
Procedure of Eliminating Porosity in Grey Cast Iron with Low Sulphur Content

Abstract
:1. Introduction
2. Methodology
2.1. Industrial Research

| Metal Charge | C | Si | Mn | P | S |
|---|---|---|---|---|---|
| Steel Scrap | 0.19 | 0.33 | 0.40 | 0.01 | 0.01 |
| Graphite Carburiser | 96.00 | - | - | - | 0.15 |
| Iron Scrap | different chemical composition within current production | ||||
| FeMn80 | 0.50 | 1.00 | 80 | 0.25 | 0.03 |
| FeSi75 | 0.15 | 75.00 | 0.50 | 0.05 | 0.04 |
| Silicon Metal | - | >98.5 | - | - | |
| FeS | - | 0.3 max. | - | - | 28–32 |
| Inoculants | Si | Ca | Al | Ba | Rest |
|---|---|---|---|---|---|
| Inoculant (A) | 0.73 | 1.25 | 1.00 | 1.00 | Fe |
| Inoculant (B) | 0.73 | 1.5 | 1.25 | - | Fe |
| Fe Powder | - | - | - | - | Fe |

2.2. Laboratory Research
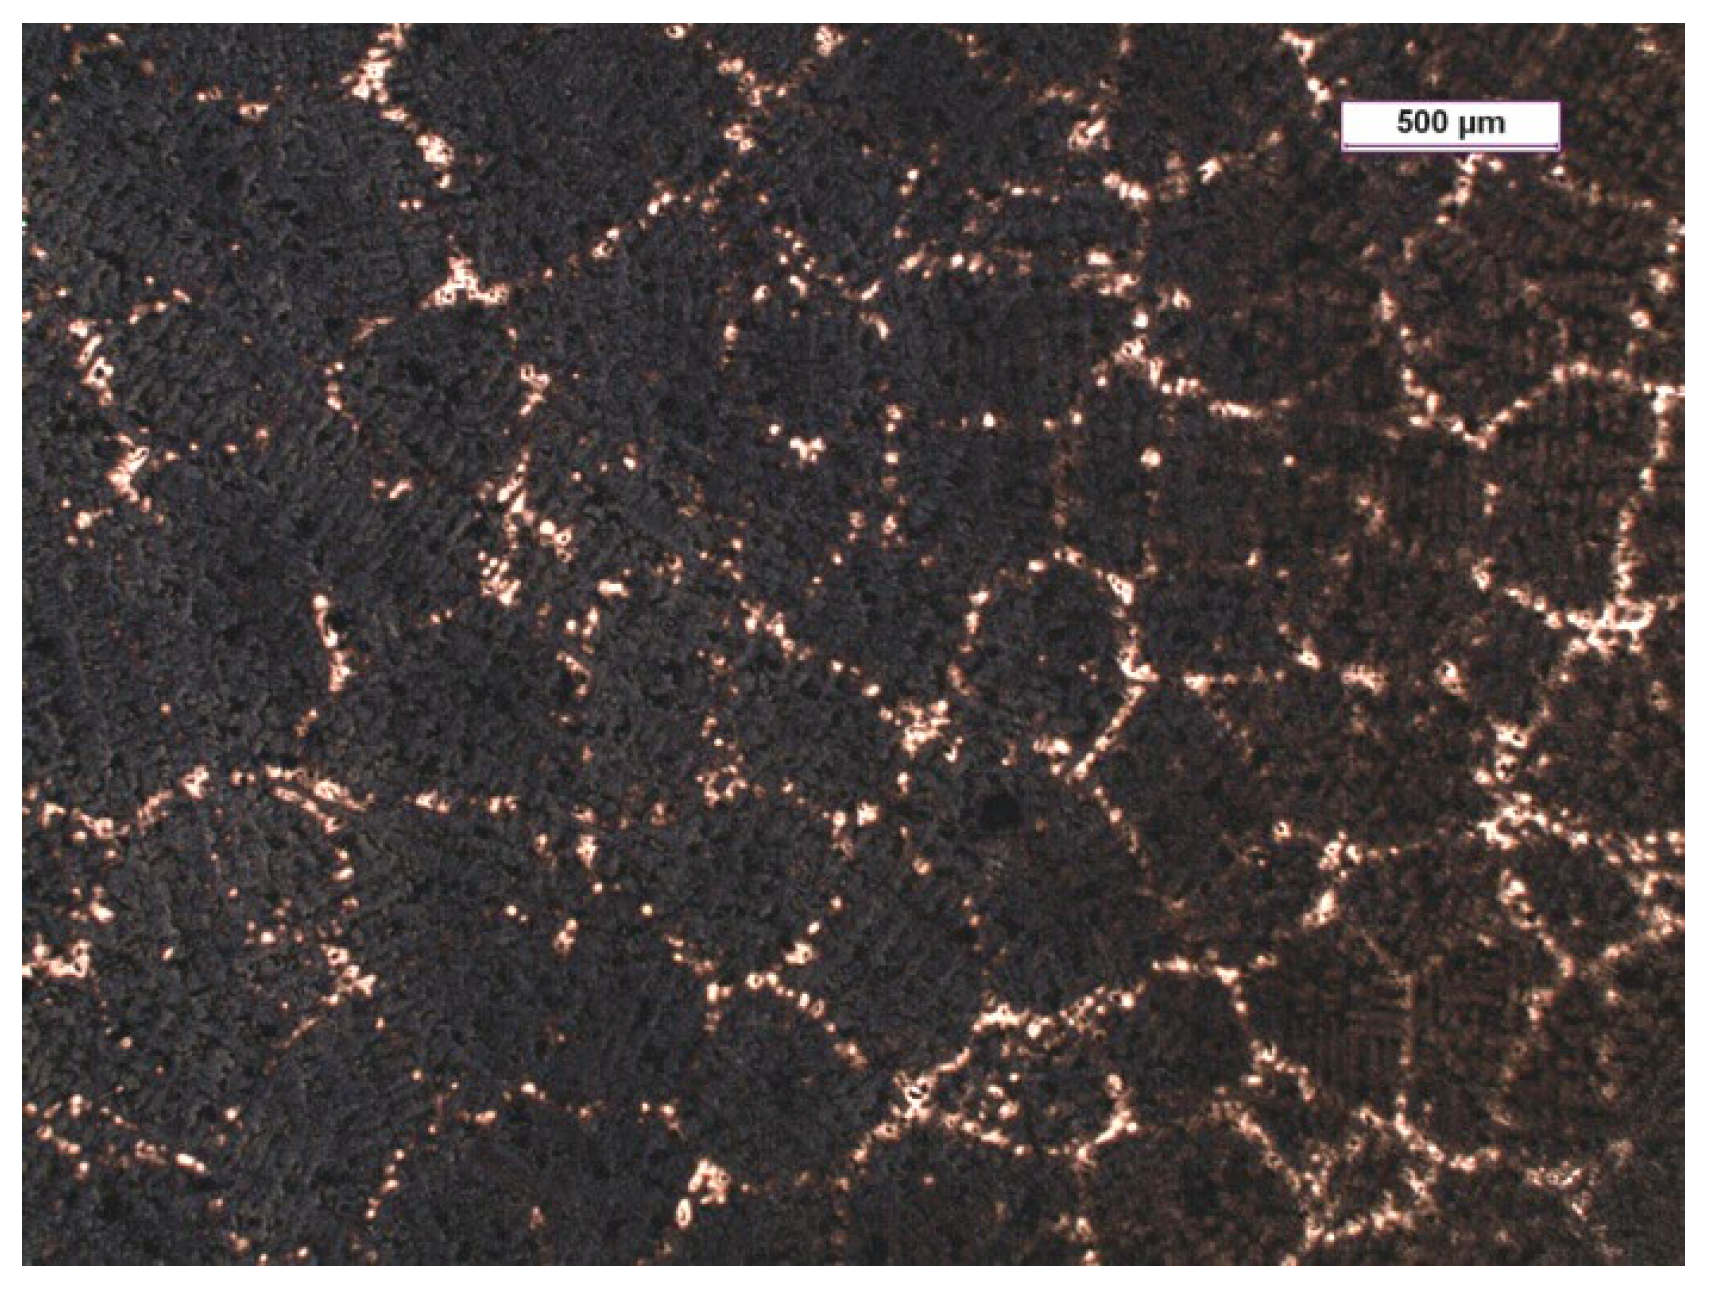
2.3. Metallographic Analysis
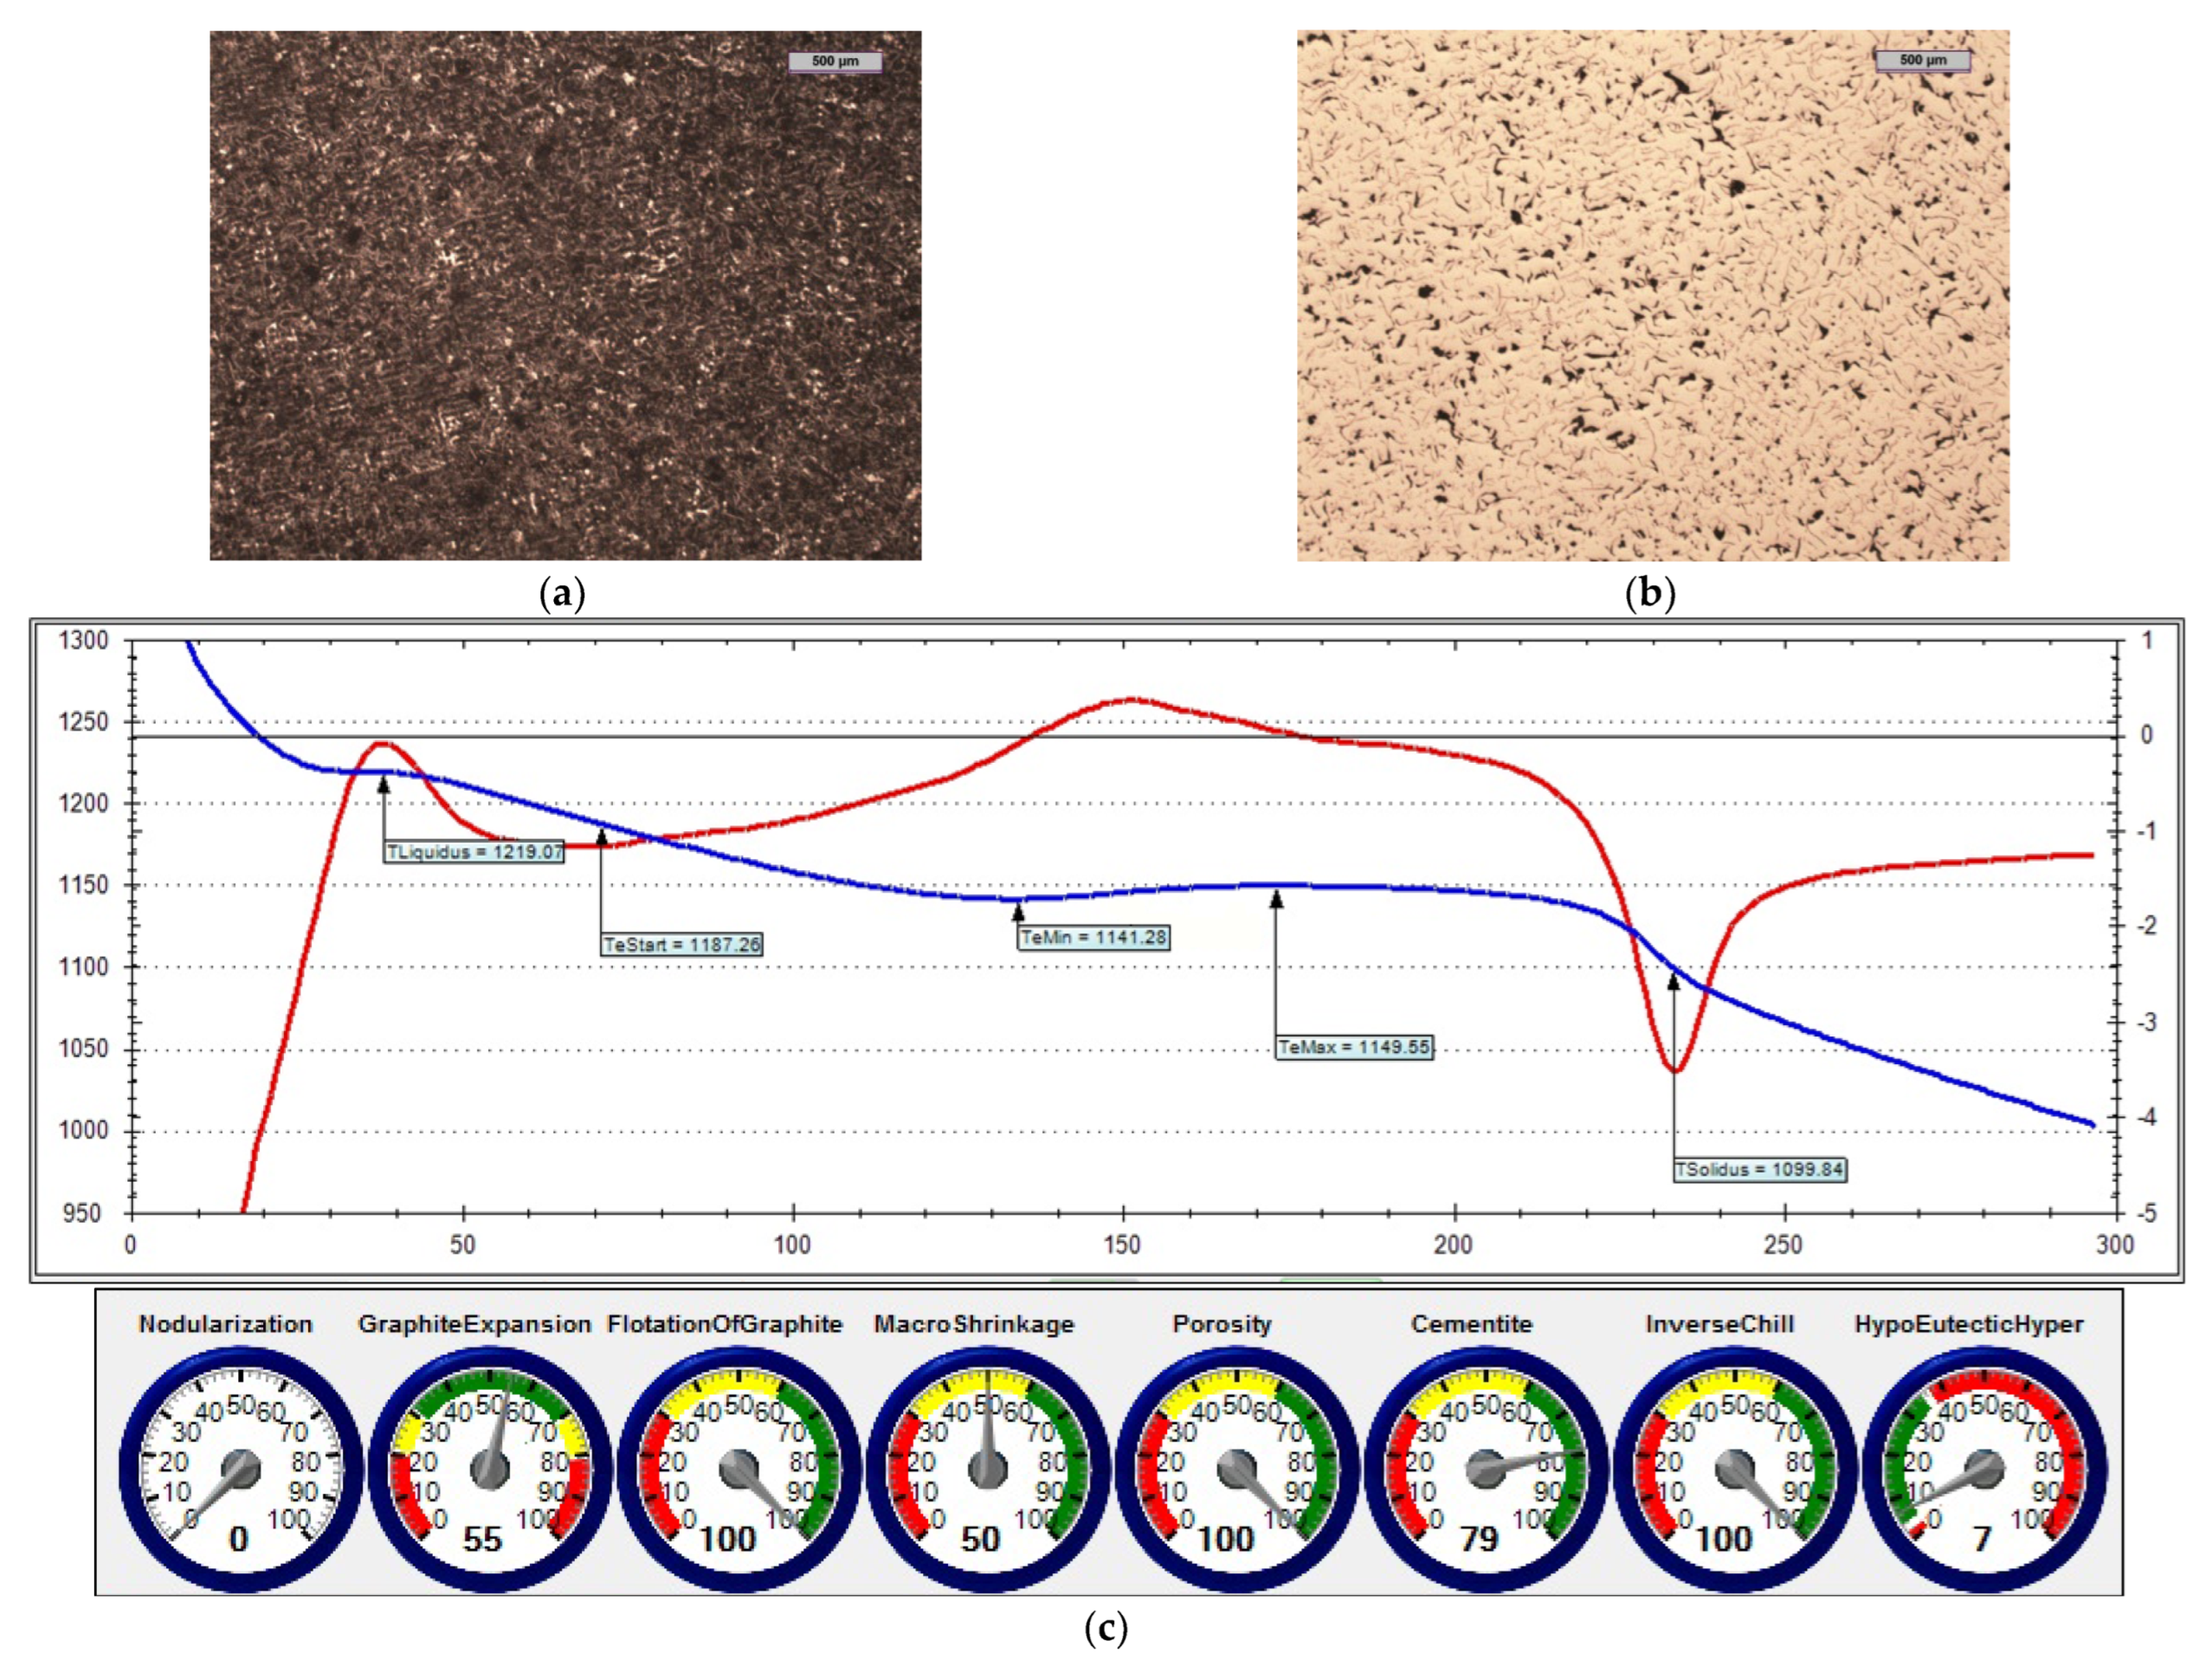
2.4. Thermal Analysis
- TLiquidus—liquidus temperature;
- TeStart—beginning of eutectic crystallisation;
- TeMin—minimum real temperature of graphite eutectic crystallisation;
- TeMax—maximum real temperature of graphite eutectic crystallisation;
- TSolidus—solidus temperature/end of eutectic crystallisation;
- REC—recalescence (determined as difference between TeMax and TeMin temperatures);
- PAE (eutectic austenitic precipitation)—this parameter is determined on the basis of the crystallisation time that elapsed from the beginning of the maximum real crystallisation temperature of graphite eutectic (TeMax) to the end of eutectic crystallisation (TSolidus);
- VPS—angle between the legs of the first derivative at solidus temperature.
2.5. Crystallization Simulation
3. Assessment of Porosity
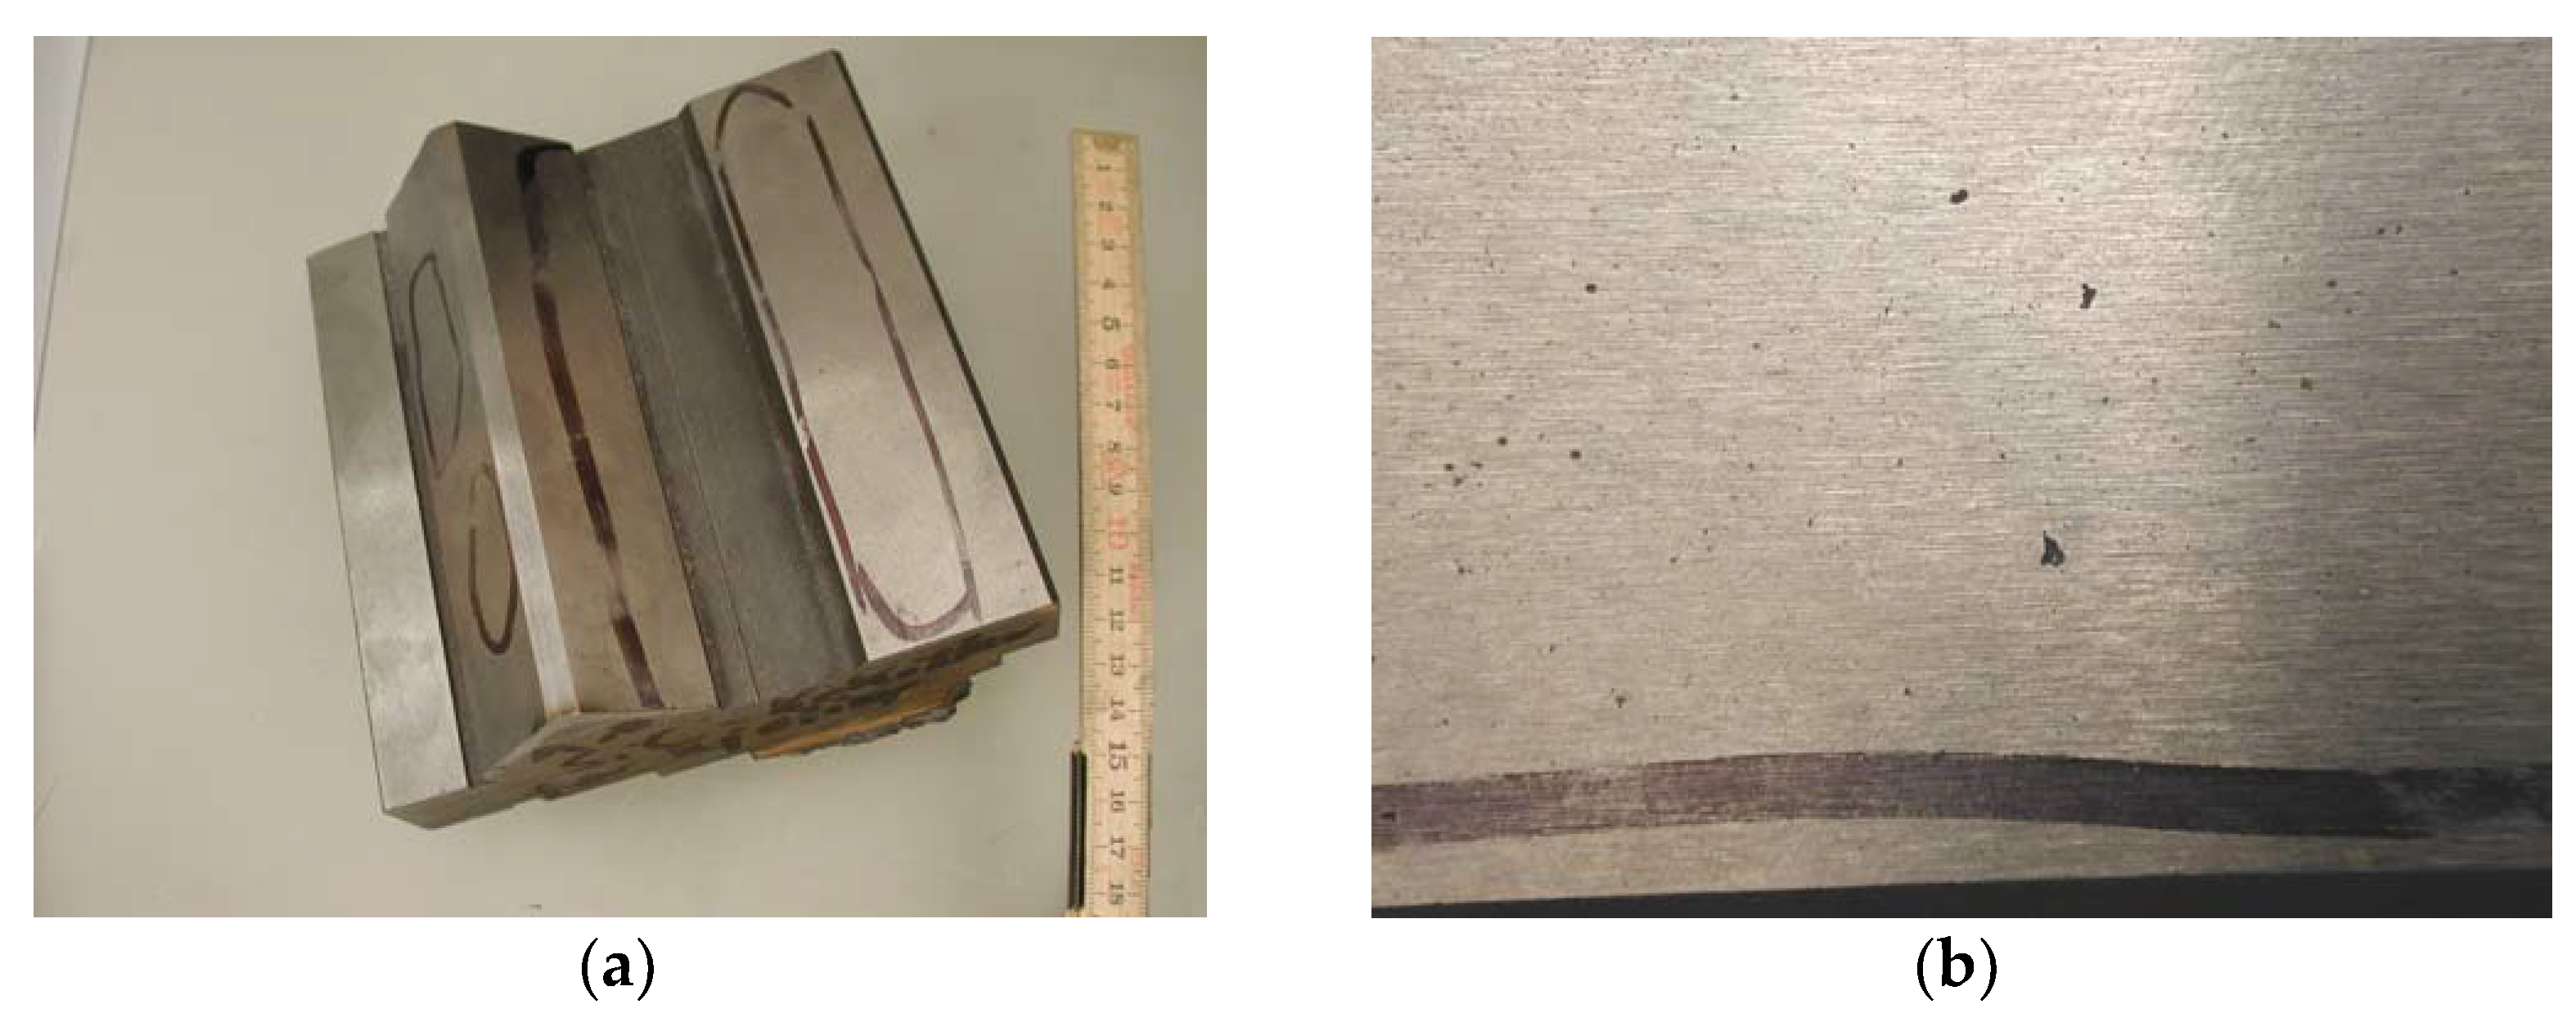
3.1. Analysis of Defects Arising in Casting (A)
3.2. Analysis of Defects Arising in Casting (B)
4. Computer Modelling
5. Laboratory Tests
| Melt No. 1 | Chemical Composition of Cast Iron: | |||||||
|---|---|---|---|---|---|---|---|---|
| 2.92% C, 1.65% Si, 0.38% Mn, 0.03% P, 0.014% S | ||||||||
| ITACA thermal analysis parameters | ||||||||
| Tliquidus | Testart | Temin | Temax | Tesolidus | Rec | VPS | PAE | |
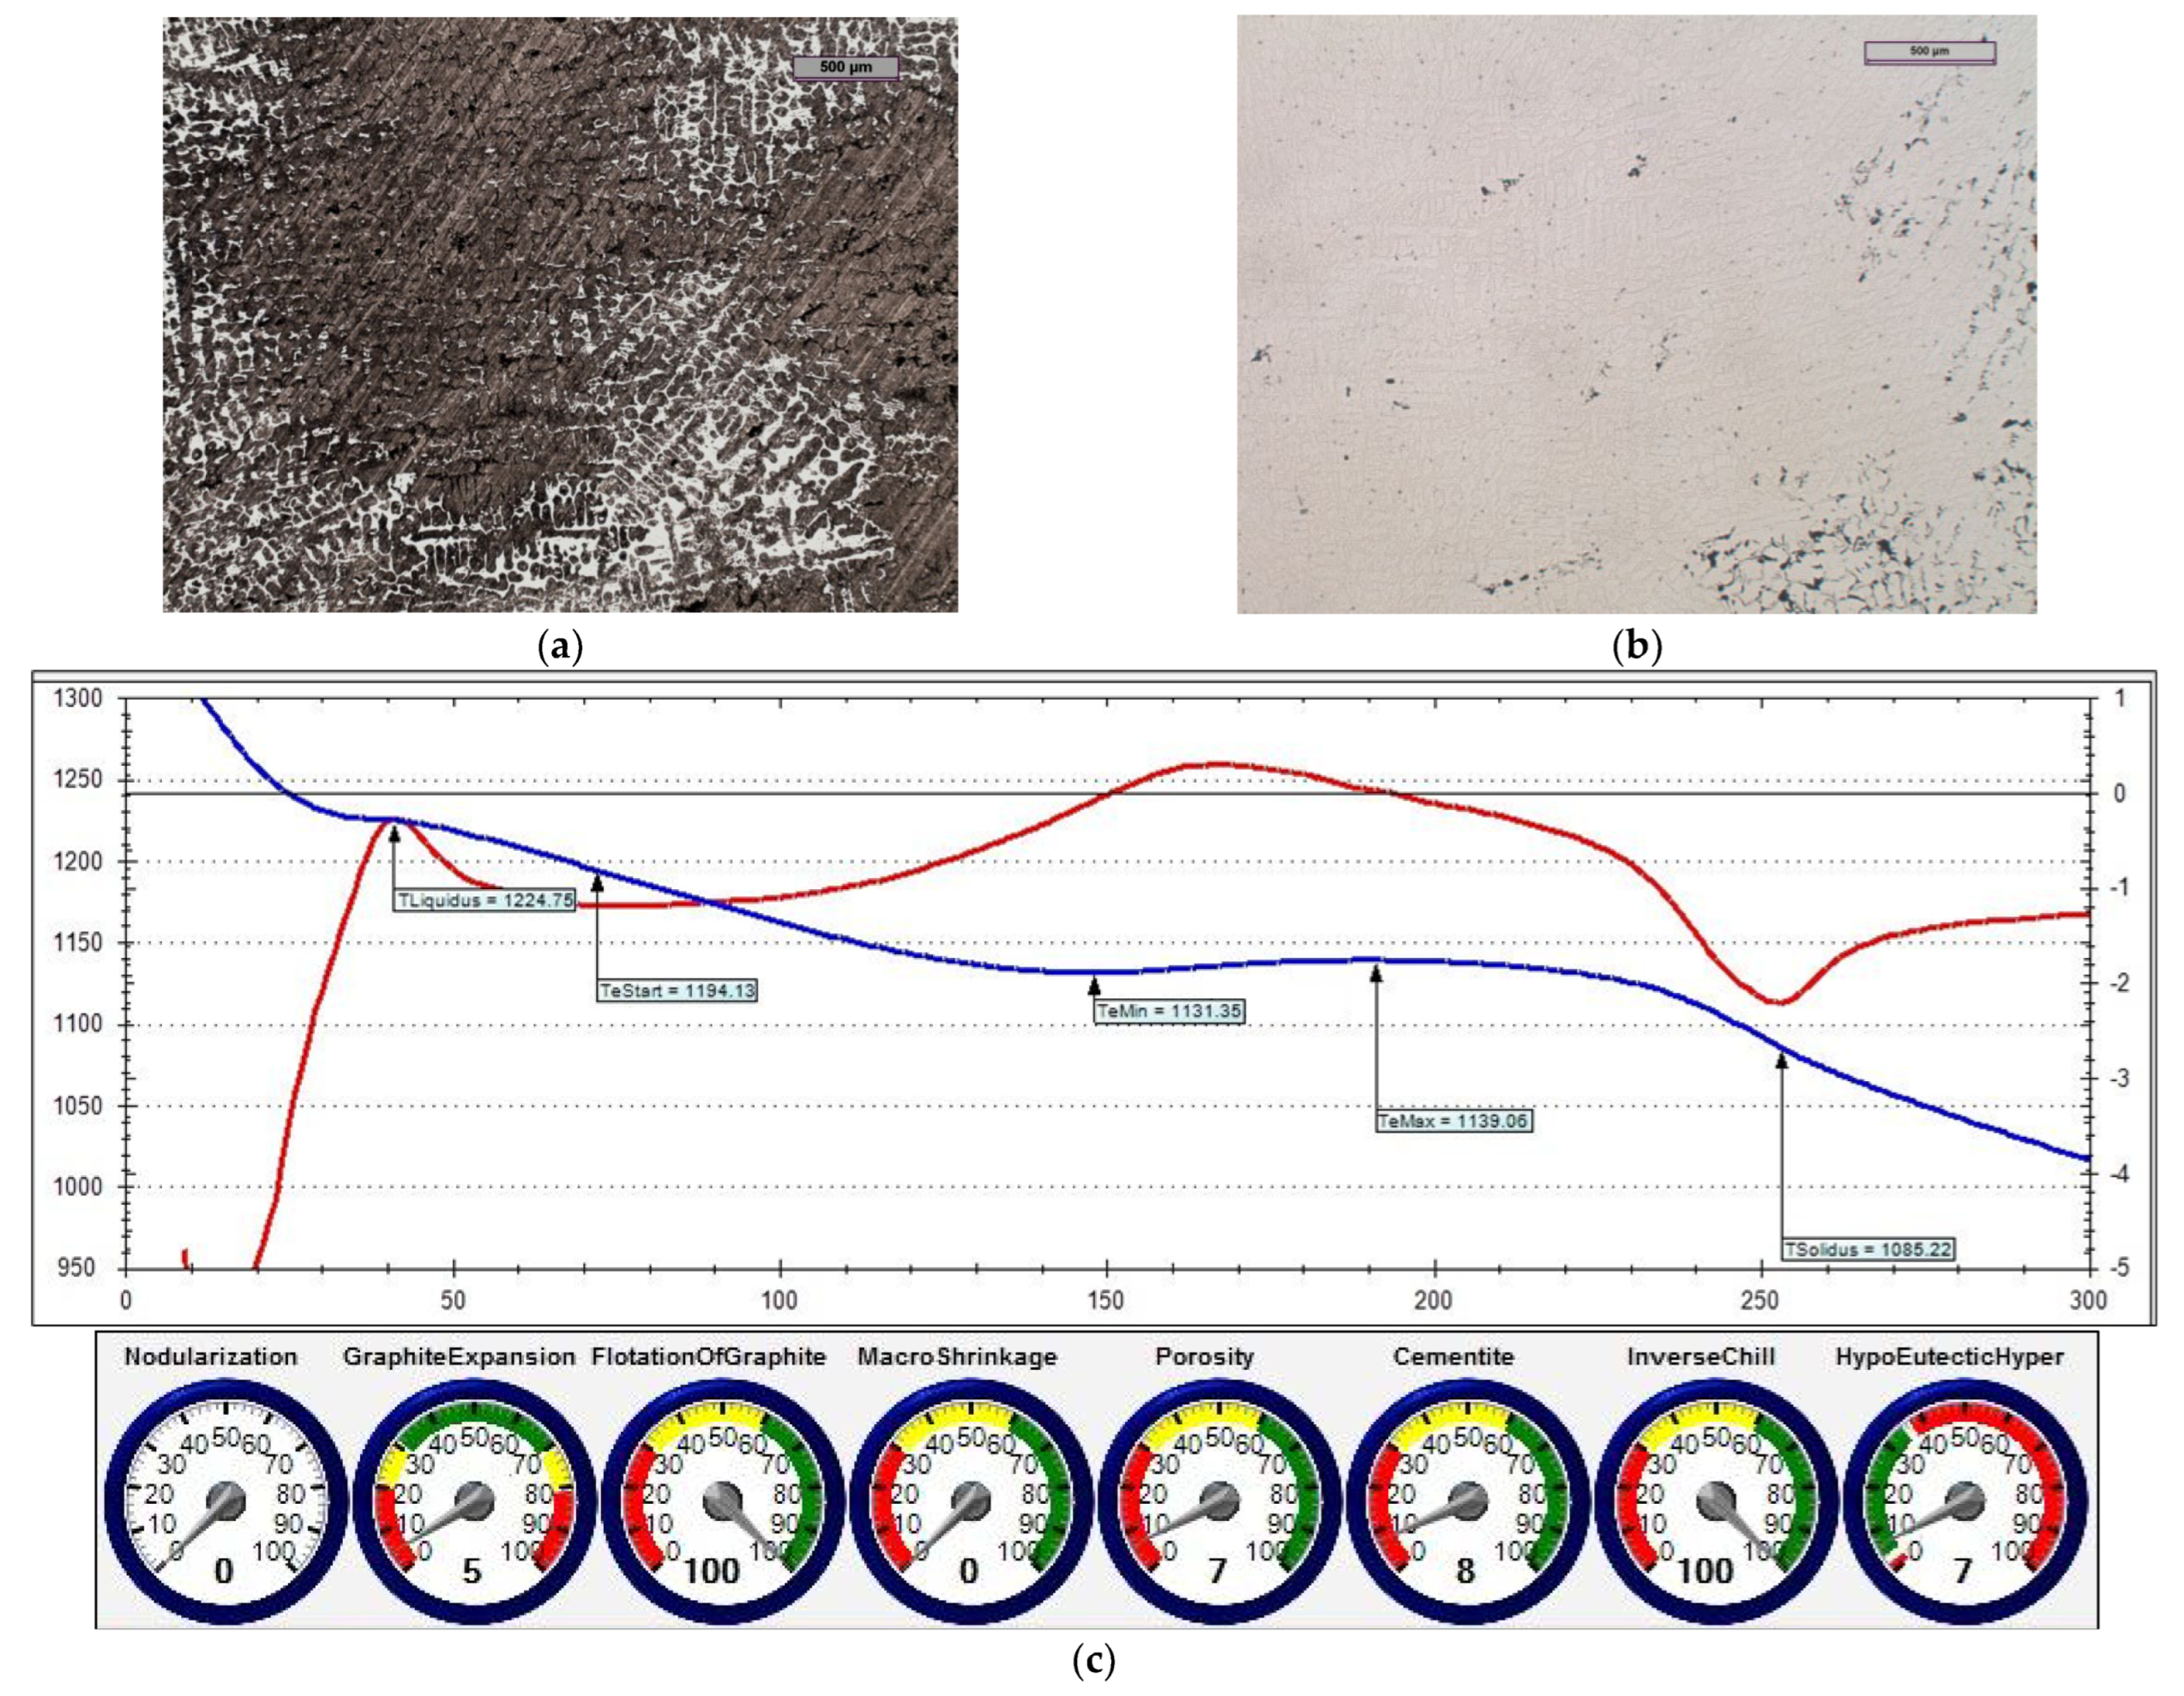
| Reference cast iron | 1224.7 | 1194.1 | 1131.3 | 1139.0 | 1085.2 | 7.71 | 82 | 41 |
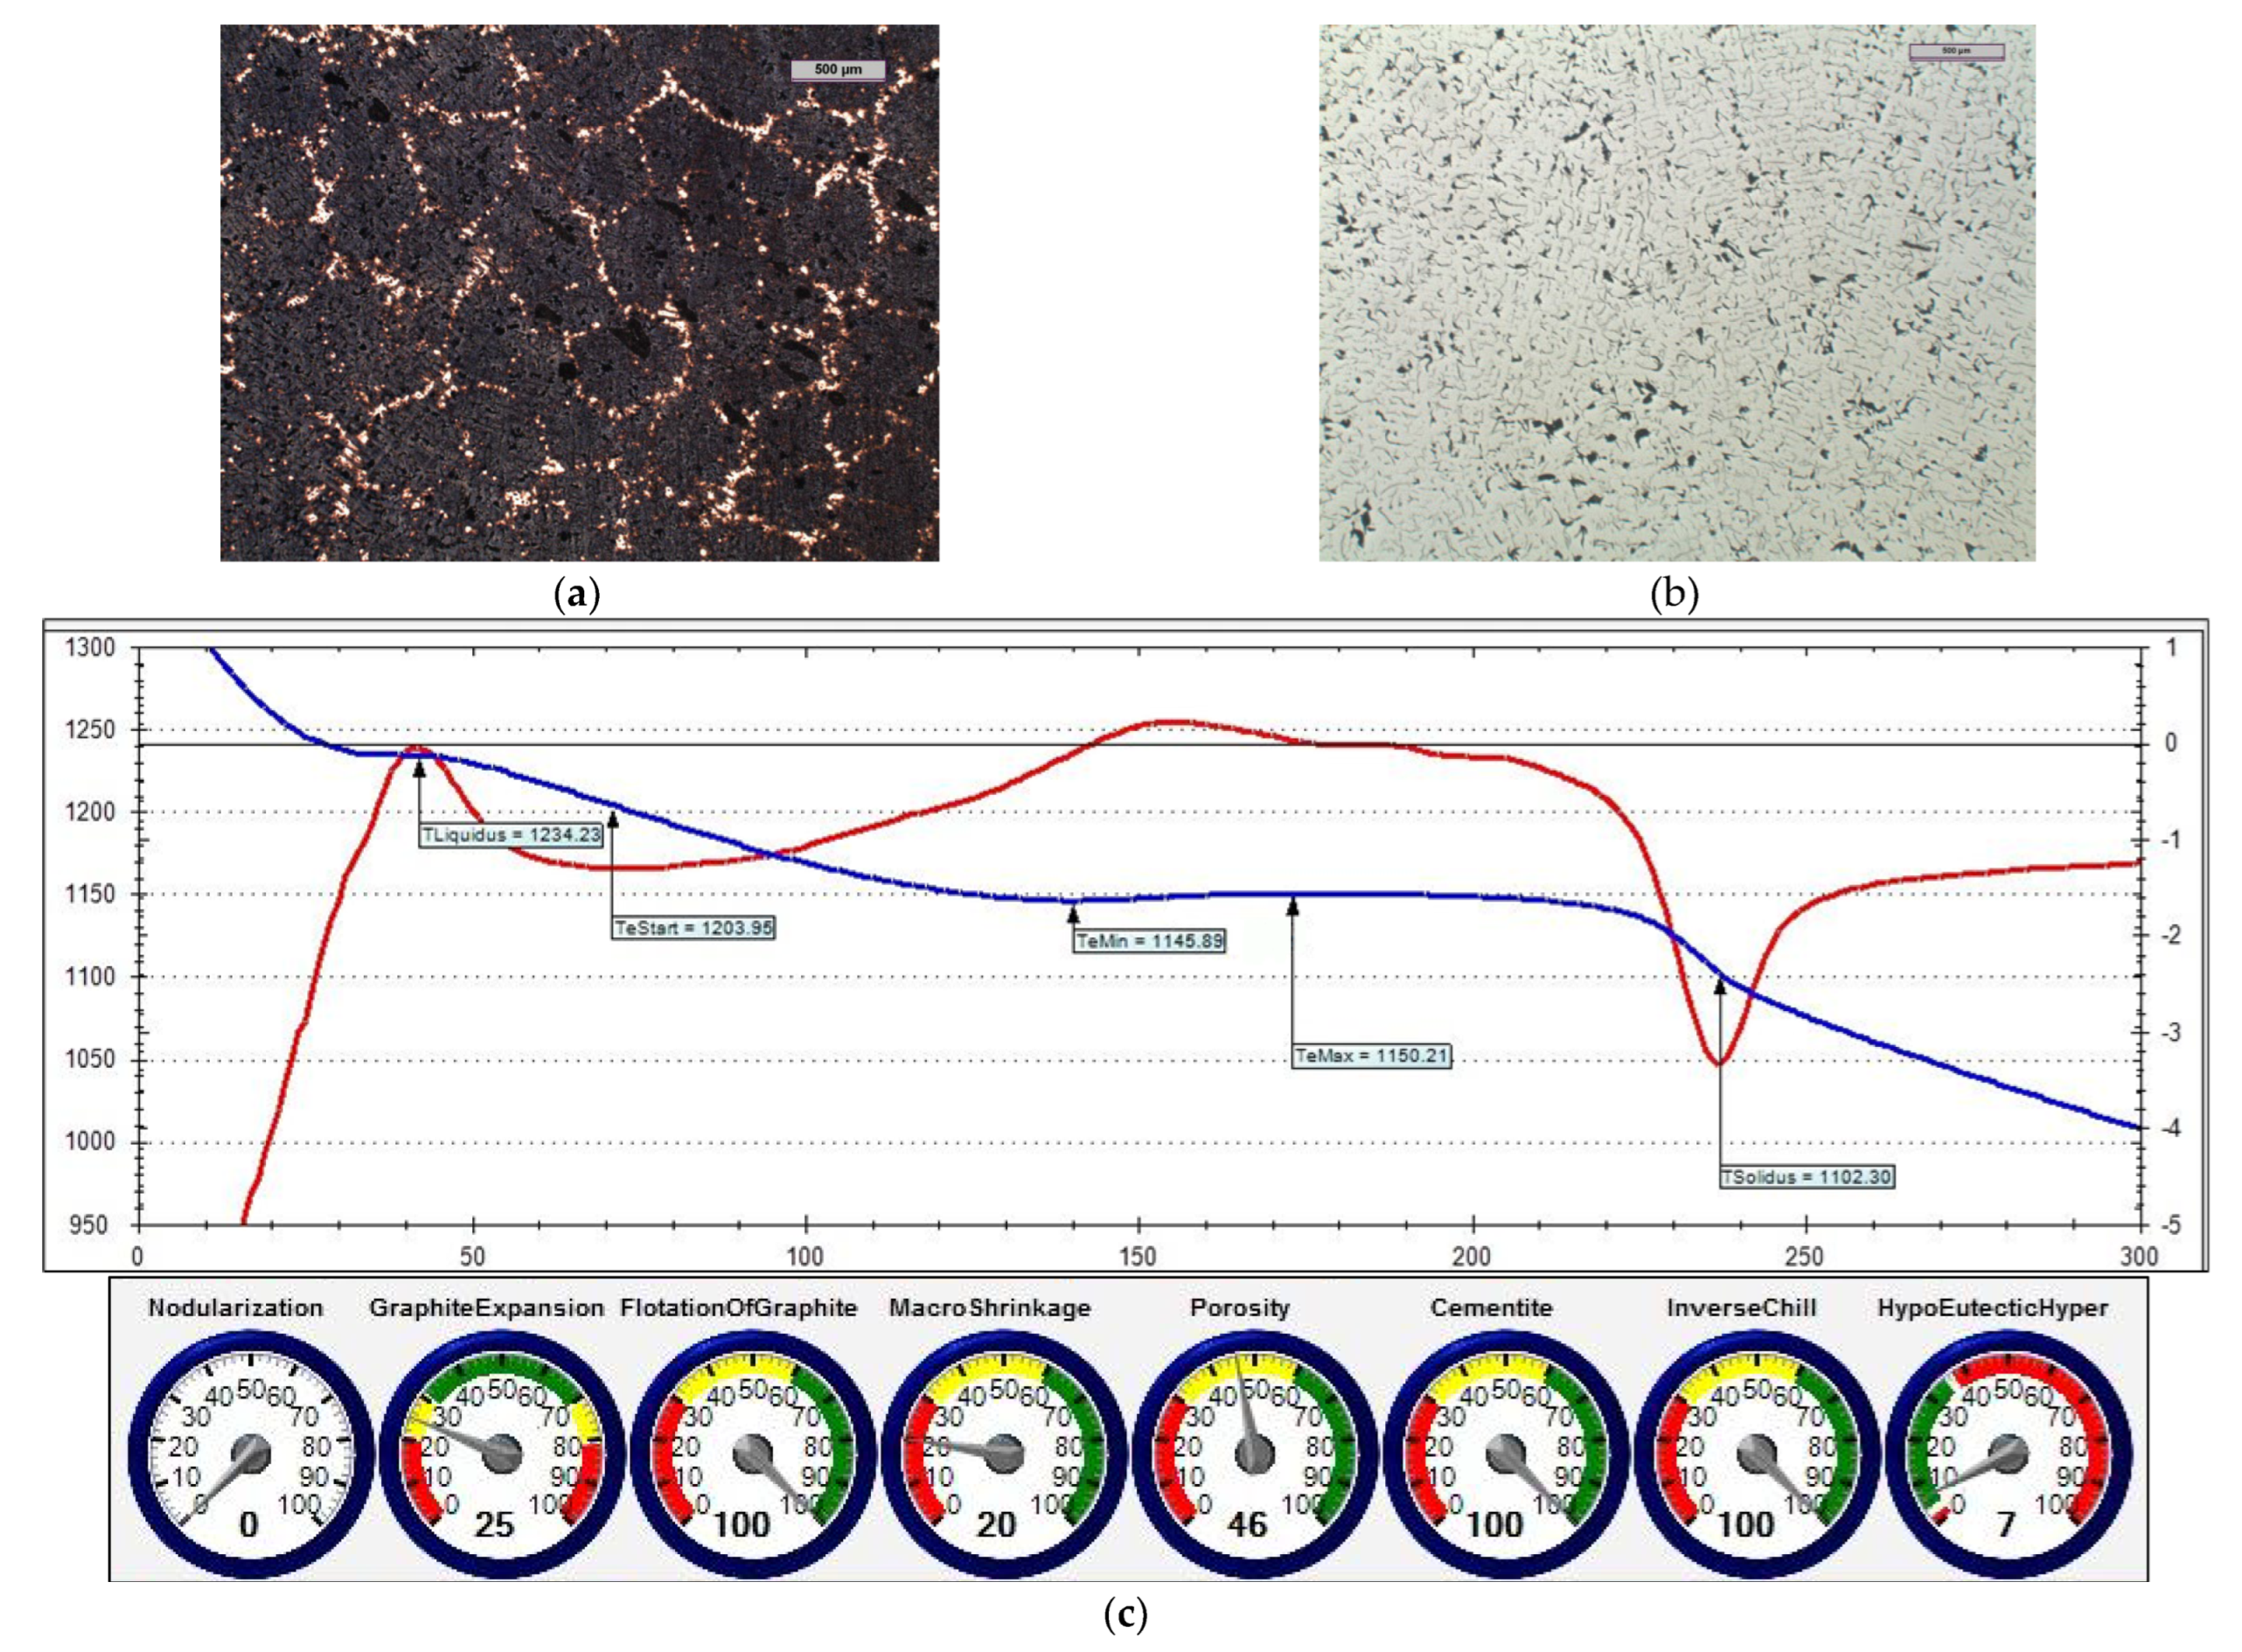
| with 0.4% Fe | 1234.2 | 1203.9 | 1145.9 | 1150.2 | 1102.3 | 4.32 | 28 | 53 |
| with 0.4% Inoculant (A) | 1233.2 | 1200.0 | 1148.7 | 1152.9 | 1104.5 | 4.25 | 23 | 47 |
| with 0.4% Inoculant (A) and 0.2% Fe | 1235.7 | 1206.9 | 1151.4 | 1154.7 | 1109.5 | 3.36 | 19 | 50 |
| Melt No. 2 | Chemical Composition of Cast Iron: | |||||||
|---|---|---|---|---|---|---|---|---|
| 3.02% C, 1.61% Si, 0.40% Mn, 0.04% P, 0.09% S | ||||||||
| ITACA thermal analysis parameters | ||||||||
| Tliquidus | Testart | Temin | Temax | Tesolidus | Rec | VPS | PAE | |
| Reference cast iron | 1216.6 | 1187.7 | 1133.1 | 1144.3 | 1087.8 | 11.18 | 49 | 46 |
| with 0.4% Inoculant (B) | 1219.0 | 1187.3 | 1141.3 | 1149.5 | 1099.8 | 8.26 | 25 | 48 |

- TeMin—minimum real temperature of graphite eutectic crystallisation;
- VPS—angle between legs of first derivative at solidus temperature.
6. Industrial Application
7. Conclusions
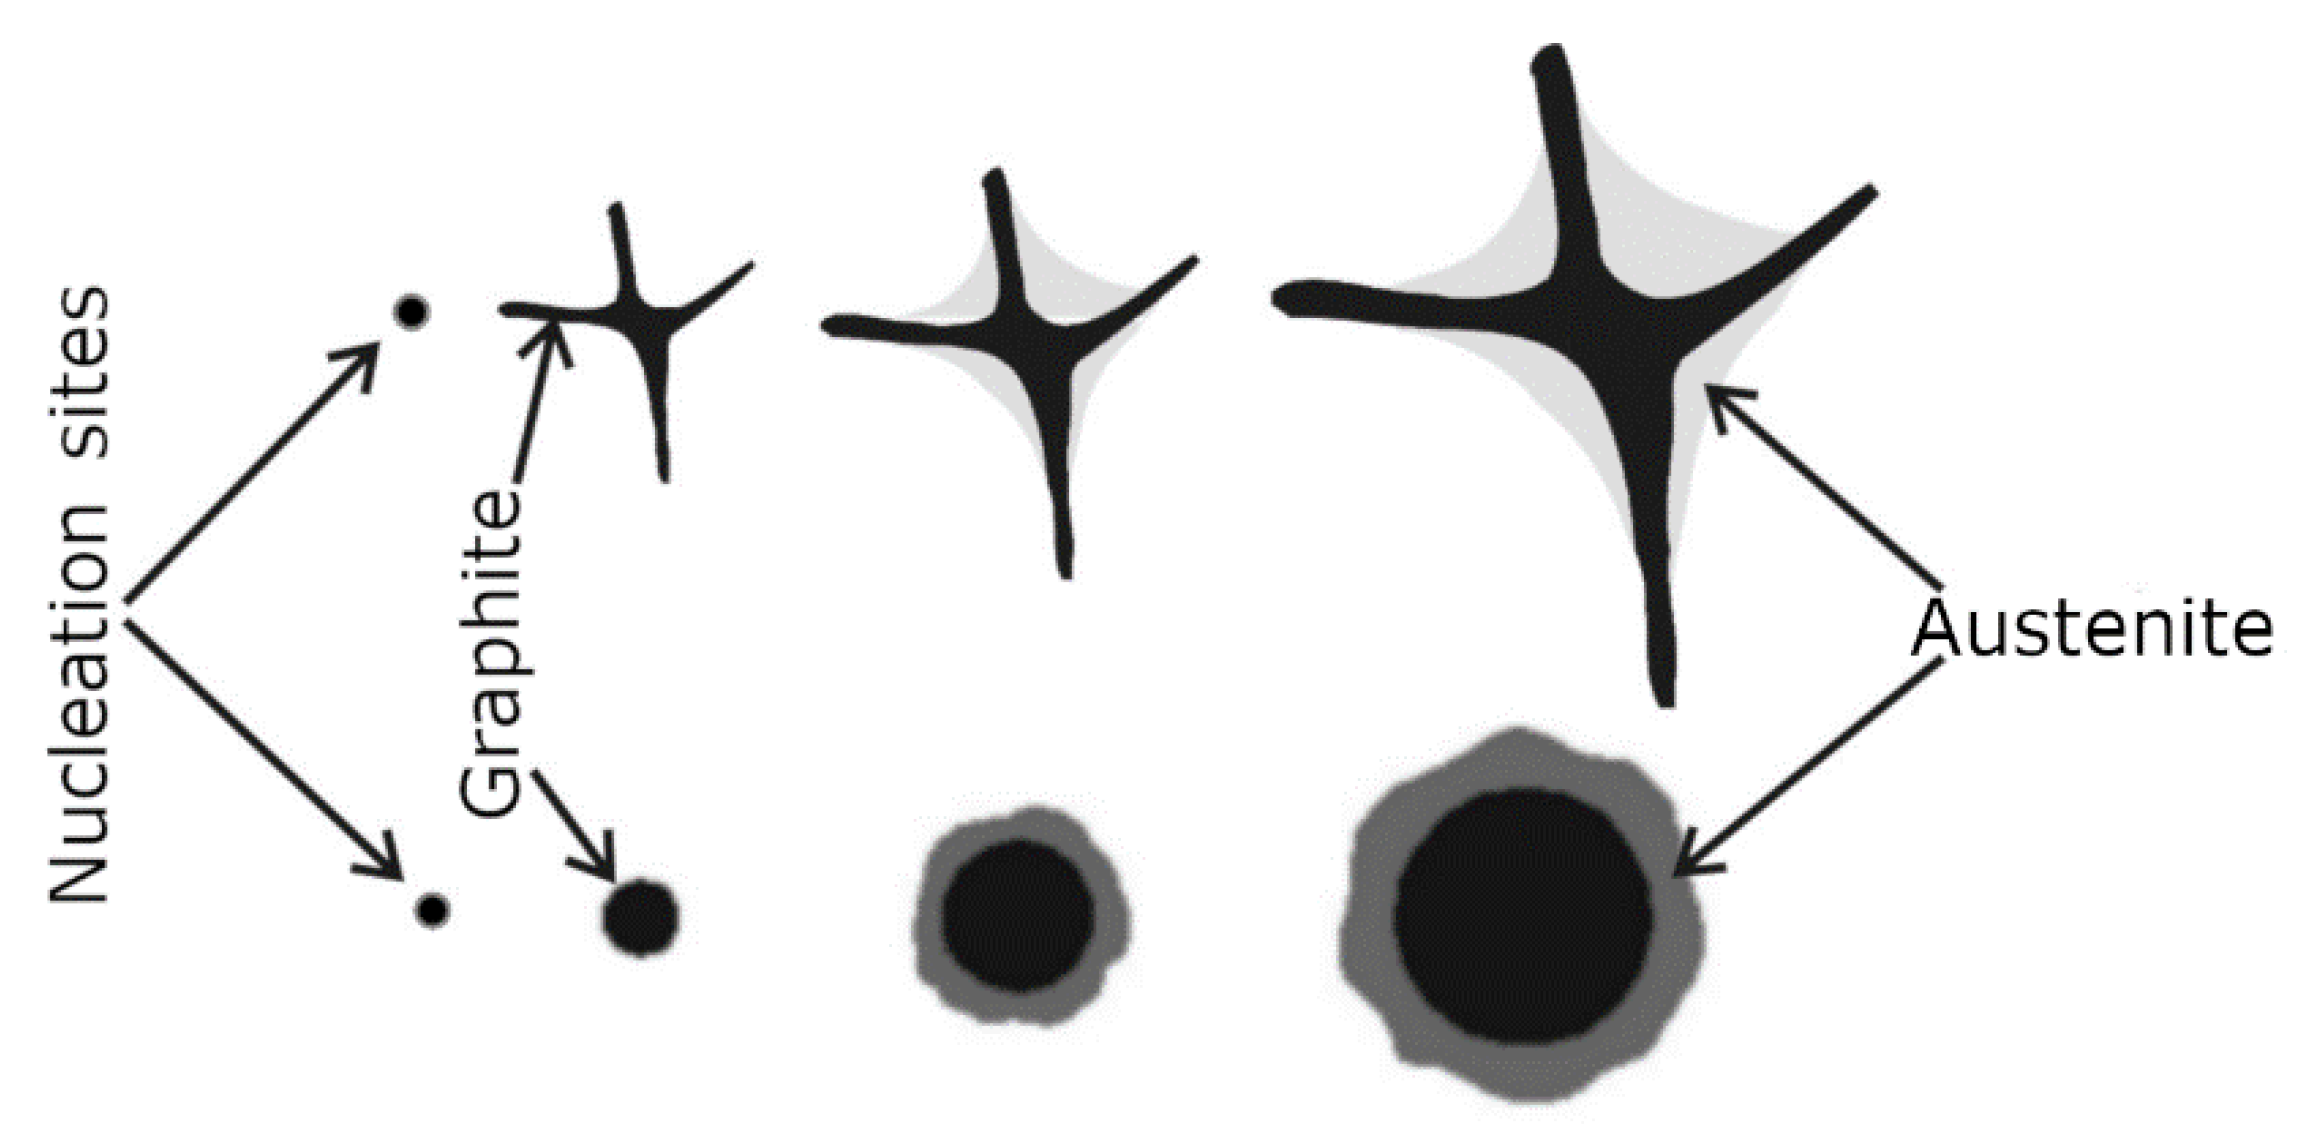
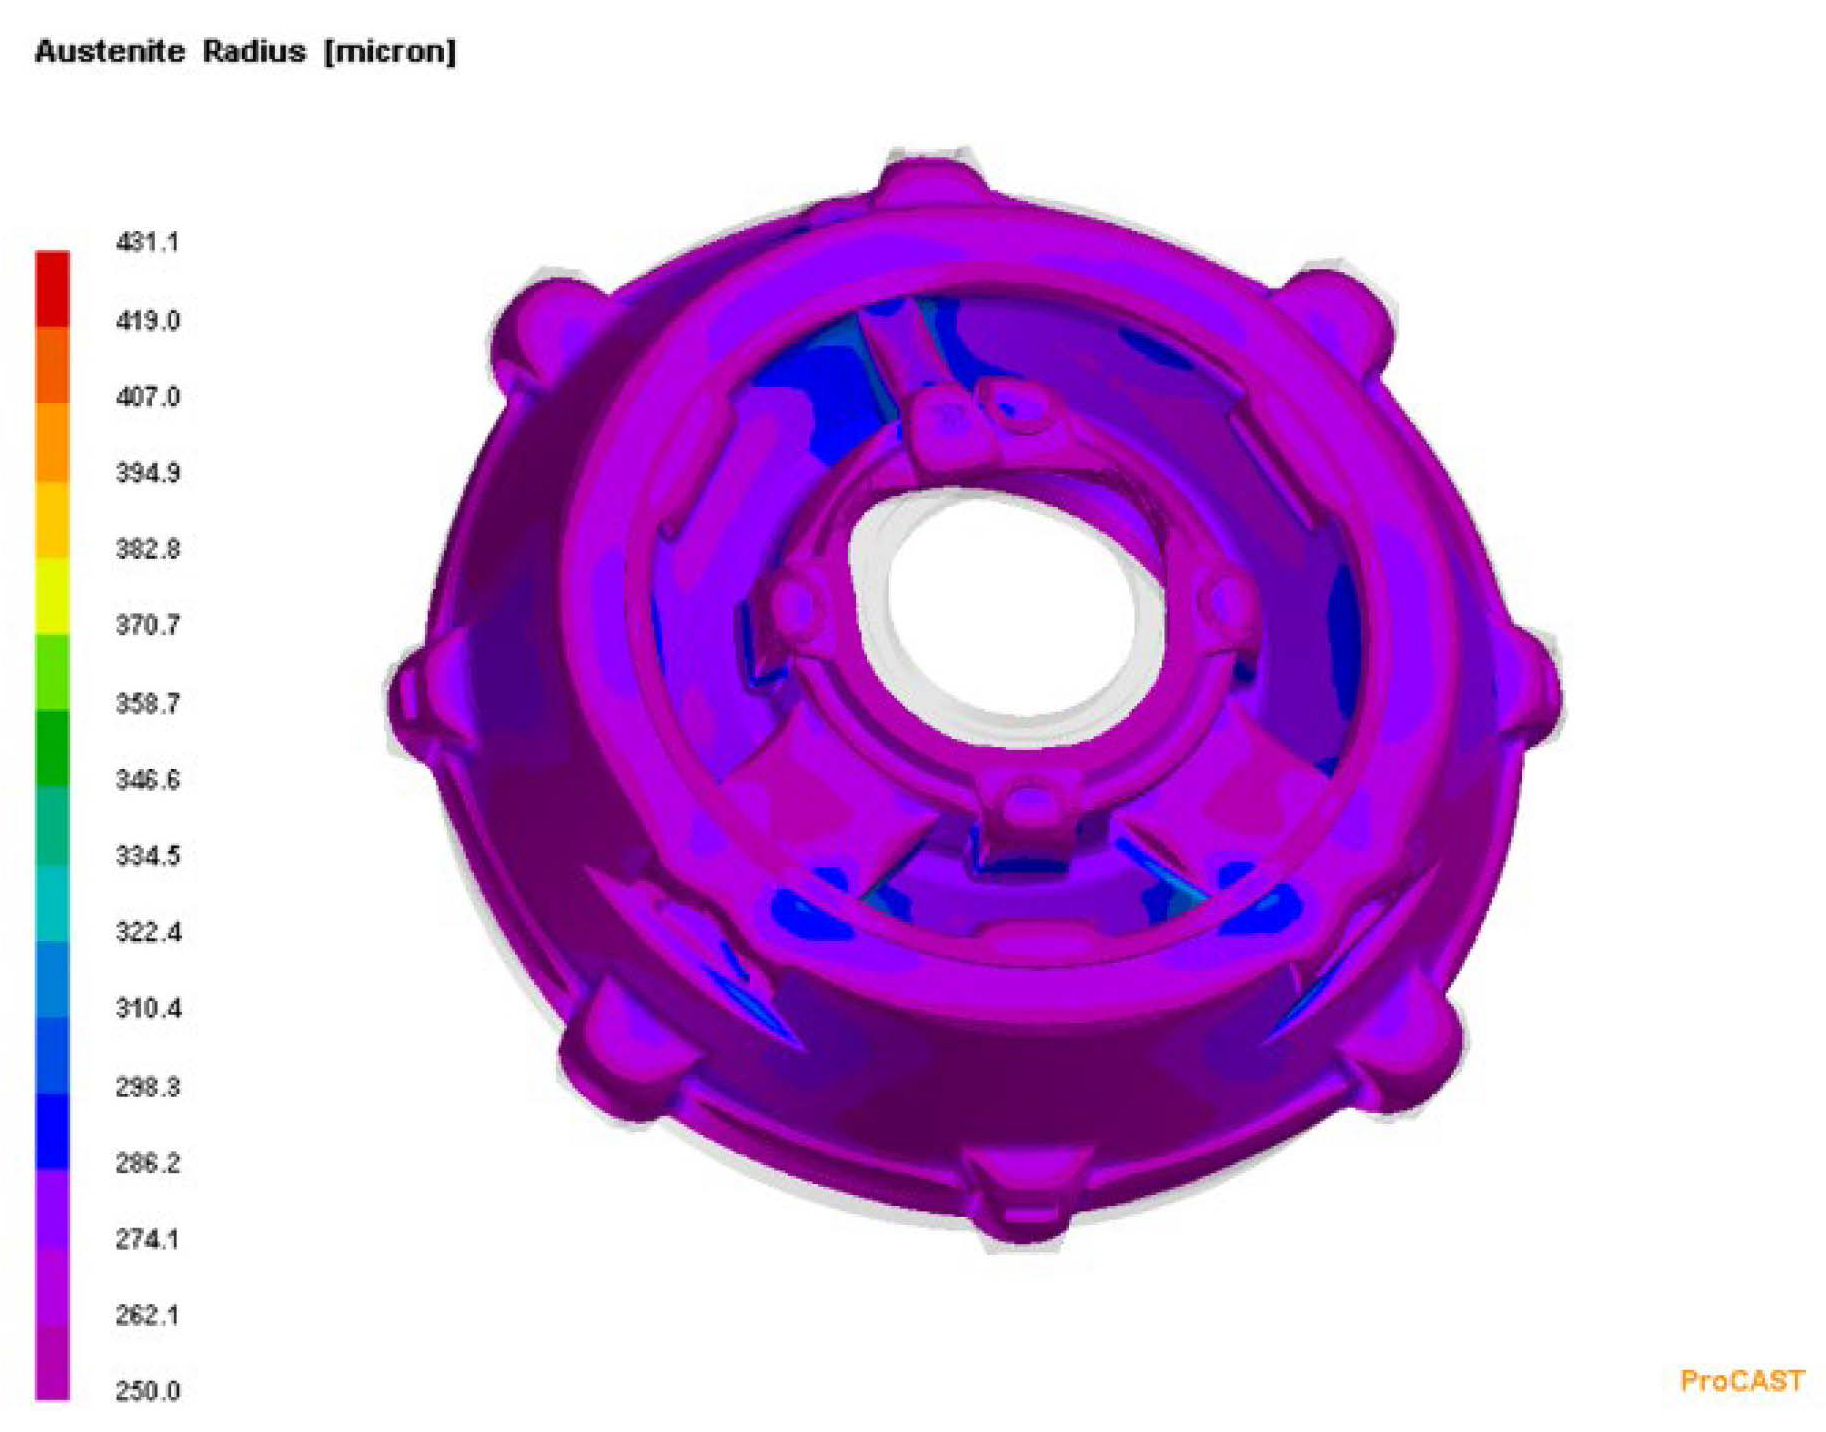
- The results of the analysis in the research work show that the crystallisation of primary austenite grains is of key importance for the appearance of porosity in a casting made of grey cast iron with a low sulphur content.
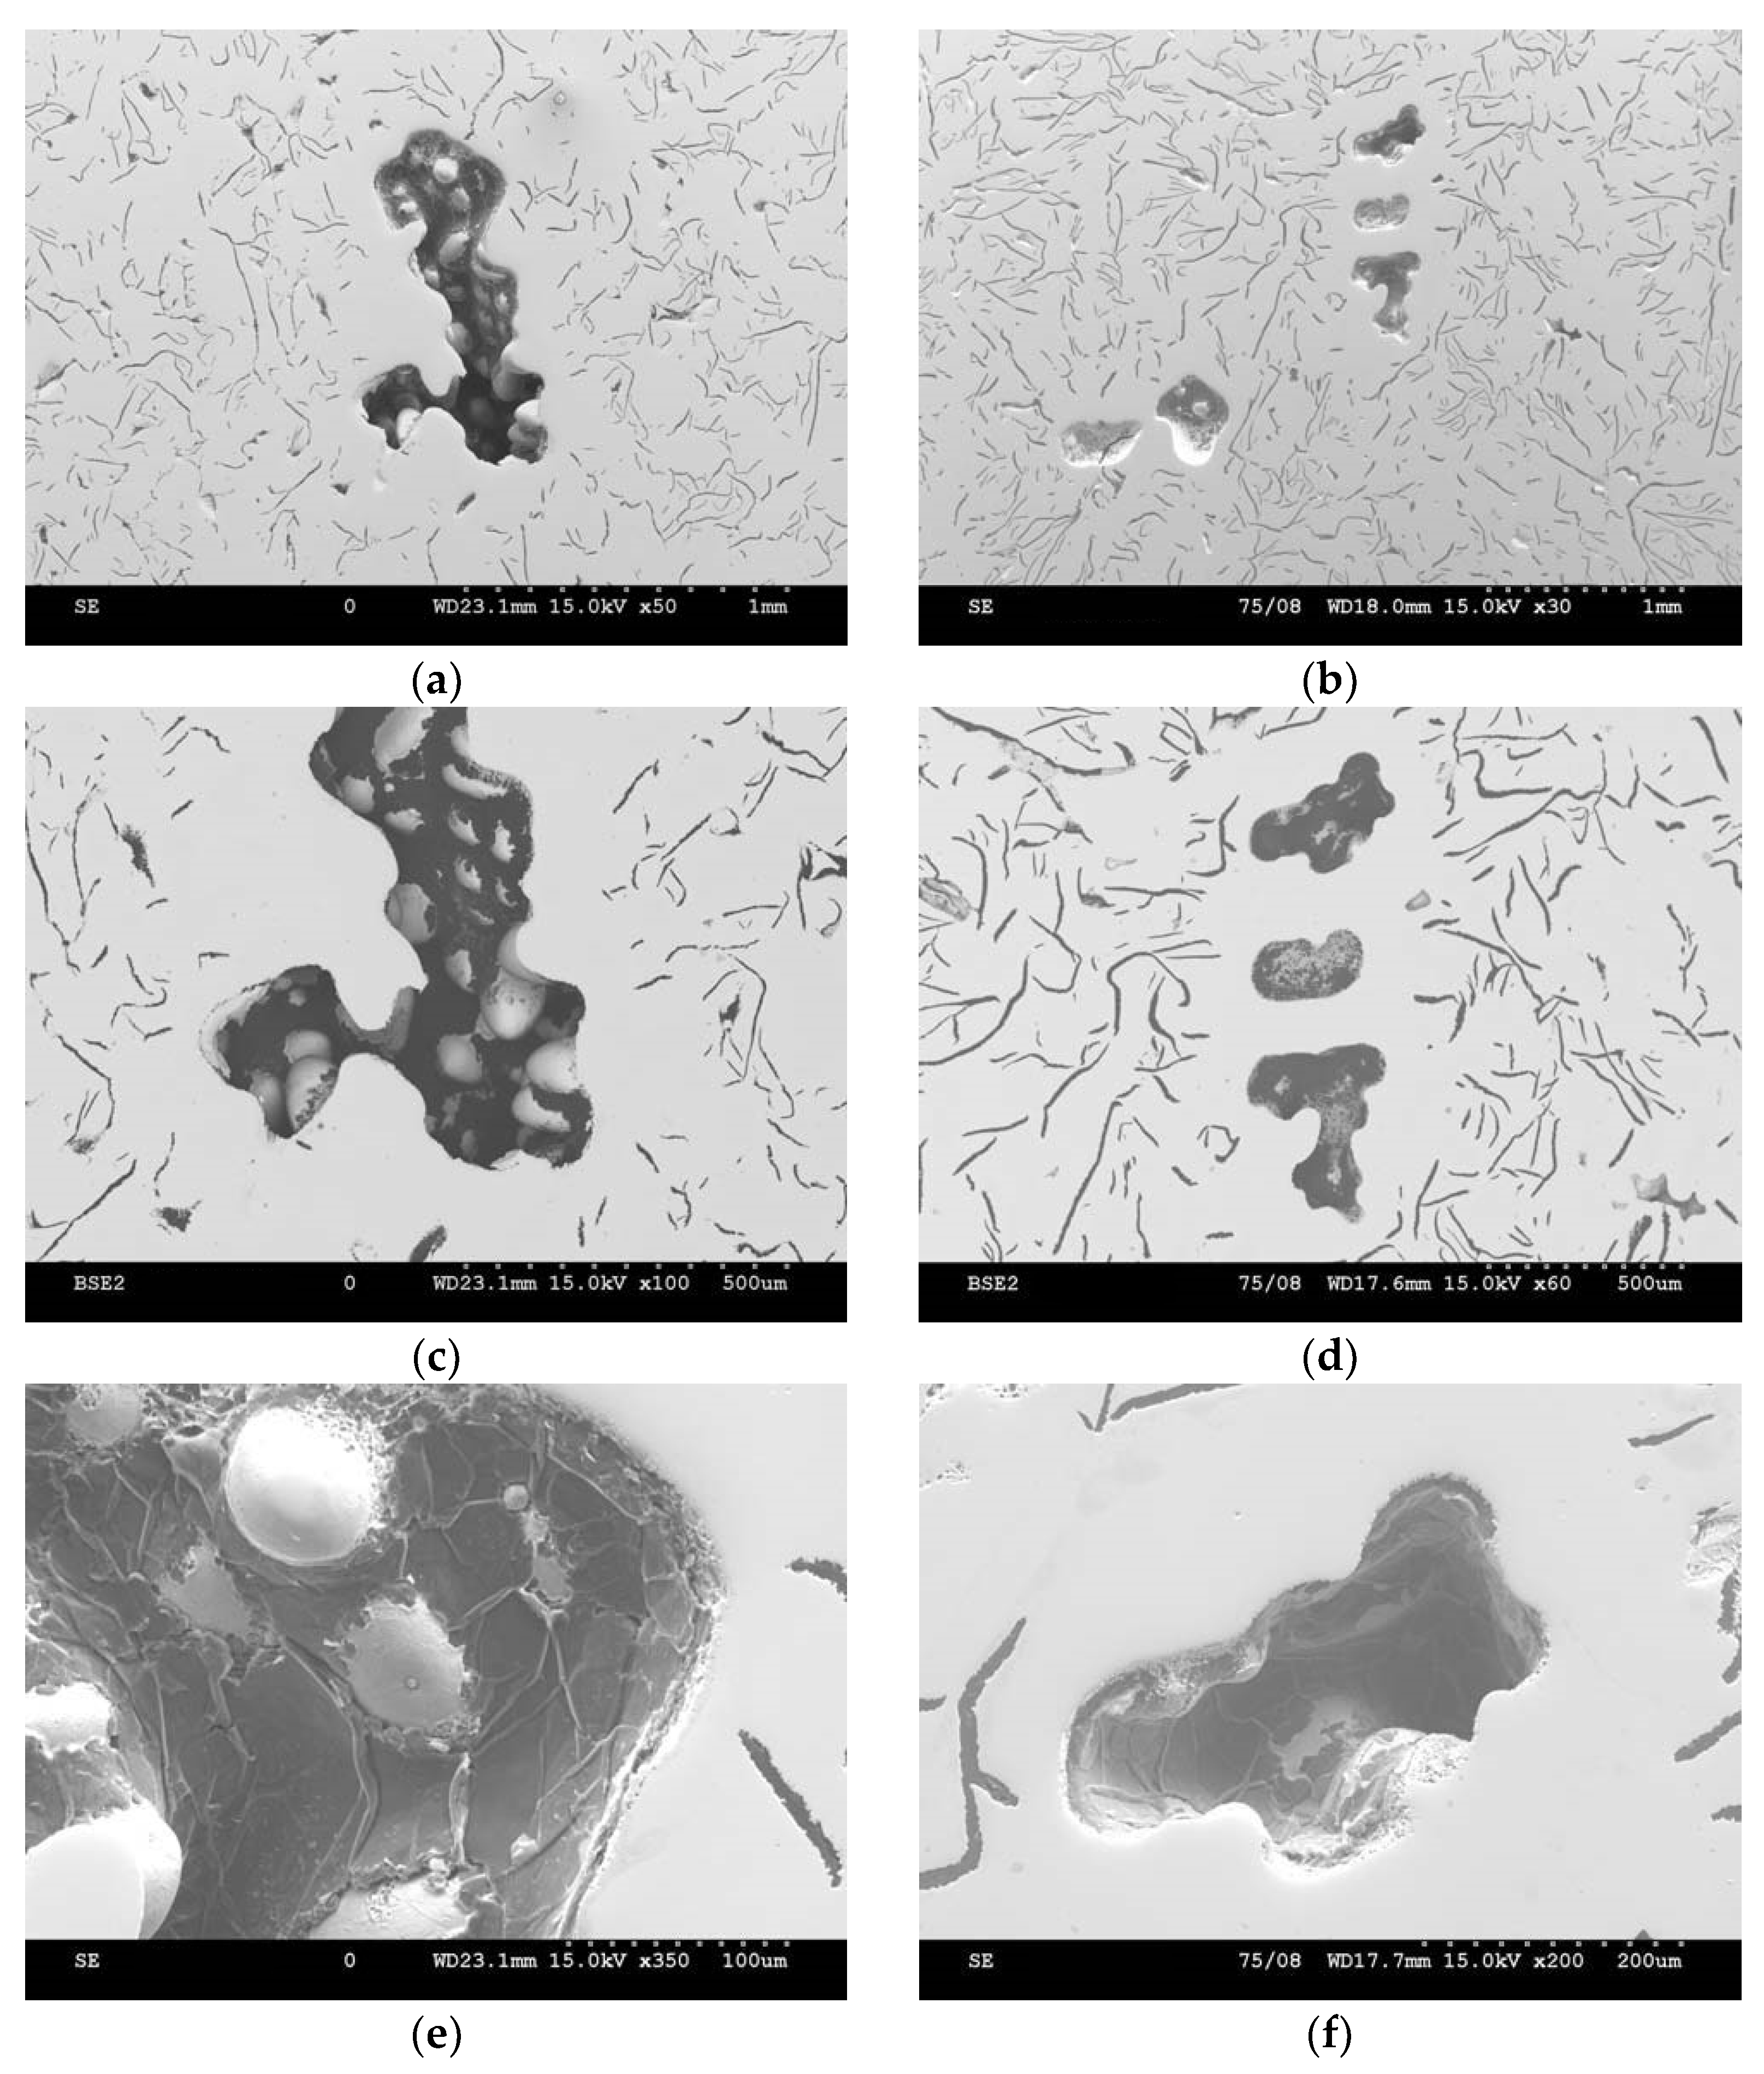
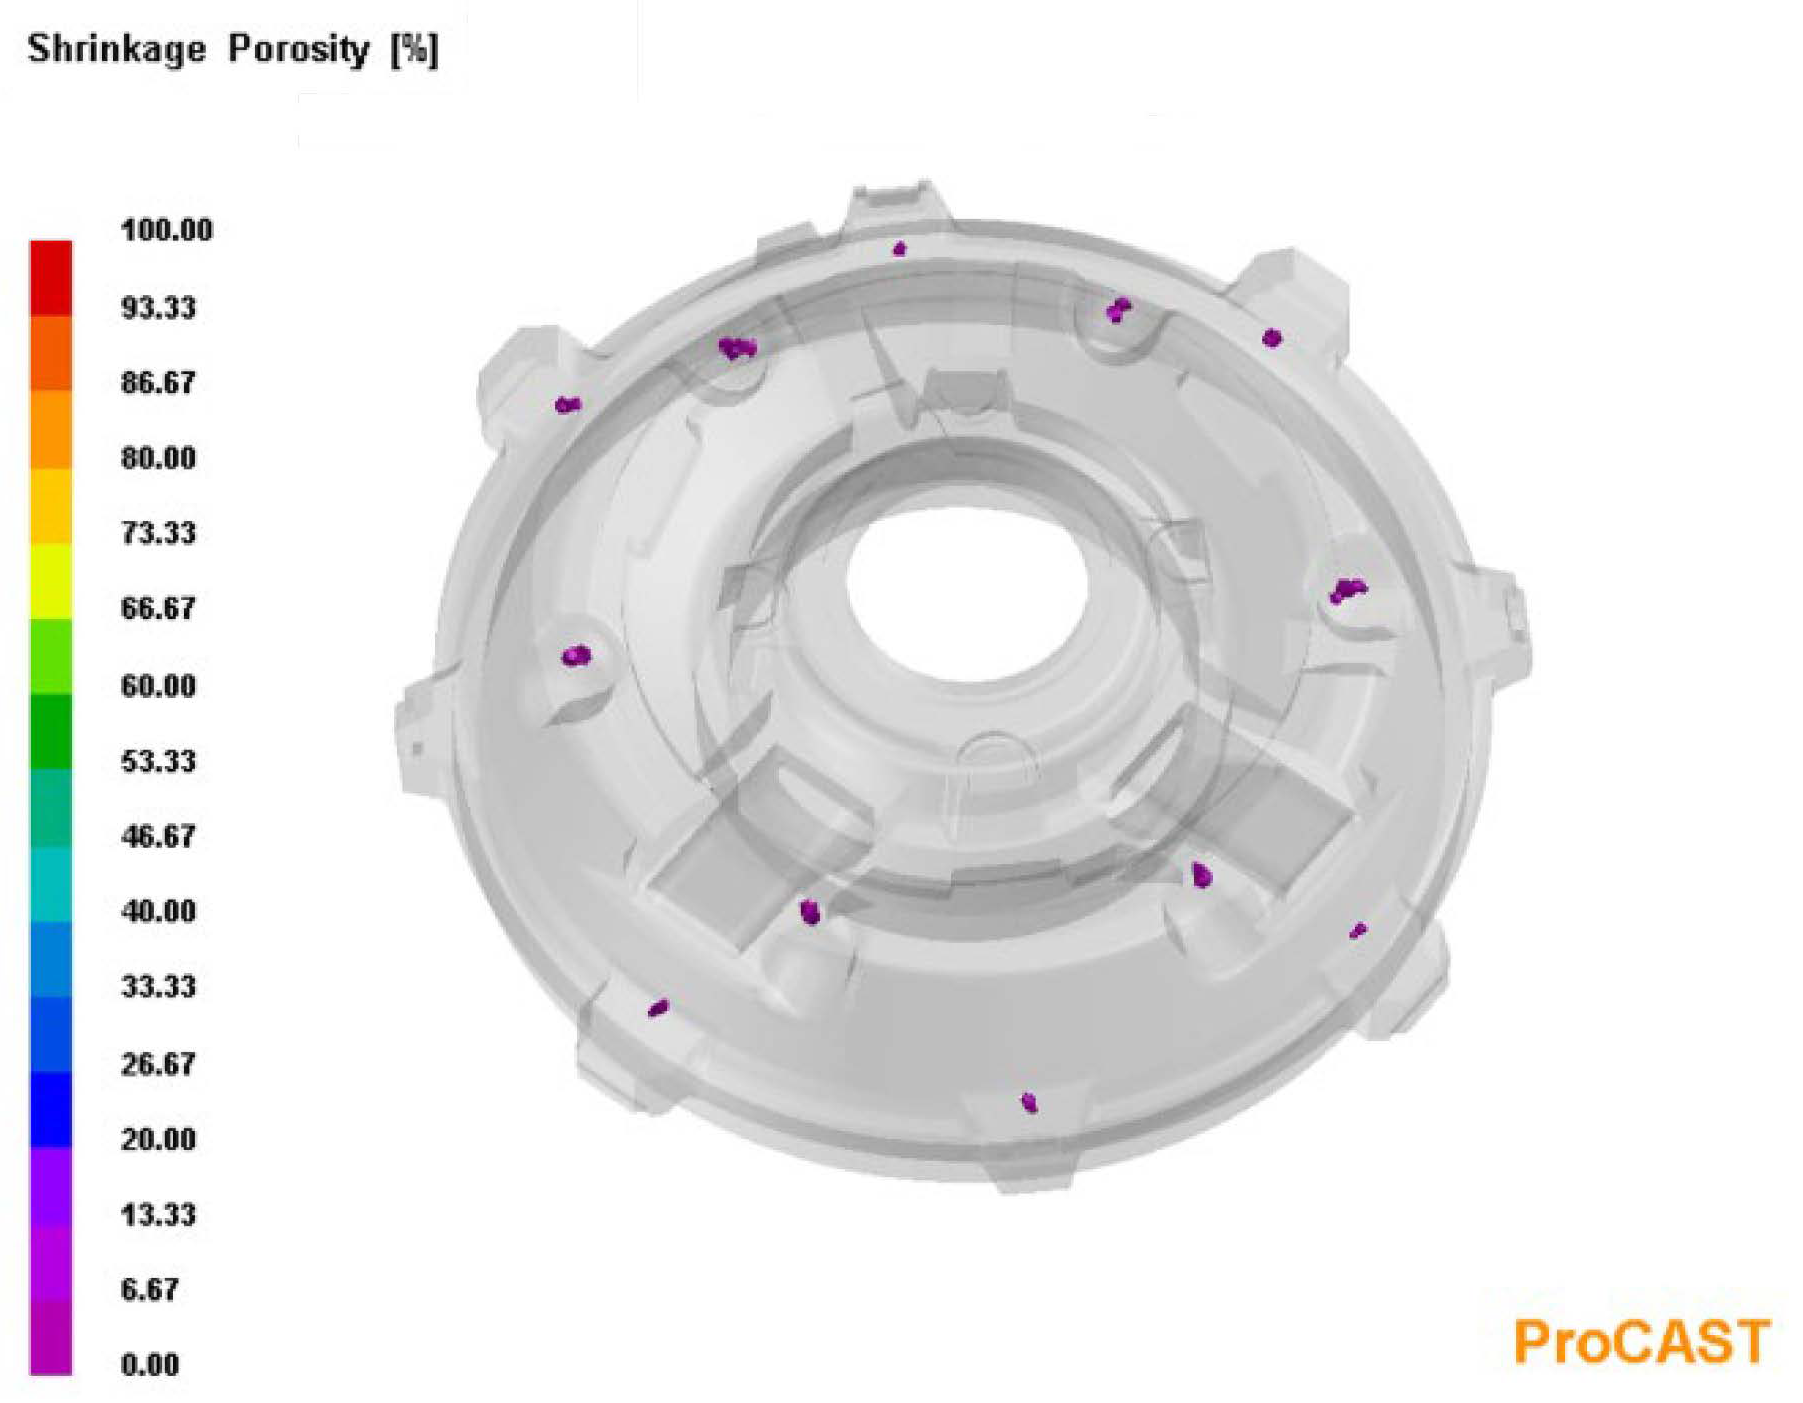
- The defect shown indicates that it is shrinkage porosity.
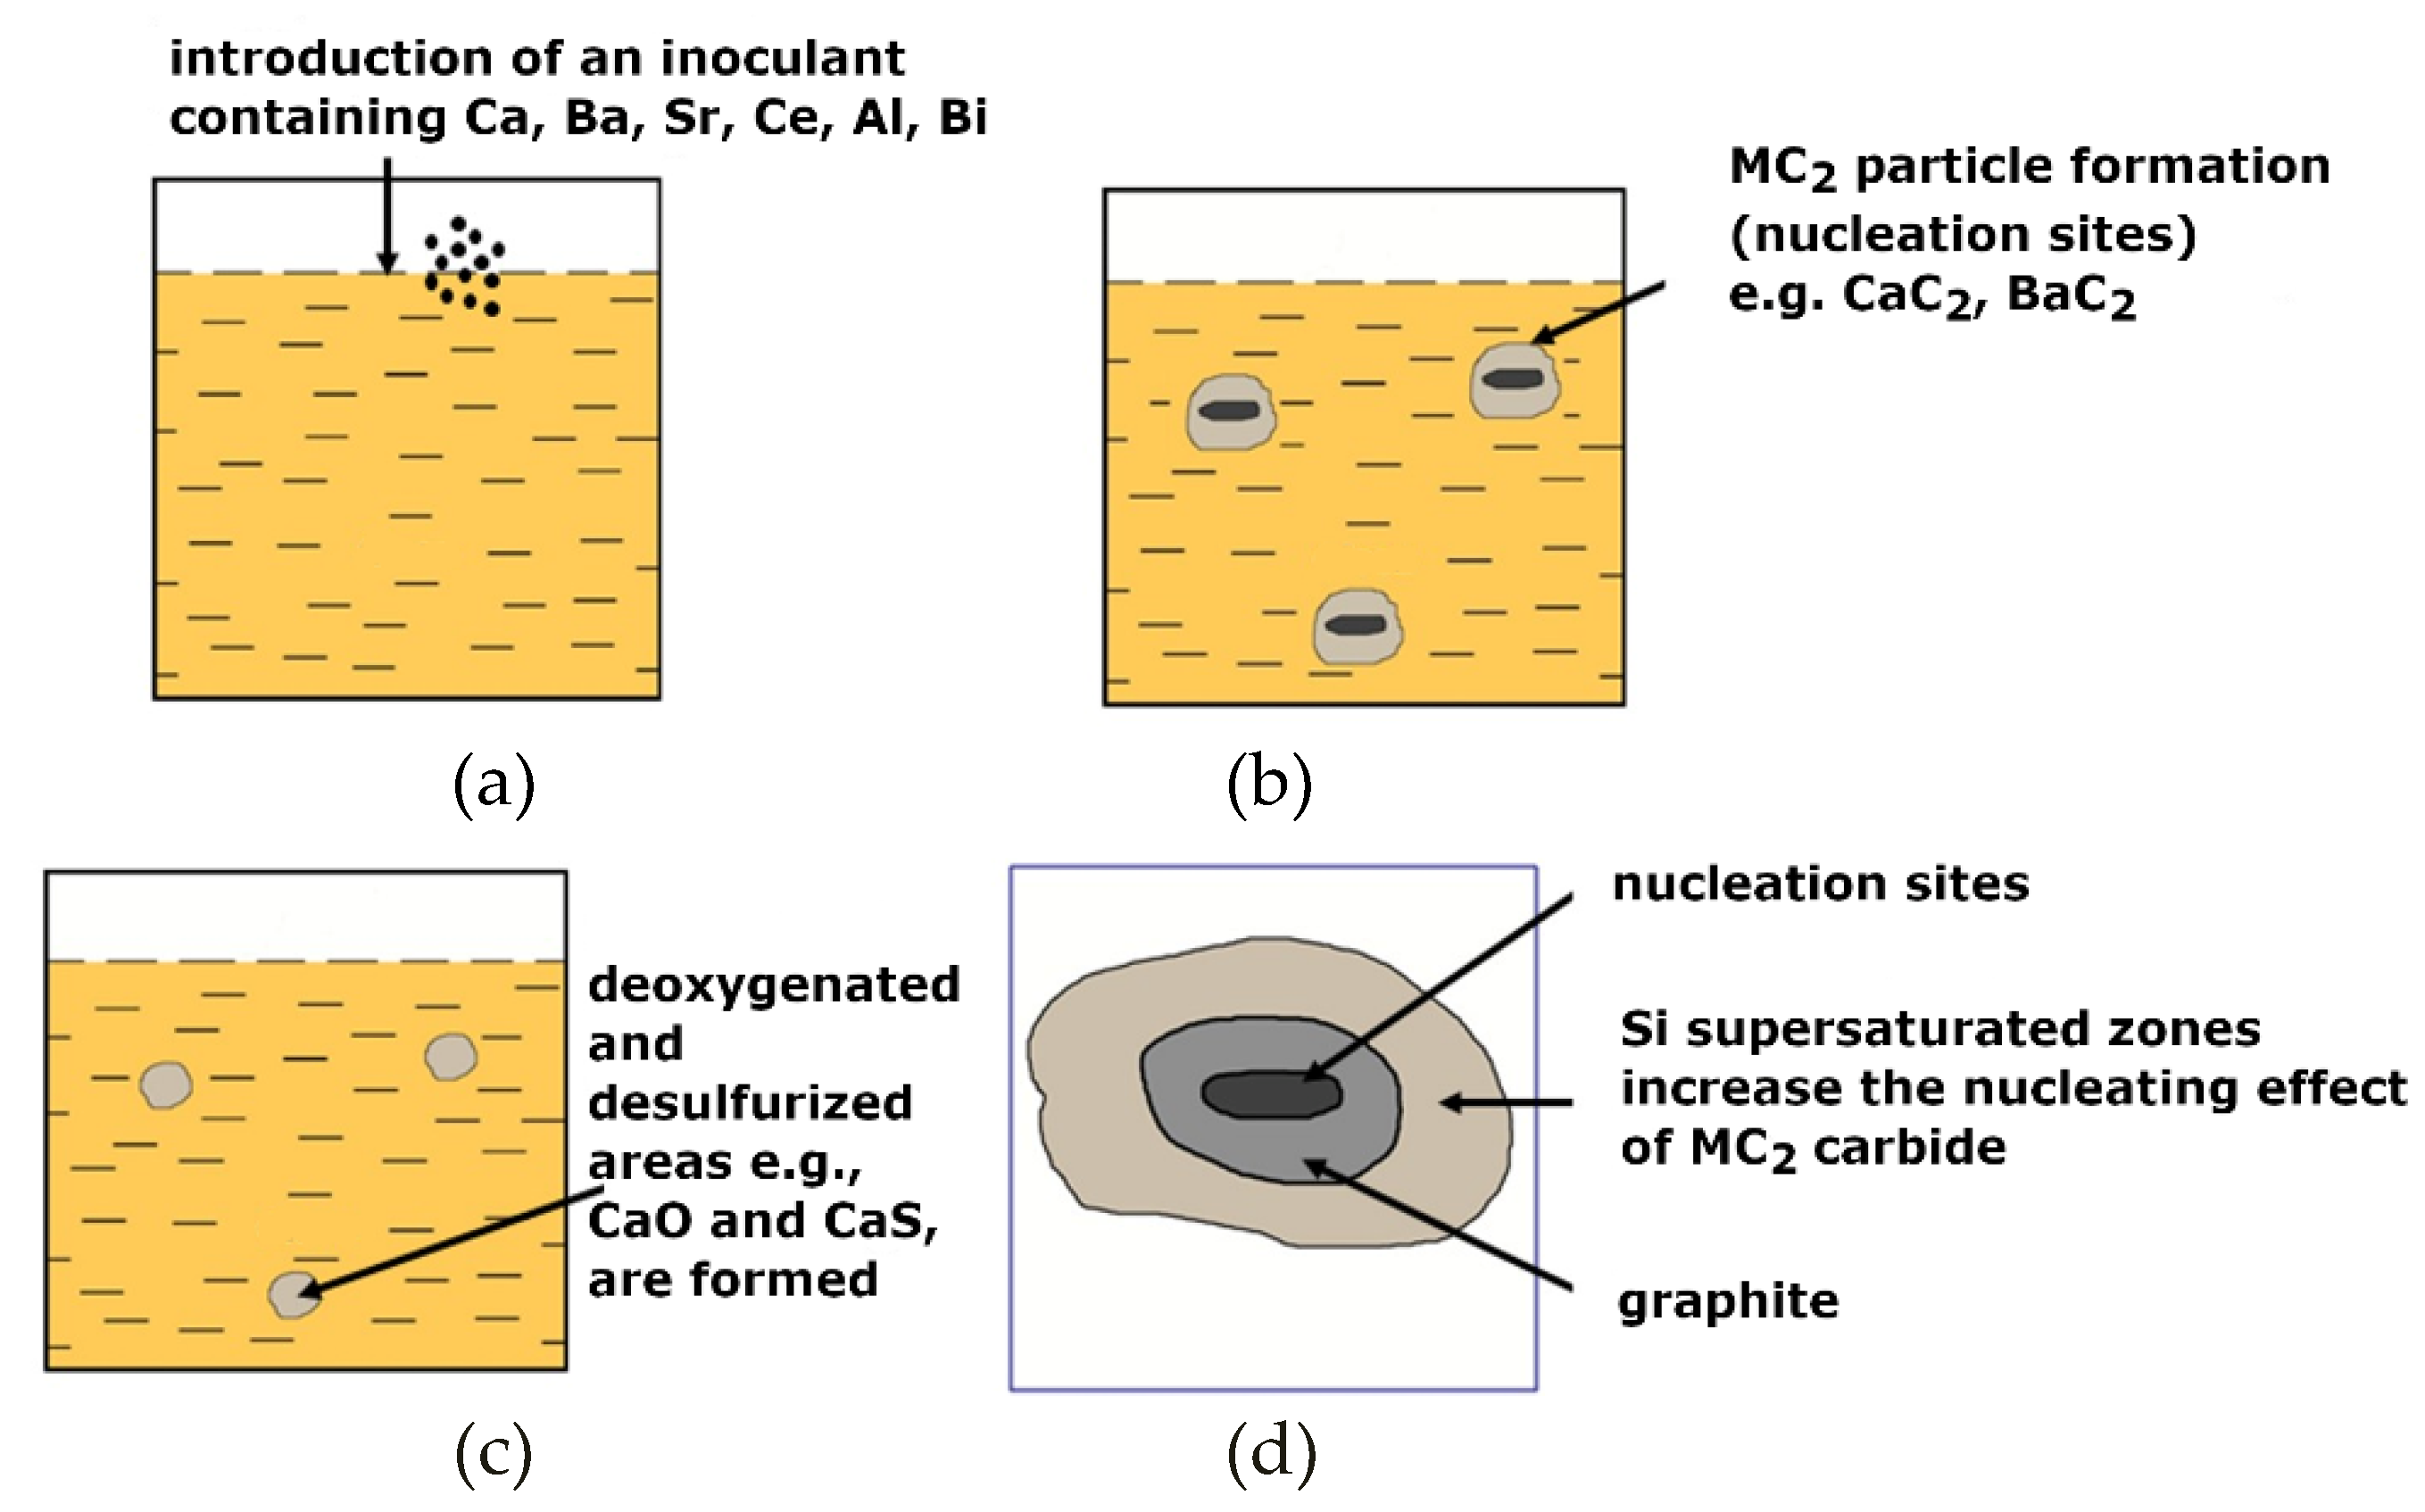
- Choosing the right inoculants is the first and easiest step for eliminating these types of defects.
- The phase composition of the inoculant is essential to influence the primary (primary austenite grains) and secondary (eutectic grains-graphite + austenite grains) structure for cast iron.
- It is important to use a thermal analysis to analyse the metallurgical quality of the molten alloy. This allows for a quick assessment of whether the molten alloy will tend to crystallise with the formation of porosity-type defects.
- The use of a commercial inoculant containing FeSi2+Al-Ba-Si+Ca-Si+Si did not eliminate the porosity from the casting.
- The use of only iron powder also failed to produce a satisfactory effect of eliminating porosity in the casting.
- The preparation of a physical mixture and the application of an inoculant consisting of iron powder and a commercial inoculant FeSi2+Al-Ca-Si+Ca-Si+Si eliminated porosity defects in the tested castings.
Author Contributions
Funding
Institutional Review Board Statement
Informed Consent Statement
Data Availability Statement
Conflicts of Interest
References
- Fredriksson, H.; Wetterfall, S.W. The Metallurgy of Cast Iron; Georgi Publishing Company: St. Saphorin, Switzerland, 1975. [Google Scholar]
- Fraś, E. Crystallization of Metals and Alloys; Scientific Publishers PWN: Warszawa, Poland, 1992. (In Polish) [Google Scholar]
- Lux, B.; Kurz, W. Eutectic growth of iron-carbon-silicon and iron-carbon-silicon-sulphur alloys. Solidif. Met. 1967, 110, 193–203. [Google Scholar]
- Lux, B. Nucleation and Graphite in Fe–C–Si alloys. Recent Research on Cast Iron; Gordon and Breach: New York, NY, USA; London, UK; Paris, France, 1968; pp. 241–250. [Google Scholar]
- McClure, N.C.; Khan, A.U.; McGrady, D.D.; Womohel, H.L. Inoculation of grey cast iron. Trans. AFS 1957, 65, 340–349. [Google Scholar]
- De Sy, A. Oxygen, oxides, superheating and graphite nucleation in cast iron. Mod. Cast. 1967, 52, 67–78. [Google Scholar]
- Fraś, E.; López, H.; Podrzucki, C. The Influence of Oxygen on the Inoculation Process of Cast Iron. Int. J. Cast Metal. Res. 2000, 13, 107–121. [Google Scholar] [CrossRef]
- Dorula, J.; Kopyciński, D.; Guzik, E.; Szczęsny, A.; Gurgul, D. The influence of undercooling ΔT on the structure and tensile strength of grey cast iron. Materials 2021, 14, 6682. [Google Scholar] [CrossRef] [PubMed]
- Rivera, G.L.; Boeri, R.E.; Sikora, J.A. Solidification of grey cast iron. Scr. Mater. 2004, 50, 331–335. [Google Scholar] [CrossRef]
- Fraś, E.; Górny, M.; López, H.F. The transition from grey to white cast iron during solidification: Part II. Experimental verification. Metallurg. Mater. Trans. A 2005, 36, 3083–3092. [Google Scholar] [CrossRef]
- Fraś, E.; Górny, M. Relationship between undecooling and eutectic cell count in cast iron. Arch. Foundry 2006, 21, 377–382. [Google Scholar]
- Dioszegi, A.; Liu, K.Z.; Svensson, J.L. Inoculation of primary austenite in grey cast iron. Cast Met. Res. 2007, 20, 68–72. [Google Scholar] [CrossRef]
- Rivera, G.L.; Calvillo, P.R.; Boeri, R.E.; Houbaert, Y.; Sikora, J.A. Examination of the solidification macrostructure of spheroidal and flake graphite cast irons using DAAS and ESBD. Mater. Charact. 2008, 59, 1342–1348. [Google Scholar] [CrossRef]
- Elmquist, L.; Dioszegi, A. Inoculation and its effect on primary solidification structure of hypoeutectic grey cast iron. Int. J. Cast Met. Res. 2010, 23, 124–129. [Google Scholar] [CrossRef]
- Riviera, R.; Diószegi, A.; Elmquist, L. Solidification study of gray cast iron in a resistance furnace. Key Eng. Mater. 2011, 457, 108–113. [Google Scholar]
- Igarashi, Y.; Okada, S. Graphite growth morphologies in cast iron. J. Jpn. Foundry Eng. Soc. 2001, 73, 83–88. [Google Scholar]
- Haji, M.M. On the Inoculation and Graphite Morphologies of Cast Iron. Ph.D. Thesis, The Royal Institute of Technology, Stockholm, Sweden, 2004; pp. 1–75. [Google Scholar]
- Guzik, E.; Porębski, M. A new complex inoculant KOMO for high quality cast iron. Acta Metall. Slovaca 2002, 8, 10–15. [Google Scholar]
- Fraś, E.; Górny, M.; López, H.F. The transition from grey to white cast iron during solidification: Part I. Theoretical background. Metallurg. Mater. Trans. A 2005, 36, 3007–3082. [Google Scholar]
- Fraś, E.; López, H.F.; Kawalec, M.; Górny, M. Role of Alloying Additions in the Solidification Kinetics and Resultant Chilling Tendency and Chill of Cast Iron. Metals 2015, 5, 256–288. [Google Scholar] [CrossRef]
- Alonso, G.; Stefanescu, D.M.; Sanchez, J.; Zarrabeitia, G.; Suarez, R. Effect of the Type of Inoculant on the Shrinkage Porosity of High Silicon SG Iron. Int. J. Met. 2022, 16, 106–118. [Google Scholar] [CrossRef]
- Ghassemali, E.; Jarfors, A.E.W.; Diószegi, A. On the Formation of Micro-Shrinkage Porosities in Ductile Iron Cast Components. Metals 2018, 8, 551. [Google Scholar] [CrossRef] [Green Version]
- Bhat, M.N.; Khan, D.M.A.; Singh, K.K. Effect of preconditioning and inoculation on graphite nodule count and their size distribution in spheroidal graphite (SG) cast iron: A study to minimise rejection of castings due to shrinkage porosity. Int. J. Met. 2019, 13, 89–97. [Google Scholar]
- Elmquist, L.; Diószegi, A. Shrinkage porosity and its relation to solidification structure of grey cast iron parts. Int. J. Cast Met. Res. 2010, 23, 44–50. [Google Scholar] [CrossRef]
- Petrus, L.; Bulanowski, A.; Kolakowski, J.; Brzezanski, M.; Urbanowicz, M.; Sobieraj, J.; Matuszkiewicz, G.; Szwalbe, L.; Janerka, K. The Influence of Selected Melting Parameters on the Physical and Chemical Properties of Cast Iron. Arch. Foundry Eng. 2020, 20, 105–110. [Google Scholar]
- Pupo-Salazar, L.; Arias-Ambruster, A.; Pastor Sanchez-Figueredo, R.; Braulio Garcia-Dominguez, A.; Hernan Oviedo-Fierro, F. Numerical analysis of the pouring and preheating temperature of the mold in the development of porosity in gray iron samples. Rev. Cuba. Ing. 2021, 12, 1–10. [Google Scholar]
- Stefanescu, D.M.; Sanchez, J.; Kim, S.B. 90 years of thermal analysis as a control tool in the melting of cast iron. China Foundry 2020, 17, 69–84. [Google Scholar] [CrossRef]
- Guzik, E. Processing of Cast Iron; Monograph Publishers–Archives of Foundry: Katowice, Poland, 2001. (In Polish) [Google Scholar]
- Szala, J. Application of Computer-Aided Image Analysis Methods for a Quantitative Evaluation of Material Structure; Archives of Metallurgy, Monograph No. 61; Silesian University of Technology: Gliwice, Poland, 2001. [Google Scholar]
- Zhou, J. Colour metallography of cast iron. China Foundry 2009, 6, 366–374. [Google Scholar]
- Vaucheret, A.; Jacquet, P.; Rossi, F.; Lagardette, P. Optimizing the inoculation of a ductile cast iron using thermal analysis. In Proceedings of the International PhD Foundry Conference, Brno, Czech Republic, 3 June 2009. [Google Scholar]


| Melt No. | C | Si | Mn | P | S | Ti | Al | Cu | N |
|---|---|---|---|---|---|---|---|---|---|
| A | 3.40 | 2.0 | 0.63 | 0.1 | 0.020 | <0.01 | - | 0.8 Cu | - |
| B | 3.24 | 1.60 | 0.91 | 0.04 | 0.025 | <0.01 | 0.01 Al | - | 0.013% |
| Melt No. | C | Si | Mn | P | S |
|---|---|---|---|---|---|
| 1 | 2.92 | 1.65 | 0.38 | 0.03 | 0.014 |
| 2 | 3.02 | 1.61 | 0.40 | 0.04 | 0.09 |
| Linear Temperature Function of Temperature in the Liquidus–Solidus Range | ||
|---|---|---|
| Heat transfer coefficient between mould and alloy, W/m2K | Liquid alloy | 800 |
| Solid casting | 400 | |
| Temperature, °C | Melt | 1400.00 |
| Mould | 20.00 | |
| Liquidus | 1165.55 | |
| Solidus | 1064.65 | |
 |  | |
 |  | |
Publisher’s Note: MDPI stays neutral with regard to jurisdictional claims in published maps and institutional affiliations. |
© 2022 by the authors. Licensee MDPI, Basel, Switzerland. This article is an open access article distributed under the terms and conditions of the Creative Commons Attribution (CC BY) license (https://creativecommons.org/licenses/by/4.0/).
Share and Cite
Dorula, J.; Kopyciński, D.; Guzik, E.; Szczęsny, A. Procedure of Eliminating Porosity in Grey Cast Iron with Low Sulphur Content. Materials 2022, 15, 6273. https://doi.org/10.3390/ma15186273
Dorula J, Kopyciński D, Guzik E, Szczęsny A. Procedure of Eliminating Porosity in Grey Cast Iron with Low Sulphur Content. Materials. 2022; 15(18):6273. https://doi.org/10.3390/ma15186273
Chicago/Turabian StyleDorula, Józef, Dariusz Kopyciński, Edward Guzik, and Andrzej Szczęsny. 2022. "Procedure of Eliminating Porosity in Grey Cast Iron with Low Sulphur Content" Materials 15, no. 18: 6273. https://doi.org/10.3390/ma15186273
APA StyleDorula, J., Kopyciński, D., Guzik, E., & Szczęsny, A. (2022). Procedure of Eliminating Porosity in Grey Cast Iron with Low Sulphur Content. Materials, 15(18), 6273. https://doi.org/10.3390/ma15186273