Article

Cation Valences and Multiferroic Properties of EuTiO3 Co-Doped with Ba and Transition Metals of Co/Ni

1
Department of Materials Science and Engineering, National Cheng Kung University, Tainan City 70101, Taiwan
2
Center for Micro/Nano Science and Technology, National Cheng Kung University, Tainan City 70101, Taiwan
*
Author to whom correspondence should be addressed.
Materials 2022, 15(19), 6652; https://doi.org/10.3390/ma15196652
Submission received: 2 September 2022 / Revised: 15 September 2022 / Accepted: 22 September 2022 / Published: 25 September 2022
(This article belongs to the Special Issue Advances in Synthesis and Characterization of Dielectric Ceramics)

Abstract

:
Eu1−xBaxTi1−yMyO3 (M = Co or Ni) was sintered at 1400 °C under a reduction atmosphere. X-ray photoelectron spectroscopy revealed the mixed valences of Eu2+/Eu3+ and Ti4+/Ti3+ in EuTiO3 and Eu0.7Ba0.3TiO3, as well as some oxygen vacancies required to keep the charge neutrality. The co-doping of Co2+/Ni2+ in Eu0.7Ba0.3TiO3 resulted in the disappearance of oxygen vacancies, as a result of a reduction in Ti3+ numbers and an increase in Eu3+ numbers. On the other hand, Ba2+ doping led to an increased lattice parameter due to its larger ionic size than Eu2+, whereas the Co2+/Ni2+ co-doping resulted in smaller lattice parameters because of the combined effects of ionic size and variation in the oxygen-vacancy numbers. Eu0.7Ba0.3TiO3 exhibited a clear ferroelectricity, which persisted in the Co2+/Ni2+ co-doped samples until the doping levels of y = 0.05 and 0.10, respectively. Eu0.7Ba0.3TiO3 remained to be antiferromagnetic with a reduced transition temperature of 3.1 K, but co-doping of Co2+/Ni2+ turned the samples from antiferromagnetic to ferromagnetic with transition temperatures of 2.98 K and 2.72 K, respectively. The cause for such a transition could not be explained by the larger lattice volume, oxygen vacancies and mixed valences of Eu2+/Eu3+, which were proposed in previous works. Instead, it was more likely to arise from a large asymmetric distortion of the Eu–O polyhedron introduced by the aliovalent doping, which promotes the admixture of Eu 5d and 4f states.

1. Introduction

Pristine and doped EuTiO3, in both bulk and thin-film forms, have been studied intensively during the past ten years or so due to a variety of interesting properties including multiferroicity [1,2,3], hidden spin orders [4,5,6], large magnetodielectric and magnetocaloric effects [7,8,9,10], etc. EuTiO3 belongs to the perovskite-structured oxides, which has an undistorted cubic lattice at room temperature (RT). Pristine EuTiO3 is known as an incipient ferroelectric with a large dielectric constant (~400) at low temperature [7], and a G-type antiferromagnet below 5.3 K [11]. It was predicted by first-principles calculation to exhibit strong ferromagnetism and ferroelectricity simultaneously under large biaxial compressive strains [12]. However, a later theoretical work indicated that the multiferroicity may also be induced by biaxial tensions with the added benefit of less strain required, which was demonstrated experimentally in epitaxial EuTiO3 thin films [3]. Apart from the heteroepitaxial thin films, structural distortions and strains may also be introduced by chemical doping. EuTiO3 has therefore been substituted at both the A-site (Eu2+) and B-site (Ti4+) for a variety of interests. The dopants at A-site included alkaline-earths, such as Sr, Ba and Ca [10,13,14,15,16,17], as well as rare-earths other than Eu (e.g., La, Ce and Sm) [17,18], whereas the dopants at B-site were mainly transition metals (TMs) (e.g., Cr, Ni, Mn, Fe, Co, Nb, Zr, etc.) [19,20,21,22,23,24] and a few main group-III elements (e.g., Al and Ga) [25].
Apart from Ba, doping of other elements at either the A or B site has so far been unable to turn EuTiO3 into a real ferroelectric. The appearance of ferroelectricity in the Ba-doped EuTiO3 is not surprising. BaTiO3 (a typical ferroelectric) is isostructural to EuTiO3, allowing it to form a full range of solid solutions with EuTiO3. So, at a high enough x, Eu1−xBaxTiO3 must become ferroelectric [13,14]. In contrast to the “inertness” of ferroelectricity to chemical doping, the magnetic properties of EuTiO3 are affected notably by the chemical doping at either the A or B site. In particular, doping of either TMs or main group elements at the B-site by ions of lower valence than Ti4+, such as Cr3+, Ni2+, Mn2+, Fe3+, Co2+, Al3+ and Ga3+, results in ferromagnetism [19,20,21,22,23,25], whereas isovalent doping at the B site by tetravalent ions, such as Zr4+, only leads to a decrease in antiferromagnetic ordering temperature (TN) over the entire substitution range of EuTi1−xZrxO3, i.e., TN = 5.6 K at x = 0 to TN = 4.1 K at x = 1 [24]. Furthermore, the effect of doping higher-valence ions at the B site was found to be dependent on the dopant concentration. It was showed that doping of ≤5 at% Nb5+ resulted in a similar decrease in TN as in the case of isovalent doping [24]. However, higher doping level (>5 at%) of Nb5+ led to ferromagnetism, and this was accompanied by a transition from the semiconductor conductivity to metallic conductivity [24], tempting the speculation that the ferromagnetism may arise from the itinerant d-electron-mediated Eu 4f spin interactions. Such a mechanism for ferromagnetism in the donor-doped EuTiO3 has also been proposed for the La3+-doped EuTiO3 at the A-site, which introduced electrons to the empty Ti 3d states [18]. On the other hand, as with the isovalent doping at the B site, doping at the A site by high concentrations of isovalent ions, such as Ba2+ and Ca2+, does not switch EuTiO3 from an antiferromagnet to a ferromagnet; i.e., Eu1−xBaxTiO3 remains antiferromagnetic with a reduced TN of 1.9 K at x = 0.5 [14], while Eu1−xCaxTiO3 is also antiferromagnetic at x = 0.6 with TN of 2.6 K [15].
Although there have been a number of studies on the chemical doping at A or B sites of EuTiO3, the studies on the co-doping at both A and B sites are far fewer in comparison. In this work, we investigated the effects of Ba and TM co-doping on the ferroelectric and magnetic properties of EuTiO3, as well as the changes in cation valences in the co-doped EuTiO3. The stable valence of Eu in air is 3+ whereas the Eu valence in EuTiO3 is 2+. So, EuTiO3 has to be synthesized in a sufficient reduction atmosphere to avoid Eu3+, which may also reduce some Ti4+ in EuTiO3 to lower valence Ti3+. Therefore, apart from Eu2+ and Ti4+, a certain amount of Eu3+ and/or Ti3+ are expected to coexist in the samples, but they have not been well studied experimentally so far. It is well-known that the magnetic property in EuTiO3 mainly arises from Eu2+, which has seven unpaired 4f electrons. So, in order to retain strong magnetic interaction, doping at the Eu2+ site was carried out in this work with the minimum amount of Ba2+ that was required to induce a clear ferroelectricity, and then the TM co-doping at the Ti4+ site was taken to the highest possible concentration, above which a secondary phase might occur or the ferroelectricity might disappear. The ferroelectric and magnetic properties, which coexisted in such co-doped EuTiO3 of a pure phase, were then investigated in detail.

2. Materials and Methods

Eu1−xBaxTi1−yMyO3 (M = Co or Ni, x = 0–0.3 and y = 0–0.1) samples were synthesized by solid-state reaction in an air-tight tube furnace filled with a mixed-gas stream of Ar + 3%H2, flowing at 50 sccm. The starting chemicals included the powders of Eu2O3 (99.9%, Alfa Aesar), TiO2 (99.9%, Showa), BaCO3 (99.95%, Alfa Aesar), Co3O4 (99.7%, Alfa Aesar) and NiO (99.8%, Showa). The powders were weighed according to the stoichiometric ratios of the metallic elements, and well-mixed by wet ball-milling with the addition of ethanol. The mixture was then dried and pressed into pellets measuring about 8 mm in diameter by 1–2 mm thick, under a pressure of 50 Kg/cm2 with the addition of 1.0 wt% PVB (polyvinyl butyral) as the binder, which was in the form of 10 wt% ethanol solution. The pellets were heated to 650 °C at 5 °C/min and dwelled for 1 h to remove the PVB binder. Afterwards, they were sintered at 1400 °C for 20 h. The synthesized samples were characterized by a range of techniques, including powder X-ray diffraction (XRD, Bruker D2 Phaser), X-ray photoelectron spectroscopy (XPS, PHI 5000 VersaProbe), and the measurements of DC conductivity (Agilent 34410A), ferroelectric hysteresis (Radiant Precision LC Ferroelectric Tester) and magnetic properties (Quantum Design MPMS). In the ferroelectric and DC conductivity measurements, both surfaces of the circular pellets were painted with silver paste as the electrodes.

3. Results and Discussion

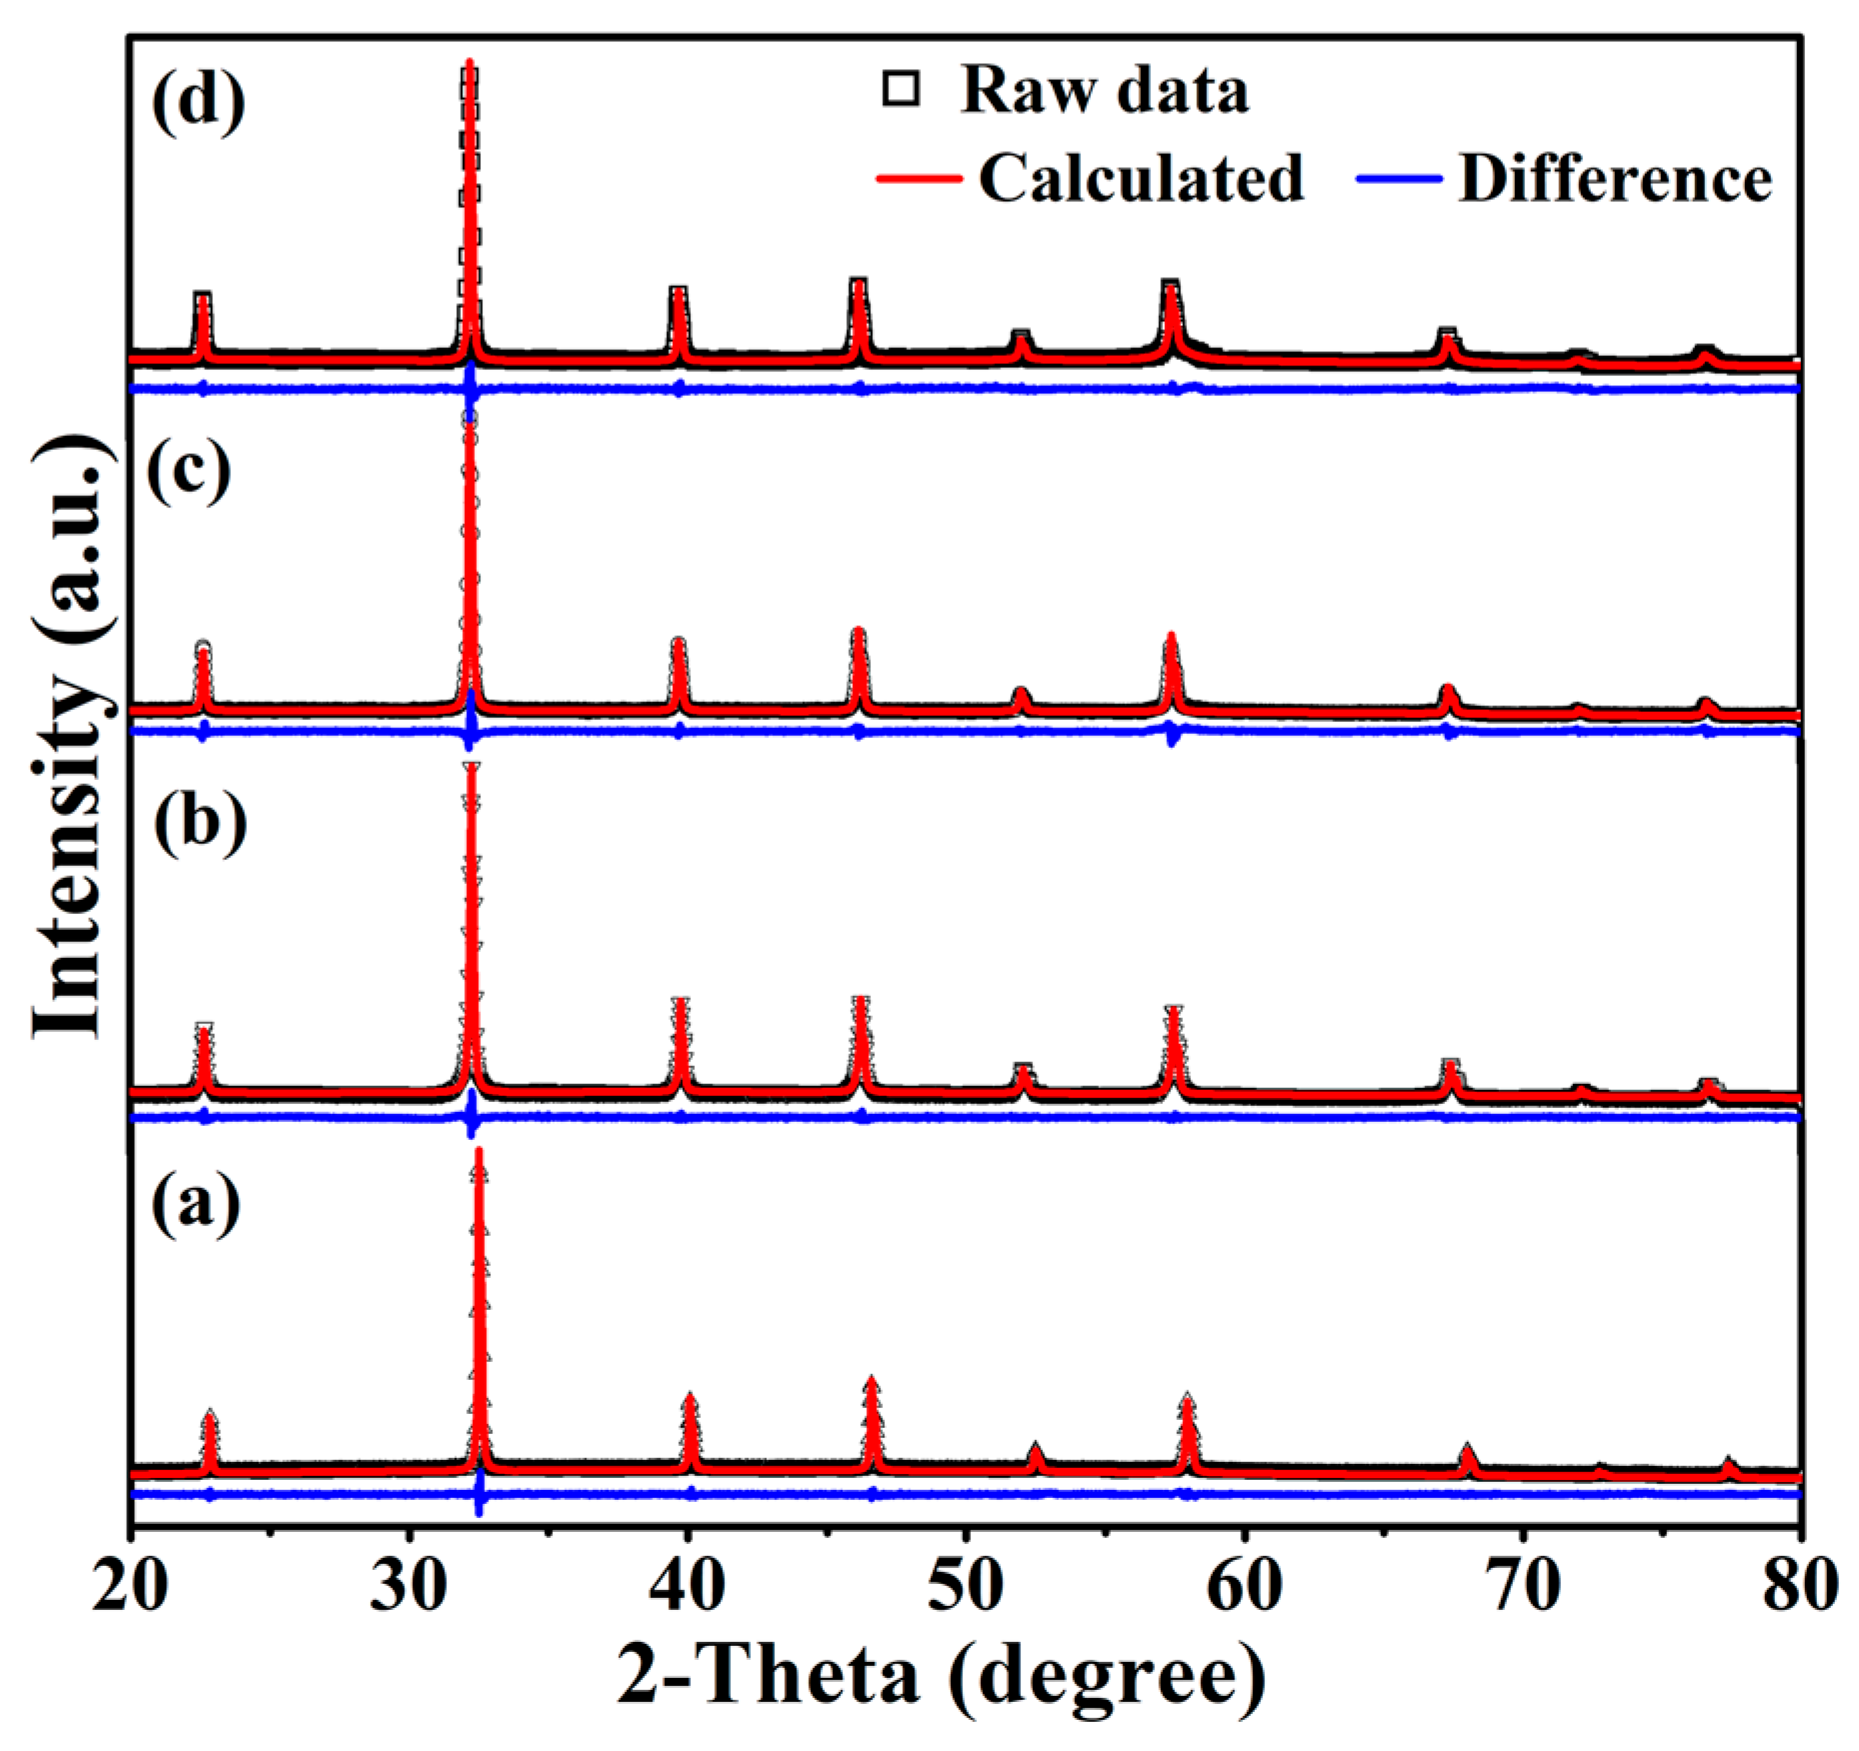
3.1. Phase Purity, Structure and Valences of Cations

Figure 1 shows the XRD patterns of Eu1−xBaxTi1−yMyO3 recorded at RT. All the reflection lines of each sample can be identified with the known EuTiO3 phase in the powder diffraction database (PDF#73-2120), which is cubic with the space group Pm-3m. The results indicate that all the synthesized samples had a pure phase and the co-substitutions of 30 at% Eu by Ba and 10 at% Ti by Co/Ni did not incur segregation of any secondary phase. However, the substitutions did result in structural variations, as indicated by the shifts of reflection lines. Thus, the actual crystal structures of the synthesized samples were refined based on the XRD data by the TOPAS software [26], which combines a number of fitting techniques including the Rietveld refinement. Table 1 lists the refined lattice parameters of the samples. The undoped EuTiO3 had a lattice parameter of 3.8976 Å, almost the same as that given in PDF#73-2120. Doping of 30 at% Ba2+ (i.e., Eu0.7Ba0.3TiO3) resulted in a larger lattice parameter of 3.9340 Å, which is expected in view of the larger ionic size of Ba2+ (1.52 Å) compared to Eu2+ (1.35 Å). Similar increases in the lattice parameters of Eu1−xBaxTiO3 were also reported elsewhere [13].
However, the variations in lattice parameter induced by Co/Ni co-doping at the Ti4+ site were more complicated due to aliovalent substitutions. Apart from the ionic size, structural changes incurred by charge-compensation mechanisms might have to be taken into account. As will be discussed below, although the valence states of Eu and Ti in EuTiO3 are usually assumed to be +2 and +4, respectively, XPS analyses indicated the existence of Eu3+ and Ti3+, whose amounts varied with the co-doping of Co or Ni, which were both in the valence states of +2. As indicated in Table 1, both Co2+ and Ni2+ co-doping at Ti4+ sites resulted in smaller lattice parameters compared to Eu0.7Ba0.3TiO3, as the consequence of a reduced number of Ti3+ and the correlated oxygen vacancies. The latter is known to cause a larger size of lattice, i.e., the so-called chemical expansion [27,28], so a reduction of such will result in a smaller lattice size.
Figure 2 shows XPS spectra around the Eu 3d5/2 binding energy (BE) for Eu1−xBaxTi1−yMyO3. All the samples contained some amounts of Eu3+, despite the fact that they were synthesized under the reduction atmosphere described in the experimental section. The rare-earth elements are usually trivalent, so the existence of some Eu3+ in EuTiO3 might be expected and was, indeed, also observed in previous works [29,30]. The charge imbalance due to the occurrence of Eu3+ was compensated for by the presence of Ti3+ in the samples, as indicated in the Ti 2p3/2 XPS spectra (Figure 3). The ratios of Eu2+/Eu3+ and Ti4+/Ti3+ can be estimated by the ratios of peak area for each ion, which were 87/13 and 70/30, respectively, for undoped EuTiO3, indicating that the number of Ti3+ was more than that needed for charge compensation of Eu3+. So, a small amount of oxygen vacancies was required to keep an overall charge neutrality, which was calculated to be 2.97% (i.e., EuTiO2.91). Ba is known to have a stable valence state of +2, which was confirmed in XPS. The isovalent substitution of Ba2+ with Eu2+ caused little change in the Eu2+/Eu3+ and Ti4+/Ti3+ ratios, as seen in Figure 2b and Figure 3b. So, the Ba2+-doped samples had approximately the same oxygen deficiency (2.95%) as undoped EuTiO3. Such an amount of oxygen vacancies was in the range reported for the epitaxial films of Eu0.5Ba0.5TiO3−δ (δ = 0.02–0.15) grown under low oxygen partial pressures (10−1–10−4 Pa) [31].
Figure 4a shows the XPS spectrum around the BE of Co 2p1/2 for Eu0.7Ba0.3Ti0.95Co0.05O3, which consists of a main peak at 795.1 eV and a small shoulder at the lower BE side (793.0 eV). Co is one of the known elements whose valence and chemical shift in XPS are reversed, so the main peak arose from Co2+, while the small shoulder was the contribution from Co3+ [33,34]; i.e., the dominant valence of Co in the co-doped samples was +2 (Co2+/Co3+ ≈ 92/8). Figure 4b shows the XPS spectrum around the BE of Ni 3p for Eu0.7Ba0.3Ti0.90Ni0.10O3, in which the two peaks at 66.31 and 64.40 eV with a separation of 1.9 eV were identified with the Ni2+ 3p1/2 and 3p3/2 doublet, according to the previously reported BEs for divalent Ni oxides such as NiO and La2NiMnO6 [35,36,37]. It is noted that the BE of Ti 3s also falls in the range of Figure 4b and the peak at 60.5 eV matches well with the reported values for Ti4+ 3s [38,39]. This peak has to be fitted with a small peak at 61.96 eV, which may come from those Ti4+ ions with the dopant Ni2+ at neighboring sites. The 3s sublevel is in the outermost atomic shell of Ti4+, so its BE is susceptible to the change in surrounding ions.
In contrast to the isovalent doping of Ba2+ at the Eu2+ site, the aliovalent doping of Co2+/Ni2+ at the Ti4+ site resulted in notable changes in both the Eu2+/Eu3+ and Ti4+/Ti3+ ratios, as compared in Figure 2 and Figure 3. The Eu2+/Eu3+ ratio decreased whereas the Ti4+/Ti3+ ratio increased, i.e., more Eu3+ and less Ti3+ were generated in the Co2+ or Ni2+ co-doped samples. Particularly in Eu0.7Ba0.3Ti0.90Ni0.10O3, the amount of Eu3+ was more than Eu2+, and yet, the BE of Ti 2p3/2 was fit very well by a single peak for Ti4+, indicating the absence of Ti3+. The increase in Eu3+ numbers and decrease in Ti3+ numbers in the Co2+/Ni2+ co-doped samples alluded to the need for small amount of oxygen interstitials instead of oxygen vacancy for charge compensation, i.e., Eu0.7Ba0.3Ti0.95Co0.05O3.10 and Eu0.7Ba0.3Ti0.90Ni0.10O3.13. However, it is noted that other charge-compensation mechanisms than the oxygen interstitials for a higher overall cation valence in the formula may also be possible (e.g., slight variation in the A/B-site cation ratio).

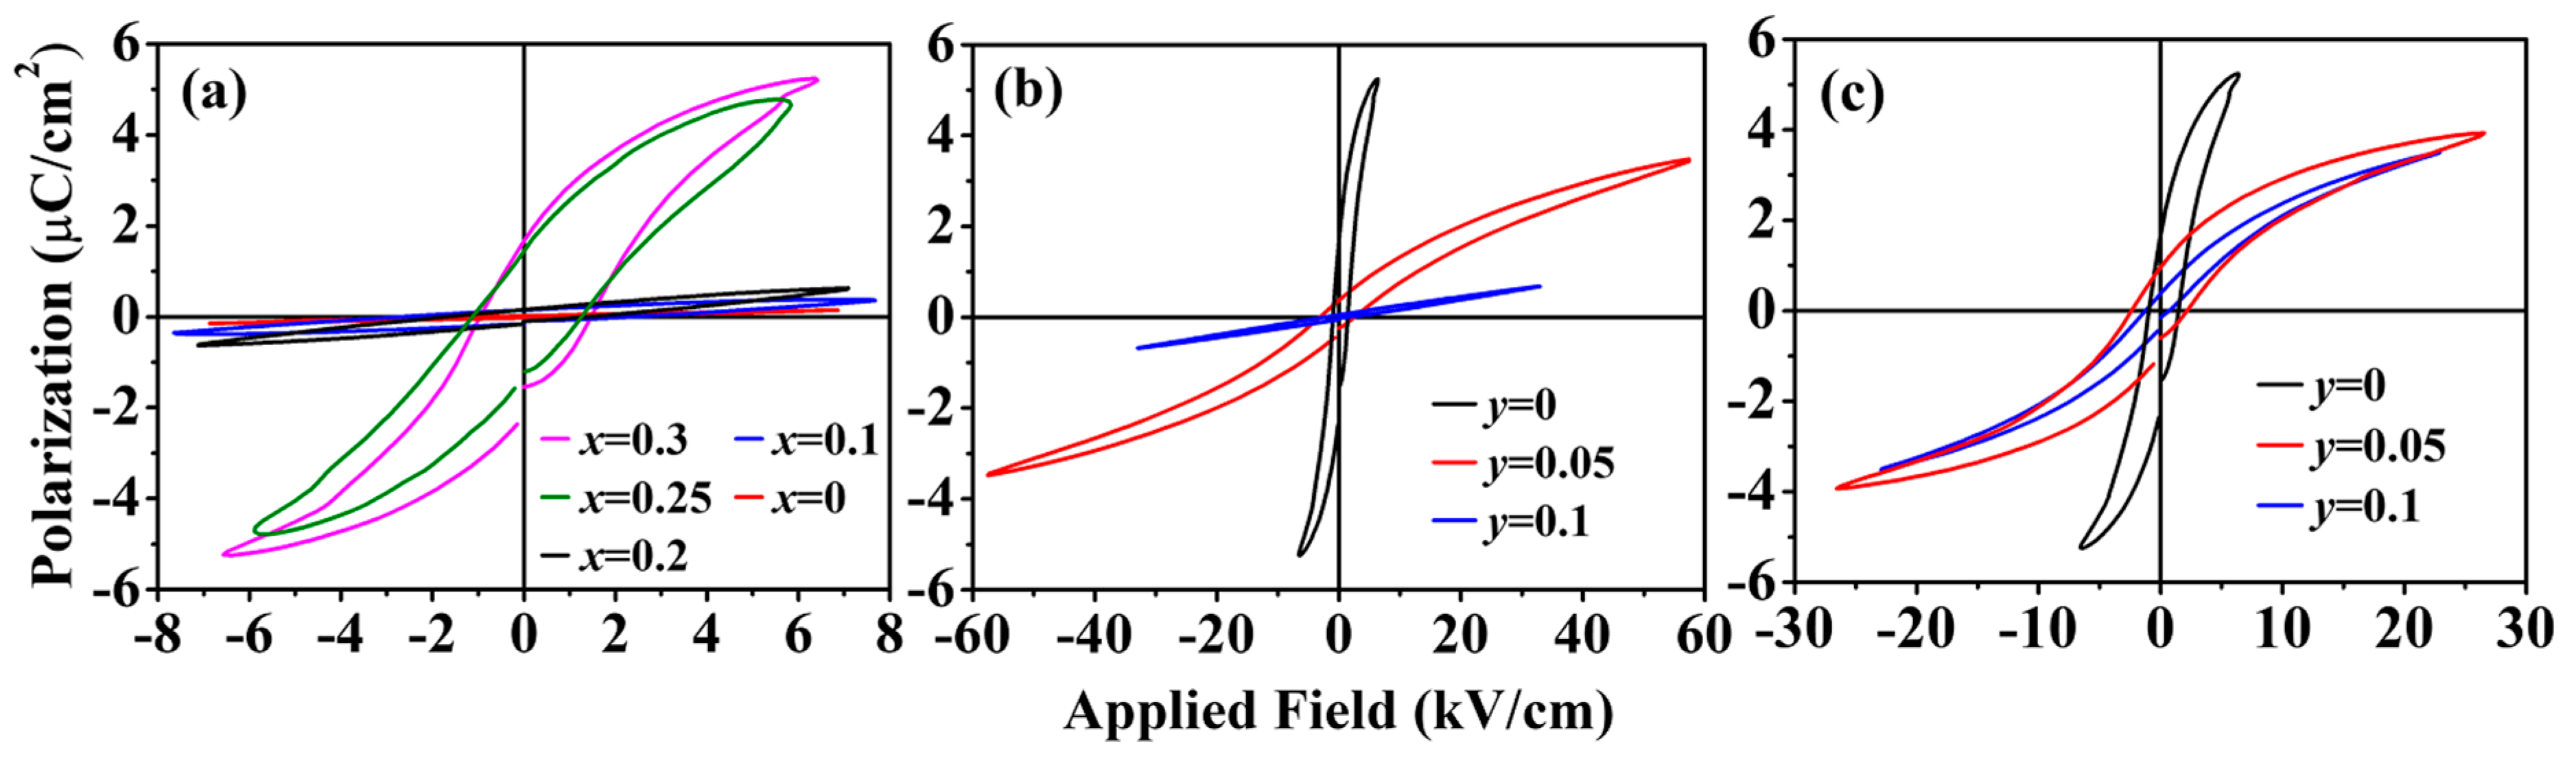
3.2. Ferroelectric Properties

The Eu1−xBaxTi1−yMyO3 samples synthesized in this work had a high resistivity (>10 kΩ·cm at RT), which decreased with an increase in temperature (i.e., a nonmetallic behavior), as shown in Figure 5. Nevertheless, the polarization vs. field (P–E) measurements at RT were still complicated by the leakage current driven under the large applied field that was required to switch ferroelectric domains. However, as discussed in Section 3.1, all the samples had a cubic structure at RT; therefore, they should not be ferroelectric at RT. So, the measurements were taken at 77 K. Figure 6a shows the P–E hysteresis loops for Eu1−xBaxTiO3 (x = 0–0.3). The samples with x < 0.25 exhibited linear P–E curves, indicating a paraelectric behavior. Typical P–E hysteresis loops for the ferroelectric behavior occurred with the samples of x ≥ 0.25, which was consistent with the previous report [13]. However, it is noted that the ferroelectricity in the x = 0.25 samples was observed at a temperature below 60 K in the previous work [13]. Such a difference in transition temperature (TC) might arise from the small deviation in actual sample compositions, because TC of Eu1−xBaxTiO3 (x ≥ 0.25) was found to shift greatly with x, i.e., TC ≈ 60 K at x = 0.25, which shifted to TC ≈ 145 K at x = 0.35, and to TC ≈ 196 K at x = 0.45 [13].
Because x = 0.25 was the lowest Ba-doping level to induce ferroelectricity in Eu1−xBaxTiO3 at 77 K, a slightly higher Ba-doping level, i.e., x = 0.30, was then chosen to study the Co/Ni co-doping effect on the ferroelectricity of Eu0.7Ba0.3Ti1−yMyO3 (M = Co or Ni). Figure 6b shows the P–E hysteresis loops of Eu0.7Ba0.3Ti1−yCoyO3, which indicate that the ferroelectricity remained in the samples of y = 0.05, whereas in the y = 0.10 samples the ferroelectricity had disappeared. On the other hand, Eu0.7Ba0.3TiO3 allowed higher Ni co-doping at Ti-site and a ferroelectricity could still be observed in the Eu0.7Ba0.3Ti1−yNiyO3 samples of y = 0.10. However, the co-doping of either Co or Ni led to a reduced remanent polarization (Pr), as shown in Table 2, indicating the weakening of ferroelectricity. The result implies that, similar to BaTiO3, the ferroelectricity in Eu0.7Ba0.3TiO3 may arise from the so-called d0 mechanism, in which the spontaneous polarization is created by the hybridization between the filled oxygen 2p states and the empty d states of the TM cation [40]. Substitution of non-d0 ions, such as Co2+ and Ni2+, reduces net charge transfer between TM d and O p states and thus leads to the weaker ferroelectricity. However, it is not clear why ferroelectricity existed in higher Ni2+ co-doped samples than in the Co2+ co-doped samples. Although this may be related to different crystal field splitting and electronic occupation of d7 (Co2+) and d8 (Ni2+) states, theoretical calculation is needed for a better understanding, which is apparently outside the scope of the current work.

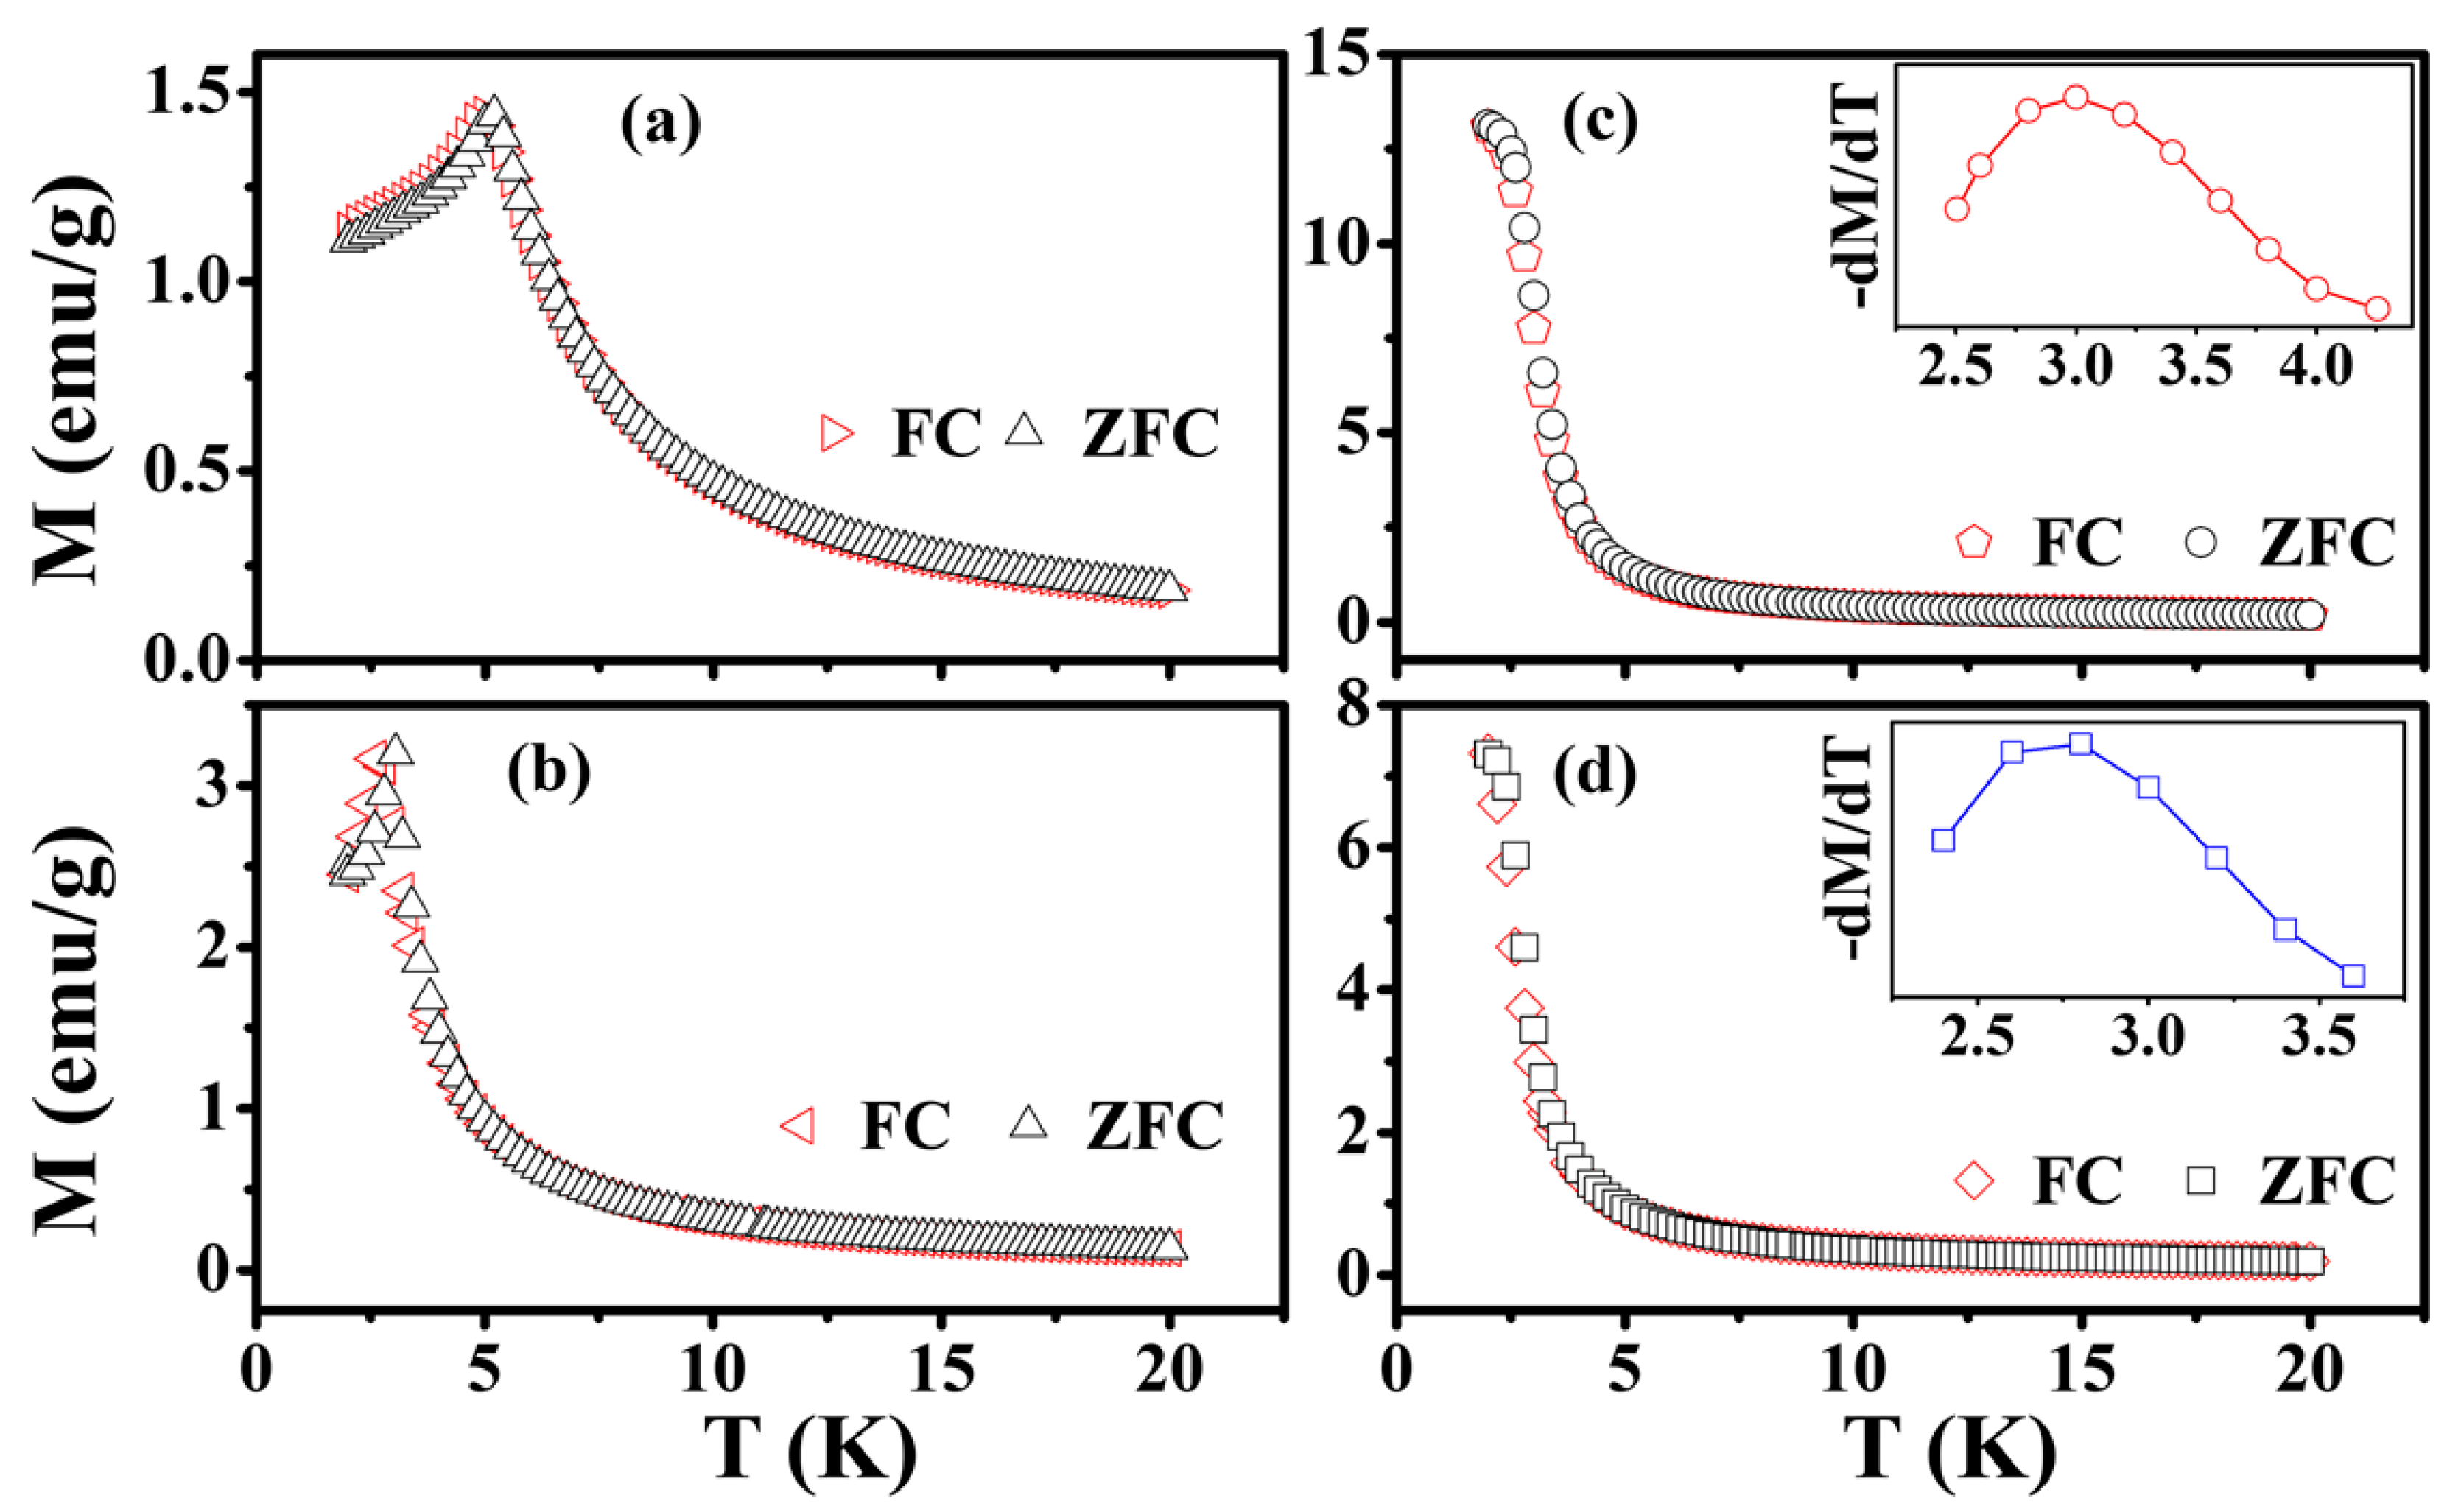
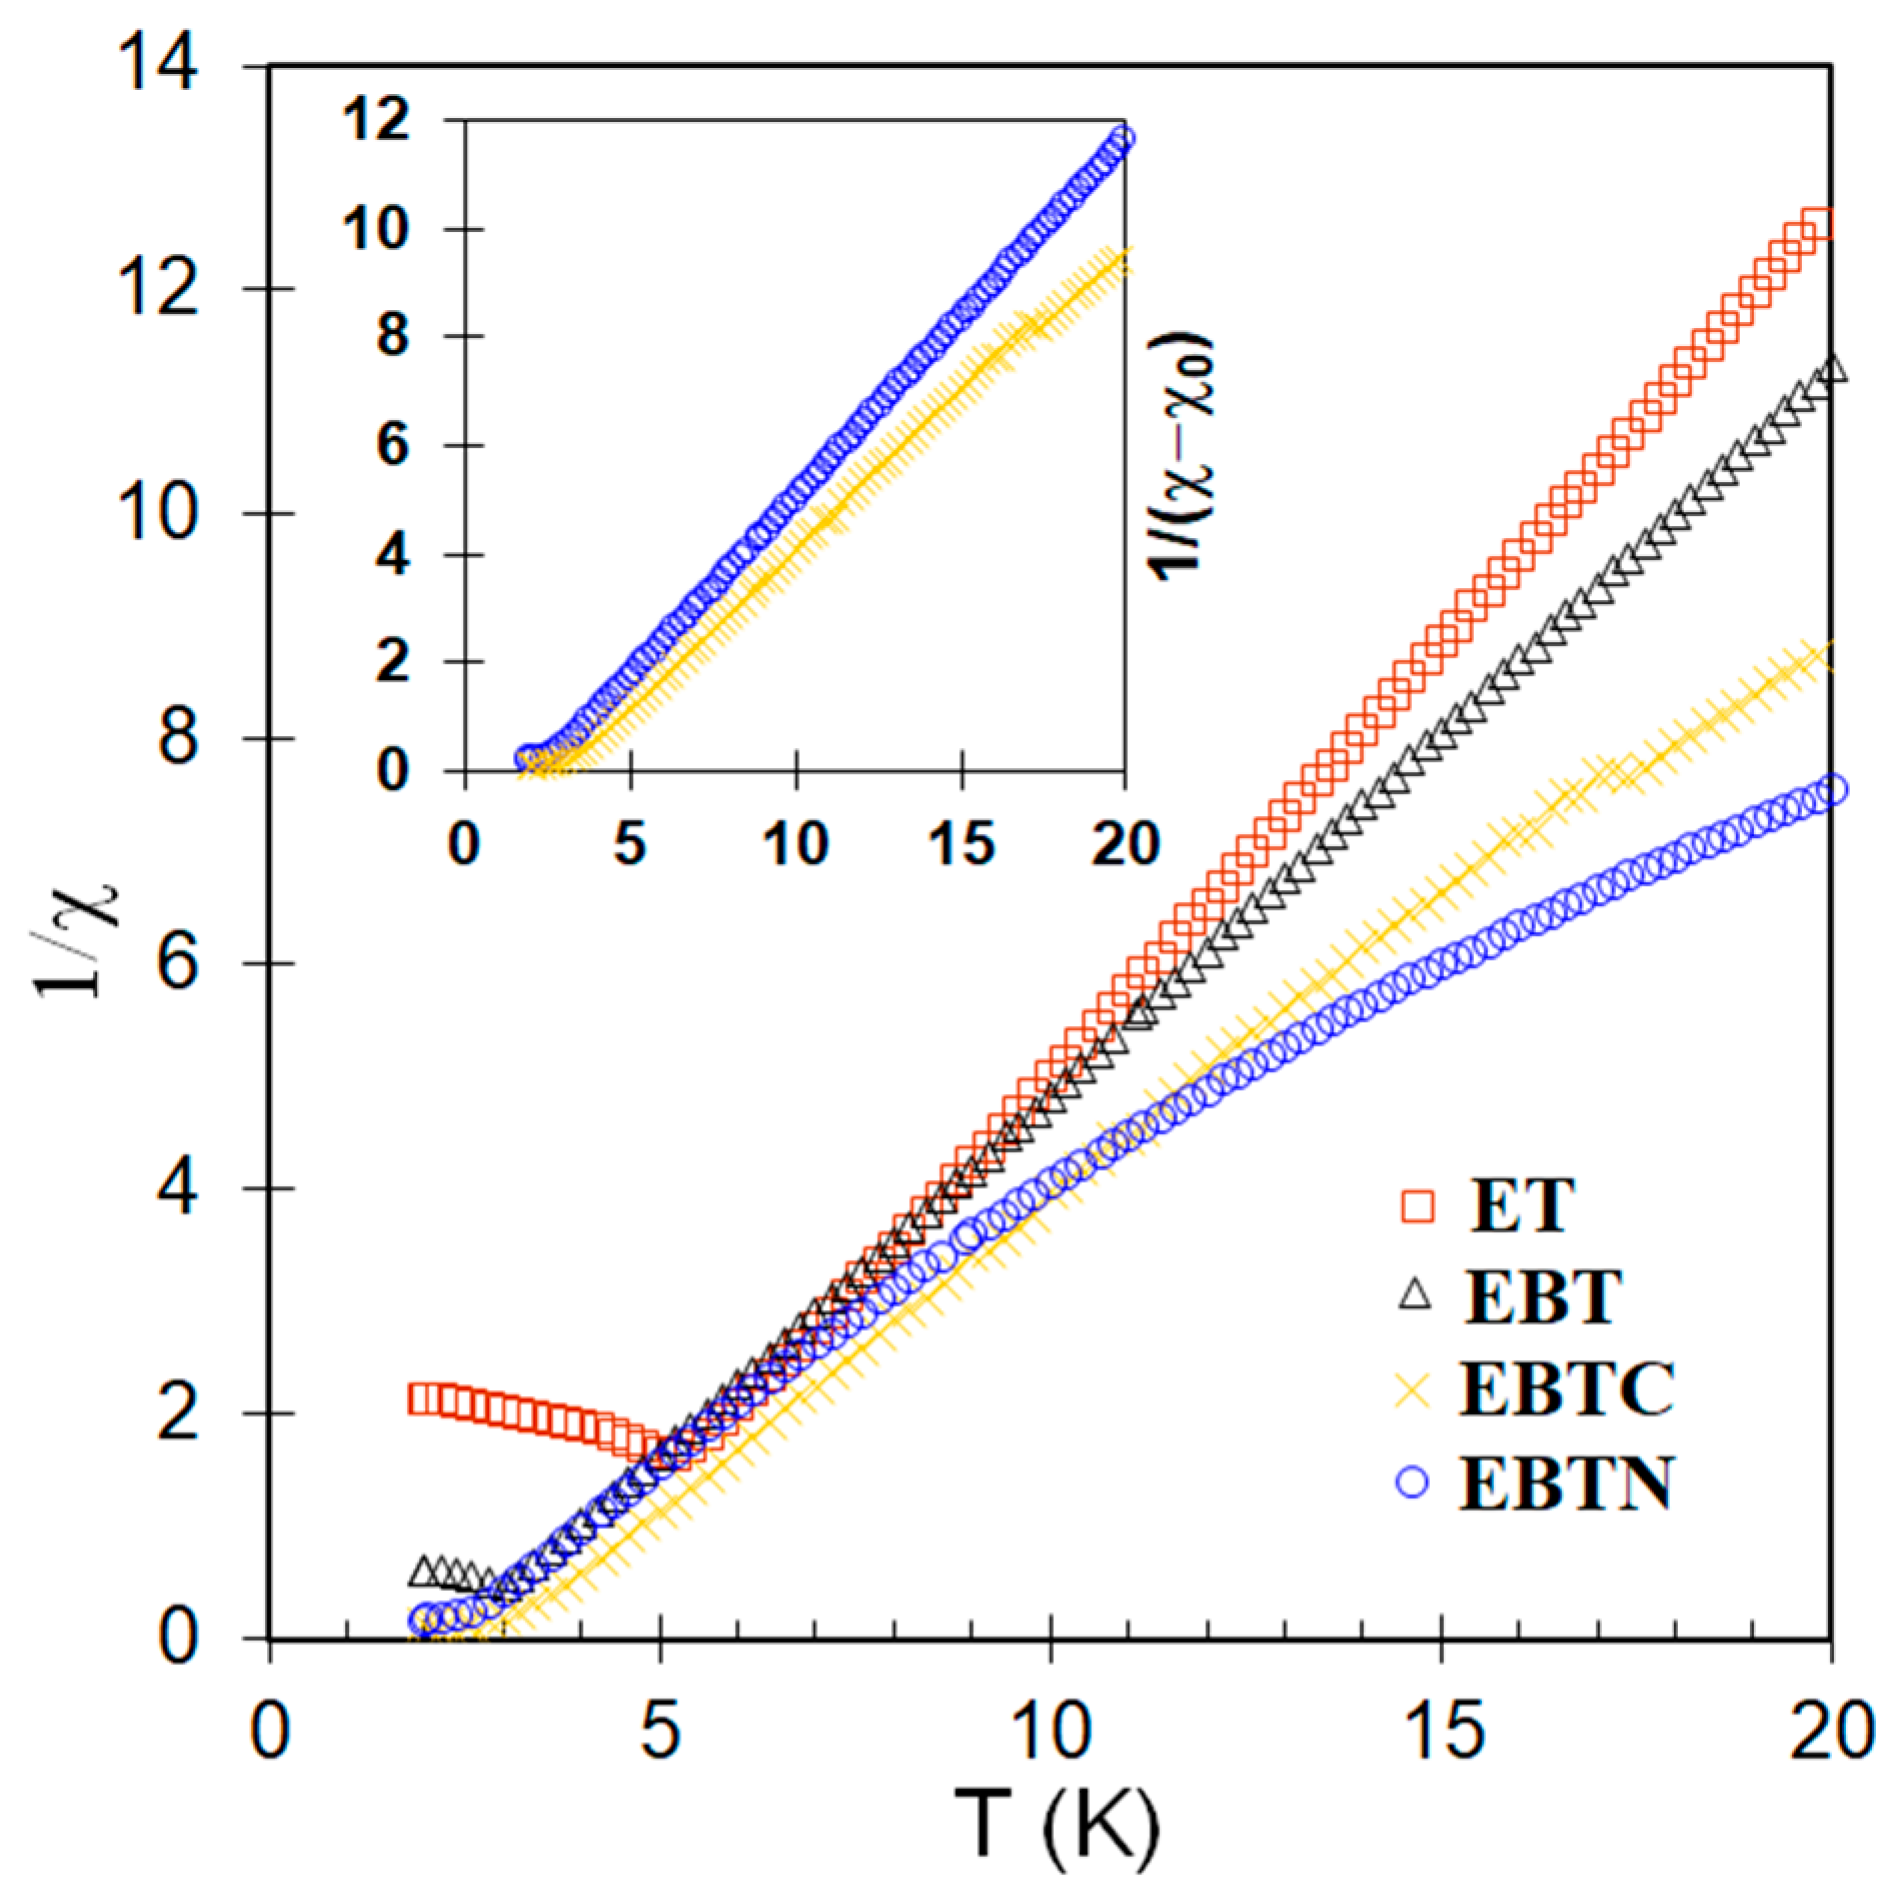
3.3. Magnetic Properties

Figure 7 shows temperature-dependent magnetization, M(T), of Eu1−xBaxTi1−yMyO3 measured under a small applied field of 100 Oe. There was little difference between the M(T) curves measured after zero field cooling (ZFC) and field cooling (FC) for all the samples, indicating no complication from field-induced effects. The M(T) curve of EuTiO3 was characterized by a cusp at 5.2 K, which is typical of an antiferromagnet. Eu0.7Ba0.3TiO3 displayed a similar M(T), but the cusp occurred at a lower temperature (i.e., 3.1 K). In contrast, the M(T) curves of Co/Ni co-doped samples showed a different character, i.e., M(T) started to increase rapidly at the temperature of ~4 K and then saturated at T < 2.5 K (there is an inflection point between 2–4 K), which is the behavior of a ferromagnet. The results suggest that although the substitution of Eu2+ by Ba2+ only resulted in a reduction in TN, agreeing with the previous reports [14,41], the Co2+/Ni2+ co-doping at Ti4+-site turned the co-doped samples into ferromagnets, with the Curie temperatures (TC) being 2.98 K and 2.72 K, respectively, which were taken at the peak of first derivative of M(T), i.e., the inflection point, as shown in the insets of Figure 7c,d.
Figure 8 shows the graphs of inverse magnetic susceptibility vs. temperature (χ−1–T), which are linear for EuTiO3 and Eu0.7Ba0.3TiO3 at T > TN, indicating that the Curie–Weiss law is followed. In contrast, there is a clear deviation from the linearity in χ−1–T at T > TC for Co2+/Ni2+ co-doped samples. However, as shown in the inset of Figure 8, it was found that the linearity could be well-restored by adding a temperature-independent term (χ0) to the Curie–Weiss law, i.e., χ = χ0 + C/(T − θ), where C is the Curie constant and θ is the paramagnetic Curie temperature. The fitted values of χ0 and θ, together with the TC calculated from –dM(T)/dT, are listed in Table 3. The origin of χ0 might arise from the trivalent Eu3+, which was known to have a large Van Vleck temperature-independent paramagnetism at low temperature (<100 K), such as in the cases of EuBO3, EuF3 and Eu2O3 [42]. Indeed, as shown in Figure 2, the Co2+/Ni2+ co-doping led to a great increase in the numbers of Eu3+. In particular, in the 10 at% Ni2+ co-doped samples, the number of Eu3+ was more than Eu2+, so these samples had a large χ0 (see Table 3) and their χ−1–T curve in Figure 8 deviated the most from the linearity. Although Figure 2 shows that Eu3+ was also present in EuTiO3 and Eu0.7Ba0.3TiO3, the numbers were probably too small to have a notable contribution.
Figure 9a shows the magnetization vs. field (M–H) curves measured at 2 K, in which the M of EuTiO3 has a linear H dependence until H ≈ 7.5 kOe and then saturates at higher H. This confirms that EuTiO3 is, indeed, an antiferromagnet. When H is applied to an antiferromagnet, M increases linearly with H as the spin arrangement changes from antiferromagnetic to the spin-flop state, and then the angle between H and the flopped spins decreases until zero at a sufficiently high H, leading to a field-induced ferromagnetic state. Figure 9a shows that Eu0.7Ba0.3TiO3 also has a portion of linear M–H, which ends at a much lower H (<2 kOe), indicating a much weaker exchange interaction among the Eu ions as a consequence of the dilution by Ba-doping. This is supported by the lower TN observed in Figure 7 for Eu0.7Ba0.3TiO3. Furthermore, it was found that the whole M–H curve of Eu0.7Ba0.3TiO3 could be fitted by the Brillouin function (see Figure 9b), confirming the weakness of the exchange interaction, because such a magnetization process is for paramagnets in which the exchange interaction is negligible. The M–H curves of either EuTiO3 or the Co/Ni co-doped samples could not be fitted by the Brillouin function due to stronger exchange interactions.
The Co/Ni co-doped samples do not display any linear portion in the M–H graph, as highlighted in the inset of Figure 9a, which also shows that their M–H curves lie above the linear part of the curve for Eu0.7Ba0.3TiO3, i.e., they have larger M under small H (<2500 Oe) due to the enhancement from ferromagnetic interaction. The M–H curves were measured at 2 K, which was only slightly lower than TC of the co-doped samples. So, their remanences were small, but nevertheless, the remanences of the Co/Ni co-doped samples were still much larger compared to EuTiO3 and Eu0.7Ba0.3TiO3, as shown in Figure 9c. To further confirm that the Co/Ni co-doping had turned the samples from antiferromagnetic to ferromagnetic, the magnetization data at 2 K was presented in the form of the Arrott plot, i.e., M2 vs. H/M [43], which is shown in Figure 9d. According to the Banerjee criterion [43,44], a magnetic phase transition is expected to have the first-order when the slope of the Arrott plot at M2 → 0 is negative, whereas it is of the second-order when the slope is positive at M2 → 0. Figure 9d shows that EuTiO3 and Eu0.7Ba0.3TiO3 have a negative slope and in contrast, the Co/Ni co-doped samples have a positive slope. The former corresponds to antiferromagnetic transition of the first-order, while the latter is consistent with the ferromagnetic transition that is well-known to be of the second-order.
The cause that turned the Co/Ni co-doped samples from antiferromagnetic to ferromagnetic is not clear. As mentioned in the introduction, doping at the Ti4+ site with lower-valence cations usually resulted in such a transition [19,20,21,22,23,25], which was correlated to the oxygen vacancies or the mixed valences of Eu2+/Eu3+ in some previous works [19,25,45]. However, as shown in Section 3.1, although oxygen vacancies were indeed present in EuTiO3 and Eu0.7Ba0.3TiO3, the Co/Ni co-doped samples did not seem to contain oxygen vacancies, because other charge compensation mechanisms than the oxygen vacancies—i.e., the increase in Eu3+ numbers with a decrease in Ti3+ numbers—were in action for the doping of Co2+/Ni2+ at the Ti4+ site. So, the oxygen vacancies can be excluded as the cause for ferromagnetism in the co-doped samples. In addition, the proposed double-exchange between the mixed valences of Eu2+/Eu3+ via Ti4+ 3d seems not to be the cause, because as shown in Figure 2, the Ni2+ co-doped samples had more Eu2+/Eu3+ pairs than the Co2+ co-doped samples, which should lead to a stronger exchange interaction in the former; however, the latter actually had a higher TC (see Table 3). Furthermore, the charge transfer along the Eu2+-Ti4+-Eu3+ route would give rise to a finite DC conductivity, which was not the case, because all the samples in this work had a high resistivity at RT (or lower temperature), as shown in Figure 5.
It is well known that EuTiO3 is a G-type antiferromagnet, in which a given Eu2+ ion has 6 nearest-neighbor (NN) Eu2+ antiparallel and 12 next-nearest-neighbor (NNN) Eu2+ parallel [11]. The exchange constant (J1) of NN interactions is determined by the competition between the antiferromagnetic superexchange via Ti4+ 3d states and an indirect ferromagnetic exchange via Eu2+ 5d states, leading to a delicate balance between the antiferromagnetic and ferromagnetic phases [46]. Density functional calculations suggest that pristine EuTiO3 has a negative J1 and an increase in its lattice parameter leads to a reduced magnitude of J1 or even a positive J1 at a large enough lattice parameter [46]. Based on the measured values of TN and θ (Table 3), J1 and J2 (NNN exchange constant) of the samples were estimated by the molecular field theory, which had the values of J1/k = −0.014 K and J2/k = 0.035 K (k: Boltzmann constant) for undoped EuTiO3, in agreement with the previous reports [47]. A greatly reduced J1 (i.e., J1/k = −0.004 K and J2/k = 0.022 K) was found for Eu0.7Ba0.3TiO3, which might be attributed to its larger lattice parameter according to the above-mentioned calculations [46]. However, the switch from the antiferromagnetic to ferromagnetic interaction in the Co2+/Ni2+ co-doped samples was not due to a further increase in the lattice parameter, because the structural characterization in Section 3.1 showed that they had a smaller lattice parameter than Eu0.7Ba0.3TiO3. A plausible explanation for such a transition may be the large asymmetric distortion of the Eu–O polyhedron introduced by the aliovalent doping of Co2+/Ni2+ at the Ti4+ site, which promotes the admixture of Eu 5d and 4f states. The odd-symmetry crystal-field term is well-known in optical spectroscopy to cause such an admixture for the rare-earth ions in solids [48]. As a result of the enhanced mixing of the Eu 5d and 4f states, ferromagnetic exchange via Eu2+ 5d states prevails over the antiferromagnetic superexchange via Ti4+ 3d states, leading to the observed ferromagnetism in the Co2+/Ni2+ co-doped samples.

4. Conclusions

Eu1−xBaxTi1−yMyO3 (x = 0–0.3, y = 0–0.1, M = Co or Ni) samples were synthesized by solid-state reaction at 1400 °C under the flow of Ar+3% H2. XRD confirmed that all the obtained samples had a pure phase. XPS analyses showed the mixed valences of Eu2+/Eu3+ and Ti4+/Ti3+ in EuTiO3 and Eu0.7Ba0.3TiO3, as well as some oxygen vacancies required to keep the charge neutrality. The co-doping of Co2+/Ni2+ in Eu0.7Ba0.3TiO3 resulted in a reduction in Ti3+ numbers but an increase in Eu3+ numbers. Such variations in the Eu2+/Eu3+ and Ti4+/Ti3+ ratios indicated that oxygen interstitials, rather than vacancies, might be present in the co-doped samples. On the other hand, Ba2+ doping led to an increase in lattice parameter due to its larger ionic size than Eu2+, whereas the Co2+/Ni2+ co-doping resulted in smaller lattice parameters because of the combined effects of ionic size and variation in the oxygen-vacancy numbers. Substitution of 30 at% Eu2+ by Ba2+ led to the appearance of ferroelectricity in Eu0.7Ba0.3TiO3, which persisted in the Co2+/Ni2+ co-doped samples until the doping level of y = 0.05 and 0.10, respectively. Eu0.7Ba0.3TiO3 remained antiferromagnetic with a reduced transition temperature of 3.1 K. The co-doping of Co2+/Ni2+ turned the samples from antiferromagnetic to ferromagnetic with a transition temperature of 2.98 K and 2.72 K, respectively. The transition could not be explained by the causes proposed in the previous works, i.e., larger lattice volume, oxygen vacancies and mixed valences of Eu2+/Eu3+. Instead, it was more likely to arise from a large asymmetric distortion of the Eu–O polyhedron introduced by the aliovalent doping, which promotes the admixture of Eu 5d and 4f states.

Author Contributions

T.-C.L.: Investigation, data curation, preparation of graphics. X.Q.: Supervision, conceptualization, writing—original draft. All authors have read and agreed to the published version of the manuscript.

Funding

This work was supported by the Ministry of Science and Technology, Taiwan, under the grant numbers: MOST 110-2221-E-006-033 and MOST 111-2221-E-006-154.

Institutional Review Board Statement

Not applicable.

Informed Consent Statement

Not applicable.

Data Availability Statement

Not applicable.

Conflicts of Interest

The authors declare no conflict of interest.

References

  1. Zhao, R.; Yang, C.; Wang, H.G.; Jiang, K.; Wu, H.; Shen, H.P.; Wang, L.; Sun, Y.; Jin, K.J.; Gao, J.; et al. Emergent multiferroism with magnetodielectric coupling in EuTiO3 created by a negative pressure control of strong spin-phonon coupling. Nat. Commun. 2022, 13, 2364. [Google Scholar] [CrossRef] [PubMed]
  2. Ryan, P.; Sterbinsky, G.; Choi, Y.; Woicik, J.; Zhu, L.; Jiang, J.; Lee, J.H.; Schlom, D.; Birol, T.; Brown, S. Multiferroic behavior in EuTiO3 films constrained by symmetry. Phys. Rev. B 2020, 101, 180409. [Google Scholar] [CrossRef]
  3. Lee, J.H.; Fang, L.; Vlahos, E.; Ke, X.; Jung, Y.W.; Kourkoutis, L.F.; Kim, J.W.; Ryan, P.J.; Heeg, T.; Roeckerath, M. A strong ferroelectric ferromagnet created by means of spin–lattice coupling. Nature 2010, 466, 954–958. [Google Scholar] [CrossRef] [PubMed]
  4. Gregori, G.; Köhler, J.; Scott, J.; Bussmann-Holder, A. Hidden magnetism in the paramagnetic phase of EuTiO3. J. Phys. Condens. Matter 2015, 27, 496003. [Google Scholar] [CrossRef] [PubMed]
  5. Guguchia, Z.; Salman, Z.; Keller, H.; Roleder, K.; Köhler, J.; Bussmann-Holder, A. Complexity in the structural and magnetic properties of almost multiferroic EuTiO3. Phys. Rev. B 2016, 94, 220406. [Google Scholar] [CrossRef]
  6. Bussmann-Holder, A.; Köhler, J.; Roleder, K.; Guguchia, Z.; Keller, H. Unexpected magnetism at high temperature and novel magneto-dielectric-elastic coupling in EuTiO3: A critical review. Thin Solid Film. 2017, 643, 3–6. [Google Scholar] [CrossRef]
  7. Katsufuji, T.; Takagi, H. Coupling between magnetism and dielectric properties in quantum paraelectric EuTiO3. Phys. Rev. B 2001, 64, 054415. [Google Scholar] [CrossRef]
  8. Repček, D.; Kadlec, C.; Kadlec, F.; Savinov, M.; Kachlík, M.; Drahokoupil, J.; Proschek, P.; Prokleška, J.; Maca, K.; Kamba, S. Seemingly anisotropic magnetodielectric effect in isotropic EuTiO3 ceramics. Phys. Rev. B 2020, 102, 144402. [Google Scholar] [CrossRef]
  9. Das, R.; Prabhu, R.; Venkataramani, N.; Prasad, S.; Li, L.; Phan, M.H.; Keppens, V.; Mandrus, D.; Srikanth, H. Giant low-field magnetocaloric effect and refrigerant capacity in reduced dimensionality EuTiO3 multiferroics. J. Alloys Compd. 2021, 850, 156819. [Google Scholar] [CrossRef]
  10. Mo, Z.J.; Sun, Q.L.; Wang, C.H.; Wu, H.Z.; Li, L.; Meng, F.B.; Tang, C.C.; Zhao, Y.; Shen, J. Effects of Sr-doping on the giant magnetocaloric effect of EuTiO3. Ceram. Int. 2017, 43, 2083–2088. [Google Scholar] [CrossRef]
  11. McGuire, T.; Shafer, M.; Joenk, R.; Alperin, H.; Pickart, S. Magnetic structure of EuTiO3. J. Appl. Phys. 1966, 37, 981–982. [Google Scholar] [CrossRef]
  12. Fennie, C.J.; Rabe, K.M. Magnetic and electric phase control in epitaxial EuTiO3 from first principles. Phys. Rev. Lett. 2006, 97, 267602. [Google Scholar] [CrossRef] [PubMed]
  13. Wei, T.; Zhou, Q.; Yang, X.; Song, Q.; Li, Z.; Qi, X.; Liu, J.M. Competition between quantum fluctuation and ferroelectric order in Eu1− xBaxTiO3. Appl. Surf. Sci. 2012, 258, 4601–4606. [Google Scholar] [CrossRef]
  14. Rushchanskii, K.; Kamba, S.; Goian, V.; Vaněk, P.; Savinov, M.; Prokleška, J.; Nuzhnyy, D.; Knížek, K.; Laufek, F.; Eckel, S. A multiferroic material to search for the permanent electric dipole moment of the electron. Nat. Mater. 2010, 9, 649–654. [Google Scholar] [CrossRef]
  15. Henderson, N.L.; Ke, X.; Schiffer, P.; Schaak, R.E. Solution precursor synthesis and magnetic properties of Eu1− xCaxTiO3. J. Solid State Chem. 2010, 183, 631–635. [Google Scholar] [CrossRef]
  16. Janes, D.; Bodnar, R.; Taylor, A. Europium barium titanate—A magnetic ferroelectric compound. J. Appl. Phys. 1978, 49, 1452–1454. [Google Scholar] [CrossRef]
  17. Hao, Z.H.; Wang, H.Y.; Zhang, Q.; Mo, Z.J. Magnetic and magnetocaloric effects of Eu0.9M0. 1TiO3 (M = Ca, Sr, Ba, La, Ce, Sm) compounds. Acta Phys. Sin. 2018, 67, 228–234. [Google Scholar]
  18. Katsufuji, T.; Tokura, Y. Transport and magnetic properties of a ferromagnetic metal: Eu1− xRxTiO3. Phys. Rev. B 1999, 60, R15021. [Google Scholar] [CrossRef]
  19. Wei, T.; Song, Q.; Zhou, Q.; Li, Z.; Qi, X.; Liu, W.; Guo, Y.; Liu, J.M. Cr-doping induced ferromagnetic behavior in antiferromagnetic EuTiO3 nanoparticles. Appl. Surf. Sci. 2011, 258, 599–603. [Google Scholar] [CrossRef]
  20. Mo, Z.; Jiang, W.; Zhao, Y.; Hao, Z.; Zheng, Z.; Zhang, W.; Li, L.; Shen, J. Low-field induced giant magnetocaloric effect in EuTi1-xNixO3 (x= 0.05, 0.1) compounds. J. Magn. Magn. Mater. 2019, 477, 258–263. [Google Scholar] [CrossRef]
  21. Mo, Z.J.; Sun, Q.L.; Han, S.; Zhao, Y.; Chen, X.; Li, L.; Liu, G.D.; Meng, F.B.; Shen, J. Effects of Mn-doping on the giant magnetocaloric effect of EuTiO3 compound. J. Magn. Magn. Mater. 2018, 456, 31–37. [Google Scholar] [CrossRef]
  22. Zhang, W.; Mo, Z.J.; Hao, Z.; Shen, J.; Luo, J.W.; Chang, R.J.; Li, L. Fe doping effect on EuTiO3: The magnetic properties and giant magnetocaloric effect. Int. J. Appl. Ceram. 2019, 16, 1606–1611. [Google Scholar] [CrossRef]
  23. Sun, Q.L.; Mo, Z.J.; Shen, J.; Li, Y.J.; Li, L.; Zhang, J.K.; Liu, G.D.; Tang, C.C.; Meng, F.B. Observation of giant magnetocaloric effect under low magnetic fields in EuTi1–xCoxO3. Chin. Phys. B 2017, 26, 117501. [Google Scholar] [CrossRef]
  24. Li, L.; Zhou, H.; Yan, J.; Mandrus, D.; Keppens, V. Research Update: Magnetic phase diagram of EuTi1− x B xO3 (B = Zr, Nb). APL Mater. 2014, 2, 110701. [Google Scholar] [CrossRef]
  25. Akahoshi, D.; Horie, H.; Sakai, S.; Saito, T. Ferromagnetic behavior in mixed valence europium (Eu2+/Eu3+) oxide EuTi1− x M x O3 (M = Al3+ and Ga3+). Appl. Phys. Lett. 2013, 103, 172407. [Google Scholar] [CrossRef]
  26. Coelho, A.A. TOPAS and TOPAS-Academic: An optimization program integrating computer algebra and crystallographic objects written in C++. J. Appl. Crystallogr. 2018, 51, 210–218. [Google Scholar] [CrossRef]
  27. Bishop, S.R.; Tuller, H.L.; Kuru, Y.; Yildiz, B. Chemical expansion of nonstoichiometric Pr0. 1Ce0. 9O2− δ: Correlation with defect equilibrium model. J. Eur. Ceram. Soc. 2011, 31, 2351–2356. [Google Scholar] [CrossRef]
  28. Marrocchelli, D.; Perry, N.H.; Bishop, S.R. Understanding chemical expansion in perovskite-structured oxides. Phys. Chem. Chem. Phys. 2015, 17, 10028–10039. [Google Scholar] [CrossRef]
  29. Zhao, R.; Li, W.; Chen, L.; Meng, Q.; Yang, J.; Wang, H.; Wang, Y.; Tang, R.; Yang, H. Conduction mechanisms of epitaxial EuTiO3 thin films. Appl. Phys. Lett. 2012, 101, 102901. [Google Scholar] [CrossRef]
  30. Fujita, K.; Wakasugi, N.; Murai, S.; Zong, Y.; Tanaka, K. High-quality antiferromagnetic EuTiO3 epitaxial thin films on SrTiO3 prepared by pulsed laser deposition and postannealing. Appl. Phys. Lett. 2009, 94, 062512. [Google Scholar] [CrossRef]
  31. Li, W.; Gu, J.; He, Q.; Zhang, K.H.; Wang, C.; Jin, K.; Wang, Y.; Acosta, M.; Wang, H.; Borisevich, A.Y. Oxygen-vacancy-mediated dielectric property in perovskite Eu0.5Ba0.5TiO3-δ epitaxial thin films. Appl. Phys. Lett. 2018, 112, 182906. [Google Scholar] [CrossRef] [Green Version]
  32. Mariscal, A.; Quesada, A.; Martin-Luengo, A.T.; García, M.A.; Bonanni, A.; Fernández, J.; Serna, R. Europium monoxide nanocrystalline thin films with high near-infrared transparency. Appl. Surf. Sci. 2018, 456, 980–984. [Google Scholar] [CrossRef]
  33. Tan, B.J.; Klabunde, K.J.; Sherwood, P.M. XPS studies of solvated metal atom dispersed (SMAD) catalysts. Evidence for layered cobalt-manganese particles on alumina and silica. J. Am. Chem. Soc. 1991, 113, 855–861. [Google Scholar] [CrossRef]
  34. Alex, C.; Sarma, S.C.; Peter, S.C.; John, N.S. Competing effect of Co3+ reducibility and oxygen-deficient defects toward high oxygen evolution activity in Co3O4 systems in alkaline medium. ACS Appl. Energy Mater. 2020, 3, 5439–5447. [Google Scholar] [CrossRef]
  35. Venezia, A.; Loxton, C. Low pressure oxidation of Ni3Al alloys at elevated temperatures as studied by X-ray photoelectron spectroscopy and Auger spectroscopy. Surf. Sci. 1988, 194, 136–148. [Google Scholar] [CrossRef]
  36. Nasir, M.; Khan, M.; Rini, E.; Agbo, S.A.; Sen, S. Exploring the role of Fe substitution on electronic, structural, and magnetic properties of La2NiMnO6 double perovskites. Appl. Phys. A 2021, 127, 208. [Google Scholar] [CrossRef]
  37. Tarditi, A.M.; Barroso, N.; Galetti, A.E.; Arrúa, L.A.; Cornaglia, L.; Abello, M.C. XPS study of the surface properties and Ni particle size determination of Ni-supported catalysts. Surf. Interface Anal. 2014, 46, 521–529. [Google Scholar] [CrossRef]
  38. Ettema, A.R.; Haas, C. An X-ray photoemission spectroscopy study of interlayer charge transfer in some misfit layer compounds. J. Condens. Matter Phys. 1993, 5, 3817. [Google Scholar] [CrossRef]
  39. Greczynski, G.; Jensen, J.; Greene, J.E.; Petrov, I.; Hultman, L. X-ray photoelectron spectroscopy analyses of the electronic structure of polycrystalline Ti1-xAlxN thin films with 0 ≤ x ≤ 0.96. Surf. Sci. Spectra 2014, 21, 35–49. [Google Scholar] [CrossRef]
  40. Ederer, C.; Harris, T.; Kováčik, R. Mechanism of ferroelectric instabilities in non-d0 perovskites: LaCrO3 versus CaMnO3. Phys. Rev. B 2011, 83, 054110. [Google Scholar] [CrossRef]
  41. Rubi, K.; Kumar, P.; Maheswar Repaka, D.; Chen, R.; Wang, J.S.; Mahendiran, R. Giant magnetocaloric effect in magnetoelectric Eu1-xBaxTiO3. Appl. Phys. Lett. 2014, 104, 032407. [Google Scholar] [CrossRef] [Green Version]
  42. Takikawa, Y.; Ebisu, S.; Nagata, S. Van Vleck paramagnetism of the trivalent Eu ions. J. Phys. Chem. Solids 2010, 71, 1592–1598. [Google Scholar] [CrossRef]
  43. Bustingorry, S.; Pomiro, F.; Aurelio, G.; Curiale, J. Second-order magnetic critical points at finite magnetic fields: Revisiting Arrott plots. Phys. Rev. B 2016, 93, 224429. [Google Scholar] [CrossRef]
  44. Banerjee, S.K. On a generalised approach to first and second order magnetic transitions. Phys. Lett. 1964, 12, 16–17. [Google Scholar] [CrossRef]
  45. Mo, Z.J.; Hao, Z.H.; Shen, J.; Li, L.; Wu, J.F.; Hu, F.X.; Sun, J.R.; Shen, B.G. Observation of giant magnetocaloric effect in EuTi1-xCrxO3. J. Alloy. Compd. 2015, 649, 674–678. [Google Scholar] [CrossRef]
  46. Akamatsu, H.; Kumagai, Y.; Oba, F.; Fujita, K.; Murakami, H.; Tanaka, K.; Tanaka, I. Antiferromagnetic superexchange via 3 d states of titanium in EuTiO3 as seen from hybrid Hartree-Fock density functional calculations. Phys. Rev. B 2011, 83, 214421. [Google Scholar] [CrossRef]
  47. Chien, C.L.; DeBenedetti, S.; Barros, F.D.S. Magnetic properties of EuTiO3, Eu2TiO4, and Eu3Ti2O7. Phys. Rev. B 1974, 10, 3913. [Google Scholar] [CrossRef]
  48. Kornienko, A.A.; Dunina, E.B.; Fomicheva, L.A. Determination of odd-symmetry crystal-field parameters from optical spectra. Opt. Spectrosc. 2014, 116, 683–690. [Google Scholar] [CrossRef]
Figure 1. XRD patterns and TOPAS fittings: (a) EuTiO3, (b) Eu0.7Ba0.3TiO3, (c) Eu0.7Ba0.3Ti0.90Co0.10O3 and (d) Eu0.7Ba0.3Ti0.90Ni0.10O3.
Materials 15 06652 g001
Figure 2. Eu 3d5/2 XPS spectra: (a) EuTiO3, (b) Eu0.7Ba0.3TiO3, (c) Eu0.7Ba0.3Ti0.95Co0.05O3 and (d) Eu0.7Ba0.3Ti0.90Ni0.10O3. SU: shake-up peak (often seen with paramagnetic ions including Eu2+ [32]).
Materials 15 06652 g002
Figure 3. Ti 2p3/2 XPS spectra: (a) EuTiO3, (b) Eu0.7Ba0.3TiO3, (c) Eu0.7Ba0.3Ti0.95Co0.05O3 and (d) Eu0.7Ba0.3Ti0.90Ni0.10O3.
Materials 15 06652 g003
Figure 4. (a) Co 2p1/2 XPS spectrum and (b) Ni 3p XPS spectrum (note: Ti 3s peaks also located in this BE range, see discussion in text).
Materials 15 06652 g004
Figure 5. DC resistivity vs. temperature, ET: EuTiO3, EBT: Eu0.7Ba0.3TiO3, EBTC: Eu0.7Ba0.3Ti0.95Co0.05O3, EBTN: Eu0.7Ba0.3Ti0.90Ni0.10O3.
Materials 15 06652 g005
Figure 6. P–E hysteresis loops measured at 77 K with frequency of 1 kHz: (a) Eu1xBaxTiO3 (x = 0–0.3), (b) Eu0.7Ba0.3Ti1yCoyO3 (y = 0, 0.5 and 0.1) and (c) Eu0.7Ba0.3Ti1yNiyO3 (y = 0, 0.5 and 0.1).
Materials 15 06652 g006
Figure 7. M(T) measured under H = 100 Oe after ZFC and FC: (a) EuTiO3, (b) Eu0.7Ba0.3TiO3, (c) Eu0.7Ba0.3Ti0.95Co0.05O3 and (d) Eu0.7Ba0.3Ti0.90Ni0.10O3. Inset in (c,d) is minus the first derivative of M(T).
Materials 15 06652 g007
Figure 8. 1/χ vs. T graphs. ET: EuTiO3, EBT: Eu0.7Ba0.3TiO3, EBTC: Eu0.7Ba0.3Ti0.95Co0.05O3, EBTN: Eu0.7Ba0.3Ti0.90Ni0.10O3. Inset: 1/(χ–χ0) vs. T for EBTC and EBTN.
Materials 15 06652 g008
Figure 9. (a) M−H measured at 2 K. ET: EuTiO3, EBT: Eu0.7Ba0.3TiO3, EBTC: Eu0.7Ba0.3Ti0.95Co0.05O3, EBTN: Eu0.7Ba0.3Ti0.90Ni0.10O3. Inset: magnified part at H ≤ 2.5 kOe. (b) Brillouin function fitting for EBT’s M−H: red line is the fitting, and green triangles are the experiment points. (c) Magnified part of M−H loops around the origin, showing the larger remanences of EBTC and EBTN. (d) Arrott plots (M2 vs. H/M), note: the graph for ET is multiplied by a factor of 0.4 in order to plot in a same scale.
Materials 15 06652 g009
Table 1. Refined lattice parameters of Eu1−xBaxTi1−yMyO3 (M = Co/Ni).
Samplea (Å)Rwp (%)Rp (%)GOF
EuTiO33.8976(3)3.823.001.19
Eu0.7Ba0.3TiO33.9340(2)5.003.951.21
Eu0.7Ba0.3Ti1−xCoxO3x = 0.053.93105(3)4.895.151.93
x = 0.13.93325(18)5.214.061.54
Eu0.7Ba0.3Ti1−xNixO3x = 0.053.92930(6)5.514.261.11
x = 0.13.93075(4)5.284.161.27
Table 2. Pr and Ec of Eu1−xBaxTi1−yMyO3 (M = Co/Ni).
SamplePr (μC/cm2)EC (kV/cm)
Eu1−xBaxTiO3x = 00.1114.77
x = 0.10.1332.25
x = 0.20.1581.53
x = 0.251.511.19
x = 0.32.011.21
Eu0.7Ba0.3Ti1−yCoyO3y = 0.050.4082.85
y = 0.10.05281.94
Eu0.7Ba0.3Ti1−yNiyO3y = 0.051.072.27
y = 0.10.4150.957
Table 3. χ0, θ, TC and TN of Eu1−xBaxTi1−yMyO3 (M = Co/Ni).
Sampleχ0θ (K)TC (K)TN (K)
EuTiO303.50--5.20
Eu0.7Ba0.3TiO302.55--3.05
Eu0.7Ba0.3Ti0.95Co0.05O38.52 × 10−33.032.98--
Eu0.7Ba0.3Ti0.90Ni0.10O34.62 × 10−22.482.72--
Publisher’s Note: MDPI stays neutral with regard to jurisdictional claims in published maps and institutional affiliations.

