
The Influence of Layer Thickness on the Microstructure and Mechanical Properties of M300 Maraging Steel Additively Manufactured by LENS® Technology


Abstract
:1. Introduction
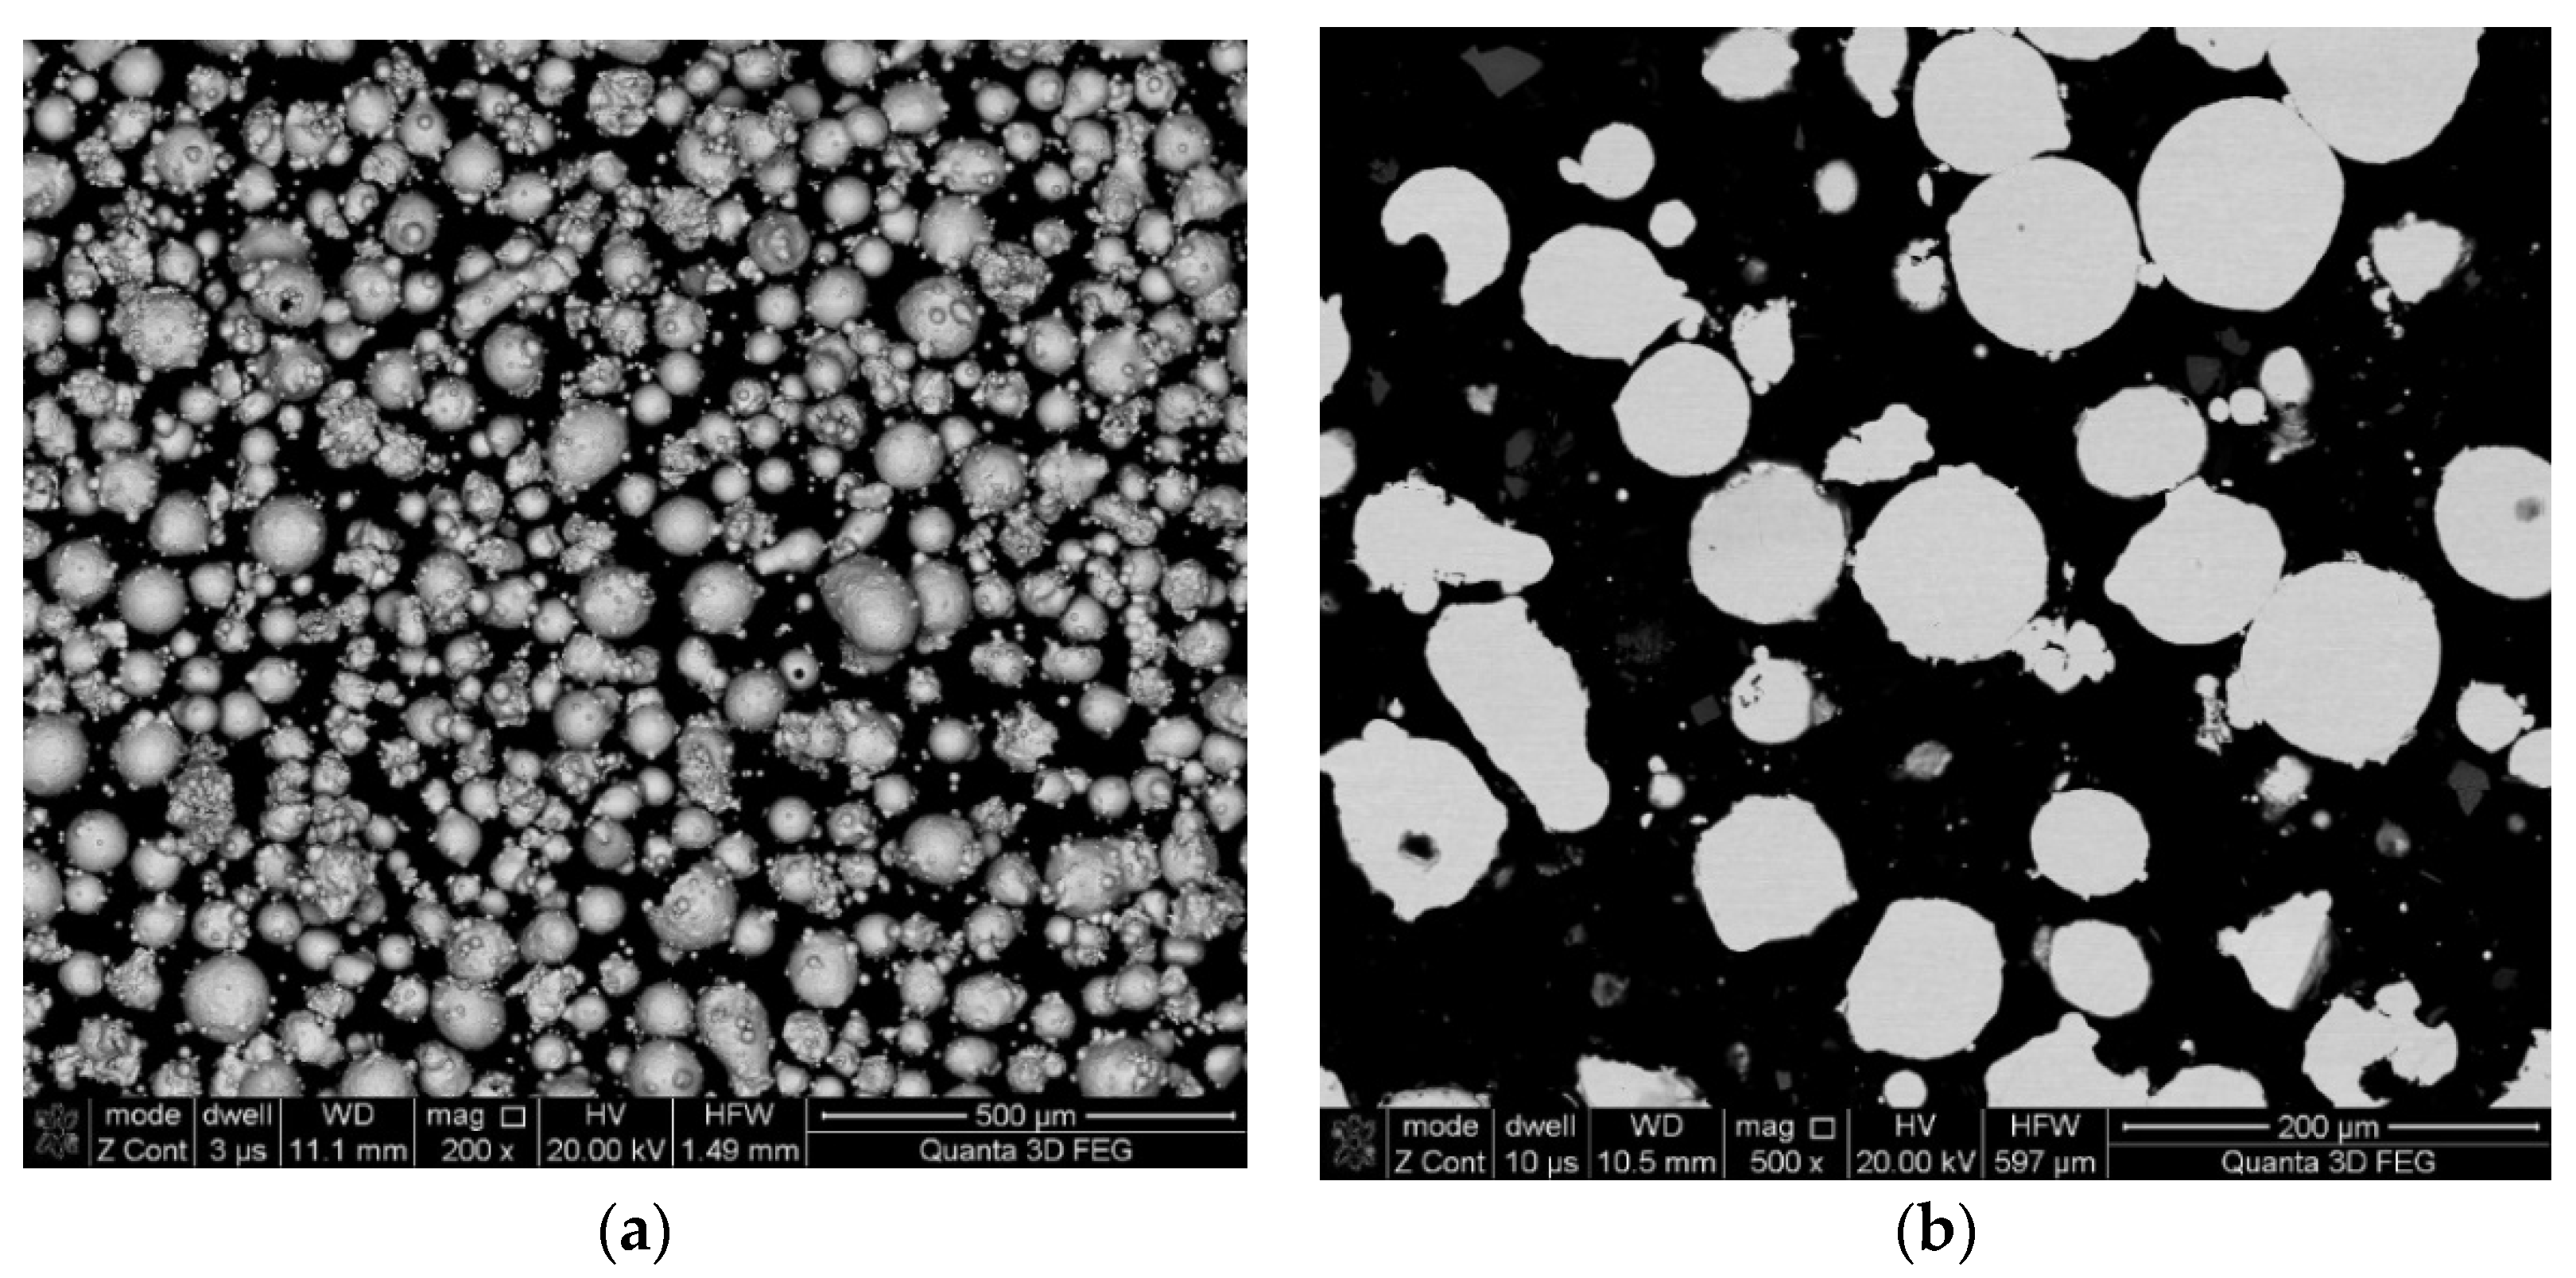
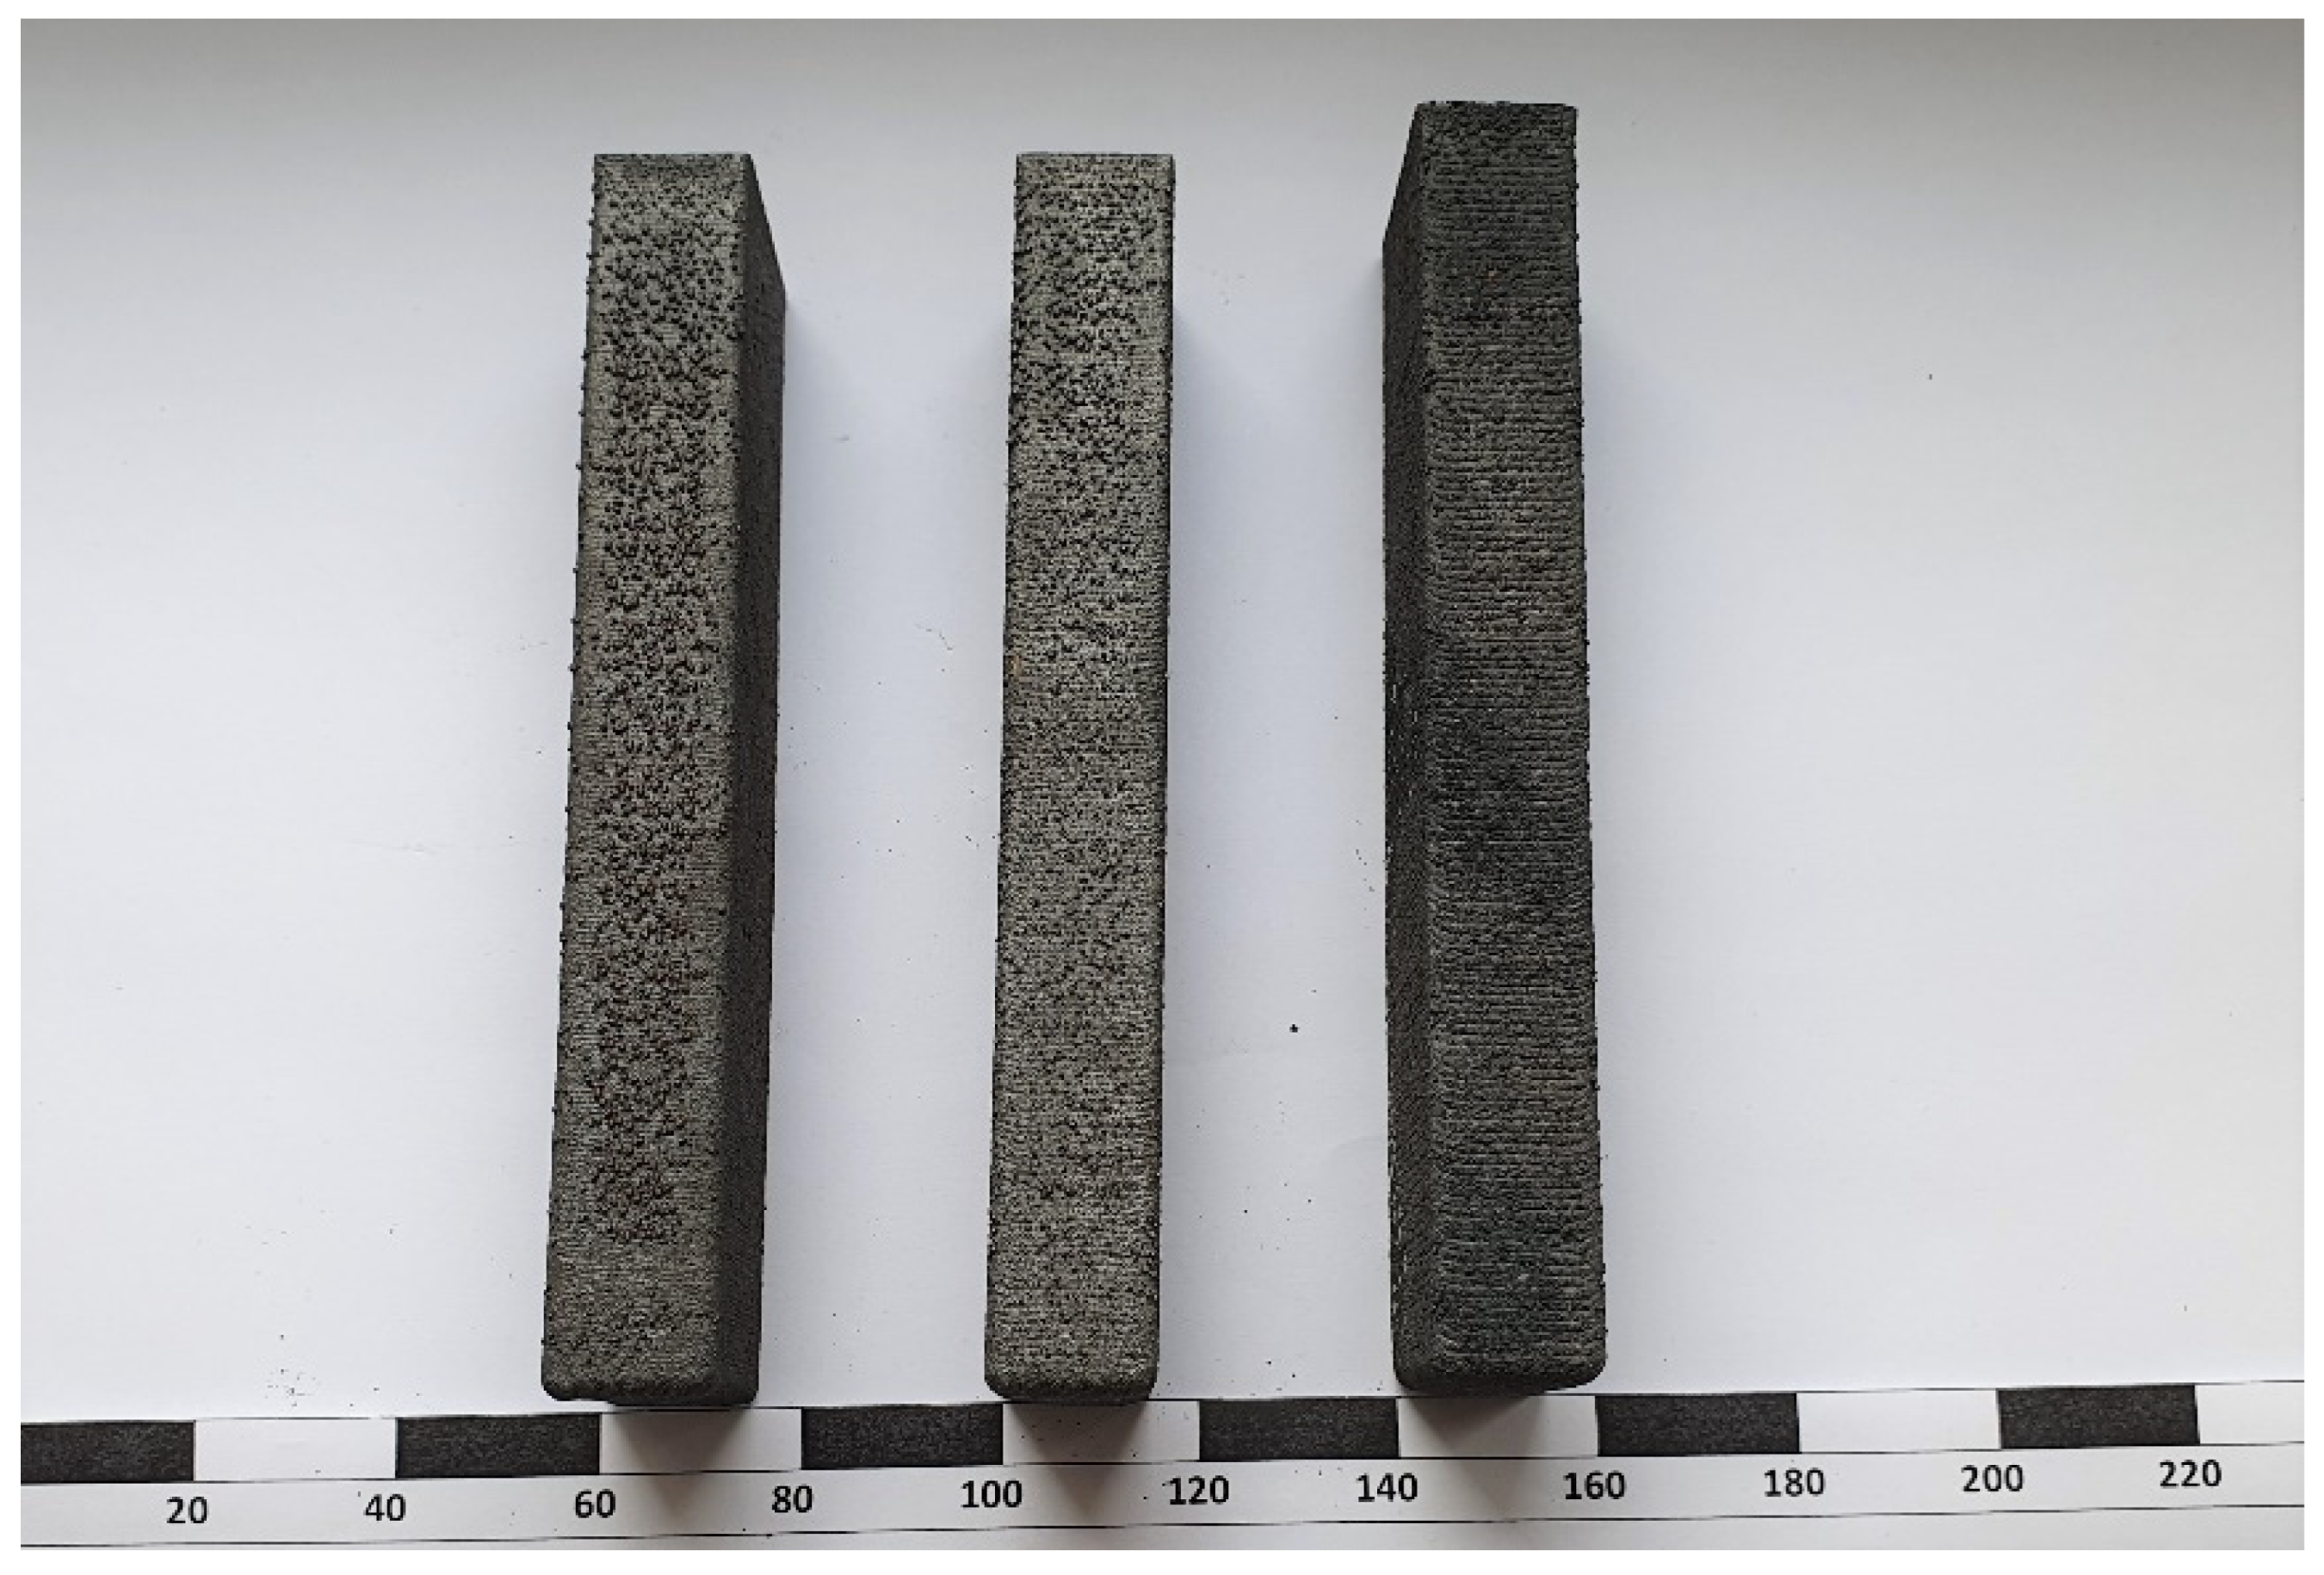
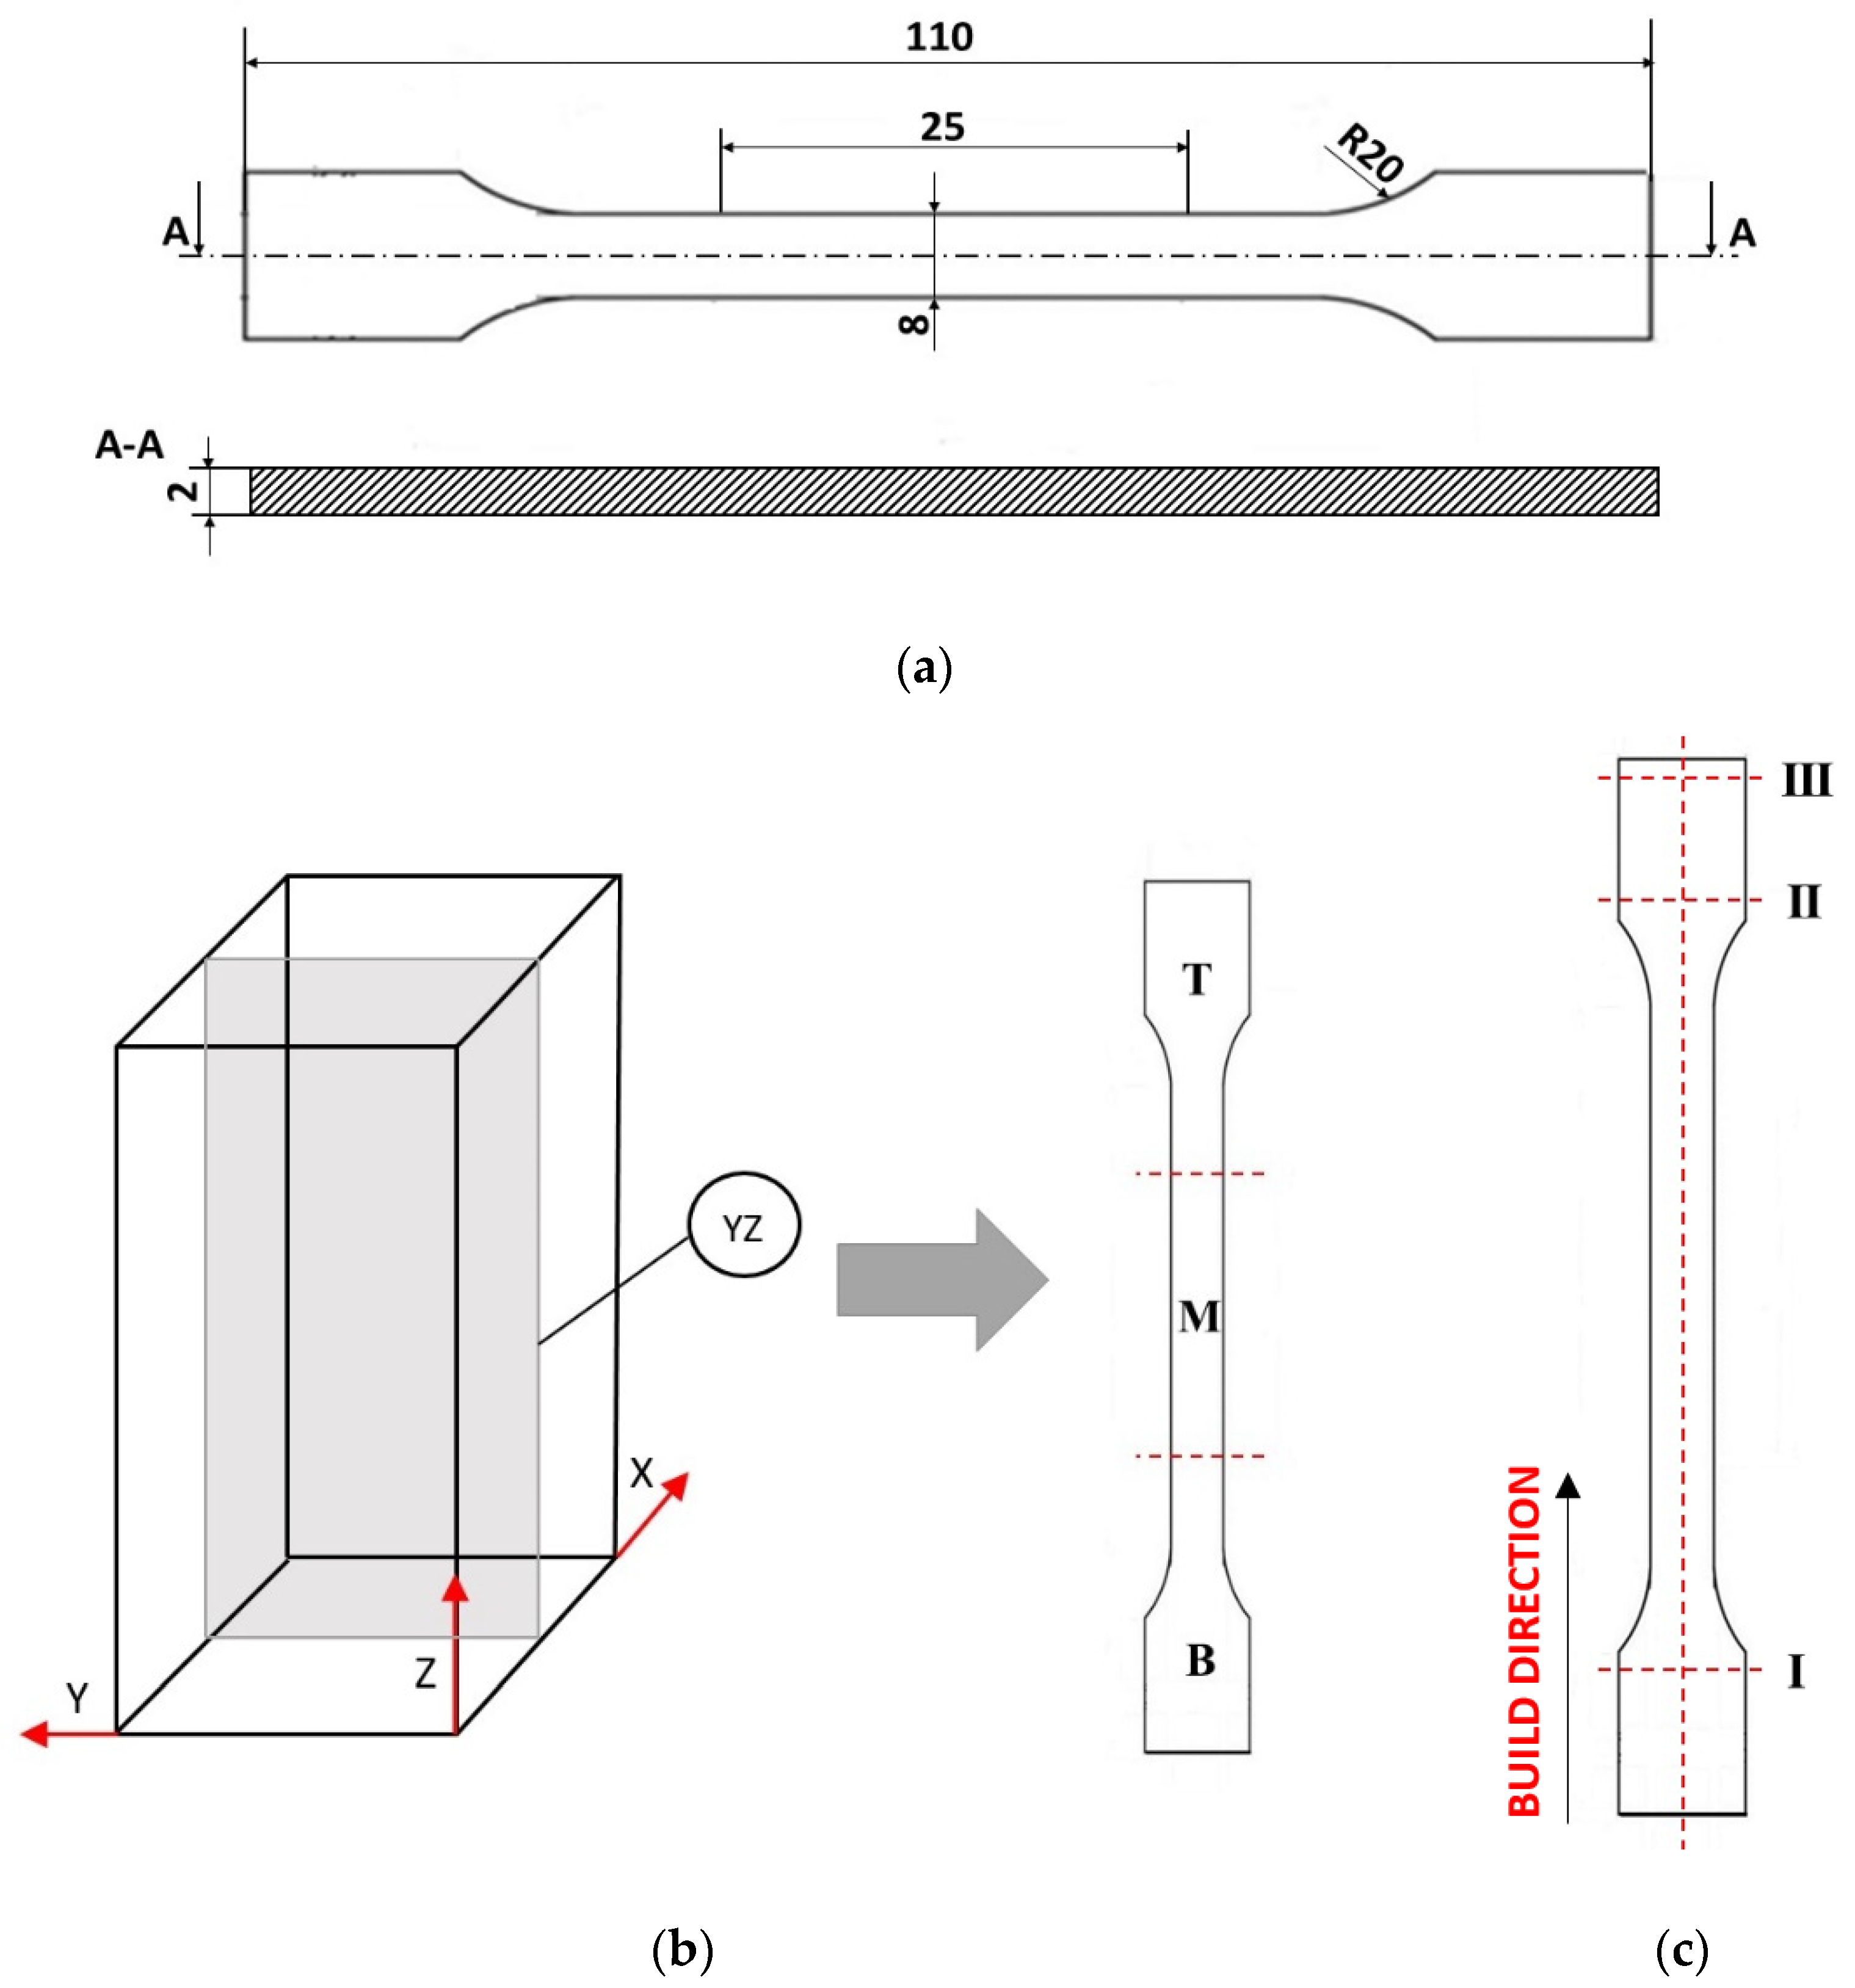
2. Materials and Methods
3. Results and Discussion
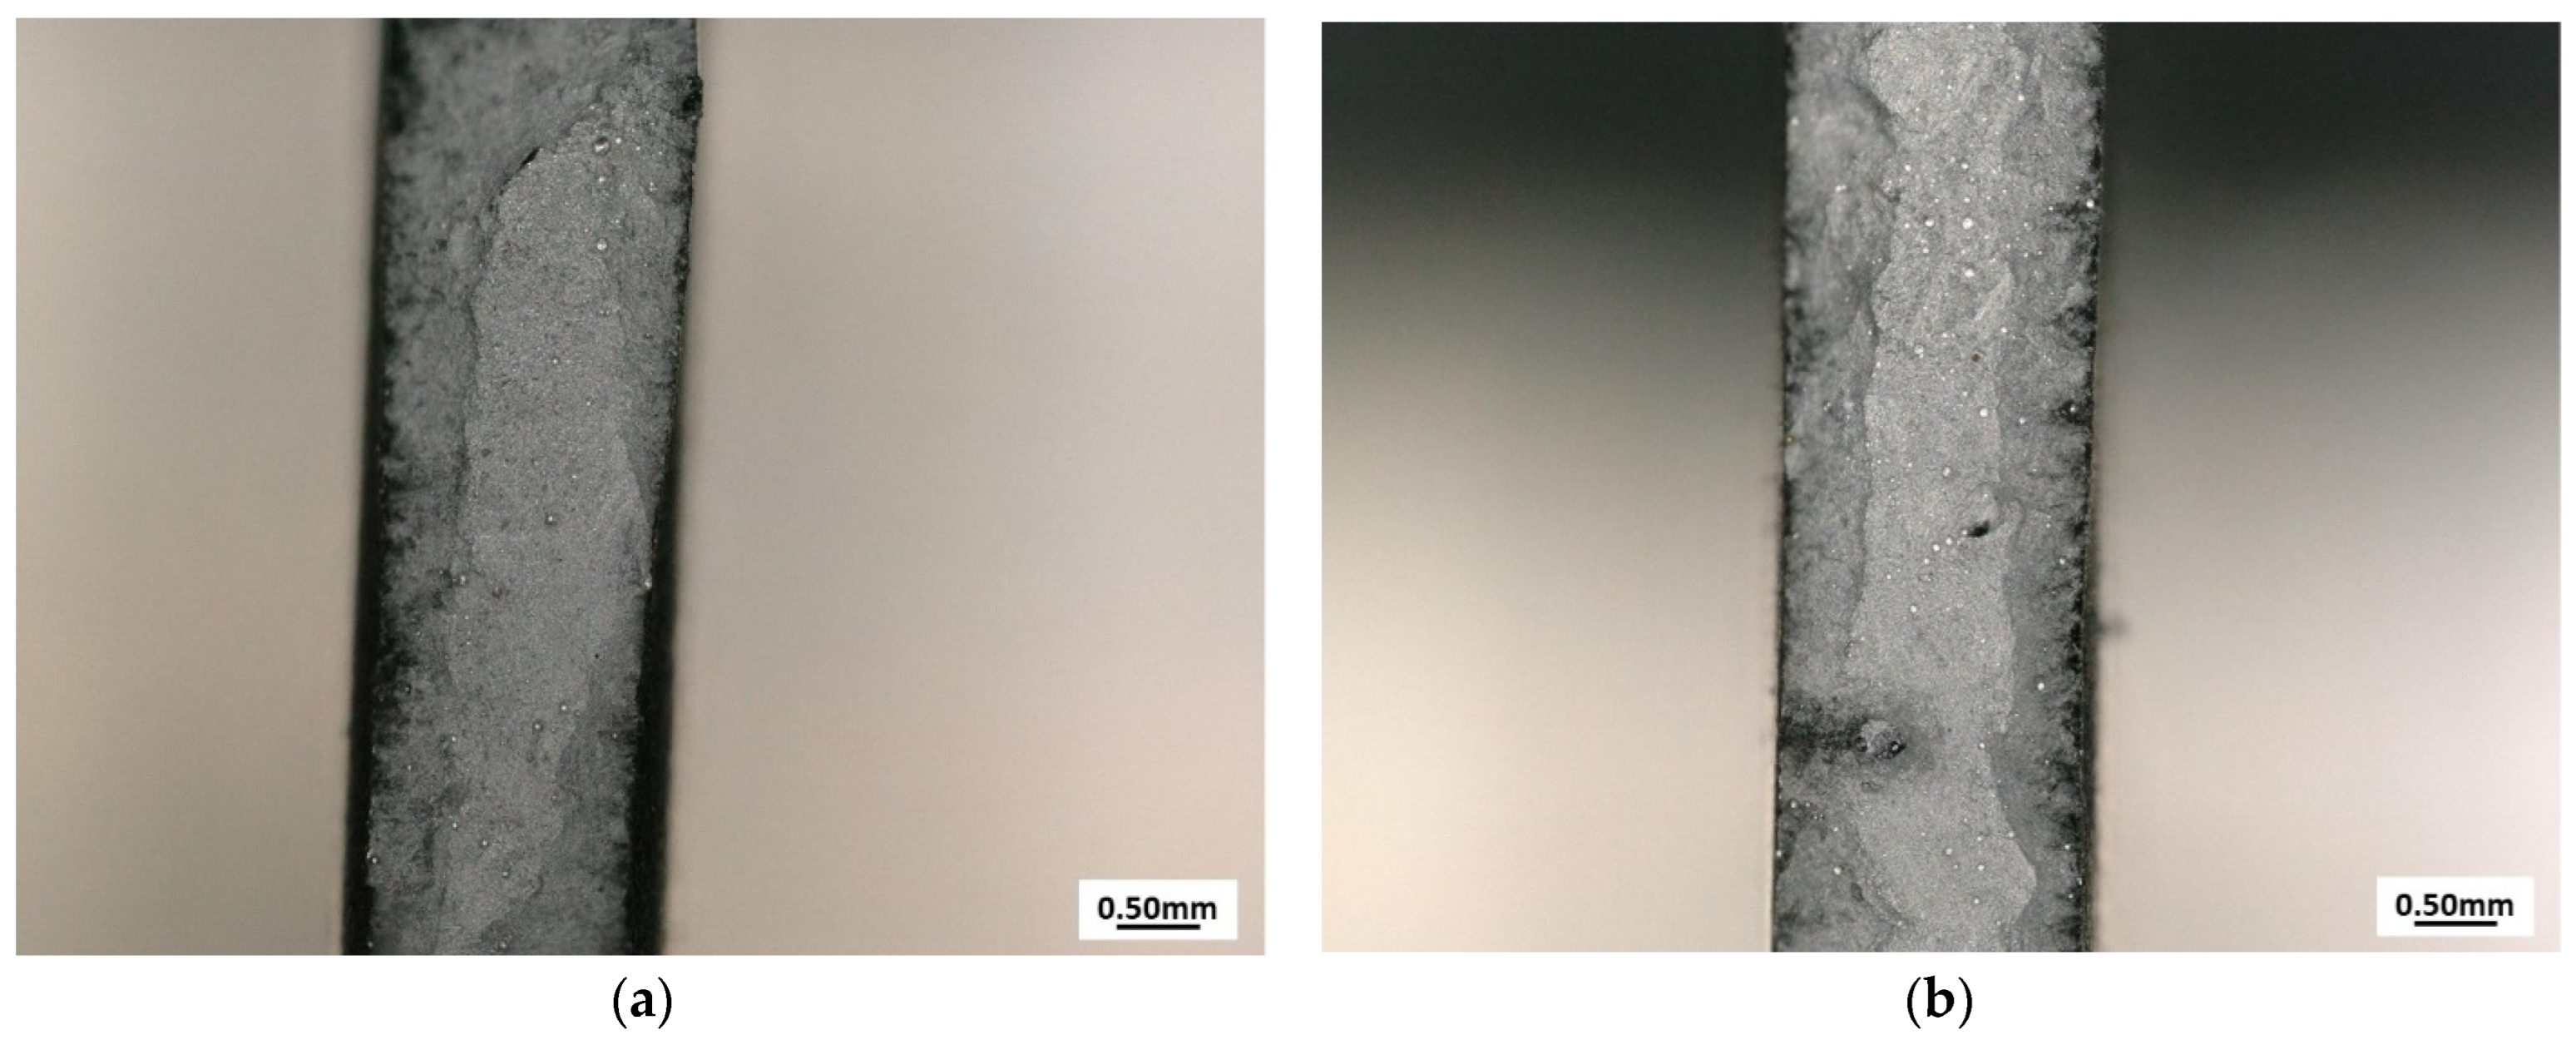
3.1. Porosity
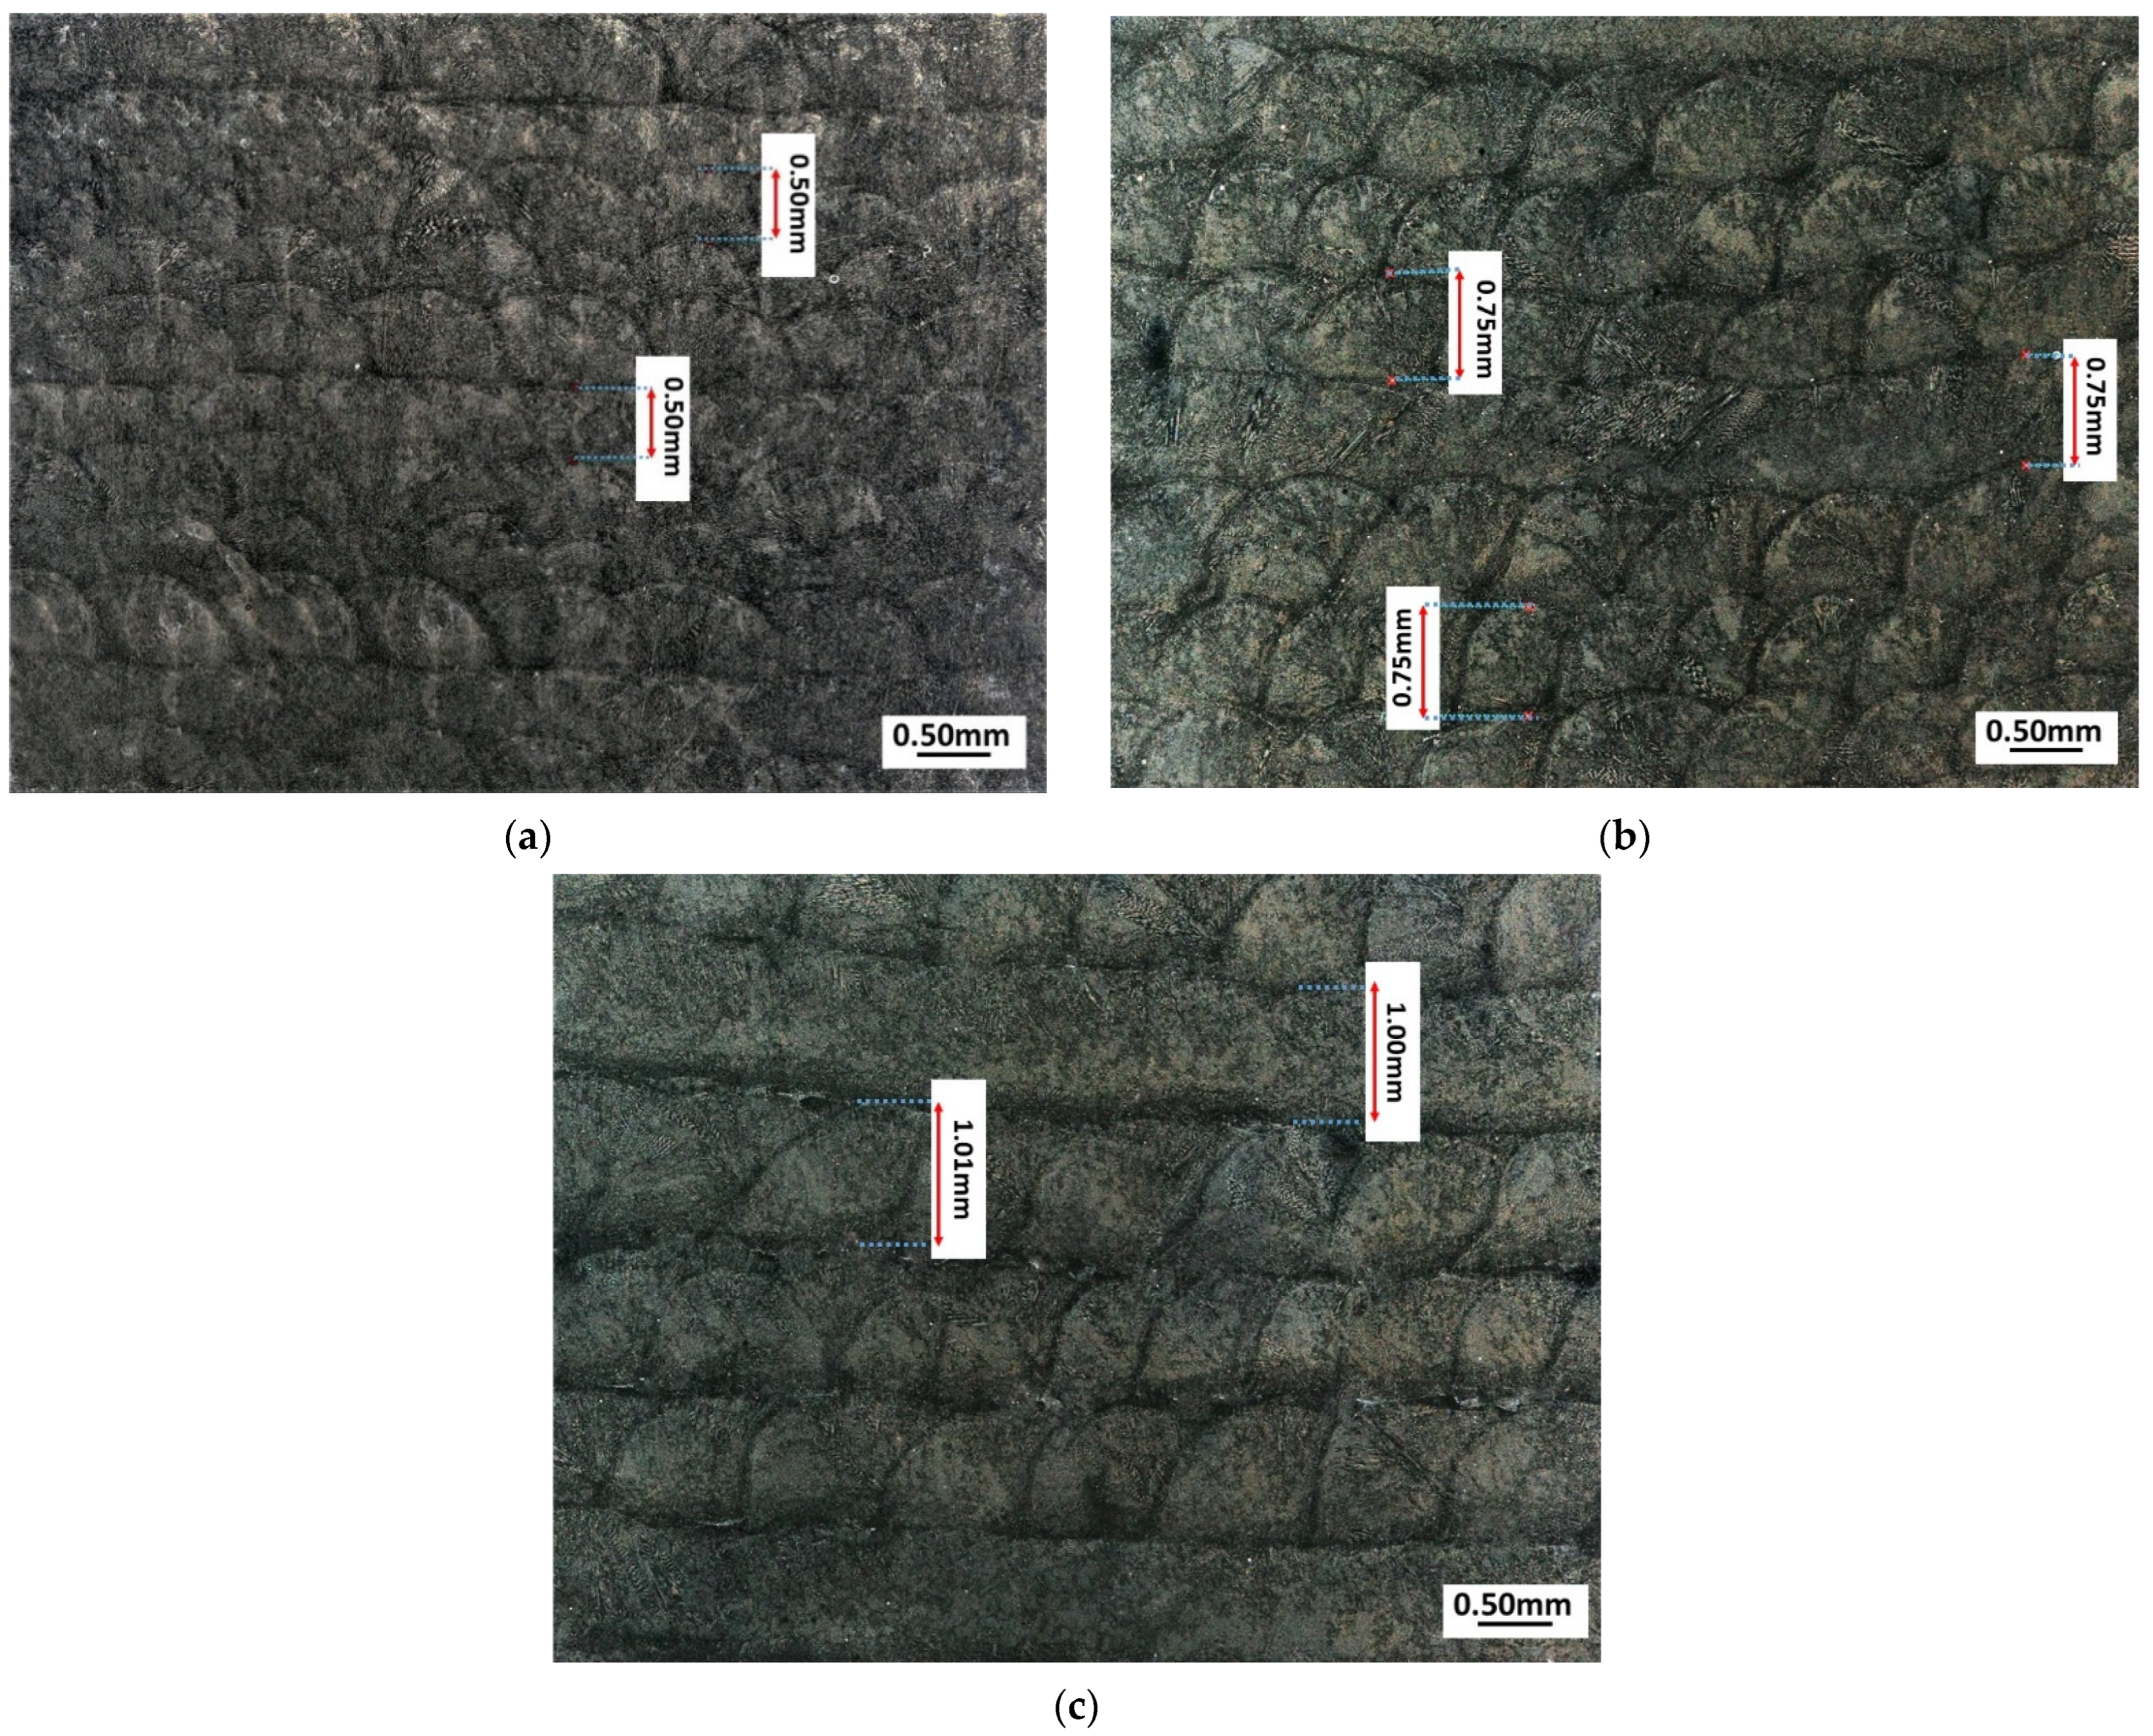
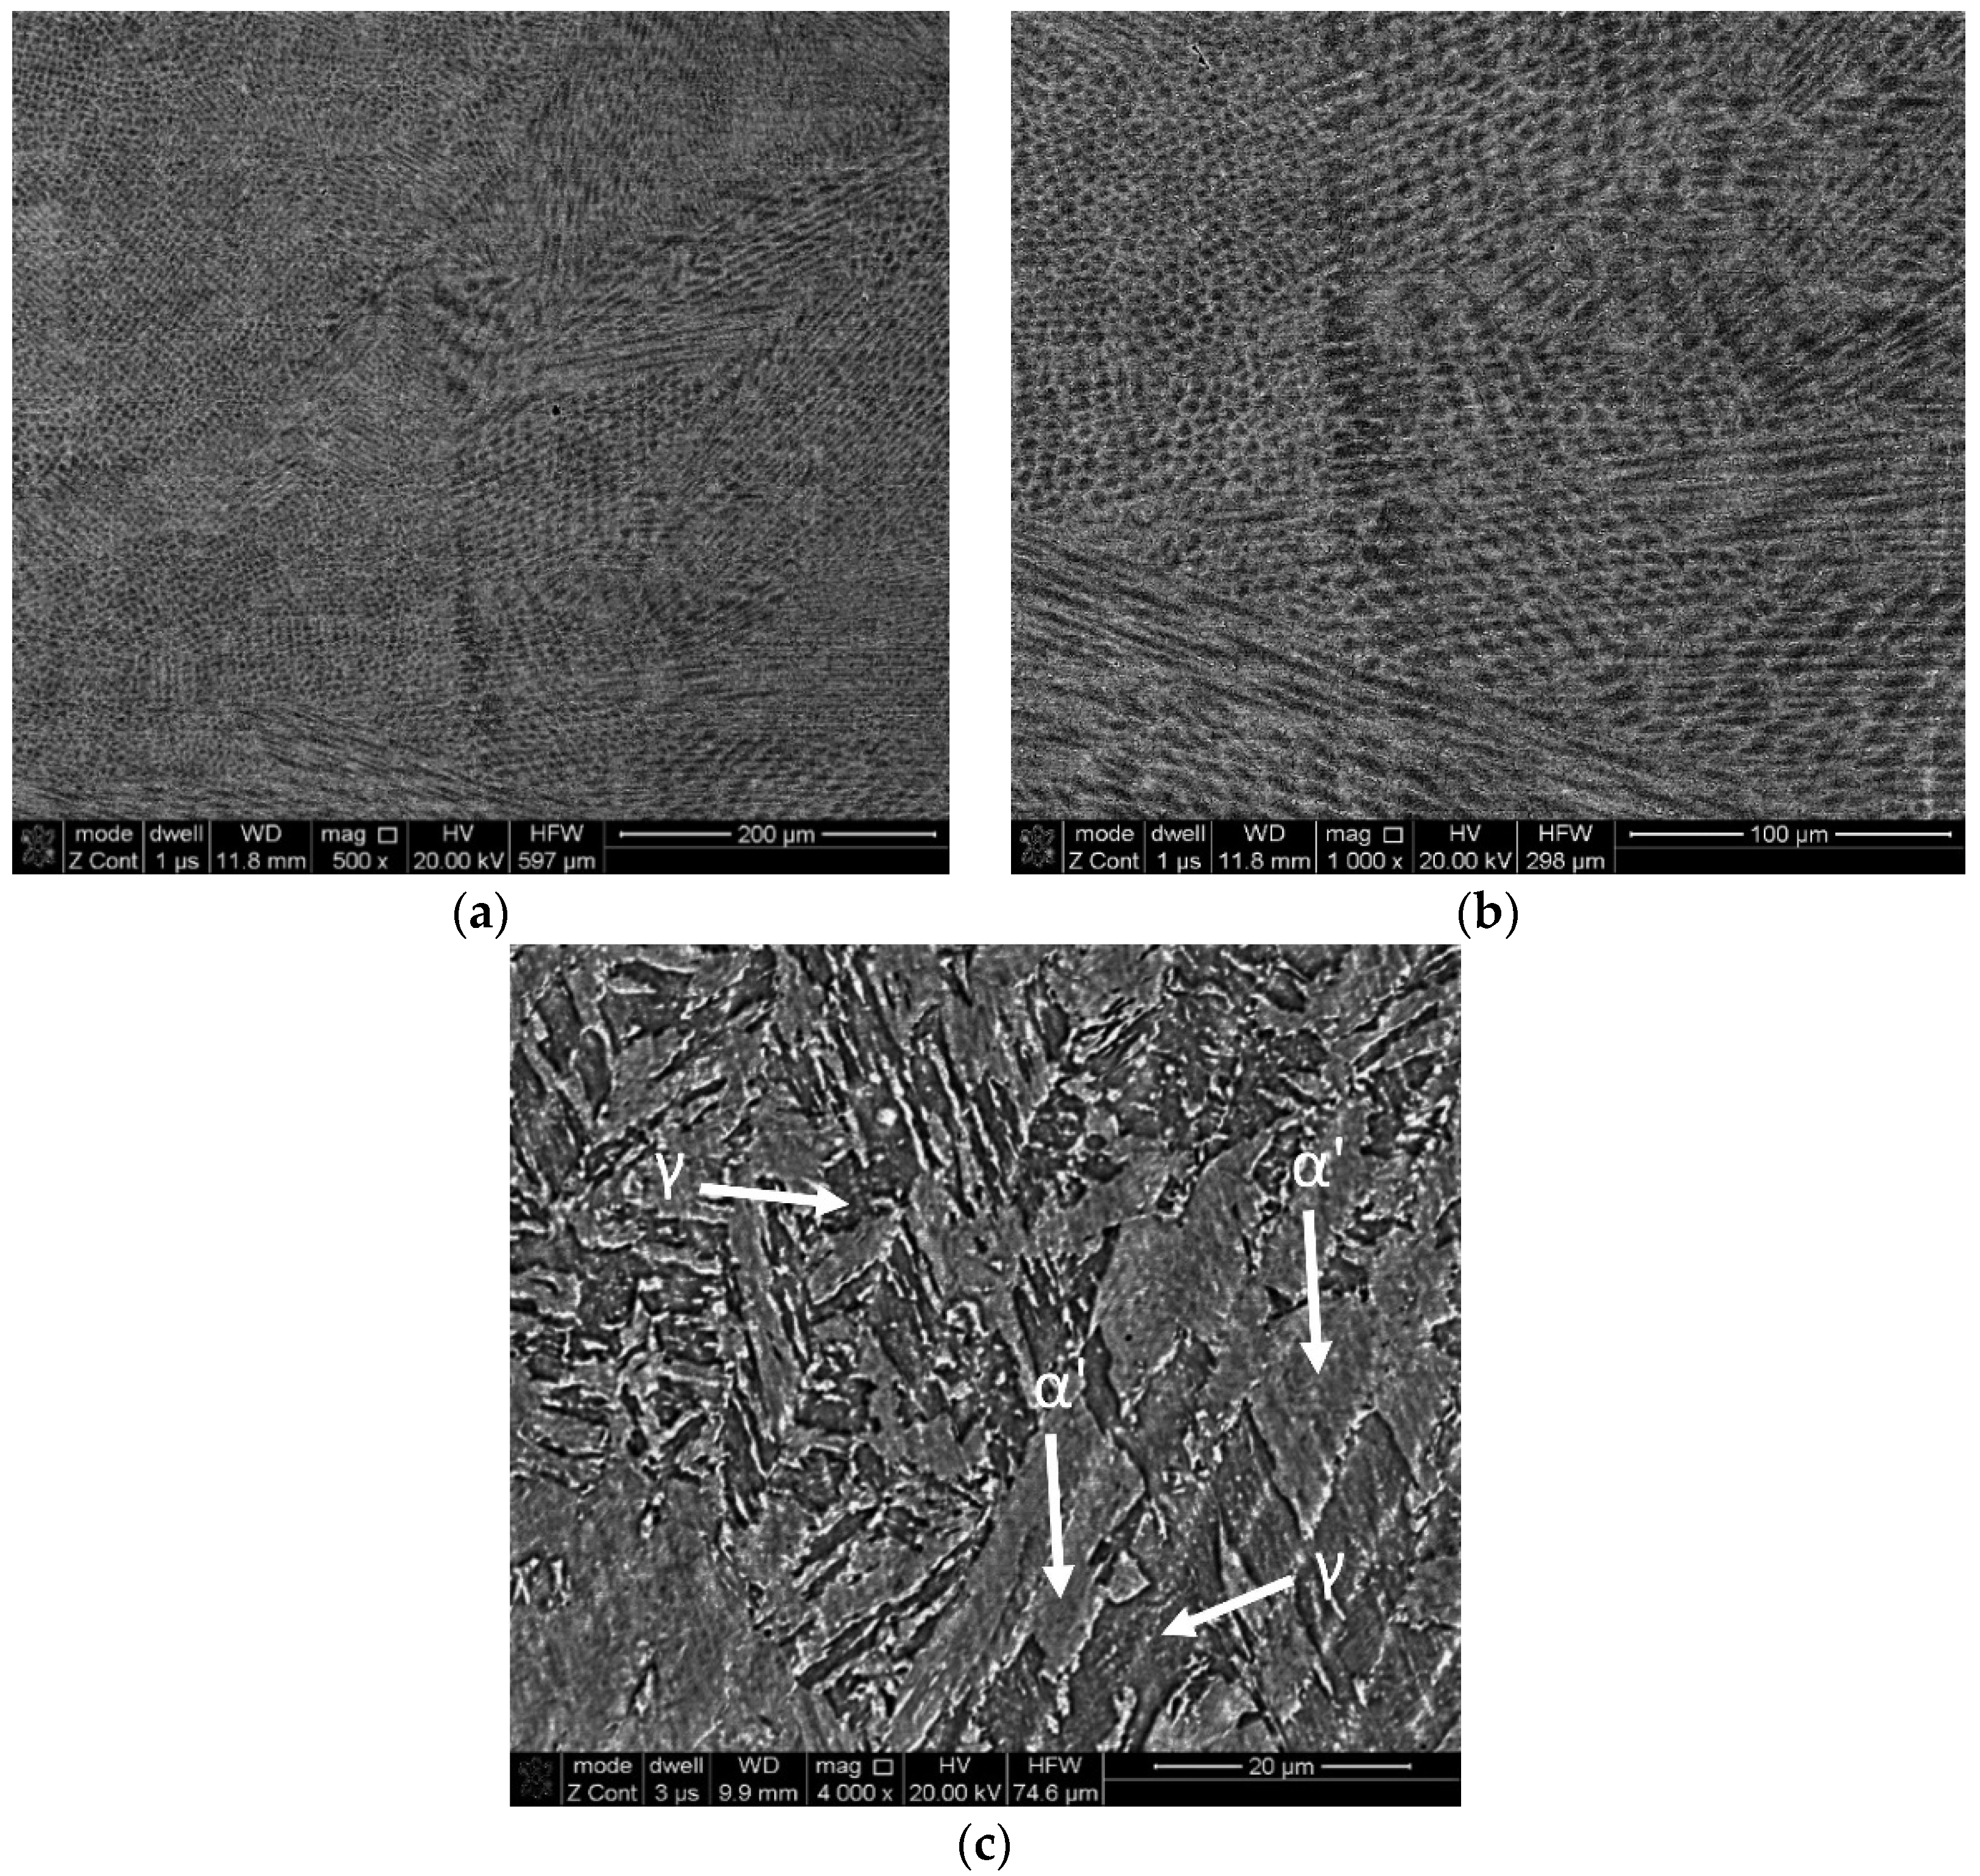
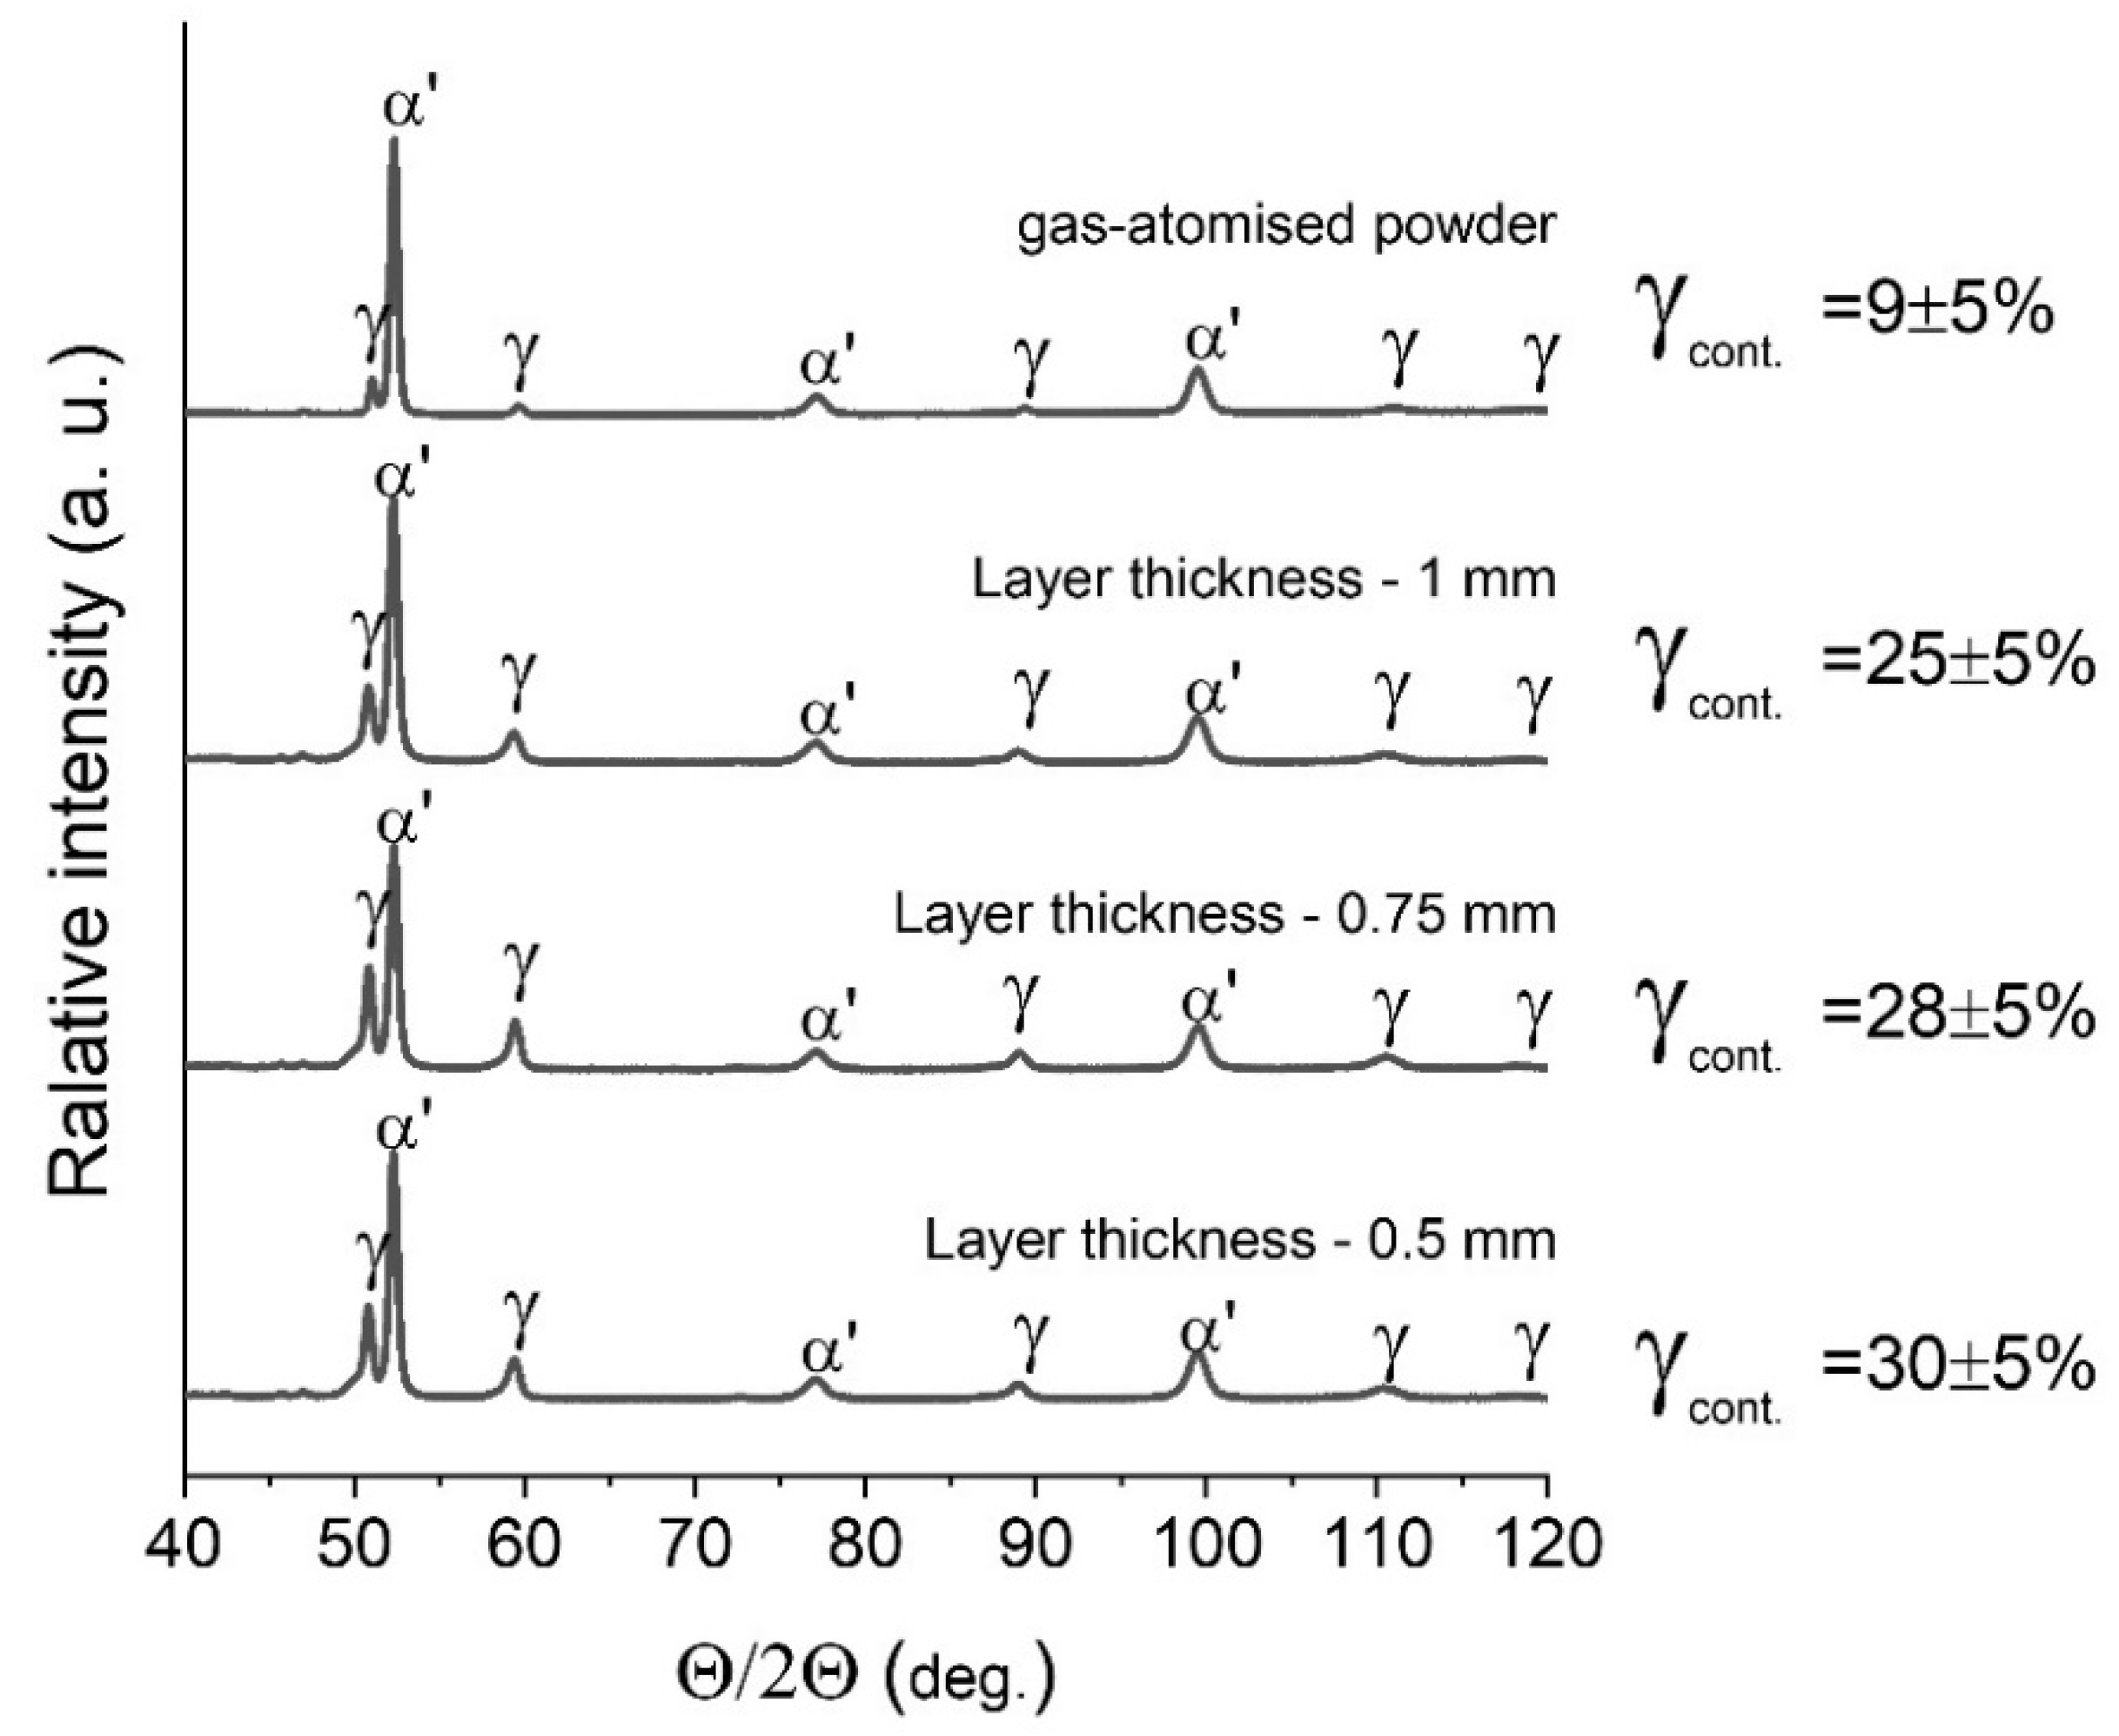
3.2. Microstructure and Phase Composition
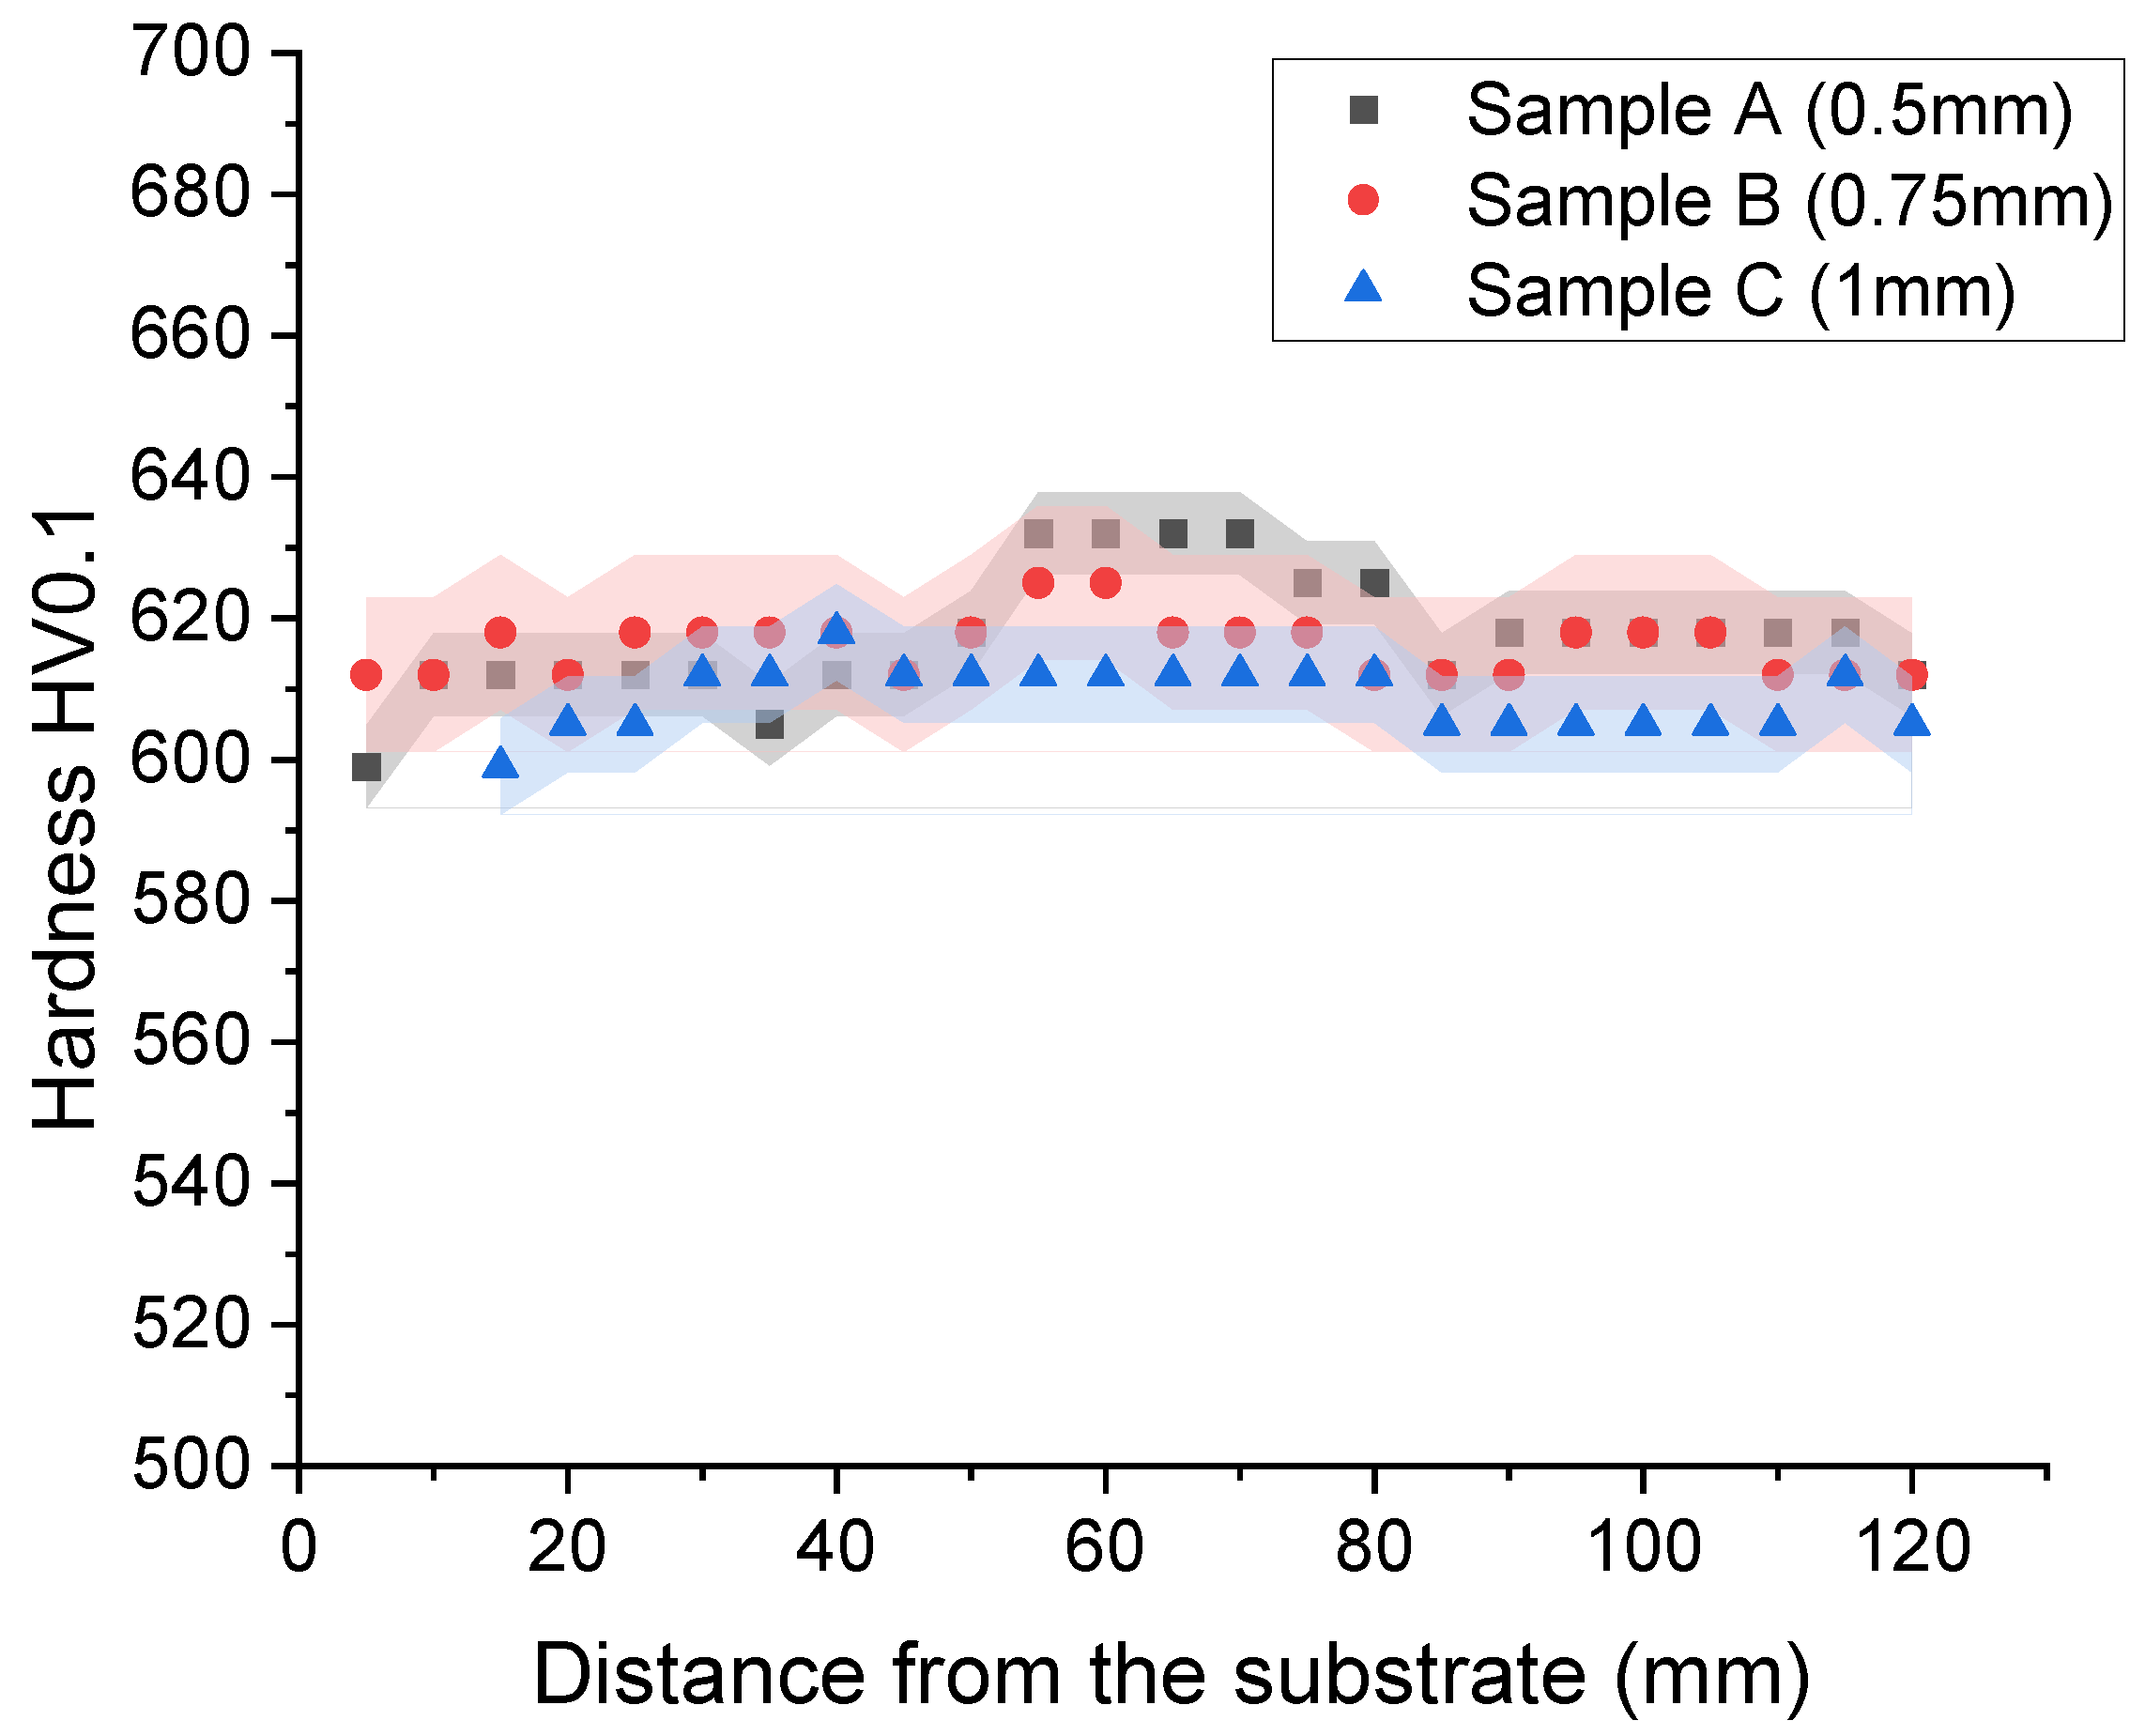
3.3. Microhardenss
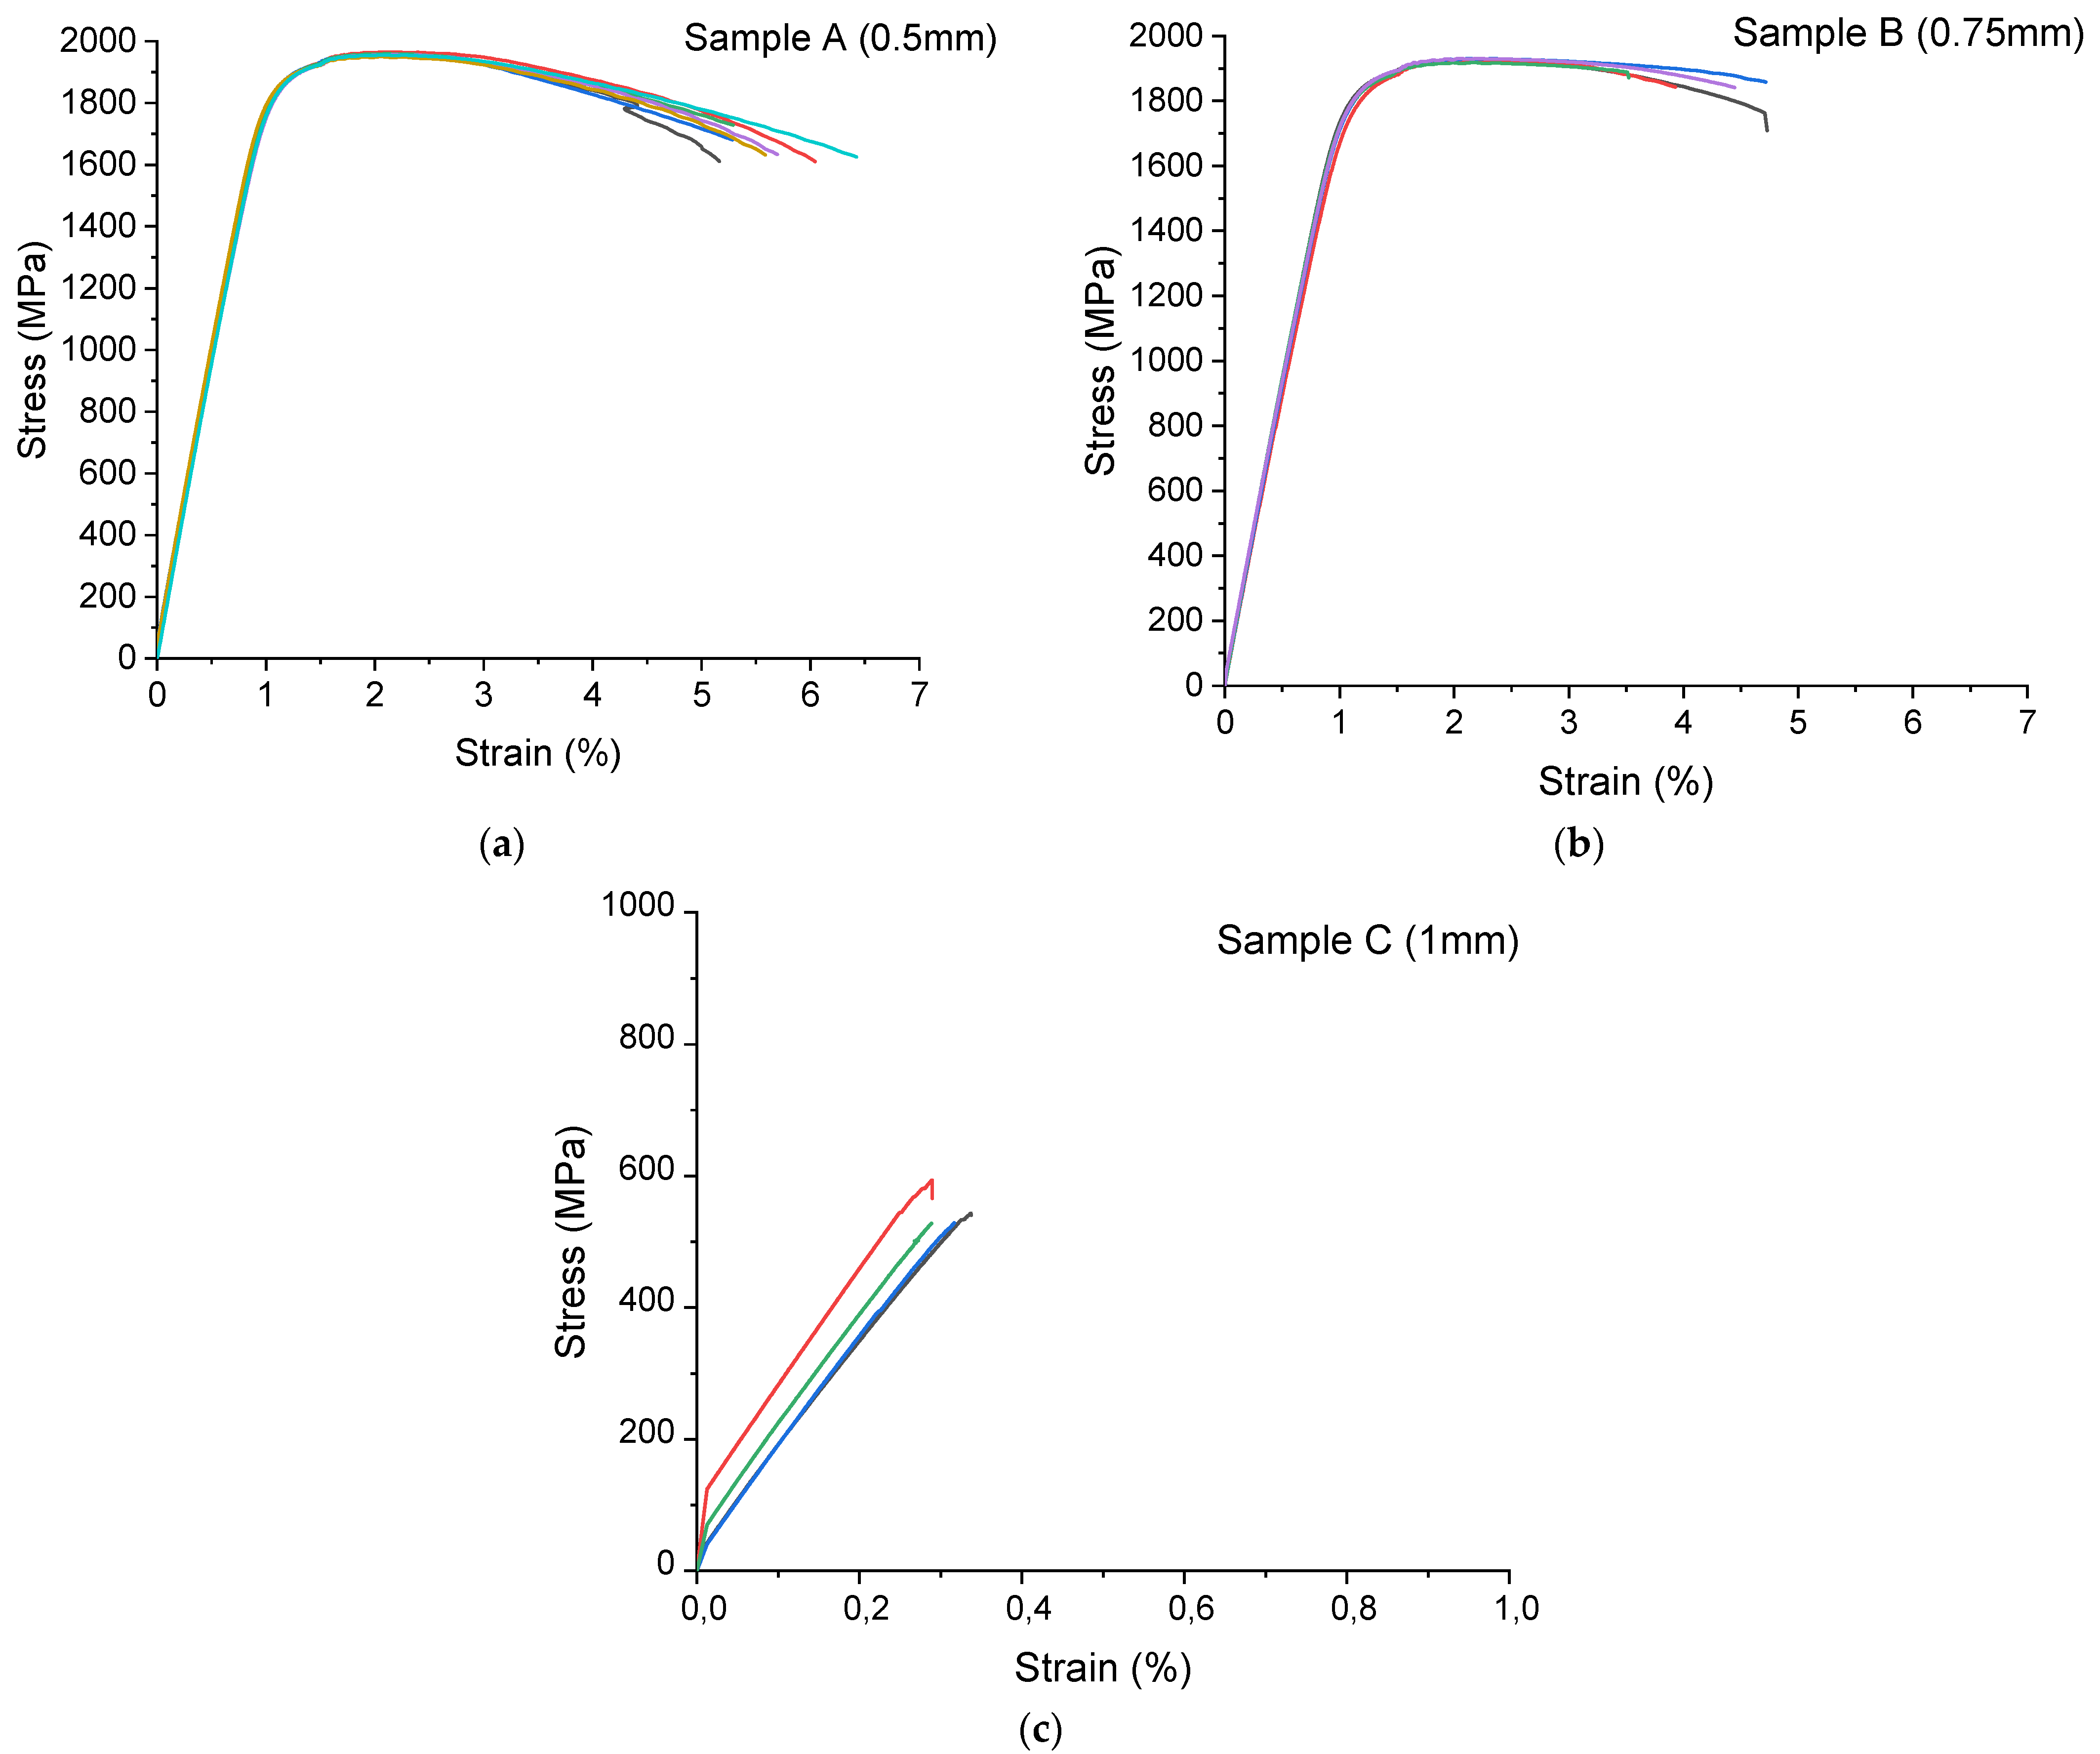
3.4. Tensile Properties
4. Conclusions
Author Contributions
Funding
Institutional Review Board Statement
Informed Consent Statement
Data Availability Statement
Acknowledgments
Conflicts of Interest
References
- Wong, K.V.; Hernandez, A. A review of additive manufacturing. Int. Sch. Res. Not. 2012, 2012, 208760. [Google Scholar] [CrossRef] [Green Version]
- Cooke, S.; Ahmadi, K.; Willerth, S.; Herring, R. Metal additive manufacturing: Technology, metallurgy and modelling. J. Manuf. Processes 2020, 57, 978–1003. [Google Scholar] [CrossRef]
- Bajaj, P.; Hariharan, A.; Kini, A.; Kürnsteiner, P.; Raabe, D.; Jägle, E.A. Steels in additive manufacturing: A review of their microstructure and properties. Mater. Sci. Eng. A 2020, 772, 138633. [Google Scholar] [CrossRef]
- Izadi, M.; Farzaneh, A.; Mohammed, M.; Gibson, I.; Rolfe, B. A review of laser engineered net shaping (LENS) build and process parameters of metallic parts. Rapid Prototyp. J. 2020, 26, 1059–1078. [Google Scholar] [CrossRef]
- Choo, H.; Sham, K.-L.; Bohling, J.; Ngo, A.; Xiao, X.; Ren, Y.; Depond, P.J.; Matthews, M.J.; Garlea, E. Effect of laser power on defect, texture, and microstructure of a laser powder bed fusion processed 316L stainless steel. Mater. Des. 2019, 164, 107534. [Google Scholar] [CrossRef]
- Mathoho, I.; Akinlabi, E.T.; Arthur, N.; Tlotleng, M.; Makoana, N.W. The Effects of LENS Process Parameters on the Behaviour of 17-4 PH Stainless Steel. In The Minerals, Metals & Materials Society, Proceedings of the TMS 2020 149th Annual Meeting & Exhibition Supplemental; Springer: Cham, Switzerland, 2020; pp. 481–490. [Google Scholar]
- Qi, H.; Azer, M.; Ritter, A. Studies of Standard Heat Treatment Effects on Microstructure and Mechanical Properties of Laser Net Shape Manufactured INCONEL 718. Metall. Mater. Trans. A 2009, 40, 2410–2422. [Google Scholar] [CrossRef]
- Donadello, S.; Furlan, V.; Demir, A.G.; Previtali, B. Interplay between powder catchment efficiency and layer height in self-stabilized laser metal deposition. Opt. Lasers Eng. 2022, 149, 106817. [Google Scholar] [CrossRef]
- Sha, W.; Guo, Z. Maraging Steels: Modelling of Microstructure, Properties and Applications; Woodhead Publishing Limited: Cambridge, UK, 2009. [Google Scholar]
- Campbell, F.C., Jr. Manufacturing Technology for Aerospace Structural Materials; Elsevier: Amsterdam, The Netherlands, 2006. [Google Scholar]
- Mouritz, A.P. Introduction to Aerospace Materials; Elsevier: Amsterdam, The Netherlands, 2012. [Google Scholar]
- Van Swam, L.F.; Pelloux, R.M.; Grant, N.J. Fatigue behavior of maraging steel 300. Metall. Trans. A 1975, 6, 45–54. [Google Scholar] [CrossRef]
- Ooi, S.W.; Hill, P.; Rawson, M.; Bhadeshia, H.K.D.H. Effect of retained austenite and high temperature Laves phase on the work hardening of an experimental maraging steel. Mater. Sci. Eng. A 2013, 564, 485–492. [Google Scholar] [CrossRef]
- Kim, D.; Kim, T.; Ha, K.; Oak, J.-J.; Jeon, J.B.; Park, Y.; Lee, W. Effect of heat treatment condition on microstructural and mechanical anisotropies of selective laser melted maraging 18Ni-300 steel. Metals 2020, 10, 410. [Google Scholar] [CrossRef] [Green Version]
- Tan, C.; Zhou, K.; Kuang, M.; Ma, W.; Kuang, T. Microstructural characterization and properties of selective laser melted maraging steel with different build directions. Sci. Technol. Adv. Mater. 2018, 19, 746–758. [Google Scholar] [CrossRef] [Green Version]
- Yasa, E.; Kempen, K.; Kruth, J.; Thijs, L.; Van Humbeeck, J. Microstructure and mechanical properties of maraging steel 300 after selective laser melting. In Proceedings of the Solid Freeform Fabrication Symposium, Austin, TX, USA, 12–14 August 2010; pp. 383–396. [Google Scholar]
- Kempen, K.; Yasa, E.; Thijs, L.; Kruth, J.-P.; Van Humbeeck, J. Microstructure and mechanical properties of Selective Laser Melted 18Ni-300 steel. Phys. Procedia 2011, 12, 255–263. [Google Scholar] [CrossRef] [Green Version]
- Chadha, K.; Tian, Y.; Bocher, P.; Spray, J.G.; Aranas, C., Jr. Microstructure Evolution, Mechanical Properties and Deformation Behavior of an Additively Manufactured Maraging Steel. Materials 2020, 13, 2380. [Google Scholar] [CrossRef]
- Sames, W.J.; List, F.A.; Pannala, S.; Dehoff, R.R.; Babu, S.S. The metallurgy and processing science of metal additive manufacturing. Int. Mater. Rev. 2016, 61, 315–360. [Google Scholar] [CrossRef]
- Zhang, B.; Li, Y.; Bai, Q. Defect Formation Mechanisms in Selective Laser Melting: A Review. Chin. J. Mech. Eng. 2017, 30, 515–527. [Google Scholar] [CrossRef] [Green Version]
- Casati, R.; Lemke, J.N.; Tuissi, A.; Vedani, M. Aging behaviour and mechanical performance of 18-Ni 300 steel processed by selective laser melting. Metals 2016, 6, 218. [Google Scholar] [CrossRef]
- de Souza, A.F.; Al-Rubaie, K.S.; Marques, S.; Zluhan, B.; Santos, E.C. Effect of laser speed, layer thickness, and part position on the mechanical properties of maraging 300 parts manufactured by selective laser melting. Mater. Sci. Eng. A 2019, 767, 138425. [Google Scholar] [CrossRef]


| Condition | Manufacturing Parameters | E [GPa] | UTS [MPa] | YS [MPa] | EL [%] | HRC |
|---|---|---|---|---|---|---|
| Wrought | 1000–1170 | 760–895 | 6–15 | 35 | ||
| Wrought AH [15] | 1930–2050 | 1862–2000 | 5–7 | 52 | ||
| SLM AB | Laser power: 285 W Scan speed: 950 mm/s Hatch space: 110 μm Layer thickness: 60 μm | 1085 ± 19 | 920 ± 24 | 11.3 ± 0.3 | 35.7 ± 1.1 | |
| SLM AH 490/6 h | 1942 ± 31 | 1867 ± 22 | 2.8 ± 0.1 | 52.9 ± 1.2 | ||
| SLM SA 840/1 h | 983 ± 13 | 923 ± 16 | 13.7 ± 0.7 | 27.5 ± 0.4 | ||
| SLM SA AB840/1 h; 490/6 h [15] | 1898 ± 33 | 1818 ± 27 | 4.8 ± 0.2 | 51.3 ± 0.9 | ||
| SLM AB | Laser power: 105 W Scan speed: 200 mm/s Layer thickness: 30 μm | 163 ± 4.4 | 1290 ± 112 | 13.3 ± 1.86 | 40 | |
| SLM AH 480/5 h [16] | 189 ± 2.8 | 2217 ± 72 | 1.6 ± 0.26 | 58 | ||
| SLM AB | Laser power: 100 W Scan speed: 150 mm/s Hatch space: 112 μm Layer thickness: 30 μm | 163 ± 4.5 | 1290 ± 114 | 1214 ± 99 | 39.9 ± 0.1 | |
| SLM AH 480/5 h [17] | 189 ± 2.9 | 2217 ± 73 | 1998 ± 32 | 58 ± 0.1 | ||
| SLM AB | Laser power: 300 W Layer thickness: 50 μm | 1214 ± 3 | 1135 ± 4 | 15 ± 2 | 35 ± 1 | |
| SLM SA AH 850/1 h; 490/6 h [18] | 2106 ± 2 | 2055 ± 11 | 8 ± 2 | 53 ± 3 |
| M300 Maraging Steel Powder | ||||||
|---|---|---|---|---|---|---|
| Element wt.% | Ni | Co | Mo | Ti | Si | Fe |
| Manufacturer | 18.60 | 8.75 | 4.89 | 0.81 | 0.08 | Bal. |
| EDS analysis | 18.25 ± 0.13 | 9.15 ± 0.11 | 4.33 ± 0.05 | 0.86 ± 0.06 | 0.15 ± 0.04 | Bal. |
| Sample | Power (W) | Hatch Space (mm) | Layer Thickness (mm) | Powder Feeding Rate (g/min) | Hatch Angle (◦) | Laser Head Travel Speed-Contour/Main (mm/s) | Laser Spot Size (mm) |
|---|---|---|---|---|---|---|---|
| A | 600 | 0.7 | 0.50 | 9.3 ± 0.1 | 0/45/90/135 | 12/15 | 1.15 |
| B | 600 | 0.7 | 0.75 | 13.9 ± 0.1 | 0/45/90/135 | 12/15 | 1.15 |
| C | 600 | 0.7 | 1 | 19.8 ± 0.1 | 0/45/90/135 | 12/15 | 1.15 |
| Layer Thickness | Porosity [%] | Circularity | |
|---|---|---|---|
| 0.5 mm | Bottom | 0.21 ± 0.12 | 0.752 ± 0.003 |
| Middle | 0.19 ± 0.08 | 0.780 ± 0.006 | |
| Top | 0.12 ± 0.07 | 0.785 ± 0.021 | |
| 0.75 mm | Bottom | 0.39 ± 0.13 | 0.718 ± 0.018 |
| Middle | 0.26 ± 0.14 | 0.728 ± 0.016 | |
| Top | 0.21 ± 0.01 | 0.730 ± 0.010 | |
| 1 mm | Bottom | 1.12 ± 0.53 | 0.669 ± 0.027 |
| Middle | 0.56 ± 0.20 | 0.767 ± 0.013 | |
| Top | 0.40 ± 0.13 | 0.780 ± 0.004 |
| Layer Thickness | Bottom | Middle | Top |
|---|---|---|---|
| 0.5 mm | 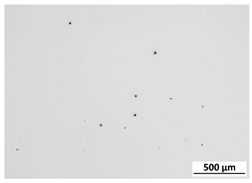 | 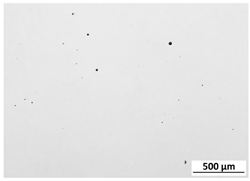 |  |
| 0.75 mm | 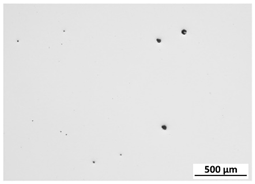 | 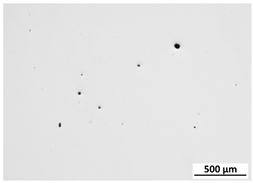 |  |
| 1 mm | 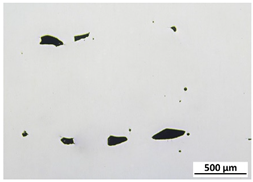 | 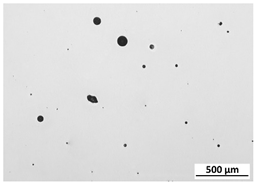 | 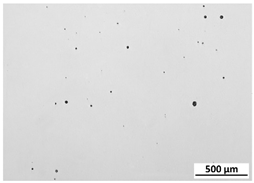 |
| Layer Thickness | UTS [MPa] | YS [MPa] | E [GPa] | EL [%] | HV0.1 |
|---|---|---|---|---|---|
| 0.5 mm | 1958 ± 10 | 1856 ± 8 | 194 ± 6 | 4.8 ± 0.8 | 617 ± 18 |
| 0.75 mm | 1926 ± 10 | 1813 ± 20 | 188 ± 10 | 3.3 ± 1.0 | 616 ± 8 |
| 1 mm | 548 ± 60 | - | 178 ± 8 | 0.19 ± 0.05 | 609 ± 8 |
Publisher’s Note: MDPI stays neutral with regard to jurisdictional claims in published maps and institutional affiliations. |
© 2022 by the authors. Licensee MDPI, Basel, Switzerland. This article is an open access article distributed under the terms and conditions of the Creative Commons Attribution (CC BY) license (https://creativecommons.org/licenses/by/4.0/).
Share and Cite
Rońda, N.; Grzelak, K.; Polański, M.; Dworecka-Wójcik, J. The Influence of Layer Thickness on the Microstructure and Mechanical Properties of M300 Maraging Steel Additively Manufactured by LENS® Technology. Materials 2022, 15, 603. https://doi.org/10.3390/ma15020603
Rońda N, Grzelak K, Polański M, Dworecka-Wójcik J. The Influence of Layer Thickness on the Microstructure and Mechanical Properties of M300 Maraging Steel Additively Manufactured by LENS® Technology. Materials. 2022; 15(2):603. https://doi.org/10.3390/ma15020603
Chicago/Turabian StyleRońda, Natalia, Krzysztof Grzelak, Marek Polański, and Julita Dworecka-Wójcik. 2022. "The Influence of Layer Thickness on the Microstructure and Mechanical Properties of M300 Maraging Steel Additively Manufactured by LENS® Technology" Materials 15, no. 2: 603. https://doi.org/10.3390/ma15020603
APA StyleRońda, N., Grzelak, K., Polański, M., & Dworecka-Wójcik, J. (2022). The Influence of Layer Thickness on the Microstructure and Mechanical Properties of M300 Maraging Steel Additively Manufactured by LENS® Technology. Materials, 15(2), 603. https://doi.org/10.3390/ma15020603