Article

Structure and Crystallization of High-Calcium, CMAS Glass Ceramics Synthesized with a High Content of Slag

State Key Laboratory of Silicate Materials for Architectures, Wuhan University of Technology, 122 Luoshi Road, Wuhan 430070, China
*
Author to whom correspondence should be addressed.
Materials 2022, 15(2), 657; https://doi.org/10.3390/ma15020657
Submission received: 24 November 2021 / Revised: 26 December 2021 / Accepted: 13 January 2022 / Published: 16 January 2022

Abstract

:
In this work, more than 70 wt % of ferromanganese slag (containing 40 wt % CaO) was used to synthesize high-calcium, CaO-MgO-Al2O3-SiO2 (CMAS) glass ceramics. The effect of SiO2/CaO on the structure, crystallization behavior and microstructure of high-calcium, CMAS, slag glass ceramics was studied by IR, NMR, DSC, XRD and SEM. The results showed that in the high-calcium, CMAS glass ceramics, the main existing forms of silicon–oxygen tetrahedra (Qn) were Q0 and Q1. With the increase in the SiO2/CaO, Qn changed from Q0 and Q1 (main units) to Q1 (main units) and Q2, and then to Q1 and Q2 (main units). The polymerization degree of Qn changed from low to high, making the glass more stable, which led to the increase in crystallization temperature and the decrease in crystallization kinetic constant (k) and frequency factor (υ). At the same time, the change in the Qn structure resulted in a gradual change to the main crystal, from akermanite to diopside–wollastonite.

1. Introduction

Ferromanganese is an important mineral resource and has a significant influence on the construction industry. The smelting efficiency of ferromanganese is significantly affected by the smelting process and its ore grade. In the smelting process, in order to improve the smelting efficiency, the ratio of CaO/SiO2 needs to be controlled and kept in the range 1.3~1.5 [1,2,3]. Therefore, ferromanganese slag is a slag with high CaO content. In China, ferromanganese slag has a higher content of CaO as the grade of manganese ore is lower than that of the average for the rest of the world [4,5]. According to statistics, the annual emissions of ferromanganese slag in China were about 18 million tons in 2017, the majority of the ferromanganese slag ended up in landfill [6,7]. The minority of the ferromanganese slag was used in the building-materials industry, and its dosage did not exceed 30 wt % [8,9]. Hence, high-volume utilization of ferromanganese slag is an important factor affecting the healthy and orderly development of the ferroalloy industry, which also leads to significant economic and environmental benefits.
Slag glass ceramics are environmentally friendly materials prepared using slag as the main raw material, which is a low-cost and high-value-added material. CaO–MgO–Al2O3–SiO2 (CMAS) is one of the important components in the field of glass–ceramic materials, whose main precipitation is diopside. Due to the crystal structure of diopside, CMAS-system glass ceramics show advantages, which include high strength and excellent chemical resistance [10,11,12]. CMAS systems are often used to design slag glass ceramics, because its main chemical composition is close to that of slag [13,14,15].
In the field of glass ceramics, using ferromanganese slag to prepare architectural glass ceramics is rarely studied. This is because, compared with other slags, the ferromanganese slag cannot be used at such a high content in traditional CMAS systems [16,17,18]. In traditional CMAS glass ceramics, the CaO content is generally not higher than 20 wt % for the sake of diopside crystallization [19,20]. This means that the utilization rate of high-calcium slag, such as ferromanganese slag (CaO ≥ 40 wt %), cannot exceed 50 wt%. When using ferromanganese slag at high dosages, the CaO content in the glass composition will be higher than that of traditional CMAS systems. Therefore, studying the glass structure and crystallization behavior of high-calcium CMAS systems is conducive to realizing the use of higher contents of high calcium slag.
SiO2 and CaO are important components of glass, and the ratio of SiO2/CaO will have a significant impact on the basic structure and crystallization behavior of the glass. Li et al. found that an increase in calcium oxide content will increase the content of low-polymerization silica tetrahedra in glass structures [21]. Jia et al. found that when the content of CaO is less than 32 wt %, adjusting the ratio of SiO2/CaO from 1.34 to 2.44 caused a series of changes in the viscosity, crystal form, structure and mechanical properties of the glass [22]. Wang et al. prepared glass ceramics by using 37~56 wt % blast furnace slag, and when the SiO2/CaO ratio was reduced from 3.33 to 1.58, the crystal changed from diopside to akermanite [23]. Hence, it is of critical importance to study the influence of the SiO2/CaO ratio in high-calcium CMAS systems.
In this work, ferromanganese slag was used as the main raw material to prepare high-calcium CMAS glass ceramics, and the slag content was higher than 70 wt %. Infrared spectroscopy (IR), nuclear magnetic resonance (NMR), differential scanning calorimeter (DSC), X-ray diffraction (XRD) and field-emission scanning electron microscopes (SEM) have been used to study the effects of the SiO2/CaO ratio on the structure and crystallization of high-calcium CMAS glass ceramics.

2. Materials and Methods

2.1. Materials Preparation

The ferromanganese slag and bauxite used in the experiment were obtained from YW Ferroalloy Factory in Lvliang, Shanxi Province, China. The oxide compositions of ferromanganese slag and bauxite are listed in Table 1.

2.2. Glass Composition

Ferromanganese slag was used as the main raw material and bauxite as the auxiliary material. By adding SiO2, Al2O3, MgO and other chemical reagents, the mass ratio of Al2O3, MgO, Fe2O3 and MnO were kept unchanged. Each sample was premilled by ball milling and kept at 1500 °C for 2 h. The samples were quenched with water, ground by a vibrating mill and passed through a 200 mesh sieve for subsequent testing. Specific oxide composition is shown in Table 2.

2.3. Characterizations

Infrared spectra of the sample were detected by infrared spectrometer (Nexus, Therno Nicolet, USA) in the range 400–2000 cm−1.
29Si magic angle spinning nuclear magnetic resonance (MAS-NMR) spectra were obtained at 79.49 MHz using a 400 MHz AVANCE III spectrometer (Bruker, Switzerland, 9.8 T, wide-bore, using 7 mm zirconia rotors spinning at 5 kHz at ambient temperature). The 29Si MAS-NMR samples were spun with a recycle delay time of 5 s and the number of scans was 1024. Chemical displacement was quoted in parts per million (ppm) from tetramethylsilane (TTMS).
The glass crystallization temperature was collected by a differential scanning calorimeter (DSC, Netzsch STA 449F3, Germany) with alumina as the reference. The temperature was scanned over a range from room temperature to 1000 °C at a heating rate of 5, 10, 15 and 20 °C/min.
Crystalline phases of glass ceramics were identified by X-ray diffraction (XRD, D/MAX-RB Rigaku, Japan) with Cu radiation (λ = 0.15405 μm) at 40 kV and 40 mA. The diffraction patterns were recorded from 10° to 70°, with a scanning speed of 2°/min.
The microstructure of the samples was observed on fresh fracture surfaces using a field emission scanning electron microscope (SEM, JSM-IT300, JEOL, Japan). The fracture surface was chemically etched by 4% HF for 40 s. The internal structural properties were determined by field-emission, high-resolution transmission electron microscope (TEM, JEM-2100F, JEOL, Japan).

3. Results

3.1. Characterization of Basic Glass

Figure 1 shows the XRD patterns of quenched samples with different SiO2/CaO ratios. Obvious crystallization peaks can be seen in S1, which contained 100% slag. This indicated that the raw-slag melt was prone to crystallize. This is because SiO2, as a glass network former, mainly participates in the composition of the glass network structure. The stable silicon–oxygen tetrahedral structure will increase the difficulty of particle migration, thereby reducing the tendency of crystallization [24]. CaO, as a network modifying oxide, can provide free oxygen (Onb) to destroy the glass network structure, thereby reducing the degree of polymerization of the glass network structure [25,26]. The decrease in polymerization degree was conducive to the migration of particles, thereby increasing the tendency of crystallization. The SiO2/CaO ratio of S1 was 0.98. this low silicon-to-calcium ratio made the glass network structure unstable, so S1 had a greater tendency to crystallize. As the ratio of SiO2/CaO increased, there was no obvious crystallization peak in S2–S5. This showed that the increase in the SiO2/CaO ratio was conducive to stabilizing the glass network structure.
Infrared spectroscopy (IR) can reflect the transition of vibrational and rotational energy levels in specific molecules by detecting the absorption of infrared light. Figure 2 shows the infrared spectra of S1–S5. The common structures in glass are [AlO4], [AlO6] and [SiO4], and the tetrahedral structure can be connected by bridge oxygen (Ob) to form anionic groups with a higher degree of polymerization. Corresponding characteristic vibrations of CAMS glass are listed in Table 3 [27,28].
It can be seen from Figure 2 that there are three obvious absorption peaks located around 450~550 cm−1, 640~800 cm−1 and 850~1150 cm−1, and the peak positions shifted significantly. As shown in Table 3, the peak around 450~550 cm−1 was ascribed to the Si-Ob-Si bending vibration and Al-O bending vibration in [AlO6]. The peak shifts to lower wavenumbers indicated that the bending vibration of Si-Ob-Si was strengthened. Therefore, the structure of Si-Ob-Si and the amount of Ob in the glass increased. The peak around 640~800 cm−1 was ascribed to the Al-O bending vibration in [AlO4], Si-Ob-Si symmetric stretching vibration and O-Si-O symmetric bending vibration. The peak around 850~1150 cm−1 could be assigned to the Si-Onb anti-symmetric stretching vibration and Si-Ob-Si anti-symmetric stretching vibration. Both peaks tended to shift to higher wavenumbers, which also explained the increase in the amount of Ob. The IR results indicated that the increase in the SiO2/CaO ratio could effectively form Ob.

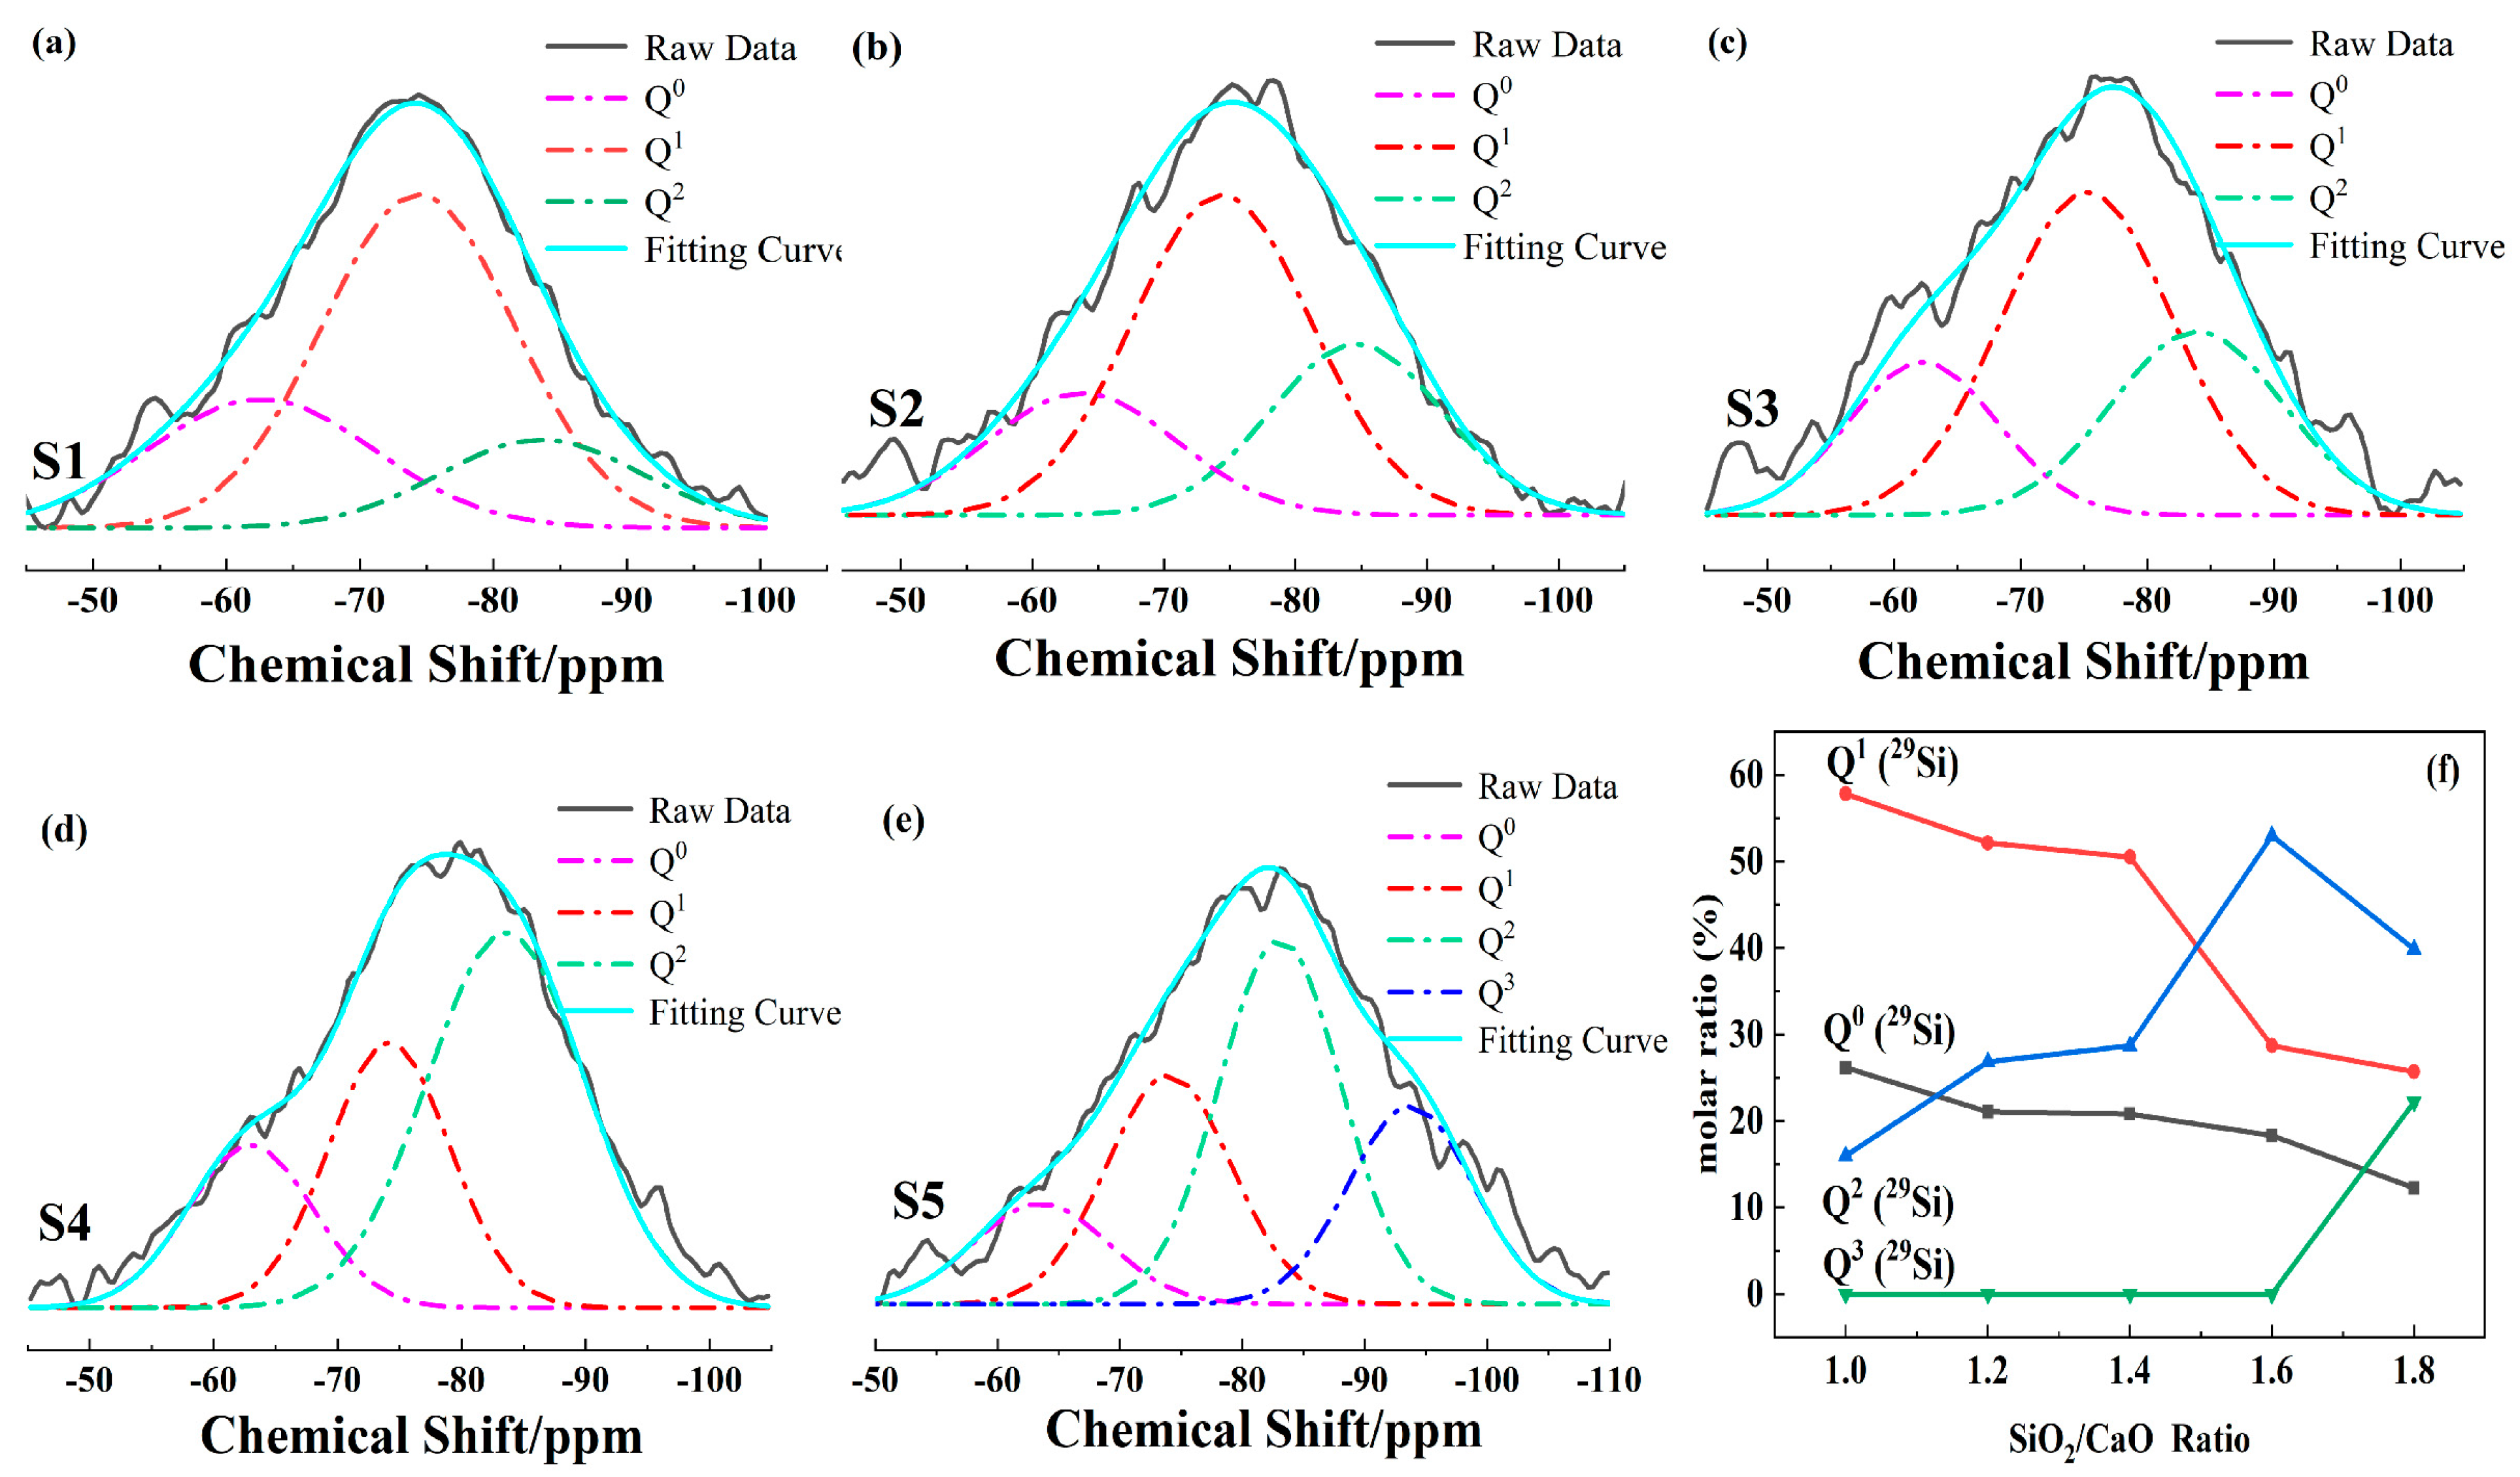
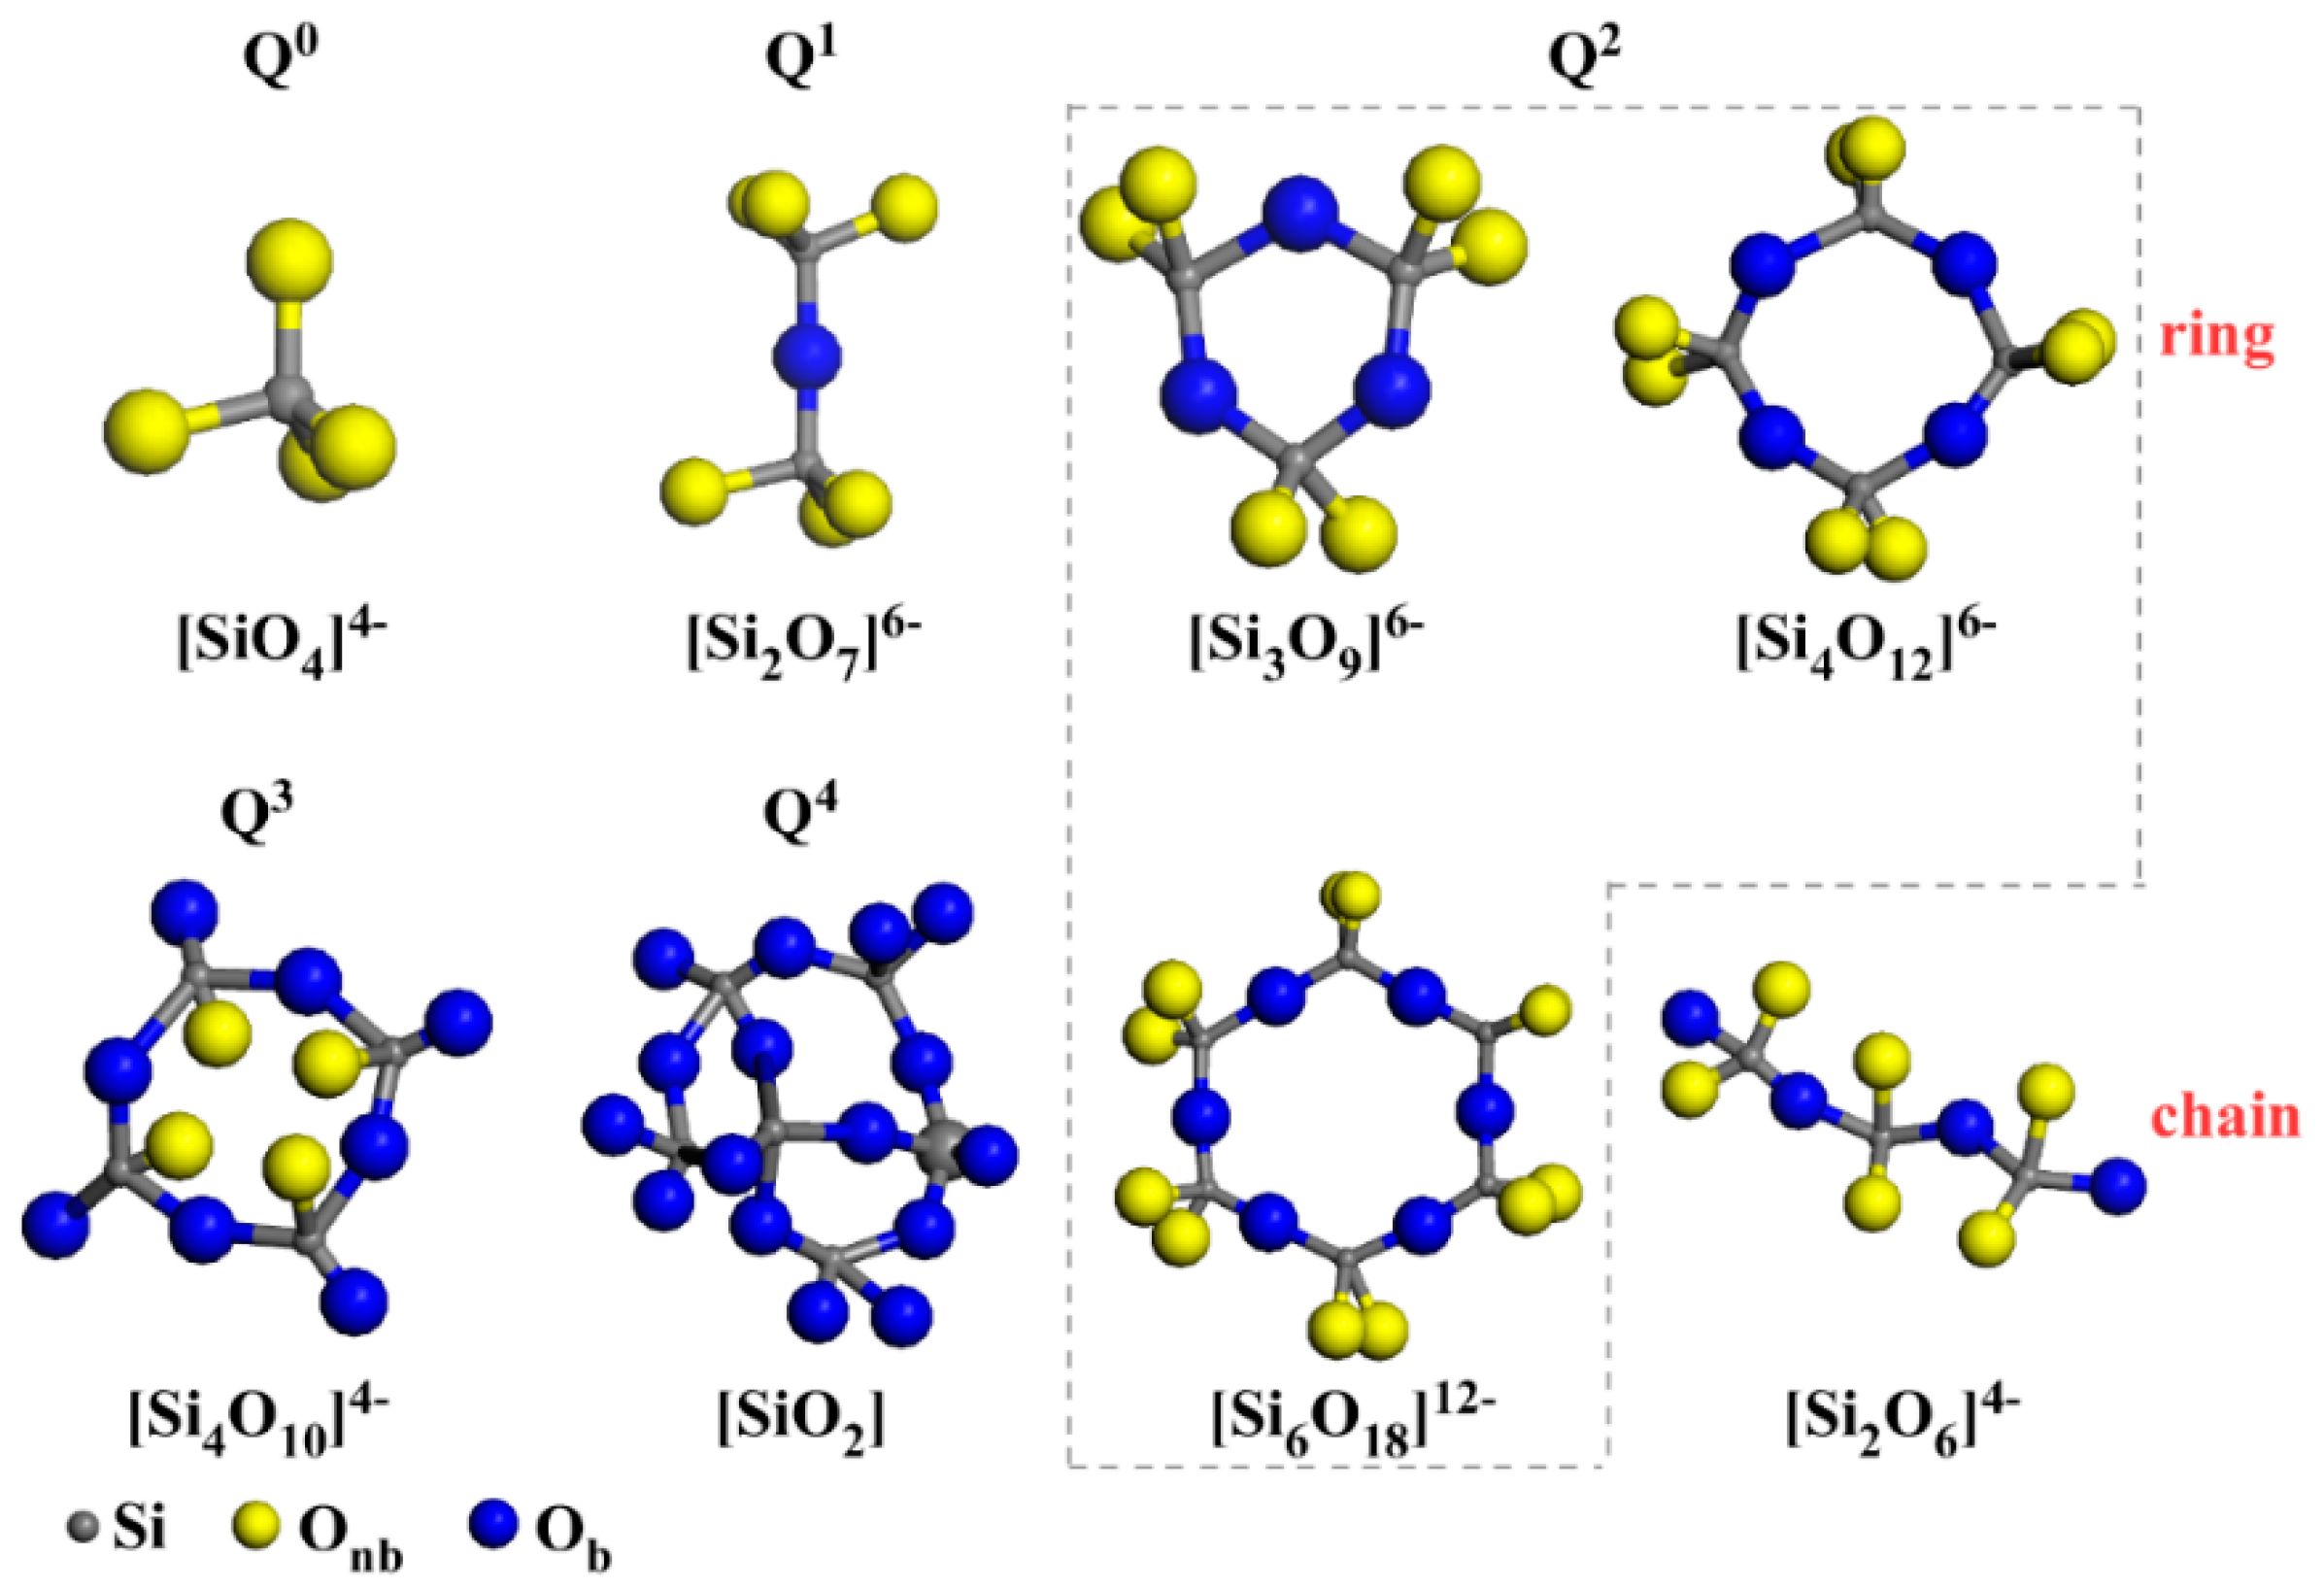
3.2. The Influence of SiO2/CaO on the Silicon–Oxygen Tetrahedron Structure

In silicon-based glass, the basic structural units are composed of a spin silicon–oxygen tetrahedron structure, in which a silicon atom is connected to four oxygen atoms. The silicon–oxygen tetrahedral structure with a silicon atom at the center can be denoted as Qn, where Q represents the silicon atom and n represents the number of Ob connected to the silicon atom. IR results showed that the number of Ob increased, and the polymerization degree of silicon–oxygen tetrahedra increased. However, a specific existing forms of the Qn structures in the high-calcium CMAS systems was still unclear. As NMR is a technique commonly used for short-range and medium-range structure analysis of glass, including 29Si, 27Al, 17O, the study was further carried out by NMR. The relative contents of each silicon–oxygen tetrahedral structure could be obtained by fitting and analyzing the measured curve [29,30].
It can be seen from Figure 3 that the center of the 29Si NMR peak was around −70~−80 ppm, indicating that the silicon–oxygen tetrahedra structures in the high-calcium CMAS systems were mainly Q0, Q1 and Q2 [31,32,33]. This was different from traditional low-calcium CMAS systems, whose main existing forms of silicon–oxygen tetrahedra are Q1, Q2 and Q3 [34,35]. With the increase in the SiO2/CaO ratio, the chemical shift of the S1–S5 peak centers became smaller. This indicated that the existing forms of the silicon–oxygen tetrahedra gradually changed from low polymerization degrees to high polymerization degrees, which was consistent with IR results.
Fourier transformation was performed to smooth the curves. The spectra intensities were normalized, and the peaks were deconvoluted (the peak centers were at −64 ppm for Q0, −74 ppm for Q1, −83 ppm for Q2, −94 ppm for Q3). Figure 4a shows a typical deconvolution for S1–S5. Figure 4b shows the relative peak-area ratio of different Qn changing with the SiO2/CaO ratio.
As shown in Figure 4, the main forms of silicon–oxygen tetrahedra in S1 were Q0 and Q1 (main units). This was because the SiO2/CaO ratio of S1 was 0.98, and the molar ratio of oxygen atoms to silicon atoms was larger than 3.5, which made the silicon–oxygen tetrahedron unable to form a high degree of polymerization anion group [36]. As the ratio of SiO2/CaO increased (Figure 4f), the content of Q0 and Q1 gradually decreased, and the content of Q2 gradually increased. This was because, with the increase in SiO2/CaO, the free oxygen introduced by CaO decreased, whereas the Si atoms that could form silicon–oxygen tetrahedra increased. Low-polymerization-degree [SiO4] needs to be bonded with oxygen atoms to form glass structures with a high polymerization degree, so as to achieve a balance of valence. When SiO2/CaO changed from 1.6 to 1.8, the content of Q2 was reduced, because Q3 (higher degree of polymerization) was formed in the glass.
In high-calcium CMAS systems, an increase in the SiO2/CaO ratio will cause three significant changes in the main existing form of Qn. When SiO2/CaO increased from 0.98 to 1.2, the main forms of silicon–oxygen tetrahedra changed from Q0 and Q1 (main units) to Q1 (main units) and Q2. When the SiO2/CaO ratio increased from 1.4 to 1.6, the main forms of silicon–oxygen tetrahedra changed from Q1 (main units) and Q2 to Q1 and Q2 (main units). When the SiO2/CaO ratio reached 1.8, a glass structure with a higher degree of polymerization, i.e., Q3, began to appear.

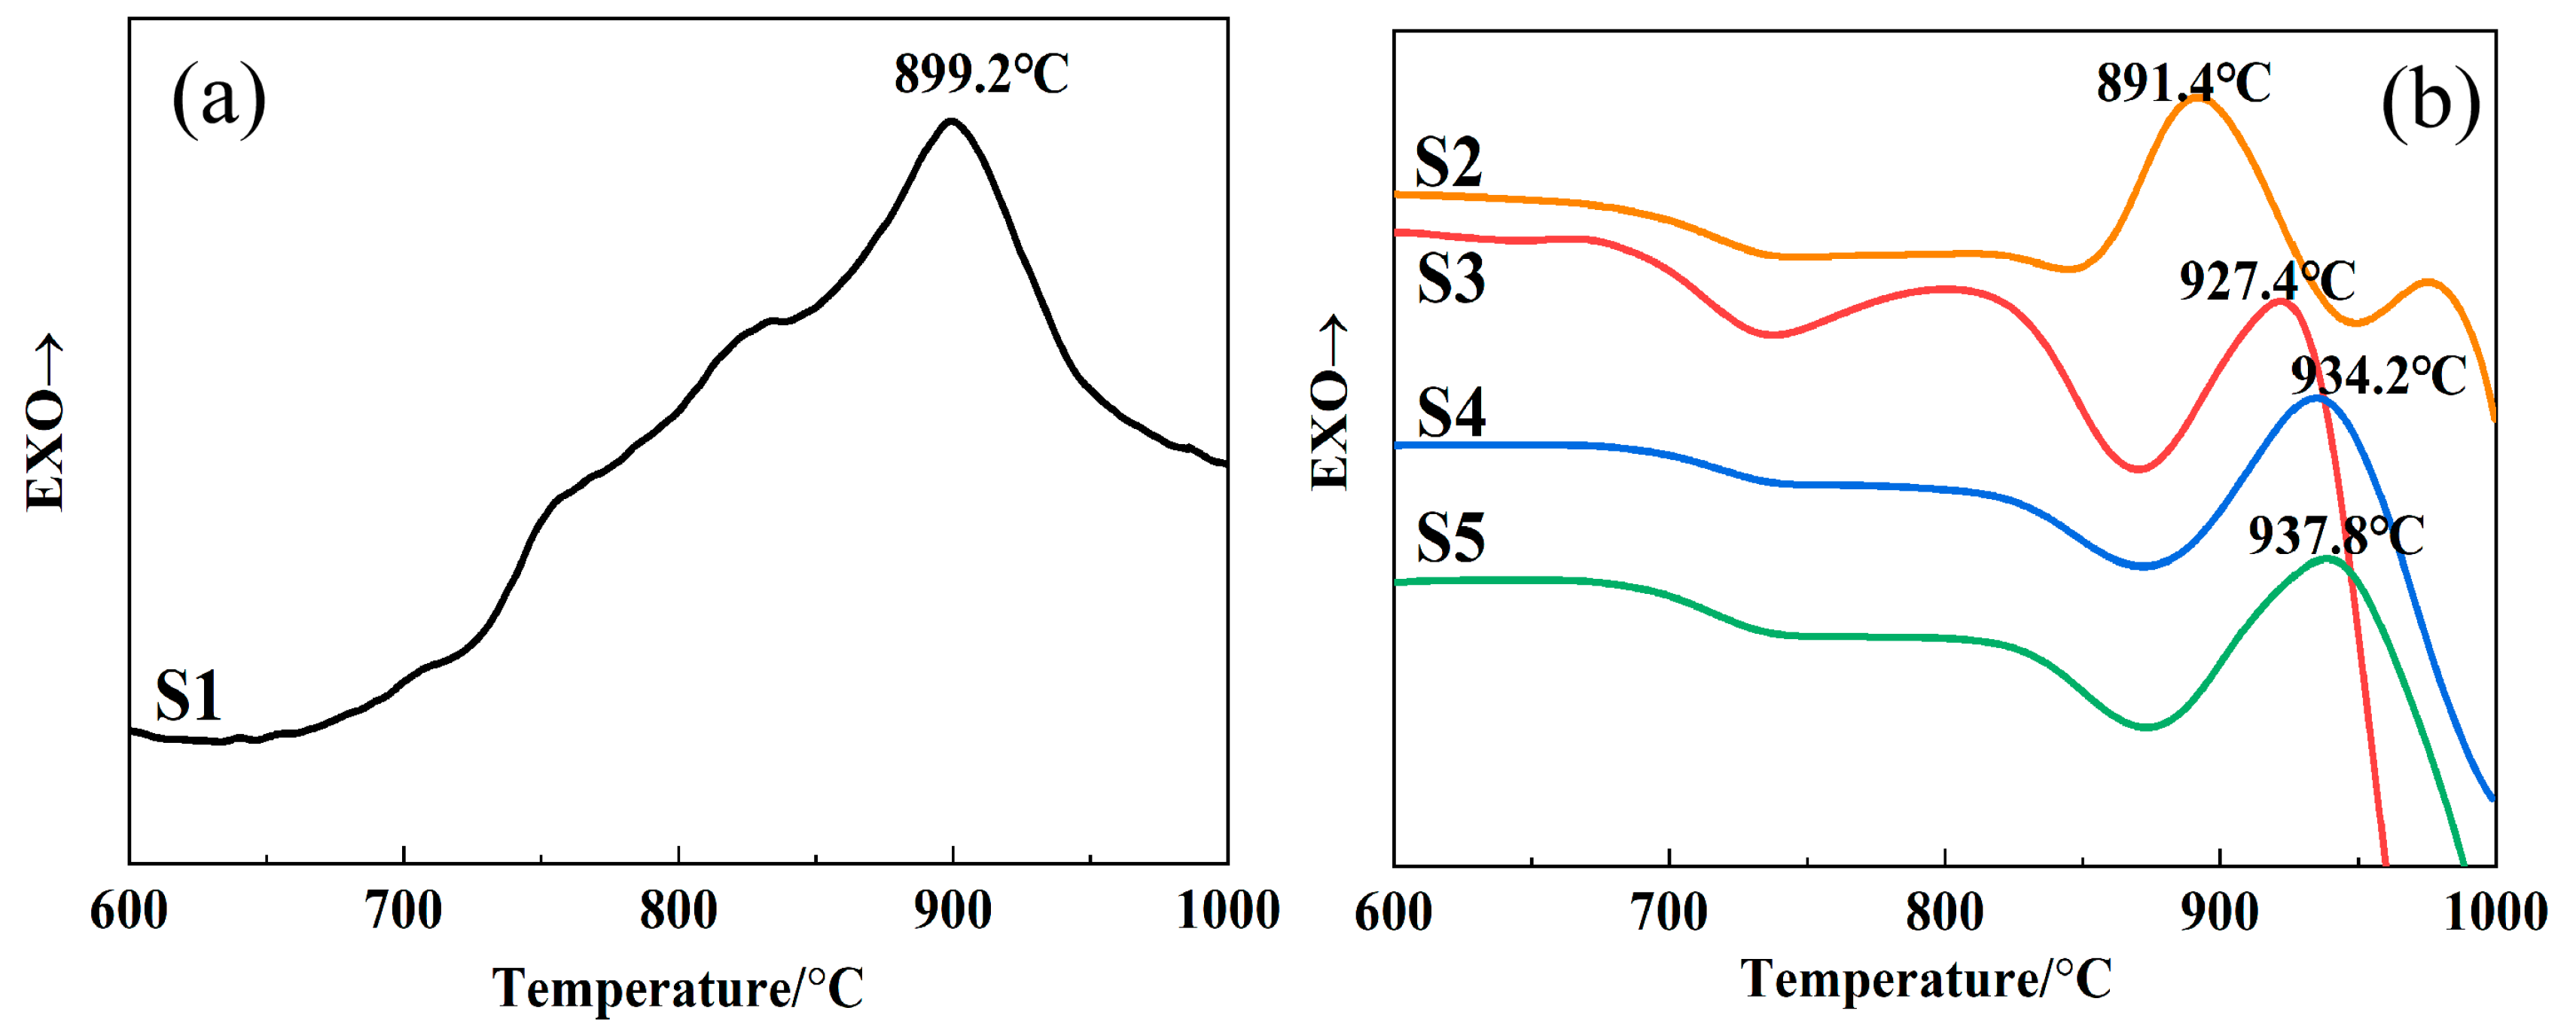
3.3. The Effect of SiO2/CaO on Crystallization Behavior

Figure 5 shows the DSC curves of the samples with different SiO2/CaO ratios, at a heating rate of 10 °C/min. The DSC curves of the original slag sample and the modified samples are depicted respectively. As for S1, the DSC curve exhibited a low initial exothermic temperature and a broad and coarse exothermic peak in the range 700~1000 °C, which indicated that S1 had a wide crystallization range. According to XRD pattern of the water-quenched samples (Figure 1), S1 had already undergone crystallization during the cooling process. In the subsequent crystallization process, when the temperature rose above the glass transition temperature, these precipitated crystals would grow further. Therefore, the initial temperature of the exothermic process, caused by crystal growth, was lower. At the same time, a new nucleation process and crystal growth process would occur, so the entire crystallization process lasted for a long period of time, which caused a wide exothermic peak on the DSC curve.
Compared to S1, the exothermic peak width of S2–S5 were significantly narrowed and the initial exothermic temperature was increased from 700 °C to 850 °C. This was because the rapid crystallization of the slag was solved as the SiO2/CaO ratio increased. In detail, S2–S5 needed to undergo a nucleation process before the crystallization process during the heating process. Therefore, the initial exothermic temperature was significantly increased.
The narrower crystallization peak indicated that the crystallization process of the samples occurred in a narrow temperature range, which was conducive to controlling the appropriate crystallization temperature so that the uniform crystal grain could be precipitated. For S2–S5, with the increase in the SiO2/CaO ratio, the shape of the crystallization peak did not change significantly, but the temperature of the crystallization peak kept shifting to higher temperatures. This was because the silicon–oxygen tetrahedron changed from Q1 (main units) to Q2 (main units) as the ratio of SiO2/CaO increased. Qn changed a from low polymerization degree to a higher polymerization degree. The stable glass structure made it more difficult for particles to migrate during the crystallization process, so the corresponding crystallization peak temperature increased.
In order to investigate the effect of the SiO2/CaO ratio on the crystallization mechanism of glass, the crystallization activation energy (Ec) of S1–S5 was evaluated by non-isothermal DSC curves. The crystallization peak temperatures (Tp) of S1–S5 are shown in Table 4. The non-isothermal crystallization kinetics of glass can be described by the Kissinger equation [37].
ln ( T p 2 α ) = E c R T p + ln ( E c R ) ln v  
The crystallization kinetic constant (k) is related to the crystallization peak temperature and can be described by the Arrhenius equation.
k = υ × exp ( E c R T p )
where Tp is the crystallization peak temperature, α is the heating rate and R is the gas constant. Figure 6a shows the correlation between   ln   ( T p 2 / α ) and 1000 / ( R × T p ) of S1–S5. The Ec, k and υ were calculated, and the relationship of Ec, k and υ with SiO2/CaO was plotted, as shown in Figure 6b–d.
It was found that as the ratio of SiO2/CaO increased, the activation energy of the sample gradually decreased. Similar results were found by Deng when a high content of stainless-steel slag (more than 50 wt %) was used [38]. Cheng et al. pointed out that activation energy could not be directly used to judge the stability of glass. It was necessary to introduce the crystallization kinetic constant k and frequency factor υ to evaluate the thermal stability of glass [39]. Hu et al. also pointed out that k and υ could reflect the thermal stability and internal structure of the glass [40]. The stability of the glass increased as the values of k and v decreased. As the ratio of SiO2/CaO increased, the kinetic constant and frequency factor of the sample decreased, indicating that the glass structure became more stable, which was consistent with the IR and NMR results.
Figure 7a,b are the XRD patterns of S1–S5 crystallized at 950 °C for 1 h and S3 heated at 850 °C, 900 °C and 950 °C for 1 h, respectively. As shown in Figure 7a, only akermanite (Ca2MgSi2O7) was precipitated in S1. With the increase in the SiO2/CaO ratio, the content of akermanite gradually decreased until it disappeared. The main crystal phase of the sample gradually changed from akermanite to diopside–wollastonite (CaMgSi2O6-CaSiO3), and the amount of diopside gradually increased with the increase in SiO2/CaO ratio.
By comparing crystal form and the content of Qn, it was found that the content of akermanite changed with Q1 and the content of diopside–wollastonite changed with Q2. When SiO2/CaO increased from 0.98 to 1.2, the main forms of the silicon–oxygen tetrahedra changed from Q0 and Q1 (main units) to Q1 (main units) and Q2. The appearance of Q2 corresponded to the precipitation of diopside–wollastonite. When SiO2/CaO increased from 1.4 to 1.6, the main forms of the silicon–oxygen tetrahedra changed from Q1 (main units) and Q2 to Q1 and Q2 (main units), which corresponded to the disappearance of akermanite. This was because the transformation of Qn affected the precipitation of crystals [41].
As shown in Figure 8, Qn corresponded to different anion group structures. Q1 contained a bridging oxygen, which corresponded to the anionic group structure of [Si2O7]6−. When the SiO2/CaO ratio was low, the main existing form of the silicon–oxygen tetrahedron in the glass structure was Q1, which made it easier to precipitate crystals with the anionic group structure of [Si2O7]6−, that is, akermanite. Q2 contained two bridge oxygens, which could be formed in different anionic group structures such as [Si3O9]6−, [Si4O12]8−, [Si6O18]12− and [Si2O6]4−. When the main form of silicon–oxygen tetrahedron in the glass structure was Q2, it was easier to precipitate crystals (wollastonite and diopside) with the corresponding anion group structure. Therefore, when the tetrahedral structure in the glass changed, the crystal form corresponding to different SiO2/CaO changed at the same time.
It can be seen from Figure 7b that the diopside phase was first precipitated in the sample during the crystallization process, and the wollastonite phase was gradually precipitated as the temperature rose. This was because Qn underwent structural transformation during the heating process, such as Qn Qn−1 + Qn+1 [42]. The anion group of diopside (CaMgSi2O6) and wollastonite (CaSiO3) both belong to Q2. As for [Si3O9]6−, [Si4O12]8− and [Si6O18]12−, the formation of these ring-like structures was difficult, and required breaking, bonding and bending of several Si–O bonds from Q1. However, [Si2O6]4− is a chain structure, so its transformation from Q1 required the breaking and bonding of fewer bonds. Therefore, diopside was easier to crystallize than wollastonite.
Figure 9a–e shows the microstructure of S1–S5, which were made from powders kept at 950 °C for 1 h. Figure 9f shows the TEM image of S1. As shown in Figure 9a, herringbone crystals, with a grain size of approximately 1 μm, and sphere particles, with grain size of 0.2 μm, could be found in S1. These crystals with different grain sizes were both akermanite, according to the XRD result. This indicated that the growth process of grains in S1 differed. The TEM image of S1 showed that there were obvious diffraction spots in the water-quenched sample, indicating that crystals had already precipitated during the cooling process at the low SiO2/CaO ratio. From DSC, the growth of existing crystals could occur at a low temperature. However, the new crystal needed to form a nucleus first, and then grow, so there was a significant difference in crystal sizes. For S2, the main crystal phase was still akermanite, so herringbone crystals could be seen in SEM image. The increase in the SiO2/CaO ratio stabilized the glass structure, so the grain size in S2 was more uniform than that in S1. The main crystal form of S3 was akermanite and diopside–wollastonite, so a variety of crystals could be clearly seen in the SEM image of S3. When the SiO2/CaO ratio was further increased, there was almost no akermanite in the sample, so the SEM mainly existed in the form of dendrites.

4. Conclusions

(1)
In the high-calcium CMAS systems, the type of crystals precipitated in the sample was closely related to Qn. When the ratio of SiO2/CaO was 0.98, the main forms of Qn were Q0 and Q1 (main units). At this time, only akermanite was precipitated. As the ratio of SiO2/CaO increased, the main forms of Qn changed from Q0 and Q1 (main units) to Q1 (main units) and Q2. The sample began to precipitate diopside–wollastonite. When the SiO2/CaO ratio was greater than 1.6, the main existing form of the silicon-oxygen tetrahedron changed from Q1 (main units) and Q2 to Q1 and Q2 (main units). At this time, akermanite in the sample disappeared, and only diopside–wollastonite was precipitated.
(2)
A low SiO2/CaO ratio reduced the stability of the glass, and caused rapid crystallization during the melt–cooling process in high-calcium CMAS systems. As the ratio of SiO2/CaO increased, the anionic groups in the glass changed from a low polymerization degree to a high polymerization degree. The glass stability was obviously improved. The crystallization peak temperature of the sample continuously increased, and the crystallization kinetic constant k and the frequency factor υ gradually decreased.
(3)
In high-calcium CMAS systems, the rapid crystallization problem in the cooling process, caused by low SiO2/CaO, caused significant differences in grain size. As the ratio of SiO2/CaO increased, the homogeneity of the crystal improved, and the crystal changed from herringbone shape (akermanite) to dendritic shape (diopside–wollastonite).

Author Contributions

Conceptualization, M.Z. and L.C.; methodology, H.W. and L.C.; formal analysis, L.C. and Y.L.; resources, L.C. and H.W.; data curation, Y.L.; writing—original draft preparation, L.C.; writing—review and editing, M.Z. and Y.L.; project administration, H.W.; funding acquisition, M.Z. All authors have read and agreed to the published version of the manuscript.

Funding

This research received no external funding.

Conflicts of Interest

The authors declare no conflict of interest.

References

  1. Linrui, D. Ultilization of Silicomanganese Slag in Building Materials. China’s Manganese Ind. 2017, 35, 136–138. [Google Scholar]
  2. Heo, J.H.; Chung, Y.; Park, J.H. Effect of CaF2 Addition on the Silicothermic Reduction of MnO in Ferromanganese Slag. Metall. Mater. Trans. B 2015, 46, 1154–1161. [Google Scholar] [CrossRef]
  3. Li, X.; Tang, K.; Tangstad, M. Reduction and Dissolution Behaviour of Manganese Slag in the Ferromanganese Process. Minerals 2020, 10, 97. [Google Scholar] [CrossRef] [Green Version]
  4. Ji, J.; Liu, X.; Nie, J.; Zhang, S.; Wang, M.; Nie, W. Application status and development trend of silico-manganese slag in construction materials field. China Metall. 2018, 28, 1–4. [Google Scholar]
  5. Choi, S.; Kim, J.; Oh, S.; Han, D. Hydro-thermal reaction according to the CaO/SiO2 mole-ratio in silico-manganese slag. J. Mater. Cycles Waste Manag. 2015, 19, 374–381. [Google Scholar] [CrossRef]
  6. Meng, X.Z.Z.; Wang, B. On Industry Research of Mn-silicon Alloy. China’s Manganese Ind. 2018, 36, 6–9. [Google Scholar]
  7. Song, Y.X.; Lan, S.D.; Di, J.H.; Jiang, B.Q. Present situation and development trend of comprehensive utilization of ferroalloy slag in China. China Metall. 2017, 27, 73–77. [Google Scholar]
  8. Lizhu, W.Y.L.; Jun, W.; Meng, Z.; Zhe, Z. Research status of comprehensive utilization of water-quenched manganese slag in building materials. Dev. Guide Build. Mater. 2017, 15, 75–77. [Google Scholar]
  9. Frías, M.; Rojas, M.I.S.d.; Rodríguez, C. The influence of SiMn slag on chemical resistance of blended cement pastes. Constr. Build. Mater. 2009, 23, 1472–1475. [Google Scholar] [CrossRef]
  10. Han, Y.; Jia, X.; Liu, F.; Deng, L.; Zhang, X. Effect of Cr2O3 content on high-temperature dielectric properties and crystallisation of CMAS glass-ceramics. Mater. Res. Express 2019, 6, 075213. [Google Scholar] [CrossRef]
  11. Guo, X.; Cai, X.; Song, J.; Yang, G.; Yang, H. Crystallization and microstructure of CaO-MgO-Al2O3-SiO2 glass-ceramics containing complex nucleation agents. J. Non-Cryst. Solids 2014, 405, 63–67. [Google Scholar] [CrossRef]
  12. Deng, L.; Yun, F.; Jia, R.; Li, H.; Jia, X.; Shi, Y.; Zhang, X. Effect of SiO2/MgO ratio on the crystallization behavior, structure, and properties of wollastonite-augite glass-ceramics derived from stainless steel slag. Mater. Chem. Phys. 2020, 239, 122039. [Google Scholar] [CrossRef]
  13. Zhao, M.; Cao, J.; Wang, Z.; Li, G. Insight into the dual effect of Fe2O3 addition on the crystallization of CaO-MgO-Al2O3-SiO2 glass-ceramics. J. Non-Cryst. Solids 2019, 513, 144–151. [Google Scholar] [CrossRef]
  14. Sycheva, G.A.; Polyakova, I.G.; Kostyreva, T.G. Volumetric nucleation of crystals catalyzed by Cr2O3 in glass based on furnace slags. Glass Phys. Chem. 2016, 42, 238–245. [Google Scholar] [CrossRef]
  15. Tong, Z.; Sun, J.; Wang, J.; Tan, Z.; Liu, S. Iron reduction and diopside-based glass ceramic preparation based on mineral carbonation of steel slag. Environ. Sci. Pollut. Res. Int. 2021, 28, 796–804. [Google Scholar] [CrossRef]
  16. Bai, Z.; Qiu, G.; Yue, C.; Guo, M.; Zhang, M. Crystallization kinetics of glass-ceramics prepared from high-carbon ferrochromium slag. Ceram. Int. 2016, 42, 19329–19335. [Google Scholar] [CrossRef] [Green Version]
  17. Ljatifi, E.; Kamusheva, A.; Grozdanov, A.; Paunović, P.; Karamanov, A. Optimal thermal cycle for production of glass-ceramic based on wastes from ferronickel manufacture. Ceram. Int. 2015, 41, 11379–11386. [Google Scholar] [CrossRef]
  18. Miao, X.; Bai, Z.; Qiu, G.; Tang, S.; Guo, M.; Cheng, F.; Zhang, M. Preparation of transparent Mn-doped CaF2 glass-ceramics from silicon-manganese slag: Dependence of colour-controllable change on slag addition and crystallization behaviour. J. Eur. Ceram. Soc. 2020, 40, 3249–3261. [Google Scholar] [CrossRef]
  19. Kang, J.; Wang, J.; Cheng, J.; Yuan, J.; Hou, Y.; Qian, S. Crystallization behavior and properties of CaO-MgO-Al2O3-SiO2 glass-ceramics synthesized from granite wastes. J. Non-Cryst. Solids 2017, 457, 111–115. [Google Scholar] [CrossRef]
  20. Zheng, W.; Sheng, L.; Chao, H.; Wang, Z.; Qian, S.; Peng, Z.; Shen, C. Crystallization of CaO-MgO-Al2O3-SiO2 by Float Process. Glass Phys. Chem. 2017, 43, 347–356. [Google Scholar] [CrossRef]
  21. Li, H.; Wang, C.; Yu, H.; Liang, X.; Yang, S. Effects of Calcium Oxide Addition on the Structure and Thermal Properties of Iron Phosphate Glasses. Spectrosc. Lett. 2015, 48, 184–189. [Google Scholar] [CrossRef]
  22. Jia, R.; Deng, L.; Yun, F.; Li, H.; Zhang, X.; Jia, X. Effects of SiO2/CaO ratio on viscosity, structure, and mechanical properties of blast furnace slag glass ceramics. Mater. Chem. Phys. 2019, 233, 155–162. [Google Scholar] [CrossRef]
  23. Wang, Y.; Gui, Y.; Song, C.; Xie, C.; Zhao, J. Effect of Mass Ratio of CaO to SiO2 on Crystallization of CaO-MgO-SiO2-Al2O3 Glass Ceramics. Multipurp. Util. Miner. Resour. 2018, 1, 137–141. [Google Scholar]
  24. Fu, Y.; Li, P.; Tao, H.; Zhang, L.; Xin, M.; Chang, Y.; Xia, Y.; Zhou, H. The effects of Ca/Si ratio and B2O3 content on the dielectric properties of the CaO–B2O3–SiO2 glass–ceramics. J. Mater. Sci. Mater. Electron. 2019, 30, 14053–14060. [Google Scholar] [CrossRef]
  25. Goj, P.; Stoch, P. Influence of CaO on structural features of polyphosphate P2O5-Fe2O3-FeO glasses by molecular dynamics simulations. J. Non-Cryst. Solids 2020, 537, 120014. [Google Scholar] [CrossRef]
  26. Jha, P.; Singh, K. Effect of Field Strength and Electronegativity of CaO and MgO on Structural and Optical Properties of SiO2-K2O-CaO-MgO Glasses. Silicon 2016, 8, 437–442. [Google Scholar] [CrossRef]
  27. Hanuza, J.; Ptak, M.; Mączka, M.; Hermanowicz, K.; Lorenc, J.; Kaminskii, A.A. Polarized IR and Raman spectra of Ca2MgSi2O7, Ca2ZnSi2O7 and Sr2MgSi2O7 single crystals: Temperature-dependent studies of commensurate to incommensurate and incommensurate to normal phase transitions. J. Solid State Chem. 2012, 191, 90–101. [Google Scholar] [CrossRef]
  28. Zeng, L.; Huang, S.; Lin, H.; Zhao, H.; Jiang, H.; Ma, Y. Effect of Mixed Alkali on the Structure and Thermal Expansion Properties of Li2O- Al2O3-SiO2 Glass. Bullet. Chinese Ceram. Soc. 2021, 40, 3813–3821. [Google Scholar]
  29. Silva, A.M.B.; Queiroz, C.M.; Agathopoulos, S.; Correia, R.N.; Fernandes, M.H.V.; Oliveira, J. Structure of SiO2-MgO-Na2O glasses by FTIR, Raman and 29Si MAS NMR. J. Mol. Struct. 2011, 986, 16–21. [Google Scholar] [CrossRef]
  30. Duer, M.J.; Elliott, S.R.; Gladden, L.F. An investigation of the structural units in sodium disilicate glass: A 2-D 295i NMR study. J. Non-Cryst. Solids 1995, 189, 107–117. [Google Scholar] [CrossRef]
  31. Elgayar, I.; Aliev, A.E.; Boccaccini, A.R.; Hill, R.G. Structural analysis of bioactive glasses. J. Non-Cryst. Solids 2005, 351, 173–183. [Google Scholar] [CrossRef]
  32. Zhang, X.; Hu, L.; Ren, J. Structural Studies of Rare Earth-Doped Fluoroborosilicate Glasses by Advanced Solid-State NMR. J. Phys. Chem. C 2020, 124, 8919–8929. [Google Scholar] [CrossRef]
  33. Zhidong, W.; Jinglin, Y.; Jian, W.; Min, W.; Yingxia, H.; Yejin, Y. NMR Spectroscopic Study on Binary Sodium Silicate Glass Based on the Fine Structure. Chem. J. Chin. Univ. 2019, 40, 108–114. [Google Scholar]
  34. Li, H.; Liu, S.; Xu, W.; Zhang, Y.; Li, X.; Ouyang, S.; Zhao, G.; Liu, F.; Wu, N. The Effect of Microwave on the Crystallization Behavior of CMAS System Glass-Ceramics. Materials 2020, 13, 4555. [Google Scholar] [CrossRef] [PubMed]
  35. Liu, S.; Chen, Y.; Ouyang, S.; Li, H.; Li, X.; Li, B. Microstructural transformation of stainless steel slag-based CAMS glass ceramics prepared by SPS. Ceram. Int. 2021, 47, 1284–1293. [Google Scholar] [CrossRef]
  36. Zhang, L.; Huang, X.; Song, X. Fundamentals of Materials Science; Wuhan University of Technology Press: Wuhan, China, 2008. [Google Scholar]
  37. Kissinger, H.E. Analytical Chemistry; National Bureau of Standards: Washington, DC, USA, 1957.
  38. Deng, L.; Wang, S.; Zhang, Z.; Li, Z.; Jia, R.; Yun, F.; Li, H.; Ma, Y.; Wang, W. The viscosity and conductivity of the molten glass and crystallization behavior of the glass ceramics derived from stainless steel slag. Mater. Chem. Phys. 2020, 251, 123159. [Google Scholar] [CrossRef]
  39. Cheng, J.; Kang, J.; Lou, X.; Wu, H.; Liu, K. Effect of Nucleation Temperature on the Crystallization Behavior of Glass-ceramics. J. Wuhan Univ. Technol. 2014, 36, 1–5. [Google Scholar]
  40. Hu, L.; Jiang, Z. A New Criterion for Crystallization Of Glass. Bull. Chin. Ceram. Soc. 1990, 18, 315–321. [Google Scholar]
  41. Schneider, J.; Mastelaro, V.; Panepucci, H.; Zanotto, E. 29Si MAS-NMR studies of Qn structural units in metasilicate glasses and their nucleating ability. J. Non-Cryst. Solids 2000, 273, 8–18. [Google Scholar] [CrossRef]
  42. Davis, M.C.; Sanders, K.J.; Grandinetti, P.J.; Gaudio, S.J.; Sen, S. Structural investigations of magnesium silicate glasses by 29Si 2D Magic-Angle Flipping NMR. J. Non-Cryst. Solids 2011, 357, 2787–2795. [Google Scholar] [CrossRef]
Figure 1. XRD patterns of quenched samples with different SiO2/CaO ratios.
Materials 15 00657 g001
Figure 2. Infrared spectra of S1–S5.
Materials 15 00657 g002
Figure 3. 29Si NMR spectra of S1–S5.
Materials 15 00657 g003
Figure 4. (ae) Typical deconvolution of 29Si NMR spectra for S1–S5. (f) Relative peak-area ratio of different Qn changes with the SiO2/CaO ratio.
Materials 15 00657 g004
Figure 5. DSC curves of (a) S1 and (b) S2–S5 at heating rate of 10 °C/min.
Materials 15 00657 g005
Figure 6. (a) Relationship between ln   ( T p 2 / α ) and 1000 / ( R × T p ) , relationship between SiO2/CaO ratio with Ec (b), k (c), υ (d).
Materials 15 00657 g006
Figure 7. (a) XRD patterns of S1–S5 crystallized at 950 °C for 1 h. (b) XRD patterns of the S3 heated at different temperatures for 1 h.
Materials 15 00657 g007
Figure 8. The correlation between Qn and basic silicate structural units.
Materials 15 00657 g008
Figure 9. (ae) SEM images of S1–S5 treated at 950 °C for 1 h. (f) TEM image of S1 quenched by water.
Materials 15 00657 g009
Table 1. Oxide composition of main materials (wt %).
MaterialLOSSSiO2Al2O3CaOMgOFe2O3MnO
Ferromanganese slag0.2740.874.4641.786.870.263.99
Bauxite12.8334.8443.520.760.292.610.04
Table 2. Oxide composition of glass ceramics.
SampleSiO2/CaOAl2O3SiO2CaOMgOFe2O3MnO
S10.984.540.941.86.90.264.0
S21.204.545.1137.596.90.264.0
S31.404.548.2434.466.90.264.0
S41.604.550.8931.816.90.264.0
S51.804.553.1629.536.90.264.0
Table 3. Characteristic vibrations of CAMS glass.
Wavenumber/cm−1Corresponding Characteristic Vibration
430~550Bending vibration of Si-Ob-Si
520The Al-O bending vibration in [AlO6]
700The Al-O bending vibration in [AlO4]
760Symmetric stretching vibration of Si-Ob-Si
780~800Symmetric bending vibration of O-Si-O
950Anti-symmetric stretching vibration of Si-Onb
1020~1060Anti-symmetric stretching vibration of Si-Ob-Si
Table 4. T p   of S1–S5 at different heating rates.
Sample T p / ° C · min 1
5 °C·min−110 °C·min−115 °C·min−120 °C·min−1
S1882.8899.2909.1914.2
S2870.3891.4902.1909.3
S3905.6927.4941.7952.8
S4912.7934.2951.9960.1
S5915.4937.8957.1965.8
Publisher’s Note: MDPI stays neutral with regard to jurisdictional claims in published maps and institutional affiliations.

