1. Introduction
The research and development of Accident Tolerant Fuel (ATF) cladding materials were raised by the Fukushima nuclear accident in Japan due to nuclear safety concerns [
1,
2,
3]. Such materials are used to reduce the oxidation rate of cladding tubes in high-temperature steam by forming protective oxide films such as Cr
2O
3, Al
2O
3 or SiO
2, and thus greatly suppress the generation of hydrogen and delay the heating load on the reactor core during severe accidents [
4,
5]. Two main material approaches to form ATF claddings were proposed. The first one consists of developing brand-new ATF claddings to substitute for Zr alloys, such as SiC
f/SiC composites [
6,
7], FeCrAl stainless steels [
8,
9], Mo alloys [
10,
11], and MAX phases [
12,
13]. The second approach, referred to as ATF-coated cladding, is to prepare coatings on the existing Zr alloy claddings, which is the most promising for engineering implementation within the short term. Consequently, many coatings such as Cr and Cr-based alloys [
14,
15,
16], nitride ceramics [
17,
18,
19], FeCrAl alloys [
20,
21,
22] and MAX phase ceramics [
23,
24,
25] are used worldwide. Among them, Cr coatings show resistance to pressurized-water corrosion [
26,
27], friction and wear [
16,
28], high-temperature steam oxidation [
29,
30,
31,
32] and ion or neutron irradiation [
33,
34,
35,
36], and hence become the most promising candidate for advanced ATF cladding coatings. At present, the most important task for the development of pure Cr coatings on Zr alloy claddings is to precisely control the coating to meet the requirements of engineering design.
Engineering feasibility of coating methods should be based on the general considerations as follows: (i) the coating has high compactness with minimal pores and good adhesion with the substrate; (ii) it has little influence on the substrate without significant changes to the grain sizes and chemical composition, introducing no inclusions of second phase or hydrides, etc.; (iii) the coating process is easy to practice, the uniform coating deposition on long-size tubes is feasible, and the coating quality is controllable. Up to date, representative institutions and companies, including the CEA/Framatome/Areva from France, the KAERI from South Korea and UW-Madison/Westing house from the United States, have been committed to the engineering development of Cr-coated Zr alloys tubes. However, their coating technologies are different due to possible issues involved with intellectual property (patents). For example, the French companies mainly adopted high ionization-rate pulsed magnetron sputtering technology (HIPMS) [
16,
28], the Korean institute chose a 3D laser melting and coating technology (3D-LMC) [
37,
38], and the Americans applied the cold spraying technology (CS) [
39,
40]. A detailed description of these coating technologies can be found in the earlier published review papers [
41,
42]. Meanwhile, the Nuclear Power Institute of China (NPIC) prefers to use the arc ion plating (AIP) technology that also met the coating requirement.
Although it was confirmed that the performances of Cr-coated Zr alloys were improved to some extent as compared to uncoated Zr alloys, differences in the coating methods and parameters were indeed existent and played important roles in their use. For example, grains of CS Cr coatings were presented with large plastic deformation, leading to enhanced irradiation stability as compared to annealed Cr coatings [
43]. The mechanical strength of 3D-LMC Cr-coated Zr-4 tubes was higher than that of Cr-coated Zr alloys prepared by other methods due to the formation of martensite structures from a rapid solidification process [
38]. Cr coatings prepared by atmospheric plasma spraying (APS) were reported with structural porosity, resulting in inner oxidation of the coatings at high temperatures [
44]. Furthermore, a study evaluating the use of AIP and magnetron sputtering (MS) preparation indicated that more holes/cavities were located on the surfaces of MS Cr coatings with cracking evident after air oxidation at 800 °C [
45]. Kashkarov et al. [
46] prepared a 4.5 μm thick Cr coating with a dense and fine-grain structure by arc-magnetron sputtering and with better resistance to high-temperature steam oxidation than that of comparative samples (6–9 μm thick coatings with coarser columnar crystal) prepared by no-arc magnetron sputtering. Furthermore, the differences in the processing parameters of the same method show great differences in high-temperature oxidation resistance [
47,
48,
49,
50]. Our recent studies found that increases in the (110) preferred orientation of the AIP Cr coatings resulted in a decrease in the size and number of cavities during Au
+ ion irradiation (up to 20 dpa) [
34]. Our ongoing research also indicates that different process parameters in the same technology would affect both the resistance to coating cracking in mechanical tests and the degradation behavior of the Cr coatings during high-temperature oxidation.
Up to now, the control of Cr coatings has been performed by studying the effects of deposition parameters on their microstructures, such as surface droplet particles, crystal preferred orientation, grain structures, etc. [
47,
48,
49,
50,
51,
52,
53,
54]. However, these studies only compared single factor variables and could not distinguish between experimental error and the influence of various parameters. This leads to a lack of systematic guidance for engineering practice. Therefore, facing massive data in microstructures, coating properties and depositing parameters, the orthogonal analysis commonly used as an experiment simplification technique is a good way to deal with the influence of various parameters [
55], especially in shifting from small-sized samples to big engineering workpieces in a reliable manner.
In this work, the L9(34) orthogonal tests were used to prepare samples of 1400 mm-long Cr-coated N36 cladding tubes in an industrial multiple arc source system. Large amounts of statistical data based on the orthogonal tests were analyzed to clarify the influence of orthogonal processing parameters on the intrinsic characteristics of coatings, including thickness distribution, deposition rate, surface roughness, defects (droplet particles and pores), and crystal and grain structure. The involved mechanisms are also carefully discussed. This systemic study is believed to be significant for the further development and optimization of full-size Cr-coated Zr alloy claddings by arc ion plating.
2. Materials and Methods
2.1. Materials
The substrates used were N36 alloy (a novel zirconium alloy developed by NPIC) tube segments (1400 mm) with a nominal composition of Zr-1Nb-1Sn-0.3Fe. These segments were cut from the “full-length” (4000 mm) cladding tubes with an outer diameter of 9.5 mm and a wall thickness of 0.57 mm. The surfaces of these tubes were mechanically polished and the grains were recrystallized. The raw materials for deposition of Cr coatings were Cr targets with a purity ≥99.95% (Shanghai Boyi). Ultra-pure (≥99.999%) Ar (Shanghai Yuanyang) was used as the gas during the deposition process.
Prior to use, N36 tubes underwent multiple ultrasonic cleaning and rinsing using an environmentally friendly agent (Shanghai Bo’er, mainly composed of potassium hydroxide and 2-aminoethanol) and ultra-pure water, respectively. After this, the inner and outer surfaces of tubes were dried with compressed air and kept for storage. Before deposition, the outer surfaces of tubes were repeatedly wiped with dust-free clothes dipped in absolute ethanol (analytically pure CH3CH2OH, Zhejiang Tengyu) and purged with compressed air to remove the floating dust off the surface.
2.2. Coating Preparation
For deposition of Cr coatings on N36 cladding tubes by AIP method, industrial multi-arc ion plating equipment with a vertical side-door configuration, shown in
Figure S1 (in Supplementary Materials), was used. This facility is equipped with 16 asymmetric arc sources arranged in 4 columns (including magnetic systems and cathode targets connected to the arc current power sources). The target–substrate distance is ~200 mm and the effective deposition length is 1400 mm. Cladding tubes were placed in the deposition chamber with two ends inserted into the sleeves on the stations located in the outer ring of a two-stage rotating frame (connected to the bias power source). By this frame, the workpieces could be rotated around their axes, while the frame itself rotated with a constant velocity to ensure circumferential uniformity of deposition.
Figure S2 (in Supplementary Materials) shows the coating fabrication process. After loading tubes, the deposition chamber was evacuated to a pressure of 5.0 × 10
−3 Pa. The moisture and air remaining in the chamber walls and cladding tubes were then removed by heating up to the desired temperature. When the pressure was restored back to 5.0 × 10
−3 Pa, plasma treatment was applied to further clean and activate the surfaces of Zr alloys. This process was carried out at the negative bias voltages of −(700–900) V and a constant gas pressure of 1.2 Pa, respectively.
Cr coatings were deposited in two stages. The initial (priming) stage was carried out to generate a basic layer at negative bias voltages decreasing steply from −400, −300 to −200 V (each step for 5 min), a gas pressure of 0.6 Pa and an arc current of 90 A. In this process, a strong ion bombardment effect induced by high negative bias voltages and low gas pressure can cause the incident ions “pin” into the substrate. In the second stage, the negative bias voltage was reduced to the required value for a smooth transition to the following steady-state deposition, during which the parameters were kept fixed. In this work, the effects of four key parameters during steady-state deposition, namely heating temperature, arc current, negative bias voltage and gas pressure, were investigated.
It should be noted that the heating temperature during coating deposition should not exceed the recrystallization point of the Zr alloys (500–580 °C) to avoid the impact of the coating preparation process on the microstructure and properties of the substrates. Taking into account that arc evaporation and ion bombardment effects during AIP deposition cause a 70–130 °C rise in environment and substrate temperature, the heating temperature should be maintained below 400 °C. The other values were selected empirically based on the process parameters for preparing pure metal coatings by the AIP equipment used. For example, arc discharge could not be ignited successfully with an arc current (<50 A) or a gas pressure (<0.3 Pa) that was too low. Oppositely, an arc current that was too high (>180 A) would lead to an undesirable rise in temperature and an obvious degradation of the coating surface quality; a gas pressure (>2.5 Pa) that was too high would result in the instability of the arc spots, which may damage the cathode components once the arc spots move apart from the range of target materials. Moreover, the bias voltage was applied to improve the coating compactness. However, a bias voltage that is too high (>−200 V) would introduce high growth stress, leading to the peeling of thick coatings during deposition. Based on the above considerations, the samples were prepared at the parameters of L9(3
4) orthogonal experiments, as shown in
Table 1. The deposition time of each orthogonal test was 10 h.
2.3. Characterization
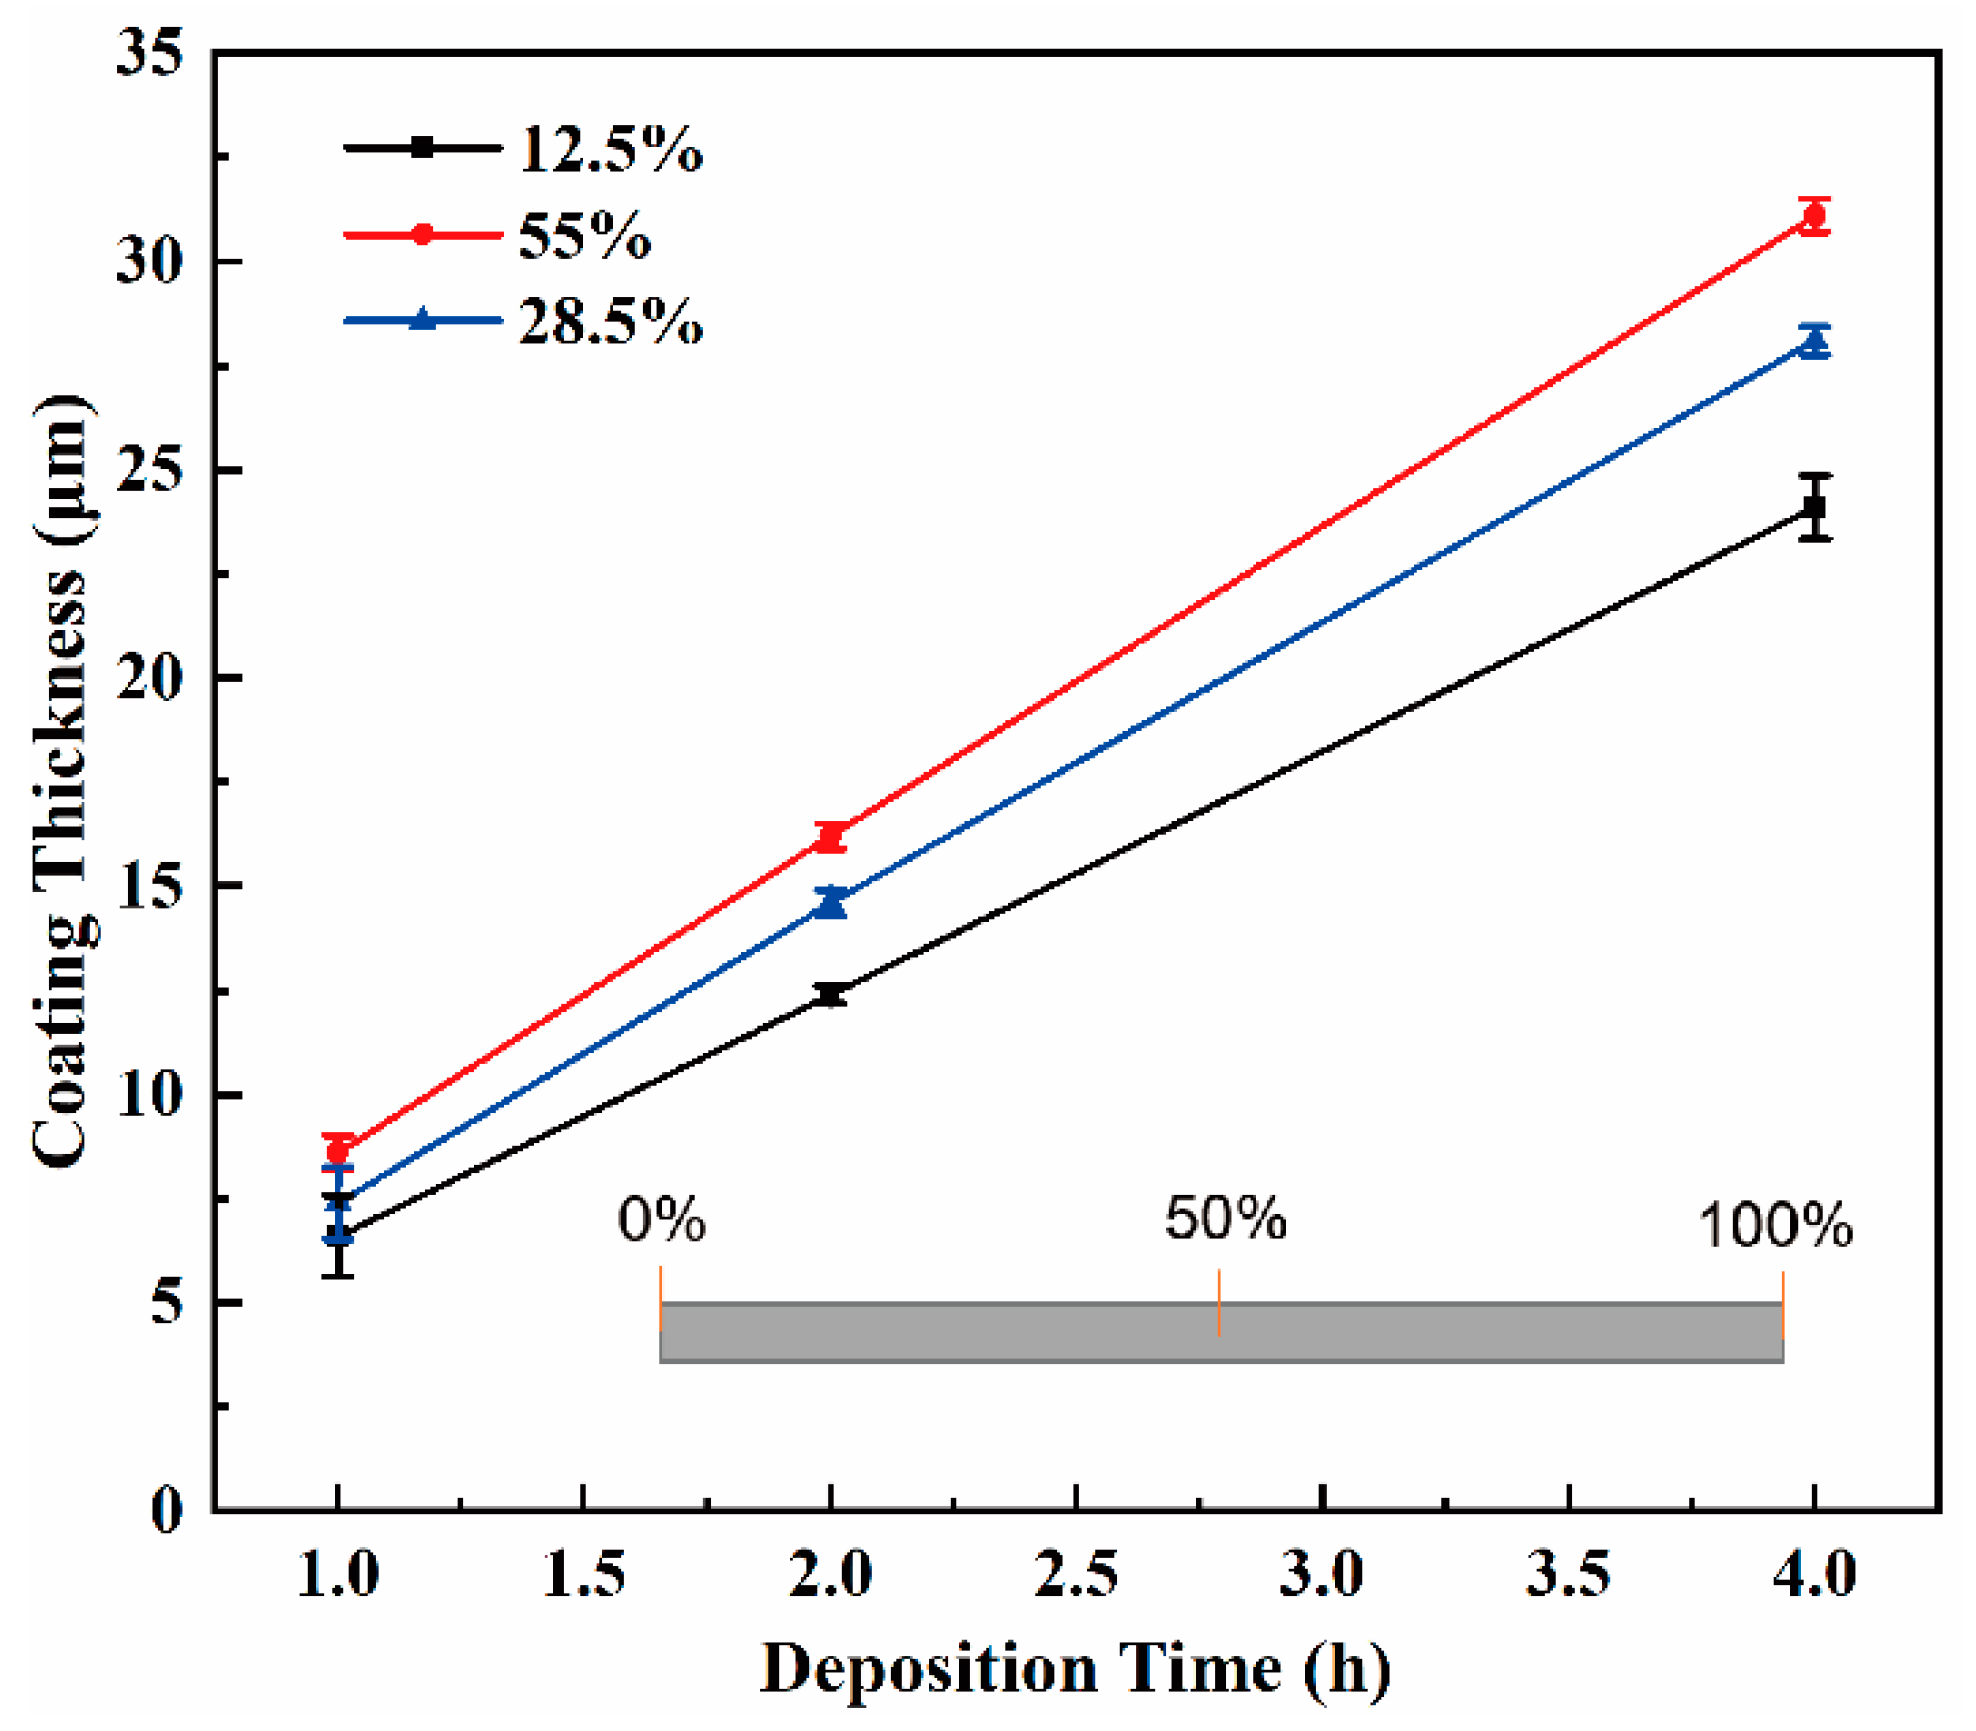
The coating thickness was measured from the cross-sectional images of Cr-coated N36 tube samples taken by optical microscopy (OLYMPUS OLS4000). The measurement details are illustrated in
Figure S3 (in Supplementary Materials). The total cross-sectional images were 25 per sample. The mean thickness values were calculated by averaging the measurement results obtained in three random points at each circumferential position.
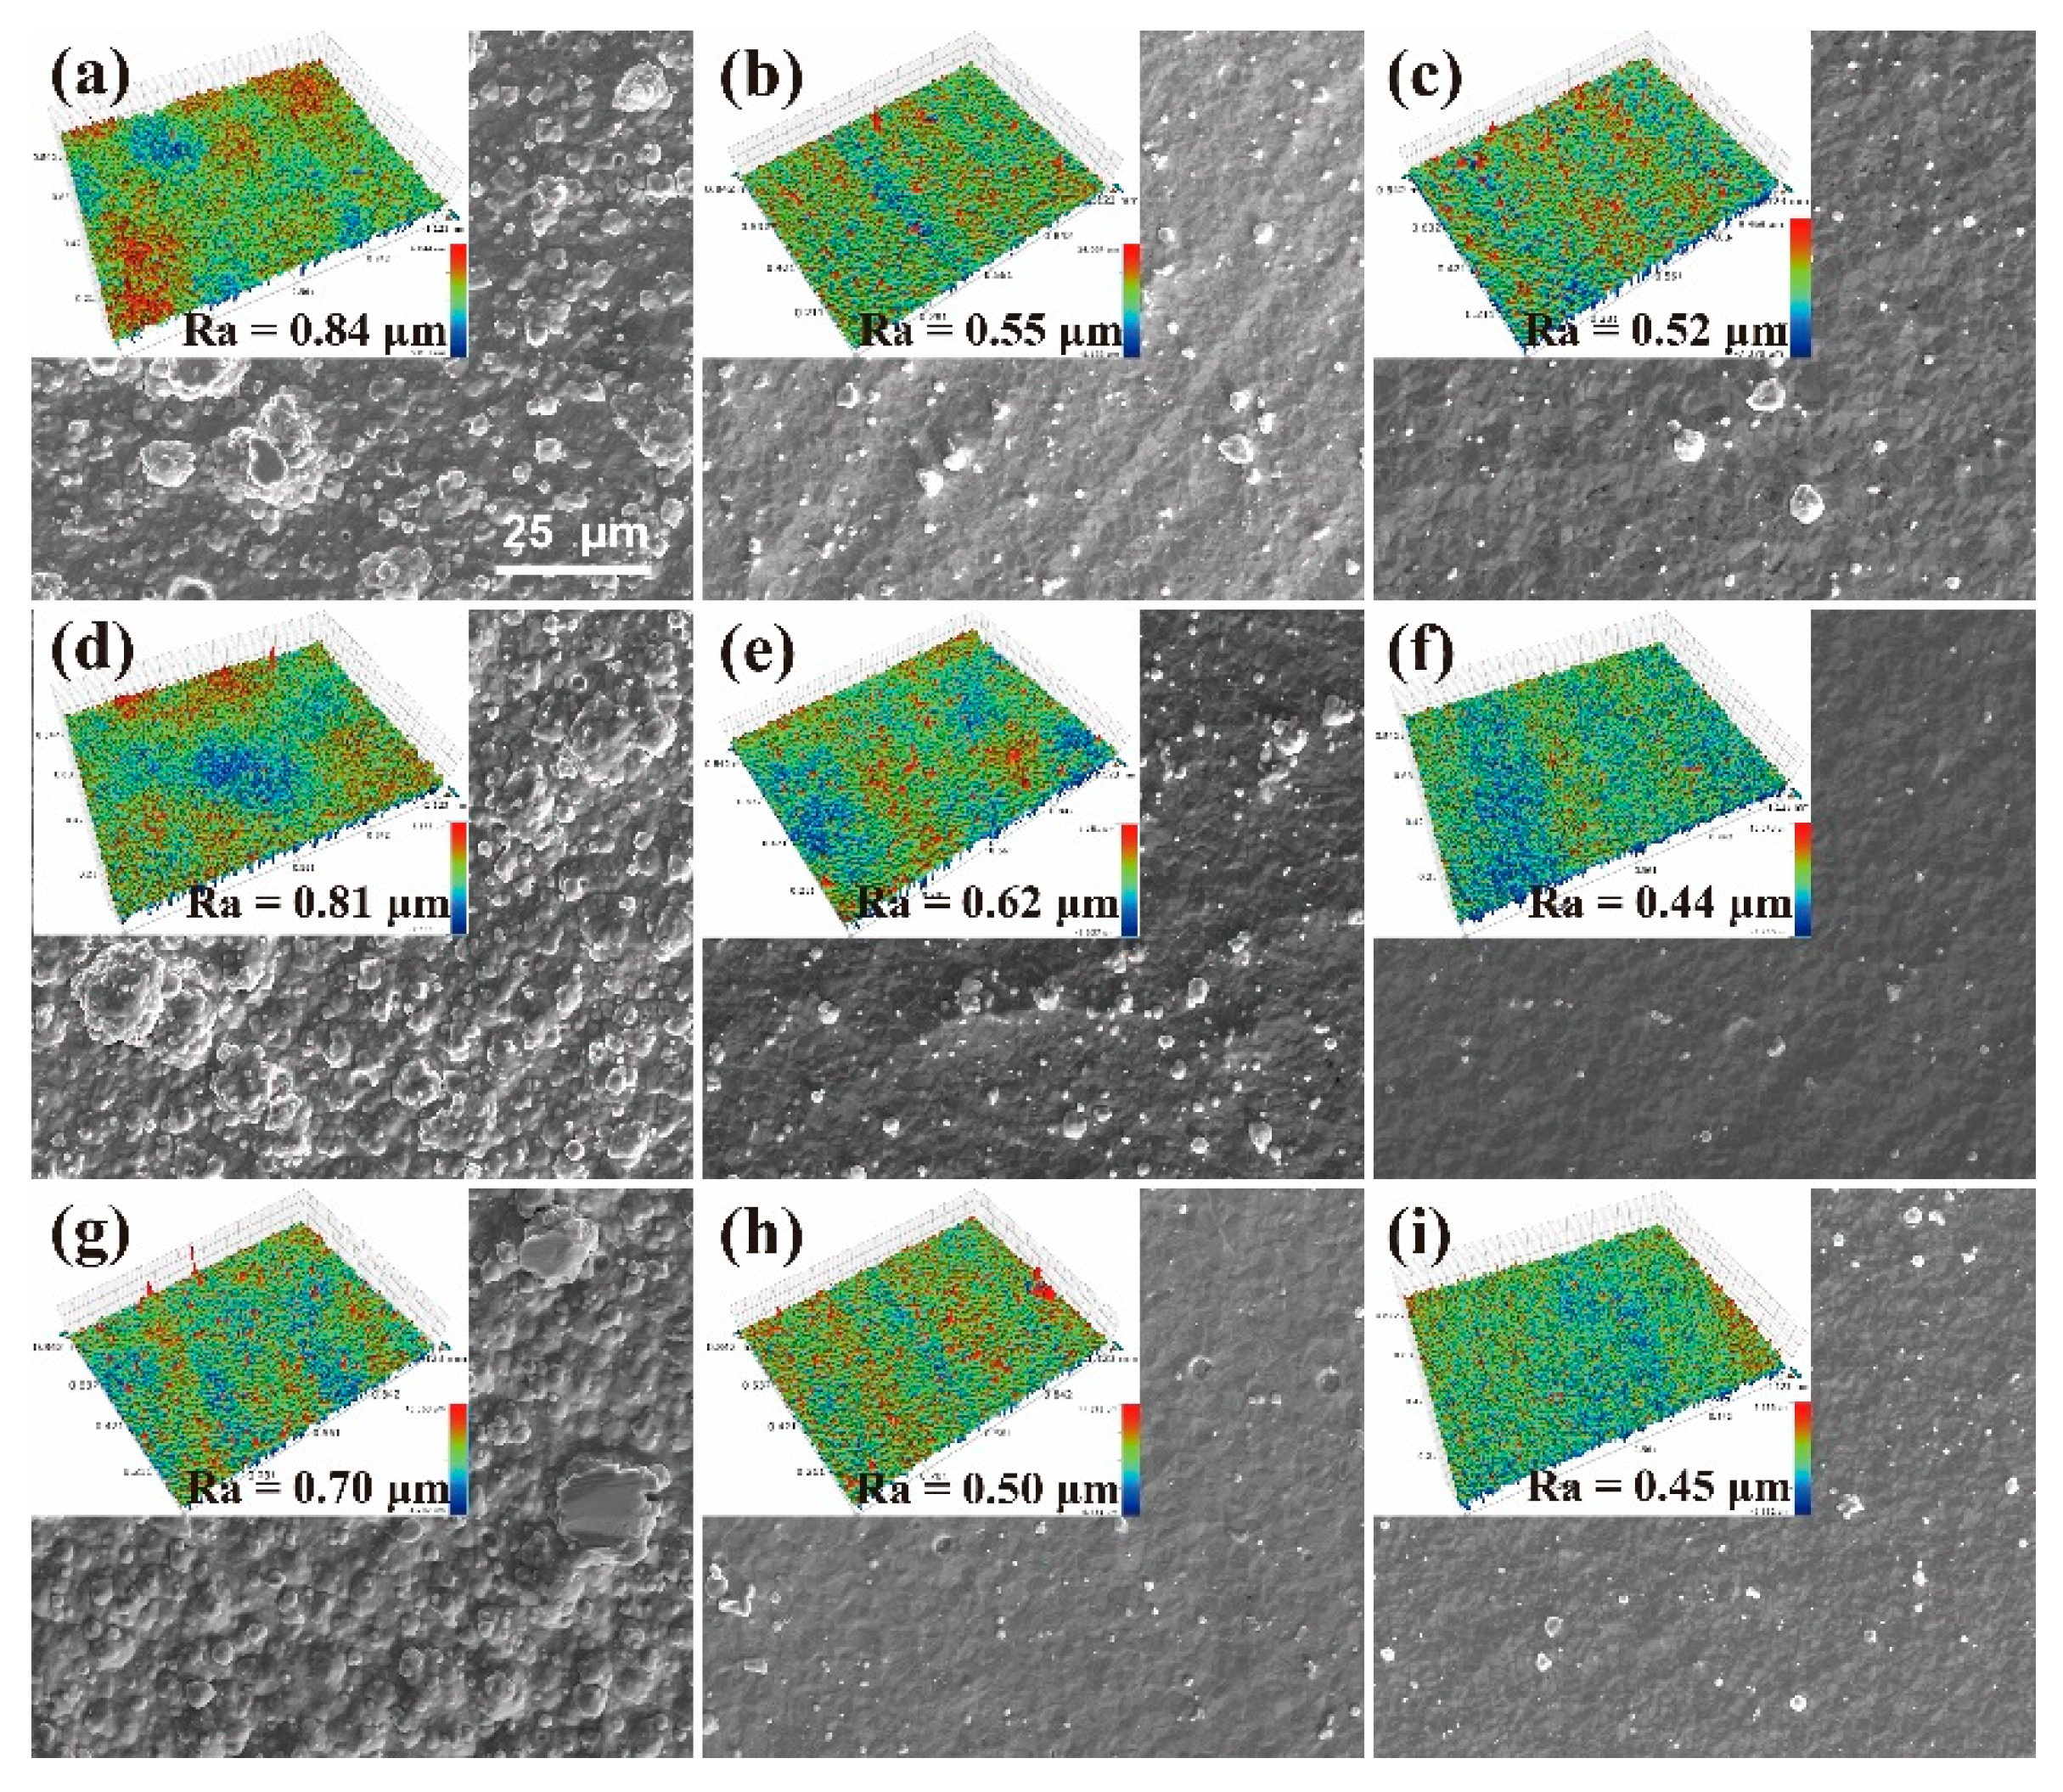
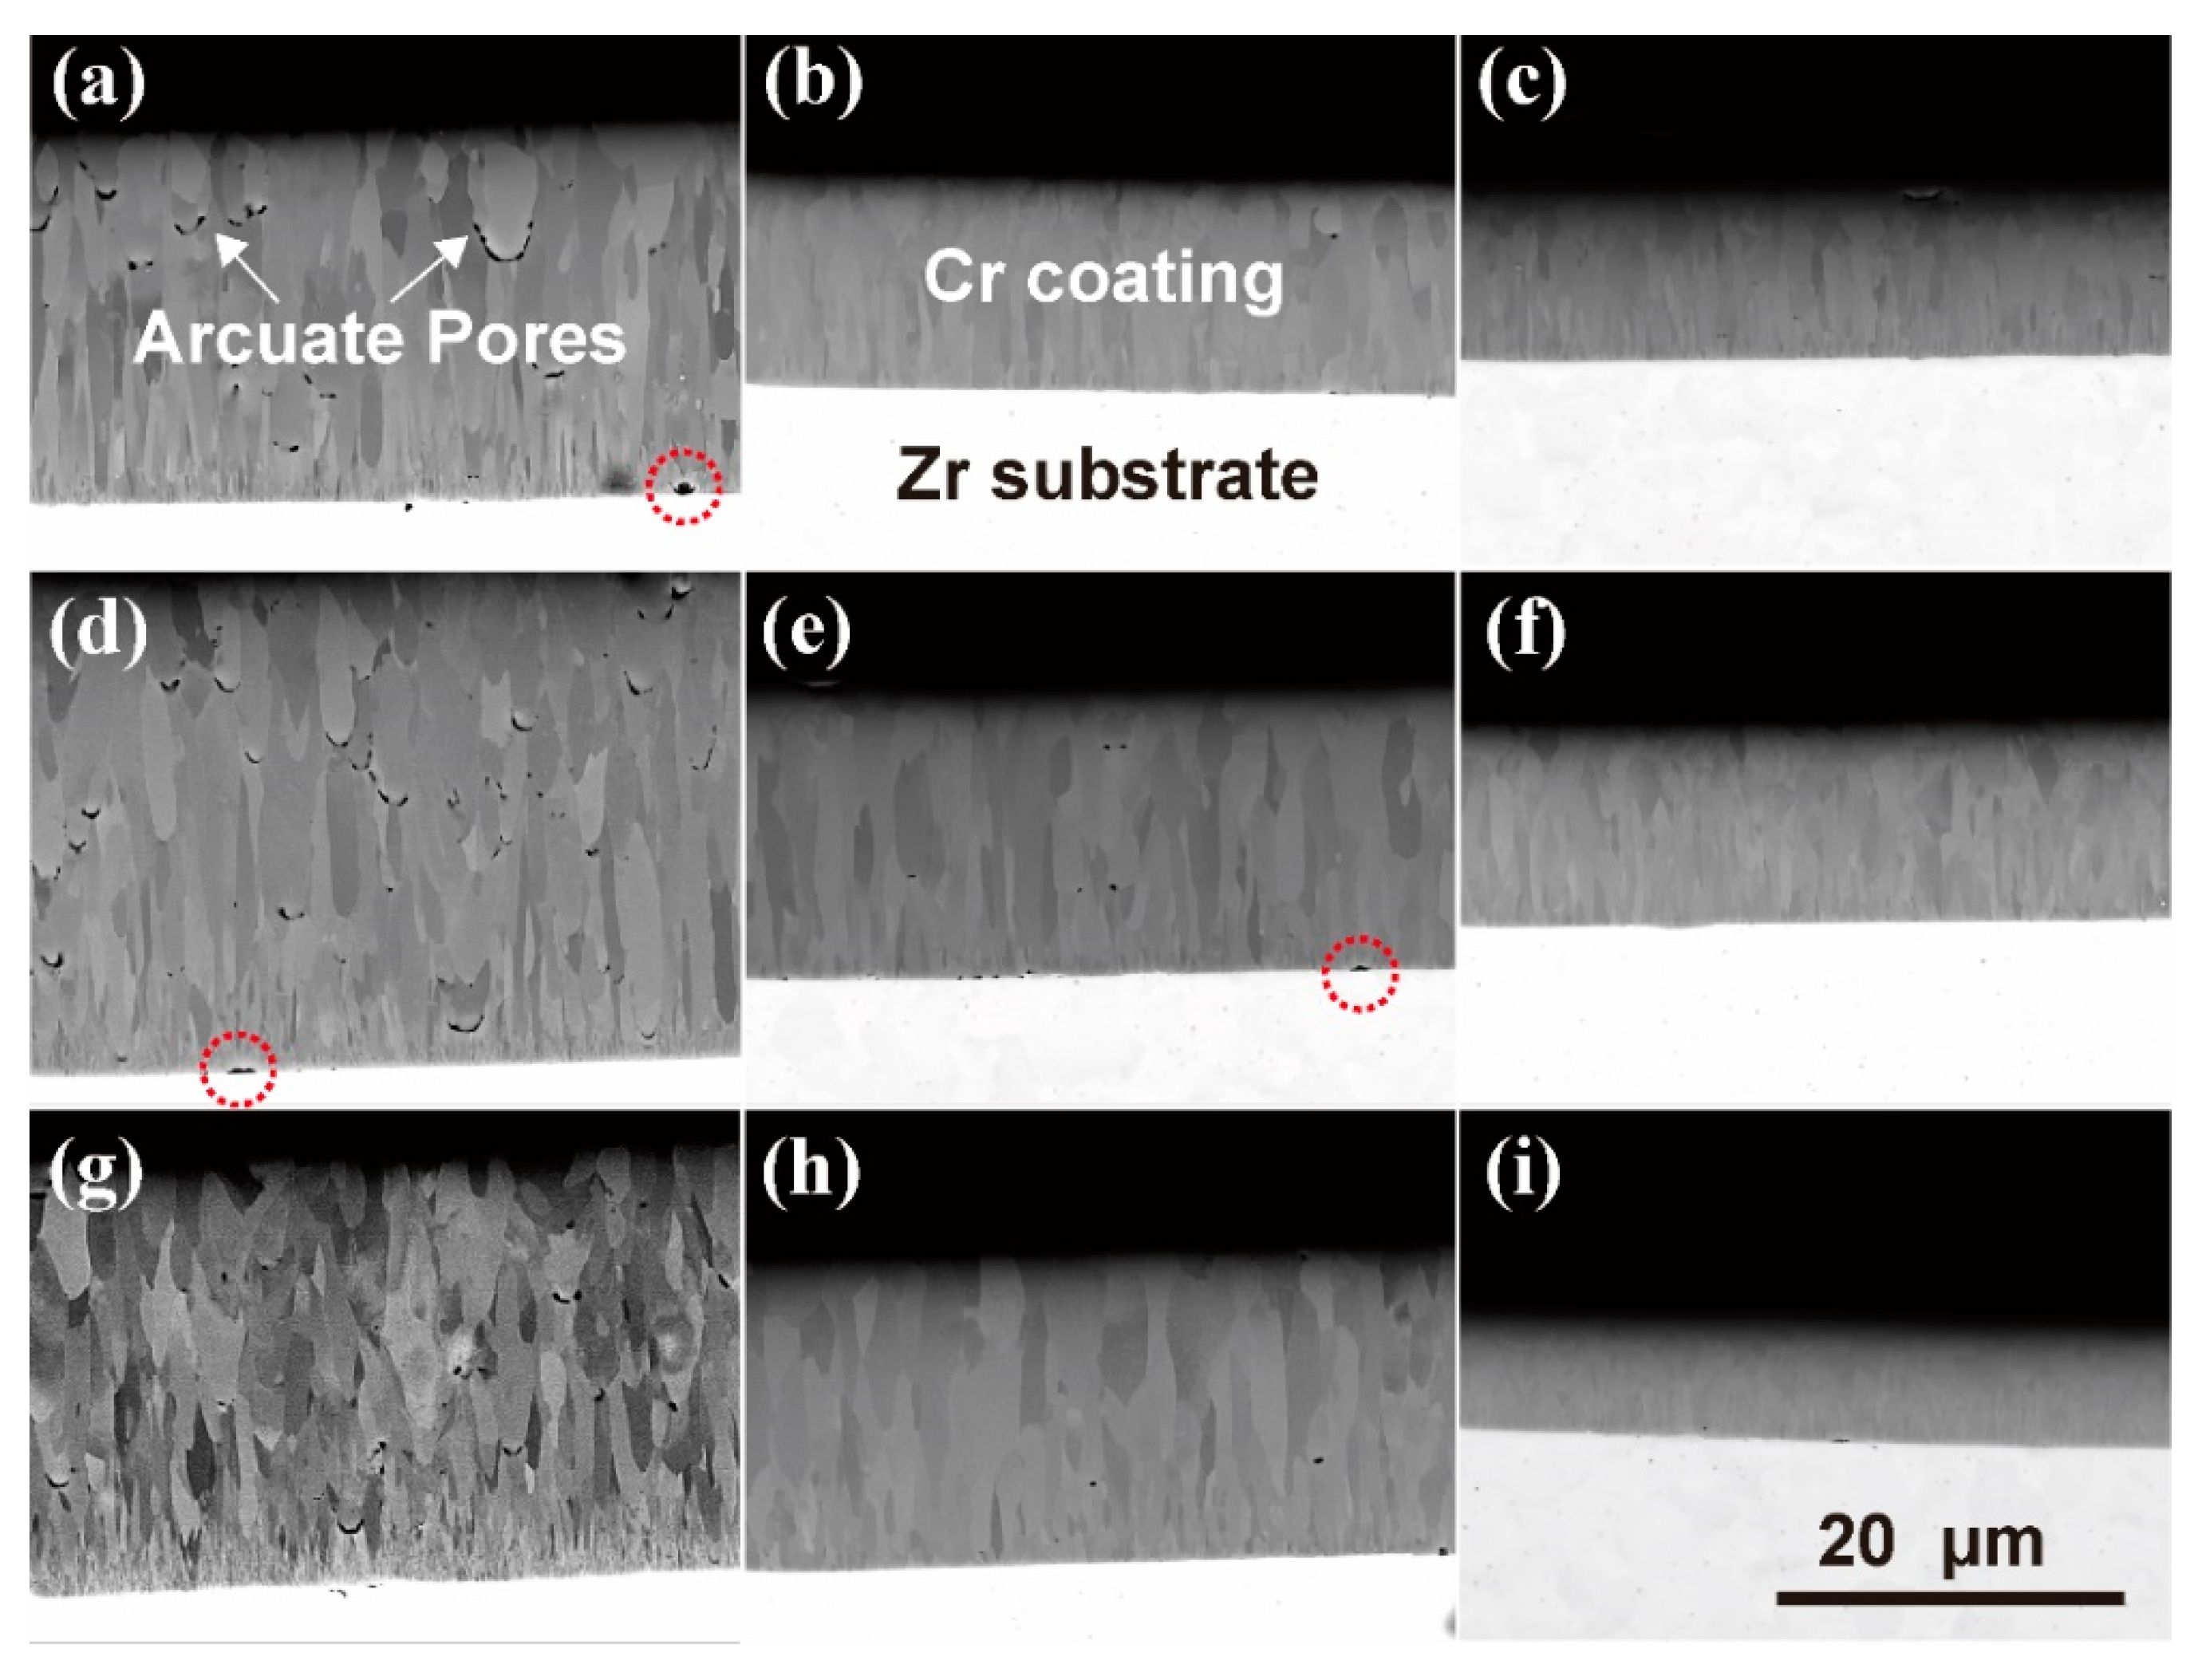
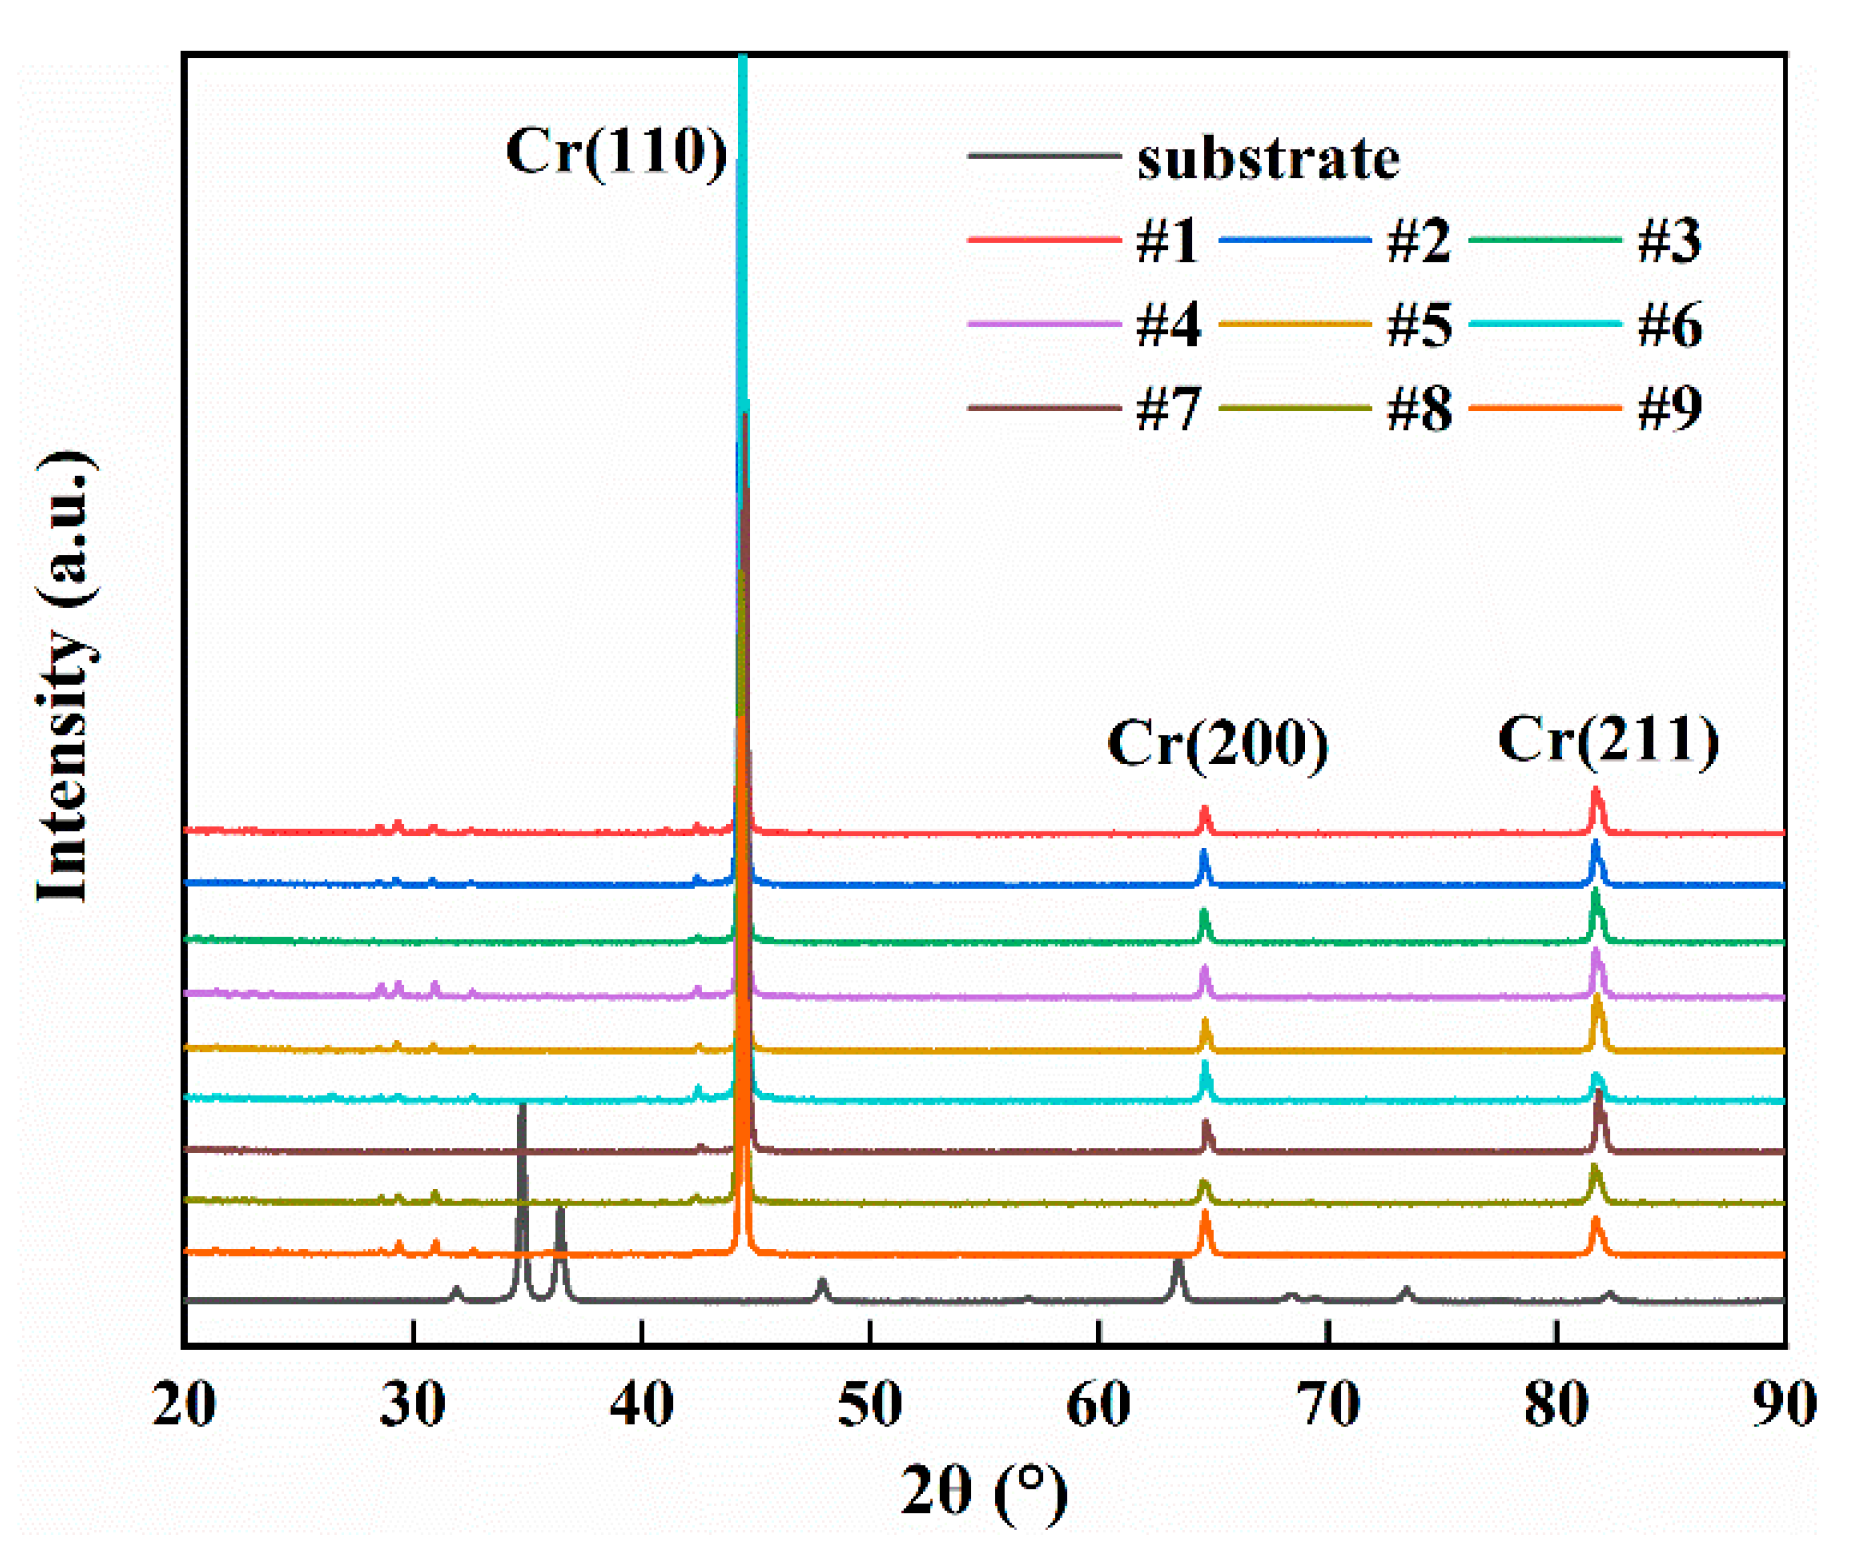
The three-dimensional (3D) profiles of Cr-coated surfaces and the surface roughnesses were measured by white light interferometer (BRUKER Contour GT-K1). The crystal structures of coatings were characterized by X-ray diffraction (XRD, PANalytical Empyrean). The micro-morphologies of the coating surface and cross-section were observed by scanning electron microscope (SEM, FEI NOVA NanoSEM 400). The sizes and the number of droplet particles on the coating surface were determined from SEM images using the Image J software.
Electron backscatter diffraction (EBSD) was used to obtain the grain structure patterns of the Cr coatings and Zr alloy substrates from polished cross-sectional samples of Cr-coated N36 tubes. The surfaces of cross-sectional samples were treated by using vibrational or ion-beam polishing to eliminate residual surface stress. Before the EBSD examination, a coordinate system for the tube sample was defined using three directions, which are axial (AD), tangential (TD) and radial (RD), respectively (
Figure S4 in Supplementary Materials). This was undertaken in order to accurately describe the micro-textures of the sample. The grain sizes and micro-textures were evaluated from EBSD patterns by using the HKL Channel 5 software (Oxford Instruments, Abingdon, UK).
2.4. Orthogonal Analysis
In the orthogonal analysis, the range and variance of coating indexes were calculated to identify the primary- and secondary-order factors according to their impact on the results as well as to find out the variation of results with these factor values [
55]. Those indexes are hereinafter particularly referred to as the coating deposition rate, surface roughness, droplet particle size and number, preferred crystal orientation, etc. The methods of the analyses are introduced in
Appendix A, taking the L9(3
4) orthogonal experiments as an example.
2.4.1. Range Analysis
In the schema of range calculations (
Table A1 in
Appendix A.1), the range (
Rj) reflects the rangeability of the test index changing with the level of the factor in column
j. The greater the
Rj is, the higher the impact of this factor on the results is and the more important this factor is. The optimal level of the factor in column
j can be obtained by the size of
kmj.
2.4.2. Variance Analysis
Although the range analysis is simple and clear, it cannot distinguish whether the difference in results is caused by the change in experimental conditions or by errors. It also cannot enable us to understand whether the effect of the factor being considered is significant. The analysis of variance is intended to avoid the above shortcomings [
55].
Based on the results of variance calculation (
Table A2 in
Appendix A.2.) and F-testing (
Table A3 in
Appendix A.2), the factor being analyzed is considered to have a significant impact on the experimental results if
F >
and to be insignificant otherwise. The smaller the value of
is, the higher the significance level is.


 ,
, 