1. Introduction
In coastal, marine, or other chloride environments, chloride ion erosion is the main cause of steel corrosion in reinforced concrete (RC) structures, and corrosion further leads to the degradation of the durability of RC structures [
1,
2]. The chloride ions in the environment reach the surface of steel bars through the pores and micro-cracks inside the concrete, and their concentration is continuously accumulated on the reinforcement surface. When the chloride ion concentration reaches a threshold, the dense passive film on the surface of the steel bars is destroyed, and then, with the presence of oxygen, the local corrosion is activated. Subsequently, the steel bars undergo electrochemical corrosion, that is, the steel dissolution reaction of the anode and the oxygen consumption reaction of the cathode occur simultaneously on the surface of the steel bars [
3]. Generally, chloride ion erosion will cause non-uniform corrosion of steel bars, which is serious on the side of steel bars facing the concrete cover surface (CCS). Non-uniform corrosion can significantly reduce the strength and ductility of steel bars [
4,
5] and then lead to the degradation of the load-bearing capacity, stiffness, and ductility of RC structures [
6]. There are many factors affecting the corrosion of steel bars in concrete, such as the water-binder ratio or concrete strength, mineral admixture, cement type, concrete cover thickness, reinforcement type and diameter, temperature and relative humidity, chloride ion concentration, external load, crack width, etc., [
7,
8,
9,
10,
11,
12] and it should be noted that under different conditions, the main influencing factors of steel corrosion will be different.
After the corrosion of steel bars embedded in concrete, the volume of corrosion products is approximately 2–4 times that of the original steel [
13,
14]. As a result, the corrosion products exert pressure on the surrounding concrete, which causes cracks at the interface between steel bars and concrete (IBSC) when the concrete strain reaches its ultimate tensile strain. Generally, the higher the strength of concrete, the larger the initial cracking time of IBSC under the same conditions [
15]. As the development of steel corrosion, the cracks extend from the IBSC to the CCS, which provides a way for corrosive media to quickly reach the surface of steel bars, resulting in the accelerated corrosion of reinforcement, causing serious damage or even the spalling of the concrete cover [
16,
17]. Therefore, studying the corrosion-induced cracking process of the concrete cover is of great significance to predict the durability life of RC structures.
The models for studying the corrosion-induced cracking process of the concrete cover can be divided into three types including the empirical model, numerical model, and analytical model. The empirical models are derived by fitting the experimental data under different experimental conditions, which mainly consider the effects of some parameters on corrosion-induced cracking, such as concrete cover thickness, the ratio of concrete cover thickness to the diameter of steel bars, concrete strength, mass loss of steel bars, and so on [
18,
19,
20]. Therefore, the applicability of these empirical models is limited to certain conditions, which cannot really reveal the corrosion-induced cracking mechanism of the concrete cover. The numerical models adopted by researchers are used to consider the non-linear behavior during the process of corrosion-induced cracking of the concrete cover, and the resulting equilibrium equations are solved numerically by either finite element [
21,
22,
23] or finite difference methods [
24]. Generally, the analytical models require some assumptions considering the material’s behaviour and can be solved using a closed-form solution, and in the analytical models, the parameters have specific physical meanings [
1]. At present, different analytical models have been proposed to analyse the corrosion-induced cracking of the concrete cover based on the thick-walled cylinder model, in which the concrete cover is divided into an inside cracked and an outside un-cracked region [
13,
25,
26,
27,
28].
The three-stage model [
16] has been widely used to quantitatively describe the cracking process of the concrete cover caused by the corrosion of steel bars. In this model, it is assumed that the corrosion-induced cracking process of the concrete cover is divided into three stages: (1) the stage when corrosion products fill the pores at the IBSC, (2) the stage in which the corrosion products exert expansion pressure on the surrounding concrete, and (3) the stage in which the corrosion products fill the cracks. According to the three-stage model, the corrosion amount of steel bars corresponding to the three stages should be considered to predict the corrosion-induced cracking time of the concrete cover.
However, some researchers [
29,
30,
31,
32] have found that the average thickness of the rust-filling layer increased with the thickness of the rust layer until the thickness of the rust layer reached a critical value, that is, the rust was constantly filling the pores of surrounding concrete during the formation of rust layer, which is obviously different from the assumptions of the three-stage model. They also found that, before the corrosion-induced cracks reached the CCS, the rust would not fill the cracks and the pores of concrete near the cracks. Similarly, Chernin et al. [
33] revealed that while the rust filled the pores of the IBSC, it continuously filled the pores of the surrounding concrete. Zhao et al. [
34] also confirmed that when the concrete cover surface cracked induced by corrosion, the rust-filling layer was still developing. Thus, the rust filling the pores of the surrounding concrete should be taken into consideration when establishing the corrosion-induced cracking model of the concrete cover.
Because the rust fills the pores of the concrete, a rust-filling layer is formed in the surrounding concrete. Some researchers have established corrosion-induced cracking models of the concrete cover considering the effect of the rust-filling layer, while the effect of the load was not considered in their models [
30,
31]. During the service stage, RC structures suffer from different loads, and the loads affect the corrosion characteristics of steel bars embedded in concrete [
35,
36,
37]. In contrast to that without considering load, the load can shorten the initial corrosion time, change the corrosion rate and the corrosion distribution, and cause local pitting of steel bars in RC structures [
38,
39,
40], resulting in serious corrosion-induced cracking of the concrete cover [
41,
42]. Therefore, the influence of load should be considered when establishing the corrosion-induced cracking model of the concrete cover. However, to the best knowledge of the authors, the study of the corrosion-induced cracking model considering the effect of the load is severely inadequate.
To fill this research gap, in this paper, based on the thick-walled cylinder model, the effect of the load was considered to analyse the critical corrosion depth of steel bars when the IBSC cracked and the CCS cracked. Then, a prediction model for the corrosion-induced longitudinal cracking (CLC) time (i.e., initiation cracking time) of the CCS of RC structures under load was proposed, and the rationality of the prediction model was verified by the experimental data of Wang et al. [
43]. Finally, based on the proposed prediction model, the influence of load on the CLC time of CCS was analysed.
2. Interaction between Ribbed Steel Bars and Surrounding Concrete under Load
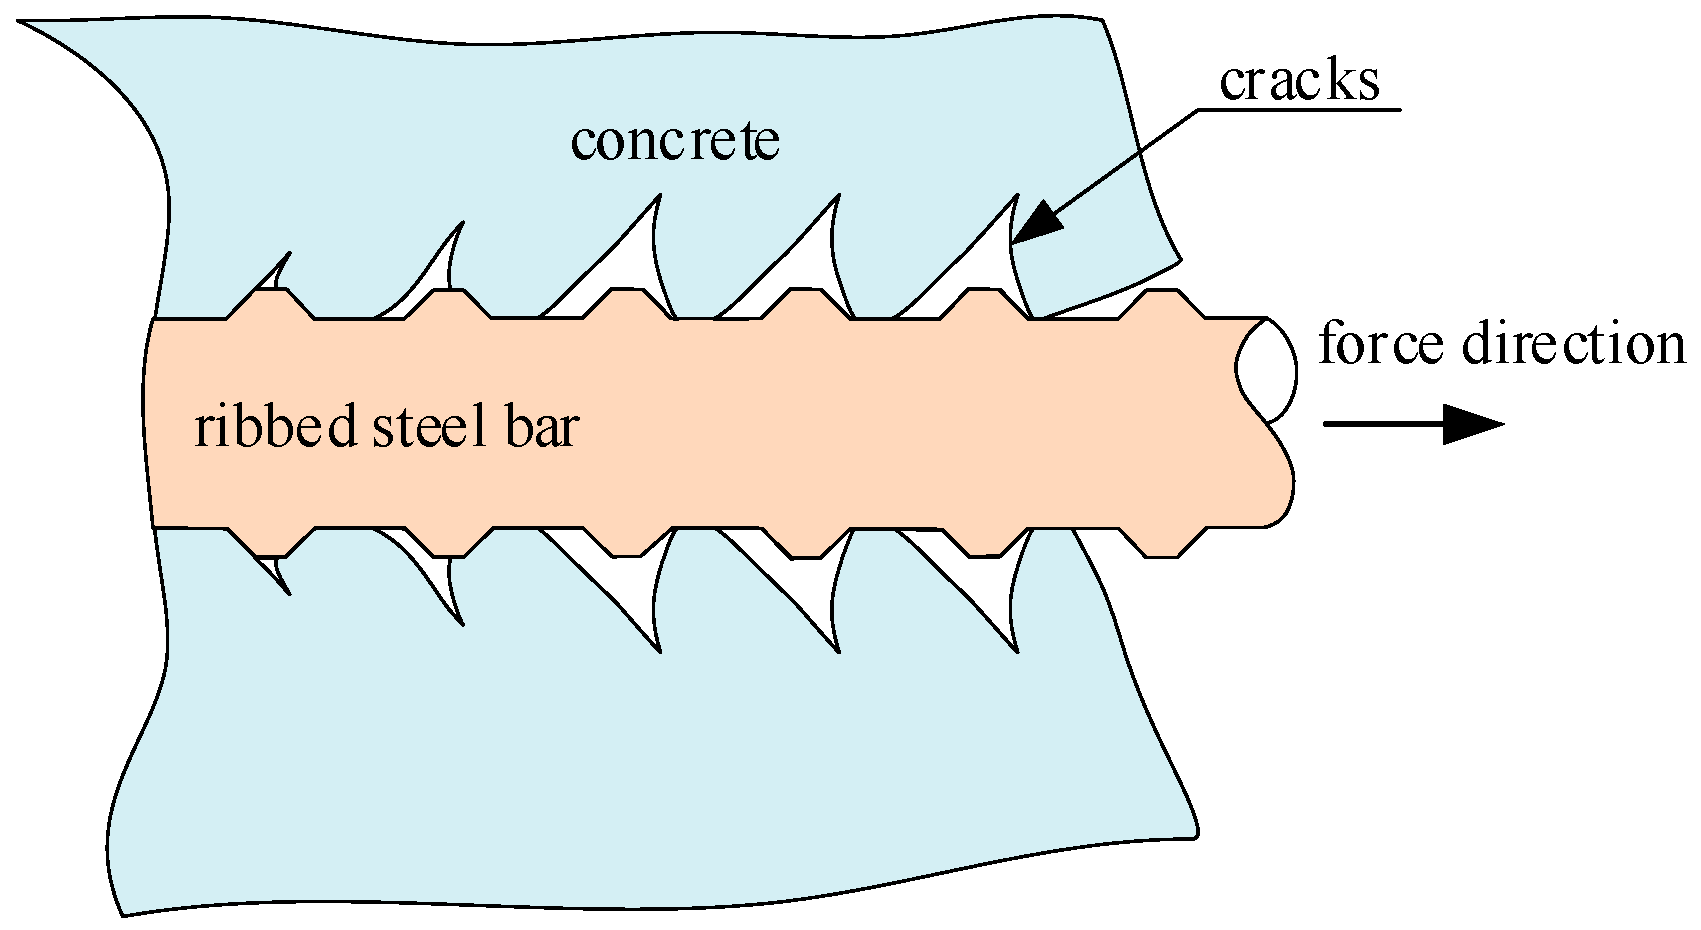
The bonding force between ribbed steel bars and surrounding concrete consists of three parts: the chemical adhesive force between the cement gel and the surface of steel bars, the friction force between steel bars and concrete, and the mechanical interlocking force between the transverse ribs of steel bars and concrete. Among them, the mechanical interlocking force is the main part of the bonding force. The oblique extrusion force between the transverse ribs of steel bars and the surrounding concrete forms slip resistance. The component force of the oblique extrusion force along the axial direction of the steel bars makes the concrete between two transverse ribs bend and shear as a cantilever beam, which causes oblique cracks inside the concrete. The radial component of the oblique extrusion force makes the surrounding concrete like a pipe wall under internal pressure, resulting in hoop tensile stress inside the concrete, which causes radial cracks in the surrounding concrete. After the ribbed steel bars are subjected to a force, the distribution of cracks near the transverse ribs is shown in
Figure 1.
After the ribbed steel bars are subjected to a force, the surrounding concrete produces oblique extrusion force
p on transverse ribs, as shown in
Figure 2. In the figure,
θ is the angle between the concrete sliding surface near the transverse ribs and the axis of ribbed steel bars, and
μ is the friction coefficient between the ribbed steel bars and concrete. By decomposing the oblique extrusion force
p and friction force
μp on the concrete sliding surface along the axis and radial directions of the ribbed steel bars, the bond stress
τ and the radial pressure
q1 can be obtained, as written in Equations (1) and (2), respectively.
Tepfers [
44] found that the angle
θ as shown in
Figure 2 was 30°–40°, and Xu [
45] found that the angle ranged from 10° to 40°, with an average of 25°. The friction coefficient
μ between the ribbed steel bars and concrete increases with the corrosion degree of ribbed steel bars, and if the ribbed steel bars are not corroded, the friction coefficient can be taken as 0.3 [
45]. Guo and Shi [
46] showed that the steel bars changed from a non-corrosion state to a corrosion state, and the variation range of the friction coefficient was 0.2–0.6. Zhao and Xiao [
47] confirmed that the friction coefficient between the concrete and rolled steel was 0.25–0.35. According to the above research results,
θ is taken as 30° and
μ is taken as 0.35 in this paper.
The relationship between the bond stress
τ and the radial pressure
q1 can be derived from Equations (1) and (2):
The bond stress as shown in
Figure 2 can be determined by establishing the mechanical equilibrium equation along the axis direction of the ribbed steel bars:
where
R is the radius of the ribbed steel bars, and
σs is the tensile stress of the ribbed steel bars.
Substituting Equation (4) into Equation (3), the radial pressure can be obtained as:
To calculate dσs/dx in Equation (5), it is first necessary to derive the equation between the tensile stress of the ribbed steel bars and the bending moment, and then take the derivative of x on both sides of the equation to obtain dσs/dx. The detailed calculation process is as follows:
(1) During the service stage, before the load-induced cracking of RC members, the full cross-section of RC members is subjected to force. When calculating the tensile stress of ribbed steel bars under the bending moment, the cross-section of the steel bars needs to be transformed to the concrete section. For RC beams with a rectangular cross-section, the transformed cross-section is shown in
Figure 3, and the area of the transformed cross-section can be calculated by Equation (6).
where
A0 is the area of cross-section after transformation,
n1 denotes the ratio of the elastic modulus of tensile steel bars to that of concrete,
n2 refers to the ratio of the elastic modulus of the compressive steel bars to that of concrete,
As is the area of cross-section of tensile steel bars,
is the area of cross-section of compressive steel bars, and
b and
h are the width and height of the cross-section, respectively.
The height of the compression zone of the transformed cross-section can be determined by the equal area moment of the tension zone and compression zone to the neutral axis of the cross-section:
where
x0 is the height of the compression zone, and
h0 is the effective height of the cross-section.
After the height of the compression zone is obtained, the moment of inertia
I0 of the transformed cross-section can be expressed as:
Therefore, before load-induced cracking of RC beams, the tensile stress of ribbed steel bars under bending moment is:
where
M is the bending moment.
During the service stage, after the load-induced cracking of RC beams, the concrete in the tension zone of the cross-section exits work, and only the steel bars in the tension zone are subjected to force. For RC beams with a rectangular cross-section, the tensile stress of steel bars in the tension zone of the cross-section can be calculated according to the method of the transformed cross-section, or calculated according to the method stipulated in China Standard (GB 50010) [
48]. The latter method is adopted in this paper, as written in Equation (10).
(2) For the RC beams with a rectangular cross-section, the bending moment is often different along the length of beams under load. Taking the RC beams subjected to third-point concentrated load (i.e., F/2) as an example (
Figure 4), the bending moment can be calculated according to Equation (11).
where
M(
x) is the bending moment at the distance
x from the left support of beams under the third-point concentrated load, and
l1 is 1/3 of the calculated span of RC beams.
Substituting Equation (11) into Equations (9) and (10), respectively, the tensile stress of ribbed steel bars can be obtained, and then Equation (5) can be rewritten as:
Before load-induced cracking of RC beams:
After load-induced cracking of RC beams:
This paper only gives the calculation formulas of radial pressure when the RC beams with rectangular cross-sections are subjected to third-point concentrated loads. Similarly, the calculation method of radial pressure can be established for beams under other types of loads.
For RC structures under load, before the corrosion of steel bars, there is only radial pressure between steel bars and surrounding concrete. The thick-walled cylinder model [
44,
49,
50] is usually adopted to calculate the interaction between steel bars and the concrete cover, as shown in
Figure 5. In this figure,
C is the thickness of the concrete cover,
d is the diameter of steel bars, and
q1 is the radial pressure.
Along the longitudinal direction of the steel bars, the concrete cover may be in uncracked, partially cracked, or completely cracked states under radial pressure. This paper only discusses the longitudinal cracking of the concrete cover under the coupled effects of load and steel corrosion; hence, the transverse cracking of the concrete cover is not considered and is out of the scope of this paper. Assuming that the longitudinal cracks do not generate in concrete cover under radial pressure, that is, the concrete cover is in the elastic deformation stage (
Figure 5). Therefore, the elastic theory can be adopted to calculate the stress distribution in the concrete cover under radial pressure. According to the theory of elasticity [
51], the hoop stress at any position
rx (
R ≤
rx ≤
b) of the thick-walled cylinder under radial pressure can be expressed as:
where
b is the outer radius of the thick-walled cylinder,
b =
d/2 +
C.
Equation (14) can be used to judge the longitudinal cracking of the concrete cover: if
σθ(
R) <
ft, no cracking, and if
σθ(
R) ≥
ft and
σθ(
b) <
ft, partial cracking. After the corrosion of the steel bars, the surrounding concrete does not crack immediately. Corrosion products accumulate at the IBSC and continue to exert corrosion expansion pressure
q2 on the surrounding concrete. Therefore, the time when longitudinal cracks appear on the CCS under the combined action of corrosion expansion pressure
q2 and radial pressure
q1 is the longitudinal cracking time of CCS under the coupled effects of load and steel corrosion. The total radial pressure
q calculated by Equation (15) can be directly applied to the inner wall of the thick-walled cylinder, and then the elasticity and damage mechanics theories are adopted to derive the time for the appearance of longitudinal cracks on the CCS.
3. Rust Filling Model
During the corrosion-induced cracking process of the concrete cover, corrosion products accumulate at the IBSC forming the rust layer and filling the pores of surrounding concrete forming the rust-filling layer. The process of corrosion products filling the pores of surrounding concrete is affected by many factors, such as the position of the aggregate and the distribution of pores. Zhao et al. [
29,
30,
32] and Wu [
31] found that the average thickness of the rust-filling layer increased with the thickness of the rust layer until the thickness of the rust layer reached a critical value, that is, the corrosion products were constantly filling the pores of surrounding concrete during the formation of the rust layer. The relationship between the average thickness of the rust-filling layer and the thickness of the rust layer is shown in
Figure 6 and can be expressed by Equation (16) [
29,
30].
where
TCL is the thickness of the rust layer at the IBSC,
denotes the average thickness of the rust-filling layer;
is the maximum value of
,
is the
corresponding to
, and
kT is the ratio of
to
.
To consider the influence of the rust-filling layer in the corrosion-induced cracking model of the concrete cover, the rust-filling layer should be converted to the equivalent rust layer as shown in
Figure 7, and the thickness of the equivalent rust layer can be expressed as [
30]:
where
TCL,pore is the thickness of the equivalent rust layer,
TCP denotes the thickness of the rust-filling layer, and
γ is the porosity of concrete around the steel bars, which can be approximately calculated as [
30]:
where
W/
C is the water–cement ratio of concrete, and
α is the hydration degree of concrete.
Generally, the average thickness of the rust-filling layer does not reach the maximum average thickness before the CCS cracks [
30,
31], as shown in
Figure 6. Therefore, when establishing a prediction model for the cracking of CCS, only the case of
<
in Equation (16) is considered. The thickness of the equivalent rust layer can be determined according to Equation (17):
It can be found from Equation (19) that the thickness of the equivalent rust layer is related to the type of concrete. After the corrosion of the steel bars, assuming that
Vrust is the total volume of rust, and
Vsteel is the volume lost by the steel bars due to corrosion, the actual rust volume expansion ratio
n can be defined as [
30]:
The total volume of rust
Vrust is the sum of the volume of rust filling the concrete pores
Vrust,CP and the volume of rust layer
Vrust,CL:
However, during the corrosion process of steel bars, only the rust layer exerts extrusion force on the surrounding concrete, which causes the concrete cover to crack. Therefore, the nominal rust volume expansion ratio
n0 can be defined as [
30]:
The relationship between the actual rust volume expansion ratio and the nominal rust volume expansion ratio is [
30]:
The following equation can be derived from Equations (19) and (23):
Equation (24) shows that when n = n0, the volume of rust filled into the pores of the concrete around the steel bars is zero, and n0/n decreases with the increase of concrete porosity γ, that is, the volume of rust filled into the pores of concrete around the steel bars increases with concrete porosity. It can be seen from the above analysis that n0 should be used instead of n when establishing the corrosion-induced cracking model of the concrete cover. However, for different types of concrete, before calculating n0, the values of γ and kT need to be determined.
4. Non-cracking Stage Model of Concrete Cover
For the thick-walled cylinder model, as shown in
Figure 8, when the IBSC does not crack under the total radial pressure
q, the stress and strain at any point in the concrete cover can be calculated by the elastic theory. In
Figure 8,
δcc and
δr are, respectively, the radial deformations of the concrete and rust layers at the IBSC,
dρ is the residual diameter of the steel bars after corrosion, and
d1 denotes the diameter of the steel bars after the free expansion of rust.
Stress components at any point in the concrete cover under the total radial pressure can be formulated as [
13,
30]:
where
σr and
σθ are the radial stress and the hoop stress in the concrete cover at a distance
rx from the center of the steel bar, respectively, and
b =
R +
C.Strain components at any point in the concrete cover under the total radial pressure can be derived as [
13,
30]:
where
εr and
εθ are the radial strain and the hoop strain in concrete cover at the distance
rx from the center of the steel bar, respectively, and
Ec and
vc are the elastic modulus and Poisson’s ratio of concrete, respectively.
According to the elastic theory, the radial displacement
ur at any point in the concrete cover can be derived by
εθ =
ur/
rx:
The critical state of cracking at the IBSC is defined as the hoop strain of concrete reaching ultimate tensile strain:
where
εt and
ft are the ultimate tensile strain and tensile strength of concrete, respectively.
When the IBSC cracks, the critical value
qinner of total radial pressure
q can be obtained on the basis of Equations (27) and (28):
According to the deformation coordination conditions of the concrete and rust layer at the IBSC, the following equation can be obtained [
13,
30]:
where
R1 is the radius of steel bars after the free expansion of rust.
The calculation methods of parameters in Equation (30) are [
13,
30]:
where
ηs is the mass loss of steel bars,
Er is the elastic modulus of rust, which can be taken as 100 MPa [
52], and
vr is the Poisson’s ratio of rust, which can be taken as 0.25 [
52].
When the IBSC cracks, the relationship between the critical total radial pressure
qinner and critical mass loss
of steel bars can be derived from Equations (29) to (31):
The critical total radial pressure
qinner can be derived from Equation (32):
Substituting
into Equation (33), and assuming
M1= [(1 +
vc)(
R +
C)
2 + (1 − 2
vc)
R2]/[
Ec(2
RC +
C2)],
M2 =
n0(1 −
)/
Er,
M3 = (1 +
vc)
n0 − 2, the following equations can be obtained:
The algebraic cubic equation as shown in Equation (34a) has three roots. However, only one analytic real root for Equation (34a) is useful, which can be calculated as [
53]:
If Equation (34a) has no real roots, a real root can be approximately obtained as the value of
x1 through the MATLAB program, and then the critical mass loss of steel bars can be determined as:
Through the critical mass loss of steel bars, the critical corrosion depth of steel bars can be derived as:
where
is the critical corrosion depth of steel bars when the IBSC cracks.
According to the calculation model of the critical corrosion depth of steel bars established above, to analyse the influence of load on the critical corrosion depth of steel bars when the IBSC cracks, an example is adopted. Assuming that the length of an RC beam is 2300 mm, its calculated length is 2100 mm, the size of its cross-section is 150 (width) × 250 (height) mm, the strength grade of concrete is C30, the tensile steel bars are two HRB335 ribbed steel bars with a diameter of
d = 18 mm and the yield strength is
fy = 335 MPa, the thickness of the concrete cover is
C = 30 mm, and the actual rust volume expansion ratio is
n = 2. The parameters of concrete are tensile strength
ft = 2.01 MPa, compressive strength
fc = 20.1 MPa, elastic modulus
Ec = 30 GPa, and Poisson’s ratio
vc = 0.2. The range of
n/
n0 is about 1–1.2 [
31], and 1.0 and 1.2 are taken in this example.
For the RC beam under a third-point concentrated load, the radial pressure
q1 occurs at the IBSC, which causes hoop tensile stress in the concrete cover, as shown in Equation (14). Assuming that the hoop tensile stress at the position
rx =
R of the concrete cover caused by the radial pressure is 0, 0.2, and 0.3 times the tensile strength of concrete, the tensile stress level
δT = 0, 0.2, and 0.3, meanwhile, the IBSC does not crack [
54].
Figure 9 shows the critical corrosion depth of steel bars when the IBSC cracks are induced by corrosion under load. It can be seen from
Figure 9 that the load has a significant effect on the critical corrosion depth of the steel bars. The greater the load, the smaller the critical corrosion depth, and for the two cases of
n/n0 = 1.0 and
n/n0 = 1.2, when the tensile stress level
δT increases from 0 to 0.3, the critical corrosion depth is reduced by 67.9% and 59.4%, respectively. Therefore, the influence of load needs to be considered when establishing the corrosion-induced cracking model of the concrete cover.
Figure 9 also depicts that when
n/n0 = 1.2, the critical corrosion depth is significantly larger than that of
n/n0 = 1.0, which is because, the larger the
n/n0, the more rust filled into the pores of concrete around steel bars, and the rust-filling layer does not produce squeezing force on the IBSC. As a result, the more serious the corrosion of steel bars, the larger the critical corrosion depth of steel bars.
5. Partial Cracking Stage Model of Concrete Cover
After the IBSC cracks under the total radial pressure, the cracks propagate radially to the surface of the cylinder. Therefore, the thick-walled cylinder can be divided into two coaxial cylinders. The inside one is a cracked cylinder and the outside one is an intact cylinder, as depicted in
Figure 10. In the figure,
Rc represents the radius of the interface between the cracked cylinder and the intact cylinder.
The cracked concrete inside the thick-walled cylinder is assumed to be non-uniform orthotropic linear elastic material, and the outside intact concrete is assumed to be isotropic linear elastic material [
33]. Then, the stress component and strain component at any point in the intact concrete can be derived from elastic theory [
55]:
Stress components:
where
is the radial pressure at the interface between cracked and intact cylinders.
For the cracked cylinder, assuming that the cracks are uniformly distributed on the circumference of the cracked cylinder and propagate outwards radially, the damage degree of concrete along the direction of cracks is different, which near the steel bars is larger than that of concrete far away from the steel bars. The relationship between the radial stress and hoop stress at any point in the cracked cylinder is [
55]:
Based on the Mohr–Coulomb failure criterion [
13] and Mazar’s damage model [
56], the damage variable
D is adopted to describe the damage degree of the cracked cylinder along the radial direction. Equation (40) can be rewritten as [
57]:
where
φ is the internal friction angle of concrete, and
c is the cohesive strength of concrete.
The internal friction angle of concrete decreases slightly with increasing concrete strength, which can be approximately taken as 37°, and the cohesive strength of concrete can be determined as [
30,
58]:
where
fc is the compressive strength of concrete.
The damage variable
D can be derived by Mazar’s damage equation [
59]:
where
At and
Bt are the coefficients of Mazar’s damage model, 0.7 <
At < 1 and 10
4 <
Bt < 10
5.
Substituting Equation (41) into Equation (40) yields [
13,
30]:
The boundary conditions are expressed as:
Substituting Equation (45a) into Equation (44) yields:
Substituting Equation (45b) into Equation (39) results in:
Substituting Equation (45b) and Equation (46) into Equation (44), the total radial pressure can be derived as [
13,
30]:
Equation (48) can be simplified to Equation (29) when
Rc =
R. Hence, the calculated results obtained at the non-cracking stage and partial cracking stage of the concrete cover are continuous. To simplify the calculation, the cracked cylinder is divided into
N concentric rings of equal thickness, as depicted in
Figure 11. For each ring, the damage variable
D can be considered constant. The radial displacement
ur in the cracked cylinder should satisfy the following equation [
30,
60,
61]:
The radial displacement at any point in the cracked cylinder can be obtained from Equation (49), which is expressed as [
13,
30]:
where
C1 and
C2 are the constants.
According to the geometric equation between displacement and strain, the radial and hoop strains at any point in the cracked cylinder can be derived as [
13,
30]:
Assuming that the thickness of each ring in the cracked cylinder is Δ
R, the total thickness of the cracked cylinder is
NΔ
R. For the
Nth ring shown in
Figure 11 adjacent to the uncracked concrete, its damage variable
DN is close to 0. Therefore, it can be assumed that the damage variable of the whole
Nth ring is 0, and the constants
and
in Equation (50) can be determined according to the condition that Equation (51) and Equation (39) are equal at the position of
rx =
Rc. When the constants in Equation (50) are determined, the radial and hoop strains at any point in the
Nth ring can be calculated according to Equation (51). Since the inner surface of the
Nth ring is the outer surface of the (
N−1)th ring, for the (
N−1)th ring, the constants
and
in Equation (50) can be derived according to the strain continuity condition of the two rings at the contact surface. The damage variable
DN−1 of the (
N−1)th ring can be determined by Equation (43), and the parameter
εθ in Equation (43) takes the hoop strain on the inner surface of the
Nth ring. As a result, the radial and hoop strains at any point in the (
N−1)th ring can also be calculated according to Equation (51). Similarly, the constants and strains from the (
N−2)th ring to the 1th ring can be calculated. The above-detailed analysis process can be referred to in the literature [
13]. According to the above analysis, the radial deformation of the concrete at the IBSC is equal to the radial displacement of the inner surface of the 1th ring, that is:
where
D1 is the damage variable of 1th ring, which can be calculated according to Equation (43).
At the partial cracking stage of the concrete cover, the mass loss and corrosion depth of the steel bars can be derived according to Equations (30)–(37). When the cracks develop on the surface of the thick-walled cylinder, i.e.,
Rc =
R +
C, the critical corrosion depth of the steel bars can be determined as:
where
is the critical mass loss of steel bars when the CCS cracks.
To analyse the influence of load on the critical corrosion depth of steel bars when the CCS cracks are induced by corrosion, the same example as
Section 4 is used. The internal friction angle
φ of concrete is 37°, the cohesion strength
c = 5.01 MPa of concrete is calculated according to Equation (42), Δ
R is 1 mm, and the values of
At and
Bt are 0.7 and 10
4, respectively. Zhao et al. [
13] found that when the cracks propagated to 0.8 times the thickness of the concrete cover, the corrosion expansion force at the IBSC reached the maximum, and at this time, even if the corrosion process of steel bars stopped, the cracks could spontaneously extend to the CCS. Therefore, this paper assumes that when the radius of the interface between the cracked cylinder and intact cylinder is
Rc =
R + 0.8
C, the CCS cracks. Assuming that the hoop tensile stress at the position
rx =
R of concrete cover caused by the radial pressure is 0, 0.2, and 0.3 times the tensile strength of concrete, that is, the tensile stress level
δT = 0, 0.2, and 0.3, and meanwhile, the IBSC does not crack [
54]. The range of
n/
n0 is about 1–1.2 [
31], and 1.0, 1.05, and 1.1 are taken in this example. When the CCS cracks are induced by corrosion under load, the critical corrosion depth of steel bars is shown in
Figure 12.
Figure 12 illustrates that the load affects the critical corrosion depth of the steel bars when the CCS cracks, but the effect is not significant. The larger the load, the smaller the critical corrosion depth of the steel bars. The larger the
n/
n0, the more rust filled into the pores of concrete around steel bars, resulting in a larger critical corrosion depth of the steel bars. For the three cases of
δT = 0, 0.2, and 0.3, when the
n/
n0 increases from 1.0 to 1.1, the critical corrosion depth of steel bars increases by 30.8%, 30.2%, and 30.6%, respectively. For the three cases of
n/
n0 = 1.0, 1.05, and 1.1, when the tensile stress level
δT increases from 0 to 0.3, the critical corrosion depth of the steel bars decreases by 4.6%, 4.8%, and 4.7%, respectively. Apparently, the value of
n/
n0, that is, the influence of the rust-filling layer on the critical corrosion depth of the steel bars is greater than that of the load. Compared with the analysis results of
Section 4, it can be found that the influence of the load on the critical corrosion depth of the steel bars when the IBSC cracks is larger than that of when the CCS cracks.
7. Model Validation
For the model established in
Section 5, the rationality has been verified by Zhao et al. [
30] when the influence of the load is not considered. This section focuses on verifying the rationality of the model considering the effect of load. Wang et al. [
43] recorded the CLC time (i.e., initiation cracking time) of the CCS of recycled concrete beams under load as listed in
Table 1, and in their test, the load applied to recycled concrete beams was 0.2, 0.4, and 0.6 times the flexural capacity, respectively. It can be found that the CLC time of the CCS of recycled concrete beams tends to decrease with the increase of the applied load. Due to the load borne by RC structures during the service stage not being larger than 0.6 times the flexural capacity [
62], it can be concluded that the recycled concrete beams in the test of Wang et al. [
43] are all in the service stage. It should be noted that Equation (57) is established based on the uniform corrosion of steel bars, whereas the corrosion of steel bars under load has obvious pitting corrosion characteristics. However, the electrochemical corrosion method is adopted in the corrosion test of Wang et al. [
43]; hence, the corrosion of steel bars in recycled concrete beams under load is mainly uniform corrosion, which has been discussed in detail by Wang et al. [
43]. Therefore, the experimental values of Wang et al. [
43] can be adopted to verify the rationality of Equation (57). When the Equation (57) is adopted to calculate the CLC time of CCS under load, the values of the parameters in Equation (57) are as follows:
αrust = 0.57,
ρrust = 3600 kg/m
3,
ρst = 7850 kg/m
3,
R = 6 mm,
n = 2,
icorr = 0.01 mA/mm
2,
n/
n0 = 1.1,
C = 23 mm,
b = 29 mm,
vc = 0.2,
φ = 37°,
At = 0.7,
Bt = 10
4, Δ
R = 0.5 mm, and assuming
Rc = 6 + 0.8 × 23 ≈ 25 mm when the CCS cracks.
The comparison of the calculated values from Equation (57) and the experimental values are listed in
Table 1. It can be found that the calculated values are slightly larger than the experimental values, but the two are basically consistent. There are two main reasons for this phenomenon: on the one hand, in the test of Wang et al. [
43], the steel bars embedded in recycled concrete beams are not completely rusted uniformly, and there are many local pits on the surface of steel bars, and it is well known that pitting corrosion of steel bars can shorten the CLC time of CCS; on the other hand, it is difficult to accurately determine the values of
n and
n/
n0, and the analysis results of
Section 4 and
Section 5 show that the value of
n/
n0 has an effect on the critical corrosion depth of steel bars, i.e., the larger the
n/
n0, the larger the critical corrosion depth, which in turn affects the CLC time of CCS under load, hence the
n/
n0 = 1.1 is taken in Equation (57), which may be greater than the actual value of
n/
n0 for the recycled concrete beams in the test of Wang et al. [
43].
8. Parametric Analysis
There are some factors affecting the CLC time (i.e., initiation cracking time) of CCS, such as concrete tensile strength, concrete cover thickness, reinforcement diameter, current density, rust property, etc. [
14,
49,
60]. Based on the prediction model established in
Section 6, this section analyses the influence of load,
n, and,
n/
n0 on the CLC time of CCS. The RC beam as shown in
Section 4 is adopted, the values of parameters are listed in
Section 4 and
Section 5, and the current density
icorr = 0.01 mA/mm
2. Assuming that the hoop tensile stress at the position
rx =
R of concrete cover caused by load is 0, 0.1, 0.2, and 0.3 times the tensile strength of concrete, the tensile stress level
δT = 0, 0.1, 0.2, and 0.3. The range of the actual rust volume expansion ratio
n is about 2–4 [
13,
14], and 2, 3, and 4 are adopted in this section. The range of
n/
n0 is about 1–1.2 [
31], and 1.0, 1.1, and 1.2 are taken in this section. The influence of load,
n, and
n/
n0 on the CLC time of CCS is shown in
Figure 13.
Figure 13 shows that, with the increase of
n or load, the CLC time of CCS decreases, while the CLC time increases obviously with the
n/
n0. For example, in the case of
n = 3 and
n/
n0 = 1.2, when
δT increases from 0 to 0.3, the CLC time decreases from 397.42 h to 355.04 h; while in the case of
n = 4 and
δT = 0.30, when
n/
n0 increases from 1.0 to 1.2, the CLC time increases from 142.78 h to 243.80 h. In order to further investigate the effect of load on CLC time, the influence of load on the CLC time of CCS can be calculated quantitatively according to
Figure 13, as listed in
Table 2. It can be found from
Table 2 that the values of
n and
n/
n0 affect the influence of load on the CLC time. When
n/
n0 remains unchanged, the greater the
n, the more obvious the load can shorten the CLC time, that is, the percentage reduction in CLC time caused by load increases with
n. For instance, in the case of
n/
n0 = 1.1, when
n increases from 2 to 4, the percentage reduction in CLC time caused by the load is increased by 178.5%. However, when
n remains unchanged, the percentage reduction in CLC time caused by the load decreases with the increase of
n/
n0. For instance, for the case of
n = 3, when
n/
n0 increases from 1.0 to 1.2, the percentage reduction in CLC time caused by the load is decreased by 27.2%.


