
Photovoltaic Electrochemically Driven Degradation of Calcon Dye with Simultaneous Green Hydrogen Production

 , ,
, , 
Abstract
:
1. Introduction
2. Materials and Methods
2.1. Electrochemical Systems
2.2. Solar PV-Battery System
2.3. Apparatus and Analytical Procedures
3. Results
3.1. Voltametric Behavior of Calcon Dye on BDD Surface
- (i)
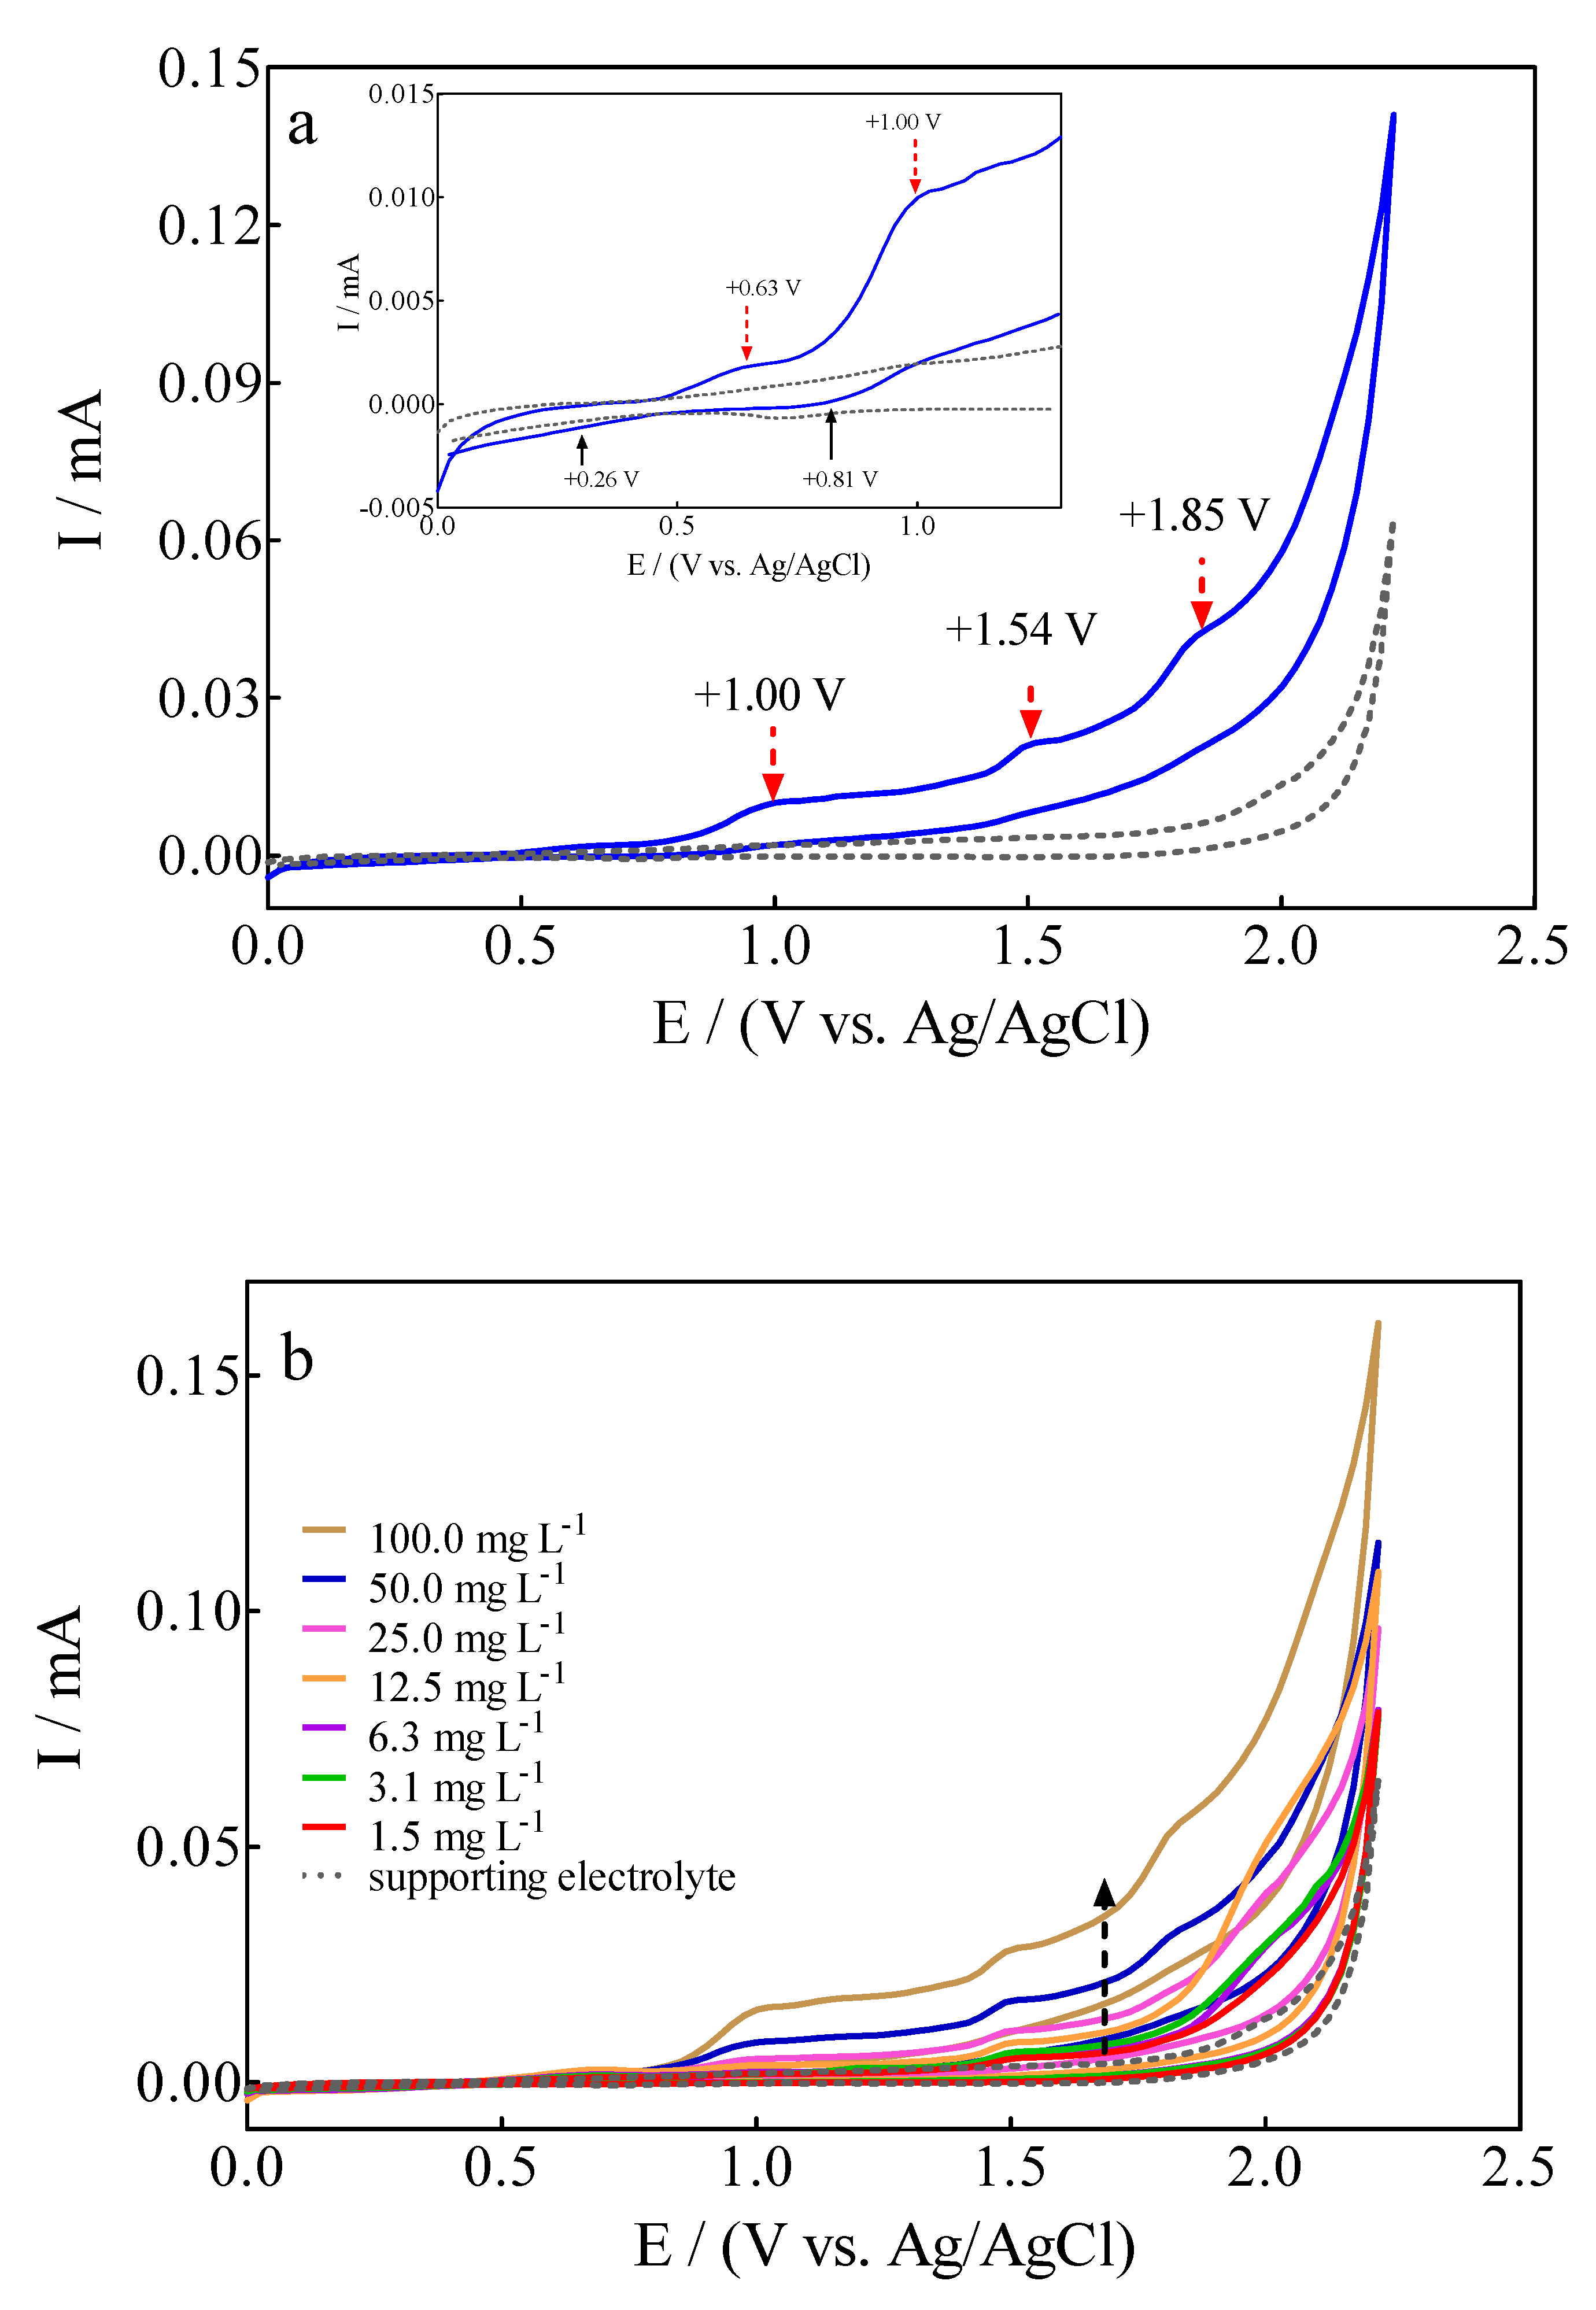
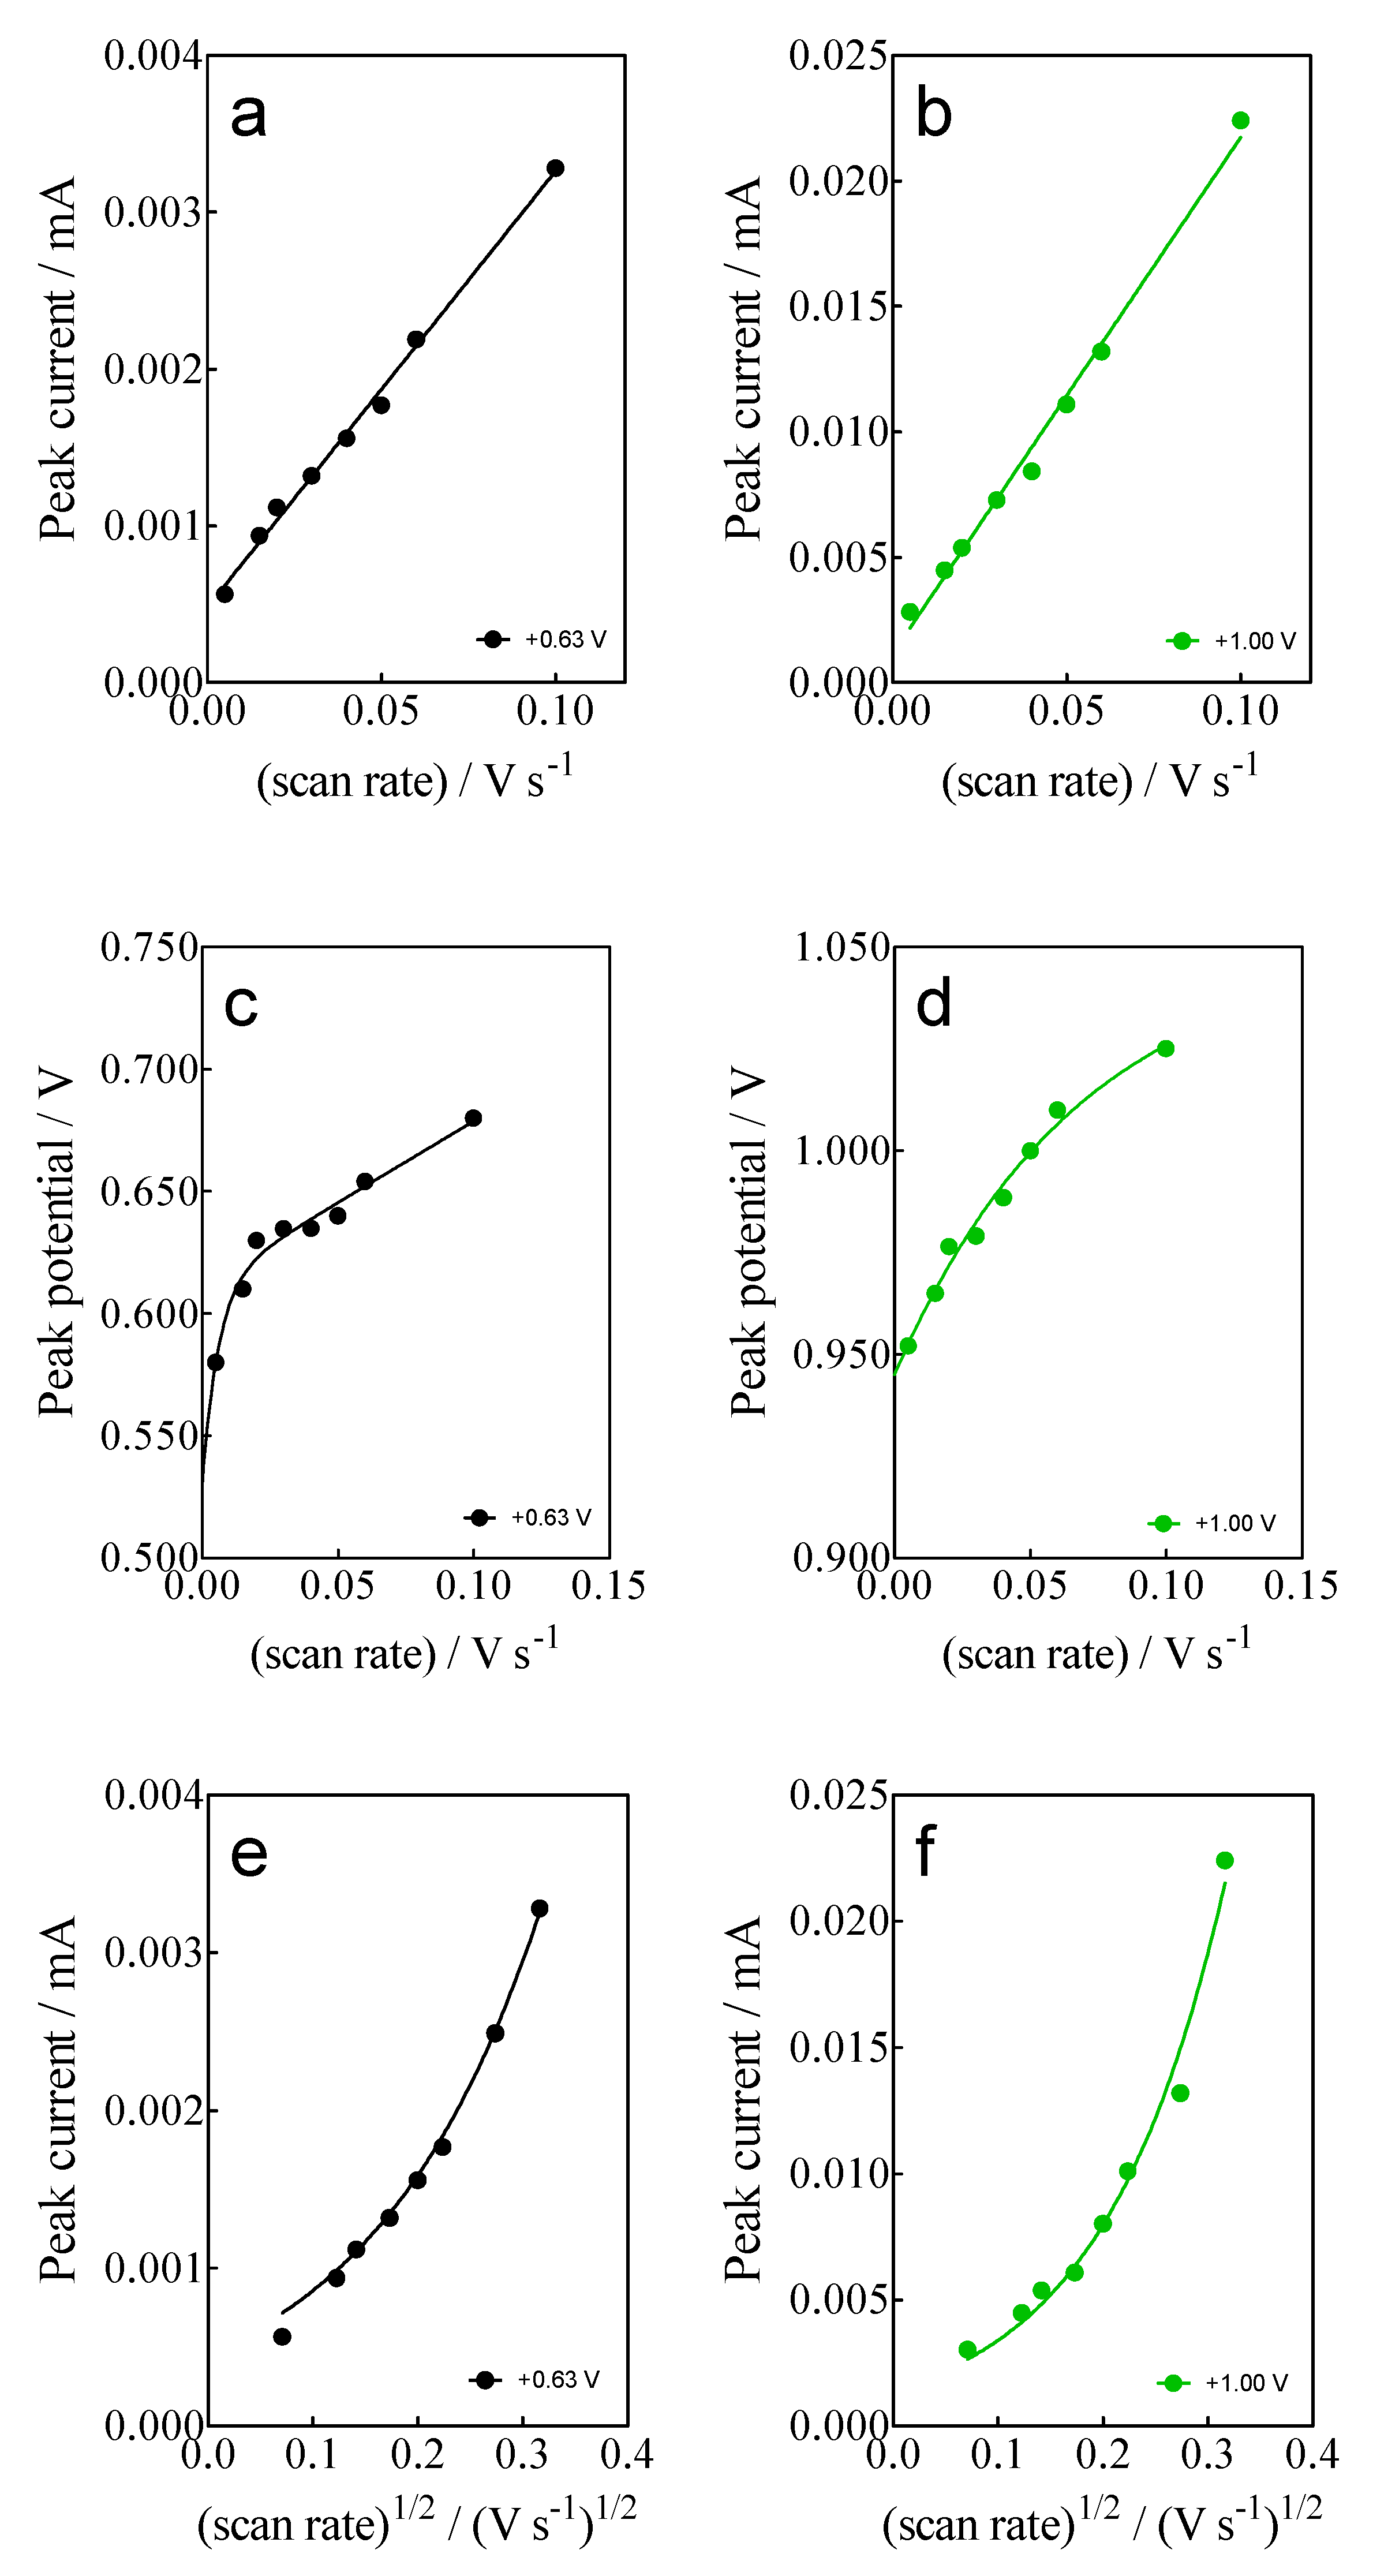
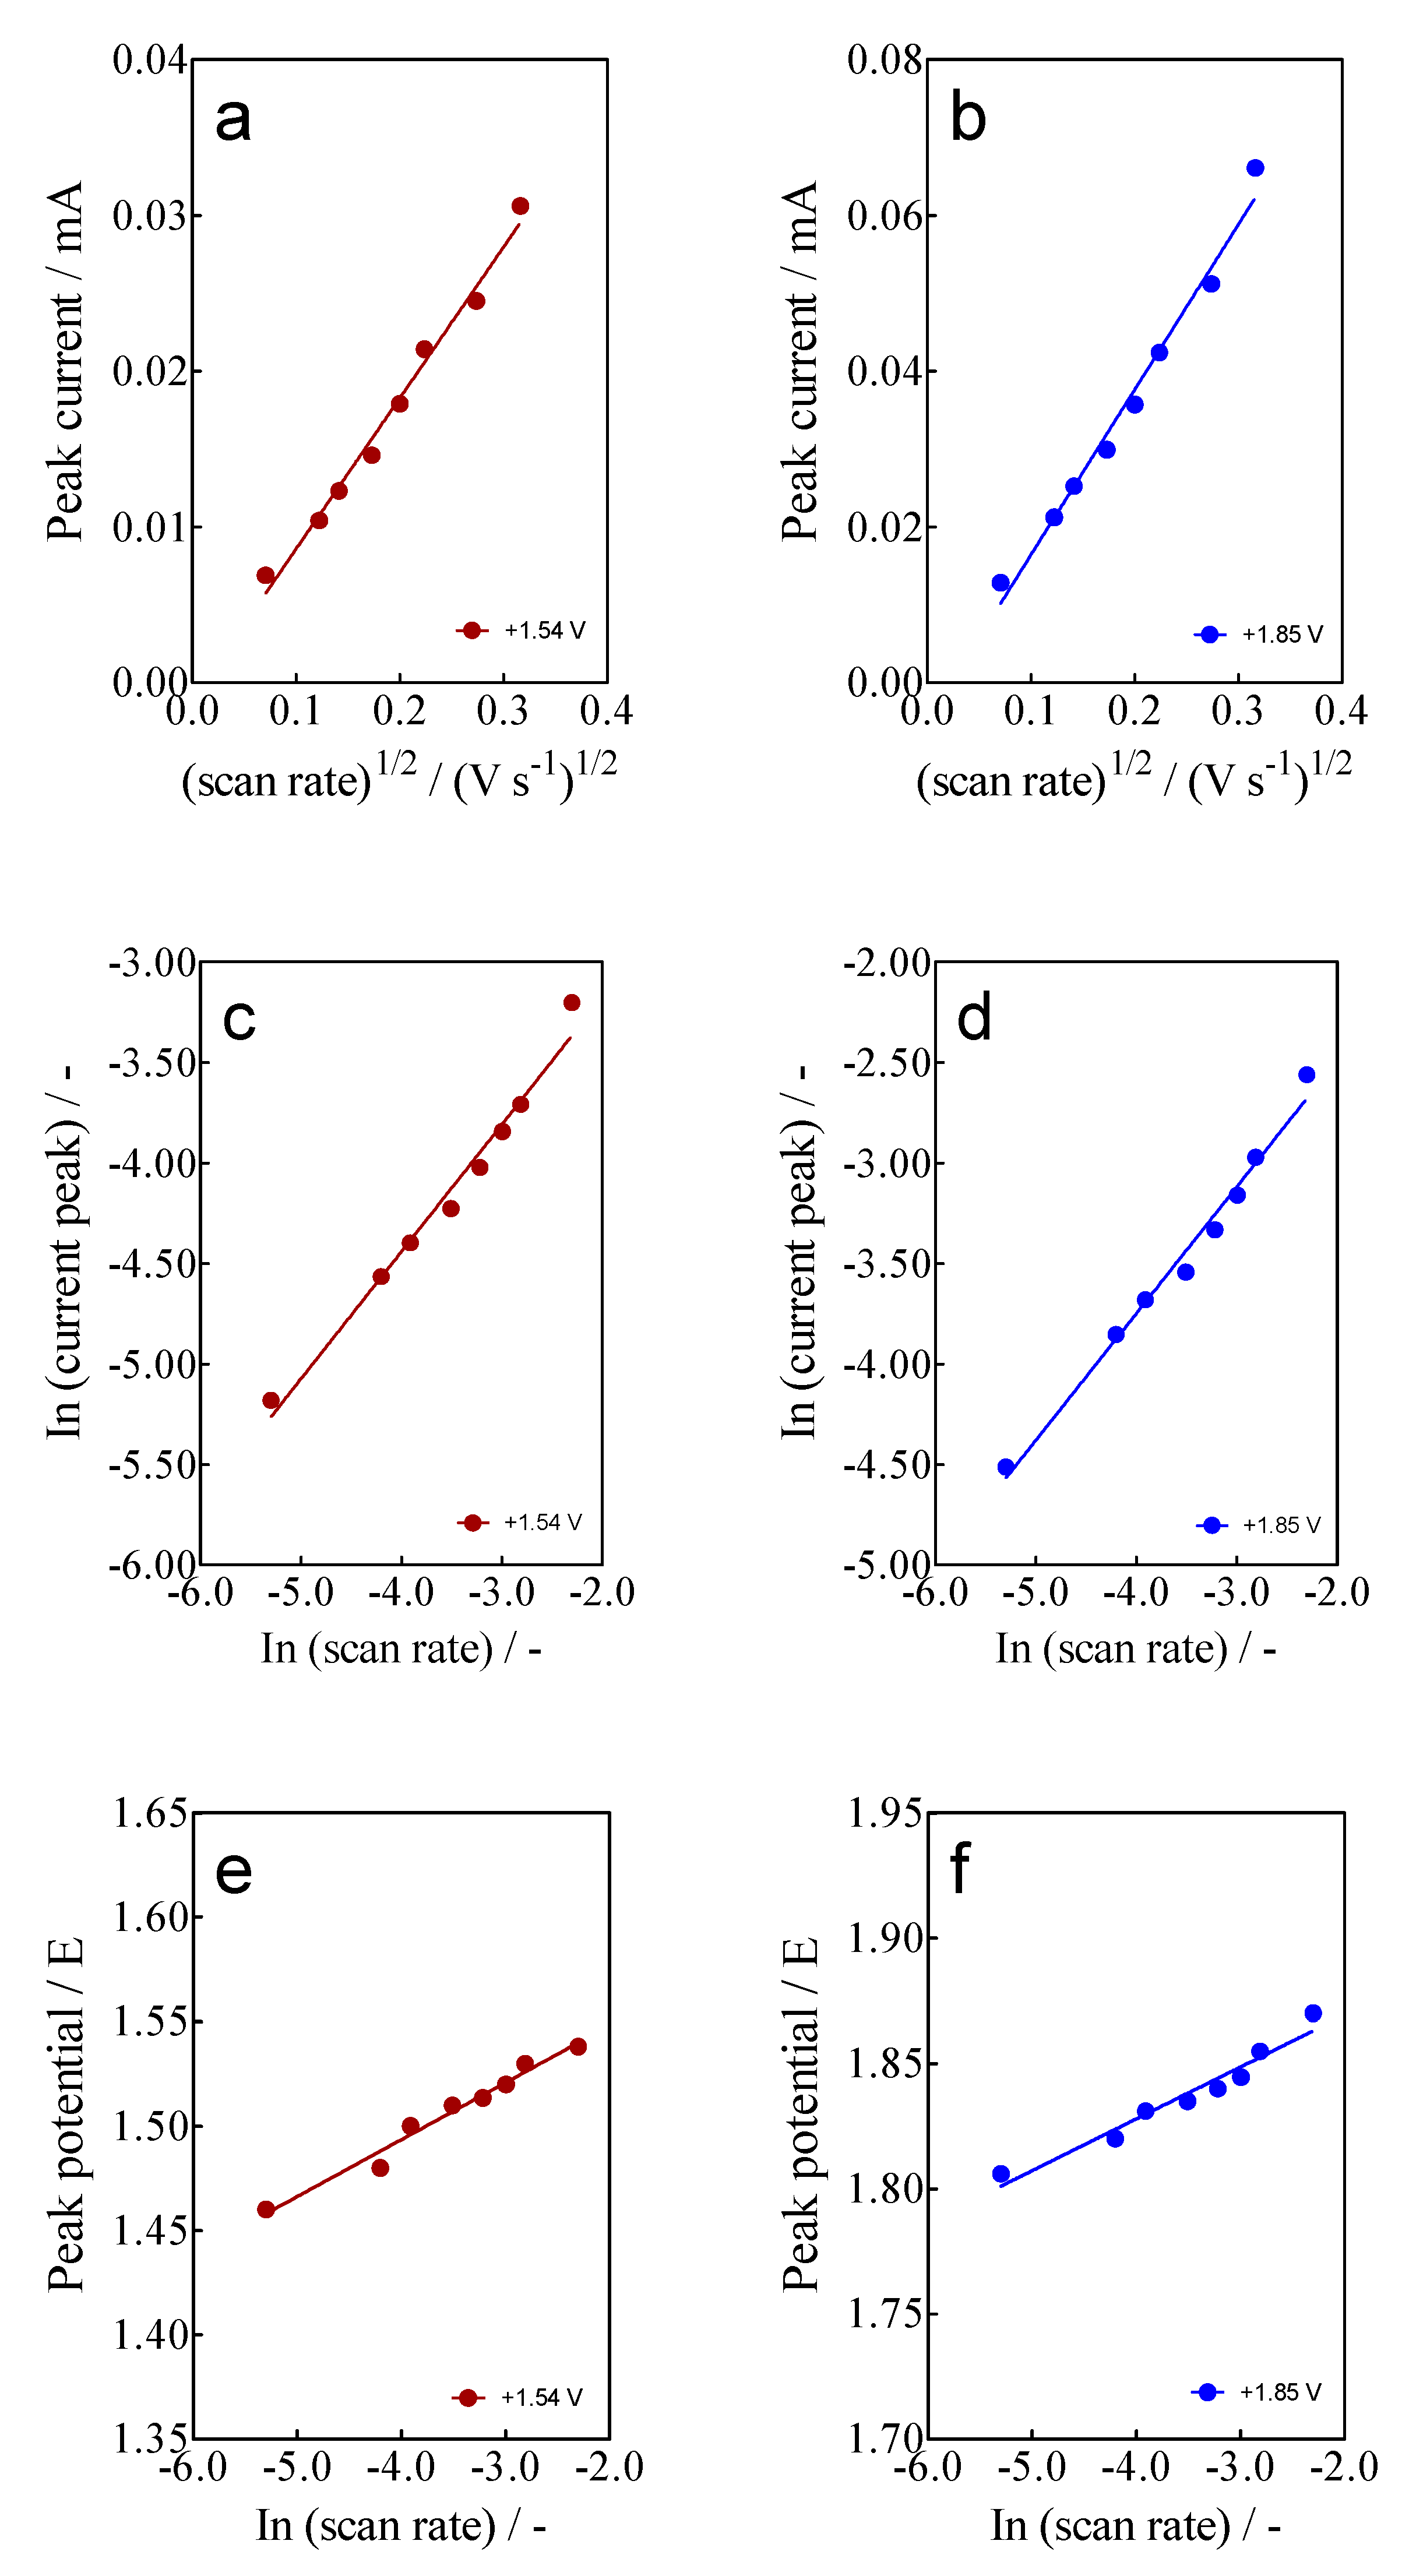
- For anodic peaks at the lower overpotential region (<1.6 V), Epa1 (+0.63 V) and Epa2 (+1.00 V), a linear relationship of the Ip (for both peaks) with the scan rate, according to the Randles–Sevcik model [46], is attained, suggesting an adsorption step of Calcon on the BDD surface (Figure 4a,b). This is also confirmed by the non-linear dependence on the Epa1 and Epa2 vs. scan rate (Figure 4c) as well as on the Ip (for both peaks) with the square root of the scan rate (Figure 4e,f), as shown in Figure 4. Therefore, a direct interaction of the Calcon structure could be attained at Epa1 (+0.63 V) and Epa2 (+1.00 V) via an electron-transfer reaction as the first step of the oxidation process [46].
- (ii)
- For the current-voltammetric signals, identified as Epa3 (+1.54 V) and Epa4 (+1.85 V), the Randles–Sevcik model was not followed (Ip vs. scan rate), indicating that the non-dependency on the direct-electron transfer reactions is attained at the high overpotential region [46]. Although the displacement of the peak potentials was not significant for these anodic peaks (Figure 3), the increase in the intensity of the current peaks (ip) with the square root of the scan rate (𝑣1/2) obeys the criterion established by Bard and Faulkner [46,47] for an irreversible process (Figure 5a,b), through the following Equation (3) in the range of 5 to 100 mV s−1 (Figure 5):
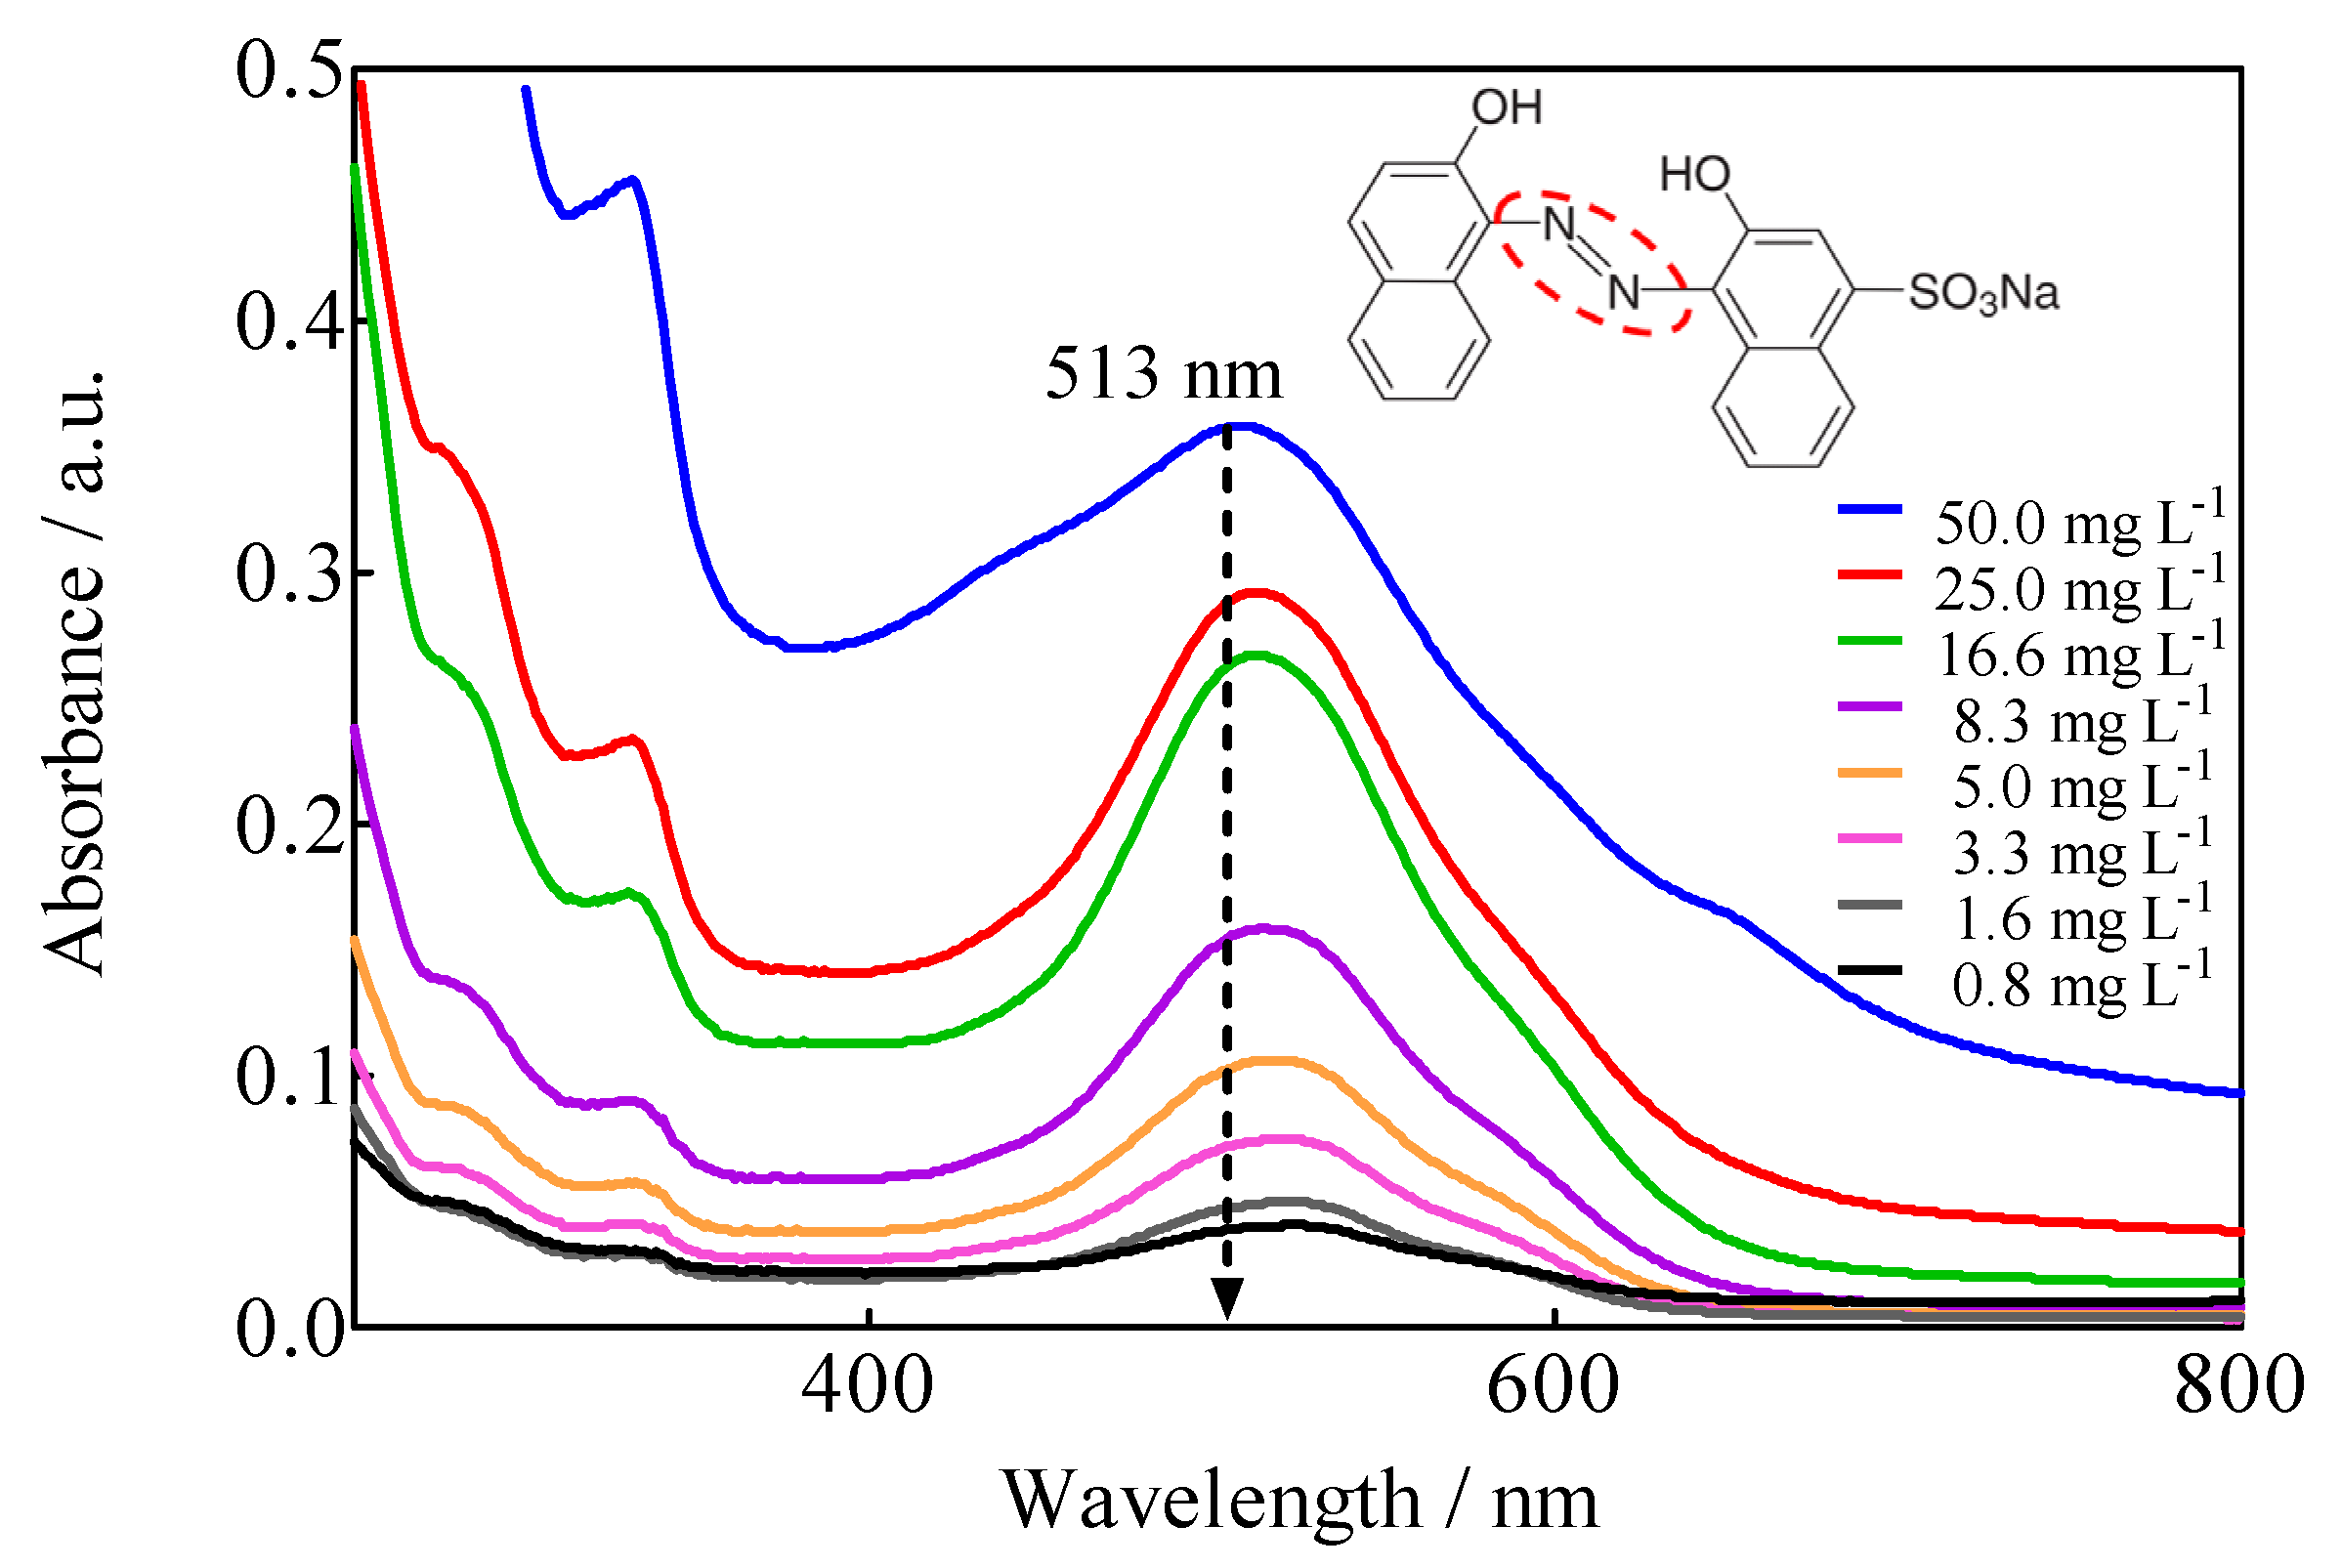
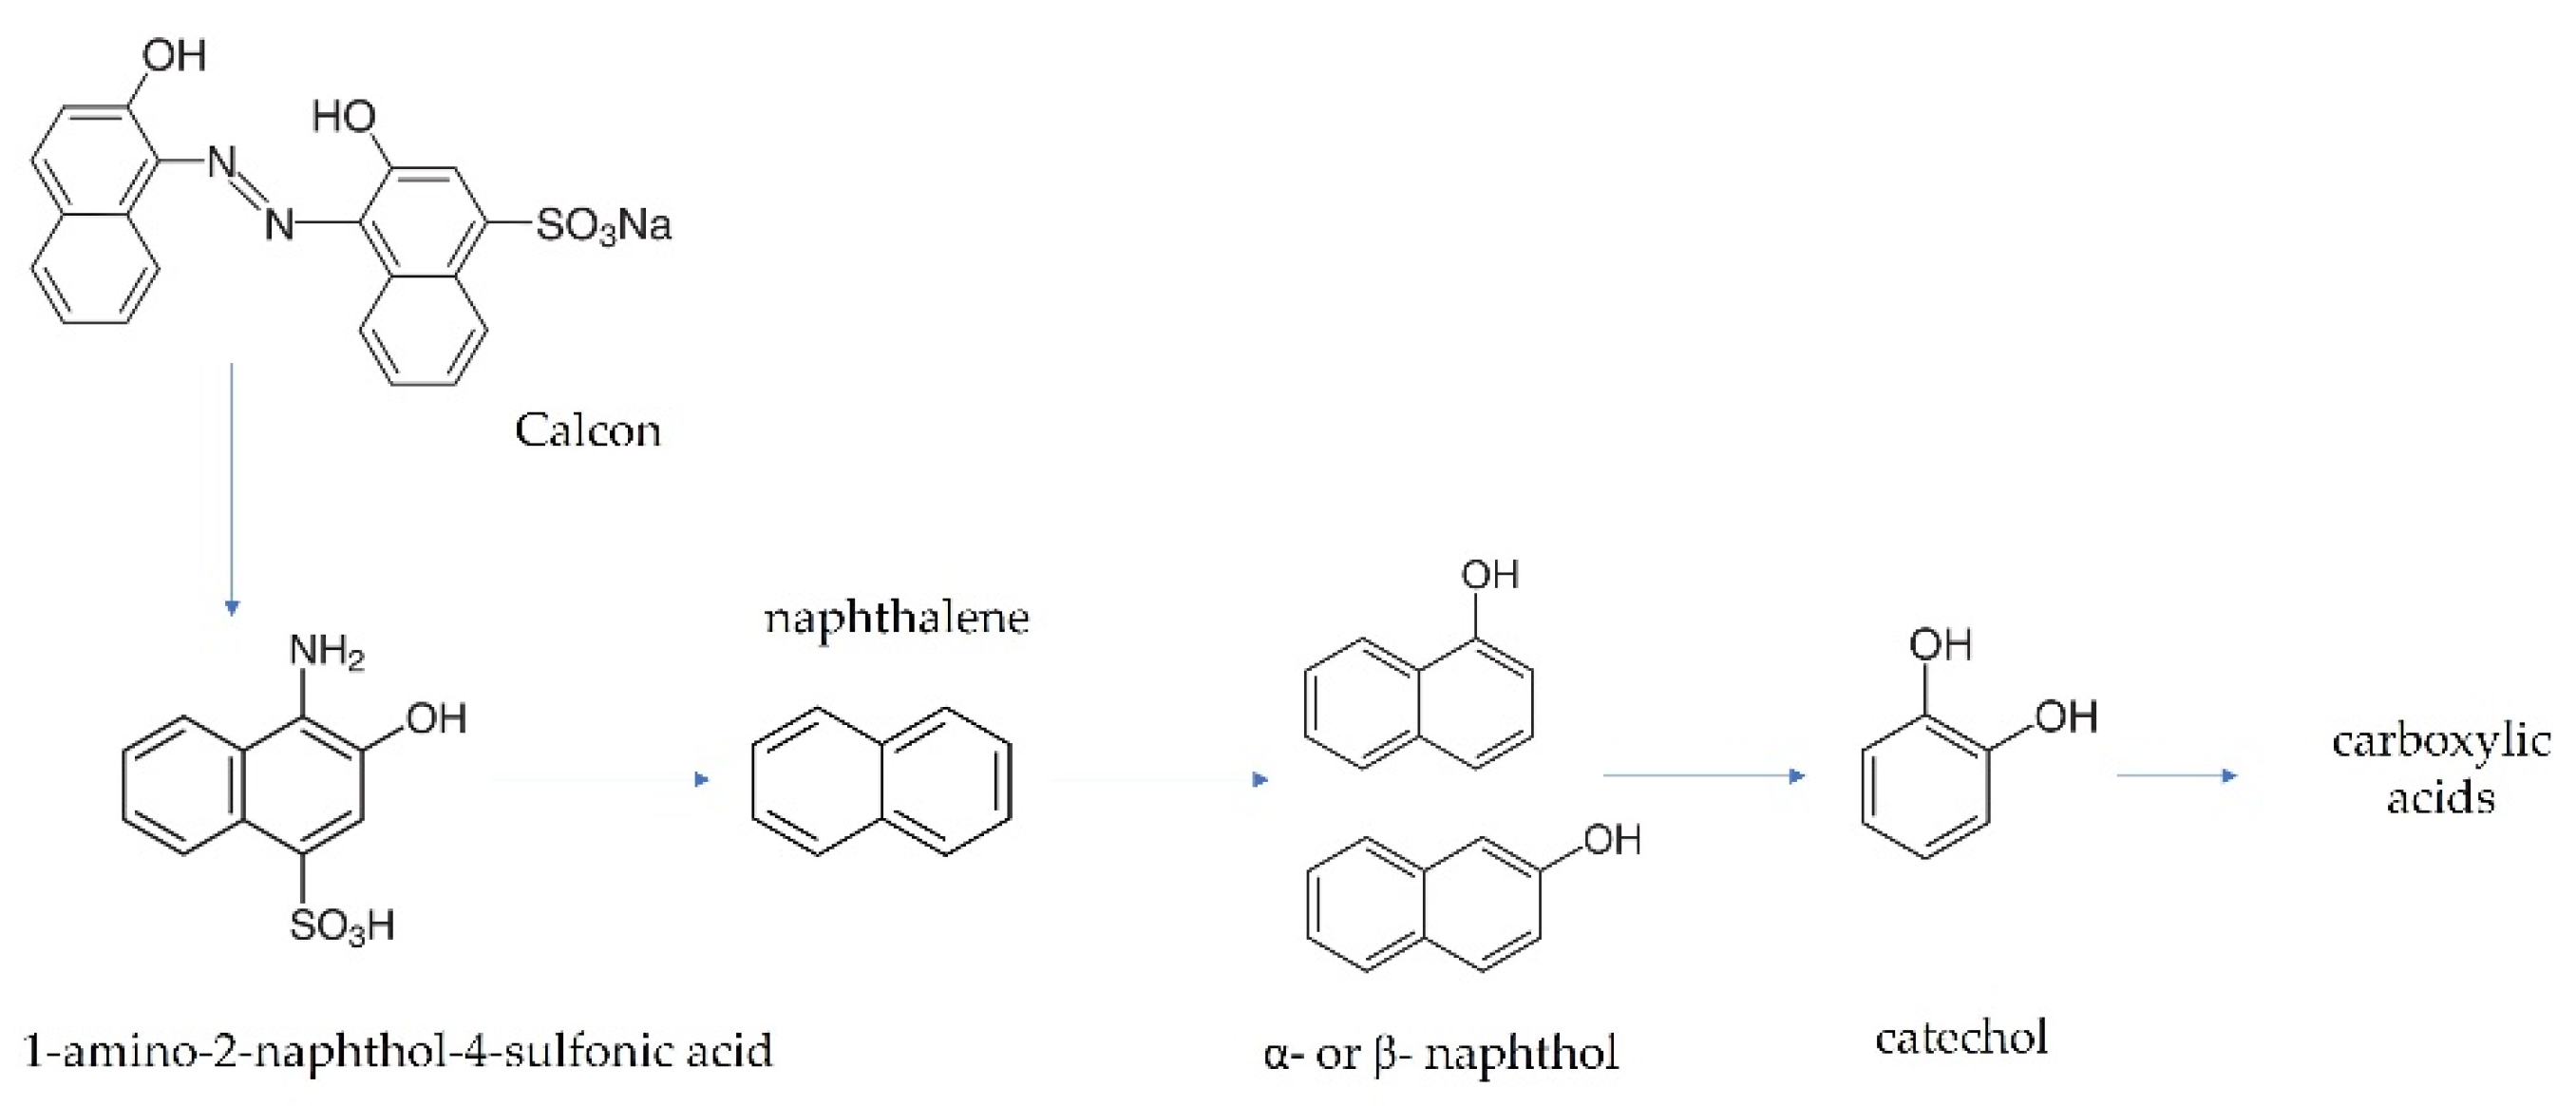
3.2. UV-Vis Spectroscopic Characteristics of Calcon in Aqueous Media
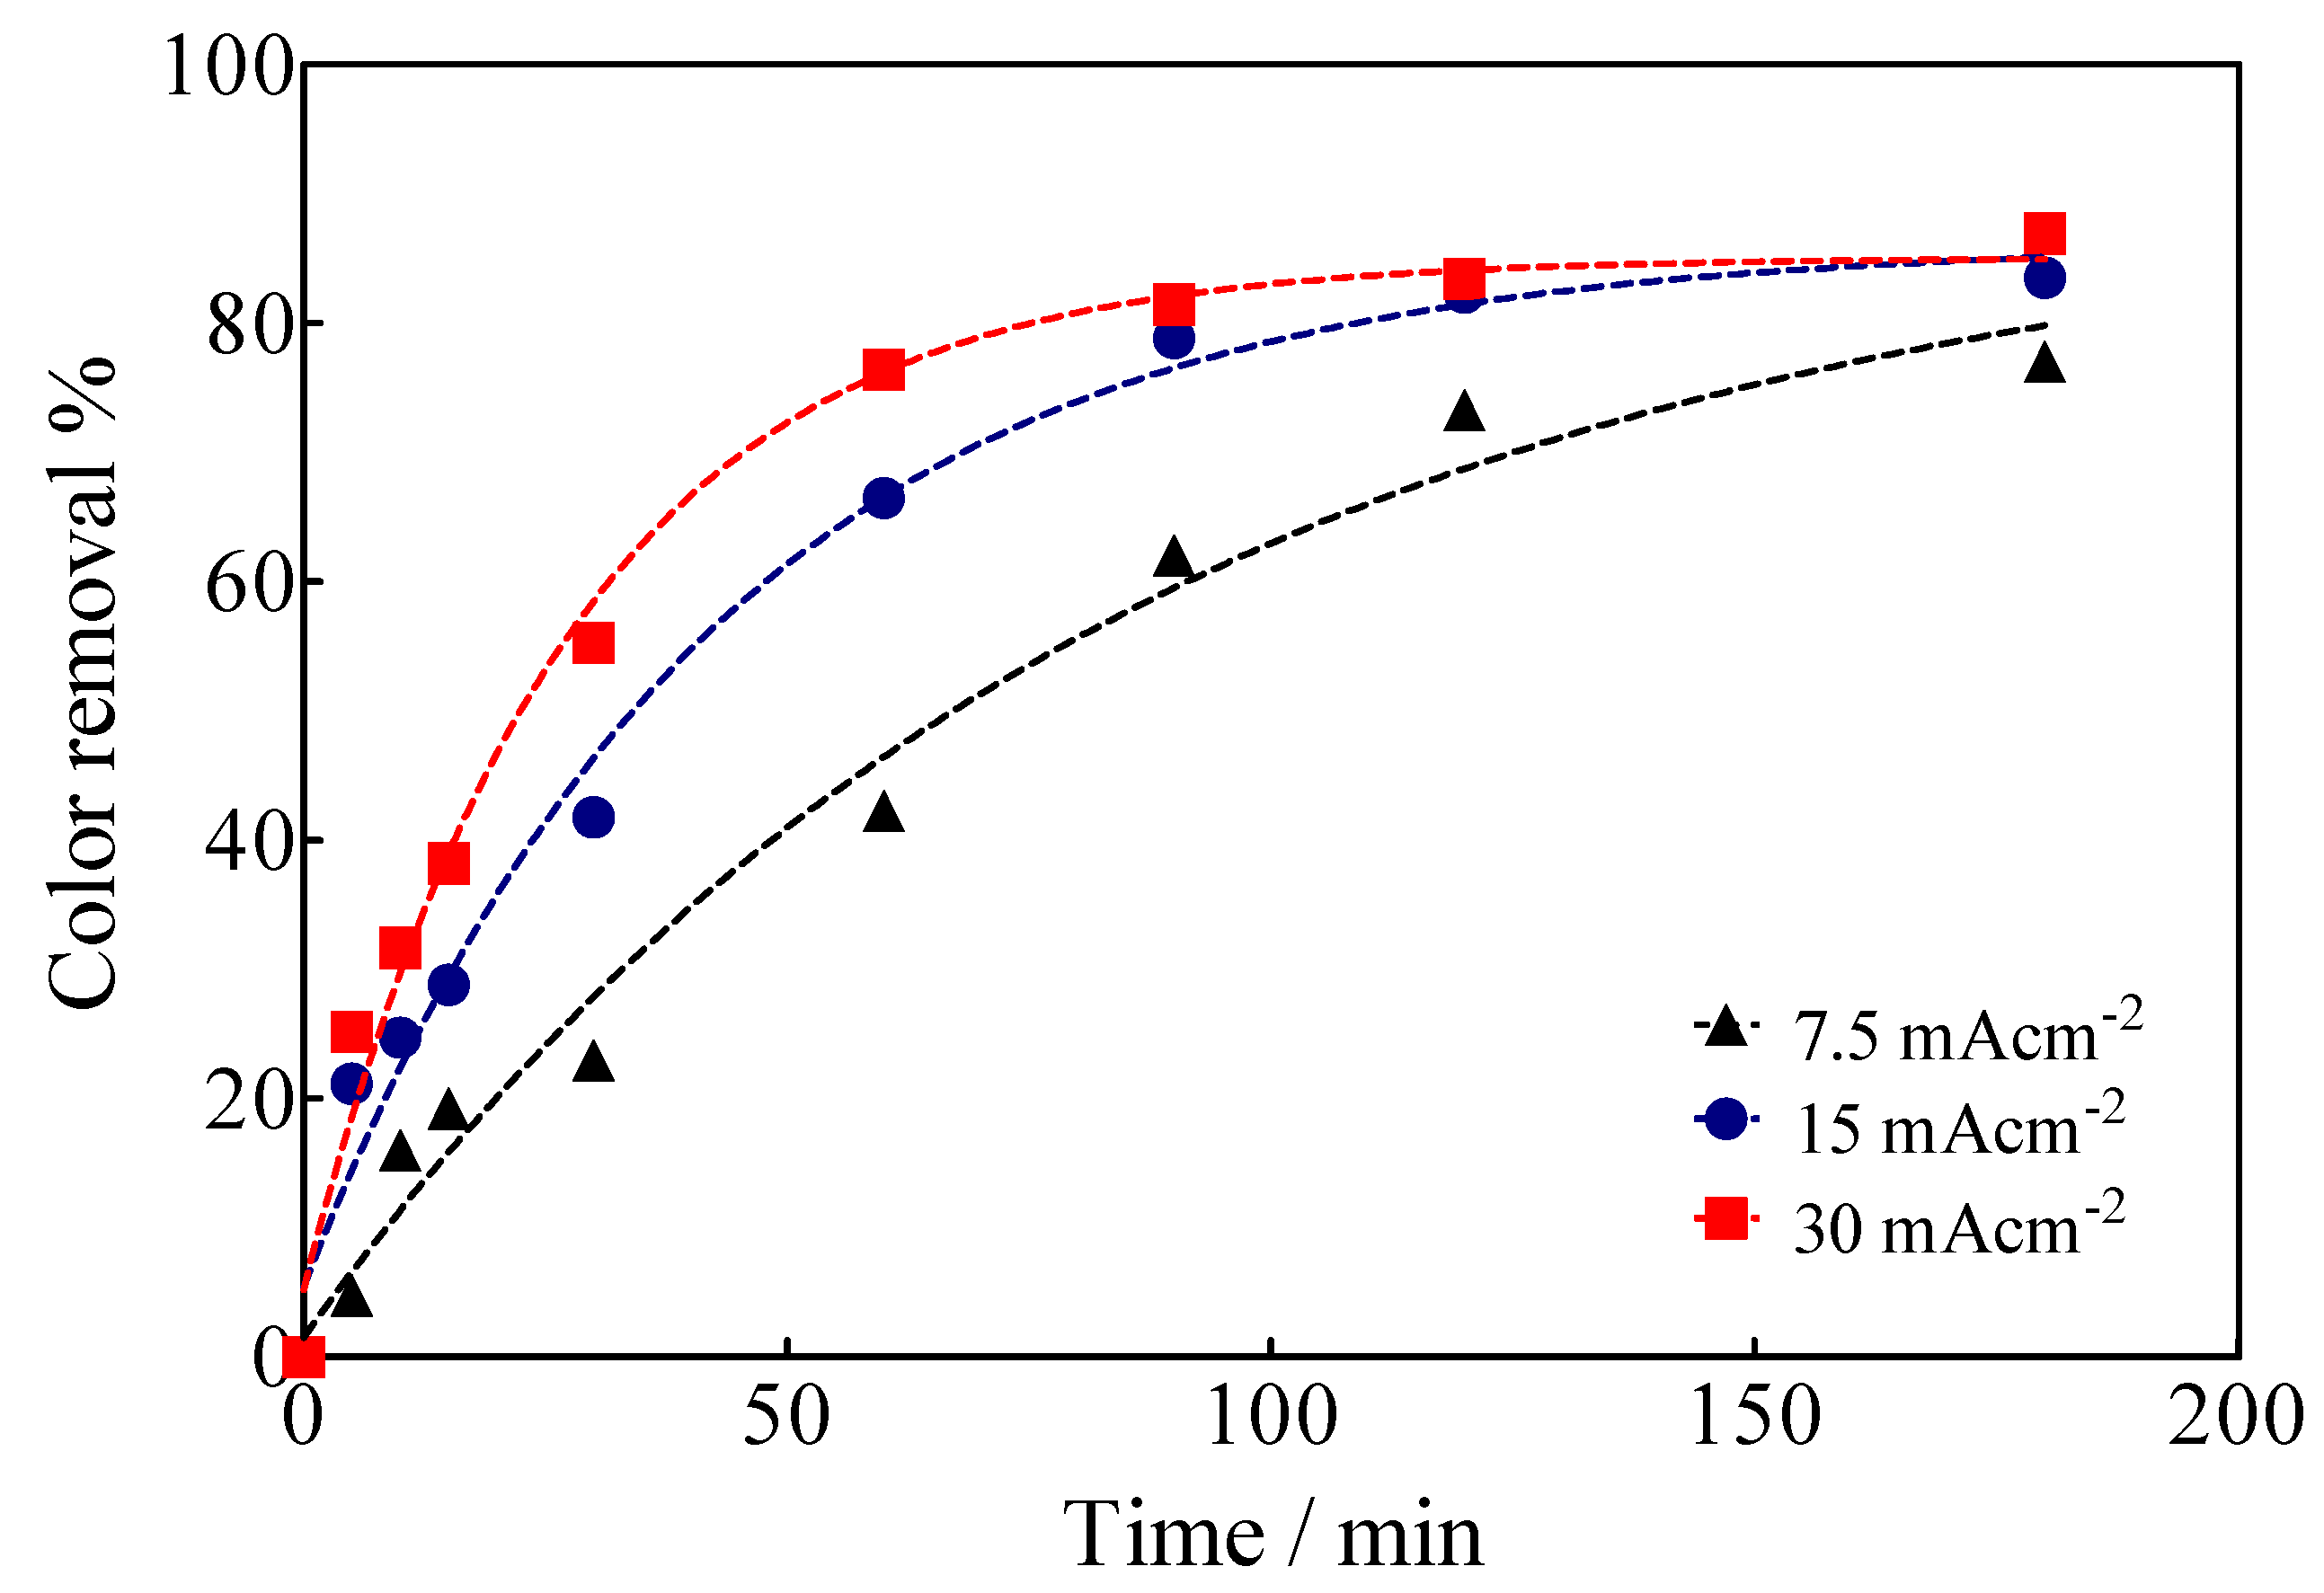
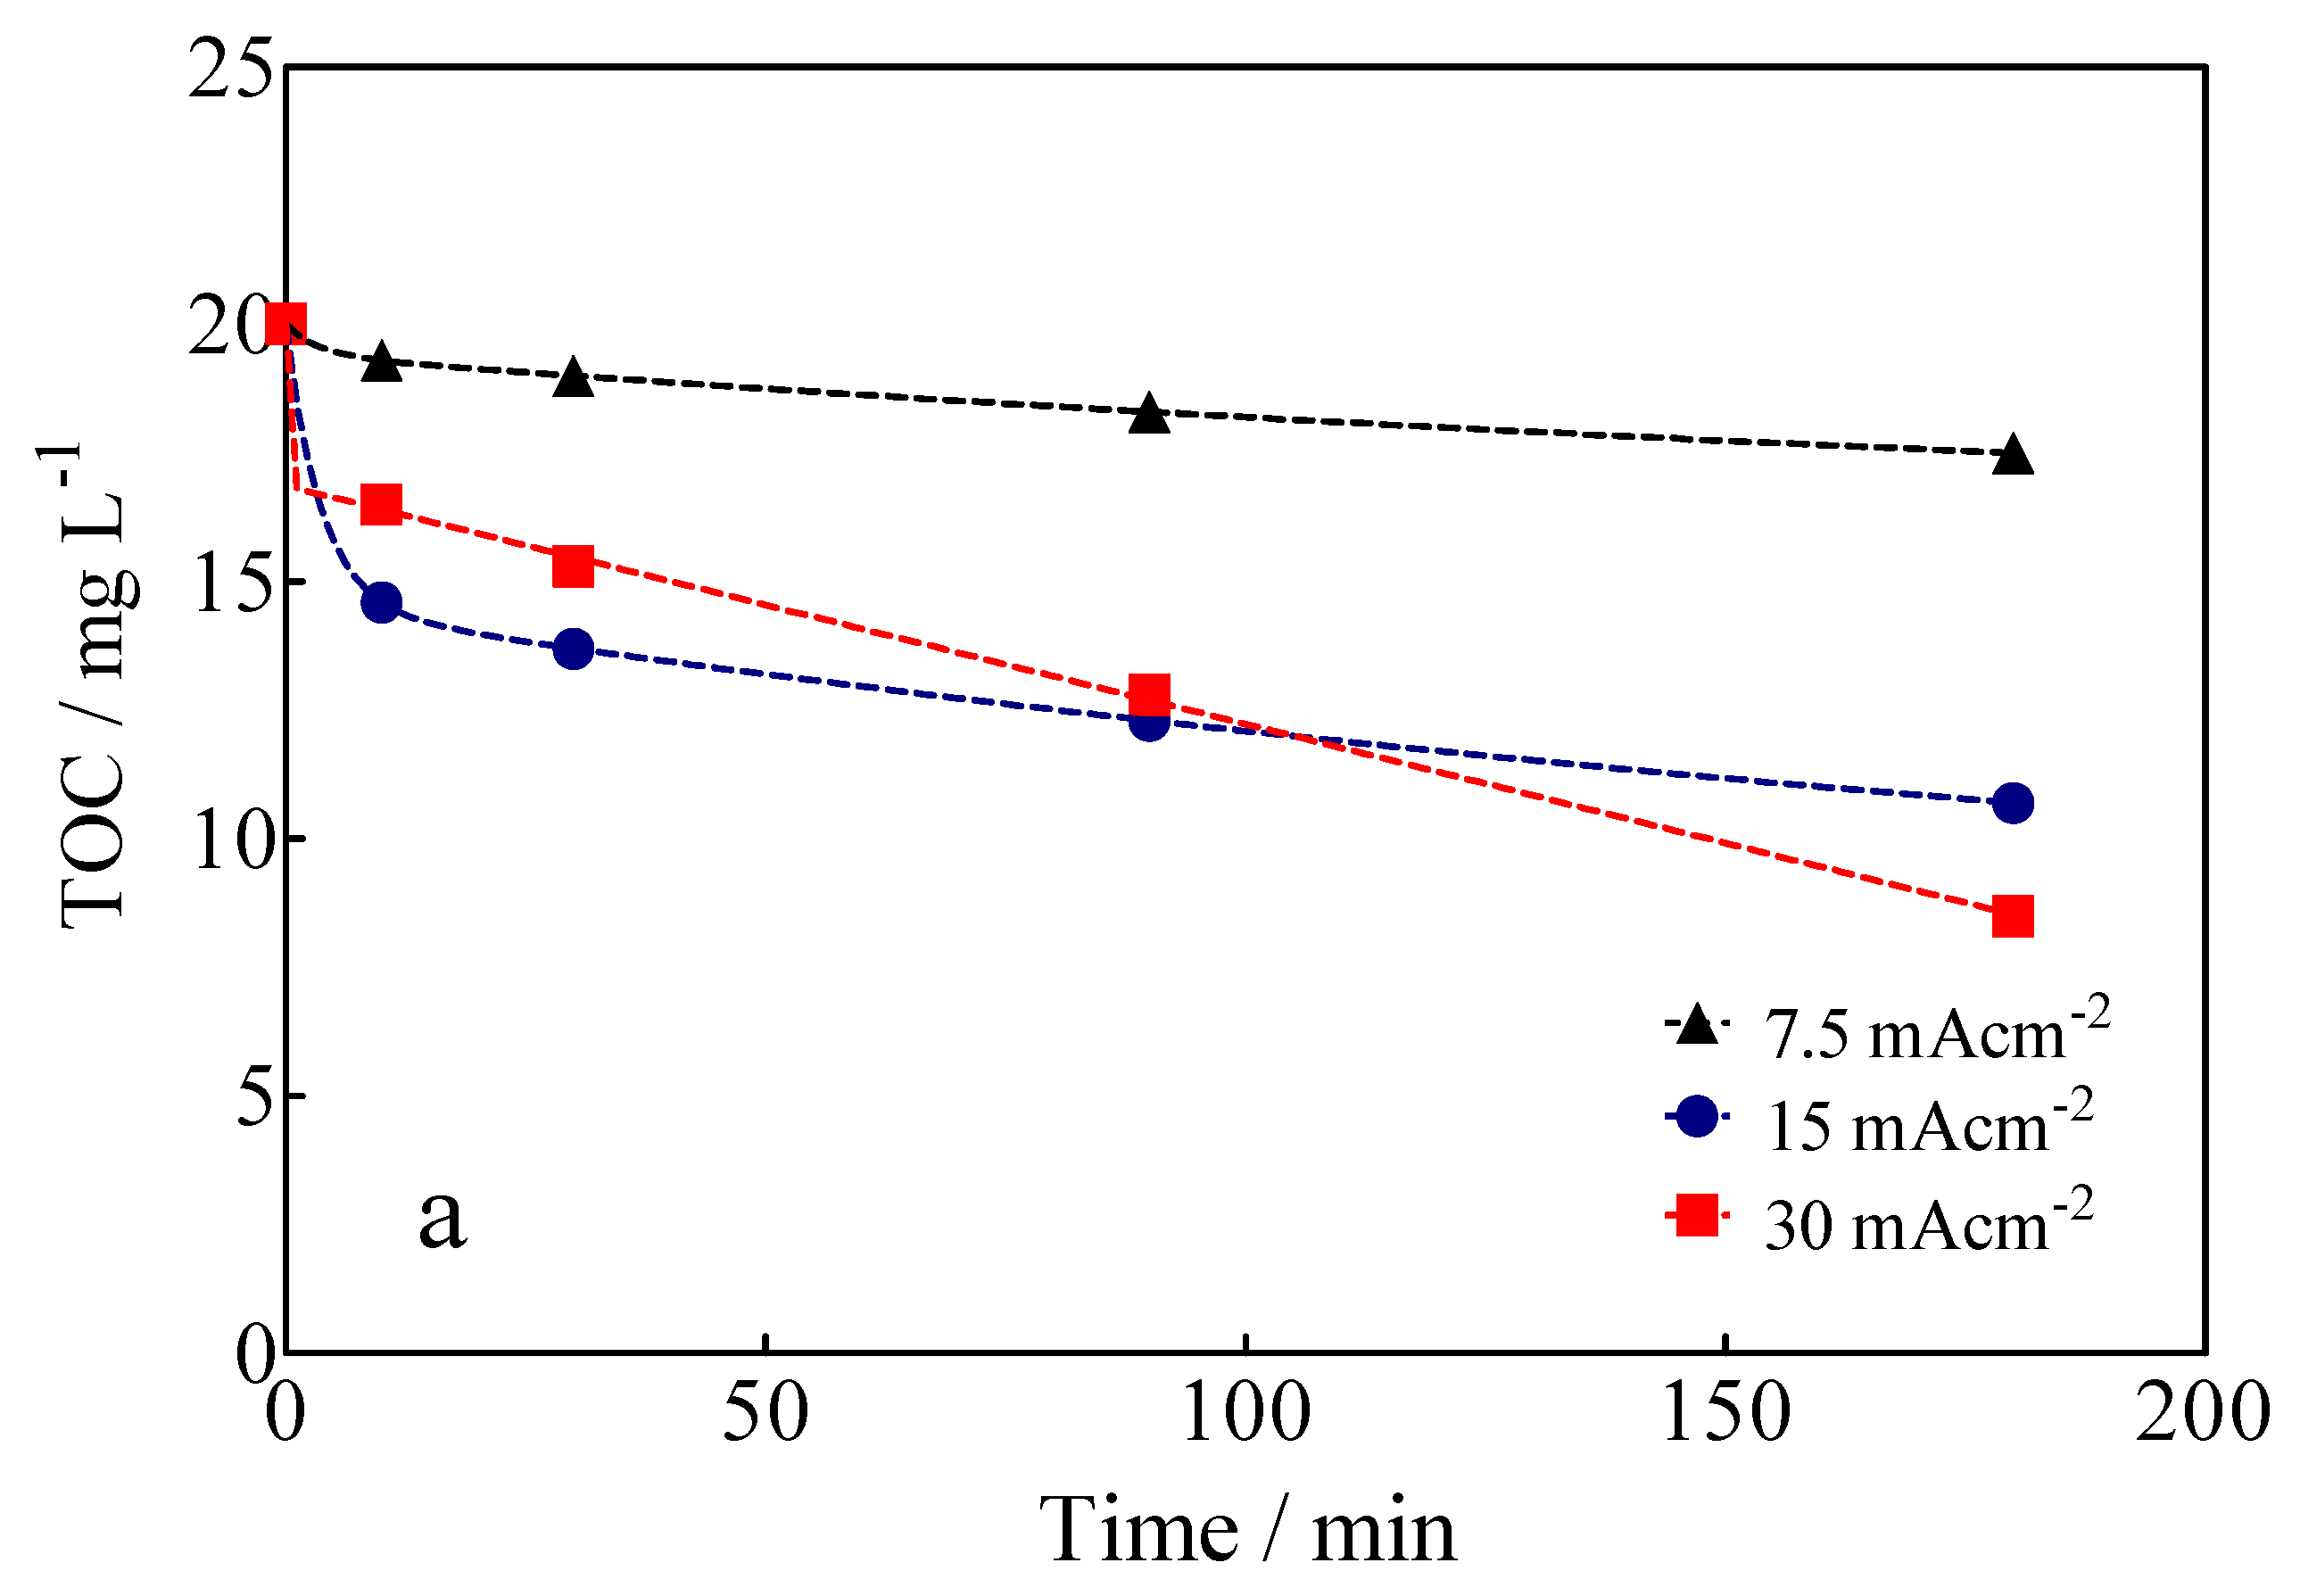
3.3. Electrochemical Oxidation of Calcon
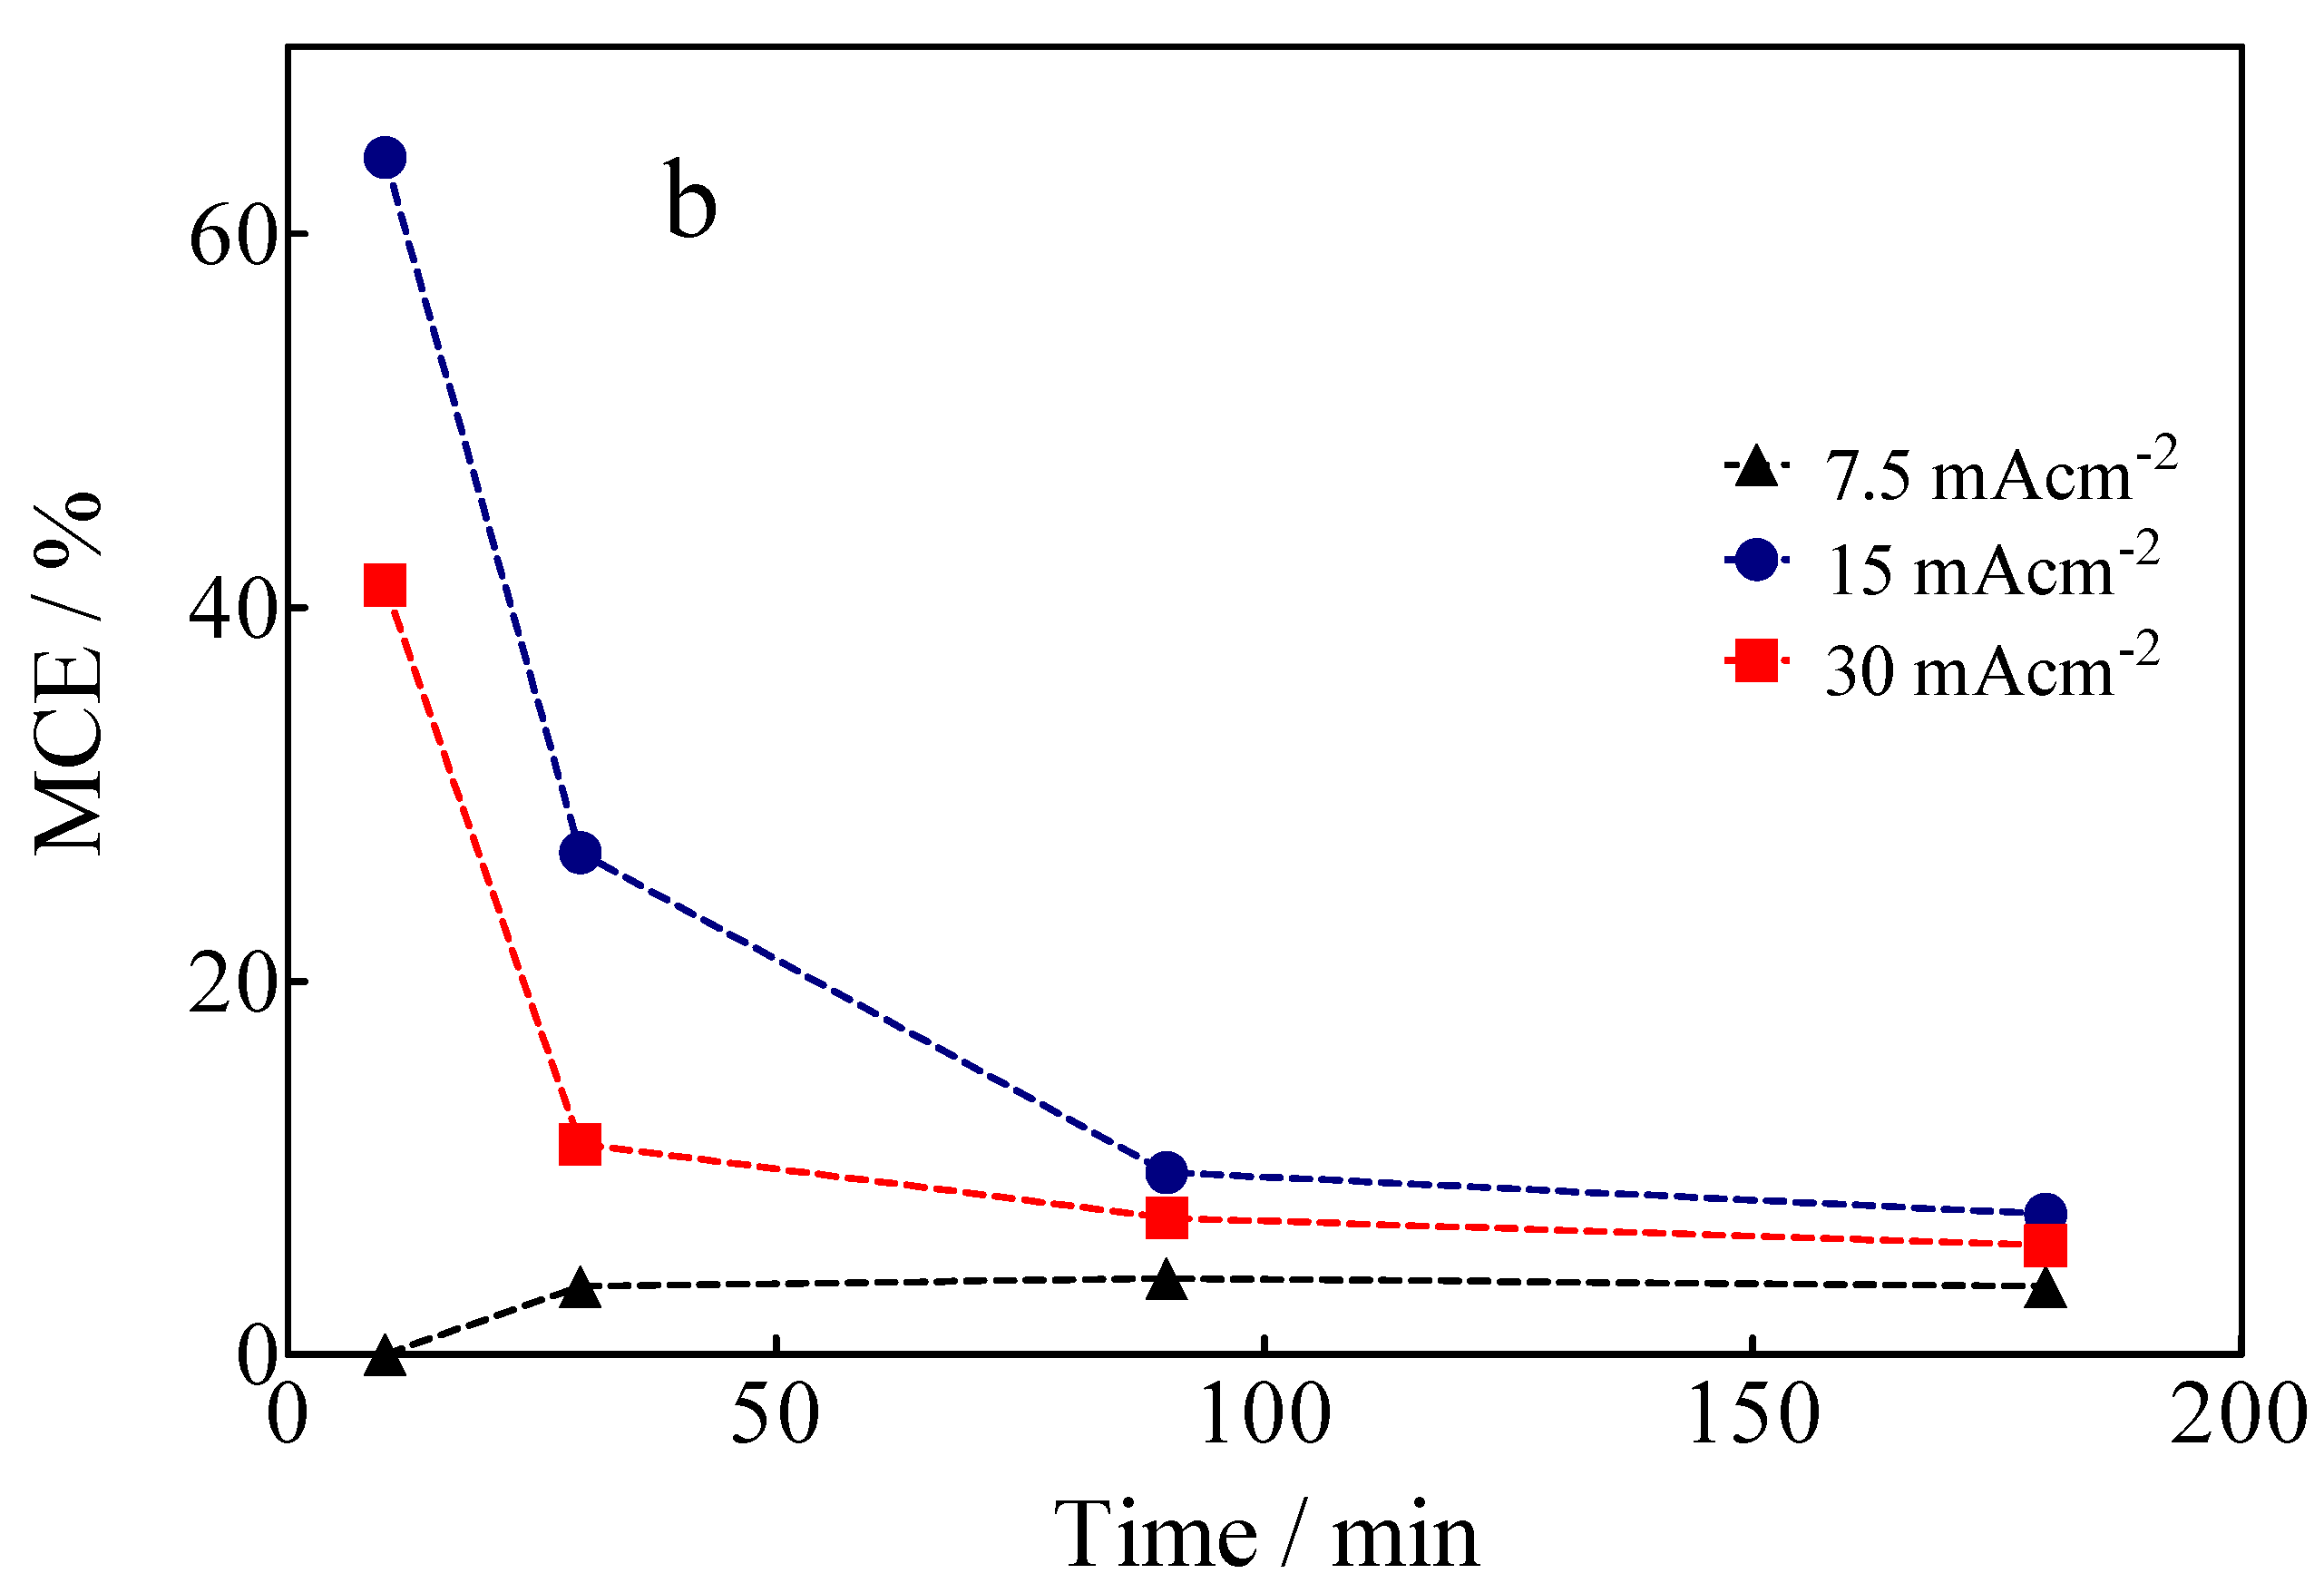
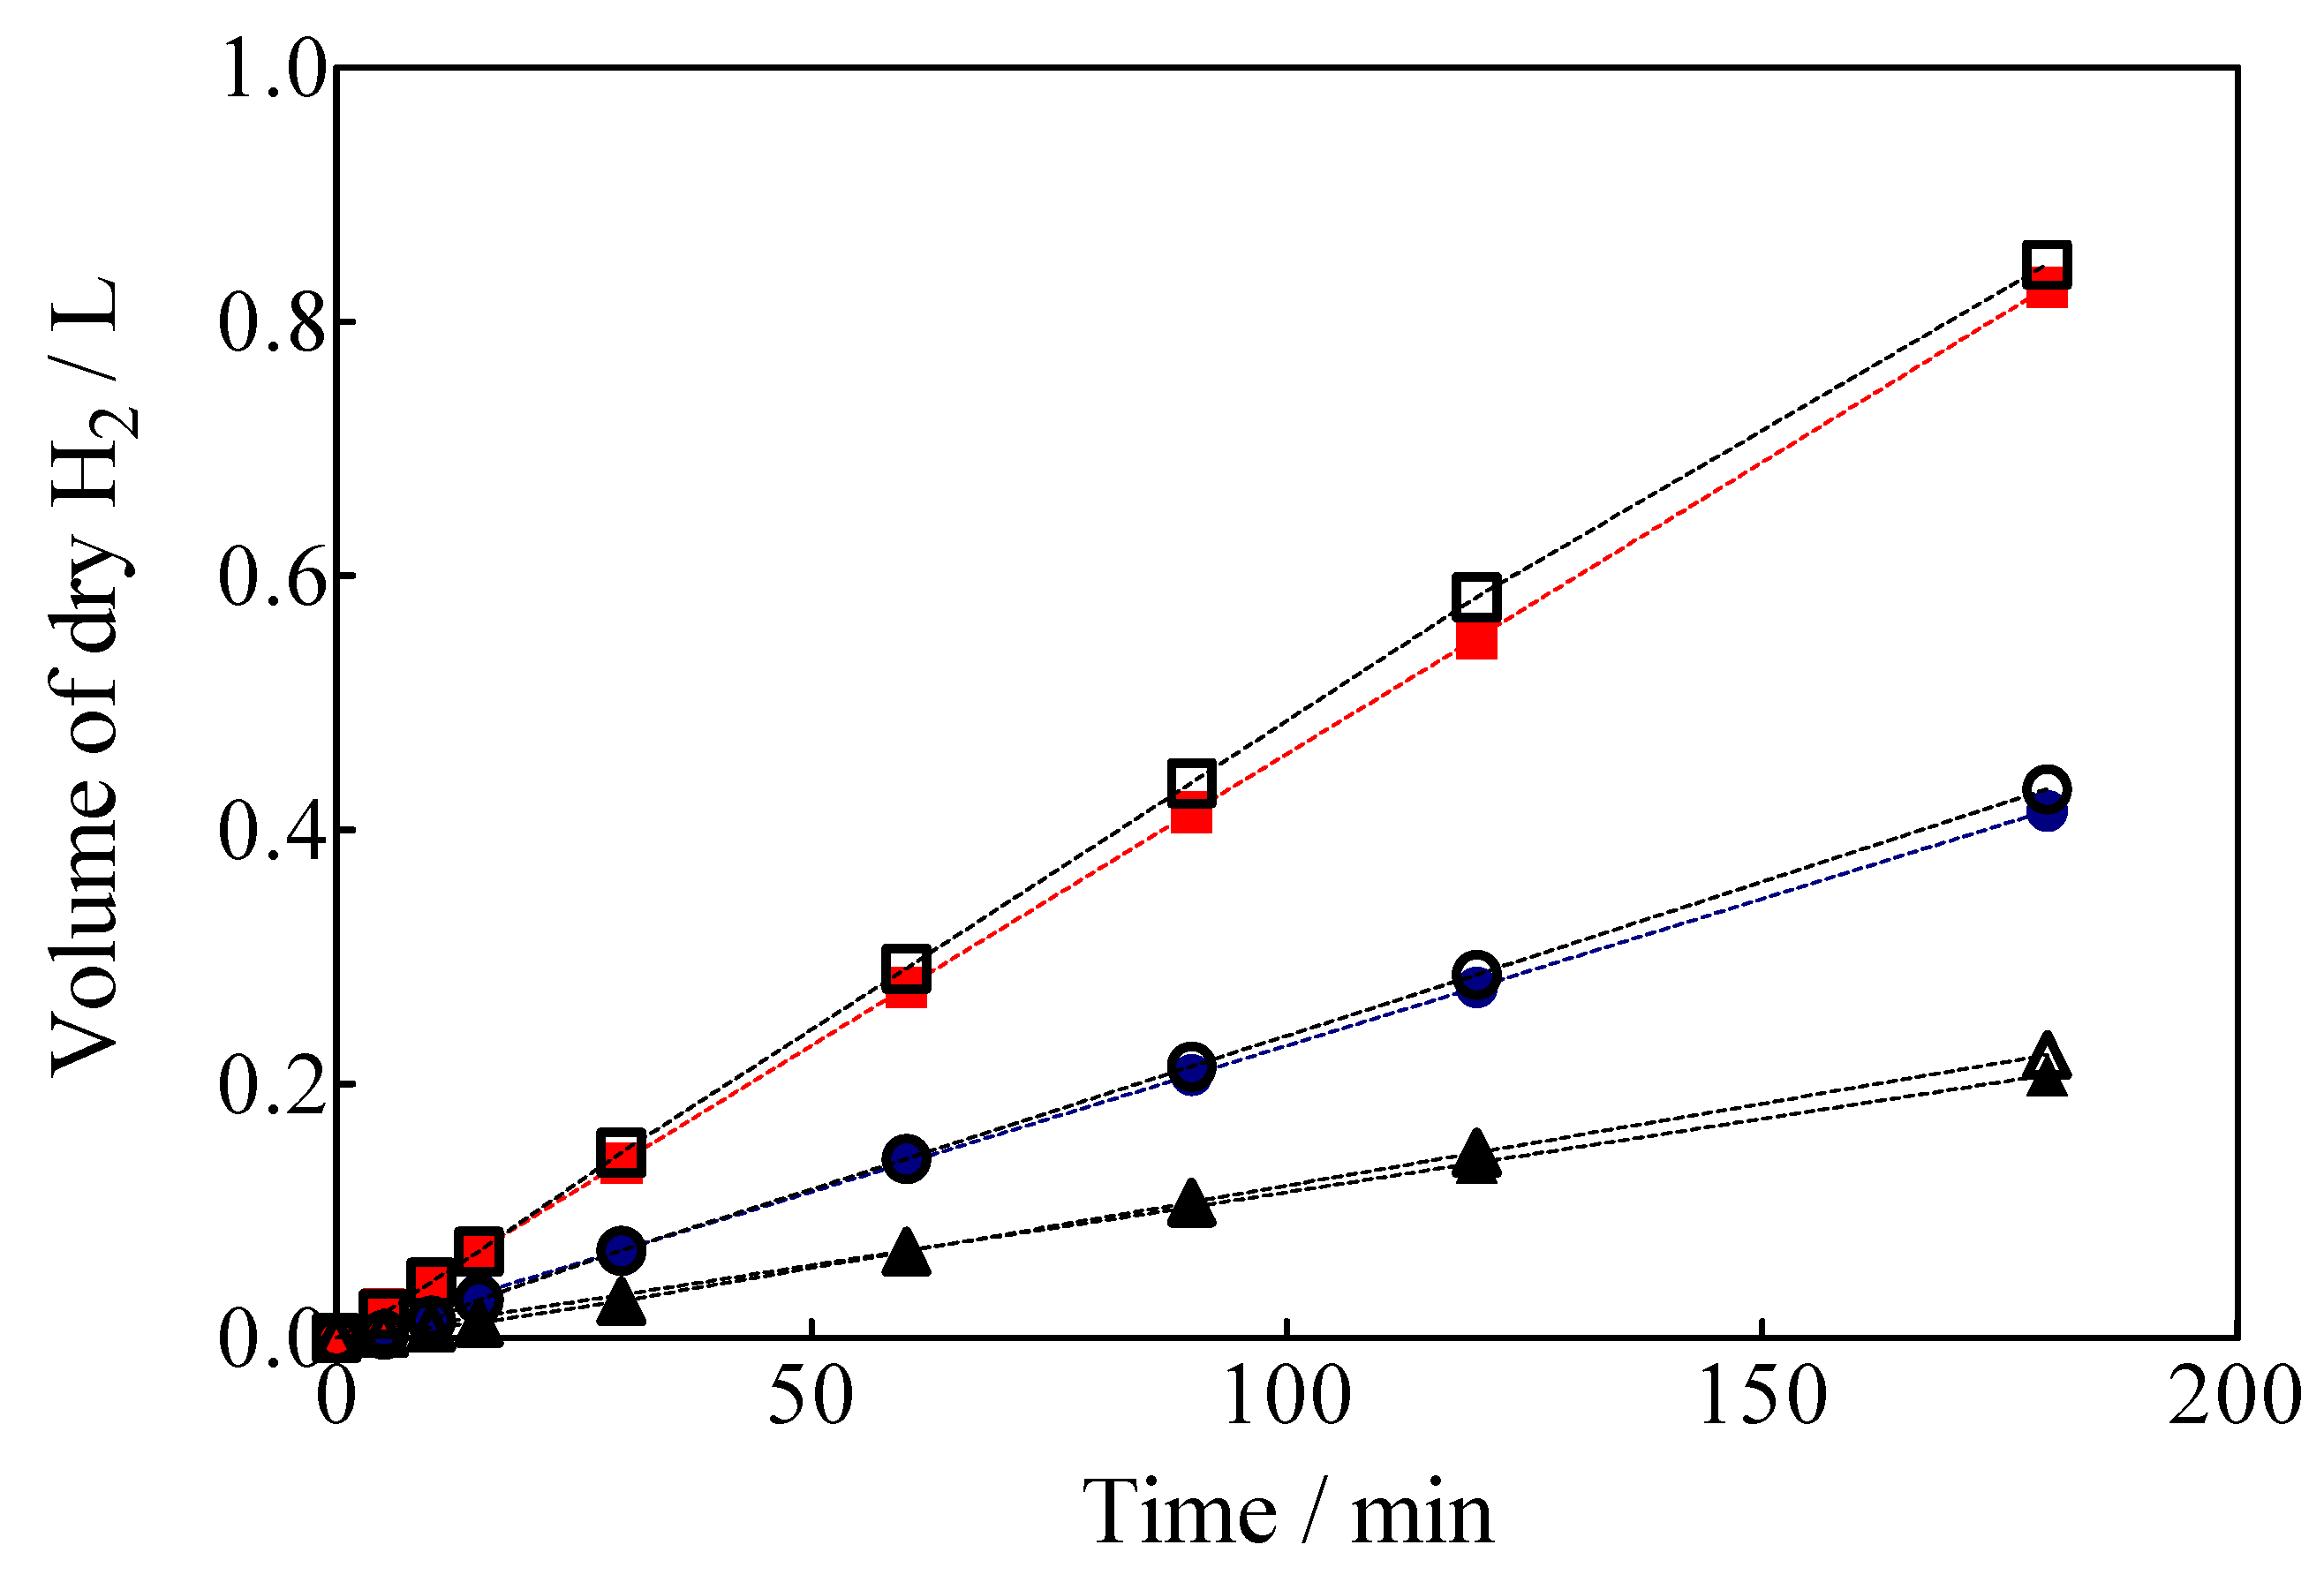
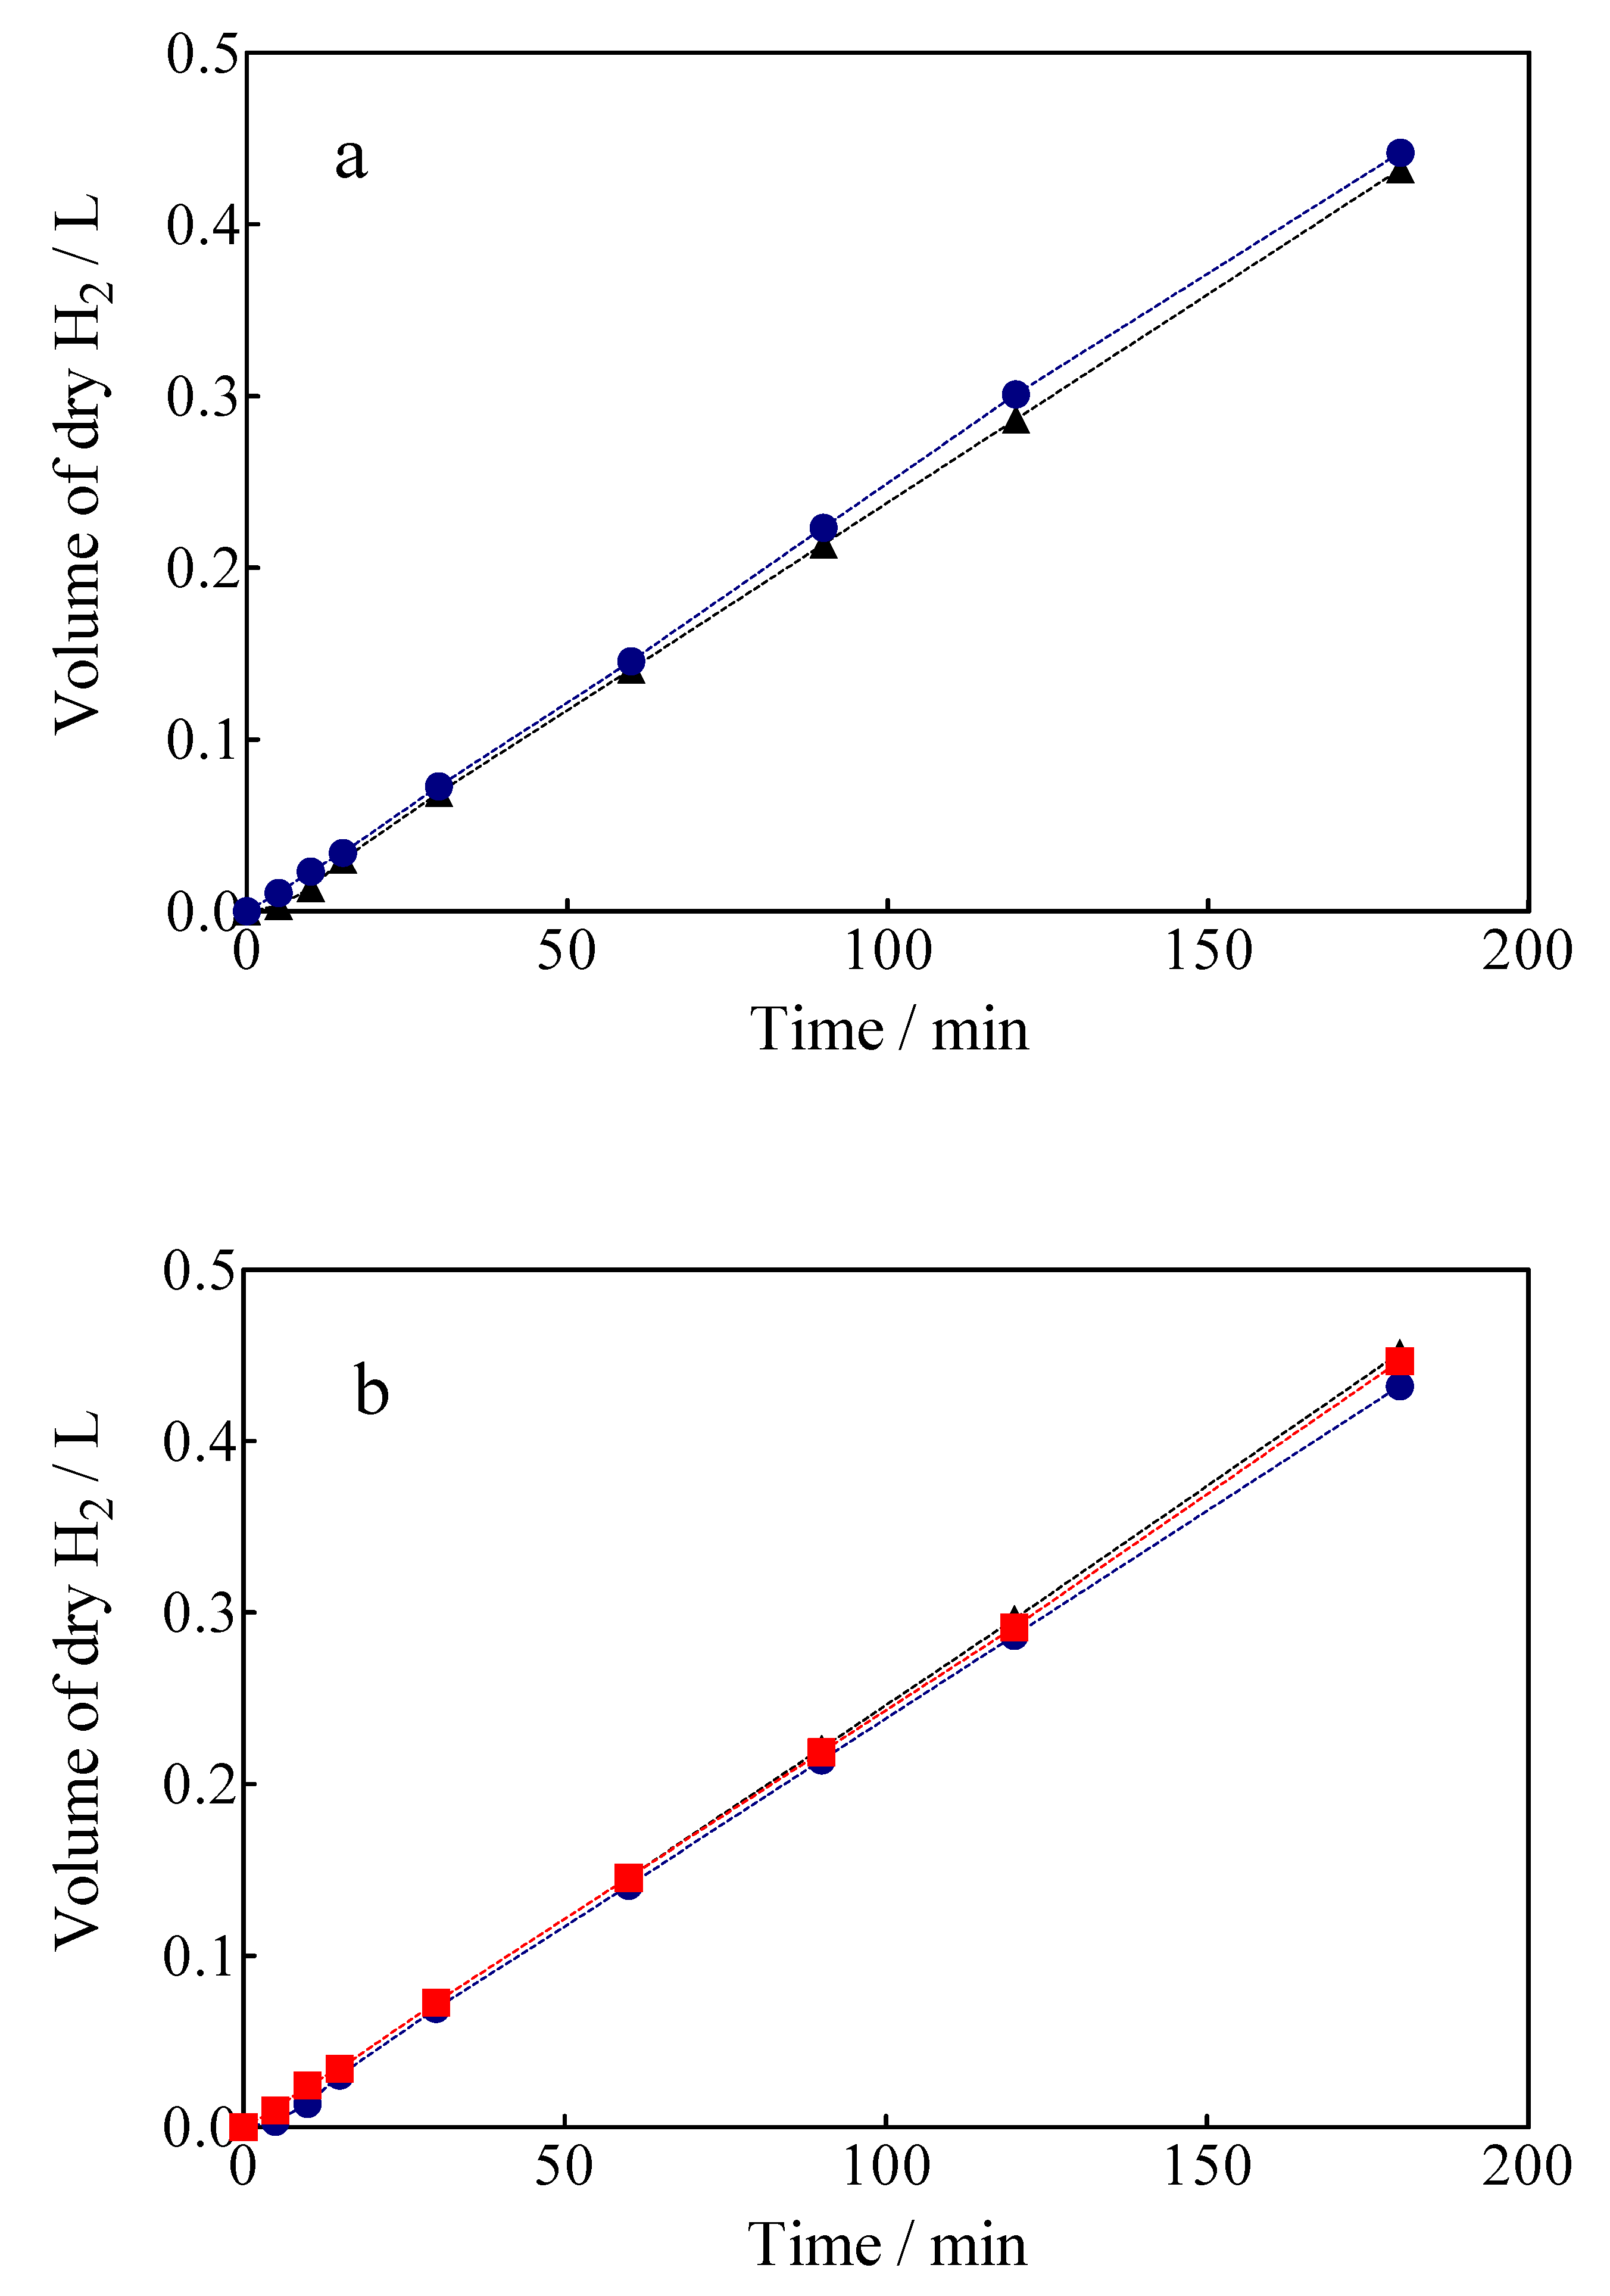
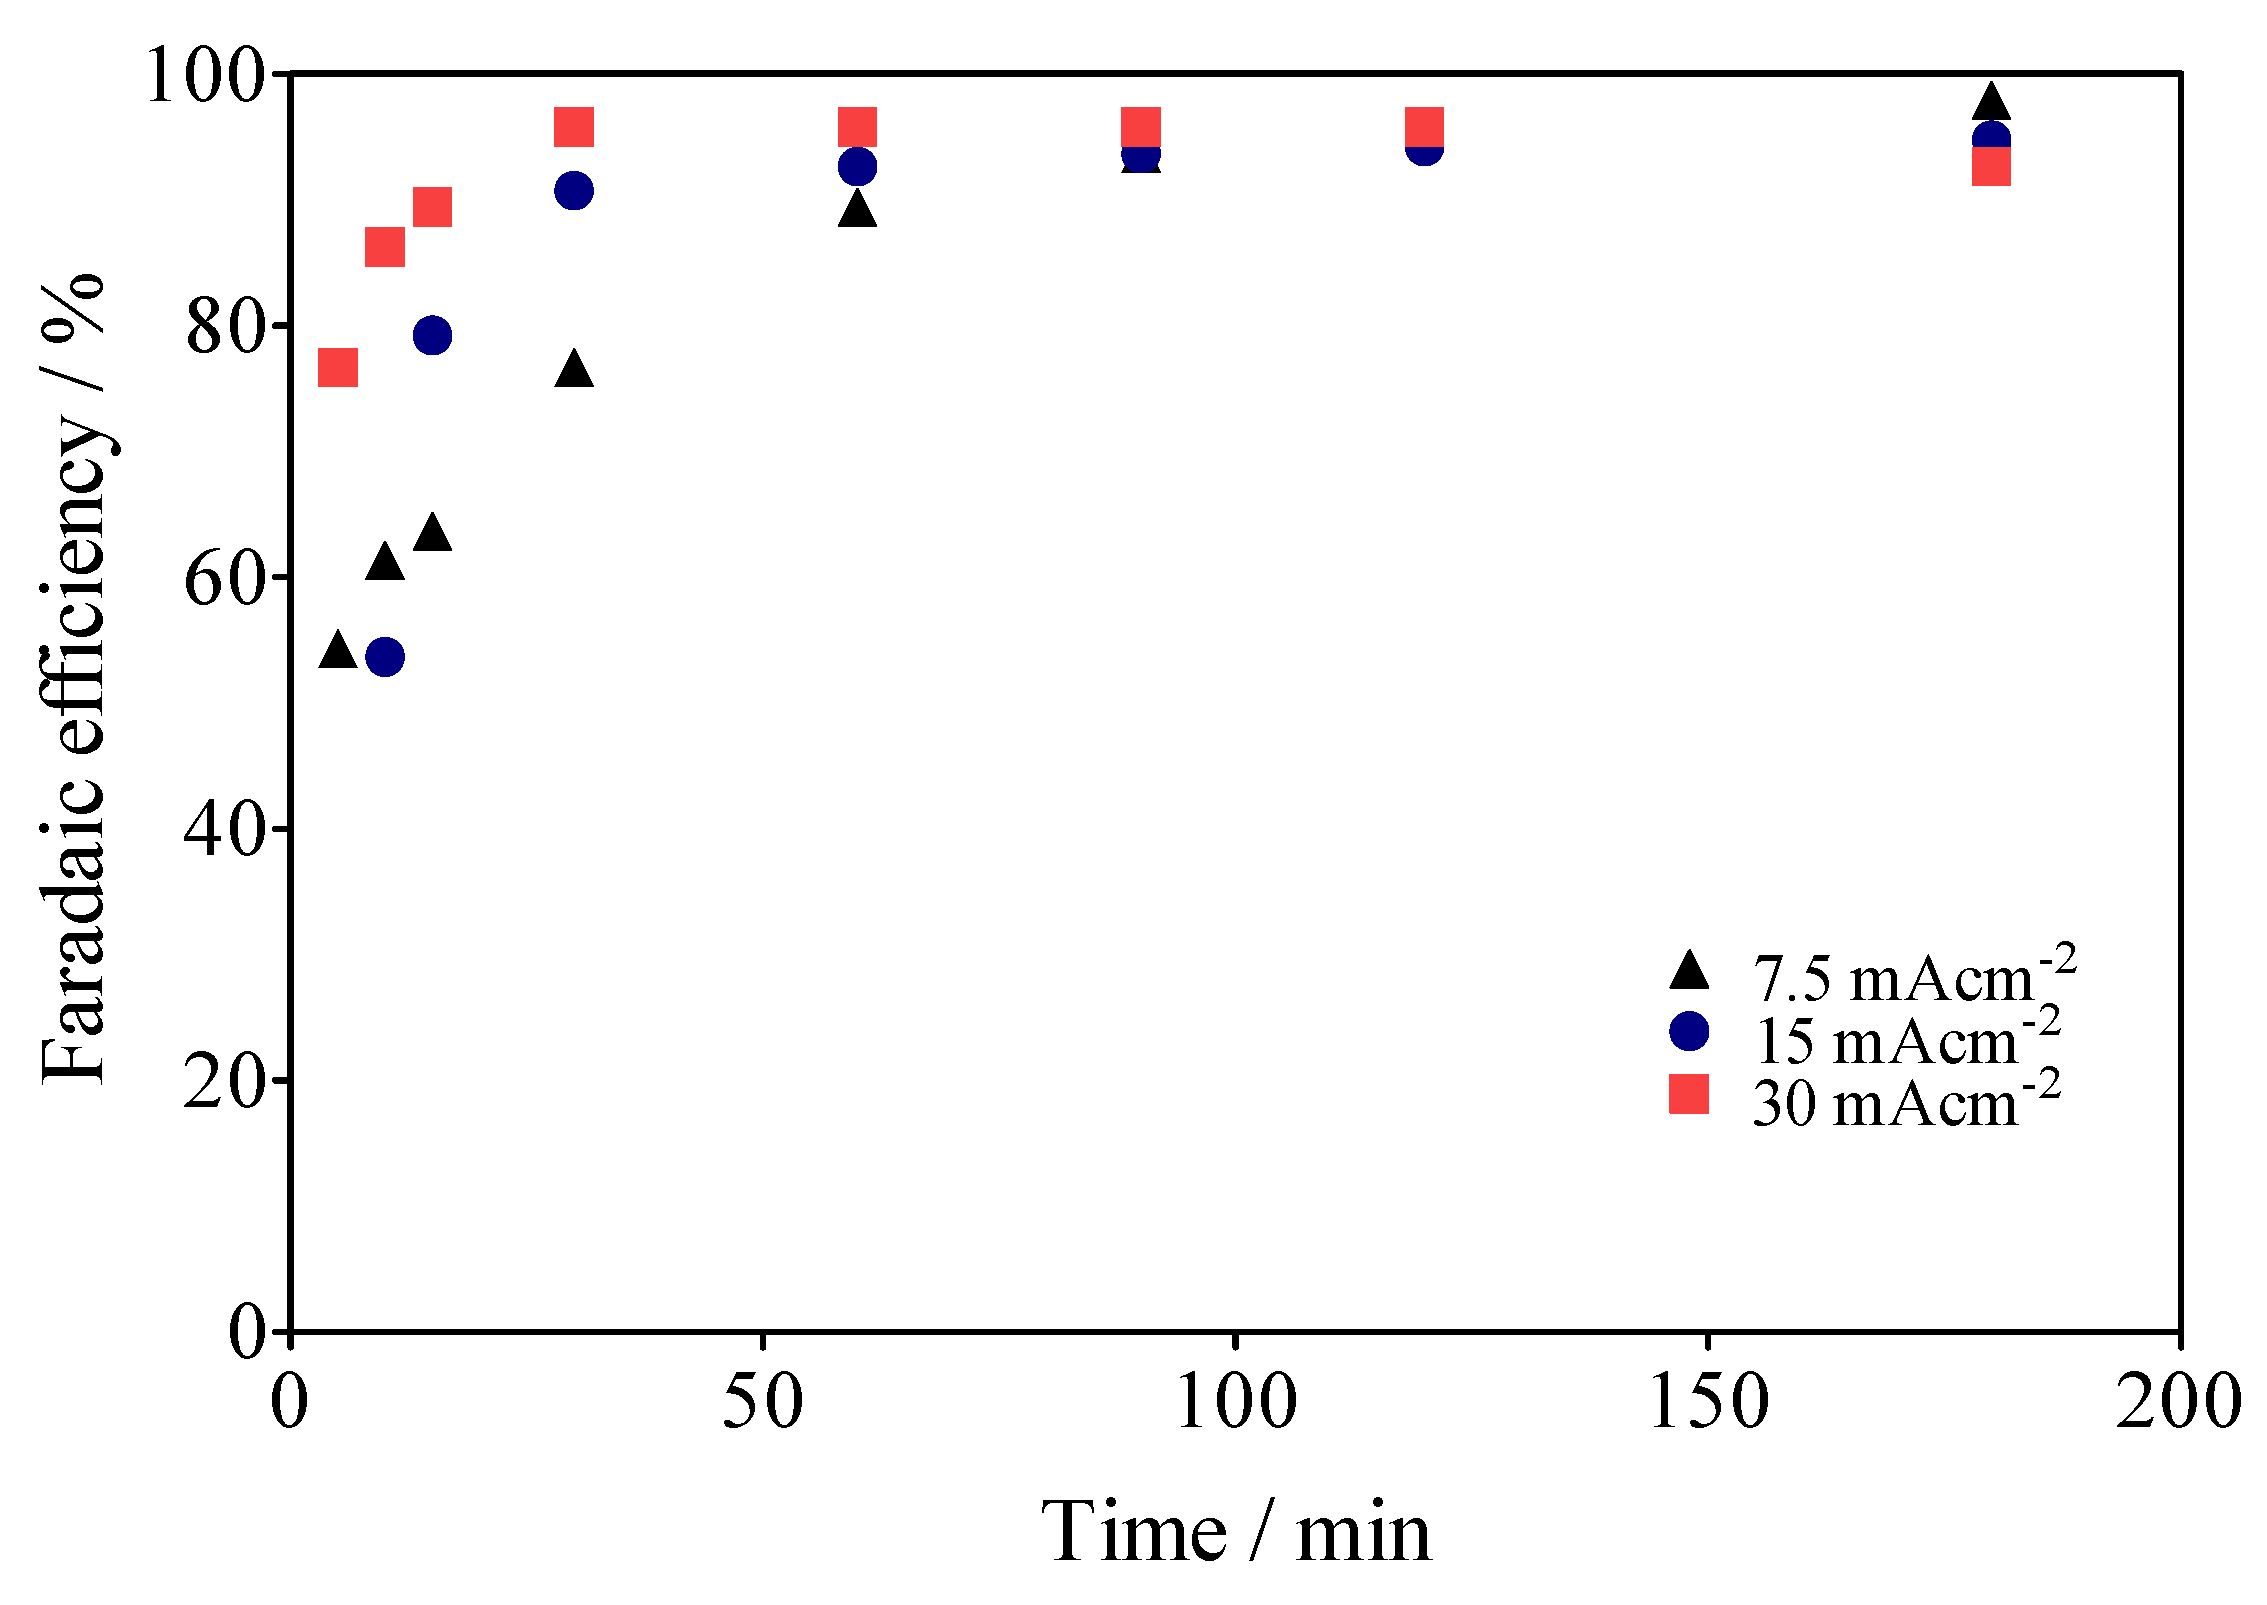
3.4. Green H2 Production
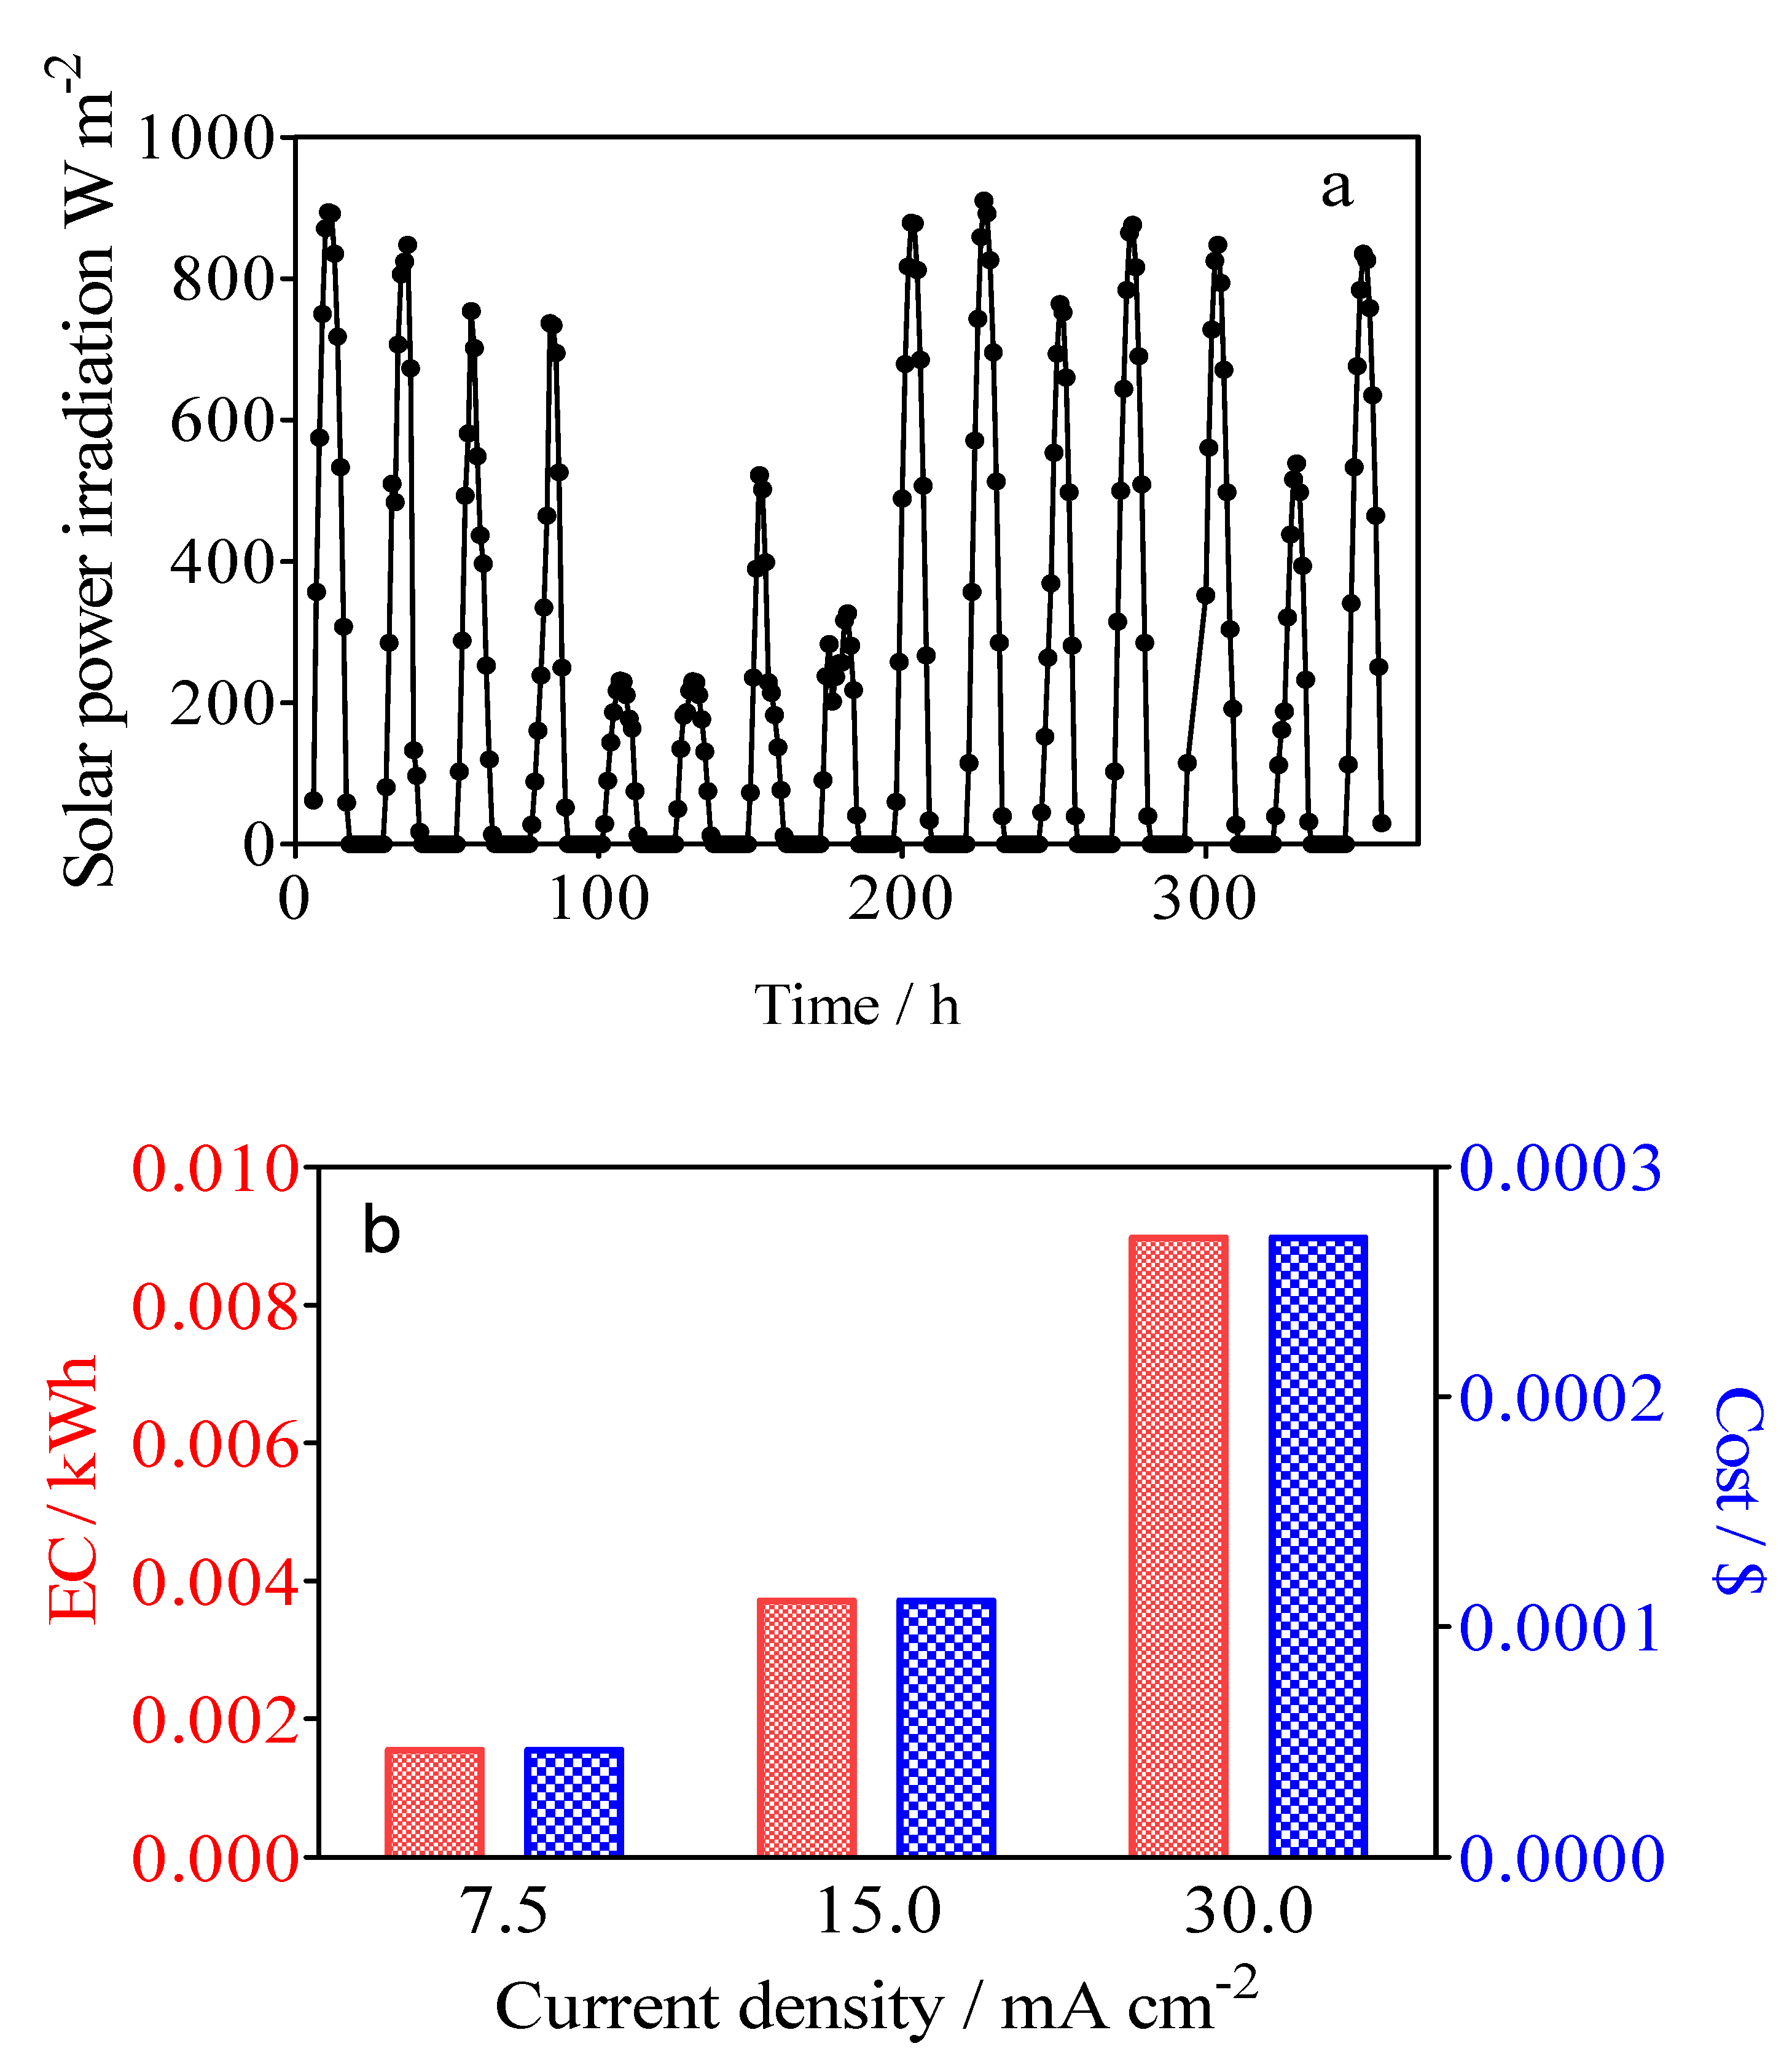
3.5. Specific Energy Consumption for the Green H2 Production
4. Conclusions
Supplementary Materials
Author Contributions
Funding
Institutional Review Board Statement
Informed Consent Statement
Data Availability Statement
Acknowledgments
Conflicts of Interest
References
- Kazi, M.K.; Eljack, F.; El-Halwagi, M.M.; Haouari, M. Green hydrogen for industrial sector decarbonization: Costs and impacts on hydrogen economy in qatar. Comput. Chem. Eng. 2021, 145, 107144. [Google Scholar] [CrossRef]
- Basheer, A.A.; Ali, I. Water photo splitting for green hydrogen energy by green nanoparticles. Int. J. Hydrog. Energy 2019, 44, 11564–11573. [Google Scholar] [CrossRef]
- Pahle, M.; Schaeffer, R.; Pachauri, S.; Eom, J.; Awasthy, A.; Chen, W.; Di Maria, C.; Jiang, K.; He, C.; Portugal-Pereira, J.; et al. The crucial role of complementarity, transparency and adaptability for designing energy policies for sustainable development. Energy Policy 2021, 159, 112662. [Google Scholar] [CrossRef]
- Zhang, S.; Wang, K.; Xu, W.; Iyer-Raniga, U.; Athienitis, A.; Ge, H.; Cho, D.W.; Feng, W.; Okumiya, M.; Yoon, G.; et al. Policy recommendations for the zero energy building promotion towards carbon neutral in Asia-Pacific Region. Energy Policy 2021, 159, 112661. [Google Scholar] [CrossRef]
- Battaglia, P.; Buffo, G.; Ferrero, D.; Santarelli, M.; Lanzini, A. Methanol synthesis through CO2 capture and hydrogenation: Thermal integration, energy performance and techno-economic assessment. J. CO2 Util. 2021, 44, 101407. [Google Scholar] [CrossRef]
- Rosen, M.A.; Koohi-Fayegh, S. The prospects for hydrogen as an energy carrier: An overview of hydrogen energy and hydrogen energy systems. Energy Ecol. Environ. 2016, 1, 10–29. [Google Scholar] [CrossRef] [Green Version]
- Tashie-Lewis, B.C.; Nnabuife, S.G. Hydrogen Production, Distribution, Storage and Power Conversion in a Hydrogen Economy—A Technology Review. Chem. Eng. J. Adv. 2021, 8, 100172. [Google Scholar] [CrossRef]
- Zhuang, X.; Xia, X.; Xu, X.; Li, L. Experimental investigation on hydrogen production by methanol steam reforming in a novel multichannel micro packed bed reformer. Int. J. Hydrog. Energy 2020, 45, 11024–11034. [Google Scholar] [CrossRef]
- Hwang, B.Y.; Sakthinathan, S.; Chiu, T.W. Production of hydrogen from steam reforming of methanol carried out by self-combusted CuCr1-xFexO2 (x = 0–1) nanopowders catalyst. Int. J. Hydrog. Energy 2019, 44, 2848–2856. [Google Scholar] [CrossRef]
- Ebrahimian, S.; Iranshahi, D. An investigative study on replacing the conventional furnaces of naphtha reforming with chemical looping combustion for clean hydrogen production. Int. J. Hydrog. Energy 2020, 45, 19405–19419. [Google Scholar] [CrossRef]
- Melo, F.; Morlanés, N. Naphtha steam reforming for hydrogen production. Catal. Today 2005, 107–108, 458–466. [Google Scholar] [CrossRef]
- Aziz, M.; Darmawan, A.; Juangsa, F.B. Hydrogen production from biomasses and wastes: A technological review. Int. J. Hydrog. Energy 2021, 46, 33756–33781. [Google Scholar] [CrossRef]
- Hou, Y.; Tu, L.; Qin, S.; Yu, Z.; Yan, Y.; Xu, Y.; Song, H.; Lin, H.; Chen, Y.; Wang, S. Dye wastewater treatment and hydrogen production in microbial electrolysis cells using MoS2-graphene oxide cathode: Effects of dye concentration, co-substrate and buffer solution. Process Biochem. 2021, 102, 51–58. [Google Scholar] [CrossRef]
- Sivaramakrishnan, R.; Shanmugam, S.; Sekar, M.; Mathimani, T.; Incharoensakdi, A.; Kim, S.H.; Parthiban, A.; Edwin Geo, V.; Brindhadevi, K.; Pugazhendhi, A. Insights on biological hydrogen production routes and potential microorganisms for high hydrogen yield. Fuel 2021, 291, 120136. [Google Scholar] [CrossRef]
- Akhlaghi, N.; Najafpour-Darzi, G. A comprehensive review on biological hydrogen production. Int. J. Hydrog. Energy 2020, 45, 22492–22512. [Google Scholar] [CrossRef]
- Rosa, D.; Medeiros, A.B.P.; Martinez-Burgos, W.J.; do Nascimento, J.R.; de Carvalho, J.C.; Sydney, E.B.; Soccol, C.R. Biological hydrogen production from palm oil mill effluent (POME) by anaerobic consortia and Clostridium beijerinckii. J. Biotechnol. 2020, 323, 17–23. [Google Scholar] [CrossRef]
- Wenderich, K.; Nieuweweme, B.A.M.; Mul, G.; Mei, B.T. Selective Electrochemical Oxidation of H2O to H2O2 Using Boron-Doped Diamond: An Experimental and Techno-Economic Evaluation. ACS Sustain. Chem. Eng. 2021, 9, 7803–7812. [Google Scholar] [CrossRef]
- Hermesmann, M.; Müller, T.E. Green, Turquoise, Blue, or Grey? Environmentally friendly Hydrogen Production in Transforming Energy Systems. Prog. Energy Combust. Sci. 2022, 90, 100996. [Google Scholar] [CrossRef]
- Scarabelot, L.T.; Rampinelli, G.A.; Rambo, C.R. Overirradiance effect on the electrical performance of photovoltaic systems of different inverter sizing factors. Sol. Energy 2021, 225, 561–568. [Google Scholar] [CrossRef]
- Zomer, C.; Custódio, I.; Goulart, S.; Mantelli, S.; Martins, G.; Campos, R.; Pinto, G.; Rüther, R. Energy balance and performance assessment of PV systems installed at a positive-energy building (PEB) solar energy research centre. Sol. Energy 2020, 212, 258–274. [Google Scholar] [CrossRef]
- Sirés, I.; Brillas, E. Remediation of water pollution caused by pharmaceutical residues based on electrochemical separation and degradation technologies: A review. Environ. Int. 2012, 40, 212–229. [Google Scholar] [CrossRef] [PubMed]
- Brillas, E.; Martínez-Huitle, C.A. Decontamination of wastewaters containing synthetic organic dyes by electrochemical methods. An updated review. Appl. Catal. B Environ. 2015, 166–167, 603–643. [Google Scholar] [CrossRef]
- Ganiyu, S.O.; dos Santos, E.V.; Costa, E.C.T.D.A.; Martínez-Huitle, C.A. Electrochemical advanced oxidation processes (EAOPs) as alternative treatment techniques for carwash wastewater reclamation. Chemosphere 2018, 211, 998–1006. [Google Scholar] [CrossRef] [PubMed] [Green Version]
- Rodríguez-Narváez, O.M.; Picos, A.R.; Bravo-Yumi, N.; Pacheco-Alvarez, M.; Martínez-Huitle, C.A.; Peralta-Hernández, J.M. Electrochemical oxidation technology to treat textile wastewaters. Curr. Opin. Electrochem. 2021, 29, 100806. [Google Scholar] [CrossRef]
- Comninellis, C. Electrocatalysis in the Electrochemical Conversion/Combustion of Organic Pollutants. Electrochim. Acta 1994, 39, 1857–1862. [Google Scholar] [CrossRef]
- Ganiyu, S.O.; Martínez-Huitle, C.A.; Oturan, M.A. Electrochemical advanced oxidation processes for wastewater treatment: Advances in formation and detection of reactive species and mechanisms. Curr. Opin. Electrochem. 2021, 27, 100678. [Google Scholar] [CrossRef]
- Ganiyu, S.O.; Martínez-Huitle, C.A. Nature, Mechanisms and Reactivity of Electrogenerated Reactive Species at Thin-Film Boron-Doped Diamond (BDD) Electrodes During Electrochemical Wastewater Treatment. ChemElectroChem 2019, 6, 2379–2392. [Google Scholar] [CrossRef]
- Raj, R.; Tripathi, A.; Das, S.; Ghangrekar, M.M. Removal of caffeine from wastewater using electrochemical advanced oxidation process: A mini review. Case Stud. Chem. Environ. Eng. 2021, 4, 100129. [Google Scholar] [CrossRef]
- Martínez-Huitle, C.A.; Rodrigo, M.A.; Sirés, I.; Scialdone, O. Single and Coupled Electrochemical Processes and Reactors for the Abatement of Organic Water Pollutants: A Critical Review. Chem. Rev. 2015, 115, 13362–13407. [Google Scholar] [CrossRef]
- Adhikari, S.; Fernando, S. Hydrogen membrane separation techniques. Ind. Eng. Chem. Res. 2006, 45, 875–881. [Google Scholar] [CrossRef]
- Ockwig, N.W.; Nenoff, T.M. Membranes for hydrogen separation. Chem. Rev. 2007, 107, 4078–4110. [Google Scholar] [CrossRef] [PubMed]
- Guenot, B.; Cretin, M.; Lamy, C. Clean hydrogen generation from the electrocatalytic oxidation of methanol inside a proton exchange membrane electrolysis cell (PEMEC): Effect of methanol concentration and working temperature. J. Appl. Electrochem. 2015, 45, 973–981. [Google Scholar] [CrossRef]
- Santos, J.E.L.; Da Silva, D.R.; Martínez-Huitle, C.A.; Dos Santos, E.V.; Quiroz, M.A. Cathodic hydrogen production by simultaneous oxidation of methyl red and 2,4-dichlorophenoxyacetate in aqueous solutions using PbO2, Sb-doped SnO2 and Si/BDD anodes. Part 2: Hydrogen production. RSC Adv. 2020, 10, 37947–37955. [Google Scholar] [CrossRef] [PubMed]
- Santos, J.E.L.; Da Silva, D.R.; Martínez-Huitle, C.A.; Dos Santos, E.V.; Quiroz, M.A. Cathodic hydrogen production by simultaneous oxidation of methyl red and 2,4-dichlorophenoxyacetate aqueous solutions using Pb/PbO2, Ti/Sb-doped SnO2 and Si/BDD anodes. Part 1: Electrochemical oxidation. RSC Adv. 2020, 10, 37695–37706. [Google Scholar] [CrossRef]
- Ying, Z.; Wang, Y.; Zheng, X.; Geng, Z.; Dou, B.; Cui, G. Experimental study and development of an improved sulfur–iodine cycle integrated with HI electrolysis for hydrogen production. Int. J. Hydrog. Energy 2020, 45, 13176–13188. [Google Scholar] [CrossRef]
- Pham, A.T.; Baba, T.; Sugiyama, T.; Shudo, T. Efficient hydrogen production from aqueous methanol in a PEM electrolyzer with porous metal flow field: Influence of PTFE treatment of the anode gas diffusion layer. Int. J. Hydrog. Energy 2013, 38, 73–81. [Google Scholar] [CrossRef]
- Marshall, A.T.; Haverkamp, R.G. Production of hydrogen by the electrochemical reforming of glycerol–water solutions in a PEM electrolysis cell. Int. J. Hydrog. Energy 2008, 33, 4649–4654. [Google Scholar] [CrossRef]
- Mishra, B.K.; Chakraborty, S.; Kumar, P.; Saraswat, C. Sustainable Solutions for Urban Water Security; Springer: Cham, Switzerland, 2020; Volume 93. [Google Scholar] [CrossRef]
- De Melo Henrique, J.M.; de Andrade, D.C.; Barros Neto, E.L.; da Silva, D.R.; dos Santos, E.V. Solar-powered BDD-electrolysis remediation of soil washing fluid spiked with diesel. J. Chem. Technol. Biotechnol. 2019, 94, 2999–3006. [Google Scholar] [CrossRef]
- Henrique, J.M.M.; Monteiro, M.K.S.; Cardozo, J.C.; Martínez-Huitle, C.A.; da Silva, D.R.; dos Santos, E.V. Integrated-electrochemical approaches powered by photovoltaic energy for detecting and treating paracetamol in water. J. Electroanal. Chem. 2020, 876, 114734. [Google Scholar] [CrossRef]
- Sahoo, M.K.; Sinha, B.; Marbaniang, M.; Naik, D.B. Degradation and mineralization of Calcon using UV365/H2O2 technique: Influence of pH. Desalination 2011, 280, 266–272. [Google Scholar] [CrossRef]
- Da Silva, J.H., Jr.; de Melo, J.V.; Castro, P.S. Lab-made 3D-printed accessories for spectroscopy and spectroelectrochemistry: A proof of concept to investigate dynamic interfacial and surface phenomena. Microchim. Acta. 2021, 188, 394. [Google Scholar] [CrossRef] [PubMed]
- Da Costa Soares, I.C.; da Silva, Á.R.L.; de Moura Santos, E.C.M.; dos Santos, E.V.; da Silva, D.R.; Martínez-Huitle, C.A. Understanding the electrochemical oxidation of dyes on platinum and boron–doped diamond electrode surfaces: Experimental and computational study. J. Solid State Electrochem. 2020, 24, 3245–3256. [Google Scholar] [CrossRef]
- Ahmadi, M.F.; da Silva, Á.R.L.; Martínez-Huitle, C.A.; Bensalah, N. Understanding the electro-catalytic effect of benzene ring substitution on the electrochemical oxidation of aniline and its derivatives using BDD anode: Cyclic voltammetry, bulk electrolysis and theoretical calculations. Electrochim. Acta 2021, 369, 137688. [Google Scholar] [CrossRef]
- Martínez-Huitle, C.A.; Quiroz, M.A.; Comninellis, C.; Ferro, S.; De Battisti, A. Electrochemical incineration of chloranilic acid using Ti/IrO2, Pb/PbO2 and Si/BDD electrodes. Electrochim. Acta 2004, 50, 949–956. [Google Scholar] [CrossRef]
- Cardozo, J.C.; da Silva, D.R.; Martínez-Huitle, C.A.; Quiroz, M.A.; dos Santos, E.V. The versatile behavior of diamond electrodes—Electrochemical examination of the anti-psychotic drug olanzapine (OL) oxidation as a model organic aqueous solution. Electrochim. Acta 2022, 411, 140063. [Google Scholar] [CrossRef]
- Bard, A.J.; Faulkner, L.R. Electrochemical Methods Fundamentals and Application, 2nd ed.; ACS: Washington, DC, USA, 2000; Volume 2, ISBN 0471043729. [Google Scholar]
- Gosser, D.K. Cyclic Voltammetry: Simulation and Analysis of Reaction Mechanisms; VCH: New York, NY, USA, 1993; ISBN 3527282262. [Google Scholar]
- Kissinger, P.T.; Heineman, W.R. Laboratory Techniques in Electroanalytical Chemistry, 2nd ed.; CRC Press: New York, NY, USA, 1996; ISBN 9781351990714. [Google Scholar]
- Radi, A.E.; Eissa, S. Electrochemical study of indapamide and its complexation with β-cyclodextrin. J. Incl. Phenom. Macrocycl. Chem. 2011, 71, 95–102. [Google Scholar] [CrossRef]
- Sanati, A.L.; Karimi-Maleh, H.; Badiei, A.; Biparva, P.; Ensafi, A.A. A voltammetric sensor based on NiO/CNTs ionic liquid carbon paste electrode for determination of morphine in the presence of diclofenac. Mater. Sci. Eng. C 2014, 35, 379–385. [Google Scholar] [CrossRef]
- De Oliveira Silva, K.N.; Rodrigo, M.A.; dos Santos, E.V. Electrochemical treatment of soil-washing effluent with boron-doped diamond electrodes: A review. Curr. Opin. Solid State Mater. Sci. 2021, 25, 100962. [Google Scholar] [CrossRef]
- Martínez-Huitle, C.A.; Ferro, S. Electrochemical oxidation of organic pollutants for the wastewater treatment: Direct and indirect processes. Chem. Soc. Rev. 2006, 35, 1324–1340. [Google Scholar] [CrossRef]
- De, F.; Araújo, K.C.; de P. Barreto, J.P.; Cardozo, J.C.; dos Santos, E.V.; de Araújo, D.M.; Martínez-Huitle, C.A. Sulfate pollution: Evidence for electrochemical production of persulfate by oxidizing sulfate released by the surfactant sodium dodecyl sulfate. Environ. Chem. Lett. 2018, 16, 647–652. [Google Scholar] [CrossRef] [Green Version]
- Araújo, K.C.F.; Silva, K.N.O.; Monteiro, M.K.; da Silva, D.R.; dos Santos, E.V.; Quiroz, M.A.; Martínez-Huitle, C.A. Using Persulfate Electrogenerated at Boron-Doped Diamond Electrodes as an Ex -Situ Oxidation Approach: Storage and Service-Life Solution Parameters. J. Electrochem. Soc. 2022, 169, 033506. [Google Scholar] [CrossRef]
- Divyapriya, G.; Nidheesh, P.V. Electrochemically generated sulfate radicals by boron doped diamond and its environmental applications. Curr. Opin. Solid State Mater. Sci. 2021, 25, 100921. [Google Scholar] [CrossRef]
- Ganiyu, S.O.; dos Santos, E.V.; Martínez-Huitle, C.A.; Waldvogel, S.R. Opportunities and challenges of thin-film boron-doped diamond electrochemistry for valuable resources recovery from waste: Organic, inorganic, and volatile product electrosynthesis. Curr. Opin. Electrochem. 2022, 32, 100903. [Google Scholar] [CrossRef]
- Skoumal, M.; Arias, C.; Cabot, P.L.; Centellas, F.; Garrido, J.A.; Rodríguez, R.M.; Brillas, E. Mineralization of the biocide chloroxylenol by electrochemical advanced oxidation processes. Chemosphere 2008, 71, 1718–1729. [Google Scholar] [CrossRef]
- McBeath, S.T.; Wilkinson, P.; Graham, N.J.D. Application of boron-doped diamond electrodes for the anodic oxidation of pesticide micropollutants in a water treatment process: A critical review. Environ. Sci. Water Res. Technol. 2019, 5, 2090–2107. [Google Scholar] [CrossRef]
- Brillas, E.; Martínez-Huitle, C.A. Synthetic Diamond Films; Brillas, E., Martínez-Huitle, C.A., Eds.; John Wiley & Sons, Inc.: Hoboken, NJ, USA, 2011; ISBN 9781118062364. [Google Scholar]
- Cañizares, P.; Lobato, J.; Paz, R.; Rodrigo, M.A.; Sáez, C. Electrochemical oxidation of phenolic wastes with boron-doped diamond anodes. Water Res. 2005, 39, 2687–2703. [Google Scholar] [CrossRef]
- Grigoriev, S.A.; Porembsky, V.I.; Fateev, V.N. Pure hydrogen production by PEM electrolysis for hydrogen energy. Int. J. Hydrog. Energy 2006, 31, 171–175. [Google Scholar] [CrossRef]
- Cornejo, O.M.; Murrieta, M.F.; Castañeda, L.F.; Nava, J.L. Characterization of the reaction environment in flow reactors fitted with BDD electrodes for use in electrochemical advanced oxidation processes: A critical review. Electrochim. Acta 2020, 331, 135373. [Google Scholar] [CrossRef]
- Carmo, M.; Fritz, D.L.; Mergel, J.; Stolten, D. A comprehensive review on PEM water electrolysis. Int. J. Hydrog. Energy 2013, 38, 4901–4934. [Google Scholar] [CrossRef]
- Millet, P.; Mbemba, N.; Grigoriev, S.A.; Fateev, V.N.; Aukauloo, A.; Etiévant, C. Electrochemical performances of PEM water electrolysis cells and perspectives. Int. J. Hydrog. Energy 2011, 36, 4134–4142. [Google Scholar] [CrossRef]
- Fiegenbaum, F.; Martini, E.M.; De Souza, M.O.; Becker, M.R.; De Souza, R.F. Hydrogen production by water electrolysis using tetra-alkyl-ammonium- sulfonic acid ionic liquid electrolytes. J. Power Sources 2013, 243, 822–825. [Google Scholar] [CrossRef] [Green Version]
- Mazloomi, S.K.; Sulaiman, N. Influencing factors of water electrolysis electrical efficiency. Renew. Sustain. Energy Rev. 2012, 16, 4257–4263. [Google Scholar] [CrossRef]
- Larminie, J.; Dicks, A. Fuel Cell Systems Explained, 2nd ed.; Wiley: Chichester, UK, 2003. [Google Scholar]
- Ursúa, A.; Gandía, L.M.; Sanchis, P. Hydrogen production from water electrolysis: Current status and future trends. Proc. IEEE 2012, 100, 410–426. [Google Scholar] [CrossRef]
- Ganiyu, S.O.; Brito, L.R.D.; De Araujo Costa, E.C.T.; Dos Santos, E.V.; Martínez-Huitle, C.A. Solar photovoltaic-battery system as a green energy for driven electrochemical wastewater treatment technologies: Application to elimination of Brilliant Blue FCF dye solution. J. Environ. Chem. Eng. 2019, 7, 102924. [Google Scholar] [CrossRef]
- Ganiyu, S.O.; Martínez-Huitle, C.A. The use of renewable energies driving electrochemical technologies for environmental applications. Curr. Opin. Electrochem. 2020, 22, 211–220. [Google Scholar] [CrossRef]
- IRENA—International Renewable Energy Agency. Available online: https://www.irena.org (accessed on 10 August 2022).


| Chemical Structure | 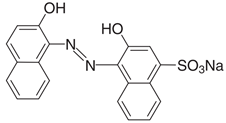 |
|---|---|
| Chemical formula | C20H13N2NaO5S |
| IUPAC name | 1-(2-Hydroxy-1-naphthylazo)-2-naphthol-4-sulfonic acid sodium salt |
| Synonym | Eriochrome Blue Black R; Mordant Black 17; Palatine Chrome Black 6BN; Anthracene blue black; Alizarin blue black BG |
| Commercial name | Calcon |
| Color Index number | 15,705 |
| Molecular Weight (g mol−1) | 416.38 |
| λmáx (nm) | 513 |
| Solubility in water | 20 mg mL−1 |
| Purity | 98% |
| CAS number: | 2538-85-4 |
Publisher’s Note: MDPI stays neutral with regard to jurisdictional claims in published maps and institutional affiliations. |
© 2022 by the authors. Licensee MDPI, Basel, Switzerland. This article is an open access article distributed under the terms and conditions of the Creative Commons Attribution (CC BY) license (https://creativecommons.org/licenses/by/4.0/).
Share and Cite
Câmara Cardozo, J.; da Silva, D.R.; Martínez-Huitle, C.A.; Quiroz, M.A.; Dos Santos, E.V. Photovoltaic Electrochemically Driven Degradation of Calcon Dye with Simultaneous Green Hydrogen Production. Materials 2022, 15, 7445. https://doi.org/10.3390/ma15217445
Câmara Cardozo J, da Silva DR, Martínez-Huitle CA, Quiroz MA, Dos Santos EV. Photovoltaic Electrochemically Driven Degradation of Calcon Dye with Simultaneous Green Hydrogen Production. Materials. 2022; 15(21):7445. https://doi.org/10.3390/ma15217445
Chicago/Turabian StyleCâmara Cardozo, Jussara, Djalma R. da Silva, Carlos A. Martínez-Huitle, Marco A. Quiroz, and Elisama V. Dos Santos. 2022. "Photovoltaic Electrochemically Driven Degradation of Calcon Dye with Simultaneous Green Hydrogen Production" Materials 15, no. 21: 7445. https://doi.org/10.3390/ma15217445