
Geotechnical Seismic Isolation System Based on Rubber-Sand Mixtures for Rural Residence Buildings: Shaking Table Test


Abstract
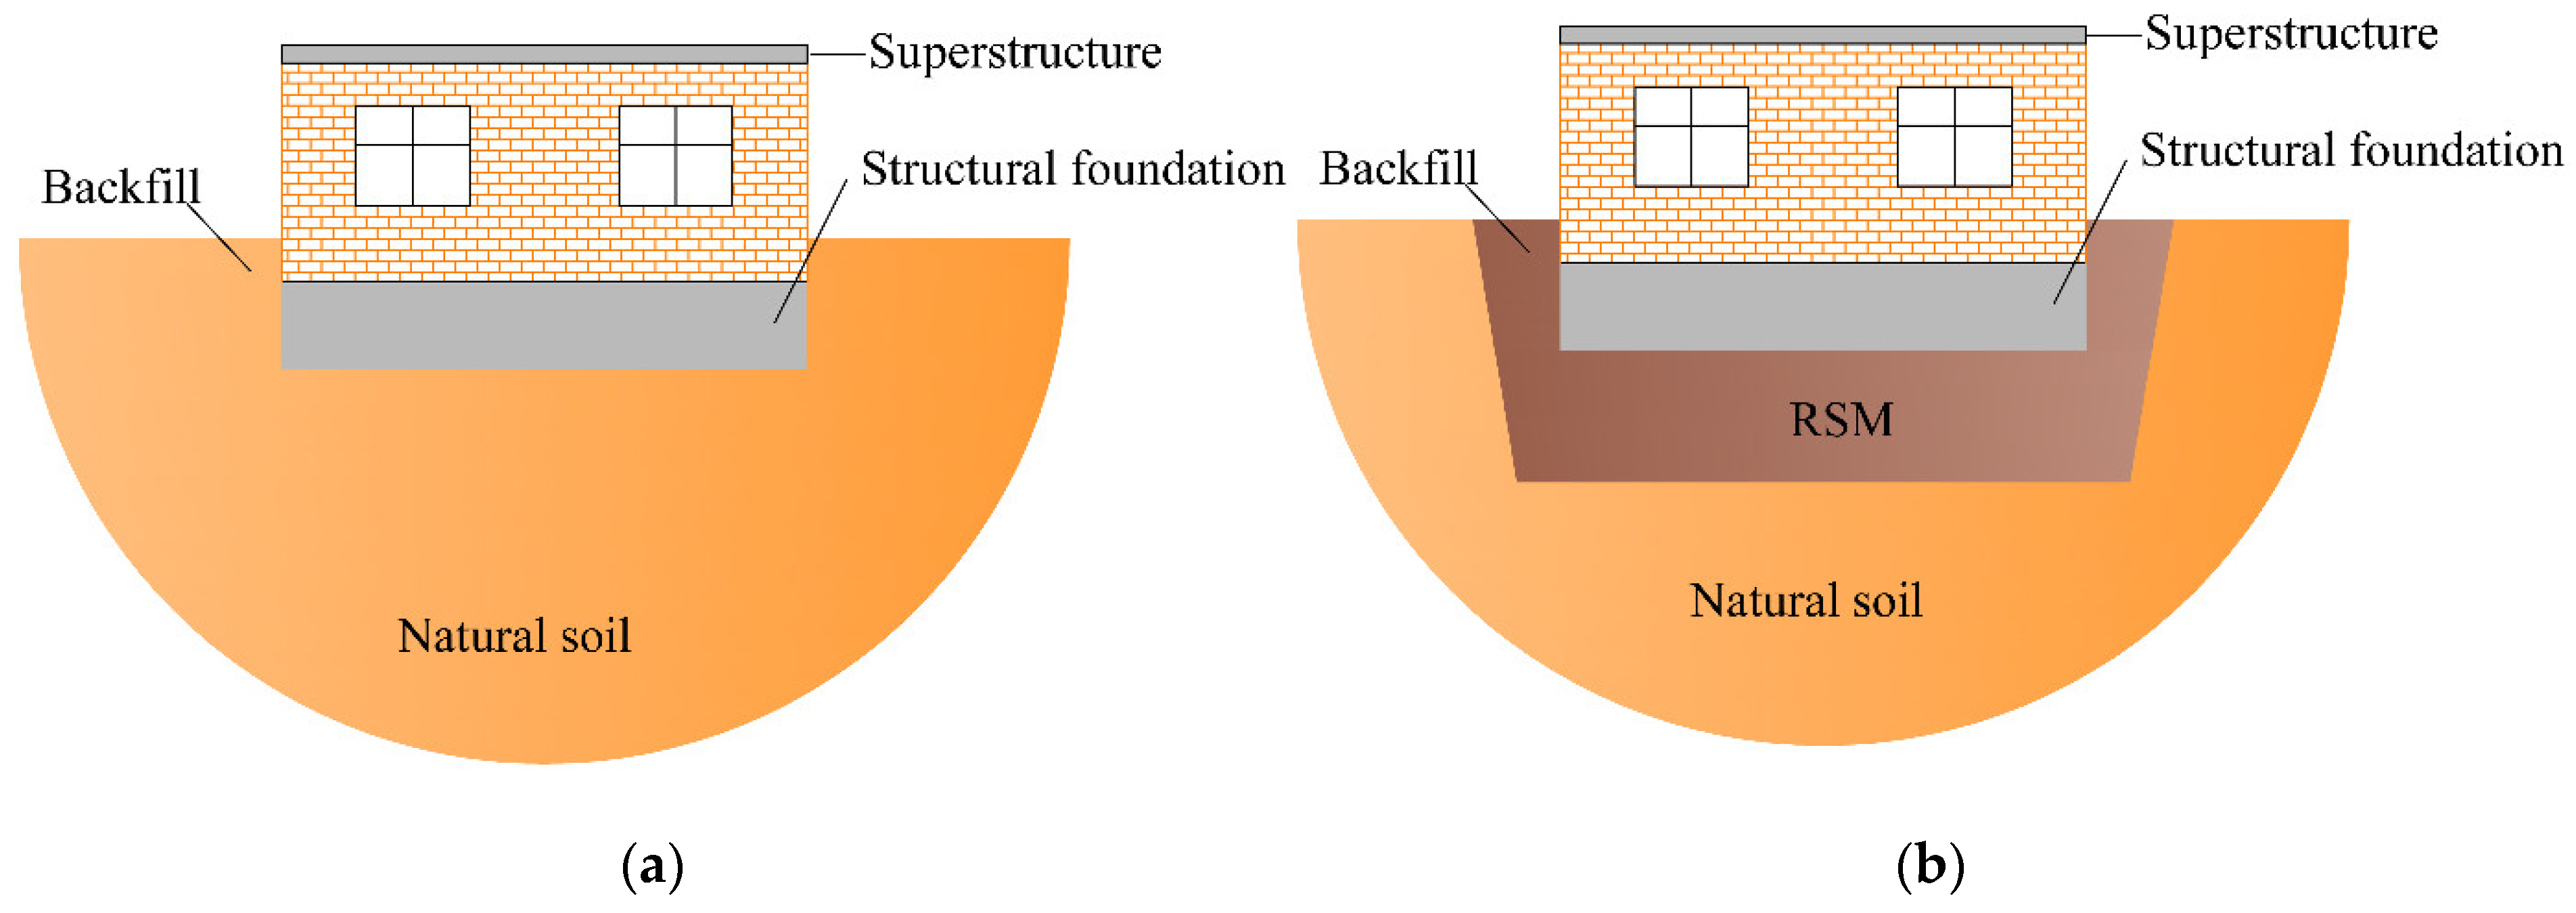
:1. Introduction
2. Shake Table Test
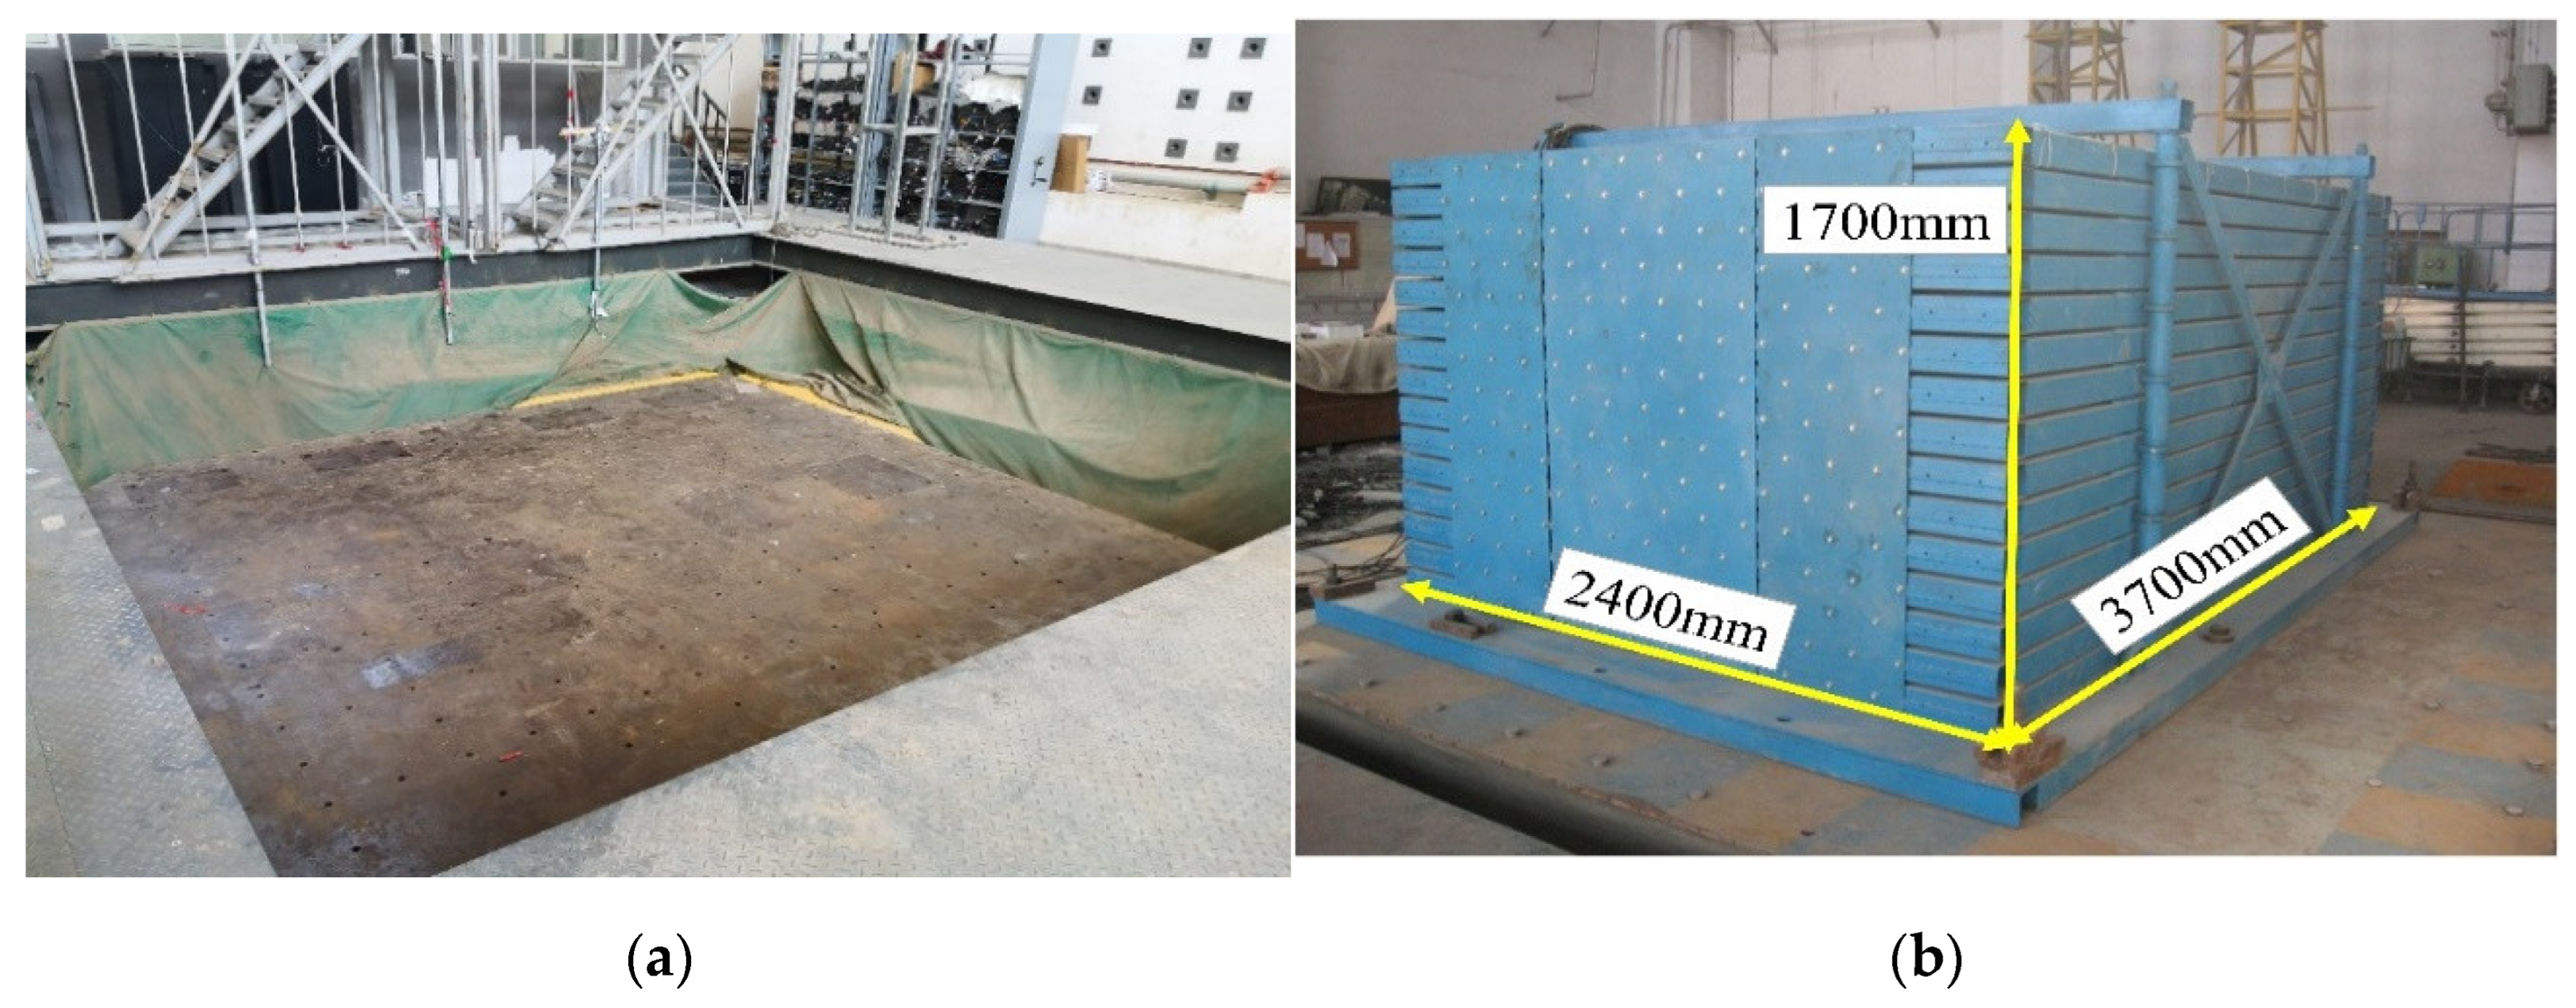
2.1. Test Equipment
2.2. Model Similarity
2.3. Test Model
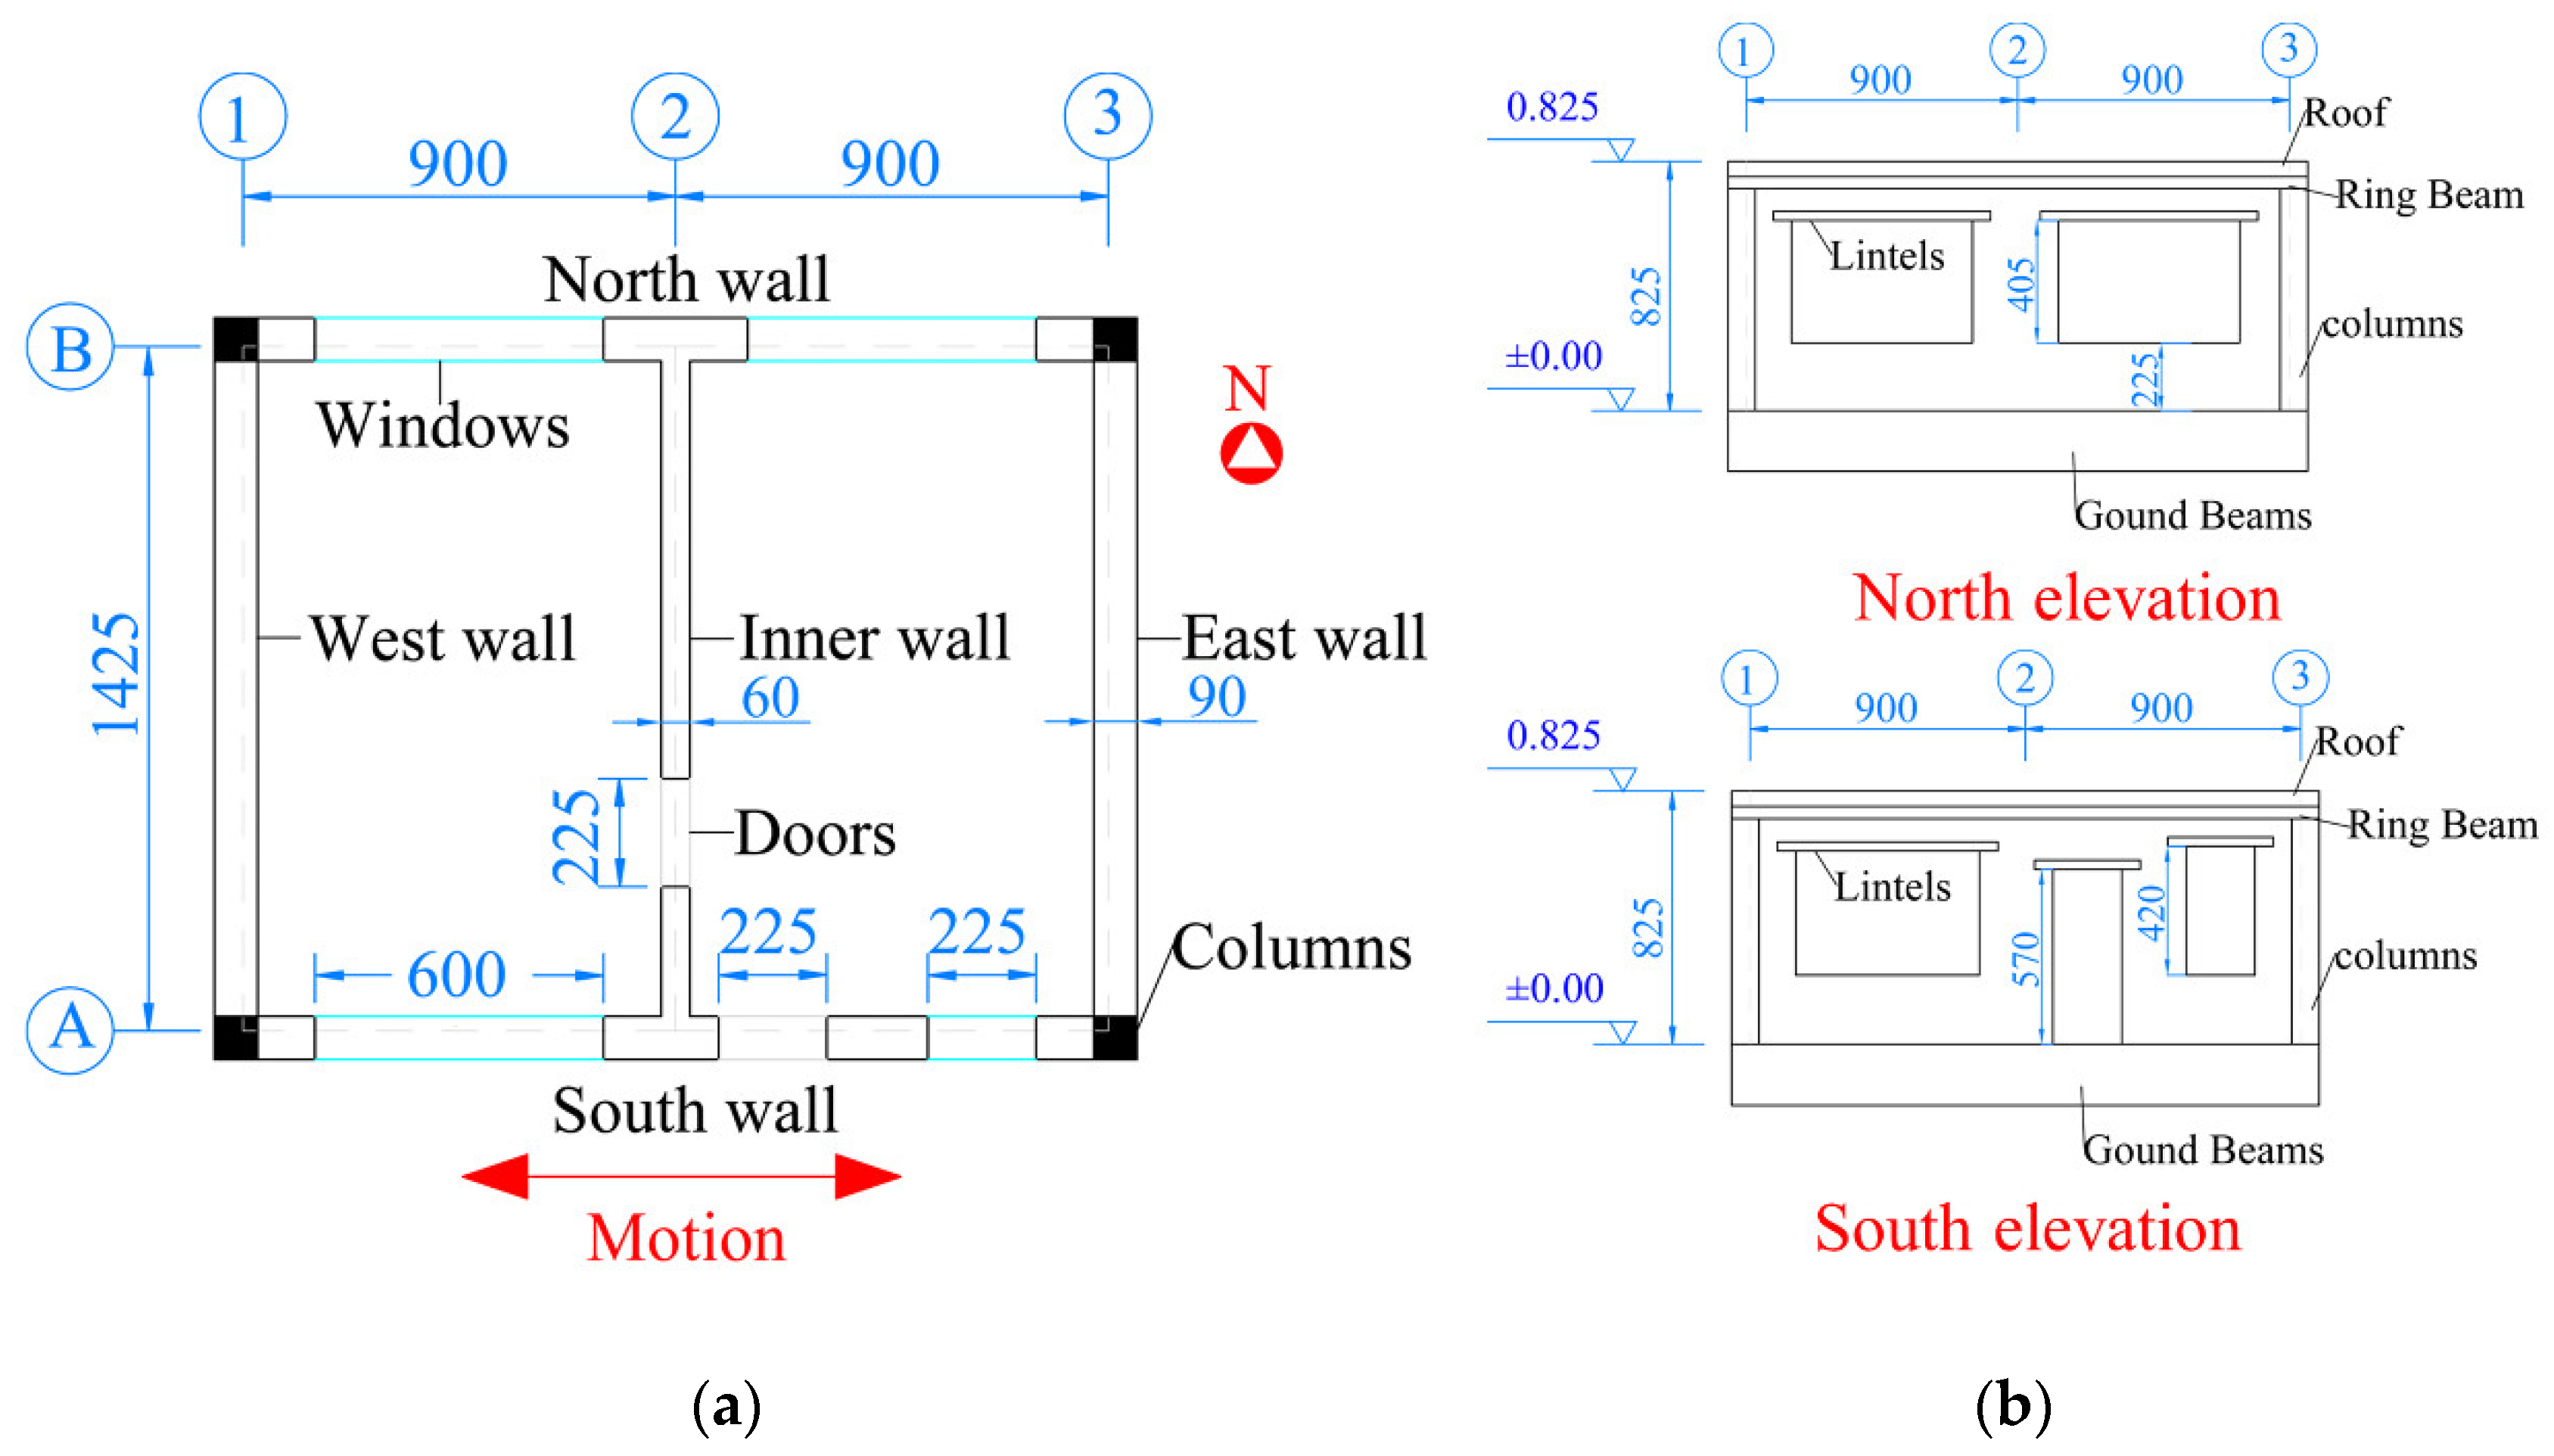
2.3.1. Structural Model
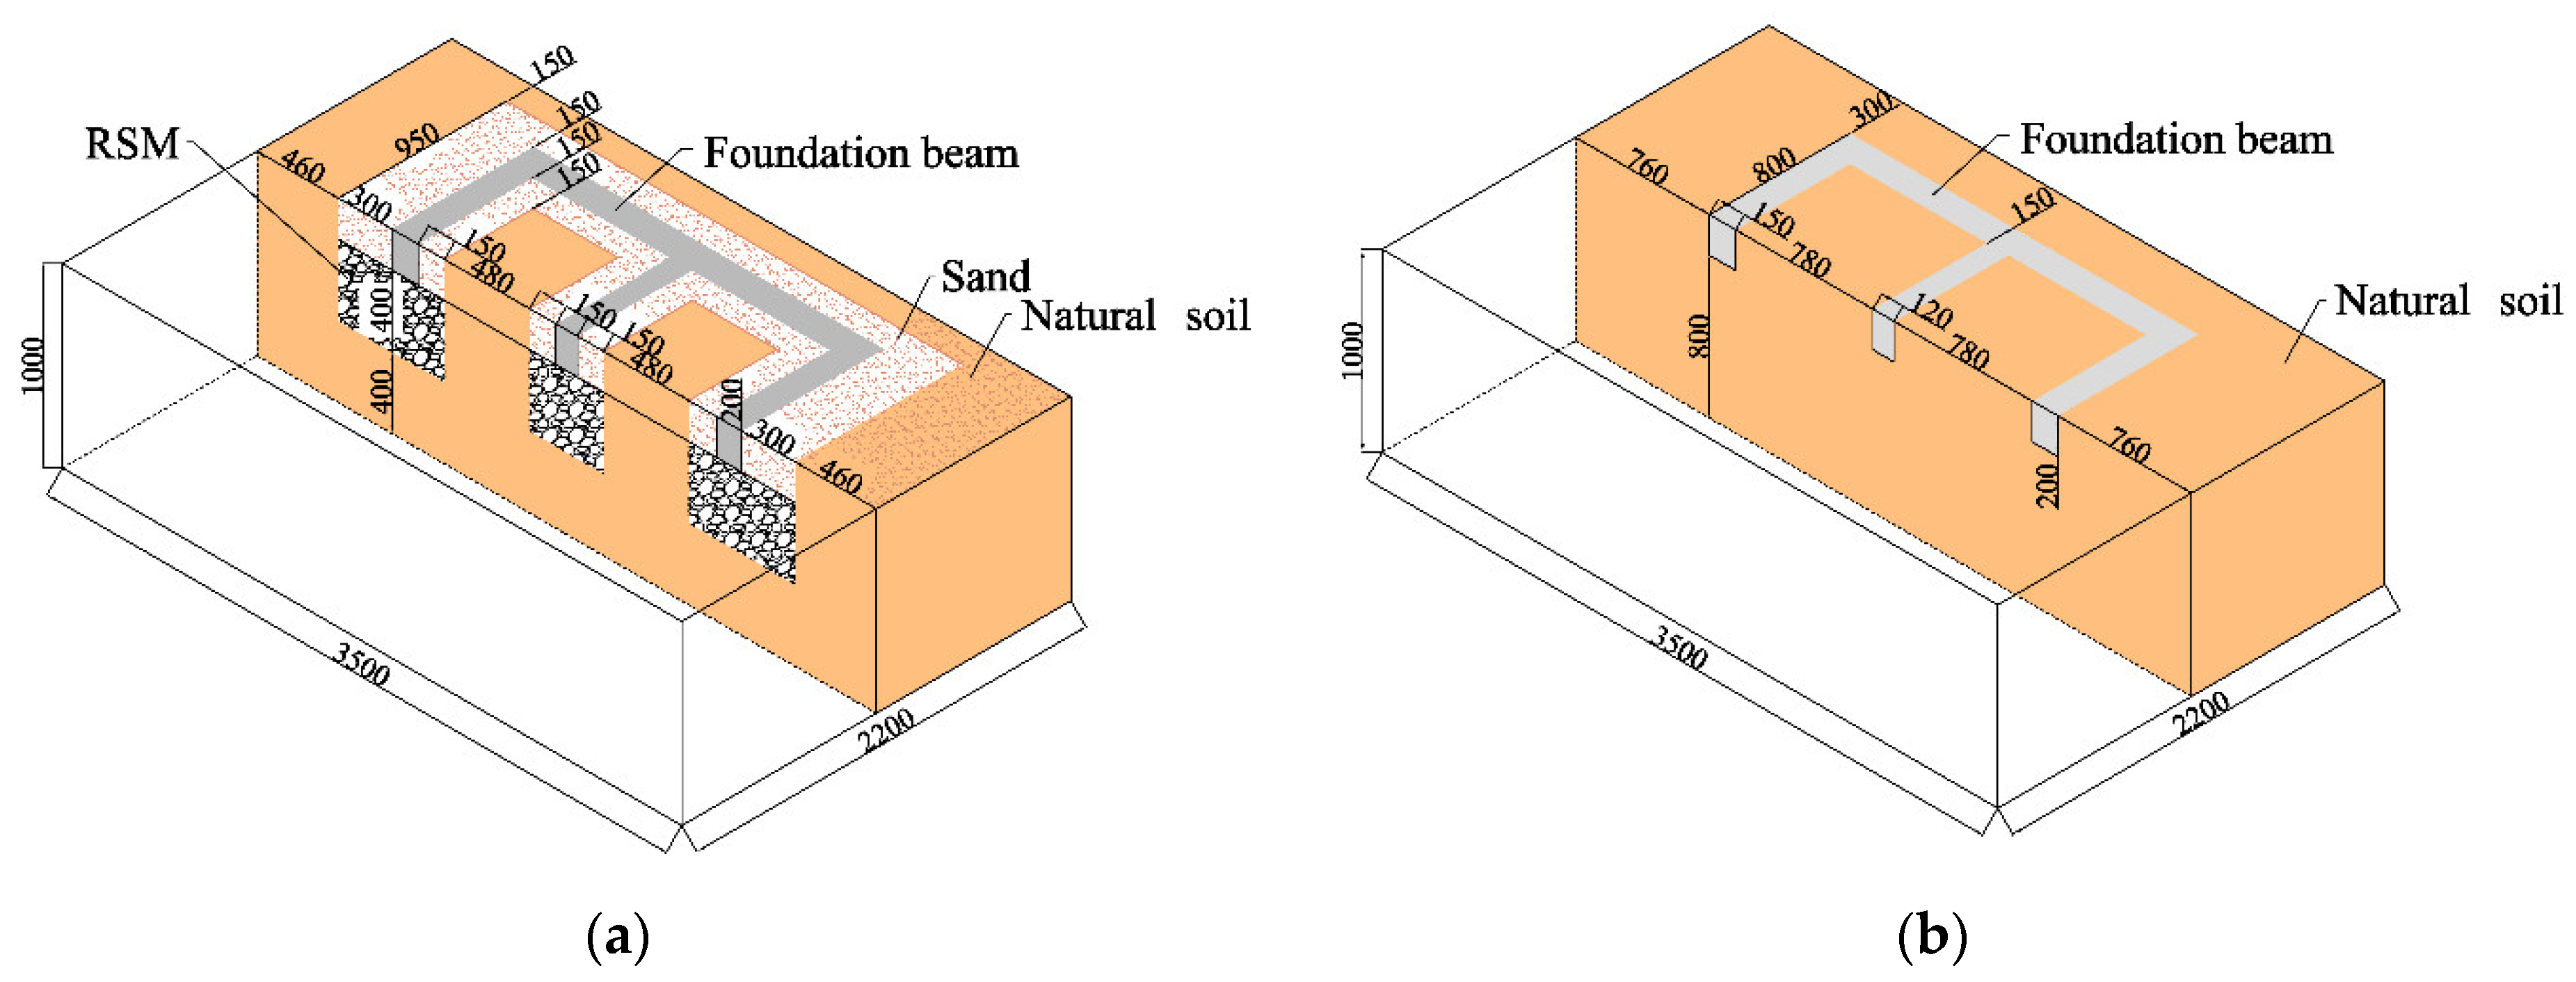
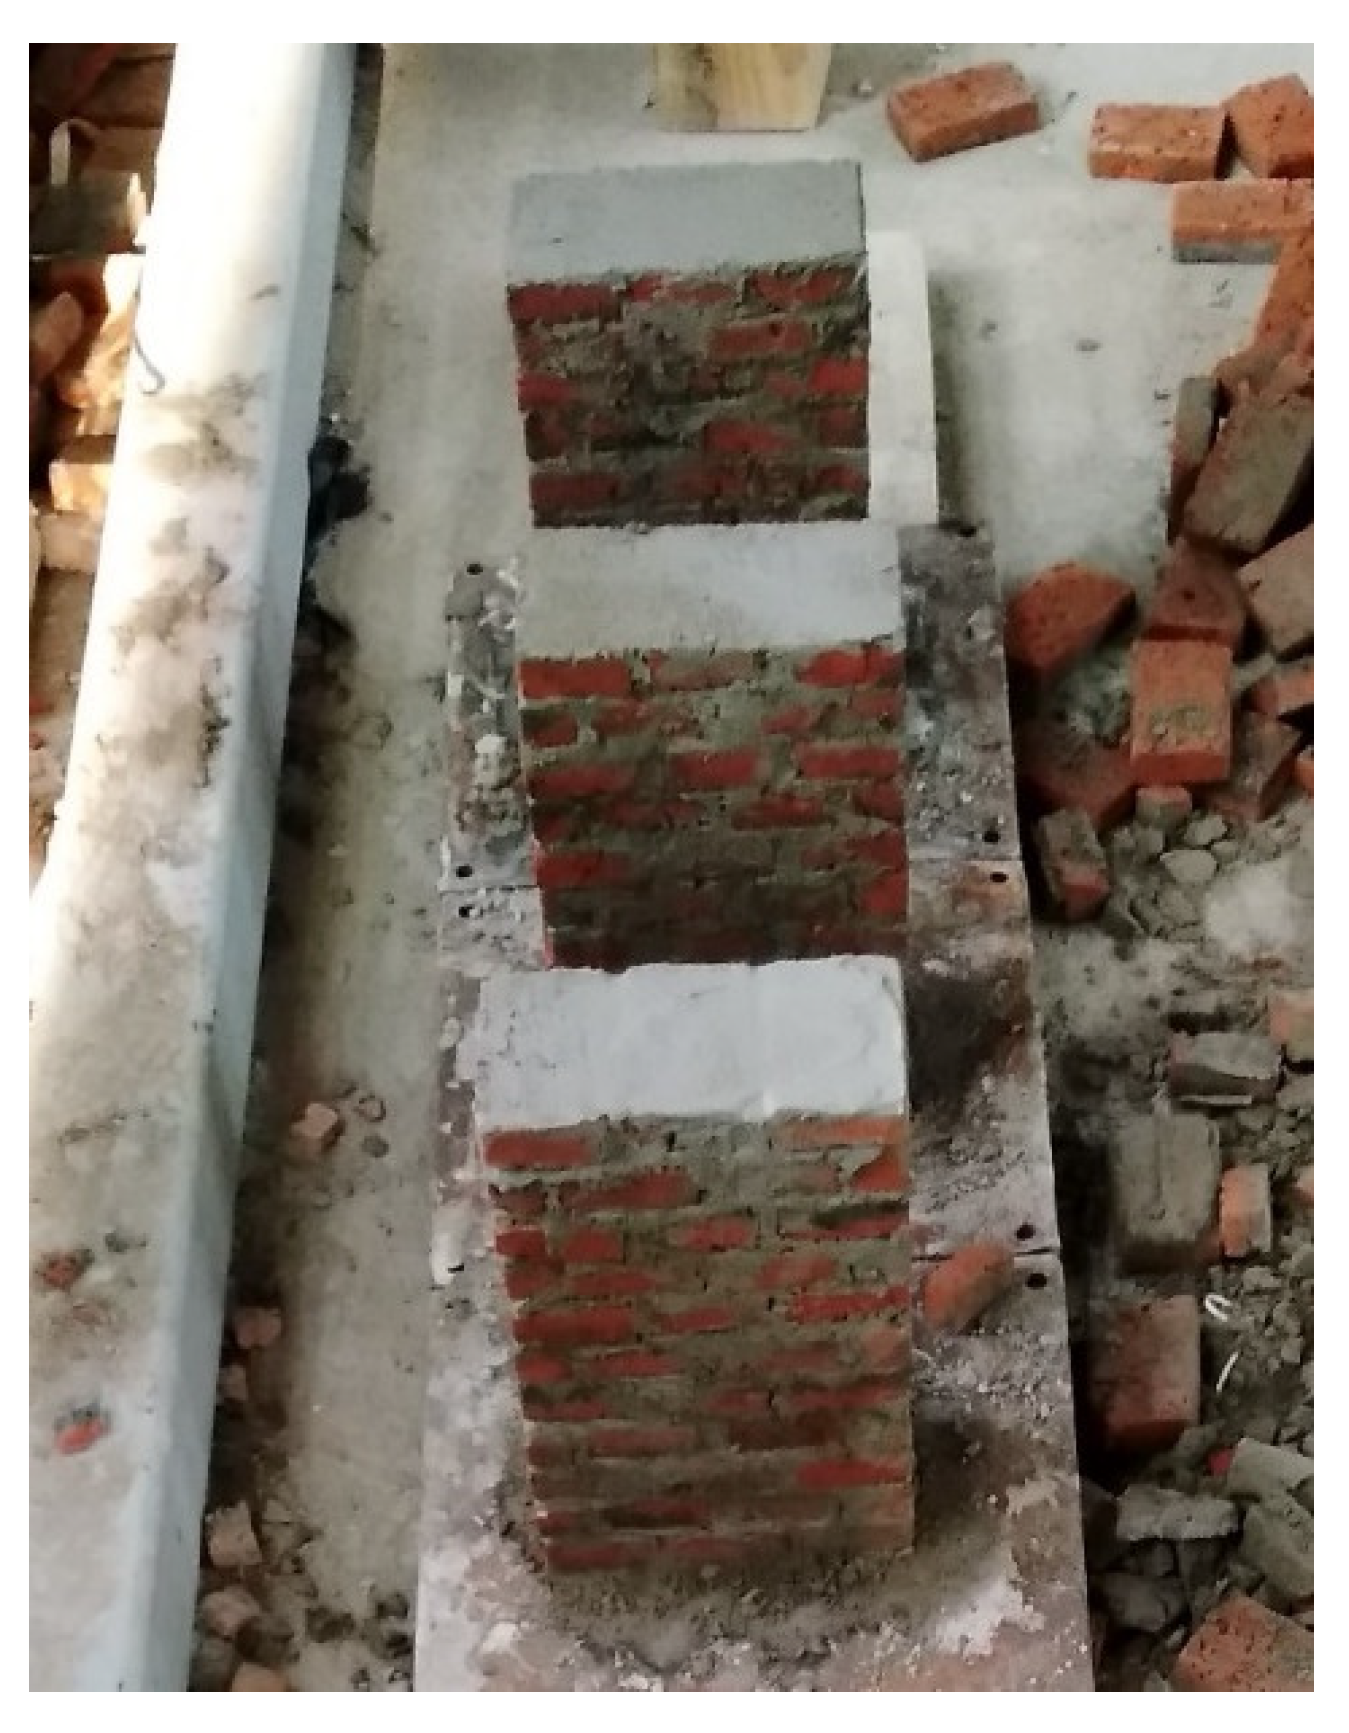
2.3.2. Foundation Soil Model
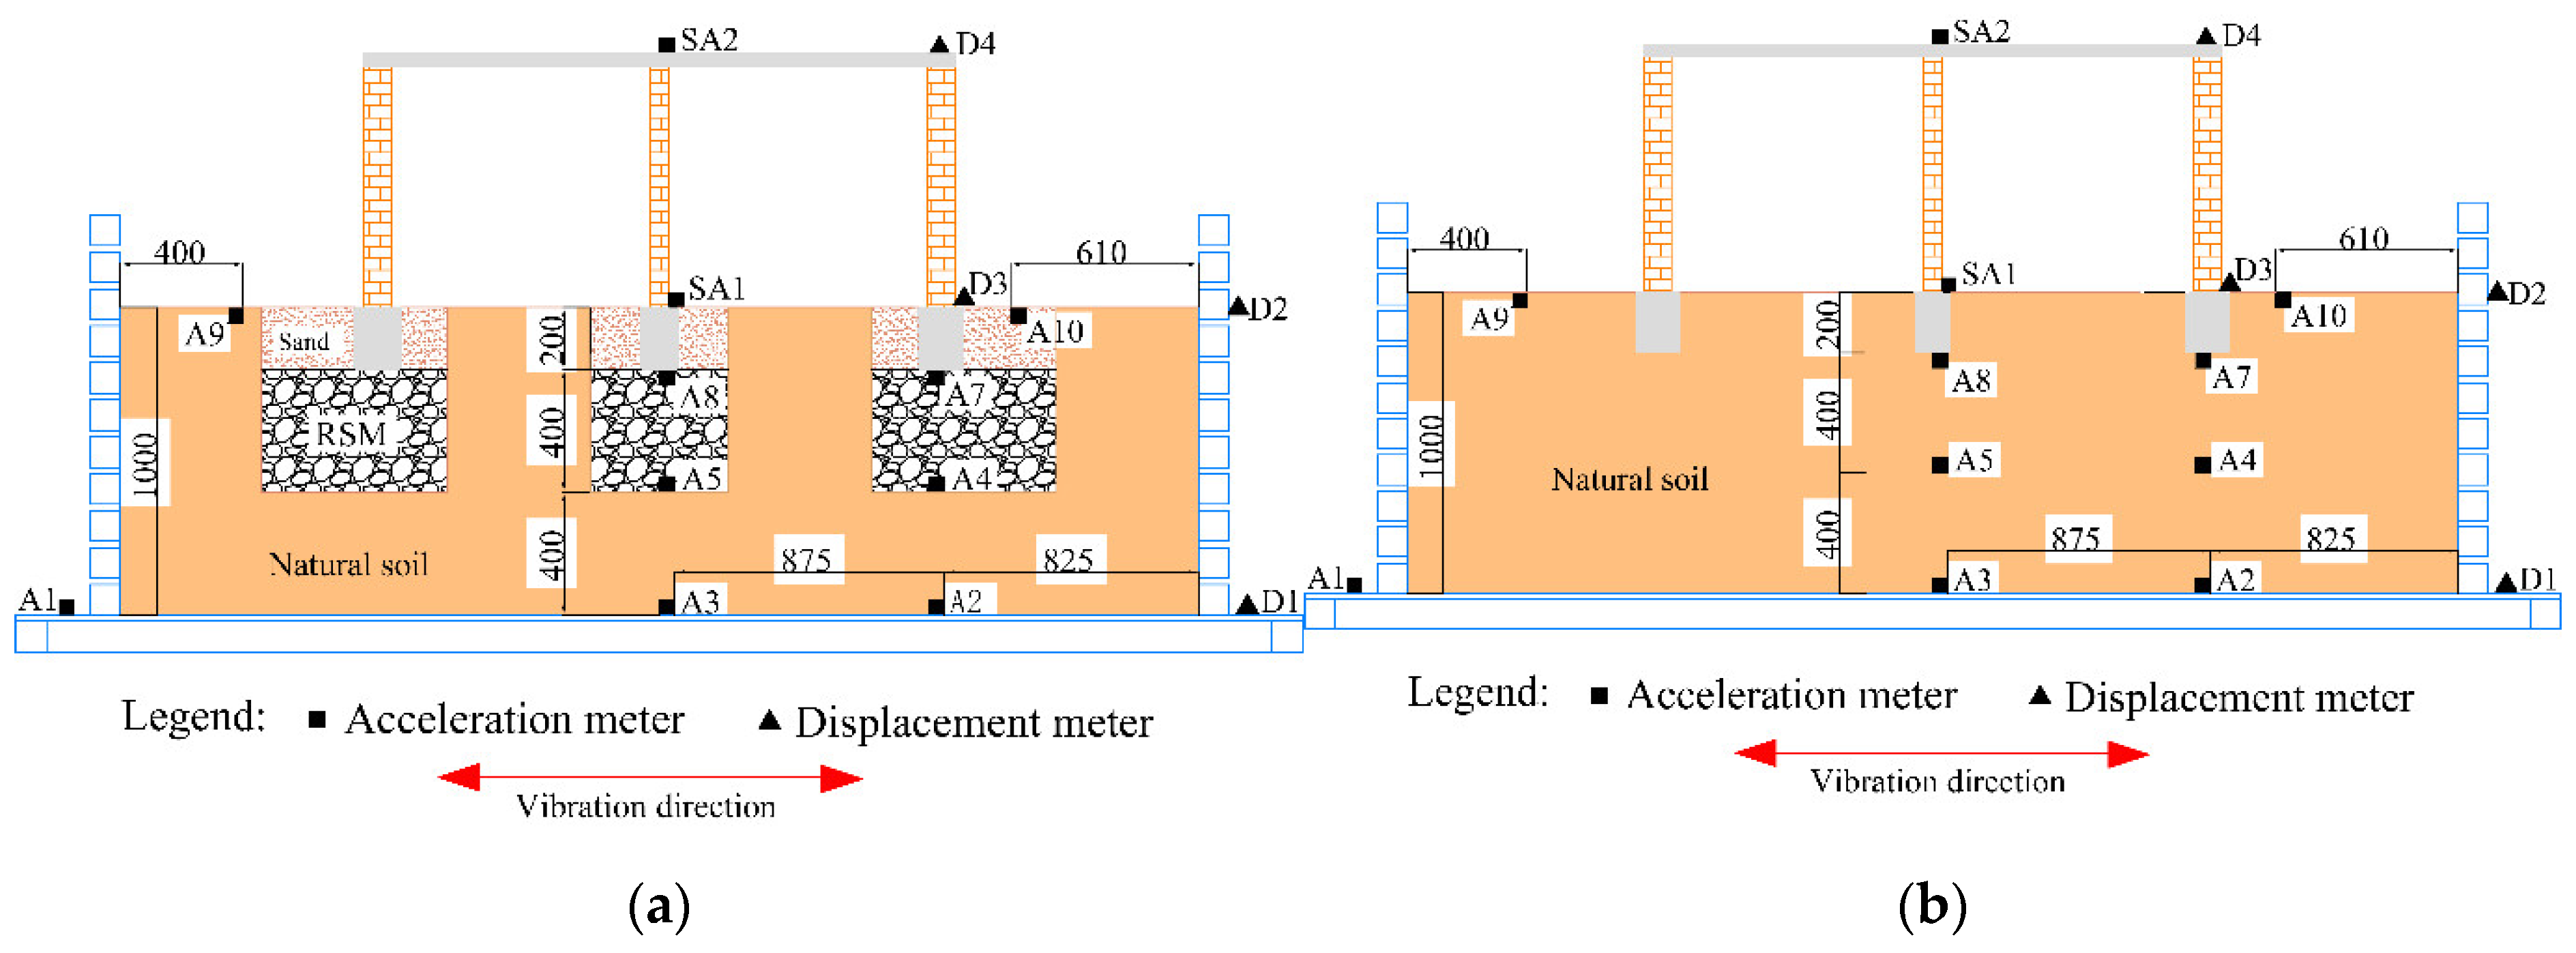
2.4. Sensor Arrangement
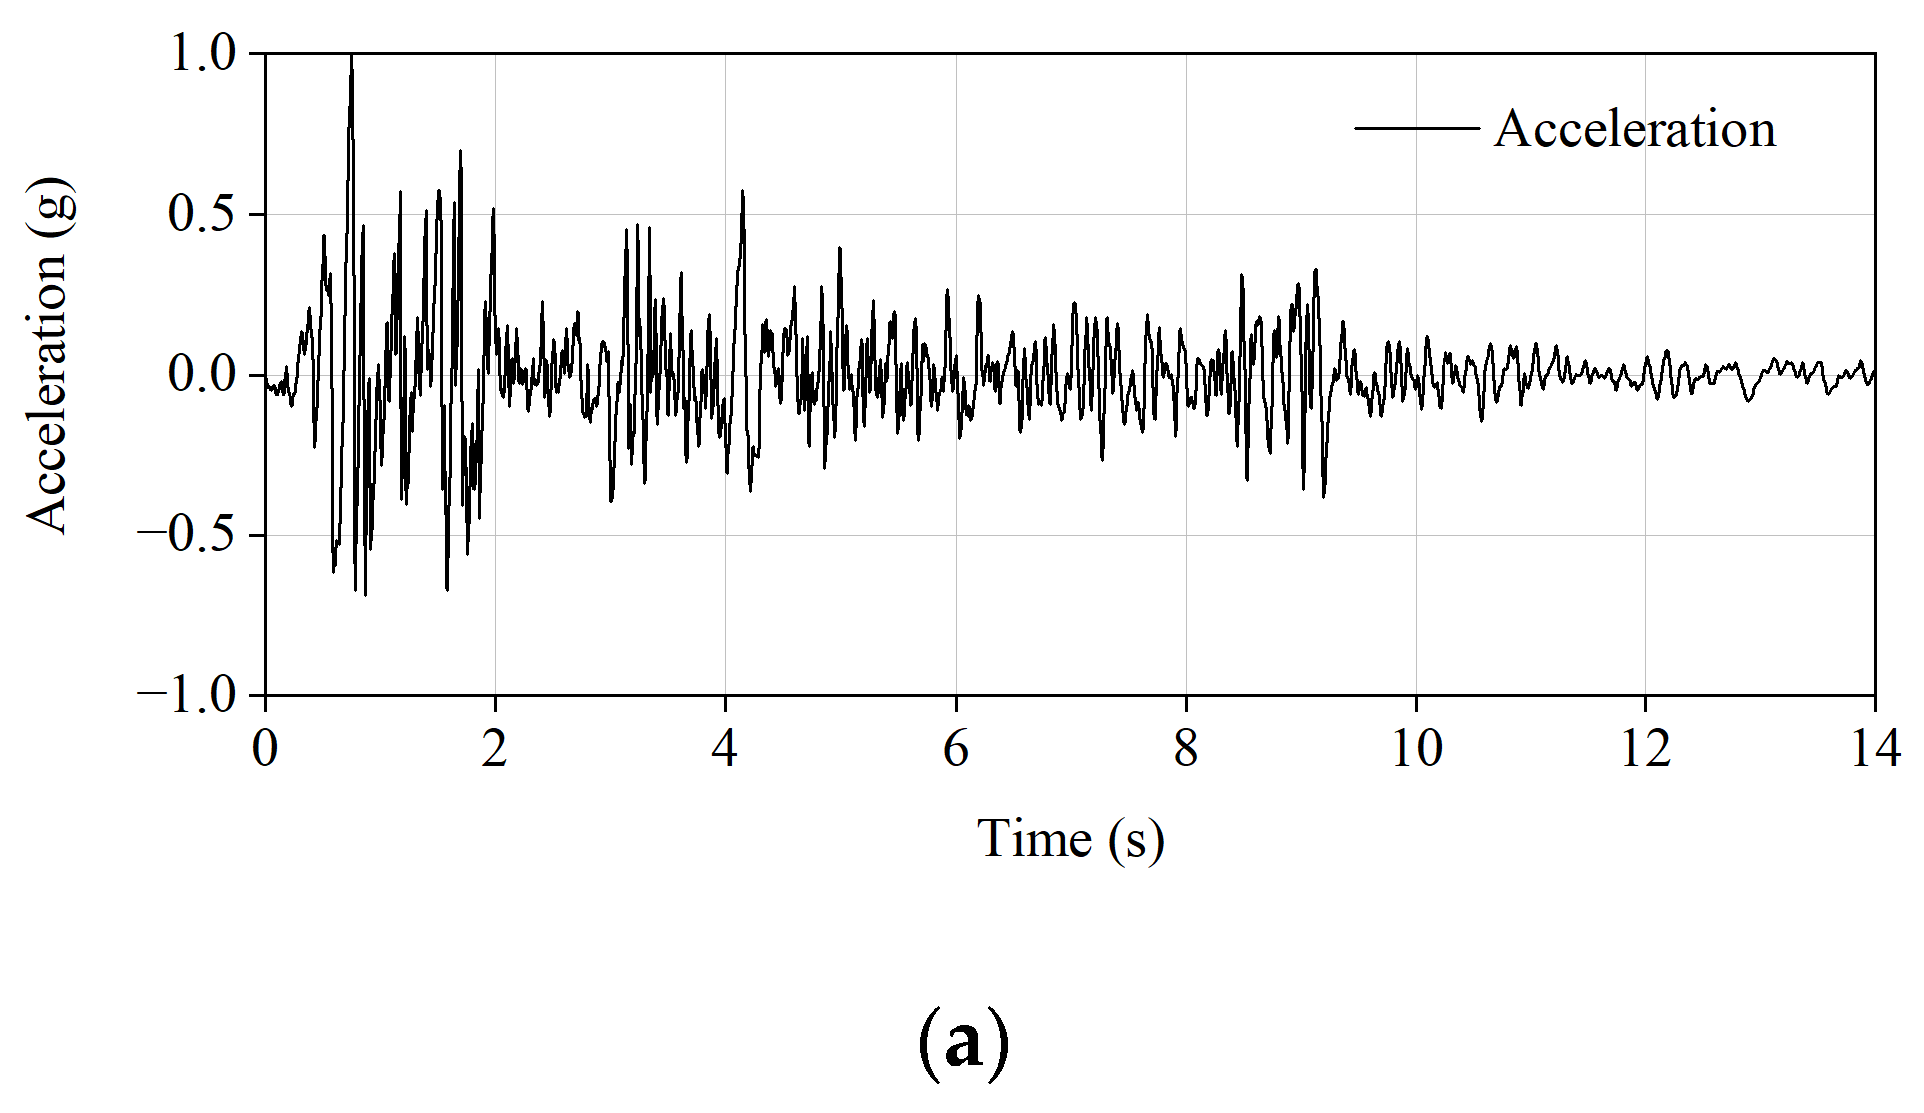
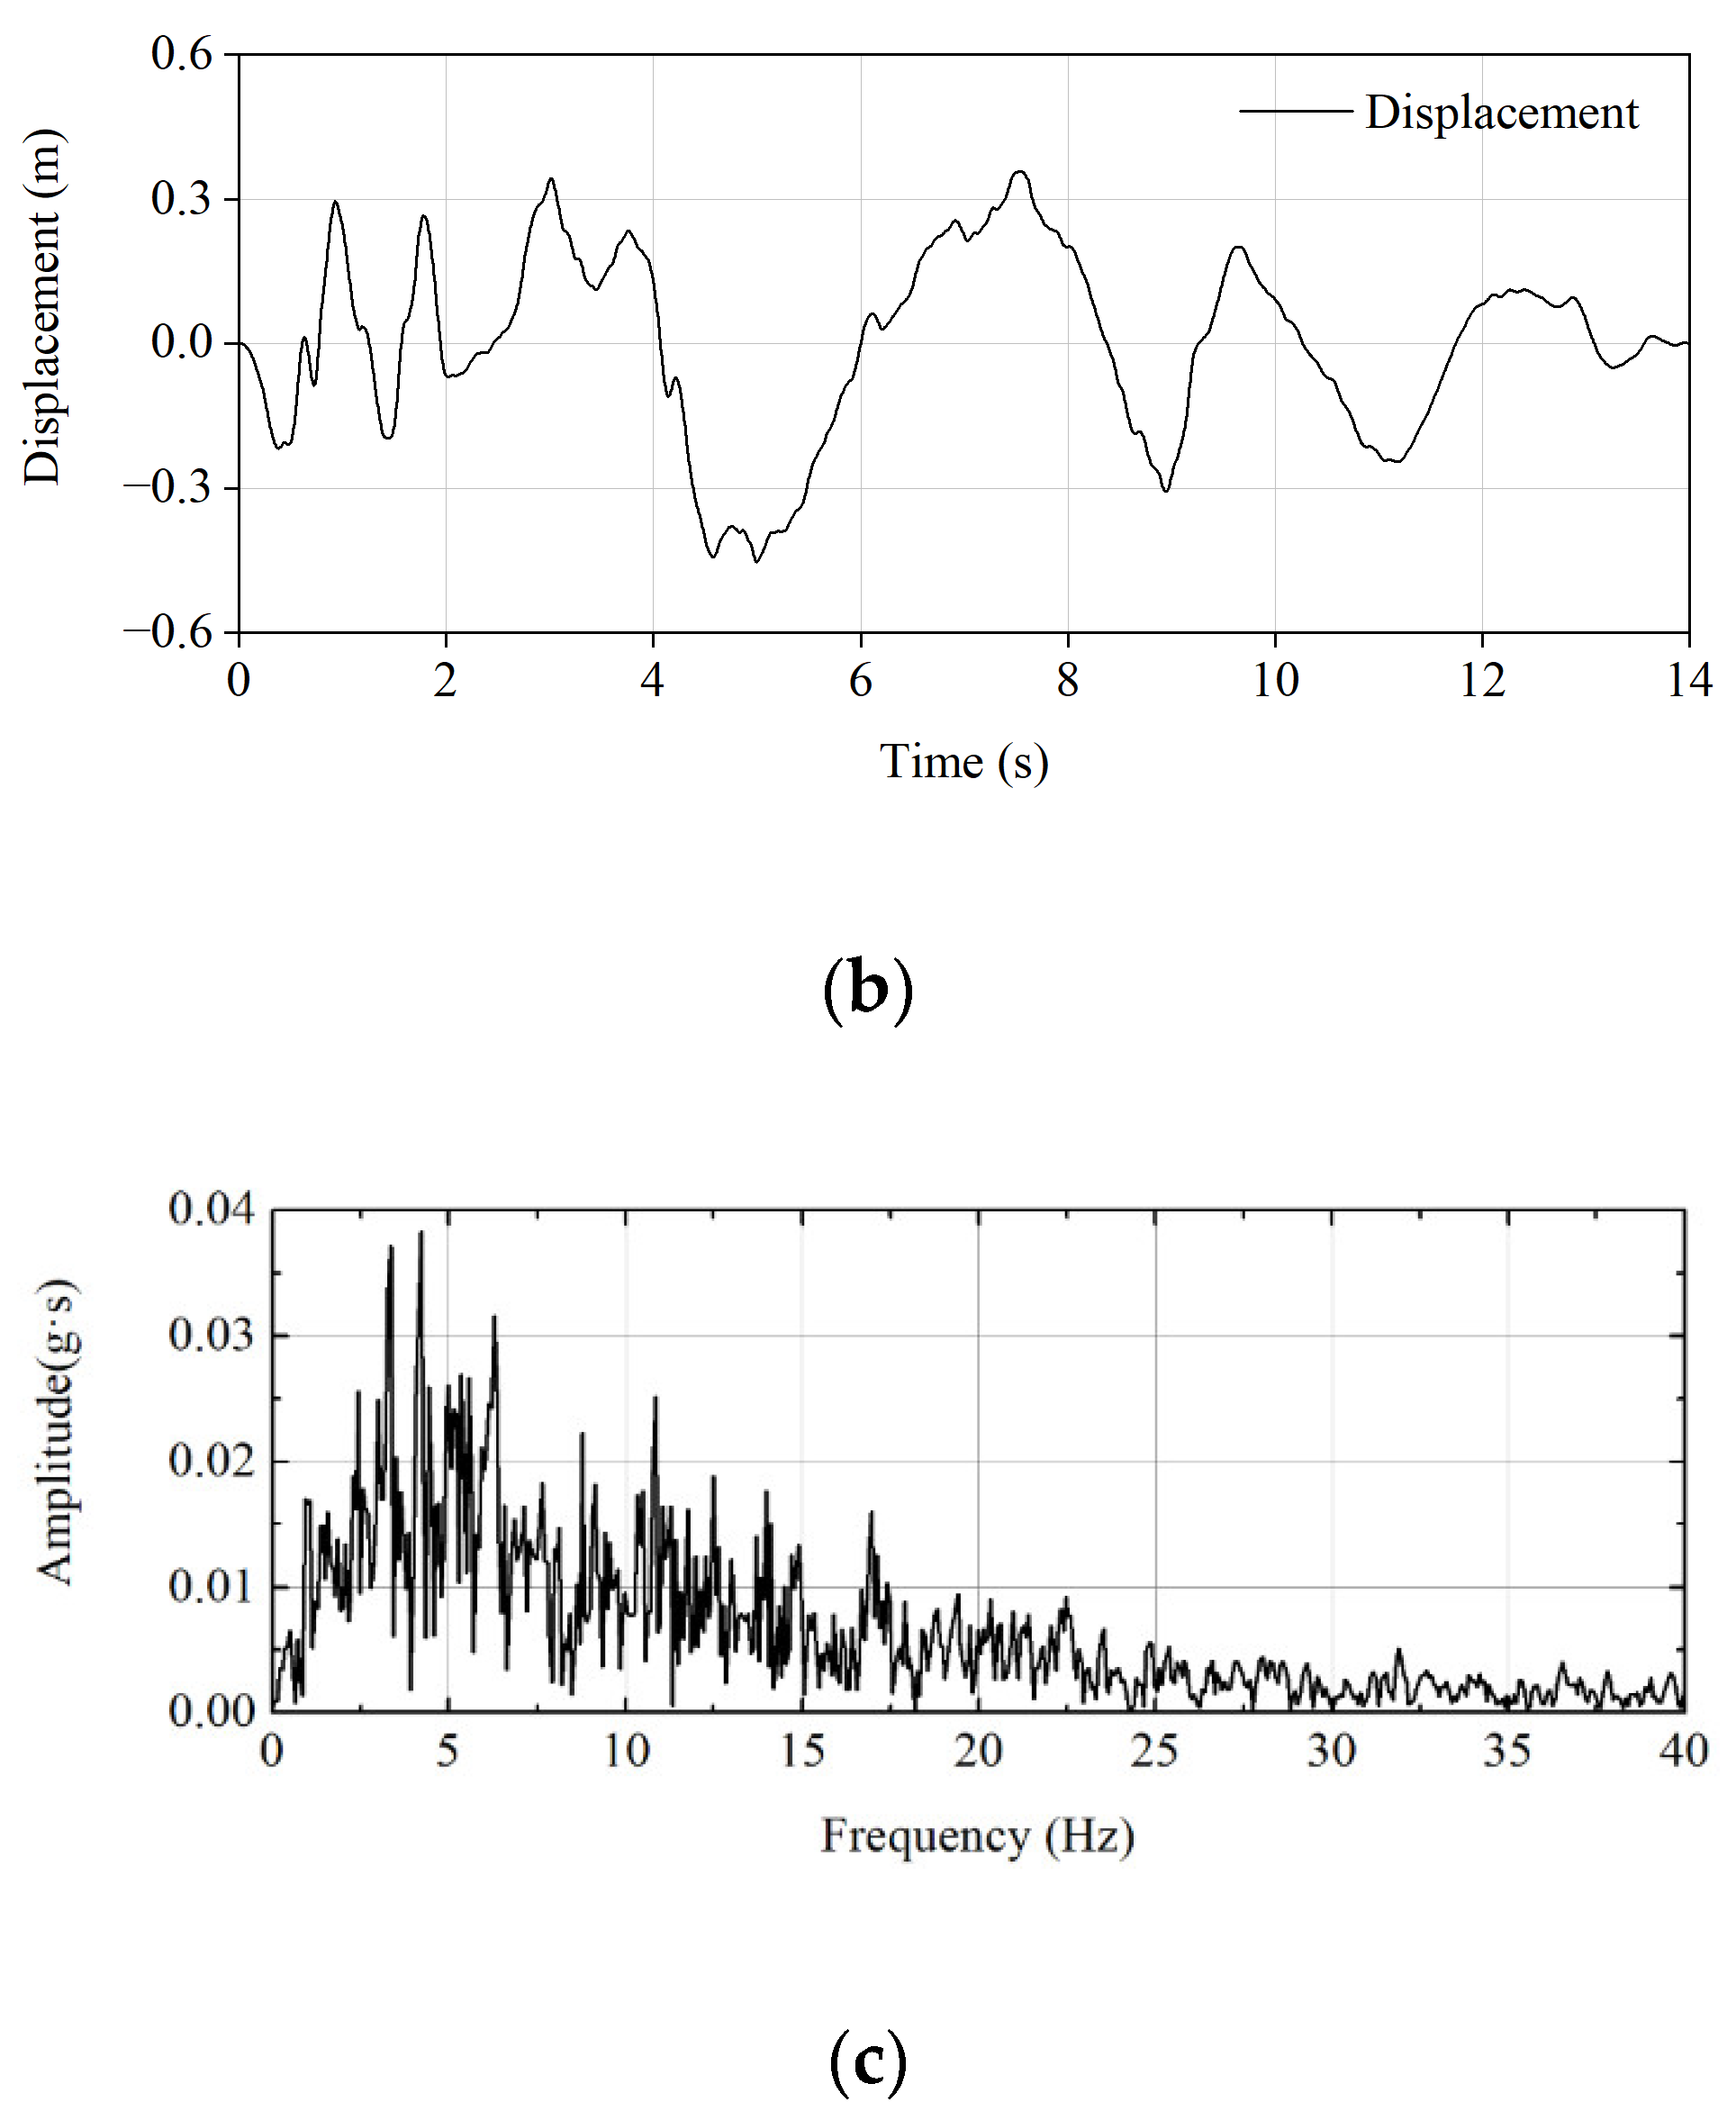
2.5. Seismic Wave and Loading System
3. Materials and Methods
3.1. Structural Model
3.2. Foundation Soil Model
4. Test Results and Discussion
4.1. Seismic Damage Analysis
4.1.1. Structural Model
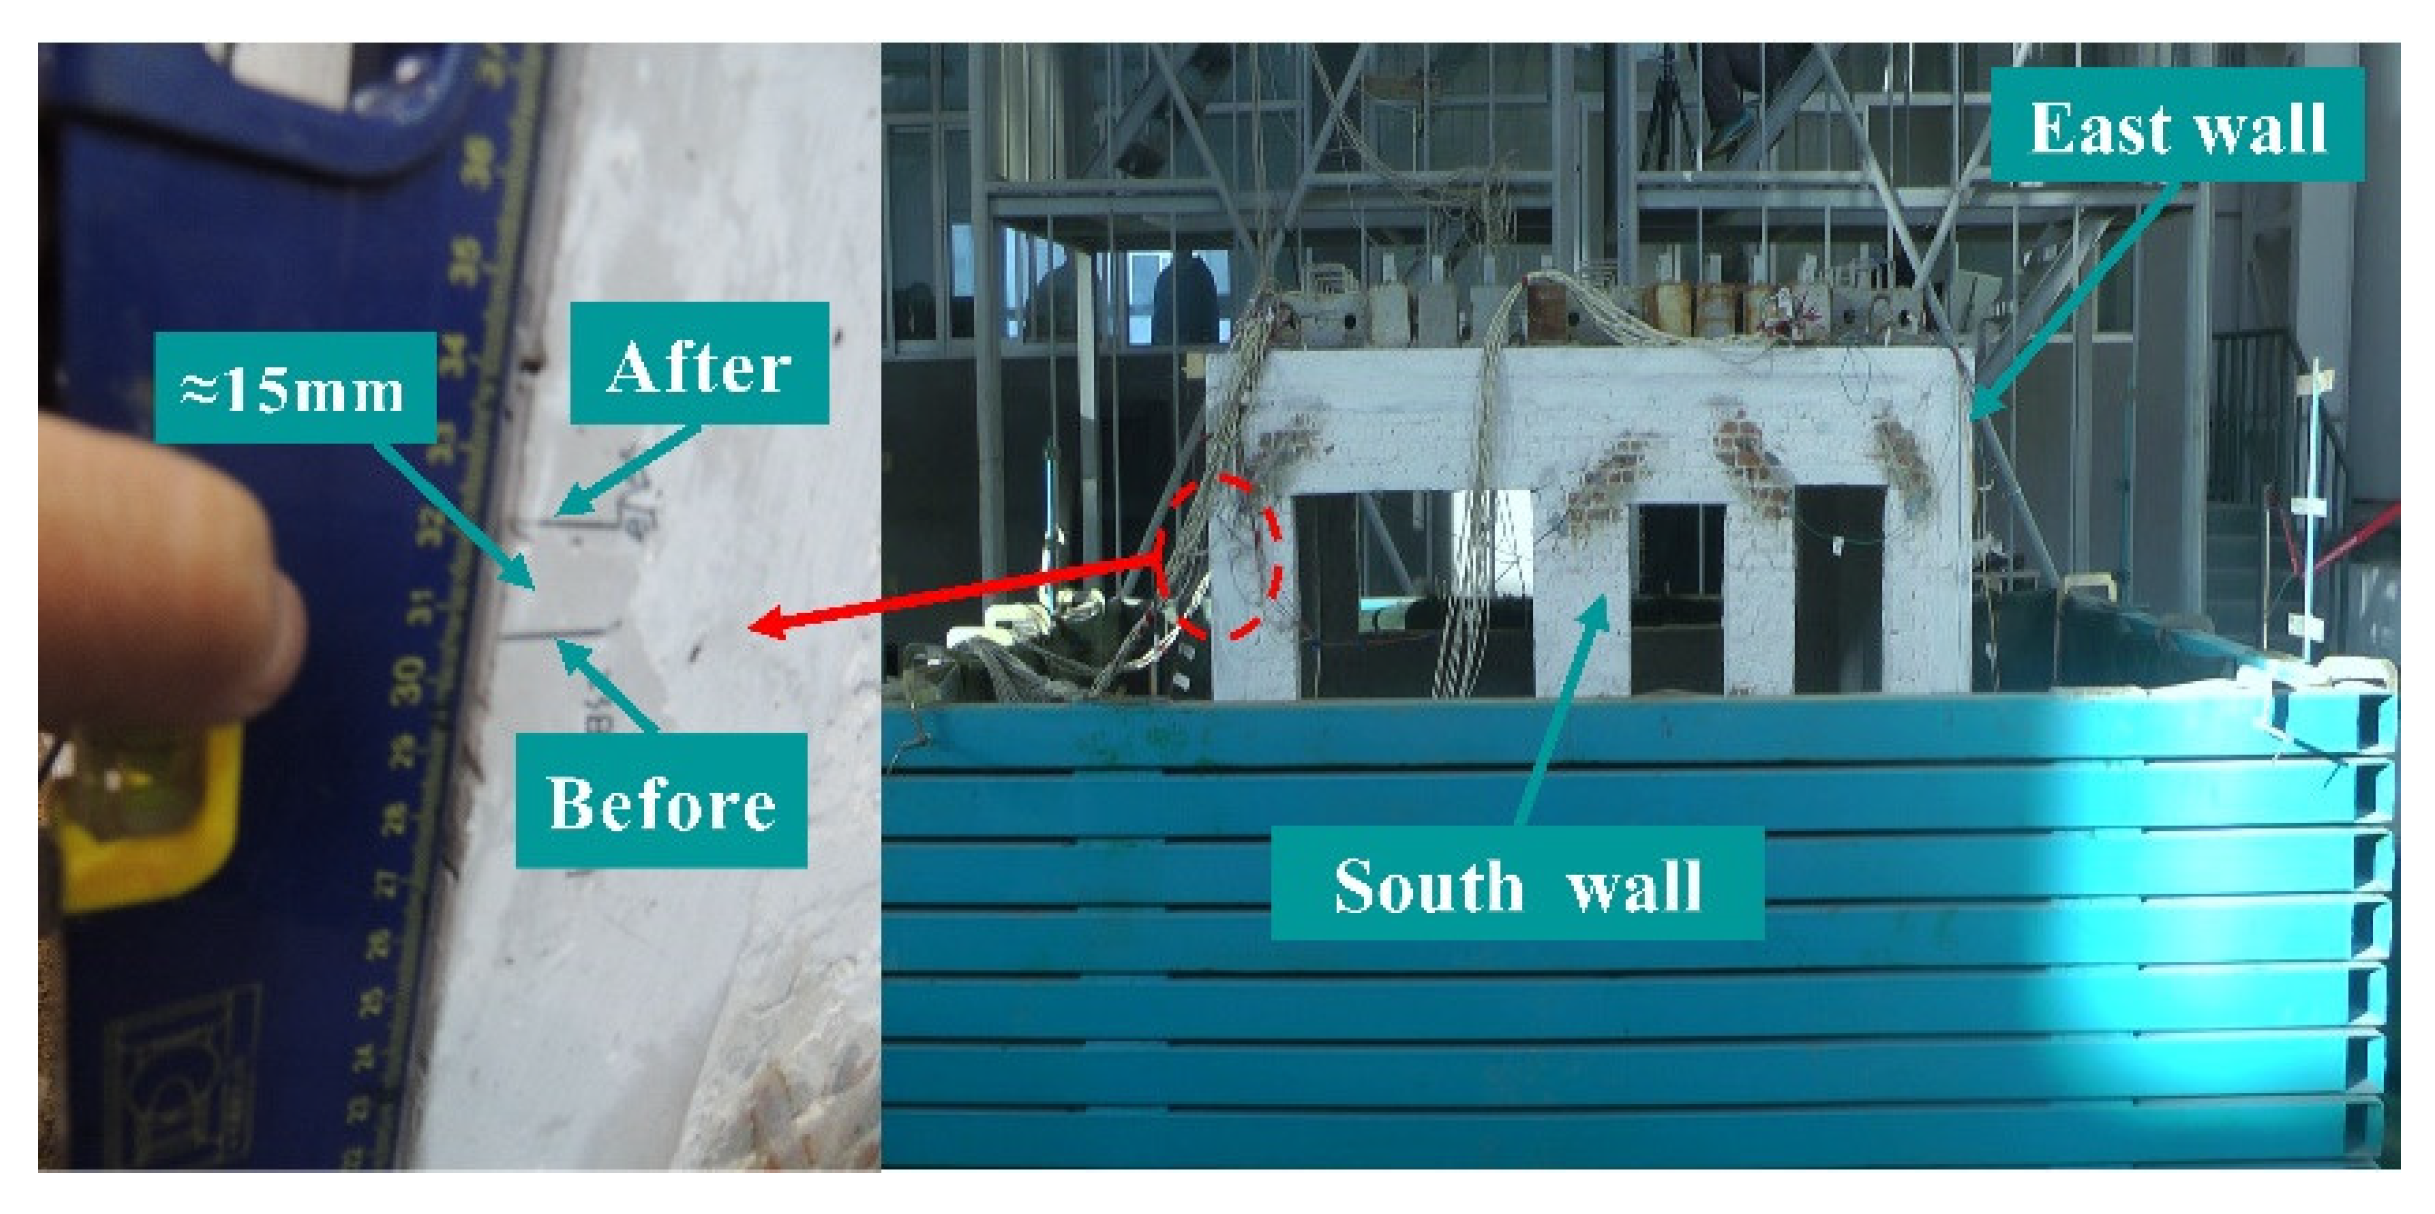
4.1.2. Foundation Soil Model
4.2. Acceleration Response
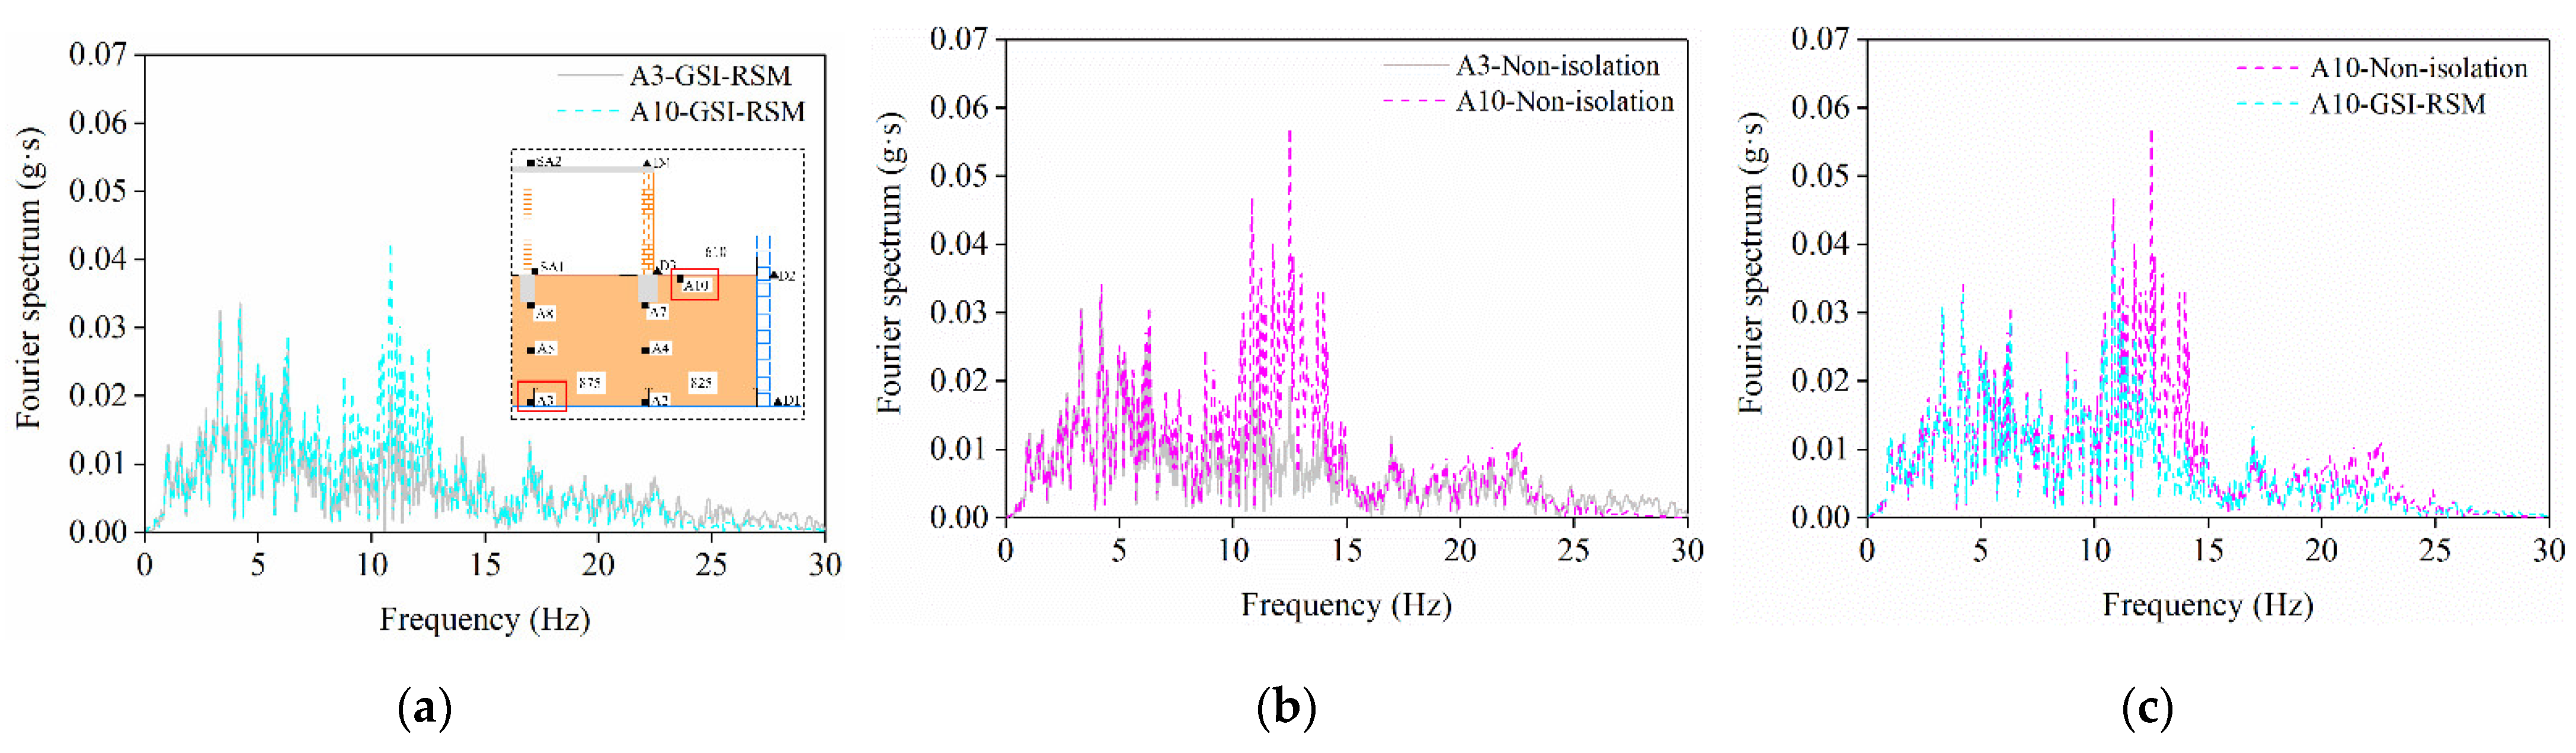
4.2.1. Fourier Spectrum
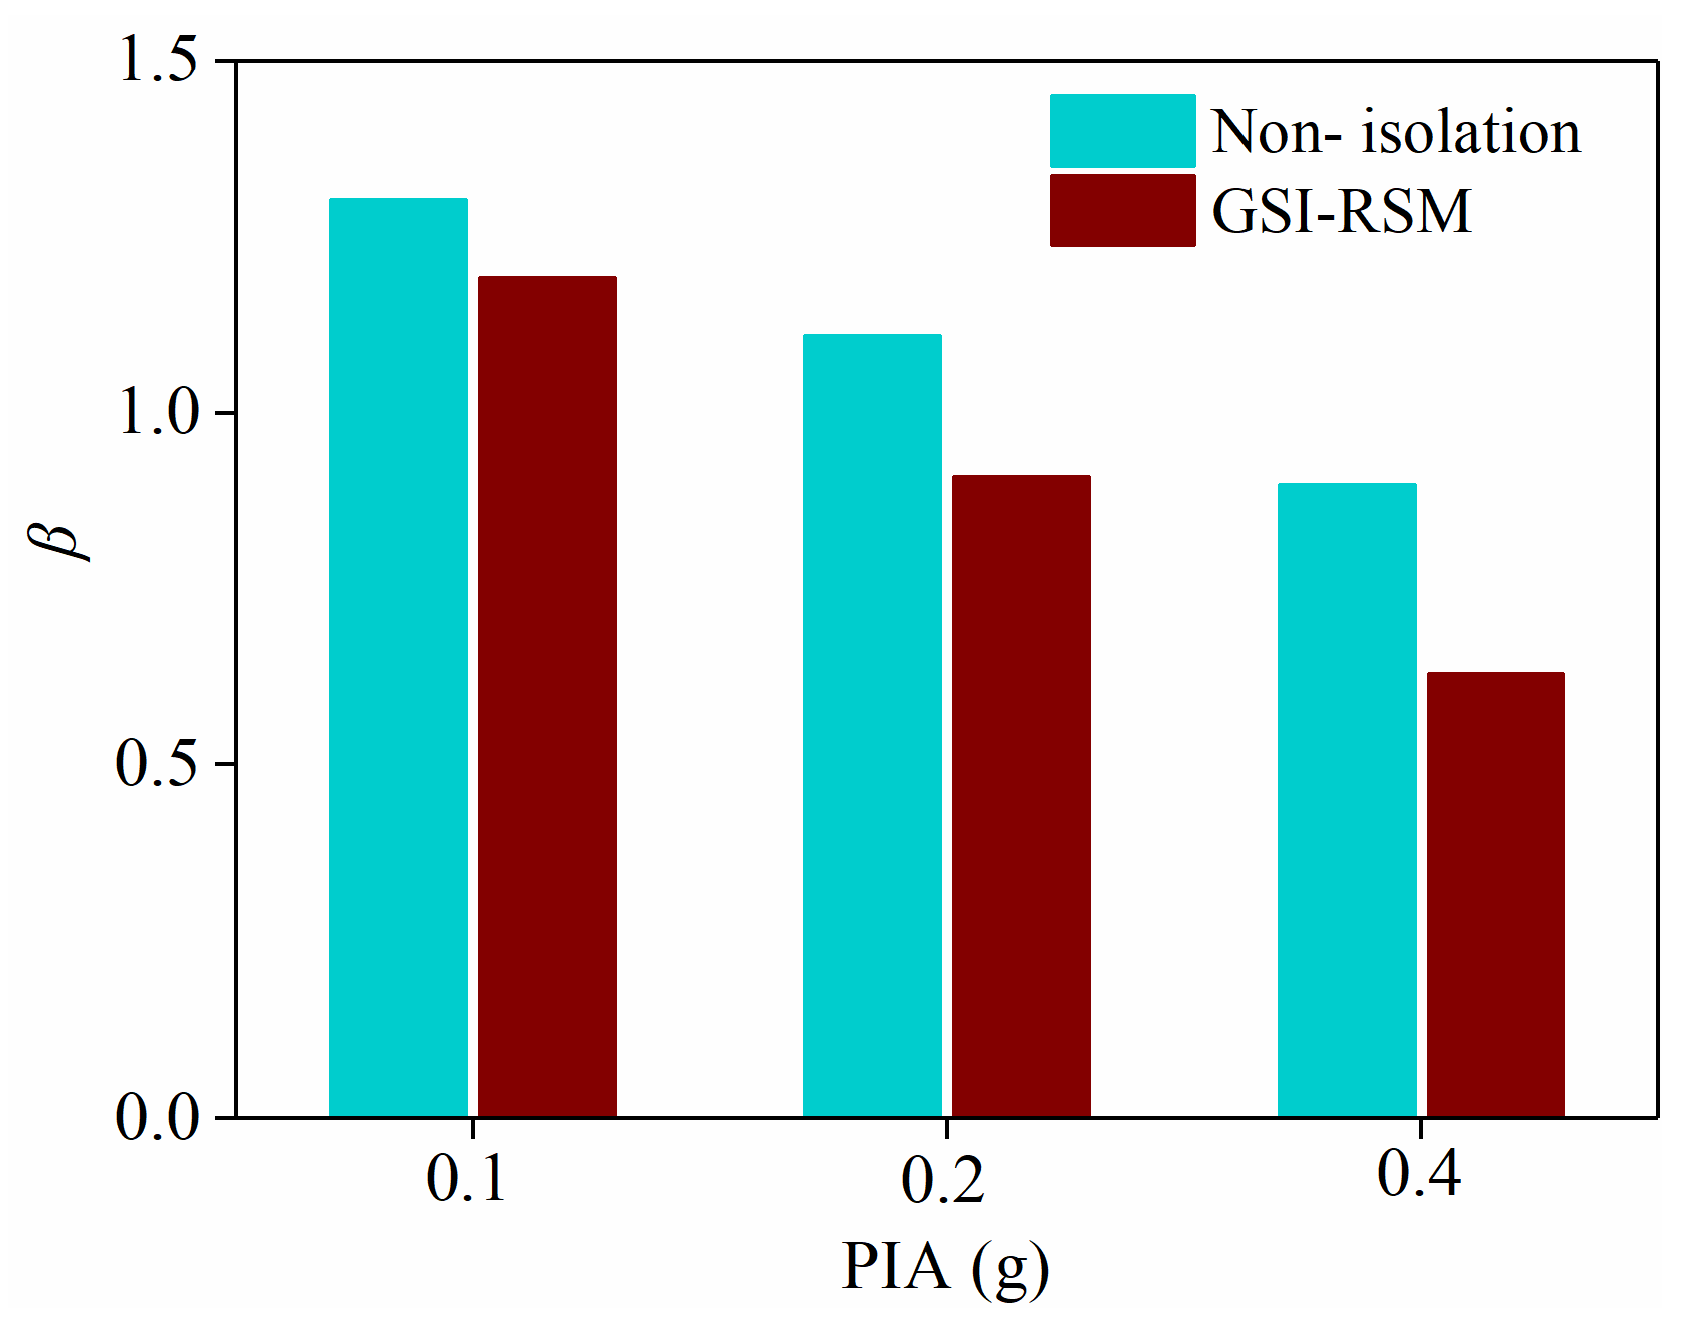
4.2.2. Acceleration Transfer Coefficient
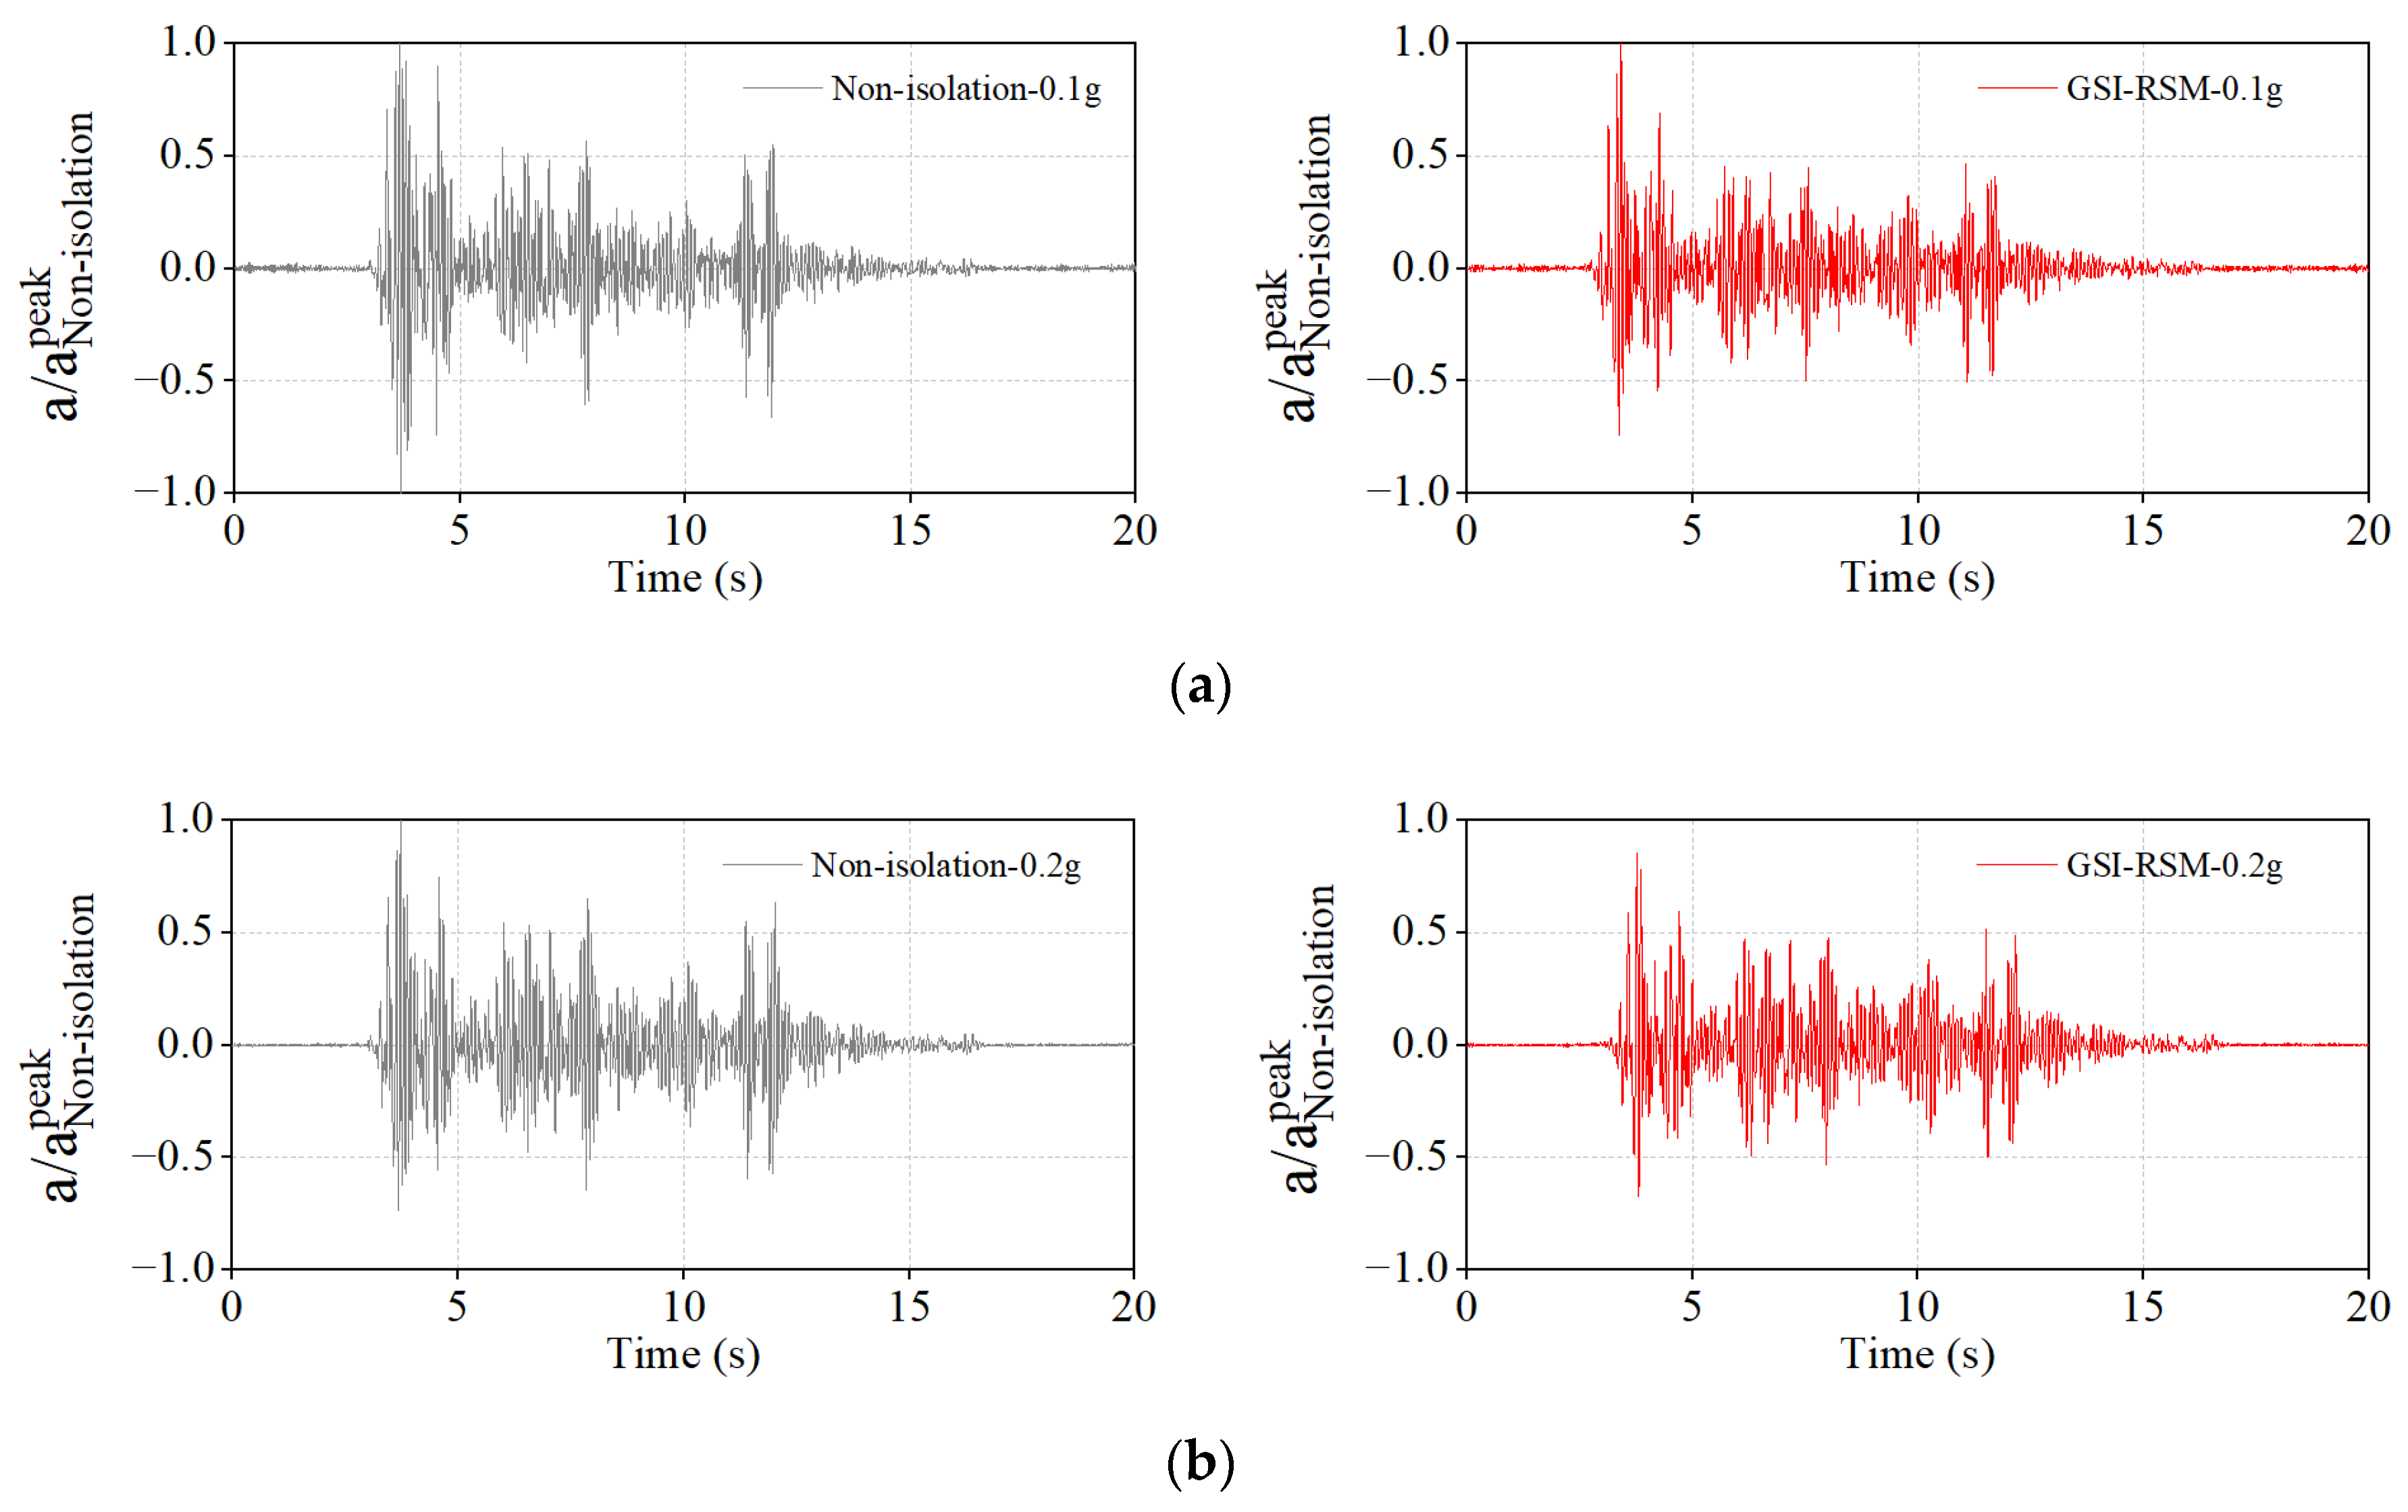
4.2.3. Structural Acceleration Response
4.3. Displacement Responses
4.3.1. Relative Displacement Response
4.3.2. Storey Drift of the Structure
5. Conclusions
- (1)
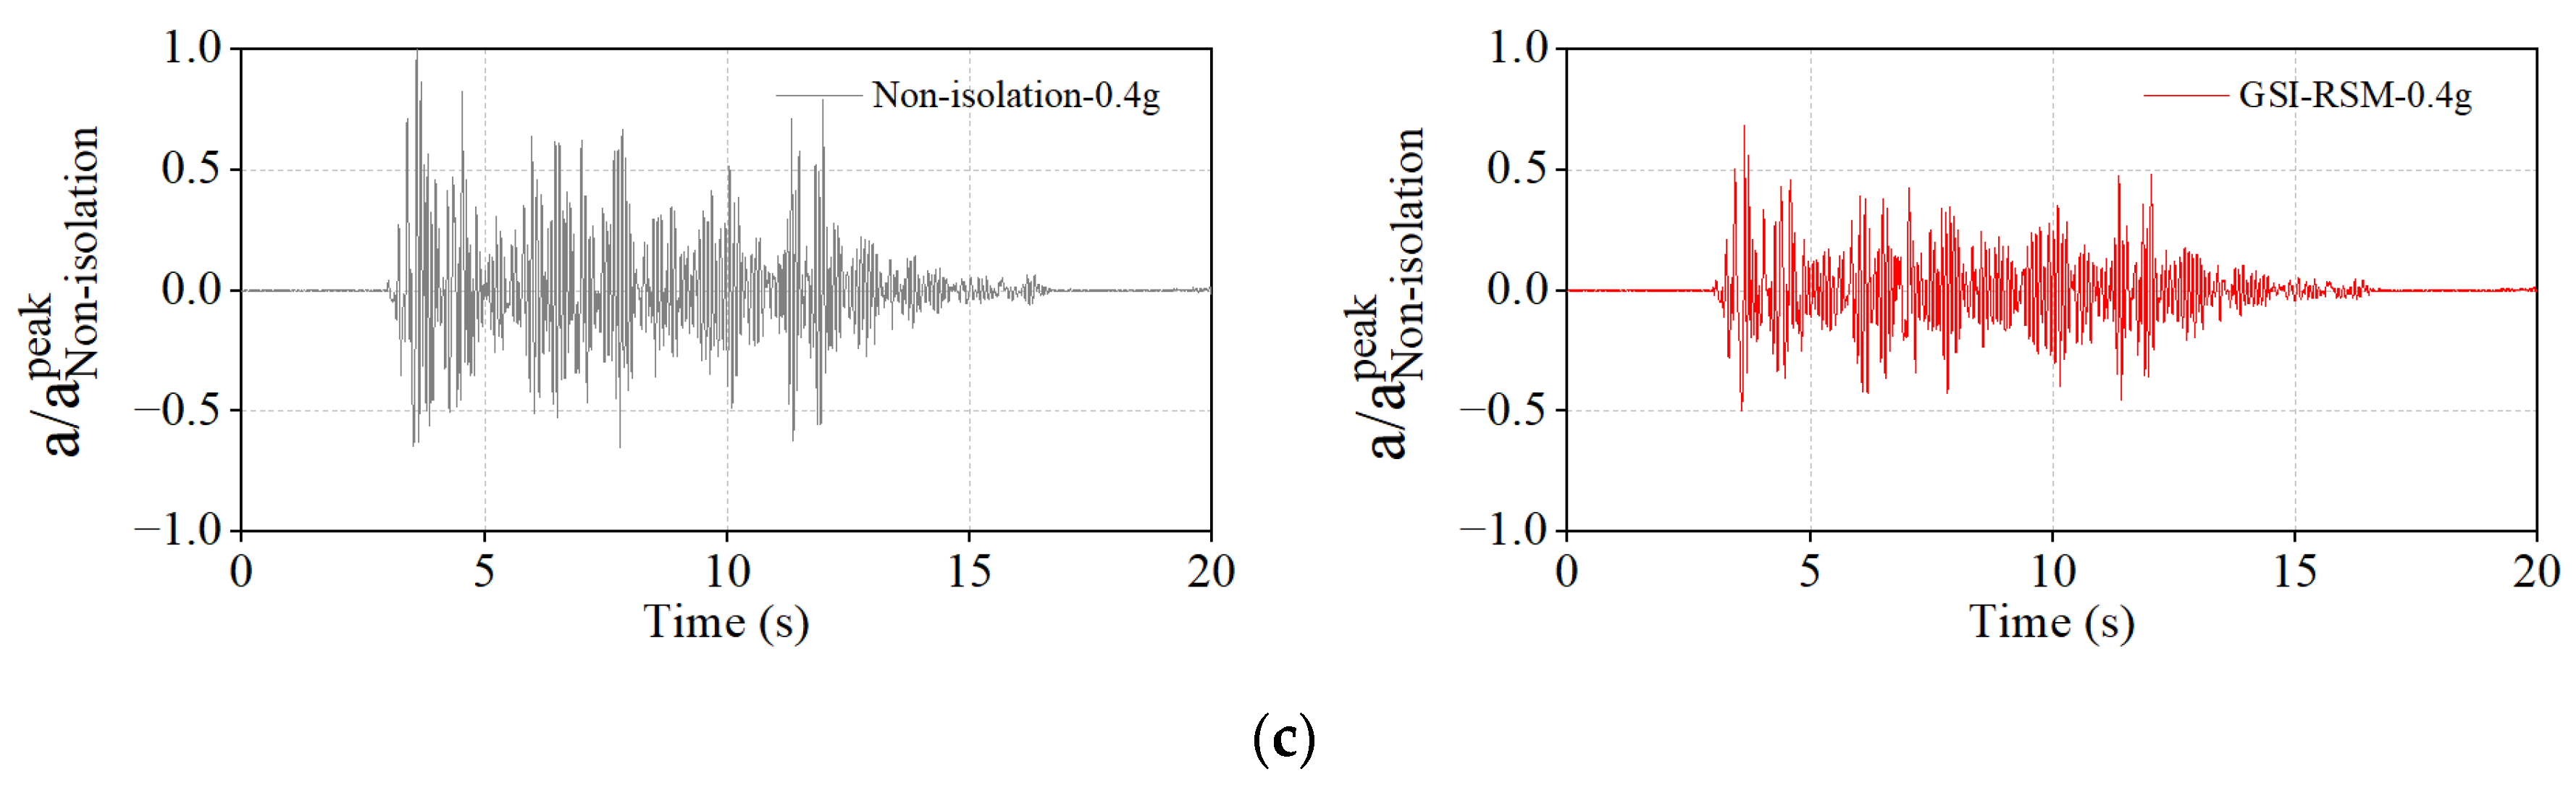
- The shaking table test results showed that the isolation effect of the GSI–RSM system was limited in small earthquakes, and the isolation effect of the GSI–RSM system increased with increasing earthquake magnitude. When the input acceleration amplitude was 0.4 g, the GSI–RSM system could reduce the acceleration response of the roof panel and the interlayer displacement response of the structure by more than 30%, which greatly reduced the seismic demand of the superstructure, achieved the purpose of isolation, and verified its effectiveness.
- (2)
- Through the analysis of the shaking table test results, the isolation mechanism of the GSI–RSM system was mainly reflected, given that the RSM layer could filter part of the high-frequency components of the earthquake to transmit to the superstructure, and the RSM layer generated friction slip in the interaction with the structural foundation, which consumed more seismic energy and thus greatly reduced the seismic energy transmitted to the superstructure.
- (3)
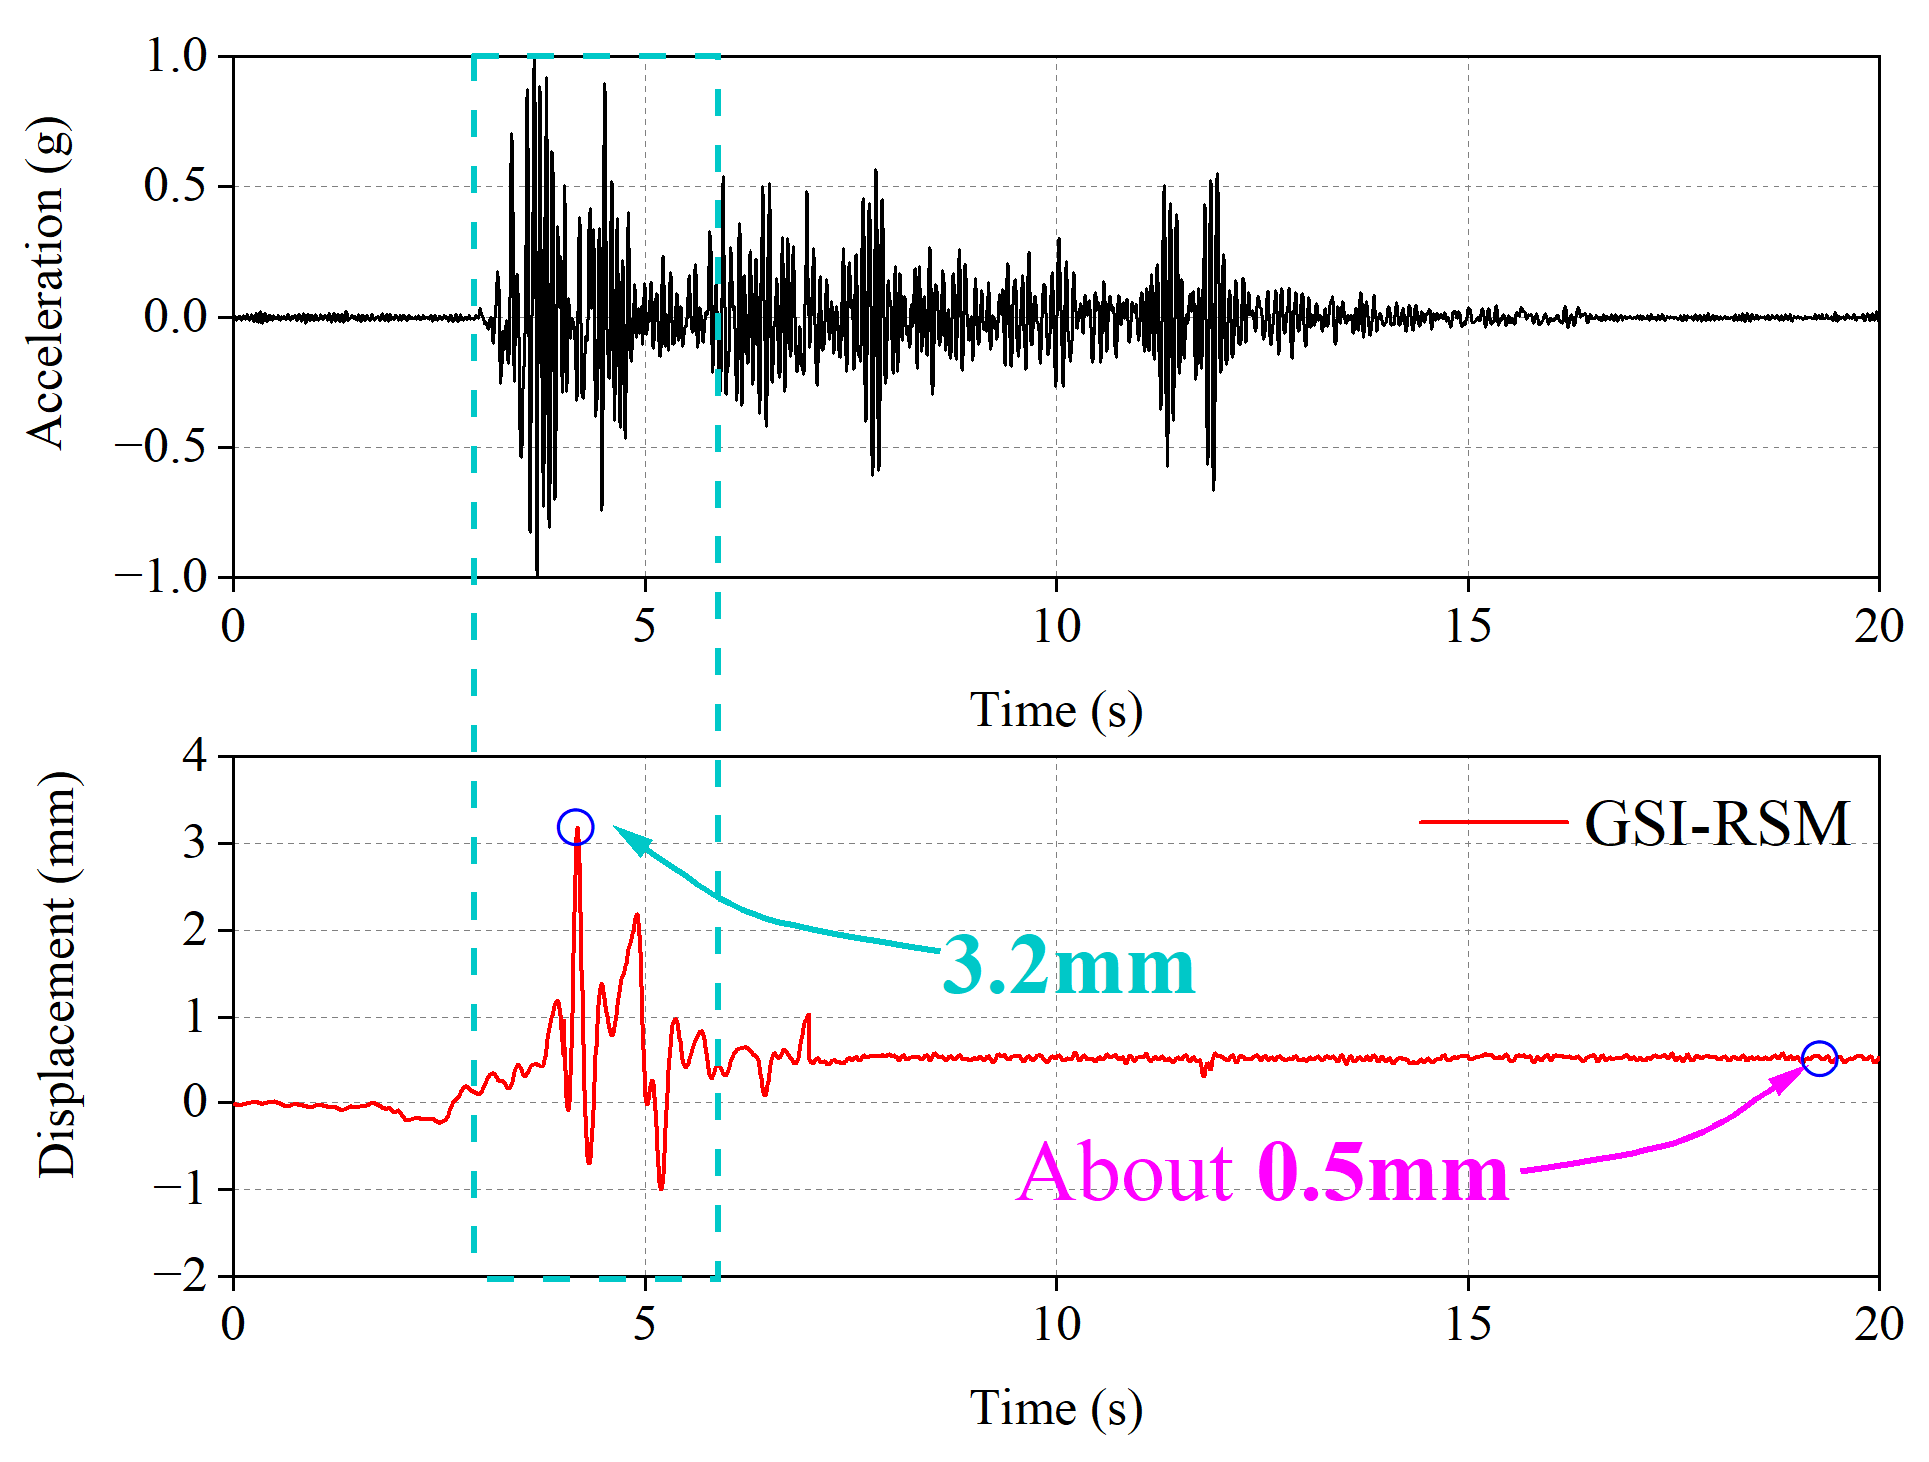
- When the input ground motion amplitude was 0.4 g, that is, the ground motion intensity was large, the relative slip movement between the structural foundation and the RSM layer occurred in the GSI–RSM test. The residual slip displacement between the structure foundation and RSM layer was only 0.5 mm, which is exactly the displacement at the end of the ground movement and is conducive to the availability of the structure after the event.
Author Contributions
Funding
Institutional Review Board Statement
Informed Consent Statement
Data Availability Statement
Acknowledgments
Conflicts of Interest
References
- Ohsaki, M.; Miyamura, T.; Kohiyama, M.; Yamashita, T.; Yamamoto, M.; Nakamura, N. Finite-element analysis of laminated rubber bearing of building frame under seismic excitation. Earthq. Eng. Struct. Dyn. 2015, 44, 1881–1898. [Google Scholar] [CrossRef]
- Lu, X.; Wang, D.; Wang, S. Investigation of the seismic response of high-rise buildings supported on tension-resistant elastomeric isolation bearings. Earthq. Eng. Struct. Dyn. 2016, 45, 2207–2228. [Google Scholar] [CrossRef]
- Markou, A.A.; Stefanou, G.; Manolis, G.D. Manolis. Stochastic response of structures with hybrid base isolation systems. Eng. Struct. 2018, 172, 629–643. [Google Scholar] [CrossRef]
- Kalpakidis, I.V.; Constantinou, M.C.; Whittaker, A.S. Modeling strength degradation in lead-rubber bearings under earthquake shaking. Earthq. Eng. Struct. Dyn. 2010, 39, 1533–1549. [Google Scholar] [CrossRef]
- Tsang, H.H. Seismic isolation by rubber-soil mixtures for developing countries. Earthq. Eng. Struct. Dyn. 2008, 37, 283–303. [Google Scholar] [CrossRef]
- Liu, H.S.; Mead, J.L.; Stacer, R.G. Environmental effects of recycled rubber in light-fill applications. Rubber Chem. Technol. 2000, 73, 551–564. [Google Scholar] [CrossRef]
- Senetakis, K.; Anastasiadis, A.; Trevlopoulos, K.; Pitilakis, K. Dynamic response of SDOF systems on soil replaced with sand/rubber mixture. In Proceedings of the ECOMAS Thematic Conference on Computation Methods in Structural Dynamics and Earthquake Engineering, Rhodes, Greece, 22–24 June 2009. [Google Scholar]
- Pitilakis, K.; Trevlopoulos, K.; Anastasiadis, A.; Senetakis, K. Seismic response of structures on improved soil. In Proceedings of the 8th International Conference on Structural Dynamics, Leuven, Belgium, 4–6 July 2011. [Google Scholar]
- Mavronicola, E.; Komodromos, P.; Charmpis, D. Numerical investigation of potential usage of rubber—Soil mixtures as a distributed seismic isolation approach. In Proceedings of the 10th International Conference on Computational Structures Technology, Valencia, Spain, 14–17 September 2010. [Google Scholar]
- Tsang, H.H.; Lo, S.H.; Xu, X.; Neaz Sheikh, M. Seismic isolation for low-to-medium-rise buildings using granulated rubber-soil mixtures: Numerical study. Earthq. Eng. Struct. Dyn. 2012, 41, 2009–2024. [Google Scholar] [CrossRef]
- Pitilakis, K.; Karapetrou, S.; Tsagdi, K. Numerical investigation of the seismic response of RC buildings on soil replaced with rubber-sand mixtures. Soil Dyn. Earthq. Eng. 2015, 79, 237–252. [Google Scholar] [CrossRef]
- Dhanya, J.; Boominathan, A.; Banerjee, S. Response of low-rise building with geotechnical seismic isolation system. Soil Dyn. Earthq. Eng. 2020, 136, 106187. [Google Scholar] [CrossRef]
- Forcellini, D. Fragility Assessment of Geotechnical Seismic Isolated (GSI) Configurations. Energies 2021, 14, 5088. [Google Scholar] [CrossRef]
- Dutta, S.; Nanda, R.P. Waste Rubber–Soil Mat for Protection of Structures from Earthquake-Induced Liquefaction. Int. J. Geosynth. Ground Eng. 2022, 8, 57. [Google Scholar] [CrossRef]
- Forcellini, D.; Alzabeebee, S. Seismic fragility assessment of geotechnical seismic isolation (GSI) for bridge configuration. Bull. Earthq. Eng. 2022, 1–22, (prepublish). [Google Scholar] [CrossRef]
- Brunet, S.; de la Llera, J.C.; Kausel, E. Non-linear modeling of seismic isolation systems made of recycled tire-rubber. Soil Dyn. Earthq. Eng. 2016, 85, 134–145. [Google Scholar] [CrossRef]
- Tsang, H.-H.; Pitilakis, K. Mechanism of geotechnical seismic isolation system: Analytical modeling. Soil Dyn. Earthq. Eng. 2019, 122, 171–184. [Google Scholar] [CrossRef]
- Hazarika, H.; Kohama, E.; Sugano, T. Underwater shake table tests on waterfront structures protected with tire chips cushion. J. Geotech. Geoenviron. Eng. 2008, 134, 1706–1719. [Google Scholar] [CrossRef]
- Hazarika, H.; Yasuhara, K.; Kikuchi, Y.; Karmokar, A.K.; Mitarai, Y. Multifaceted potentials of tire-derived three dimensional geosynthetics in geotechnical applications and their evaluation. Geotech Geomembr. 2010, 28, 303–315. [Google Scholar] [CrossRef]
- Kaneko, T.; Orense, R.P.; Hyodo, M.; Yoshimoto, N. Seismic response characteristics of saturated sand deposits mixed with tire chips. J. Geotech. Geoenviron. Eng. 2013, 139, 633–643. [Google Scholar] [CrossRef]
- Xiong, W.; Li, Y. Seismic isolation using granulated tire—Soil mixtures for less developed regions: Experimental validation. Earthq. Eng. Struct. Dyn. 2013, 42, 2187–2193. [Google Scholar] [CrossRef]
- Bandyopadhyay, S.; Sengupta, A.; Reddy, G.R. Performance of sand and shredded rubber tire mixture as a natural base isolator for earthquake protection. Earthq. Eng. Eng. Vib. 2015, 14, 683–693. [Google Scholar] [CrossRef]
- Tsiavos, A.; Alexander, N.A.; Diambra, A.; Ibraim, E.; Vardanega, P.J.; Gonzalez-Buelga, A.; Sextos, A. A sand-rubber deformable granular layer as a low-cost seismic isolation strategy in developing countries: Experimental investigation. Soil Dyn. Earthq. Eng. 2019, 125, 105731. [Google Scholar] [CrossRef]
- Tsang, H.H.; Tran, D.P.; Hung, W.Y.; Pitilakis, K.; Gad, E.F. Performance of geotechnical seismic isolation system using rubber-soil mixtures in centrifuge testing. Earthq. Eng. Struct. Dyn. 2020, 50, 1271–1289. [Google Scholar] [CrossRef]
- Pitilakis, D.; Anastasiadis, A.; Vratsikidis, A.; Kapouniaris, A.; Massimino, M.R.; Abate, G.; Corsico, S. Large-scale field testing of geotechnical seismic isolation of structures using gravel-rubber mixtures. Earthq. Eng. Struct. Dyn. 2021, 50, 2712–2731. [Google Scholar] [CrossRef]
- Sun, H.F.; Jing, L.P.; Wang, N.W.; Meng, X.C. Development of Multifunctional Laminar Shear Container for Shaking Table Test. Chin. J. Rock Mech. Eng. 2011, 30, 2498–2506. (In Chinese) [Google Scholar]
- China Standards Publication. National Standard for People’s Republic of China Code for Seismic Design of Building (GB50011-2010); Architecture and Building Press: Beijing, China, 2010. (In Chinese) [Google Scholar]
- China Standards Publication. National Standard for People’s Republic of China Standard for Test Method of Basic Mechanics Properties of Masonry (GB/T 50129-2011); Architecture and Building Press: Beijing, China, 2011. (In Chinese) [Google Scholar]


| Physical Quantity | Similarity Relation | Similarity Ratio | Physical Quantity | Similarity Relation | Similarity Ratio |
|---|---|---|---|---|---|
| Length | Sl | 0.25 | Density | Sρ | 2.00 |
| Elastic Modulus | SE | 1.00 | Time | Sl(Sρ/SE) 0.5 | 0.35 |
| Strain | Sσ/SE | 1.00 | Frequency | (SE/Sρ) 0.5/Sl | 2.83 |
| Stress | Sσ = SE | 1.00 | Acceleration | SE/(SlSρ) | 2.00 |
| Condition | Seismic Wave | Direction | Input Acceleration Amplitude [g] |
|---|---|---|---|
| 1 | EL Centro wave (NS) | Horizontal | 0.1 |
| 2 | EL Centro wave (NS) | Horizontal | 0.2 |
| 3 | EL Centro wave (NS) | Horizontal | 0.4 |
| Specimen Number | Sample Bottom Area (mm2) | Failure Load (kN) | Compressive Strength (MPa) | Elastic Modulus (MPa) | Average Modulus of Elasticity (MPa) | |
|---|---|---|---|---|---|---|
| 1 | 15,480 | 51.3 | 3.32 | 1352 | 982.25 | 1031.97 |
| 2 | 15,130 | 46.7 | 3.09 | 1186 | 1042.16 | |
| 3 | 15,260 | 45.2 | 2.96 | 1105 | 1071.49 |
| Type of Soil | Density (g/cm3) | Moisture Content (%) | Internal Friction Angle (°) | Cohesion (kPa) | Initial Shear Modulus (MPa) | Reference Strain |
|---|---|---|---|---|---|---|
| Natural soil | 1.88 | 17.31 | 26.36 | 37.61 | 29.3 | 0.0297 |
| RSM | 1.48 | 6.02 | 22.87 | 5.43 | 18.5 | 0.0093 |
| Condition | Input Acceleration Amplitude of 0.1 g | Input Acceleration Amplitude of 0.2 g | Input Acceleration Amplitude of 0.4 g | |||
|---|---|---|---|---|---|---|
| Peak Displacement (mm) | Storey Drift (%) | Peak Displacement (mm) | Storey Drift (%) | Peak Displacement (mm) | Storey Drift (%) | |
| Non-isolation | 1.26 | 0.15 | 2.25 | 0.27 | 4.24 | 0.51 |
| GSI–RSM | 1.28 | 0.15 | 1.87 | 0.23 | 2.68 | 0.32 |
Publisher’s Note: MDPI stays neutral with regard to jurisdictional claims in published maps and institutional affiliations. |
© 2022 by the authors. Licensee MDPI, Basel, Switzerland. This article is an open access article distributed under the terms and conditions of the Creative Commons Attribution (CC BY) license (https://creativecommons.org/licenses/by/4.0/).
Share and Cite
Yin, Z.; Sun, H.; Jing, L.; Dong, R. Geotechnical Seismic Isolation System Based on Rubber-Sand Mixtures for Rural Residence Buildings: Shaking Table Test. Materials 2022, 15, 7724. https://doi.org/10.3390/ma15217724
Yin Z, Sun H, Jing L, Dong R. Geotechnical Seismic Isolation System Based on Rubber-Sand Mixtures for Rural Residence Buildings: Shaking Table Test. Materials. 2022; 15(21):7724. https://doi.org/10.3390/ma15217724
Chicago/Turabian StyleYin, Zhiyong, Haifeng Sun, Liping Jing, and Rui Dong. 2022. "Geotechnical Seismic Isolation System Based on Rubber-Sand Mixtures for Rural Residence Buildings: Shaking Table Test" Materials 15, no. 21: 7724. https://doi.org/10.3390/ma15217724
APA StyleYin, Z., Sun, H., Jing, L., & Dong, R. (2022). Geotechnical Seismic Isolation System Based on Rubber-Sand Mixtures for Rural Residence Buildings: Shaking Table Test. Materials, 15(21), 7724. https://doi.org/10.3390/ma15217724