1. Introduction
Phosphogypsum is the industrial byproduct discharged from the wet preparation of phosphoric acid [
1,
2,
3]. Its main component is CaSO
4·2H
2O, and it also contains other harmful impurities [
4,
5]. The phosphogypsum emissions in China are massive, and the pile stock has increased year by year. Currently, the pile stock amounts to 500 million tons, but the utilization rate is only about 15% [
6]. The accumulation of phosphogypsum occupies a large amount of land and damages the natural environment [
7]. Phosphorus building gypsum can be obtained through the dehydration of phosphogypsum at high temperatures, and its main component is CaSO
4·1/2H
2O [
8]. The main application of phosphorus building gypsum is in preparing building materials, such as blocks and wall panels [
9]. Blocks use phosphorus building gypsum as the main raw material, adding water before mixing, casting, molding, and drying to generate lightweight phosphorus building gypsum products. Blocks have many advantages, such as sound insulation, fire prevention, and convenient construction. They represent a new low-carbon, environmentally friendly, and healthy wall material. Wall panels also use phosphorus building gypsum as the main raw material, which can be mixed with a proper amount of fiber material as the core material before molding, cutting, drying, and other processes. Wall panels are mainly used for partitions, interior walls, etc. Phosphorus building gypsum can also be mixed with water and retarder into gypsum slurry, which can be used as indoor paint. The preparation cost of phosphorus building gypsum is low, which fits with the low-carbon development trend of the global building materials industry, and it has been recognized as one of the most promising methods for treating phosphogypsum [
10].
However, due to its poor performance, phosphorus building gypsum cannot be applied widely in practical projects. On the one hand, the composition of phosphorus building gypsum is relatively complex, and the large number of impurities affects its performance. On the other hand, phosphorus building gypsum has poor crystal morphology, generally existing in a sheet or plate shape, which results in poor fluidity and high porosity. Therefore, the strength of phosphorus building gypsum is low, and the water resistance is poor [
11]. It is necessary to apply some preprocessing methods in the preparation of phosphorus building gypsum to improve the performance of phosphogypsum, such as flotation methods [
12], chemical methods [
13], sieving methods [
14], and heat treatment methods [
15]. As a common powder preprocessing method, ball milling has been widely applied and studied in the preparation and modification of cement materials [
16,
17,
18]. However, there have been few studies on the treatment of phosphogypsum and phosphorus building gypsum. Li [
19] analyzed the influence of ball-milling time on the specific surface area, particle size distribution, 2 h strength, and absolute dry strength of phosphorus building gypsum at a standard consistency. It was found that the performance of phosphorus building gypsum was best when the ball-milling time was 3 min, and the increase in ball-milling time could not improve the performance of phosphorus building gypsum. Wu [
20] studied the effects of ball-milling time on the particle size, physical properties, and mechanical properties of net slurry, and the results showed that the performance of phosphorus building gypsum could be enhanced by controlling the ball-milling time.
At present, artificial neural networks, polynomial regression analysis, machine learning, response surface fitting, and other methods are widely applied to model and predict the performance of building materials [
21,
22,
23,
24]. The prediction model of material performance can be used to guide the property design and optimization of building materials. However, research on the modification of phosphorus building gypsum using ball milling has focused on analyzing the change rules and mechanisms of material properties, whereas related studies on predicting the properties of phosphorus building gypsum using mathematical models are rare. This paper introduces gray theory to model and predict the strength of phosphorus building gypsum modified by ball milling. Gray theory can be applied to the analysis and prediction of systems with small data and uncertainty [
25,
26]. The gray prediction model has achieved good results in various fields, such as energy, economy, and environmental protection [
27,
28,
29]. Furthermore, it has also been widely applied in the study of building material properties [
30,
31,
32]. Zhou [
33] applied the GM (1,4) model to complete the optimal design of low-shrinkage cementitious materials. Ma [
34] used the GM (1,8) model to model and predict the 28-day compressive strength of calcium-based geopolymer based on pore structure characteristics and obtained good prediction results.
Through the experiments in this paper, the influence of ball milling with different parameters on the absolute dry flexural strength and absolute dry compressive strength of phosphorus building gypsum was investigated. Furthermore, as a function of the mass ratio of material to ball, ball-milling speed, and ball-milling time, the NSGM (1,4) model was adopted to model the absolute dry flexural strength and the absolute dry compressive strength of phosphorus building gypsum modified by ball milling, thereby realizing effective simulation and prediction.
3. Results and Discussion
3.1. The Effect of Ball Milling on Absolute Dry Flexural Strength of Phosphorus Building Gypsum
Table 3 shows the influence of different ball-milling parameters on the strength of phosphorus building gypsum.
Under water consumption for standard consistency, the effects of the mass ratio of material to ball, milling speed, and milling time on the absolute dry flexural strength of phosphorus building gypsum are shown in
Figure 1.
As can be seen from
Figure 1, under different mass ratios of material to ball and milling speed, the absolute dry flexural strength of phosphorus building gypsum first increased and then decreased with the increase in milling time. When the mass ratio of material to ball was the same, faster ball milling had a greater influence on the absolute dry flexural strength of phosphorus building gypsum. When the milling speed was the same, a smaller mass ratio of material to ball had a greater influence on the absolute dry flexural strength of phosphorus building gypsum.
In general, under the conditions of a mass ratio of material to ball of 1:1, ball milling speed of 90 rpm, and ball milling time of 5 min, the absolute dry flexural strength of phosphorus building gypsum reached the maximum value of 4.39 MPa, increasing by 39% compared with the control group.
3.2. The Effect of Ball Milling on Absolute Dry Compressive Strength of Phosphorus Building Gypsum
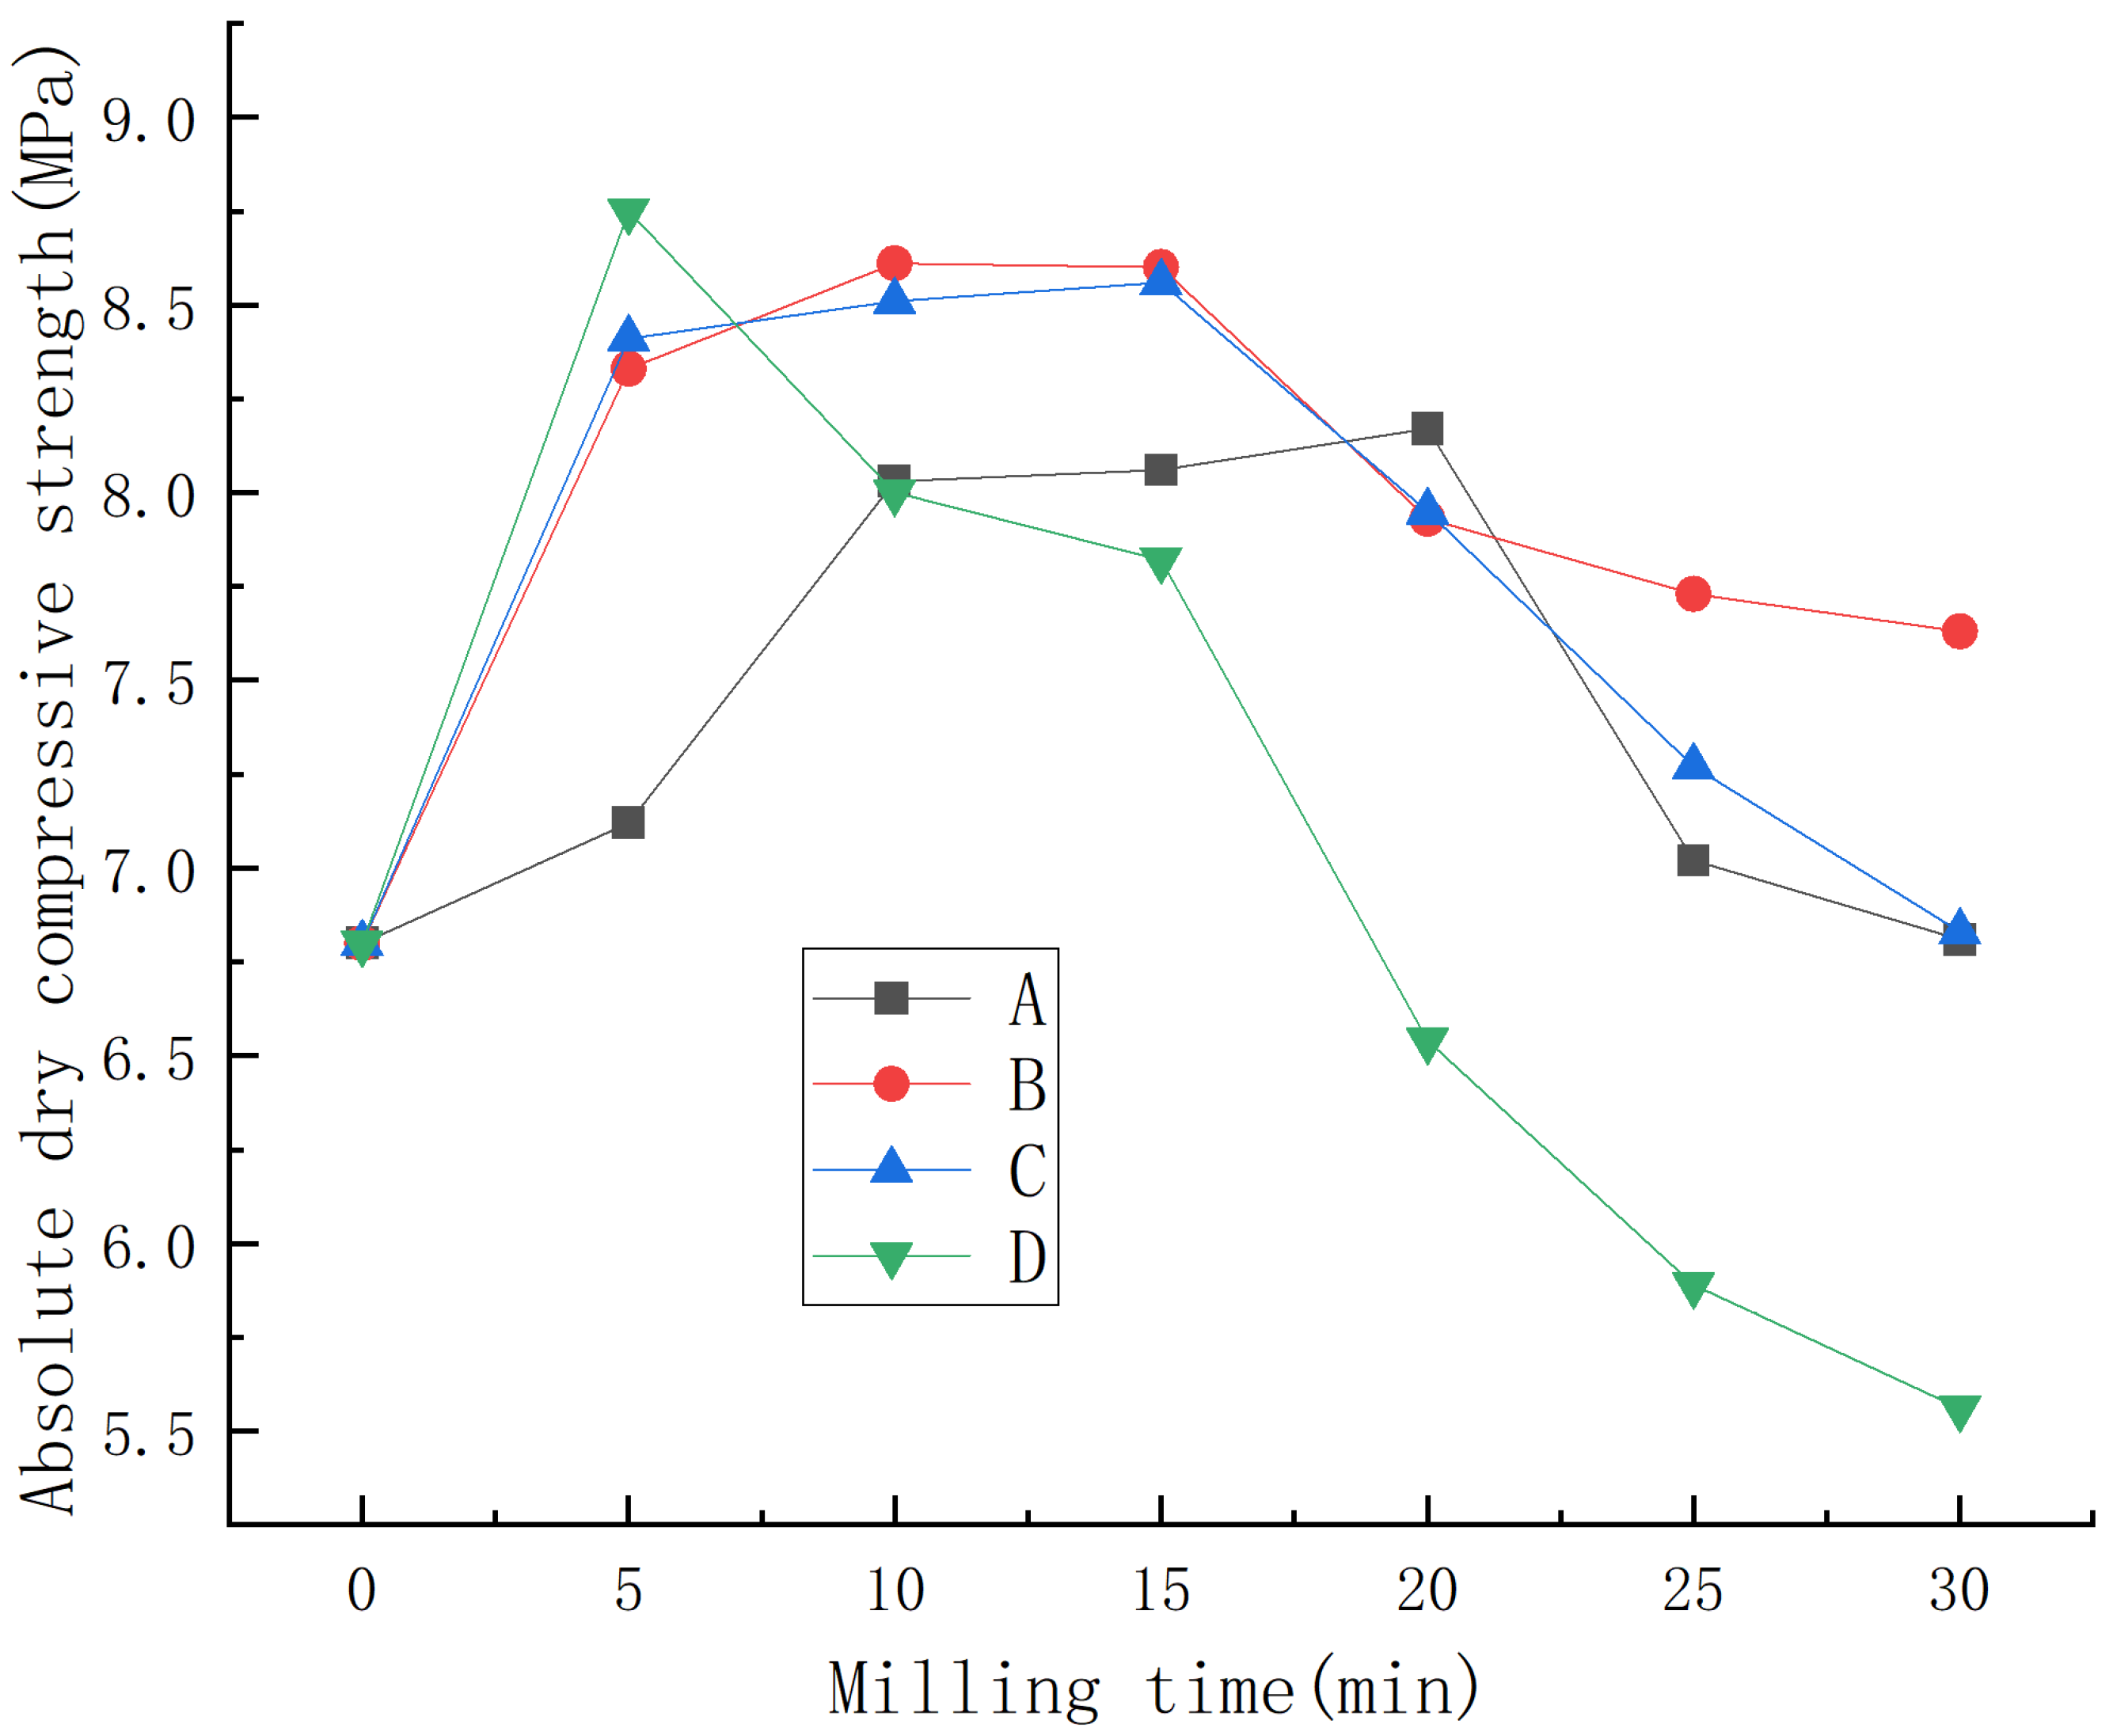
Under water consumption for standard consistency, the effects of the mass ratio of material to ball, milling speed, and milling time on the absolute dry compressive strength of phosphogypsum are shown in
Figure 2.
As can be seen from
Figure 2, under different mass ratios of material to ball and milling speed, the absolute dry compressive strength of phosphorus building gypsum first increased and then decreased with the increase in milling time. When the mass ratio of material to ball was the same, faster ball milling had a greater influence on the absolute dry compressive strength of phosphorus building gypsum. When the milling speed was the same, a smaller mass ratio of material to ball had a greater influence on the absolute dry compressive strength of phosphorus building gypsum.
In general, under the conditions of a mass ratio of material to ball of 1:1, ball milling speed of 90 rpm, and ball milling time of 5 min, the absolute dry compressive strength of phosphorus building gypsum reached the maximum value of 8.75 MPa, increasing by 29% compared with the control group.
3.3. Mechanism Analysis
By controlling the milling time, the rhomboid sheet crystal of phosphorus building gypsum could be changed to elliptic sheet crystal, and the relative thickness of phosphorus building gypsum crystal could be reduced. When the slurry was formed by adding water to phosphorus building gypsum, the phosphorus building gypsum crystal particles that were close to an oval shape with a relatively low thickness after ball milling had better fluidity. At the same time, the fine end particles of phosphorus building gypsum after ball milling increased, which changed the particle grading of phosphorus building gypsum, and the particles were effectively filled step by step, increasing the bulk density of phosphorus building gypsum after ball milling. Therefore, the overall structure of phosphorus building gypsum became denser, the porosity decreased, and the performance was improved.
However, when the ball milling time was too long, there were too many fine end particles of phosphorus building gypsum, and the specific surface area was too large, which increased the water consumption of standard consistency, thus adversely affecting the performance of phosphorus building gypsum.


