
Fracture Process Analysis and Acoustic Emission Response of Cemented Tailings Backfill with Different Sizes under Uniaxial Compression
Abstract
:1. Introduction
2. Materials and Methods
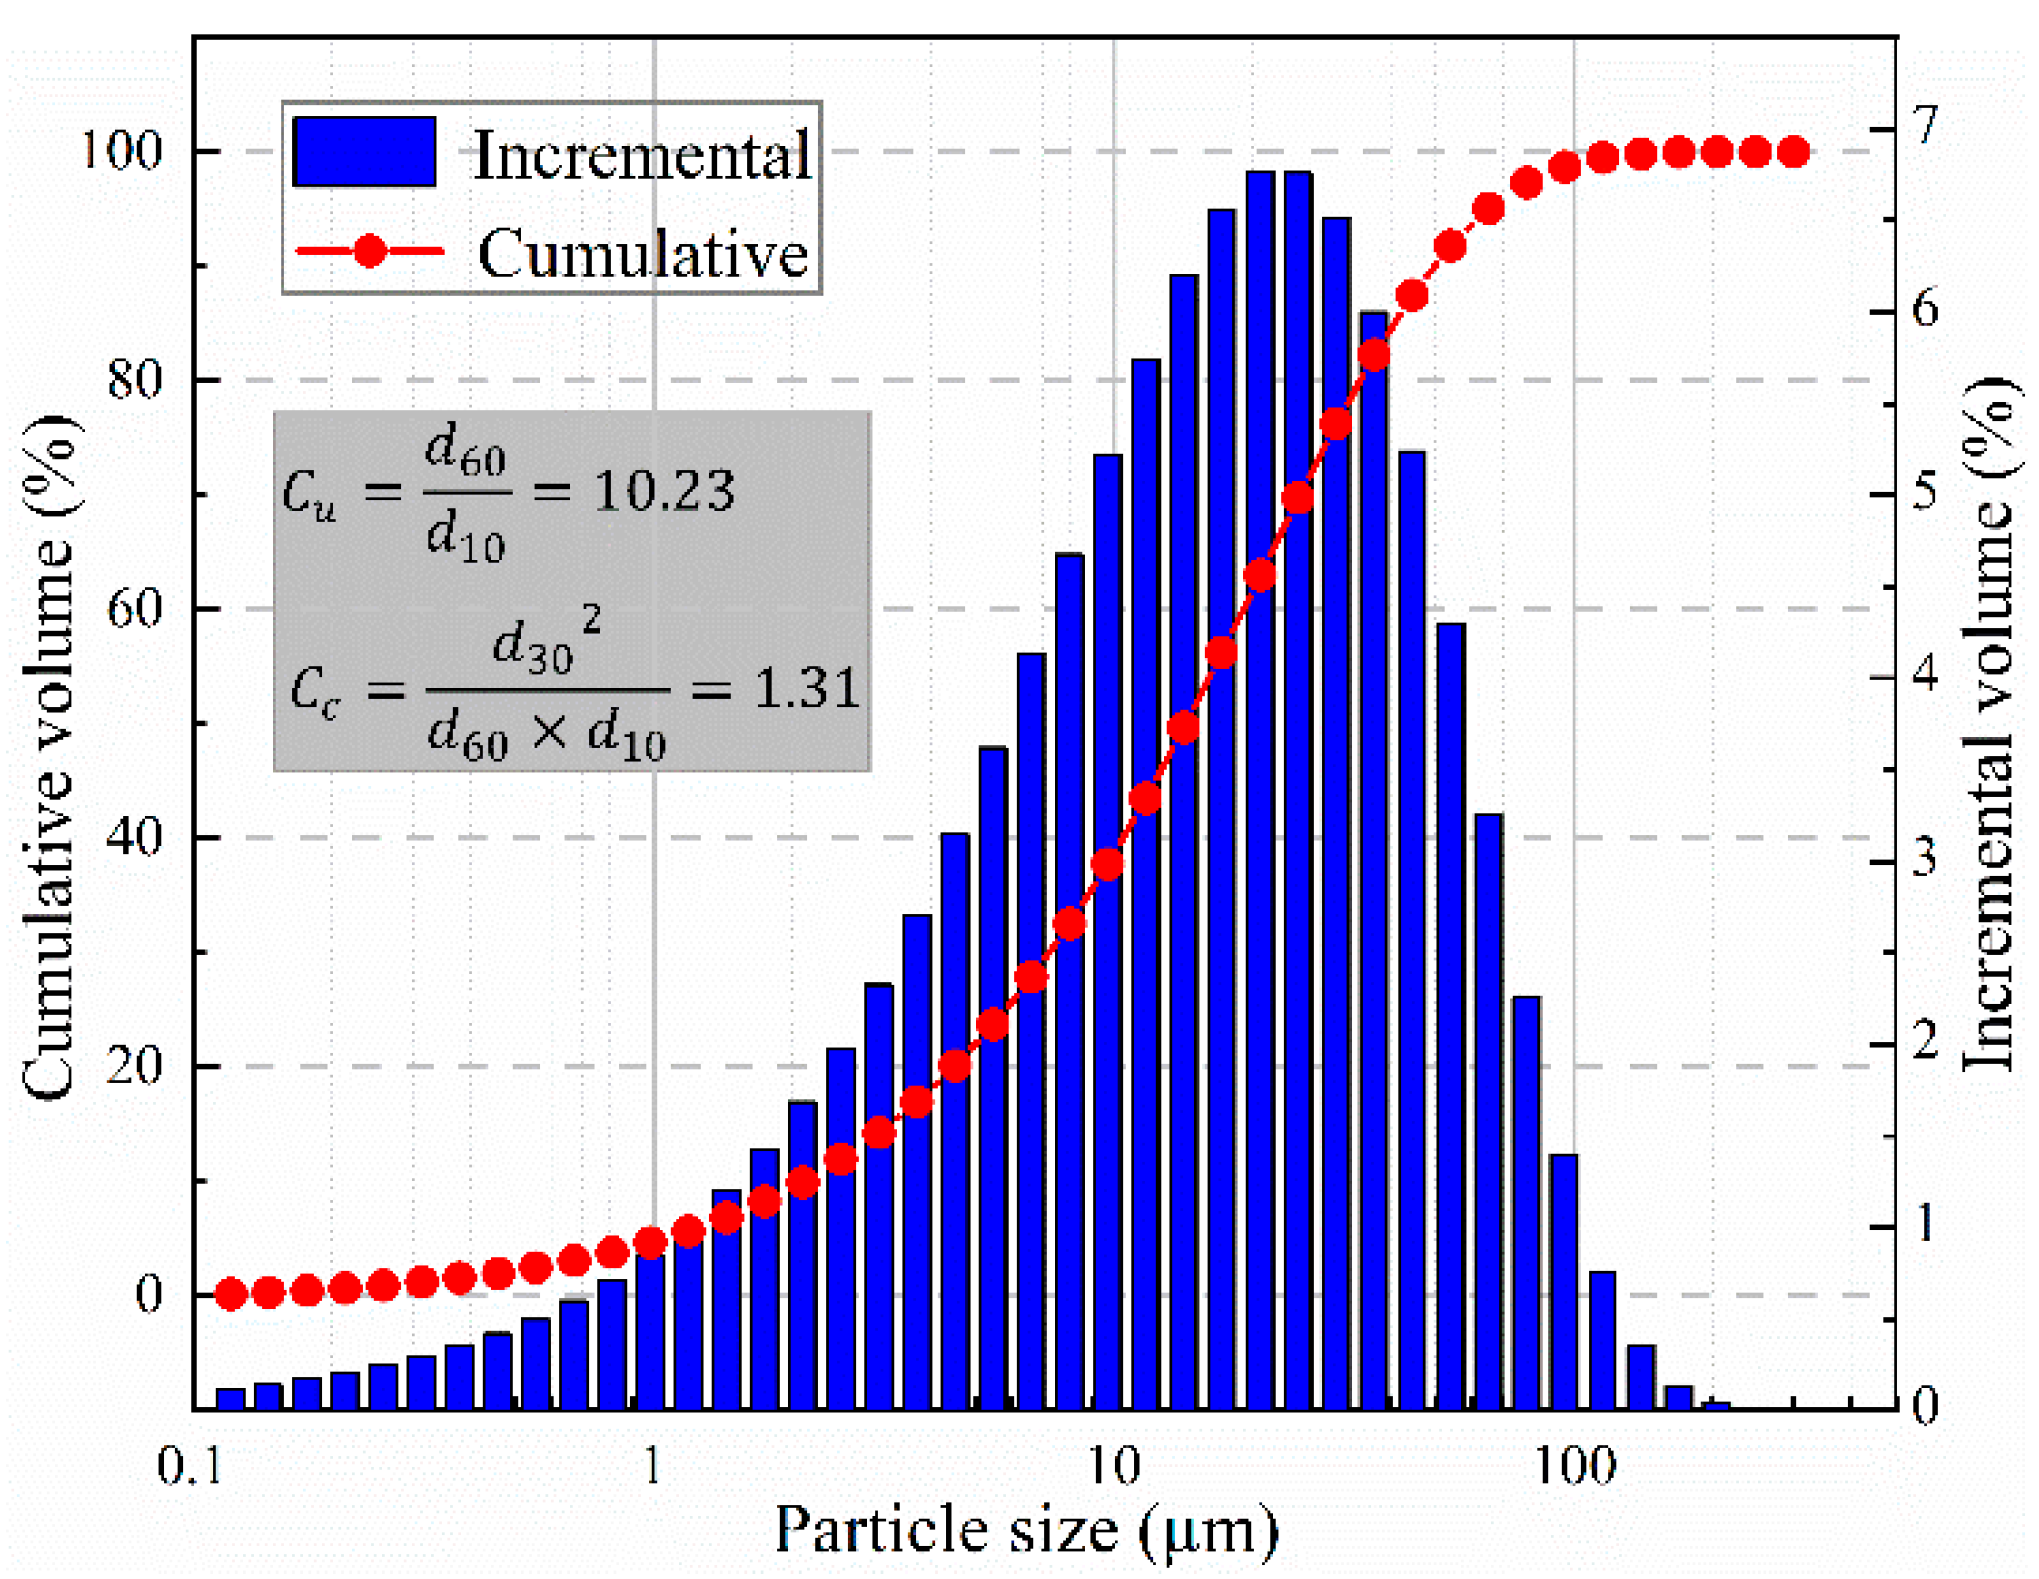
2.1. Materials
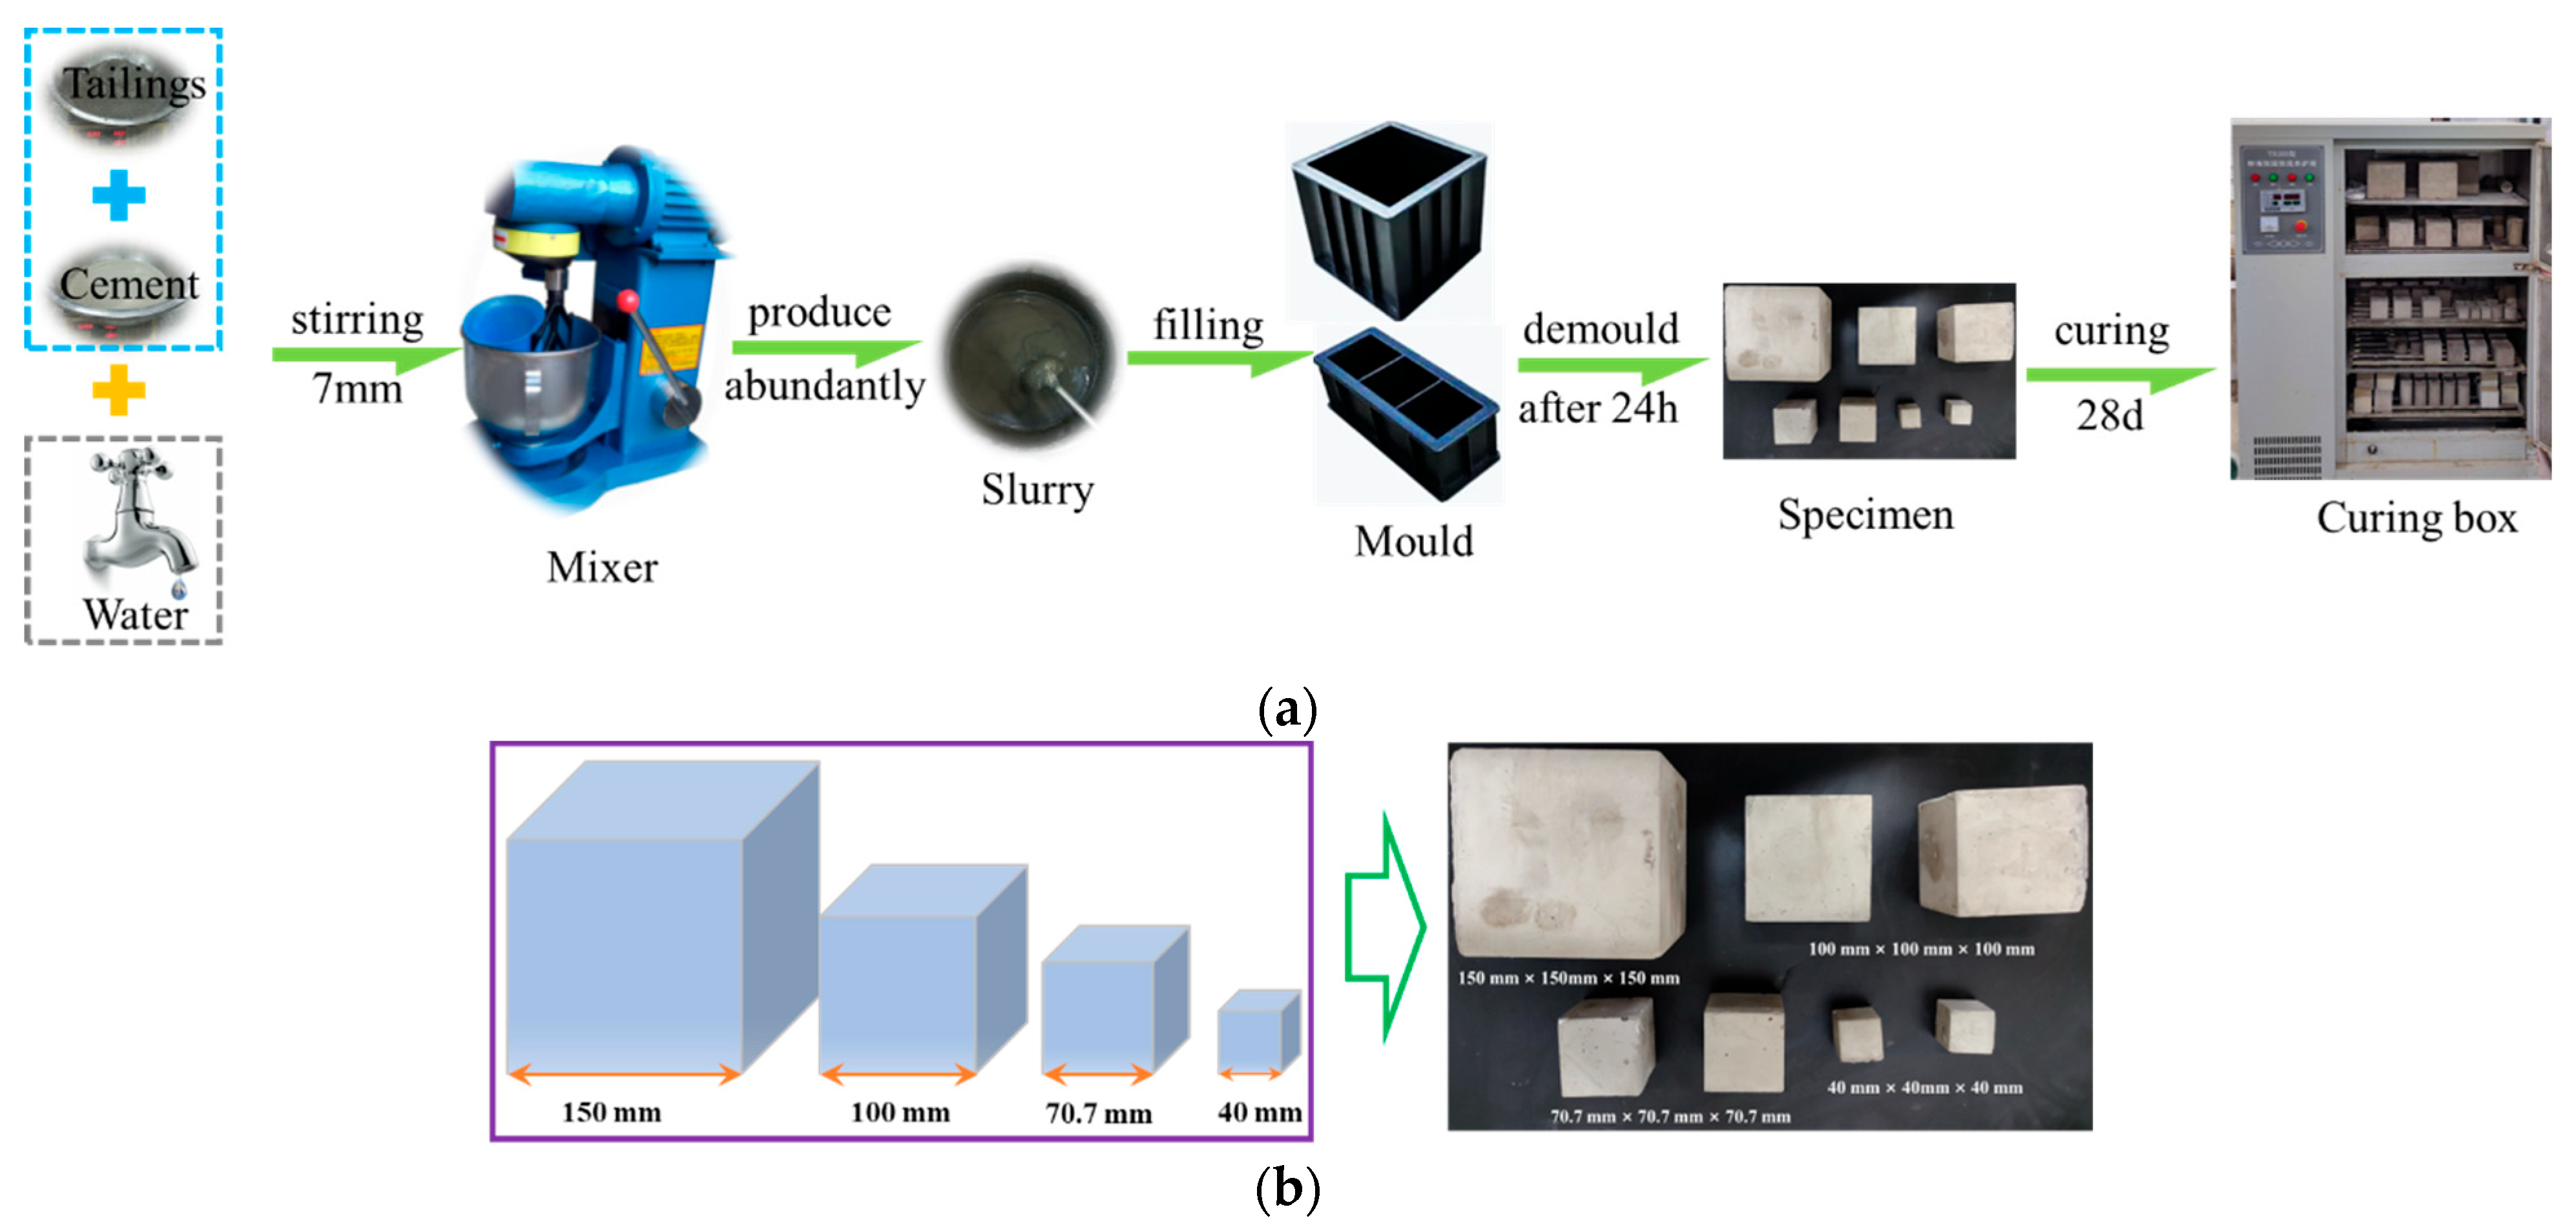
2.2. Backfill Specimens Preparation
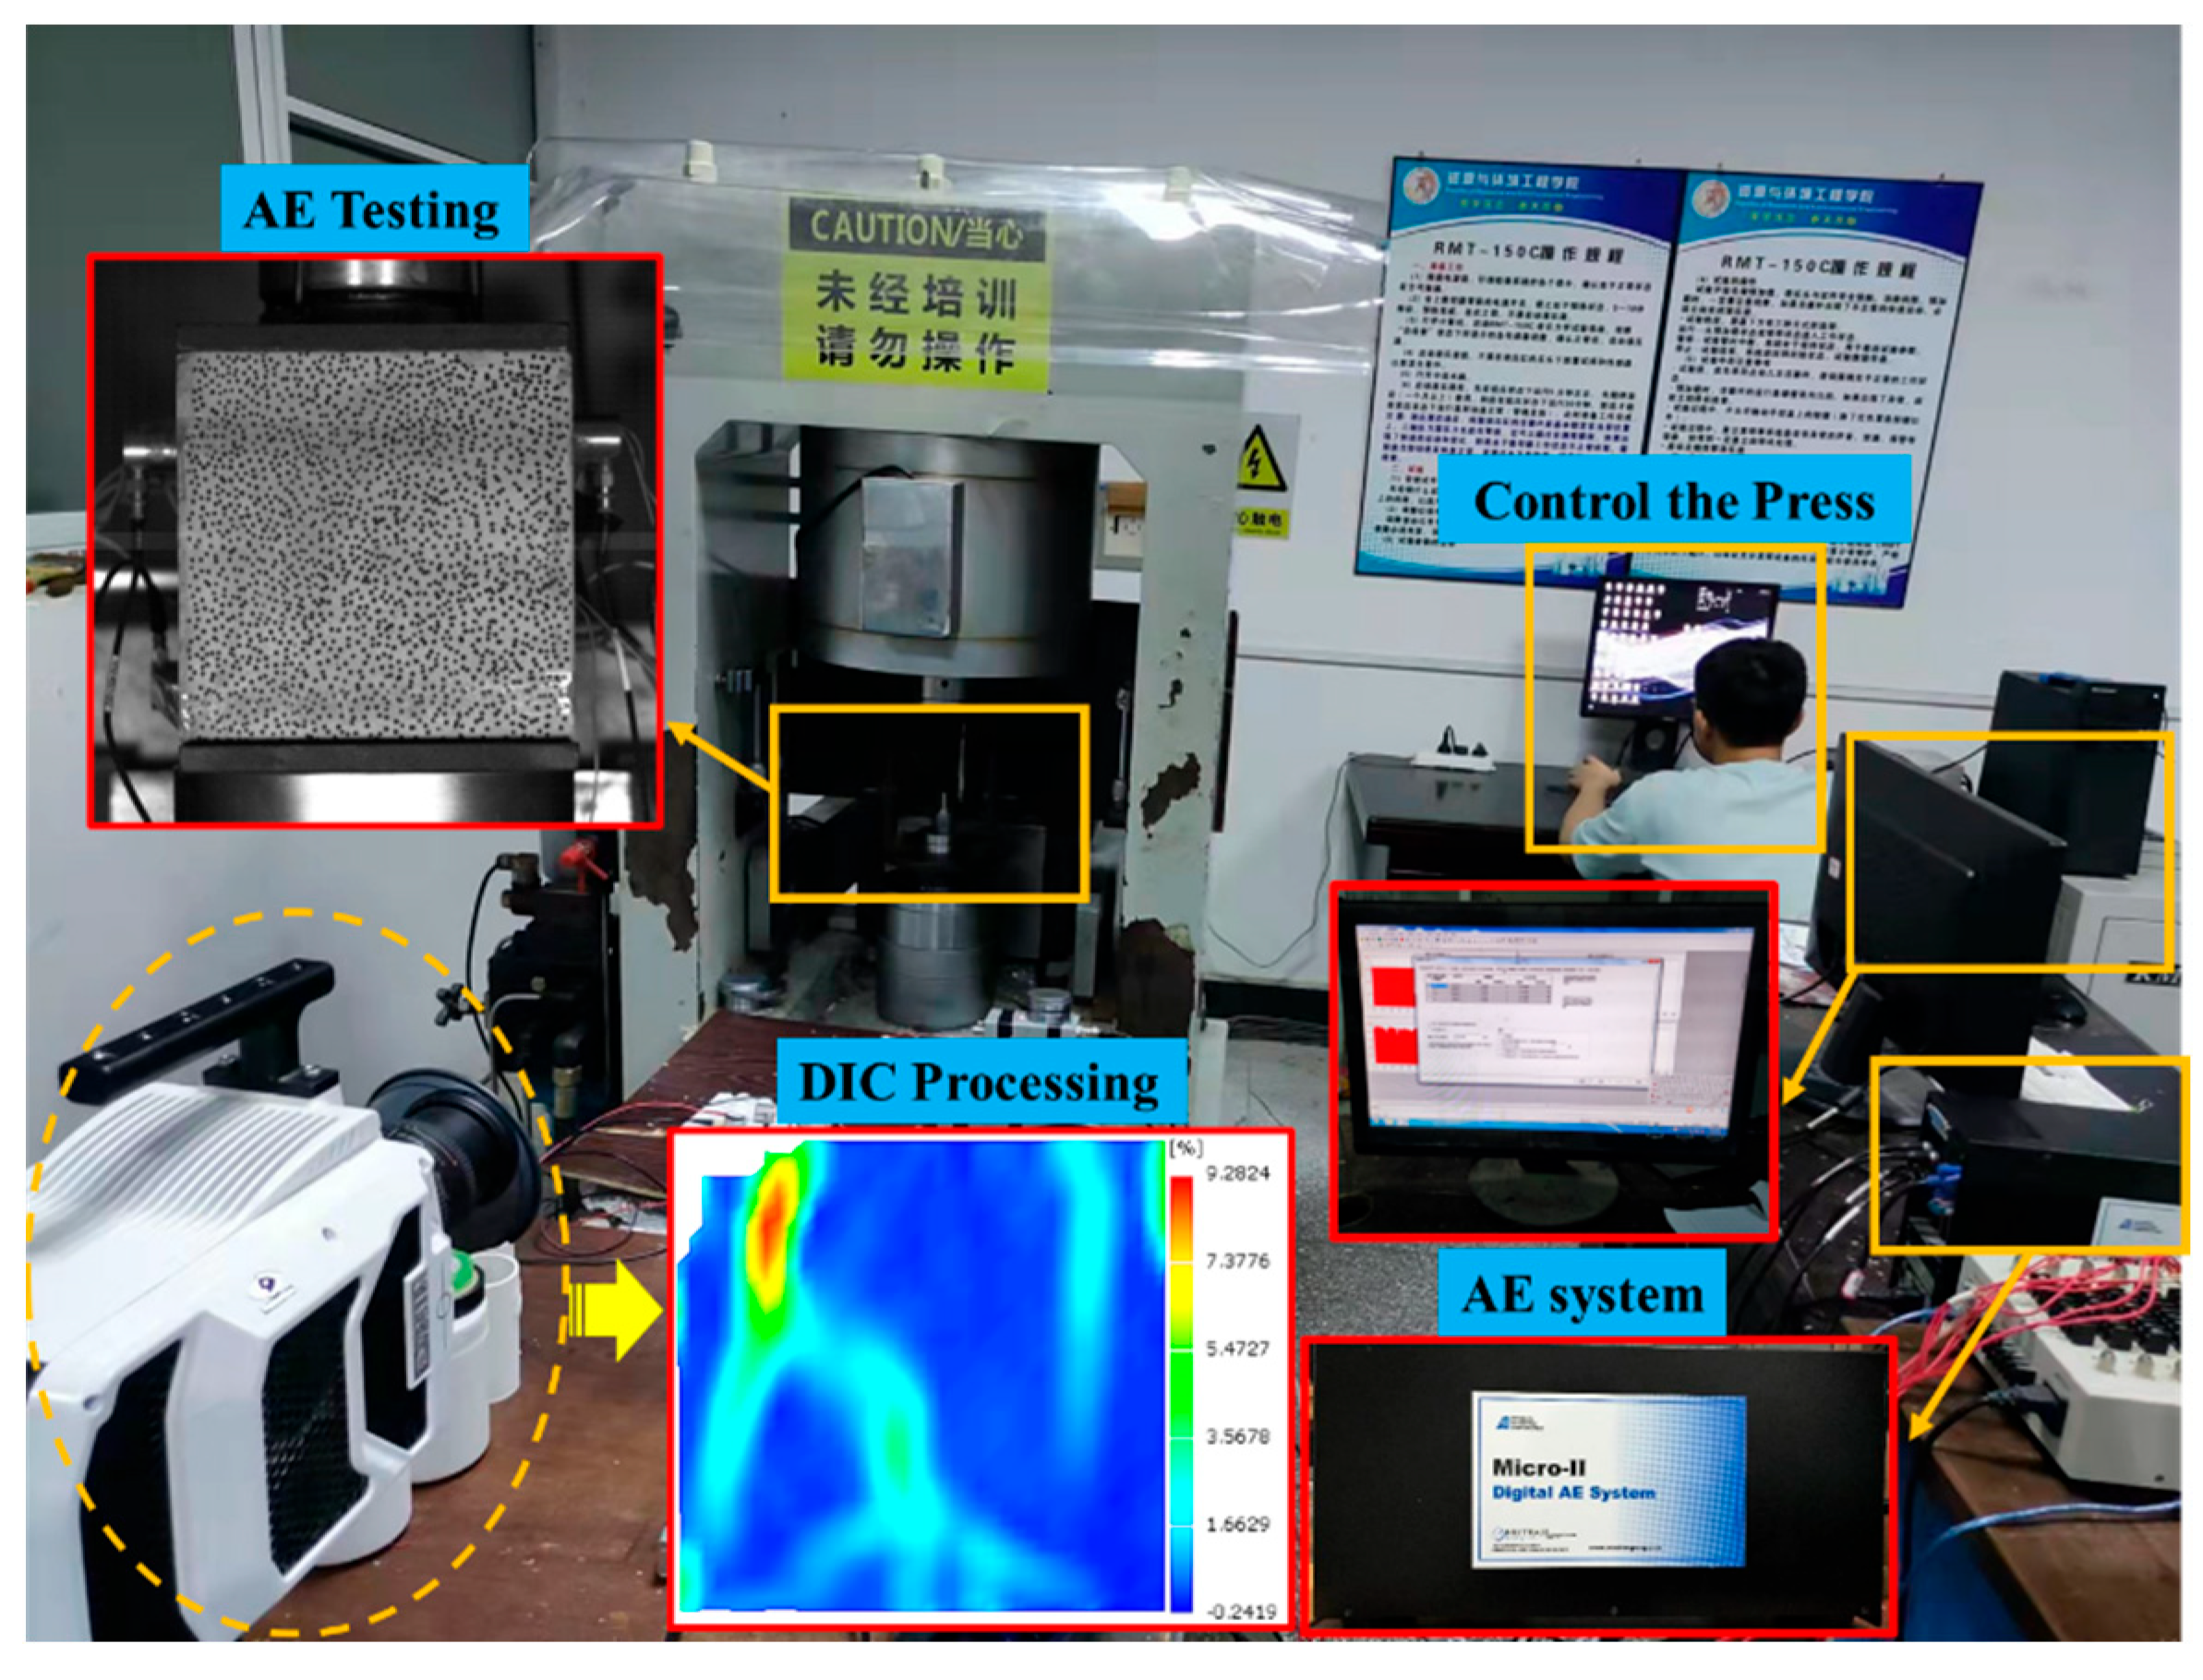
2.3. Experimental Methods
3. Results and Discussion
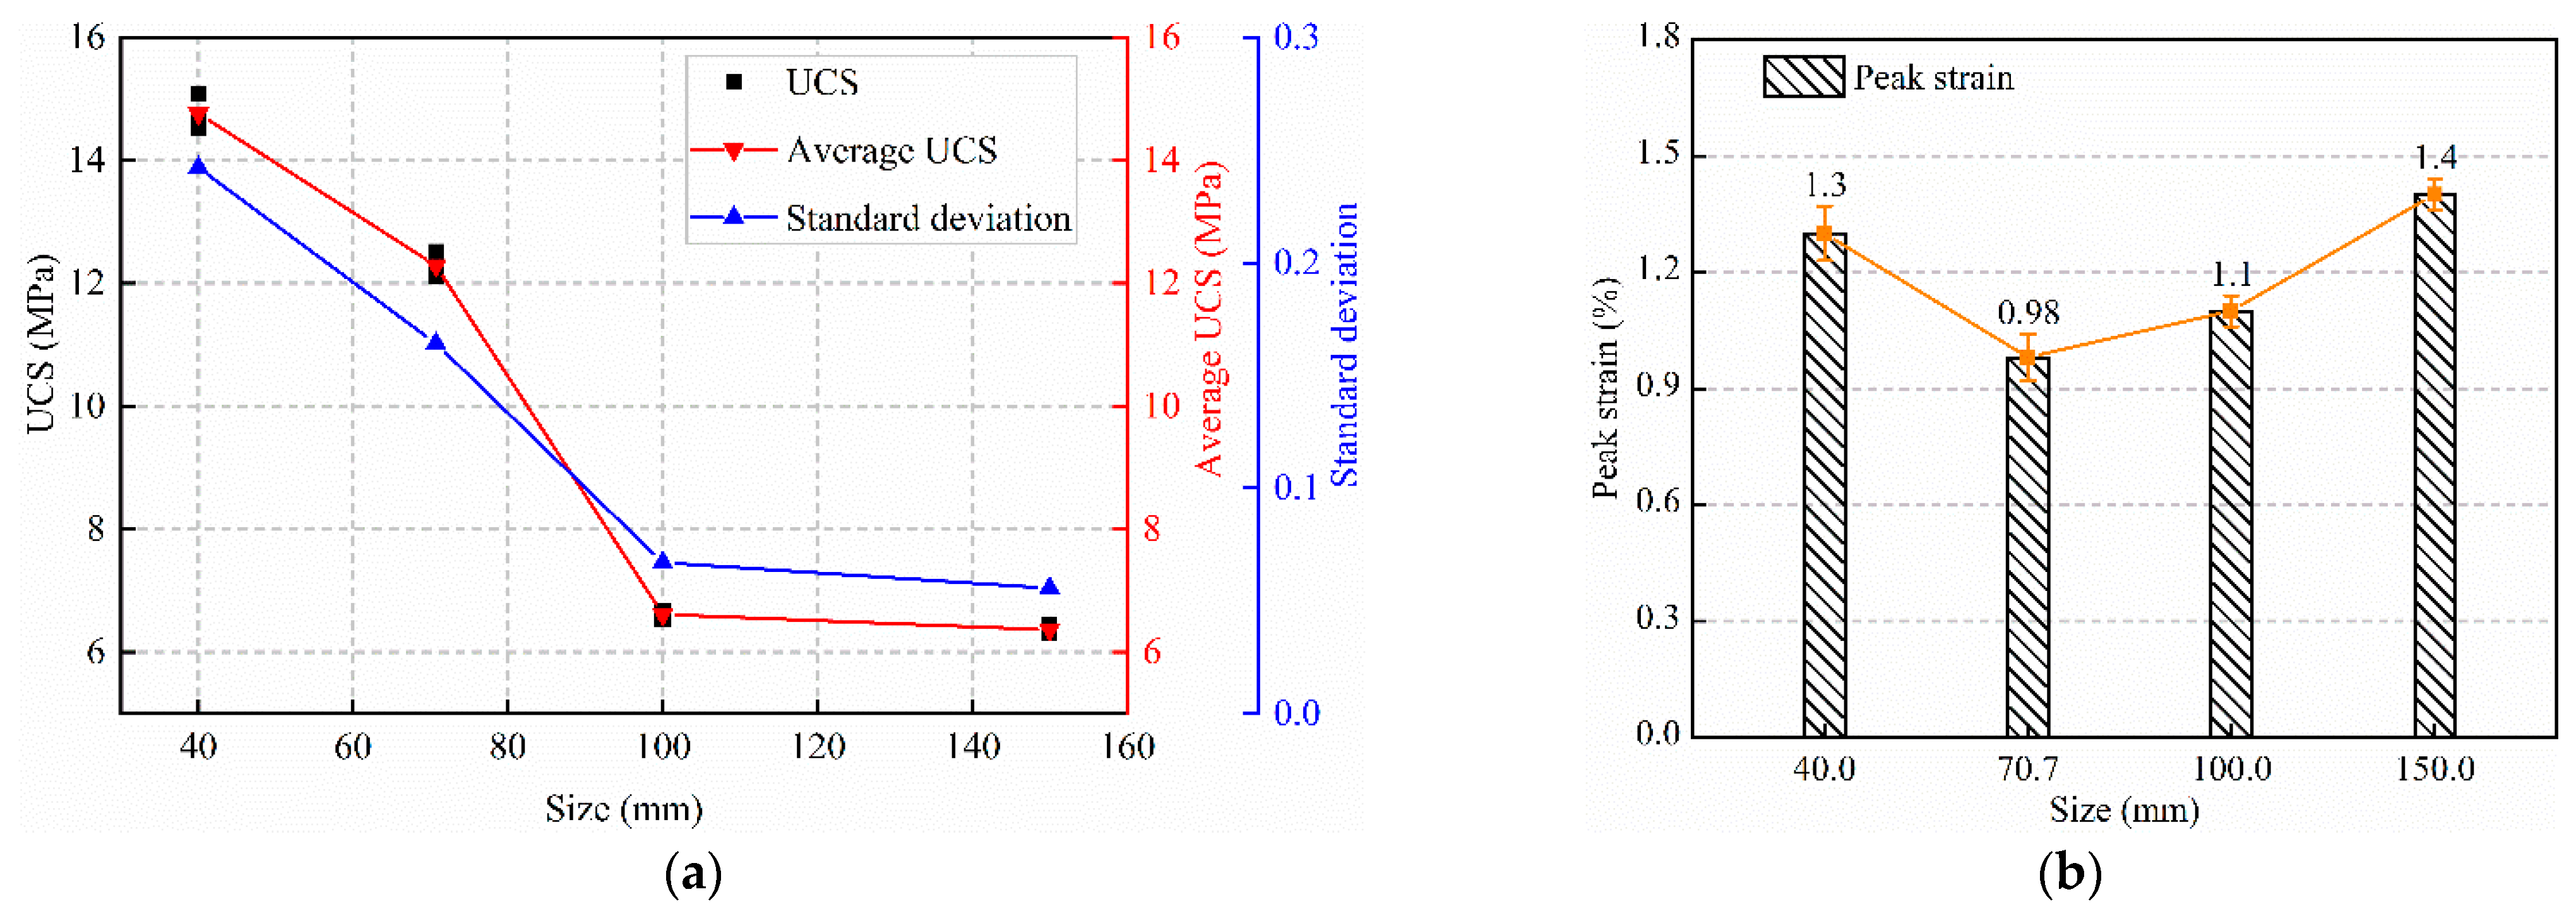
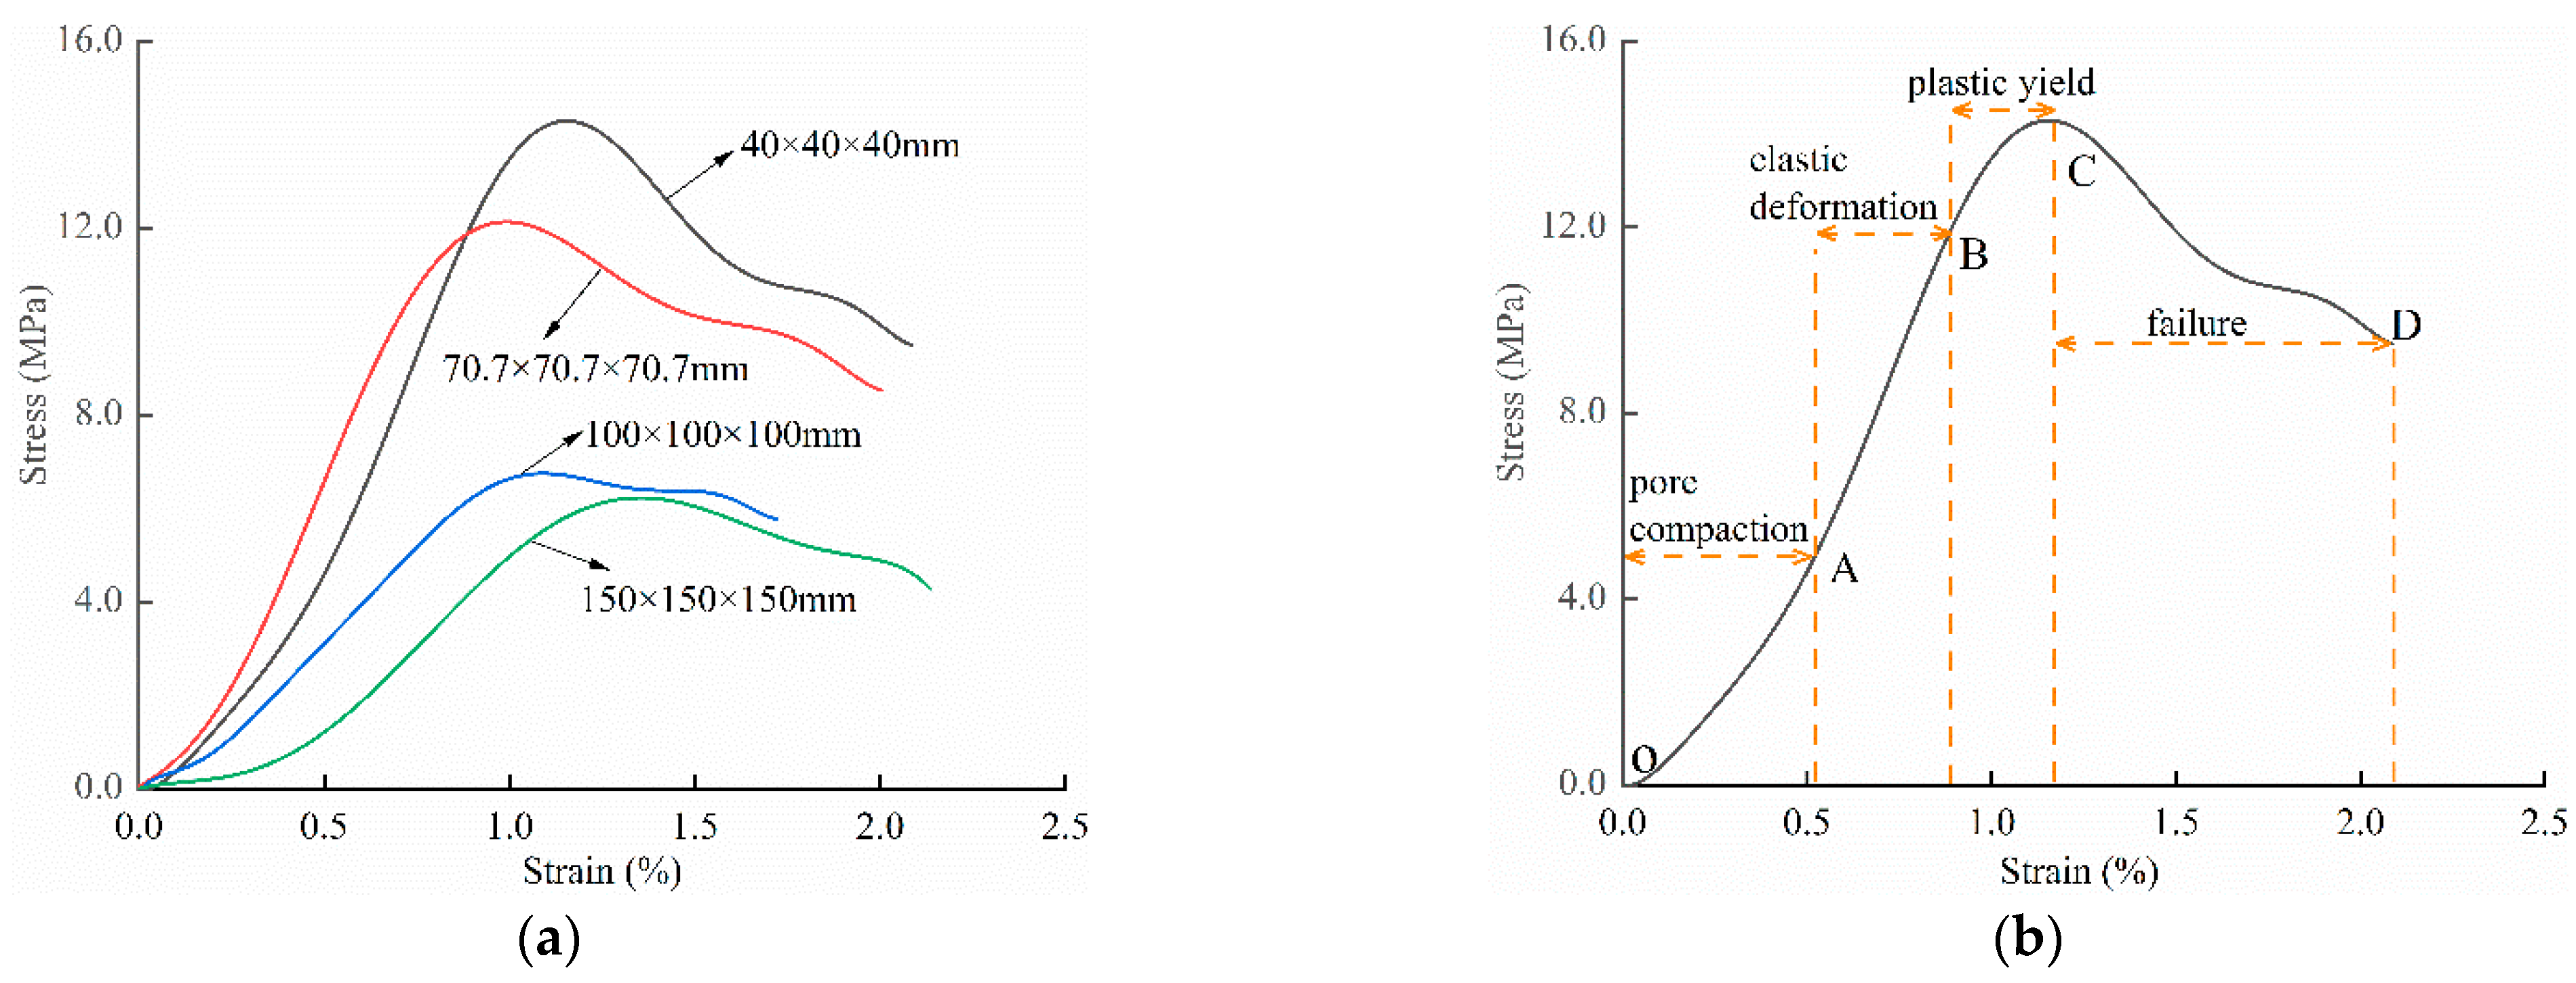
3.1. Effect of Size Change on UCS and Peak Strain
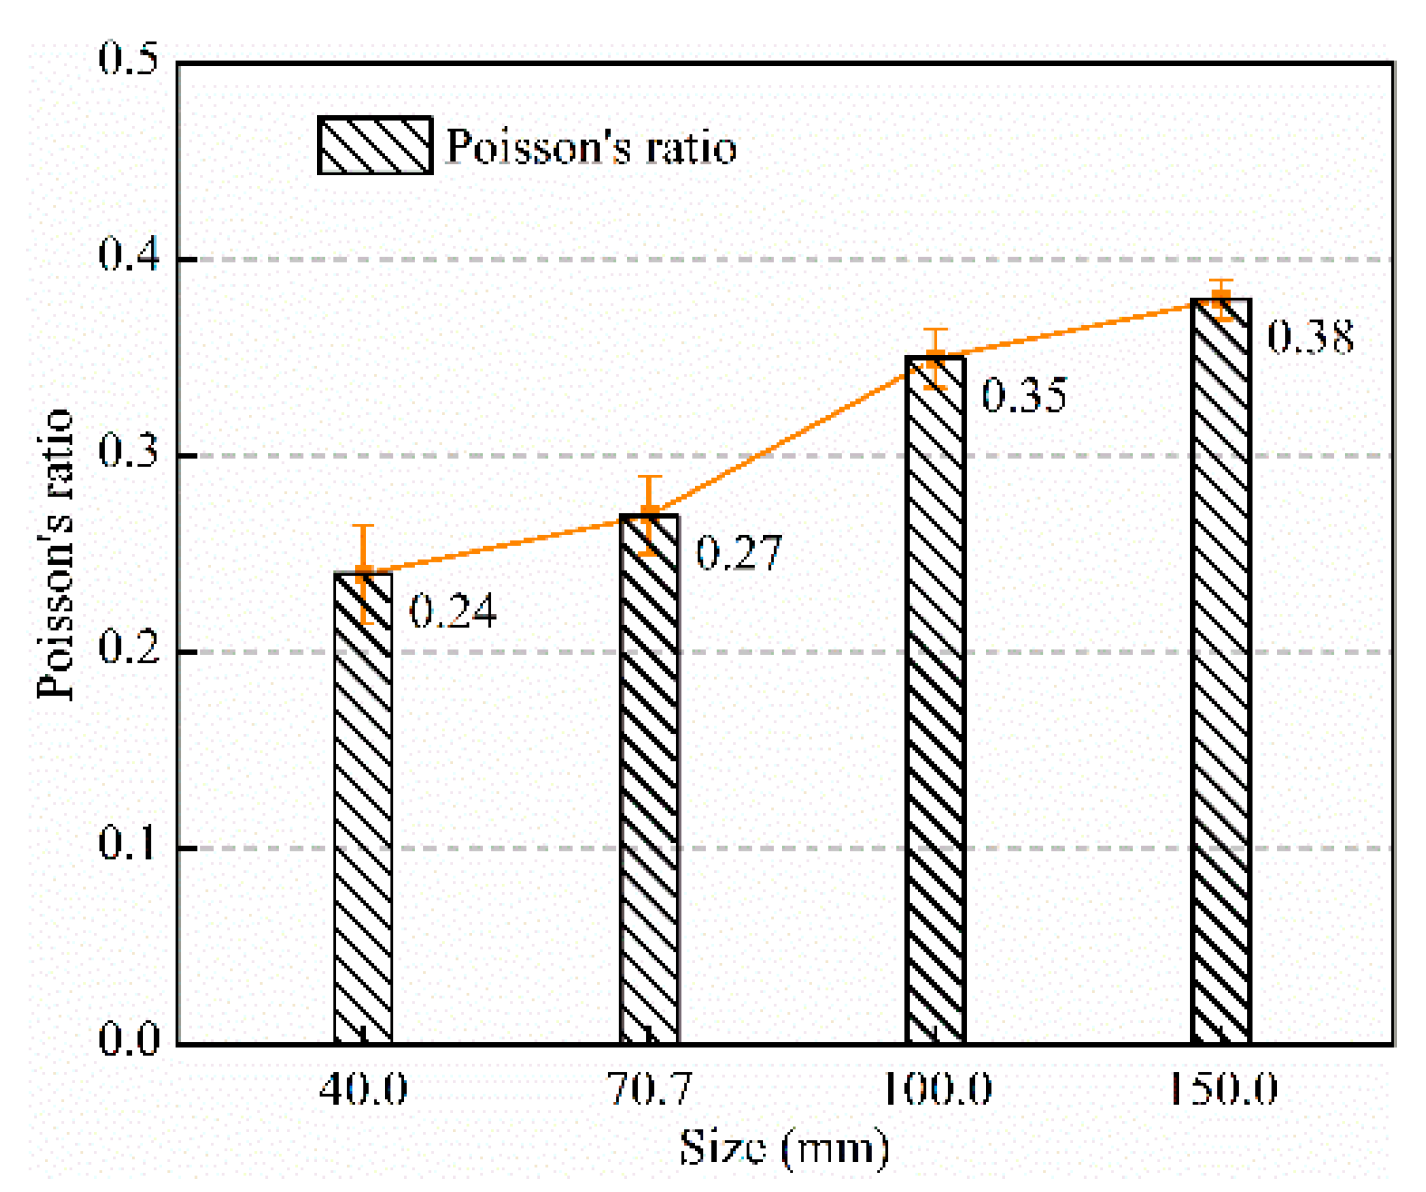
3.2. Effect of Size Change on Elastic Modulus and Wave Velocity
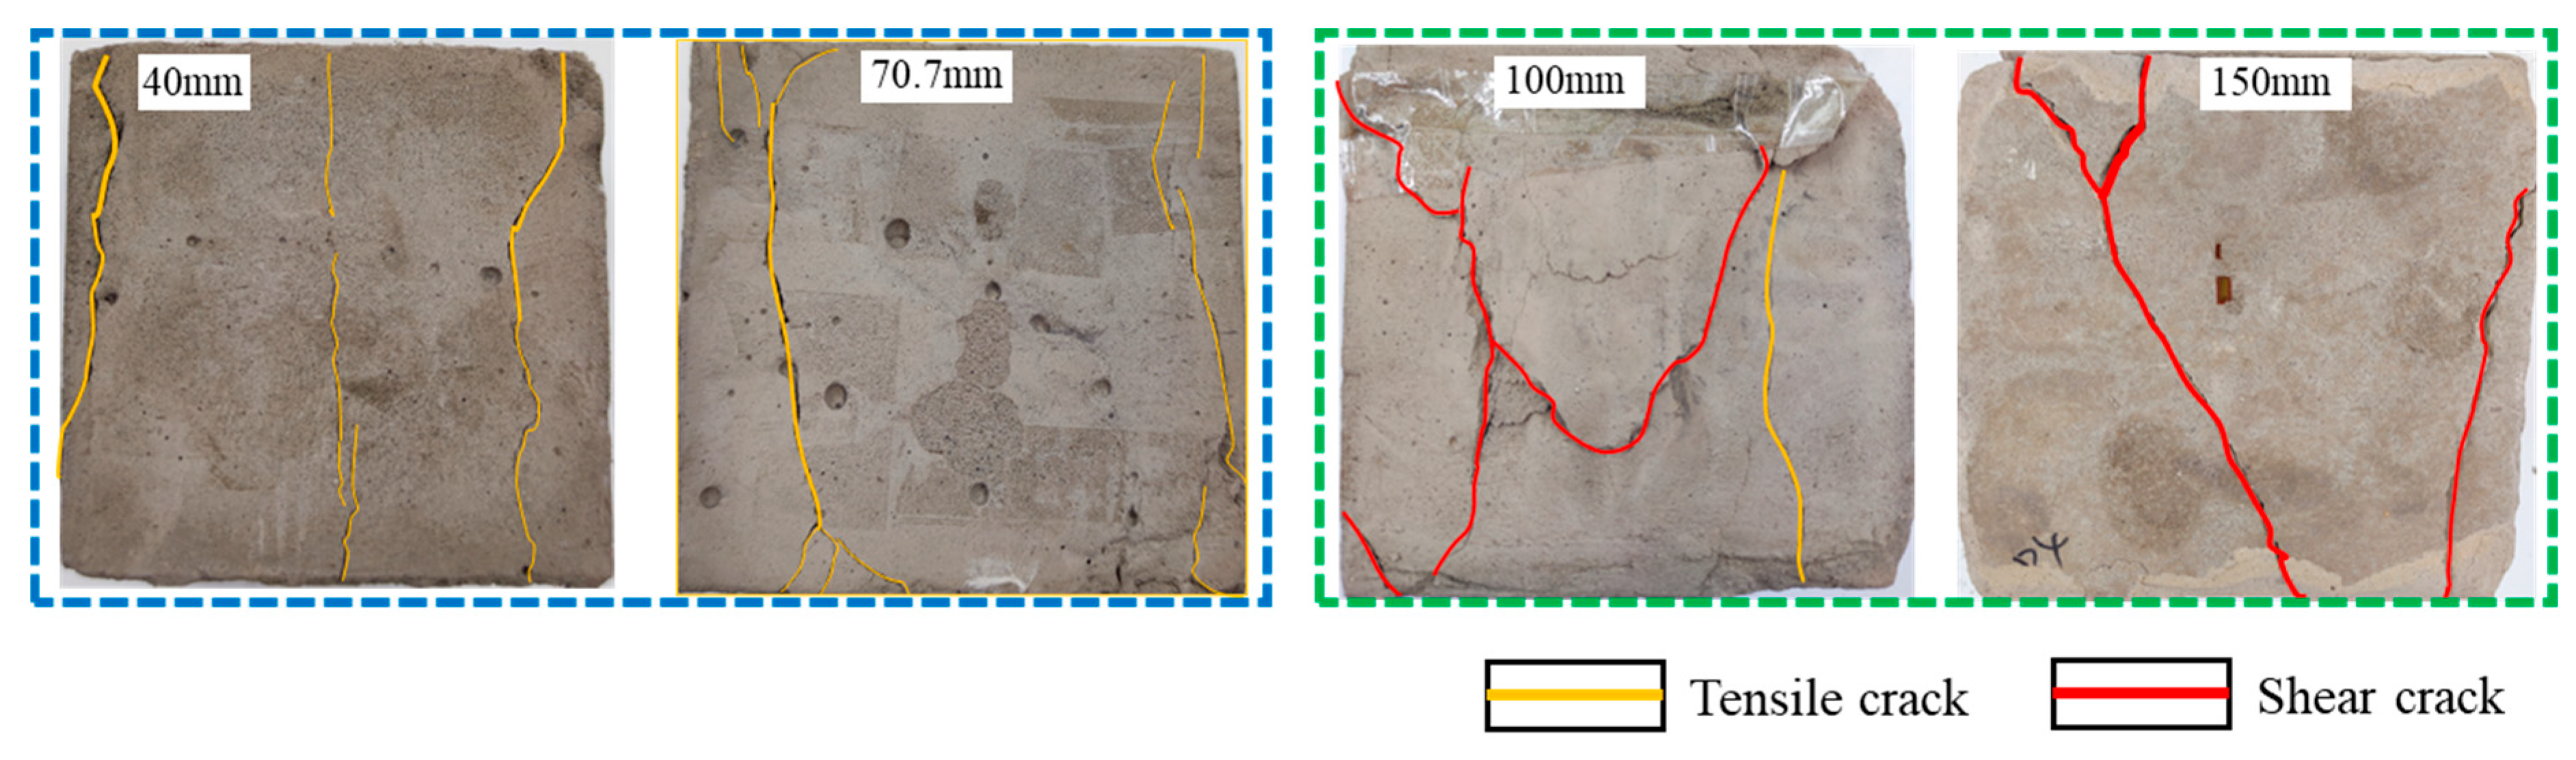
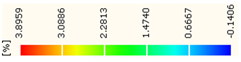
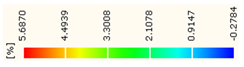
3.3. Analysis of Crack Evolution and Stress–Strain Correspondence of Backfills with Different Sizes
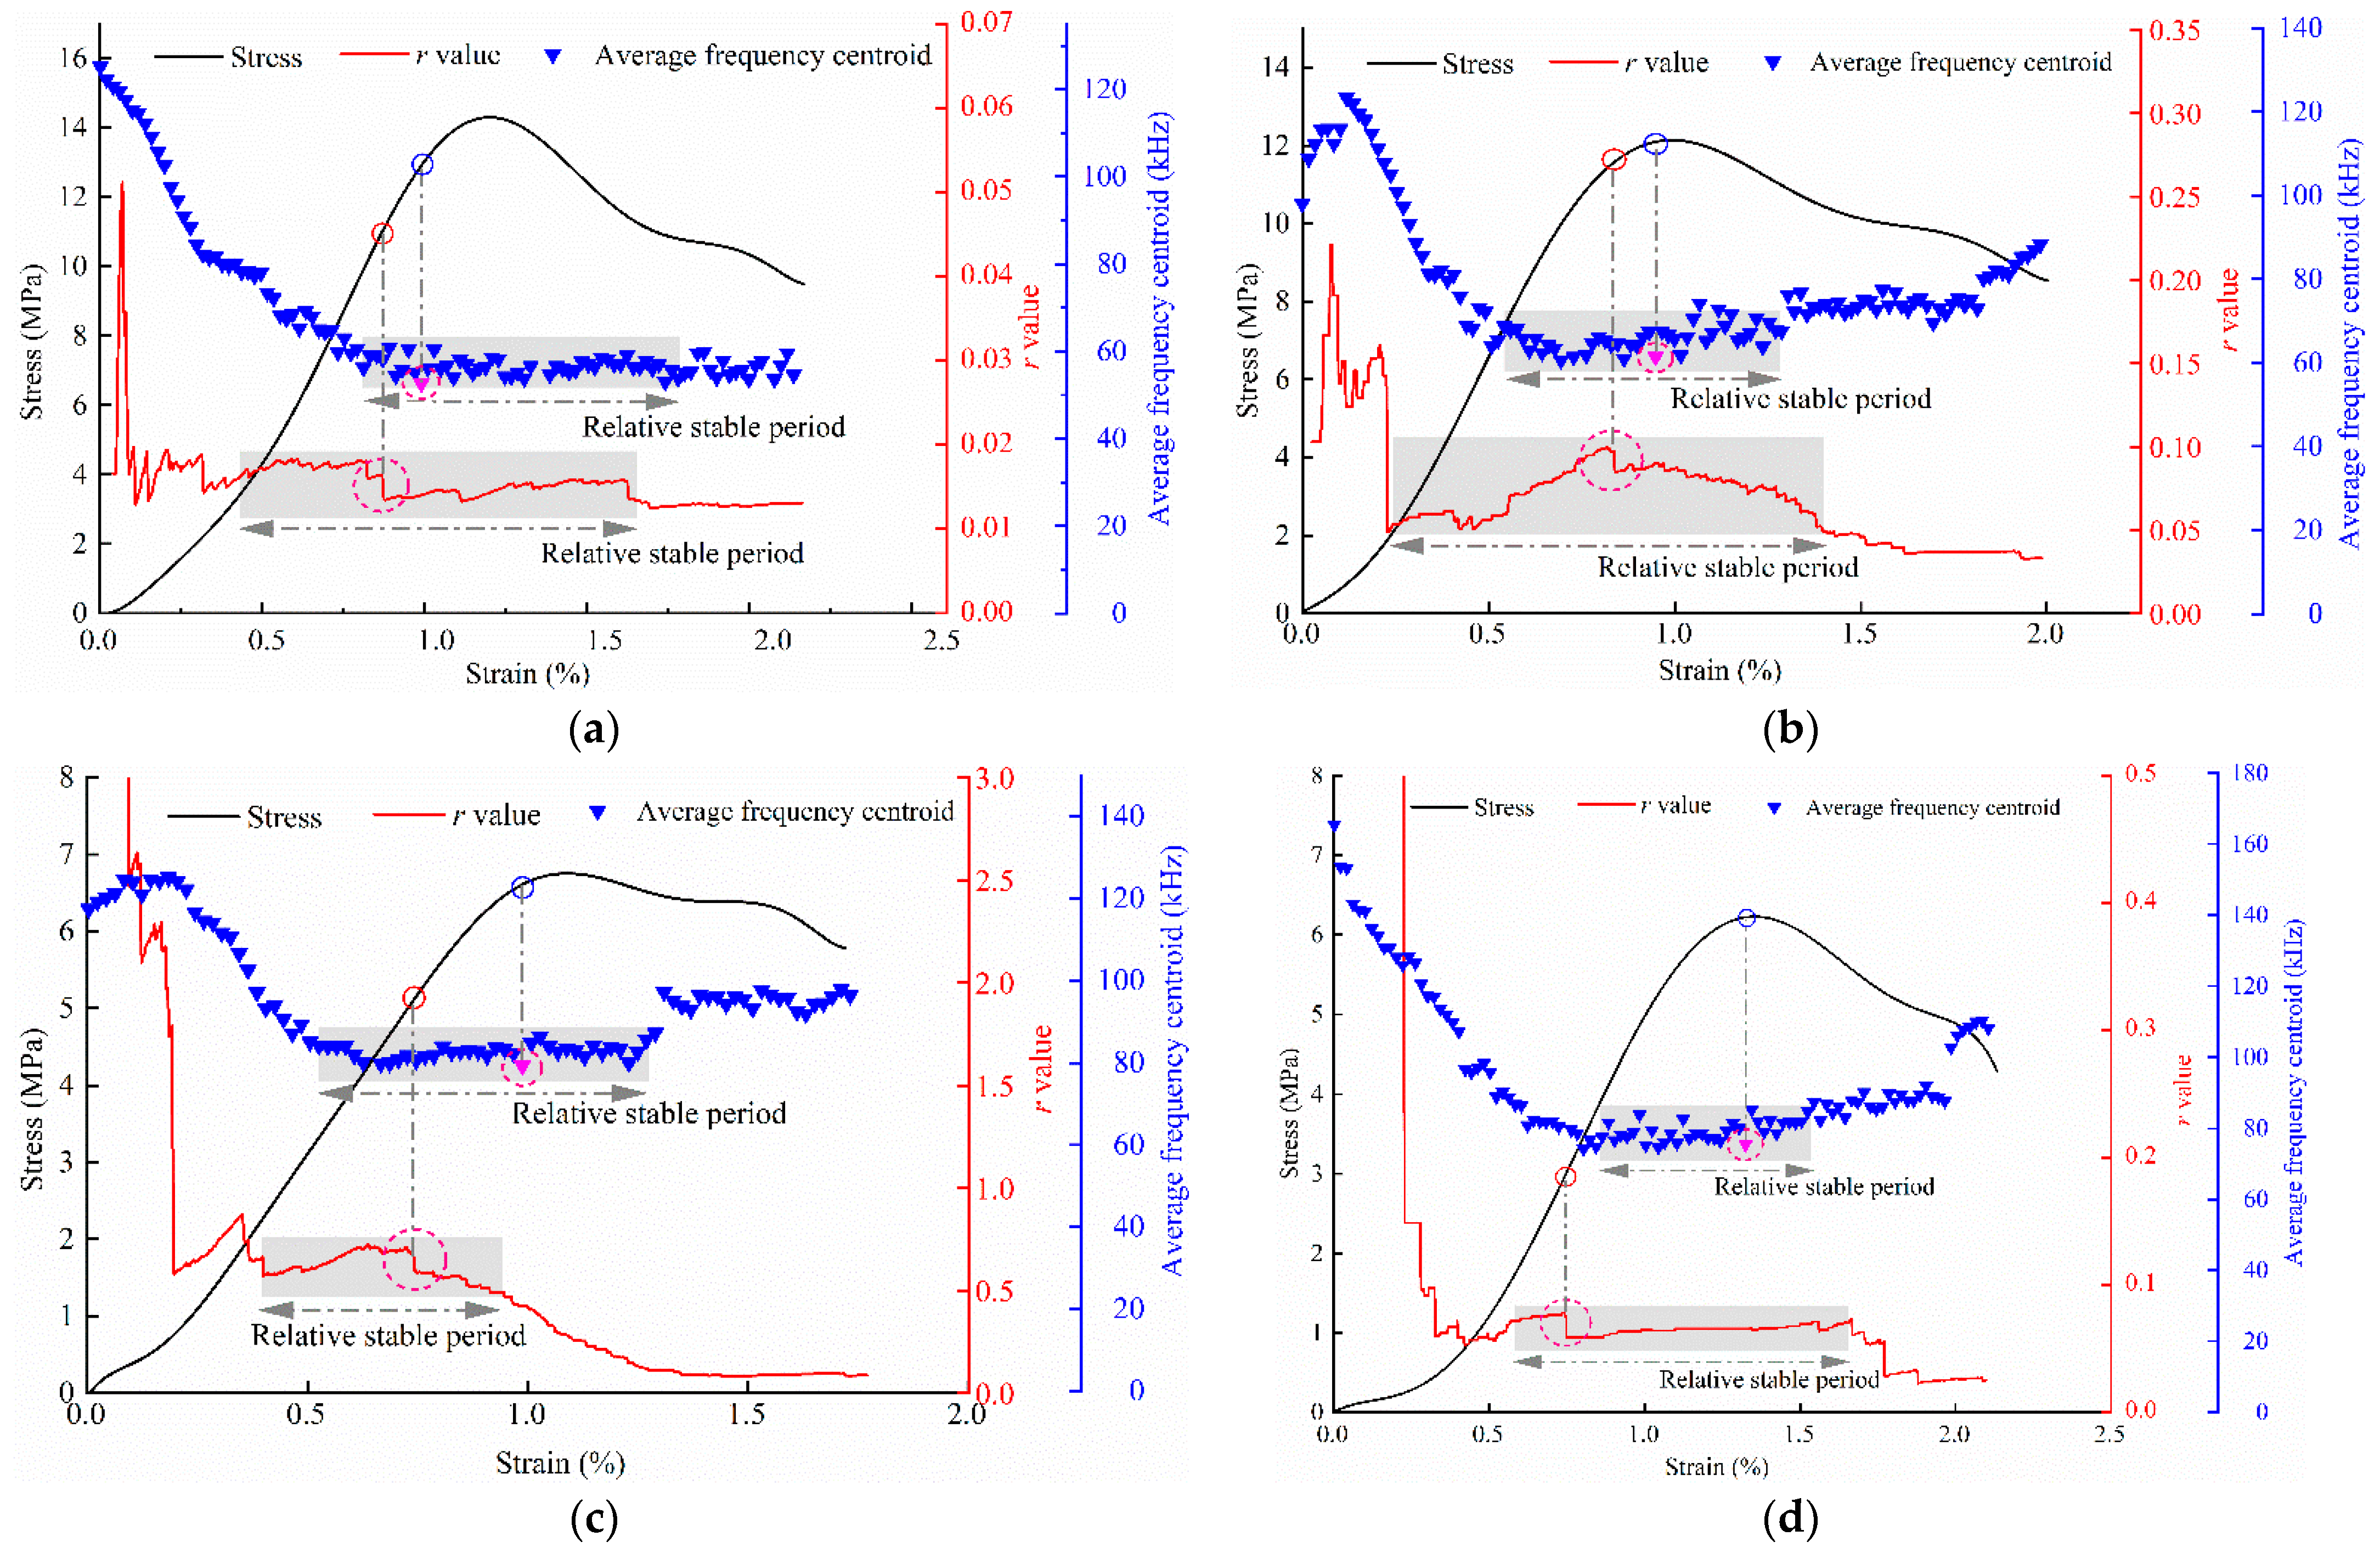
3.4. AE Response of Crack Propagation in Backfills with Different Sizes
3.4.1. Crack Fracture Process and Evolution of AE Time Series
3.4.2. Joint Analysis of AE r Value and Frequency-Domain Characteristics
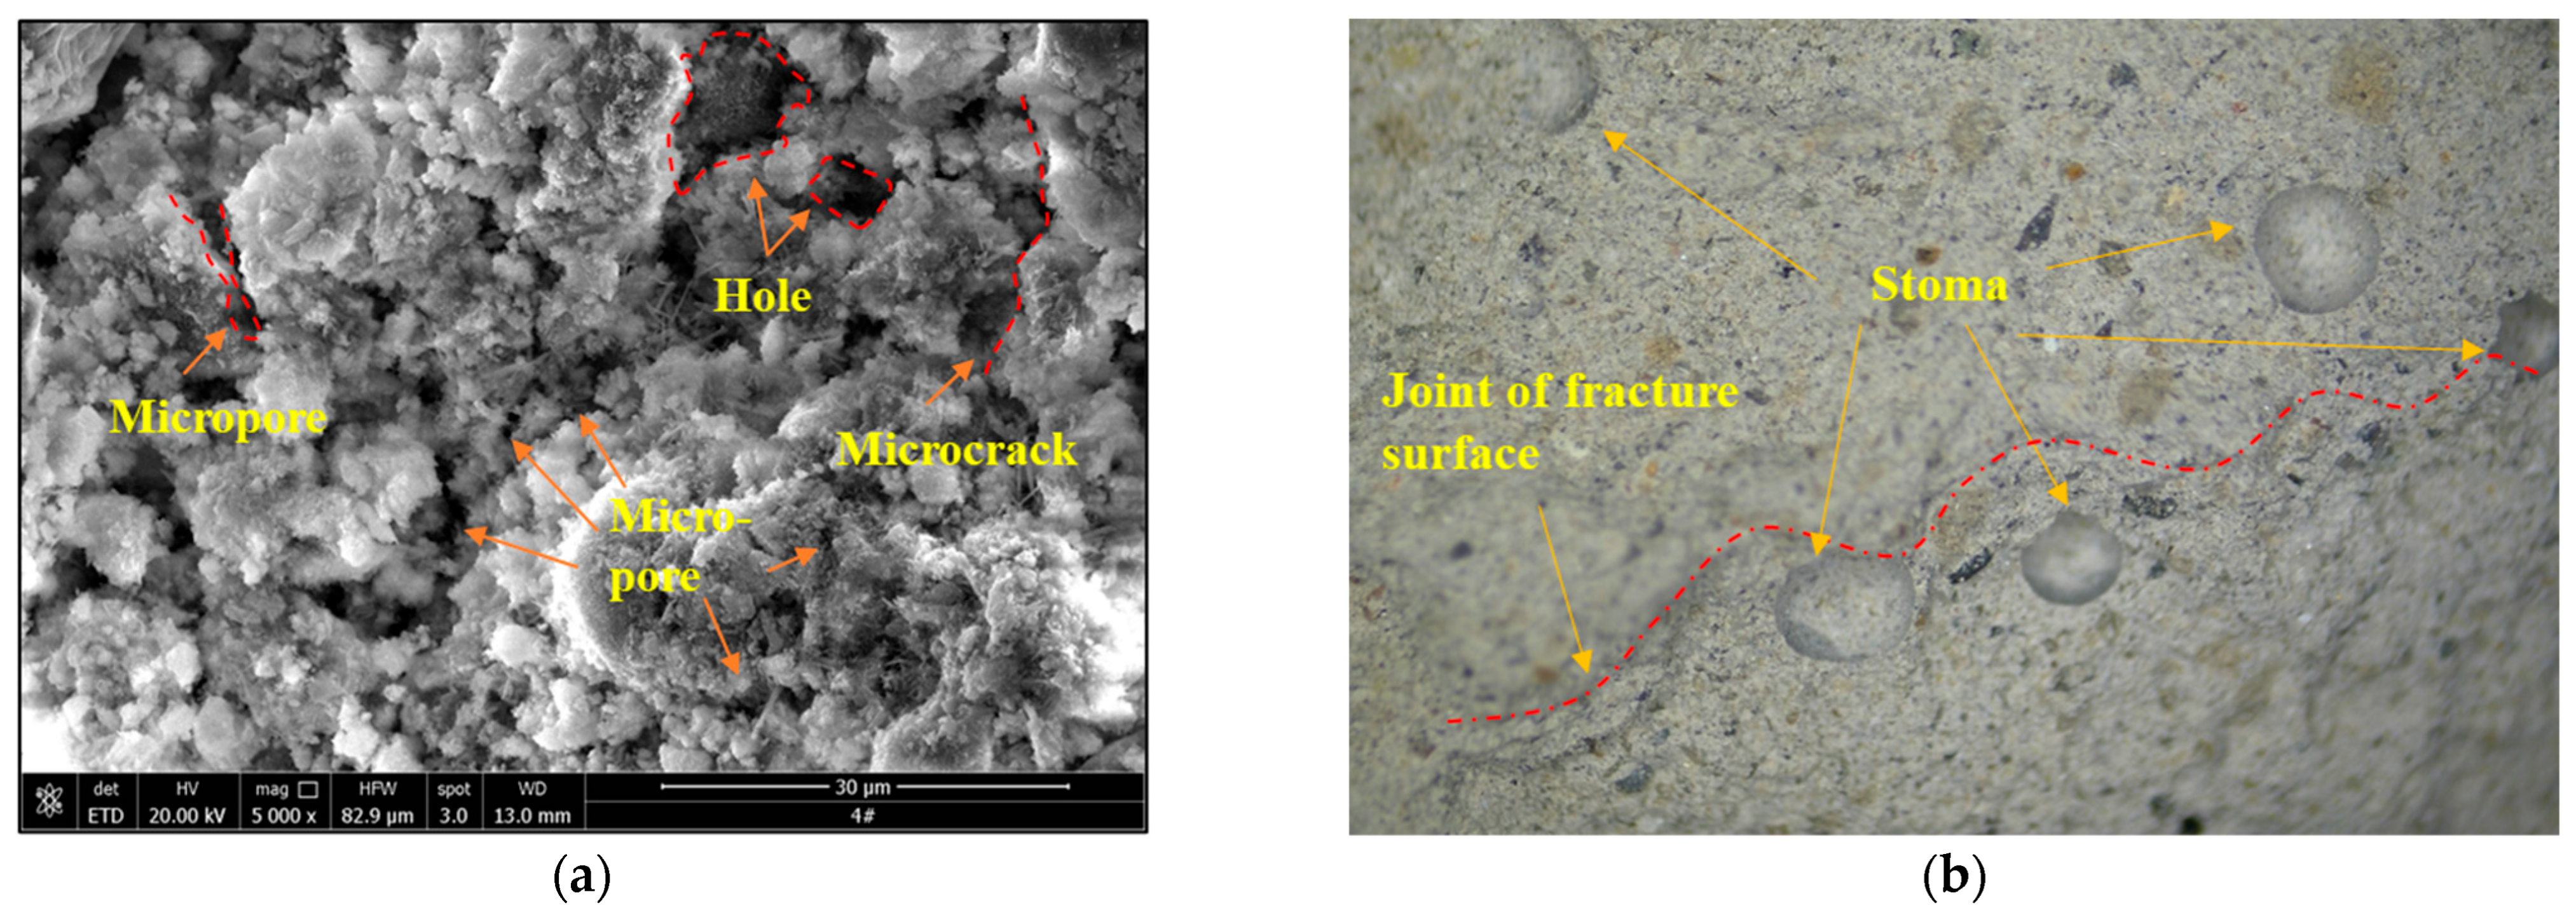
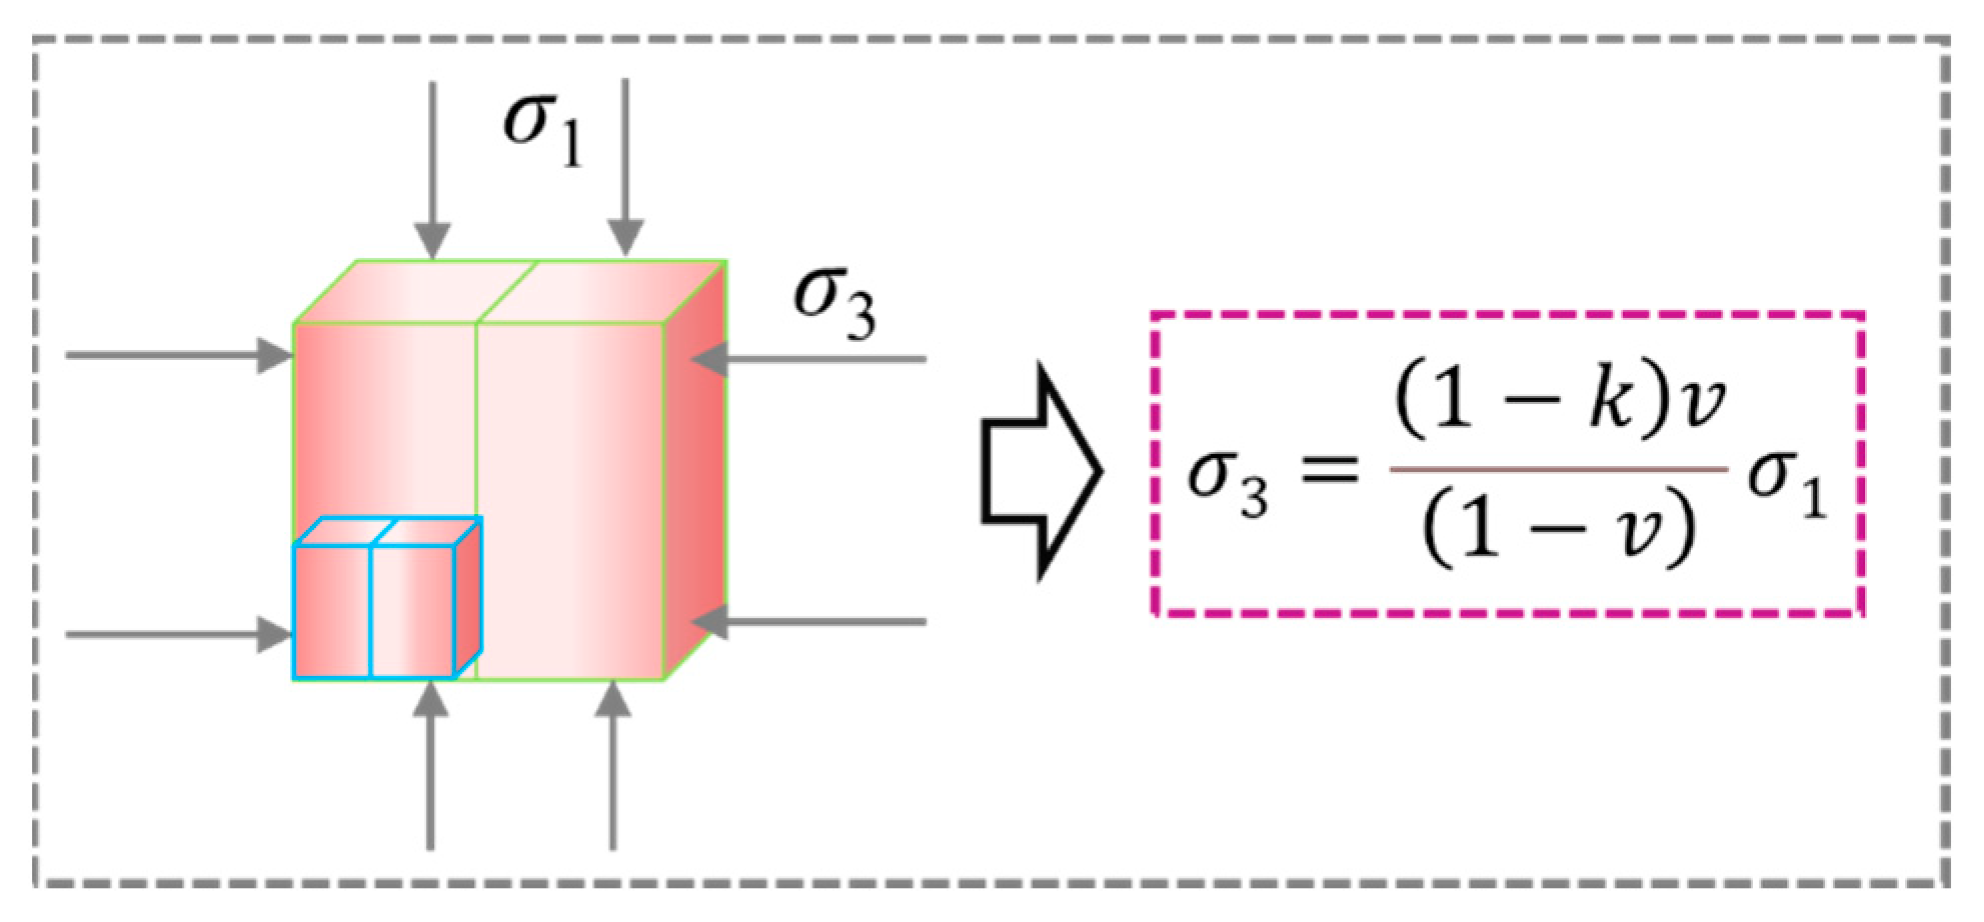
3.5. Cause Analysis of Size Effect
4. Conclusions
- (1)
- The backfill demonstrates a clear size effect: as the size increases, the UCS of the specimen decreases in two stages, and the strength stabilizes after the size reaches 100 mm. The elastic modulus and initial wave velocity trends are similar. The elastic modulus and wave velocity of the smaller specimens are significantly greater than those of the larger specimens. The end friction effect results in a higher peak strength and increases the peak strain;
- (2)
- The surface cracks of the smaller specimens evolve rapidly and aggressively without a fall-off zone under uniaxial compression. Meanwhile, the larger specimens are plastically damaged in general, where cracks gradually expand and penetrate, which facilitates the formation of a large fall-off zone;
- (3)
- As the specimen size increases, the backwards trend of the peak value of the ringing count relative to the peak value of the stress becomes increasingly evident. The occurrence of a change point at which the AE r value decreases abruptly indicates an increase in high-energy events, whereas the lowest average frequency centroid indicates a decrease in high-frequency high-energy events and an increase in low-frequency high-energy events. The sudden drop point of r value and the lowest value of average frequency centroid can be regarded as the precursor of macroscopic damage.
Author Contributions
Funding
Institutional Review Board Statement
Informed Consent Statement
Data Availability Statement
Acknowledgments
Conflicts of Interest
References
- Peng, X.; Guo, L.; Liu, G.; Yang, X.; Chen, X. Experimental Study on Factors Influencing the Strength Distribution of In Situ Cemented Tailings Backfill. Metals 2021, 11, 2059. [Google Scholar] [CrossRef]
- Peng, Z.H. Size effect of compressive strength of cemented backfill. Chin. Min. Mag. 2009, 18, 88–90. [Google Scholar]
- You, M.Q.; Zhou, Y.F. Discussion on heterogeneity of rock material and size effect on specimen strength. Chin. J. Rock Mech. Eng. 2000, 19, 391–395. [Google Scholar]
- Lu, Z.X.; Feng, Z.C.; Zhao, Y.S. Influence of rock inhomogeneity on strength-size effect of rock materials. J. China Coal Soc. 2007, 32, 917–920. [Google Scholar]
- Yang, S.Q.; Su, C.D.; Xu, W.D. Experimental and theoretical study of size effect of rock material. Eng. Mech. 2005, 22, 112–118. [Google Scholar] [CrossRef]
- Yang, S.Q.; Xu, W.Y.; Su, C.D. Study on statistical damage constitutive model of rock considering scale effect. Chin. J. Rock Mech. Eng. 2005, 24, 4484–4490. [Google Scholar]
- Walton, G. Scale Effects Observed in Compression Testing of Stanstead Granite Including Post-peak Strength and Dilatancy. Geotech. Geol. Eng. 2018, 36, 1091–1111. [Google Scholar] [CrossRef]
- Liu, B.C.; Zhang, J.S.; Du, Q.Z.; Tu, J.F. A study of size effect for compression strength of rock. Chin. J. Rock Mech. Eng. 1998, 17, 611–614. [Google Scholar]
- Pan, P.Z.; Zhou, H.; Feng, X.T. Research on effect of loading conditions on failure processes of rocks with different sizes under uniaxial compression. Chin. J. Rock Mech. Eng. 2018, 27 (Suppl. S1), 3636–3642. [Google Scholar]
- Renshaw, C.E.; Schulson, E.M.; Iliescu, D.; Murdza, A. Increased Fractured Rock Permeability After Percolation Despite Limited Crack Growth. J. Geophys. Res. Solid Earth 2020, 125, e2019JB019240. [Google Scholar] [CrossRef]
- Renshaw, C.E.; Murdza, A.; Schulson, E.M. Experimental Verification of the Isotropic Onset of Percolation in 3D Crack Networks in Polycrystalline Materials with Implications for the Applicability of Percolation Theory to Crustal Rocks. J. Geophys. Res. Solid Earth 2021, 126, e2021JB023092. [Google Scholar] [CrossRef]
- Gan, D.Q.; Han, L.; Liu, Z.Y.; Zhao, H. Experimental study on the size effect of compressive strength of cemented filling body. Met. Mine 2018, 1, 32–36. [Google Scholar]
- Xue, G.L. Research on Multi-Scale Mechanical Properties and Failure Evolution Mechanism of Fiber Reinforced Cemented Tailings Backfill. Ph.D. Thesis, University of Science and Technology Beijing, Beijing, China, 2020. [Google Scholar]
- Yilmaz, E.; Belem, T.; Benzaazoua, M. Specimen size effect on strength behavior of cemented paste backfills subjected to different placement conditions. Eng. Geol. 2015, 185, 52–62. [Google Scholar] [CrossRef]
- Xue, G.L.; Yilmaz, E.; Song, W.D.; Cao, S. Fiber length effect on strength properties of polypropylene fiber reinforced cemented tailings backfill specimens with different sizes. Constr. Build. Mater. 2020, 241, 118. [Google Scholar] [CrossRef]
- Chen, A.P.; Dai, S.Y.; Zhang, Y.S.; Huang, S.B.; Ye, Z.Y. Study on size effect of damage evolution of cemented backfill. Chin. J. Rock Mech. Eng. 2019, 38 (Suppl. S1), 3053–3060. [Google Scholar]
- Guo, Y.X.; Zhao, Y.H.; Feng, G.R.; Ren, H.Y.; Zhang, Y.J. Study on damage size effect of cemented gangue backfill body under uniaxial compression. Chin. J. Rock Mech. Eng. 2021, 40, 2434–2444. [Google Scholar]
- Zhao, K.; Yu, X.; Zhu, S.T.; Zhou, Y.; Wang, Q.; Wang, J.Q. Acoustic emission investigation of cemented paste backfill prepared with tantalum-niobium tailings. Constr. Build. Mater. 2020, 237, 117. [Google Scholar] [CrossRef]
- Wu, D.; Zhao, R.K.; Qu, C.L. Effect of Curing Temperature on Mechanical Performance and Acoustic Emission Properties of Cemented Coal Gangue-Fly Ash Backfill. Geotech. Geol. Eng. 2019, 27, 3241–3253. [Google Scholar] [CrossRef]
- Cao, S.; Yilmaz, E.; Song, W.D.; Xue, G.L. Loading rate effect on uniaxial compressive strength behavior and acoustic emission properties of cemented tailings backfill. Constr. Build. Mater. 2019, 213, 313–324. [Google Scholar] [CrossRef]
- Gong, C.; Li, C.H.; Zhao, K. Experimental study on b-value characteristics of acoustic emission of cemented filling body under loading and unloading test. J. Min. Saf. Eng. 2014, 31, 788–794. [Google Scholar]
- Qi, T.Y.; Feng, G.R. Resistivity and AE Response Characteristics in the Failure Process of CGB under Uniaxial Loading. Adv. Mater. Sci. Eng. 2017, 2017, 7857590. [Google Scholar] [CrossRef] [Green Version]
- Ran, H.; Guo, Y.; Feng, G.; Qi, T.; Du, X. Creep properties and resistivity-ultrasonic-AE responses of cemented gangue backfill column under high-stress area. Int. J. Min. Sci. Technol. 2021, 31, 401–412. [Google Scholar] [CrossRef]
- Zhou, Y.; Yu, X.; Guo, Z.Q.; Yan, Y.J.; Zhao, K.; Wang, J.Q.; Zhu, S.T. On acoustic emission characteristics, initiation crack intensity, and damage evolution of cement-paste backfill under uniaxial compression. Constr. Build. Mater. 2020, 269, 121261. [Google Scholar] [CrossRef]
- Lu, X.J.; Li, Z.J.; Fang, H.G.; Deng, W.D. Dominant size and size effect of rock uniaxial compressive strength. Yellow River 2011, 33, 107–109. [Google Scholar]
- Yilmaz, T.; Ercikdi, B.; Karaman, K.; Kulekci, G. Assessment of strength properties of cemented paste backfill by ultrasonic pulse velocity test. Ultrasonics 2014, 54, 1386–1394. [Google Scholar] [CrossRef]
- Hao, Y.X.; Song, X.P.; Huang, Y.C.; Zhang, B.; Dong, Z.L.; Wang, H. Mesoscopic damage evolution and acoustic emission characteristics of cemented paste backfill under different loading rates. Environ. Sci. Pollut. Res. 2022. [Google Scholar] [CrossRef]
- Byun, Y.; Sagong, M.; Kim, S.; Chun, B.; Park, S.; Jung, H. A study on using acoustic emission in rock slope with difficult ground—Focused on rainfall. Geosci. J. 2012, 16, 435–445. [Google Scholar] [CrossRef]
- Zhao, K.; Zhu, Z.C.; Zeng, P.; Chen, S.J. Experimental Study on Acoustic Emission Characteristics of Phyllite Specimens under Uniaxial Compression. J. Eng. Sci. Technol. Rev. 2015, 8, 53–60. [Google Scholar]
- Hall, S.A.; Sanctis, F.D.; Viggiani, G. Monitoring Fracture Propagation in a Soft Rock (Neapolitan Tuff) Using Acoustic Emissions and Digital Images. Pure Appl. Geophys. 2006, 163, 2171–2204. [Google Scholar] [CrossRef]
- Zhao, K.; Zhou, Y.T.; Zeng, P.; Lu, C.Y. Experimental study on acoustic emission characteristics of rock-like materials with different particle sizes under three-point bending. J. China Coal Soc. 2018, 43, 3107–3114. [Google Scholar]
- Qiu, H.F.; Zhang, F.S.; Liu, L.; Huan, C.; Hou, D.Z.; Kang, W. Experimental study on acoustic emission characteristics of cemented rock-tailings backfill. Constr. Build. Mater. 2022, 315, 125278. [Google Scholar] [CrossRef]
- Zhao, K.; Yang, D.X.; Zeng, P.; Huang, Z.; Teng, T.Y. Effect of water content on the failure pattern and acoustic emission characteristics of red sandstone. Int. J. Rock Mech. Min. Sci. 2021, 142, 104709. [Google Scholar] [CrossRef]
- Guo, H.S. Some factors affecting pillar strength. Chin. J. Rock Mech. Eng. 1993, 12, 38–45. [Google Scholar]


| Component | SiO2 | CaO | Al2O3 | K2O | TiO2 | P2O5 |
|---|---|---|---|---|---|---|
| Content/% | 71.56 | 1.12 | 11.62 | 0.51 | 0.19 | 0.13 |
| Size (mm) | OA | AB | BC | C | CD |
|---|---|---|---|---|---|
| 40 |  |  |  |  |  |
 | |||||
| 70.7 |  |  |  |  |  |
 | |||||
| 100 |  | 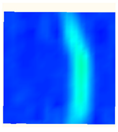 |  | 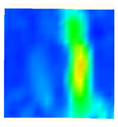 |  |
 | |||||
| 150 |  |  | 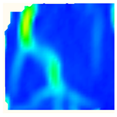 | 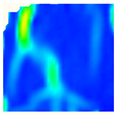 | 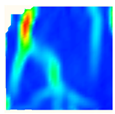 |
 | |||||
| Size (mm) | T1 (s) | T2 (s) | ΔT (s) | Relative Lag Ratio |
|---|---|---|---|---|
| 40 | 243 | 262 | 19 | 0.078 |
| 70.7 | 358 | 438 | 80 | 0.223 |
| 100 | 524 | 791 | 267 | 0.510 |
| 150 | 1104 | 1370 | 230 | 0.208 |
Publisher’s Note: MDPI stays neutral with regard to jurisdictional claims in published maps and institutional affiliations. |
© 2022 by the authors. Licensee MDPI, Basel, Switzerland. This article is an open access article distributed under the terms and conditions of the Creative Commons Attribution (CC BY) license (https://creativecommons.org/licenses/by/4.0/).
Share and Cite
Zhao, K.; Liu, Z.; Zeng, P.; Gong, C.; Li, Y. Fracture Process Analysis and Acoustic Emission Response of Cemented Tailings Backfill with Different Sizes under Uniaxial Compression. Materials 2022, 15, 8038. https://doi.org/10.3390/ma15228038
Zhao K, Liu Z, Zeng P, Gong C, Li Y. Fracture Process Analysis and Acoustic Emission Response of Cemented Tailings Backfill with Different Sizes under Uniaxial Compression. Materials. 2022; 15(22):8038. https://doi.org/10.3390/ma15228038
Chicago/Turabian StyleZhao, Kui, Zhouchao Liu, Peng Zeng, Cong Gong, and Yanda Li. 2022. "Fracture Process Analysis and Acoustic Emission Response of Cemented Tailings Backfill with Different Sizes under Uniaxial Compression" Materials 15, no. 22: 8038. https://doi.org/10.3390/ma15228038