Abstract
Post-quench atomic reordering processes undergone by Ni2Mn1−xCuxGa alloys have been characterized in detail. The obtained results corroborate the hypothesis that proposes an atomic ordering process additional to the B2↔L21 one, consisting of the relocation in the Mn sublattice of Cu atoms misplaced by quench in the Ni sublattice. In addition, the results suggest that the ordering of the Cu atoms and the L21 ordering can occur in different sequences depending on the starting state of order. The analysis of the saturation magnetization validates the occurrence of two types of atomic movements; the values corresponding to different post-quench stages have been compared with those calculated for different atomic configurations, supporting the relocation mechanism of Cu atoms as the most plausible mechanism. The effect of the quenching temperature on the reordering processes has been also studied, and an assessment of the degree of quenched disorder is provided, suggesting the existence of an order–disorder transition associated with Cu atoms ordering. Finally, the effect of the Cu amount has been analyzed, confirming that a greater amount of Cu intensifies the process associated to ordering of Cu atoms, which takes place even in martensite.
1. Introduction
Ferromagnetic shape memory alloys (FSMA) have drawn much attention in recent years, since they add to the unique capabilities of conventional shape memory alloys and other attractive properties resulting from the coupling between the magnetic and structural phase transitions, such as magnetic-field-induced strain, magnetic shape memory, or magnetocaloric effect (MCE) [1,2,3]. The most studied FSMAs are Heusler-type, particularly near-stoichiometric Ni2MnGa alloys, that undergo thermoelastic martensitic transformation (MT) from the cubic L21 parent phase (austenite) to a less symmetric phase (martensite). Much work has been devoted to the study of the structural and magnetic properties of Ni-Mn-Ga-based alloy systems, often focusing on their composition dependence. In that sense, the addition of a fourth element strongly affects both the MT (TMT) and Curie temperatures (TC) and allows for tuning the relative position of the magnetic and structural transformations. This is of utmost importance, since several functional properties, such as MCE, require the existence of a magnetization jump between phases. Among doping elements, Cu has been extensively studied, since the sequence of magnetic/structural transformations can be tailored by changing the Cu content and the element it replaces. In summary, Cu substituting Mn or Ga increases the TMT and decreases both the austenite and martensite TC [4,5]; instead, Cu substituting Ni lowers TMT and raises TC [6].
Ni-Mn-Ga-based alloys show a marked sensitivity to the degree of atomic order [7,8,9,10,11,12,13,14,15]. Ni-Mn-based alloys solidify from the melt to the cubic B2 structure, and the ordered L21 structure was formed through a B2↔L21 ordering reaction (around 1100 K for ternary Ni2MnGa [13]). A schematic representation of the atomic occupancy in the cubic lattice for the different order states B2 and L21 for ternary Ni2MnGa alloy is shown in Figure 1. As a general rule, high-temperature quenching followed by post-quench aging has proven to be effective to control the order degree; neutron diffraction measurements have confirmed [9,16] that quenching from temperatures around the ordering transition produces a loosely ordered L21 structure, so that a certain degree of atomic disorder is retained. L21 order can be progressively improved up to the equilibrium value by post-quench ageing at temperatures at which atomic diffusion is possible. It is a widespread result that TC increases with L21 order as a consequence of the variation of the magnetic moment of the alloys, depending on the position of the Mn atoms, which couple antiferromagnetically when they are nearest-neighbors (Mn atoms on the Ga positions) and ferromagnetically when they are next-nearest-neighbors (Mn atoms in the Mn sublattice) [17]. The MT temperatures are also modified by changes in atomic order, although there is no unique trend: TMT has been observed to increase (as in ternary Ni-Mn-Ga [8,16]) or to drop (as in Co− or In-doped Ni-Mn-Ga [9,11,12]) with increasing atomic order. Instead, the Ni-Mn-Sn system shows almost no changes after quenching from high temperature [10]. It is worth mentioning that the post-quench reordering process is often evidenced by the appearance of a broad exothermic calorimetric peak which appears at temperatures well above the MT, only in the first heating run after quench [7,8].
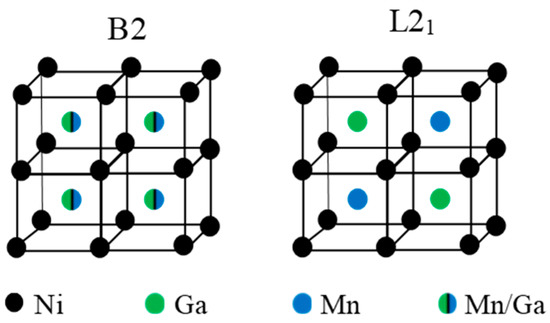
Figure 1.
Atomic occupancies of the cubic lattice for B2 and L21 order in ternary Ni2MnGa alloy.
In a recent work, the influence of atomic order on the martensitic and magnetic transformations undergone by Ni2Mn1−xCuxGa FSMAs was investigated [18]. Both the MT and Curie temperatures decrease by quench and raise during post-quench aging, but these temperatures do not evolve in parallel: TMT increases from the start of aging while TC begins to rise at a later stage in the aging process. Furthermore, during the first post-quench heating, Ni2Mn1−xCuxGa alloys display two consecutive DSC exothermic peaks, indicative of two thermal processes, each of which can be related to the evolution of a transition temperature: the one appearing at lower temperatures can be associated to a process which produces an increase in the MT temperatures, while the one occurring at higher temperatures accounts for another process that results in an increase of Curie temperature. This phenomenon, never reported before, was analyzed and discussed in detail in [18,19], basing on its most significant characteristics: first, ternary Ni-Mn-Ga, Co-doped Ni-Mn-Ga, and Ni2−xCuxMnGa alloys display a single exothermic peak, while all tested Ni2Mn1−xCuxGa alloys present the two post-quench exothermic peaks; the role of Cu substituting Mn is therefore decisive to the phenomenon [18]. Second, the peak common to all alloys disappears after quenching from temperatures well below the B2↔L21 transition, the lowest temperature exothermic peak being the only one remaining after quench from temperatures where the L21 order is complete. Finally, the detailed study of the kinetics of the post-quench aging processes [19] reveals that both can be described by a first order reaction model with similar activation energies around 1.1 eV, with the vacancies retained by high temperature quenching playing a crucial role in these processes.
According to the above, and having ruled out the formation of structures other than the Heusler X2YZ [18], the occurrence of the process undergone by all alloys that is responsible for the change in Curie temperature is attributed to the improvement of L21 order, due to exchange of Mn and Ga atoms located at antisites after quench; for the other process, which only occurs in Ni2Mn1−xCuxGa alloys and underlies the rise of martensitic transformation temperatures, diffusion of Cu atoms, misplaced in the Ni sublattice after quench, towards their most favorable sites in the Mn sublattice is proposed as the responsible mechanism [18]. Unfortunately, X-ray or TEM–electron diffraction does not allow us to distinguish what type of atom occupies the available sites, withneutron diffraction remaining as the only option to discern site occupation.
While a detailed study is carried out by means of neutron diffraction to corroborate the atomic movements proposed as the most probable hypothesis, there are still several unknowns, whose clarification will undoubtedly help to better understand the mechanisms of atomic ordering in Ni2Mn1−xCuxGa alloys.
In this work, the characterization of the post-quench atomic reordering processes that Ni2Mn1−xCuxGa alloys undergo has been deepened. All the obtained results are consistent with the hypothesis formulated that proposes, for these alloys, an atomic ordering process additional to the B2↔L21 one, consisting of the relocation in the Mn sublattice of Cu atoms misplaced by quench in the Ni sublattice. In addition, the results suggest that the ordering of the Cu atoms and the L21 ordering can occur in different sequences depending on the starting state of order.
2. Materials and Methods
Polycrystalline Ni2Mn1−xCuxGa (x = 0.12–0.44) alloy ingots were prepared by induction melting in argon atmosphere, using the appropriate quantities of the constituent elements Ni, Mn, and Cu of 99.99 % purity and Ga of 99.9999 % purity (Neyco Vacuum and Materials, Vanves, France). The alloys are labelled according to the Cu atomic percent as Cu% (% = 25·x). The ingots were melted at least twice to improve homogeneity and subjected to homogenization heat treatment consisting of 24 h at 1170 K in a vacuum quartz tube, followed by quenching in water at room temperature. The composition of the homogenized alloys was checked by energy-dispersive x-ray spectroscopy (EDS, Bruker X-flash detector 4010, Bruker GmbH, Berlin, Germany) in a scanning electron microscope (Hitachi S-3400 N, Hitachi High-Tech Ltd., Tokyo, Japan); in all cases, the content of the different elements turned out to differ by less than 5% from the nominal compositions.
The samples used in the different experimental techniques were cut using a diamond saw from the already-homogenized ingots. Long range atomic order of the samples was modified by means of additional thermal treatments, consisting of annealing for 1 h at temperatures TWQ = 570–1170 K, followed by quench into water at room temperature, and subsequent post-quench ageing, carried out by continuous heating up to a maximum of 700 K.
The martensitic and magnetic transitions, as well as the reordering processes, have been monitored by Differential Scanning Calorimetry measurements (DSC 2920, TA Instruments, New Castle, DE, USA), at a heating rate of 5 K/min, using prismatic samples with mass around 100 mg. From the DSC curves, the transition temperatures and the exchanged heats are determined, with the latter integrating the heat flow curves after the proper baseline correction. To minimize the error made when calculating the heat released during the exothermic reordering peaks, the curve corresponding to the second heating was taken as baseline and subtracted from the curve obtained after quenching.
Magnetization measurements under magnetic fields up to 7 T have been performed in a vibrating sample magnetometer (VSM; magnetic platform from Cryogenic Ltd. CFMS, London, UK), using bulk prismatic samples with mass around 10 mg.
3. Results and Discussion
3.1. Ordering Sequences
Figure 2a shows the DSC curves obtained for a Cu5 sample water quenched from 1020 K. The exothermic and endothermic peaks observed at low temperatures correspond to the forward (on cooling; peak temperature MP) and reverse (on heating; peak temperature AP) MT, respectively, whereas the anomaly around 300 K is associated with the magnetic transition taking place in the austenitic phase (); during post-quench heating, two broad exothermic peaks are observed, labelled as PL and PH. Figure 2a displays the curves obtained during cooling down to 210 K and subsequent heating up to 500 K of the just-quenched sample (blue curve), cooling after overcoming PL and heating up to 670 K (red curve), and cooling after passing PH followed by heating up to 670 K (black line). Comparison of the blue and red curves with the black one in the heating range 400 K–670 K shows that the exothermic peaks PL and PH are irreversible, as they do not appear in subsequent heating runs. Both the martensitic and magnetic transition temperatures are found to drop by quench and to increase during post-quench aging, but while there is a significant change in MP and AP after heating above PL (compare blue and red curves), does not change until the sample is heated to above PL, as shown in the inset (red and black curves). In order to discern the effects of the processes underlying PL and PH, we will name the different aging states as quenched (WQS; before blue curve), intermediate-aged (IAS; before red curve), and full-aged (FAS; before black curve).
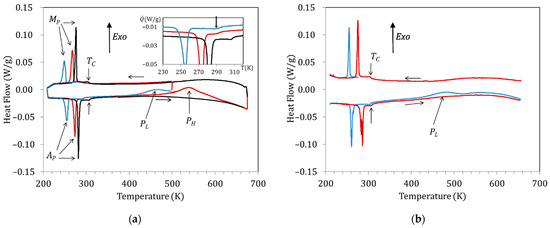
Figure 2.
DSC curves obtained for a Cu5 sample (a) water quenched from 1020 K: just-quenched (blue curve), after overcoming PL (red curve), and after passing PH (black curve). (b) Just after quench from 770 K (blue curve) and (b) quenched from 770 K: just-quenched (blue curve) and after heating up to 670 K (red curve).
On its turn, Figure 2b shows the DSC curves obtained for the same Cu5 alloy after quench from 770 K. As explained in the introduction, after quench from temperatures well below the B2↔L21 transition, the PH peak is supressed and only PL remains. Consistent with the changes in transition temperatures observed in Figure 2a, it can be seen in Figure 2b that quench from 770 K affects the MT temperatures but not the Curie temperature.
Sticking to the hypothesis that the PH peak is associated with the L21 ordering (that is, with the switch of Mn and Ga atoms from the improper to their proper sublattices), while PL accounts for the emplacement in the Mn sublattice of Cu atoms, misplaced in the Ni sublattice after quench, it results from Figure 2 that these two ordering processes take place in a different sequence depending on the starting state. This is summarized in Figure 3, which illustrates the crystal structure of the austenite with the proposed site occupation in each state and the different ordering sequences.
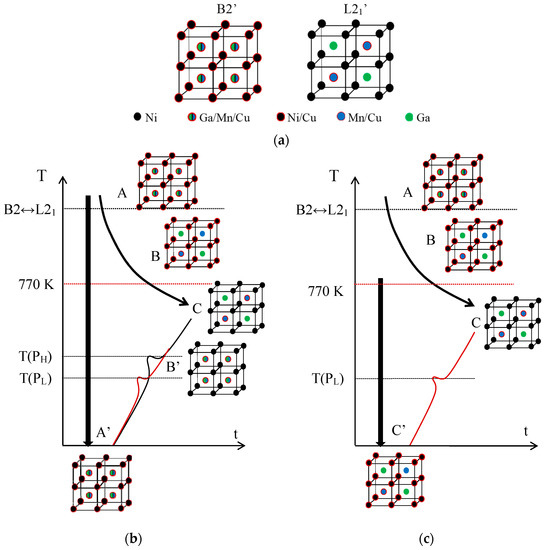
Figure 3.
Crystal structure of the austenite with the proposed site occupation in each state of the sequences, as explained in the text. (a) Atomic occupancies for B2′ and L21′ order in Ni2Mn1−xCuxGa alloys. Sequences of ordering after quench (b) from the B2′ temperature domain; and (c) from below the B2↔L21 temperature.
First, Figure 3a shows the atomic occupancies in the states of order B2′ and L21‘ for the present Ni2Mn1−xCuxGa alloys. In the B2’ ordered state we expect to find Cu atoms in the Mn and Ga sublattices, but also in the Ni sublattice, according to the formulated hypothesis. Likewise, the most ordered structure L21’ corresponds to the Cu atoms in the sites of the Mn that it replaces. In Figure 3b, states A and C correspond to B2′ and L21′ respectively, and A’ is obtained by quenching from the temperature domain of B2’; although it certainly holds a substantial L21‘ order, it retains a certain degree of B2’ order, which is shown in the figure. If from state A’ heating proceeds continuously, during the PL process ordering of the Cu atoms located in Ni sites, towards the Mn sublattice, occurs, leading to a state called B’ in which the disorder between Mn and Ga atoms remains. On further heating, during the PH process, the Mn-Ga ordering takes place, resulting in the ordered structure L21’ (state C). Instead, below the ordering temperature B2↔L21, the stable state is called B in Figure 3c, in which the Mn and Ga atoms occupy their own sublattices, but some Cu atoms remain misplaced in the Ni sites. Quenching from that state retains the disorder of the Cu atoms (C’ state), and subsequent heating leads, through the PL process, to the ordered C state.
3.2. Magnetic Behavior
Figure 4 shows the magnetization measured at a constant magnetic field of 5 mT, as a function of temperature, for samples of alloy Cu5 quenched from 1020 K in three different post-quench ageing states as defined above: just quenched (WQS), intermediate-aged (IAS), and full-aged (FAS). In line with the previously established relationship between the processes underlying PL and PH and the variation of transition temperatures, the IAS sample shows MT temperatures higher than WQS but with no TC changes, while between IAS and FAS samples, an increase in TC was also observed.
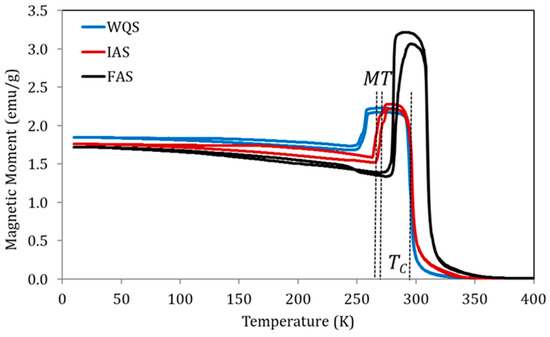
Figure 4.
Magnetization vs temperature curves under a constant magnetic field of 5 mT for samples of alloy Cu5 quenched from 1020 K in three different post-quench ageing states: just quenched (WQS), intermediate-aged (IAS), and full-aged (FAS).
To better understand the magnetization changes associated with these states of order, magnetization vs. magnetic field curves for the above specimens were also recorded at 10 K (ferromagnetic martensite, Figure 5a) and 280 K (ferromagnetic austenite, Figure 5b). The saturation magnetization increases from WQS to FAS—i.e., with atomic order degree—but it is worth paying attention to the fact that the increase in magnetization is very small between WQS and IAS (overcoming PL), with the true increase being produced when passing from IAS to FAS (that is, after overcoming PH). With the behavior being the same in Figure 5a,b, the M(μoH) values for ferromagnetic austenite at 280 K are clearly lower than those observed for ferromagnetic martensite at 10 K. This can easily be attributed to the fact that 280 K is not far enough below the Curie temperature to have complete magnetic order; in fact, the gap (TC −280 K) is different for WQS, IAS, and FAS samples. Trying to approach more realistic values of the saturation magnetization in austenite, the Kuz’min [20] formula can be applied
where is the reduced temperature difference, M(T) is the spontaneous magnetization at temperature T, M(0) is the saturation magnetization at 0 K, and s is a parameter related to the shape of the magnetization versus temperature curves; in [12,21], s = 0.1 was successfully used for austenite. The Curie temperatures for WQS, IAS, and FAS were taken as 300 K, 301 K, and 316 K, as depicted in Figure 4. The saturation magnetization of ferromagnetic martensite and austenite was determined from the Arrott plots, based on the mean field theory applied to magnetism which predicts that should be linear below the Curie temperature. High field data have been fitted to a linear function that is extrapolated to to obtain the saturation magnetization. The obtained values, together with the calculated austenite 0 K values as indicated above, are given in Table 1, where it can be seen that the magnetic moment experiences a slight rise after overcoming the process associated with PL and a significantly greater rise when overcoming the process PH.
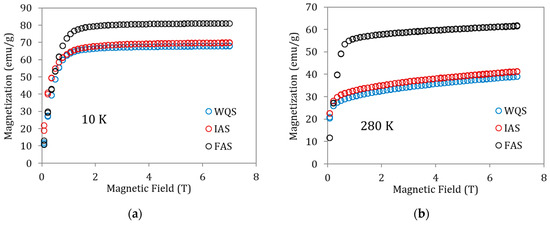
Figure 5.
Magnetization vs. magnetic field curves for samples of alloy Cu5 quenched from 1020 K in WQS, IAS, and FAS ageing states recorded at (a) 10 K and (b) 280 K.

Table 1.
Saturation magnetization of ferromagnetic martensite and austenite obtained by means of the Arrott plots, together with the calculated values for austenite at 0 K.
The saturation magnetization per formula unit that would correspond at 0 K to the full-ordered Ni2Mn1−xCuxGa can be computed from
The values for (magnetic moment of X atoms in the Y sublattice) can be found in [22] to be , and . Particularizing in the Cu5 alloy (x = 0.2) to which the previous results refer,
a value somewhat higher than those listed in Table 1 for sample FAS, meaning that not even FAS corresponds to an optimal degree of atomic order. To explain the measured magnetic moments for states WQS, IAS, and FAS, we will refer to the atomic occupation of the sublattices in case it is different from the perfectly ordered one. Clearly, the greatest changes in magnetization are associated with the position of the Mn atoms, due to antiferromagnetic coupling of the Mn-Mn pairs when Mn atoms are not located at the proper sites in the Heusler structure [22]. Since and [22], a fraction α of Mn-Ga atoms exchange would lead to
accounting for a decrease of . In this sense, the lower the L21 order degree, the more Mn-Mn pairs are coupled antiferromagnetically, and therefore, the resulting saturation magnetization is lower. In addition to the Mn-Ga (L21) disorder, the placement of the Cu atoms will be considered to explain the measured values of . Following [22], for the Ni2Mn0.8Cu0.2Ga alloys, the configurations listed below can be considered, ranked from the most (i) to the least favorable energetically (v):
- i.
- Ni2 (Mn0.8Cu0.2) Ga
- ii.
- Ni2 (Mn0.8Ga0.2) (Ga0.8Cu0.2)
- iii.
- (Ni1.8Cu0.2) (Mn0.8Ni0.2) Ga
- iv.
- (Ni1.8Cu0.2) (Mn0.8Ga0.2) (Ga0.8Ni0.2)
- v.
- (Ni1.8Ga0.2) (Mn0.8Ni0.2) (Ga0.8Cu0.2)
The v configuration is discarded as being highly unfavorable, and for the remaining ones, we can evaluate the saturation magnetic moment using and [22]. Configuration ii, that is, Cu atoms misplaced in the Ga sublattice, yield an increase of the saturation magnetization, thus it does not seem to be a likely configuration after quench (WQS); instead, iii and iv produce comparable decrease of of with respect to i. In this way, the slight increase in experienced between WQS and IAS states is compatible with the relocation of Cu atoms, misplaced by quench in the Ni sublattice, towards the Mn sublattice, in agreement with the hypotheses which was formulated in [18]. Among iii and iv, the configuration iii is more stable according to the first principles calculations in [22], so the following atom allocation is proposed to explain the measured values:
WQS: (Ni2−βCuβ) (NiβCu0.2−βMn0.8−αGaα) (Ga1−αMnα)
IAS: Ni2 (Cu0.2Mn0.8−αGaα) (Ga1−αMnα)
FAS: Ni2 (Cu0.2Mn0.8) Ga
Evidently, from a quantitative point of view, it is a mere approximation, since it is obvious that the Mn-Ga exchanges take place throughout the entire aging process, although their rate be maximum in the temperature domain where PH occurs; in the same way, other atomic movements cannot be ruled out, which in any case would be less relevant. For this reason, it would be very daring trying to deduce, from the values in Table 1, the fractions α and β of misplaced atoms. At most, from the comparison between the values for WQS, IAS, and FAS, we can estimate α = 0.07–0.08 after quench, and remaining α = 0.01–0.02 in FAS.
3.3. Evaluation of Order Degree for Different TWQ
A relevant characteristic of the studied processes is their behavior for different quenching temperatures (TWQ). In this sense, the most outstanding observation, as already mentioned, is the suppression of PH for TWQ below 770 K. However, TWQ has other interesting effects, both on the structural and magnetic transitions as well as on the exothermic processes PL and PH. Figure 6 shows the DSC curves obtained for alloy Cu5 during the first (solid lines) and second (dashed lines) heating runs after quench from different TWQ. As we know, both the Curie and MT temperatures recorded in the first heating run (quenched state) fall relative to the second heating (ordered, stable state); it can be observed in Figure 6 that the value of the drops ∆TC, ∆MP and ΔAP depends on TWQ; all temperature drops are larger the higher TWQ, but ∆TC becomes stable for TWQ above 970 K (that is, coincident with the B2↔L21 temperature) and is null for quenches from 670 K and below, while ∆MP and ∆AP stabilize for quenching above 870 K, and even for quenching temperatures below 570 K, non-zero ∆MP and ΔAP are observed (see also Figure 8 in [18]). The behavior of ∆TC, ∆MP, and ∆AP supports that while the process responsible for the variation of Curie temperature is closely related to L21 ordering, the changes in the MT temperatures are generated in a process that takes place during quench from temperatures well below the B2↔L21 ordering reaction.
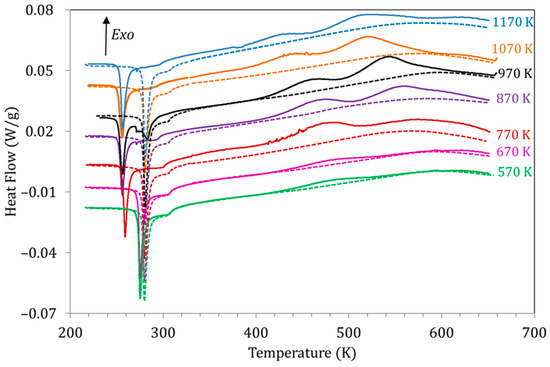
Figure 6.
DSC curves obtained for alloy Cu5 during the first (solid lines) and second (dashed lines) heating runs after quench from different TWQ.
The evolution of the exothermic peaks PL and PH as a function of TWQ can also be seen in Figure 6. Along with the suppression of PH for TWQ below 770 K, both peaks PL and PH are observed to shift towards higher temperatures as TWQ is lowered, as depicted in Figure 7a. This would indicate that the related processes require less energy to start after quenching from higher temperatures, which, as discussed in [19], can be related to the crucial role of vacancies in assisting the reordering processes. On its turn, Figure 7b shows the evolution with TWQ of the heat released during the processes underlying PL and PH, computed from the area under the DSC curves as explained in Section 2. Q(PL) and Q(PH) increase as TWQ increases, meaning that these processes involve more energy after quenching from higher temperatures.
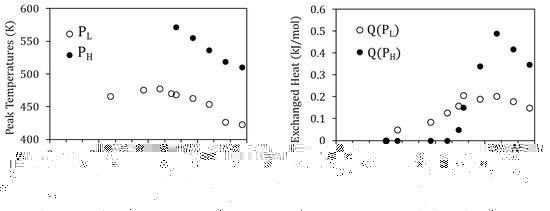
Figure 7.
(a) Peak temperature of PL and PH as a function of the quenching temperature TWQ; (b) evolution with TWQ of the heat released during PL and PH (Q(PL) and Q(PH), respectively).
To understand the meaning of the heat released in the exothermic peaks, let us take as an example the case of PH, related to the improvement of the L21 order. The heat released would be proportional to the enhancement of the order degree achieved during the process giving rise to PH, and ultimately to the degree of quenched disorder, which is clearly dependent on TWQ.
Moreover, Figure 8 shows that the Curie temperature drop ∆TC due to quench from TWQ and the heat released in the PH peak are proportional, suggesting their common origin: the higher TWQ, the lower the degree of atomic order after quench, giving rise to a greater drop in TC and to a reordering process that involves more energy. The reasoning is the same for PL, as it can be seen in Figure 8 relating the heat released at peak PL, with the MT temperatures droping due to quench from TWQ. In this case, the invoked reordering process is the relocation of Cu atoms, misplaced in the Ni sublattice, towards their most favorable sites in the Mn sublattice.
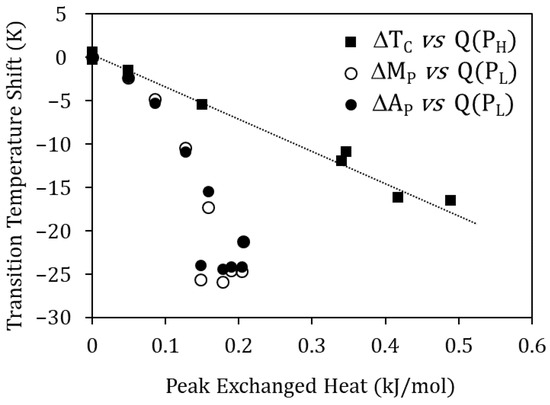
Figure 8.
Curie temperature drop ∆TC due to quench from TWQ vs. heat released in the PH peak, and MT temperatures drop (∆MP and ∆AP) vs. heat released at peak PL.
In either case, the heat released in the exothermic processes PL and PH would account for the degree of quenched-disorder according to:
being the degree of order after quench from TWQ, the heat released in the corresponding exothermic reordering peak, and the maximum heat for the ordering process; that is, the energy required to go from complete disordered to full ordered states. For the ordering B2↔L21, to which we relate PH, it is possible to find in the literature values obtained through ab-initio calculations; Ref. [23] provides a value of 50 meV/atom (4.82 kJ/mol) for the stoichiometric Ni2MnGa alloy. Instead, for the ordering of the Cu atoms in the corresponding sublattice, we do not have reference values, but we can get an approximation from [22], where the site preference of Cu-doped Ni2MnGa alloys is analyzed from the first principles. In this work, a relative free energy difference of 0.24 mRy/atom (3.26 meV/atom) between the configuration Ni2(Mn0.95Cu0.05) Ga and (Ni1.95Cu0.05)(Mn0.95Ni0.05) Ga is calculated, thus a difference of 13.06 meV/at (1.26 kJ/mol) can be inferred between the most stable Ni2 (Mn0.8Cu0.2) Ga configuration and the disordered (Ni1.8Cu0.2) (Mn0.8Ni0.2) Ga one. Using these values as Qmax in Equation (9) we can calculate the degree of order after quenching from different temperatures, with the results shown in Figure 9.
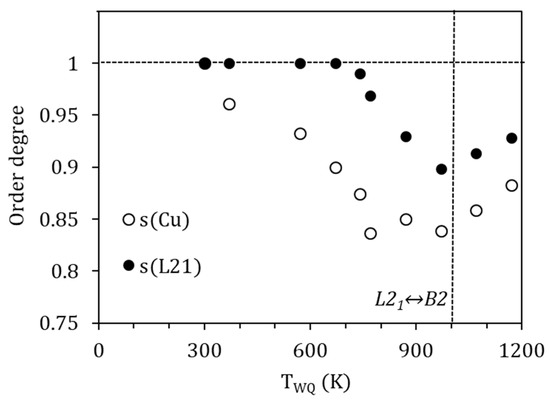
Figure 9.
Calculated degrees of order after quenching from different temperatures.
It is interesting to note that the values obtained for the degree of order L21 (PH) after quench are similar to those evaluated in the literature (see, for example, [8,9,10]), with a minimum of s(L21)~0.9 after quench from temperatures around the B2↔L21 temperature. It can be also observed, and it is quite a common feature, that the degree of order improves for higher temperatures above the order–disorder one, which is attributable to the role of quenched-in vacancies in facilitating diffusion.
On its turn, the degree of order associated with the site occupancy of Cu atoms takes minimum values around 0.85 due to quench from temperatures above 770 K. This would imply that around 15% of the Cu atoms are displaced from their most favorable sites after quench. In addition, as it was already clear from the evolution of the temperature shifts, a perfect order is not achieved, even when quenching from temperatures as low as 370 K.
Comparing the evolution of this degree of order and the L21 one, an order–disorder transition would be expected to occur at temperatures around 770 K. However, unlike the B2↔L21 transition, this eventual order–disorder transition is not accompanied by latent heat, nor has it been possible to detect its presence by other experimental techniques, so it must be attributed to a continuous transition.
3.4. Effect of Cu Content
Given that the mechanism proposed for PL is based on the diffusion of Cu atoms towards their most energetically favorable sites, it is natural to assume that the characteristics of this process will be enhanced in alloys with more Cu. Figure 10 shows the DSC curves obtained for alloys with different Cu content (3–11 at% Cu) quenched from 1020 K during the first (solid lines) and second (dashed lines) heating runs. In Figure 10, along with the variation of the MT and Curie temperatures owing to Cu content [5], the exothermic peaks PL and PH are also observed to change.
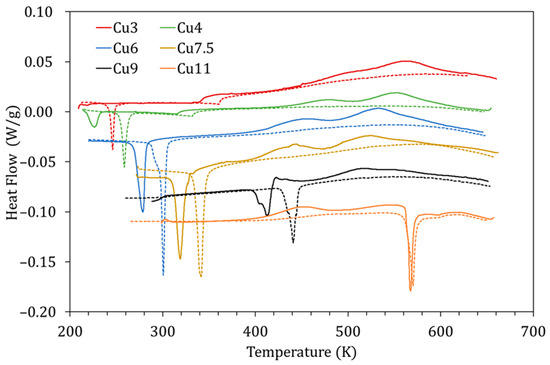
Figure 10.
DSC curves obtained for alloys with different Cu content (3–11 at% Cu) quenched from 1020 K during the first (solid lines) and second (dashed lines) heating runs.
The influence of the amount of Cu is evidenced through different magnitudes. First, the temperatures at which PL and PH occur decrease as the amount of Cu increases; this is depicted in Figure 11a, together with the temperature of the B2↔L21 transition. The reason as to why this happens is not straightforward. On the one hand, since the processes are thermally activated, the peak temperature evolution could be related to composition-dependent changes in the kinetic parameters. On the other hand, since the B2↔L21 temperatures also decrease with increasing Cu, quenching from the same temperature (1020 K) will lead to different degrees of quenched-disorder for the different compositions, modifying the characteristics of the reordering processes.
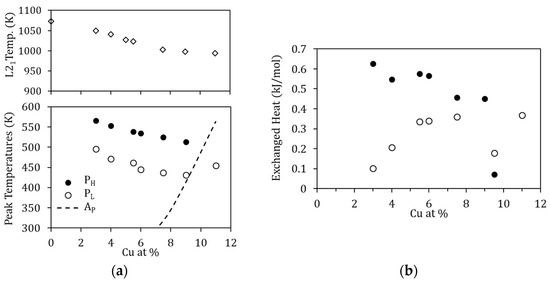
Figure 11.
(a) Peak temperature of PL and PH, together with the temperature of the B2↔L21 ordering transition, as a function of the Cu-content; the dashed line shows the reverse MT temperature; (b) Heat released during the processes PL and PH as a function of the Cu-content.
Second, in Figure 10, a phenomenon never reported to date in the literature can be observed; for the alloy with the highest Cu content (Cu11), displaying the highest MT temperatures of the set, one exothermic, transient, peak appears in martensite. This is an unprecedented observation, since it has always been assumed that diffusion-related post-quench atomic reordering only takes place in austenite (being usual to observe a related exothermic peak [7,8]). On the other hand, atomic diffusion in martensite, and the atomic rearrangement that it entails, have always been related to the phenomenon of martensite stabilization [24] (no thermal effect associated with having been reported to date). However, as can be seen in Figure 10, there is no stabilization of martensite, since the MT transformation temperatures are the same in the first and second heating runs. Incidentally, no stabilization of martensite was detected after keeping a sample for 3 h at 470 K, so this alloy, with high MT temperature, remains very stable at high temperatures. Although it could be doubted whether the detected exothermic peak is PL or PH, the fact that it remains after quench from 770 K, well below its L21 ordering temperature, suggests that it is PL, and so is quoted in Figure 11a. This is a very interesting experimental fact that should be studied in detail independently, but in the meantime, it gives rise to the idea that, unlike the L21 ordering (Mn-Ga pairs), the reordering process involving the Cu atoms can take place in martensite.
Lastly, as might be expected, the heat released during the processes PL and PH changes with Cu content, increasing with Cu in the case of Q(PL) and increasing with Mn content for Q(PH). This is shown in Figure 11b and can be interpreted as an indication that increasing the Cu (Mn) content increases the probability of finding misplaced atoms after quenching, and therefore the overall energy required for relocation increases. Nevertheless, as already mentioned, for the different Cu-content, the degree of disorder retained by quench from 1020 K will be different, as will the reference energy values, which prevents estimating the fraction of atoms that are relocated in the corresponding processes.
Detection of the disorder caused by the exchange between Ni and Cu atoms requires special measurement setups like neutron diffraction. Thus, a detailed neutron powder diffraction study is on the way, with the goal of elucidating the atomic site occupancies during post-quench aging of the Ni2Mn1−xCuxGa alloys. It will also be interesting to explore whether other families of quaternary alloys present similar ordering sequences in order to establish if it is a more general phenomenon and, if so, what would be the characteristics that give rise to it.
4. Conclusions
In this work, the characterization of the post-quench atomic reordering processes undergone by Ni2Mn1−xCuxGa alloys has been deepened. All the obtained results are consistent with the formulated hypothesis that proposes for these alloys an atomic ordering process additional to the B2↔L21 one, consisting of the relocation in the Mn sublattice of Cu atoms misplaced by quench in the Ni sublattice. In addition, the results suggest that the ordering of the Cu atoms and the L21 ordering can occur in different sequences depending on the starting state of order.
Likewise, the analysis of the saturation magnetization validates that after quenching two types of atomic movements take place consecutively, of which only one involves diffusion of Mn. The saturation magnetization values obtained have been compared with those calculated for different atomic configurations, corroborating the relocation mechanism of Cu atoms that constitutes the working hypothesis.
Additionally, the effect of the quenching temperature on the reordering processes has been studied; an assessment of the degree of quenched disorder is provided, suggesting the existence of an order–disorder transition around 770 K associated with the ordering of Cu atoms.
Finally, the effect of the amount of Cu has been analyzed, confirming that a greater amount of Cu naturally intensifies the process associated to ordering of Cu atoms, which, by the way, takes place even in martensite. This is an unprecedented observation, as it has always been assumed that diffusion-related post-quench atomic reordering only takes place in austenite.
Funding
This research was supported by Spanish Ministerio de Ciencia, Innovación y Universidades—Agencia Estatal de Investigación (MCIN/AEI/ 10.13039/501100011033/) and Fondo Europeo de Desarrollo Regional (“FEDER Una manera de hacer Europa”, EU), Project RTI 2018-094683-B-C51.
Data Availability Statement
The data presented in this study are available on request from the corresponding author.
Acknowledgments
The author warmly thanks P. Lázpita for her help in performing the magnetic measurements. These measurements have been carried out at the General Research Services of the UPV/EHU (SGiker UPV/EHU/FEDER, EU) to which the author is grateful for the technical and human support.
Conflicts of Interest
The author declares no conflict of interest.
References
- O’Handley, R.C.; Murray, S.J.; Marioni, M.; Nembach, H.; Allen, S.M. Phenomenology of giant magnetic-field-induced strain in ferromagnetic shape-memory materials. J. Appl. Phys. 2000, 87, 4712. [Google Scholar] [CrossRef]
- Webster, P.J.; Ziebeck, K.R.A.; Town, S.L.; Peak, M.S. Magnetic order and phase transformation in Ni2MnGa. Philos. Mag. B 1984, 49, 295–310. [Google Scholar] [CrossRef]
- Planes, A.; Mañosa, L.; Acet, M. Magnetocaloric effect, its relation to shape-memory properties in ferromagnetic Heusler alloys. J. Phys. Condens. Matter 2009, 21, 233201. [Google Scholar] [CrossRef] [PubMed]
- Kataoka, M.; Endo, K.; Kudo, N.; Kanomata, T.; Nishihara, H.; Shishido, T.; Umetsu, R.Y.; Nagasako, M.; Kainuma, R. Martensitic transition, ferromagnetic transition, and their interplay in the shape memory alloys Ni2Mn1−xCuxGa. Phys. Rev. B 2010, 82, 214423. [Google Scholar] [CrossRef]
- Seguí, C.; Torrens-Serra, J.; Cesari, E.; Lázpita, P. Optimizing the Caloric Properties of Cu-Doped Ni–Mn–Ga Alloys. Materials 2020, 13, 419. [Google Scholar] [CrossRef]
- Kanomata, T.; Nozawa, T.; Kikuchi, D.; Nishihara, H.; Koyama, K.; Watanabe, K. Magnetic properties of ferromagnetic shape memory alloys Ni2−xCuxMnGa. Int. J. Appl. Electromagn. Mech. 2005, 21, 151–157. [Google Scholar] [CrossRef]
- Khovailo, V.V.; Takagi, T.; Vasilev, A.N.; Miki, H.; Matsumoto, M.; Kainuma, R. On Order–Disorder (L21→B2′) Phase Transition in Ni2+xMn1—xGa Heusler Alloys. Phys. Status Solidi 2001, 183, R1. [Google Scholar] [CrossRef]
- Sánchez-Alarcos, V.; Recarte, V.; Pérez-Landazábal, J.I.; Cuello, G.J. Correlation between atomic order and the characteristics of the structural and magnetic transformations in Ni–Mn–Ga shape memory alloys. Acta Mater. 2007, 55, 3883. [Google Scholar] [CrossRef]
- Recarte, V.; Pérez-Landazábal, J.I.; Sánchez-Alarcos, V.; Rodríguez-Velamazán, J.A. Dependence of the martensitic transformation and magnetic transition on the atomic order in Ni-Mn-In Metamagnetic Shape Memory Alloys. Acta Mater. 2012, 60, 1937–1945. [Google Scholar] [CrossRef]
- Sanchez-Alarcos, V.; Perez-Landazabal, J.I.; Recarte, V.; Lucia, I.; Velez, J.; Rodriguez-Velamazan, J.A. Effect of high temperature quenching on the magnetostructural transformations and the long-range atomic order of Ni–Mn–Sn and Ni–Mn–Sb metamagnetic shape memory alloys. Acta Mater. 2013, 61, 4676–4682. [Google Scholar] [CrossRef]
- Seguí, C.; Cesari, E. Composition and atomic order effects on the structural and magnetic transformations in ferromagnetic Ni-Co-Mn-Ga shape memory alloys. J. Appl. Phys. 2012, 111, 043914. [Google Scholar] [CrossRef]
- Seguí, C. Effects of the interplay between atomic and magnetic order on the properties of metamagnetic Ni-Co-Mn-Ga shape memory alloys. J. Appl. Phys. 2014, 115, 113903. [Google Scholar] [CrossRef]
- Overholser, R.W.; Wuttig, M.; Neumann, D.A. Chemical Ordering in Ni-Mn-Ga Heusler Alloys. Scr. Mater. 1999, 40, 1095–1102. [Google Scholar] [CrossRef]
- Sanchez-Alarcos, V.; Recarte, V.; Perez-Landazabal, J.I.; Cesari, E.; Rodriguez-Velamazan, J.A. Long-range atomic order and entropy change at the martensitic transformation in a Ni–Mn–In–Co metamagnetic shape memory alloy. Entropy 2016, 16, 2756–2767. [Google Scholar] [CrossRef]
- Tsuchiya, K.; Ohtoyo, D.; Umemoto, M.H.; Ohtsuka, H. Effect of Isothermal Aging on Martensitic Transformations in Ni-Mn-Ga Alloy. Trans. Mater. Res. Soc. Japan 2000, 25, 521–524. [Google Scholar]
- Richard, M.L.; Feuchtwanger, J.; Allen, S.M.; O’handley, R.C.; Lázpita, P.; Barandiaran, J.M.; Gutierrez, J.; Ouladdiaf, B.; Mondelli, C.; Lograsso, T.; et al. Chemical order in off-stoichiometric Ni–Mn–Ga ferromagnetic shape-memory alloys studied with neutron diffraction. Philos. Mag. 2007, 87, 3437. [Google Scholar] [CrossRef]
- Soto-Parra, D.E.; Moya, X.; Mañosa, L.; Planes, A.; Flores-Zúñiga, H.; Alvarado-Hernández, F.; Ochoa-Gamboa, R.A.; Matutes-Aquino, J.A.; Ríos-Jara, D. Fe and Co selective substitution in Ni2MnGa: Effect of magnetism on relative phase stability. Philos. Mag. 2010, 90, 2771–2792. [Google Scholar] [CrossRef]
- Segui, C.; Cesari, E. Ordering mechanisms and kinetics in Ni2Mn1−xCuxGa ferromagnetic shape memory alloys. J. Alloys Compd. 2021, 887, 161302. [Google Scholar] [CrossRef]
- Seguí, C. Kinetics of Reordering in Quenched Ni2Mn0.8Cu0.2Ga Ferromagnetic Shape Memory Alloys. Metals 2022, 12, 738. [Google Scholar] [CrossRef]
- Kuz’min, M.D. Shape of Temperature Dependence of Spontaneous Magnetization of Ferromagnets: Quantitative Analysis. Phys. Rev. Lett. 2005, 94, 107204. [Google Scholar] [CrossRef]
- Recarte, V.; Pérez-Landazábal, J.I.; Sánchez-Alarcos, V.; Zablotskii, V.; Cesari, E.; Kustov, S. Entropy change linked to the martensitic transformation in metamagnetic shape memory alloys. Acta Mater. 2012, 60, 3168–3175. [Google Scholar] [CrossRef]
- Li, C.M.; Luo, H.B.; Hu, Q.M.; Yang, R.; Johansson, B.; Vitos, L. Site preference and elastic properties of Fe, Co and Cu doped Ni2MnGa shape memory alloys from first-principles study. Phys. Rev. B 2011, 84, 024206. [Google Scholar] [CrossRef]
- Entel, P.; Gruner, M.E.; Fähler, S.; Acet, M.; Çahır, A.; Arróyave, R.; Sahoo, S.; Duong, T.C.; Talapatra, A.; Sandratskii, L.; et al. Probing Structural and Magnetic Instabilities and Hysteresis in Heuslers by Density Functional Theory Calculations. Phys. Status Solidi B 2018, 255, 1700296. [Google Scholar] [CrossRef]
- Pelegrina, J.L.; Yawny, A.; Sade, M. Diffusive Phenomena and the Austenite/Martensite Relative Stability in Cu-Based Shape Memory Alloys. Shap. Mem. Superelasticity 2018, 4, 48–60. [Google Scholar] [CrossRef]


Publisher’s Note: MDPI stays neutral with regard to jurisdictional claims in published maps and institutional affiliations. |
© 2022 by the author. Licensee MDPI, Basel, Switzerland. This article is an open access article distributed under the terms and conditions of the Creative Commons Attribution (CC BY) license (https://creativecommons.org/licenses/by/4.0/).