
Determination of the Pressure Dependence of Raman Mode for an Alumina–Glass Pair in Hertzian Contact


Abstract
:1. Introduction
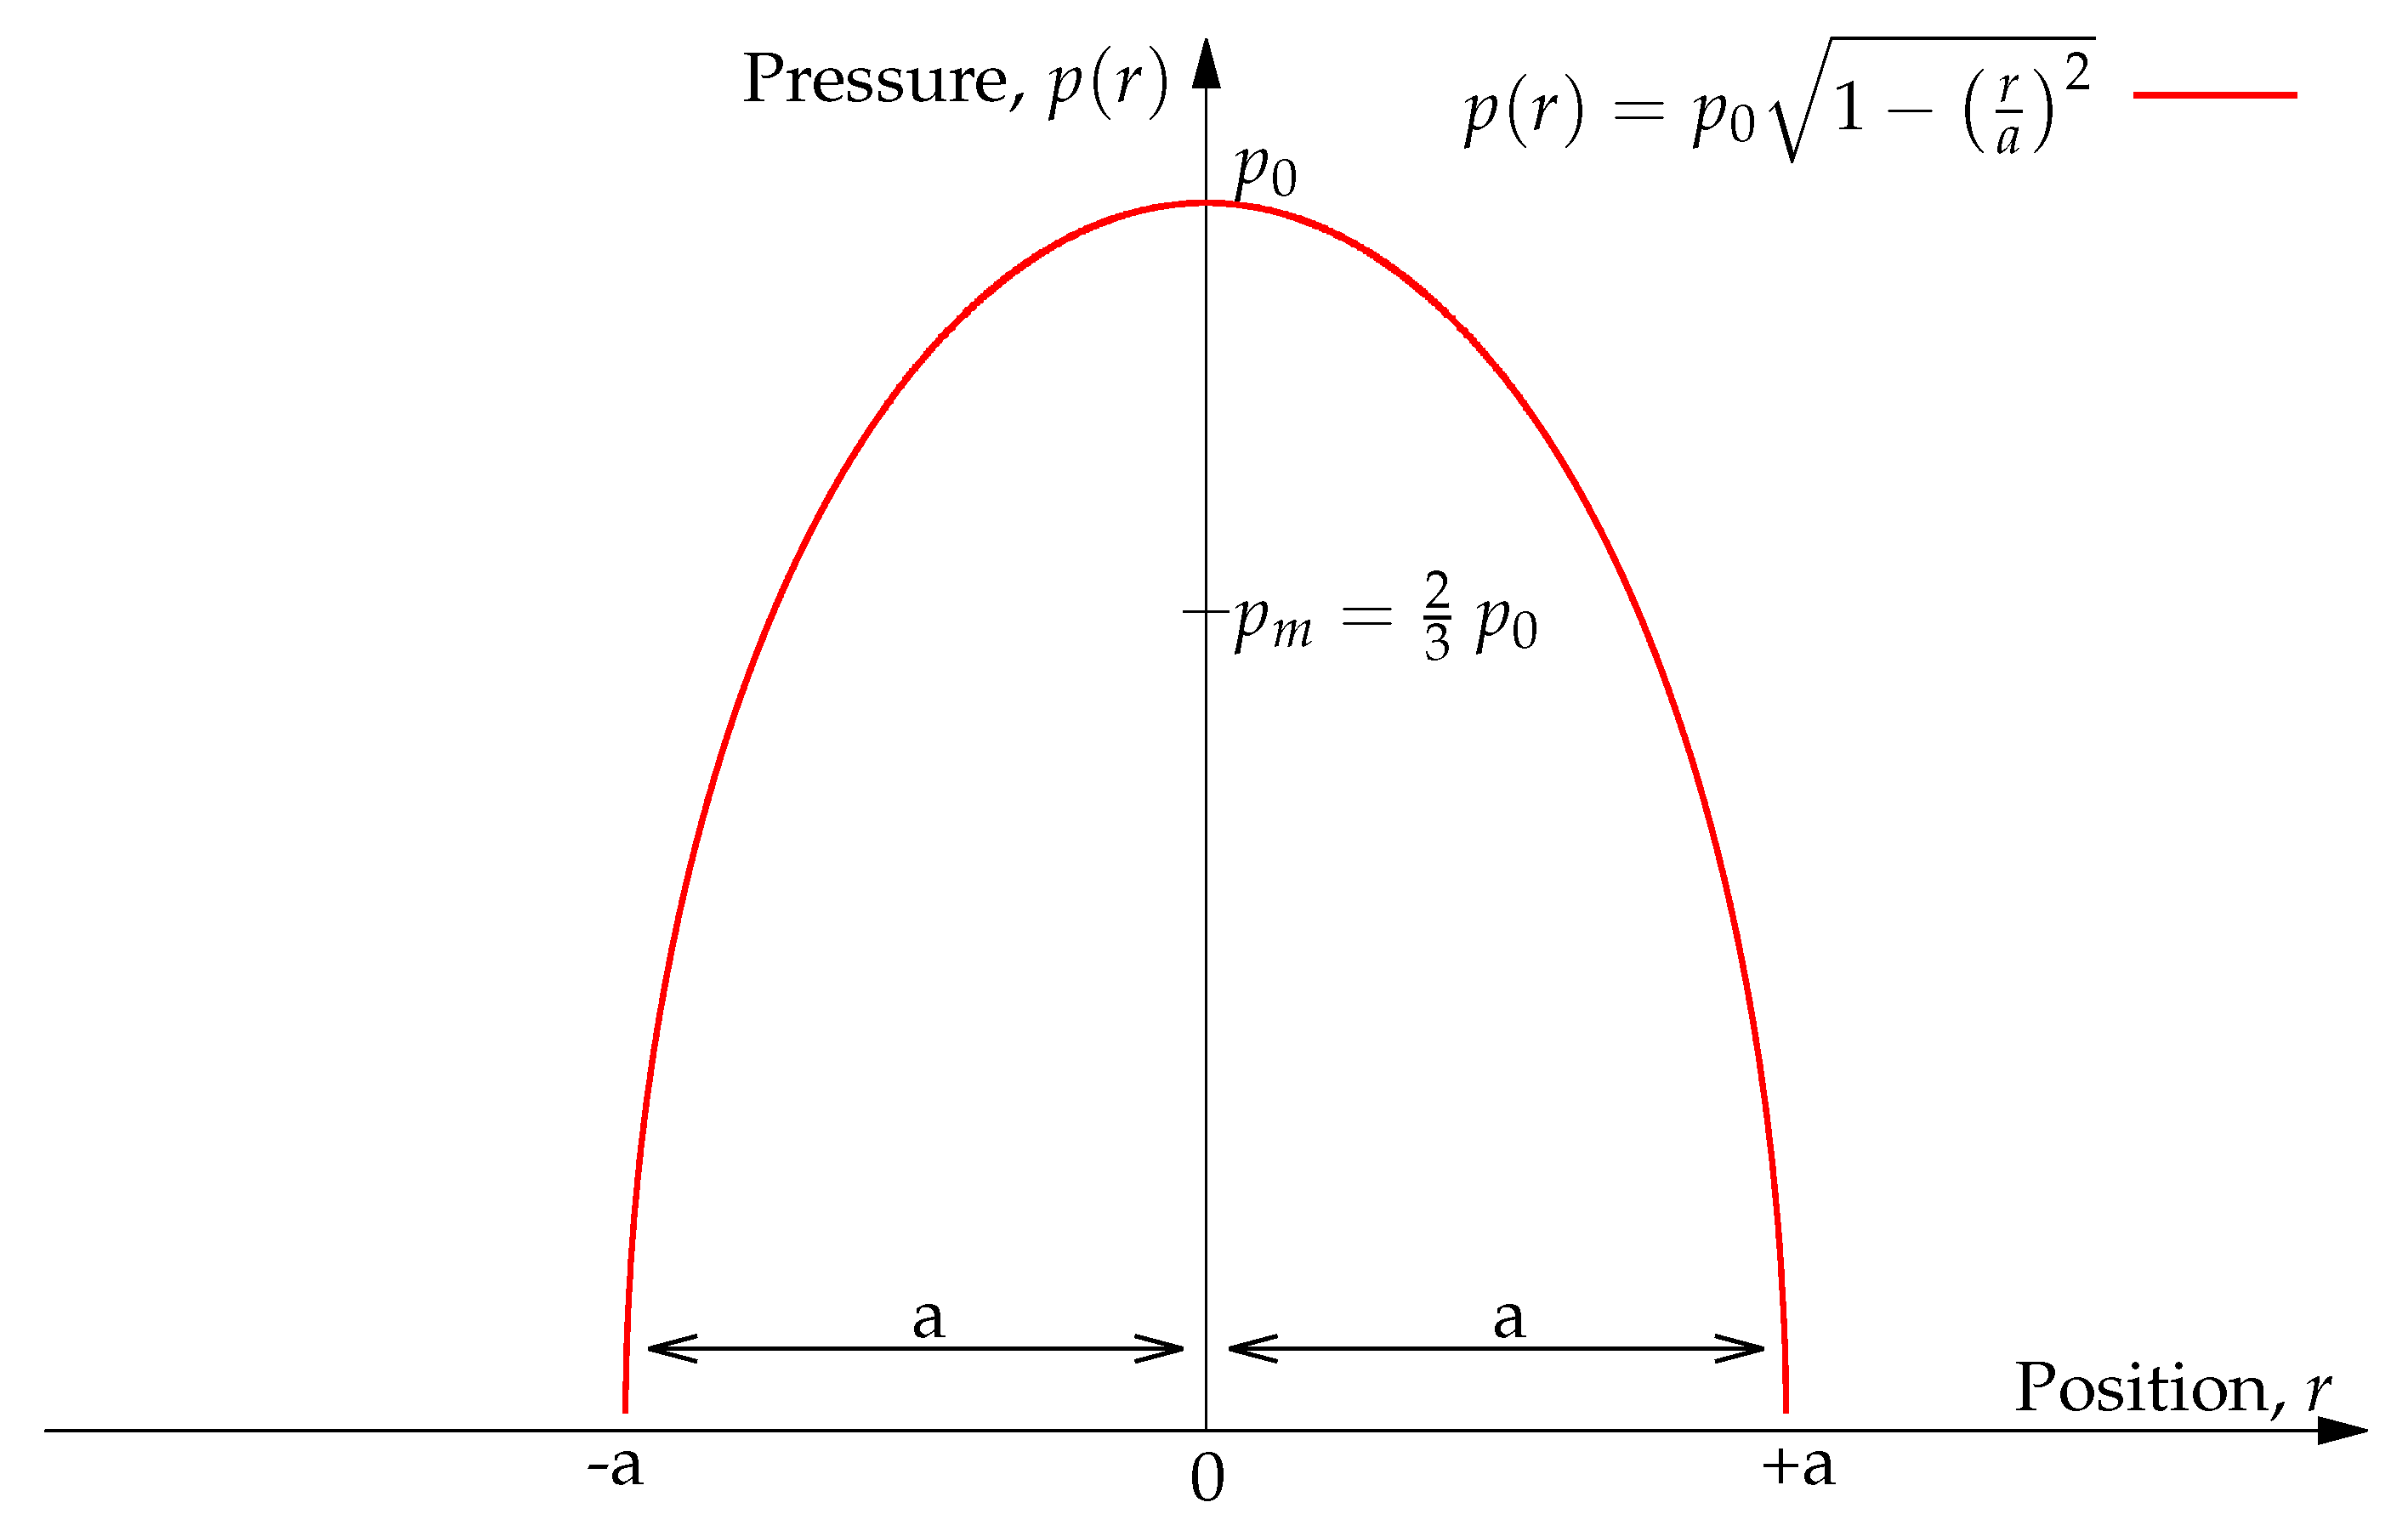
- The materials are homogeneous and elastic. They are considered semi-infinite;
- Their surfaces are continuous;
- Their geometries do not conform;
- The dimensions of the materials are large compared to the dimensions of the contact;
- There is no friction and no adhesive force.
- The boson peak is between 10 and 250 cm;
- The low-frequency region is between 250 and 700 cm;
- The intermediate region is between 700 and 850 cm;
- The high-frequency region is between 850 and 1300 cm.
2. Materials and Methods
- The spectra were truncated from 300 to 1300 cm;
- The cosmic peaks were eliminated;
- The signal-to-noise ratio was reduced by filtering;
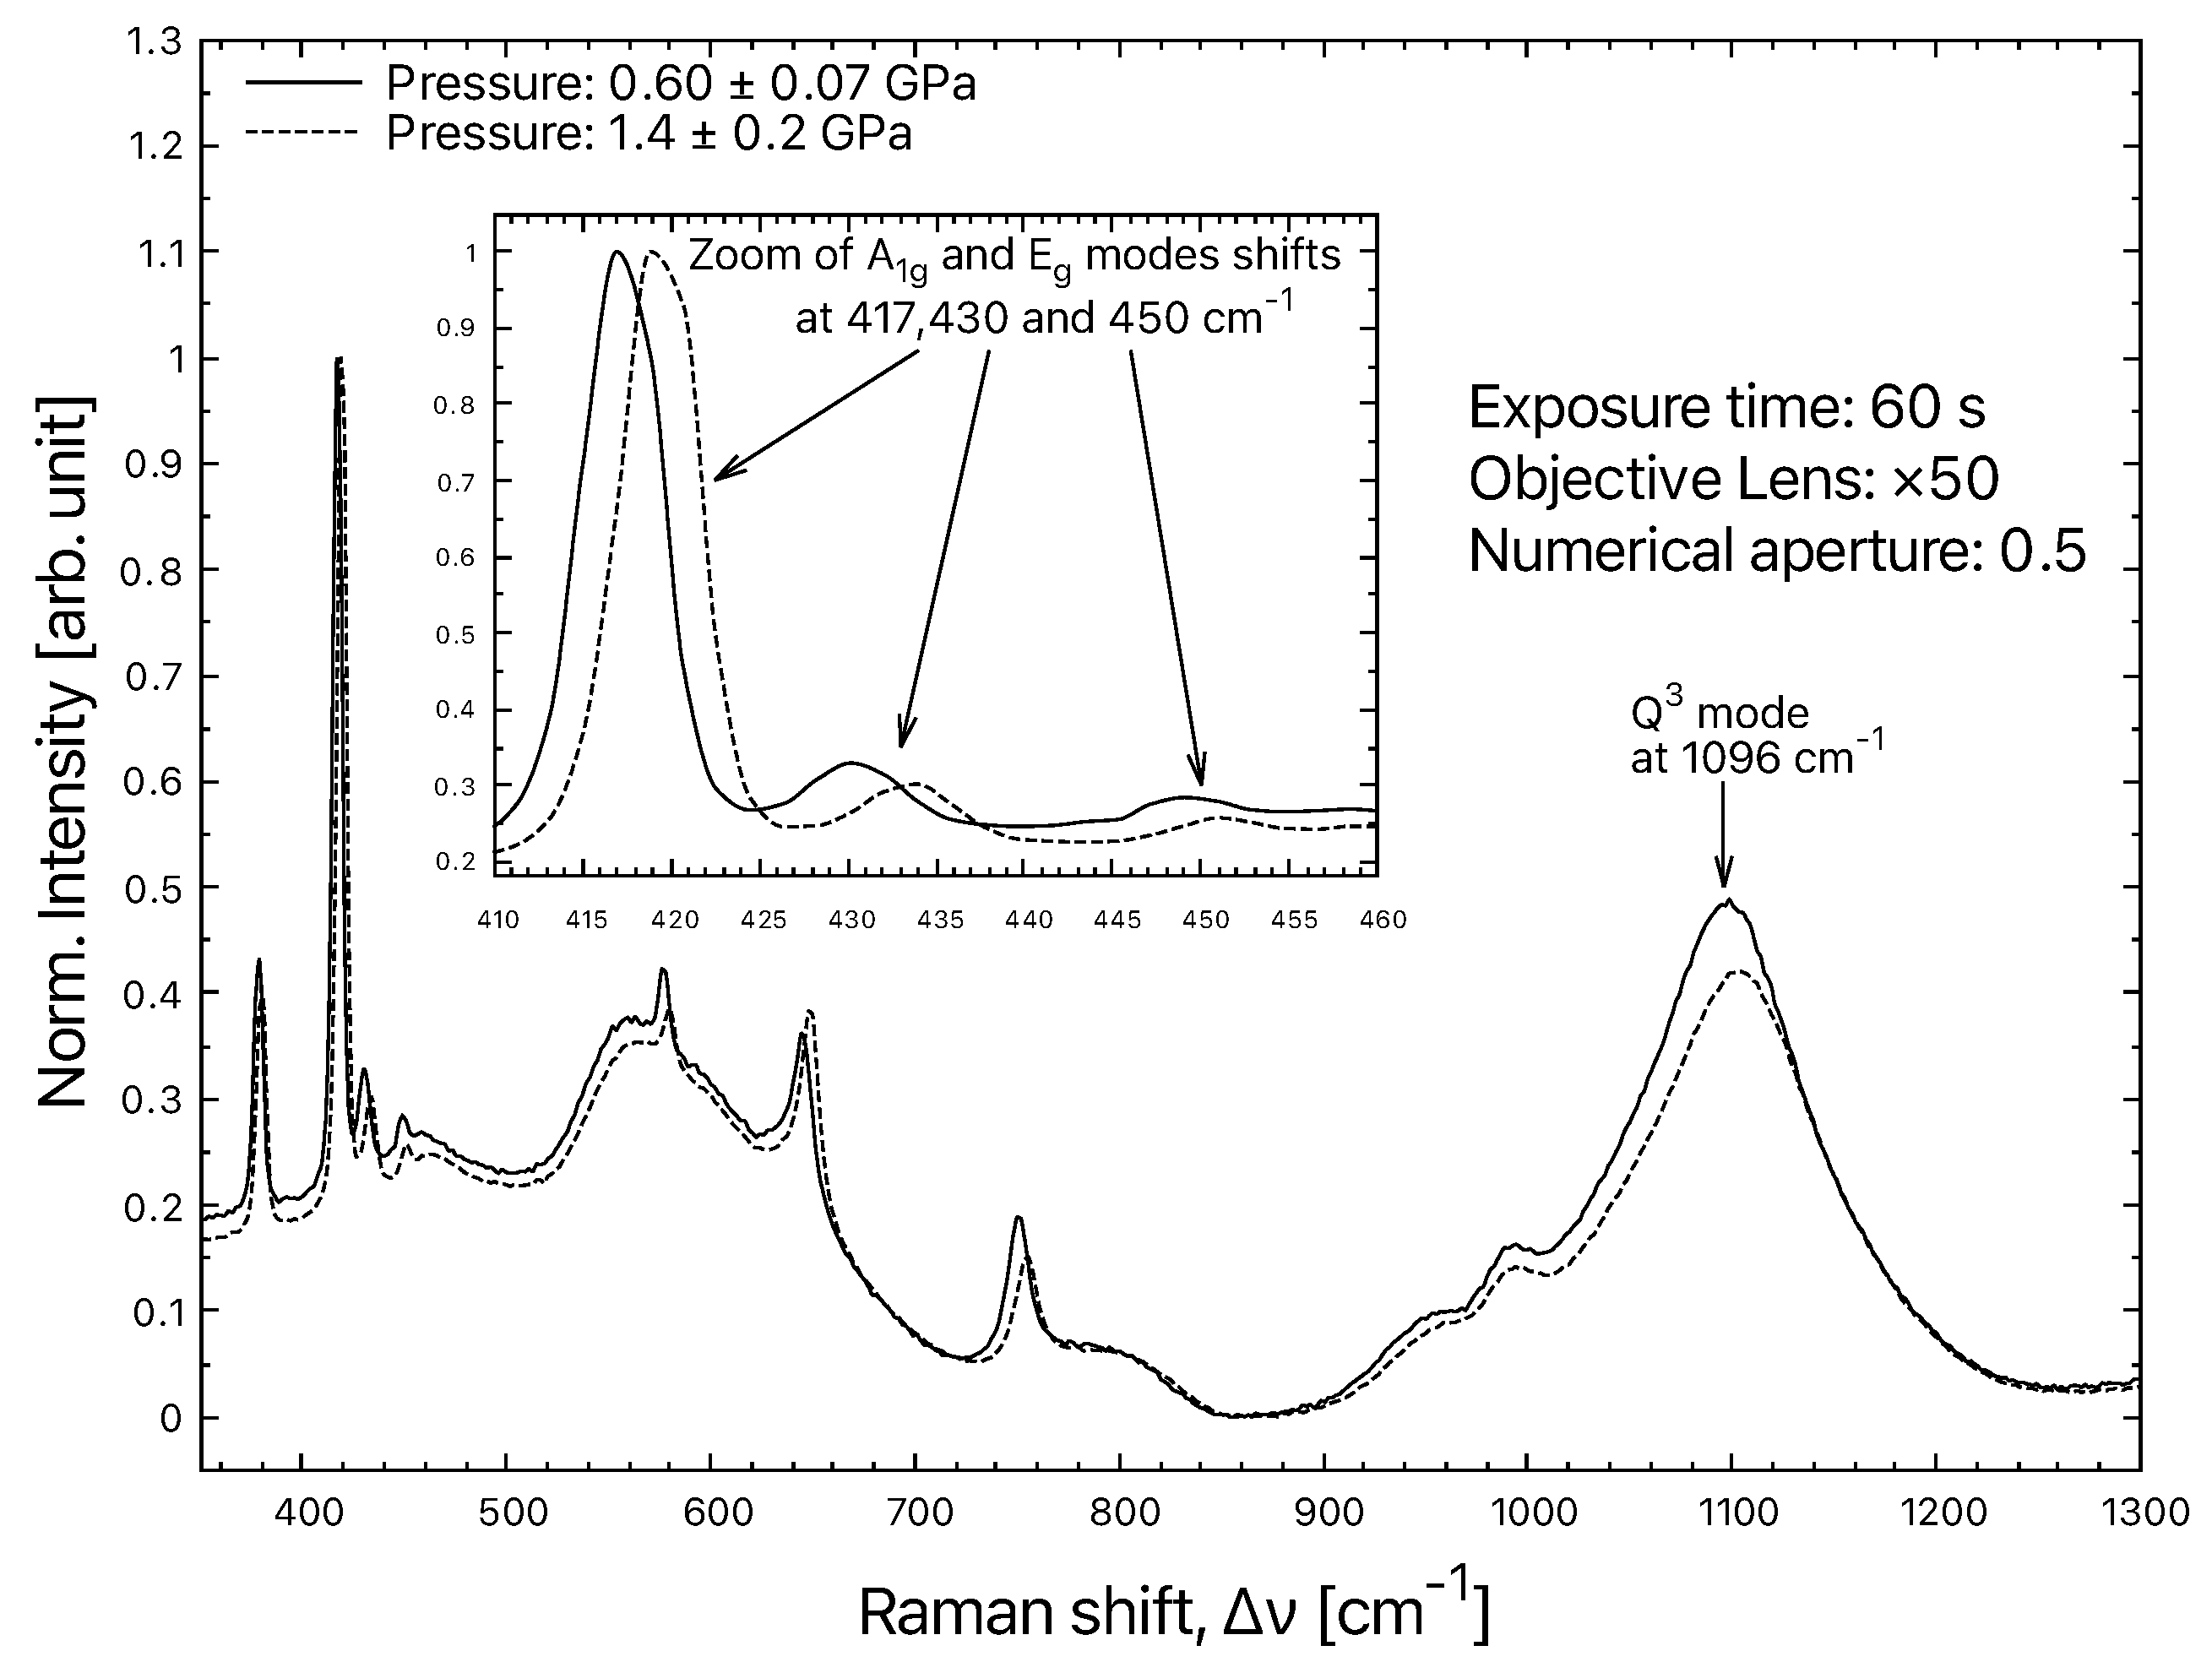
- The spectra were normalised using the strongest alumina peak at 417 cm.
3. Results
3.1. Optical Measurements
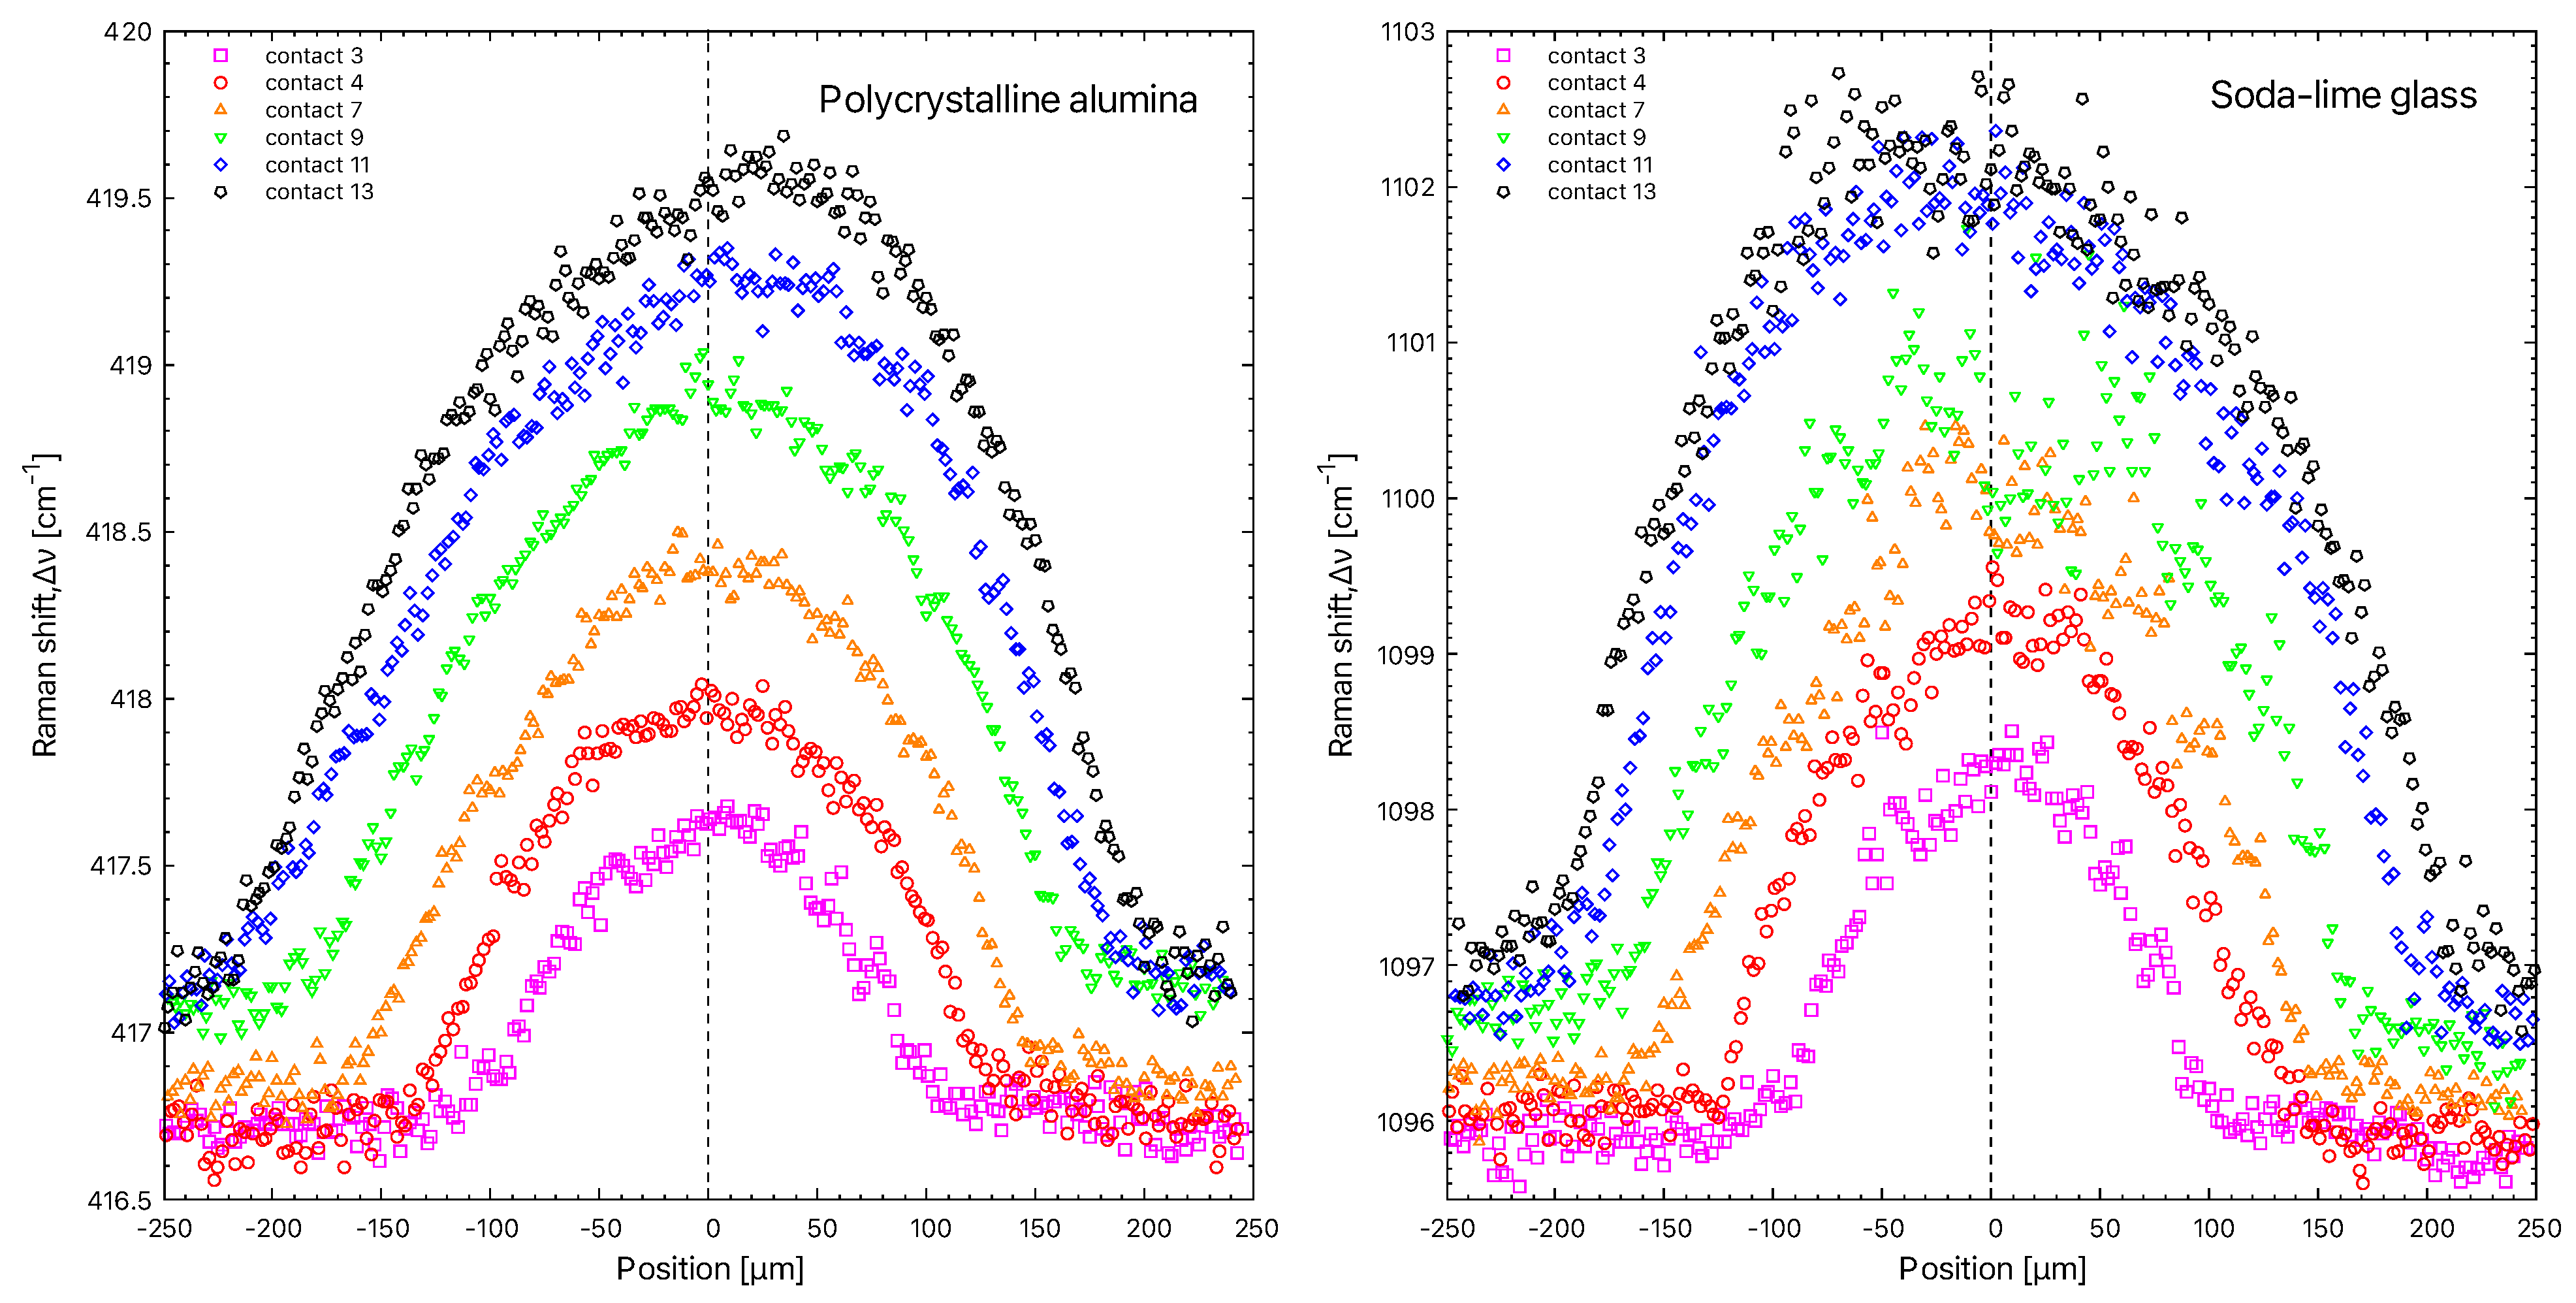
3.2. Raman Measurements
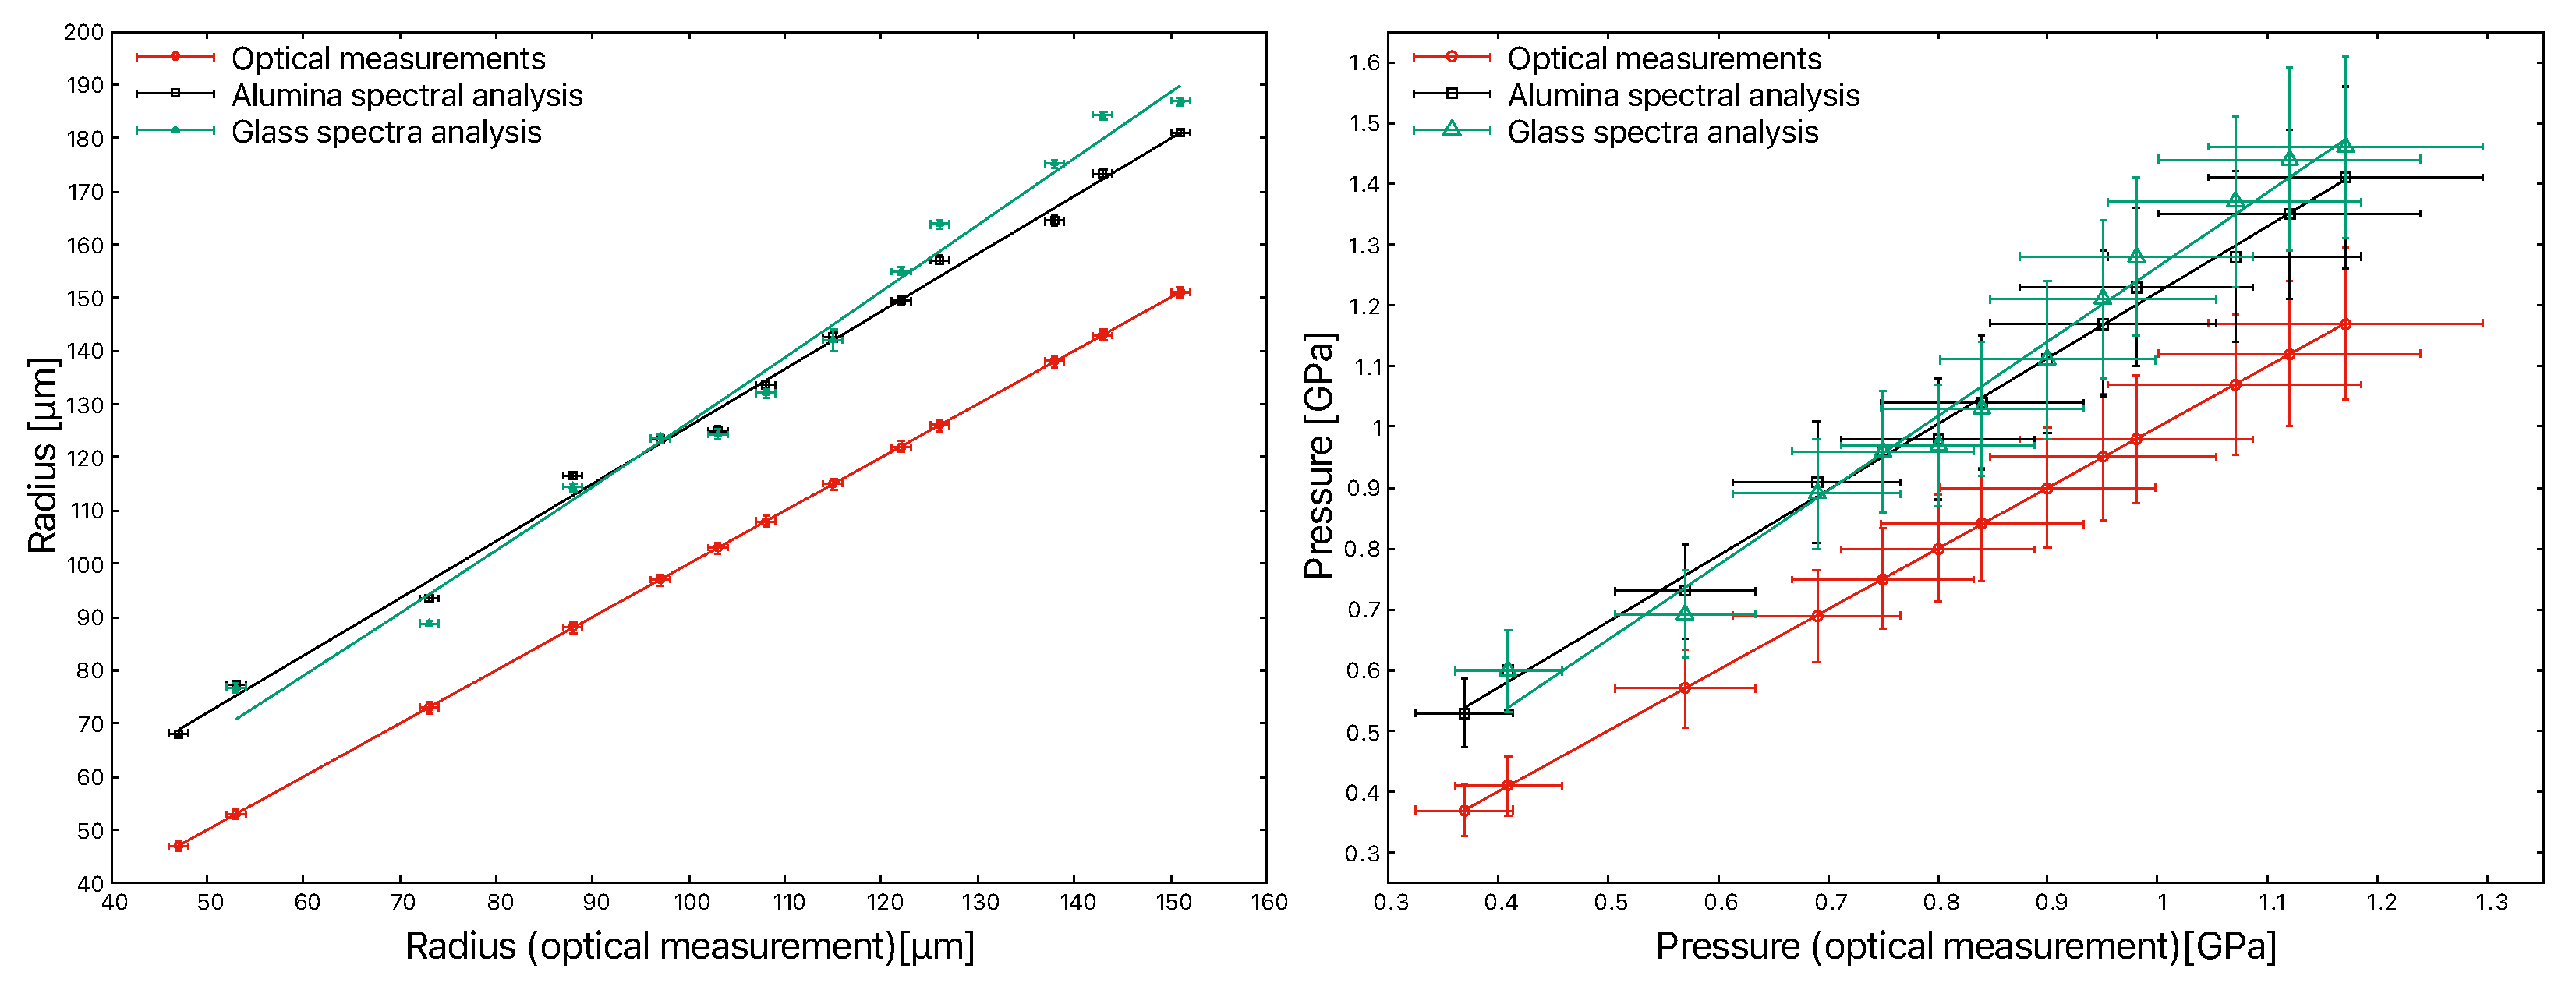
3.3. Contact Radii and Pressures
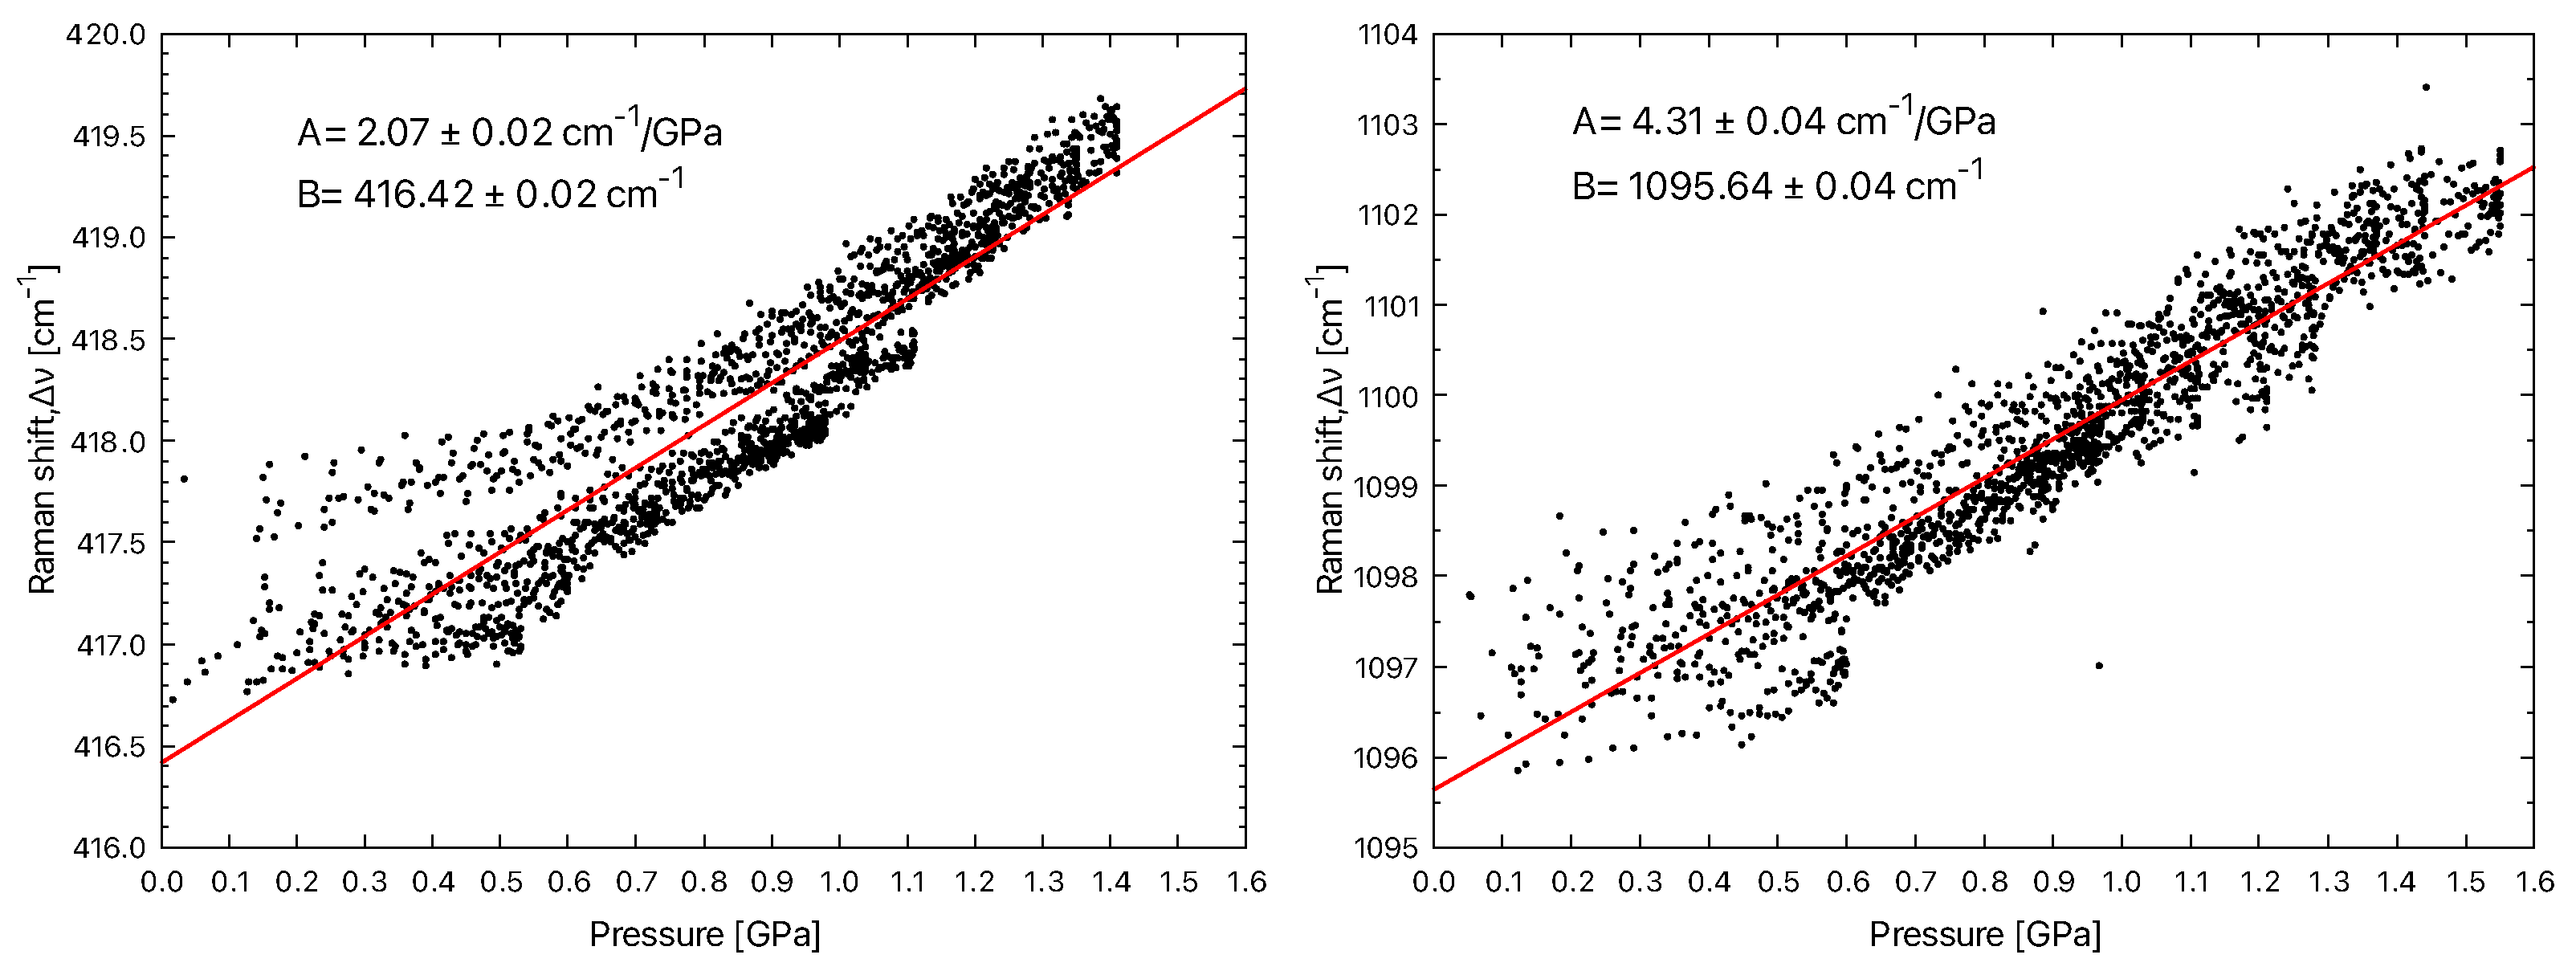
3.4. Relationship between Contact Pressure and Raman Shift
4. Discussion
Author Contributions
Funding
Data Availability Statement
Acknowledgments
Conflicts of Interest
References
- Holmberg, K.; Ronkainen, H.; Laukkanen, A.; Wallin, K.; Hogmark, S.; Jacobson, S.; Wiklund, U.; Souza, R.M.; Ståhle, P. Residual stresses in TiN, DLC and MoS2 coated surfaces with regard to their tribological fracture behaviour. Wear 2009, 267, 2142–2156. [Google Scholar] [CrossRef]
- Chen, H.; Nai, X.; Zhao, S.; Lu, D.; Shen, Z.; Li, W.; Lu, C.; Cao, J. Improvement for Ti3SiC2/Cu joint brazed using composite fillers with abnormal expansion ceramic particulates. J. Am. Ceram. Soc. 2022, 105, 3786–3796. [Google Scholar] [CrossRef]
- Meng, Y.F.; Zhu, Y.B.; Zhou, L.C.; Meng, X.S.; Yang, Y.L.; Zhao, R.; Xia, J.; Yang, B.; Lu, Y.J.; Wu, H.A.; et al. Artificial Nacre with High Toughness Amplification Factor: Residual Stress-Engineering Sparks Enhanced Extrinsic Toughening Mechanisms. Adv. Mater. 2022, 34, 2108267. [Google Scholar] [CrossRef] [PubMed]
- Jang, J.I. Estimation of residual stress by instrumented indentation: A review. J. Ceram. Process. Res. 2009, 10, 391–400. [Google Scholar]
- Novak, S.; Kalin, M.; Lukas, P.; Anné, G.; Vleugels, J.; Van der Biest, O. The effect of residual stresses in functionally graded alumina–ZTA composites on their wear and friction behaviour. J. Eur. Ceram. Soc. 2007, 27, 151–156. [Google Scholar] [CrossRef]
- Kuang, W.; Miao, Q.; Ding, W.; Li, H. A short review on the influence of mechanical machining on tribological and wear behavior of components. Int. J. Adv. Manuf. Technol. 2022, 120, 1401–1413. [Google Scholar] [CrossRef]
- Wang, S.; Yan, F.; Chen, A. Tribological effects of laser surface texturing and residual stress. Ind. Lubr. Tribol. 2018, 70, 126–132. [Google Scholar] [CrossRef]
- Laera, A.M.; Massaro, M.; Dimaio, D.; Vencl, A.; Rizzo, A. Residual Stress and Tribological Performance of ZrN Coatings Produced by Reactive Bipolar Pulsed Magnetron Sputtering. Materials 2021, 14, 6462. [Google Scholar] [CrossRef]
- Serbena, F.C.; Zanotto, E.D. Internal residual stresses in glass-ceramics: A review. J. Non Cryst. Solids 2012, 358, 975–984. [Google Scholar] [CrossRef]
- Lavigne, O.; Luzin, V.; Labonne, M.; Missiaen, J.M. Neutron diffraction characterizations of NbC-Ni cemented carbides thermal residual stresses. Int. J. Refract. Met. Hard Mater. 2022, 109, 105966. [Google Scholar] [CrossRef]
- Suresh, S.; Giannakopoulos, A.E. A new method for estimating residual stresses by instrumented sharp indentation. Acta Mater. 1998, 46, 5755–5767. [Google Scholar] [CrossRef]
- Pezzotti, G.; Sbaizero, O.; Sergo, V.; Muraki, N.; Maruyama, K.; Nishida, T. In situ measurements of frictional bridging stresses in alumina using fluorescence spectroscopy. J. Am. Ceram. Soc. 1998, 81, 187–192. [Google Scholar] [CrossRef]
- Teixeira, V.; Andritschky, M.; Fischer, W.; Buchkremer, H.P.; Stöver, D. Analysis of residual stresses in thermal barrier coatings. J. Mater. Process. Technol. 1999, 92, 209–216. [Google Scholar] [CrossRef]
- Schlichting, K.W.; Vaidyanathan, K.; Sohn, Y.H.; Jordan, E.H.; Gell, M.; Padture, N.P. Application of Cr3+ photoluminescence piezo-spectroscopy to plasma-sprayed thermal barrier coatings for residual stress measurement. Mater. Sci. Eng. A 2000, 291, 68–77. [Google Scholar] [CrossRef]
- Wang, X.; Wu, R.T.; Atkinson, A. Characterisation of residual stress and interface degradation in TBCs by photo-luminescence piezo-spectroscopy. Surf. Coatings Technol. 2000, 204, 2472–2482. [Google Scholar] [CrossRef]
- Cui, Y.; Guo, M.; Wang, C.; Tang, Z.; Cheng, L. Evolution of the residual stress in porous ceramic abradable coatings under thermal exposure. Surf. Coatings Technol. 2020, 394, 125915. [Google Scholar] [CrossRef]
- Chen, X.; Cheng, G.; Yang, J.; Hu, J.; Liao, C.; Zhang, X.; Dong, S. Effects of interfacial residual stress on mechanical behavior of SiCf/SiC composites. J. Adv. Ceram. 2022, 11, 94–104. [Google Scholar] [CrossRef]
- Wang, F.; Chen, X.; DeLellis, D.P.; Krause, A.R.; Lu, Y.; Cui, B. Microstructures and mechanical properties of α-SiC ceramics after high-temperature laser shock peening. J. Am. Ceram. Soc. 2022, 105, 2411–2420. [Google Scholar] [CrossRef]
- Ghaemi, M.H.; Reichert, S.; Krupa, A.; Sawczak, M.; Zykova, A.; Lobach, K.; Sayenko, S.; Svitlychnyi, Y. Zirconia ceramics with additions of Alumina for advanced tribological and biomedical applications. Ceram. Int. 2017, 43, 9746–9752. [Google Scholar] [CrossRef]
- Kadam, N.; Karthikeyan, G.; Kulkarni, D.; Jagtap, P. Microstructural Characterization, Residual Stress, and Mechanical Properties of Plasma Sprayed 8YSZ Thermal Barrier Coatings. Tribol. Ind. 2022, 44, 230. [Google Scholar] [CrossRef]
- Gouadec, G.; Colomban, P. Raman Spectroscopy of nanomaterials: How spectra relate to disorder, particle size and mechanical properties. Prog. Cryst. Growth Charact. Mater. 2007, 53, 1–56. [Google Scholar]
- Noguchi, N.; Abduriyim, A.; Shimizu, I.; Kamegata, N.; Odake, S.; Kagi, H. Imaging of internal stress around a mineral inclusion in a sapphire crystal: Application of micro-Raman and photoluminescence spectroscopy. J. Raman Spectrosc. 2012, 44, 147–154. [Google Scholar] [CrossRef]
- Kimachi, H.; Yamamoto, S.; Ota, W.; Shirakihara, K.; Fujita, Y. Measurement of local stress components in single crystal alumina by using Raman microspectroscopy with sub-micro spatial resolution. Zair. Soc. Mater. Sci. Jpn. 2009, 58, 603–609. [Google Scholar] [CrossRef] [Green Version]
- Pezzotti, G.; Zhu, W. Resolving stress tensor components in space from polarized Raman spectra: Polycrystalline alumina. Phys. Chem. Chem. Phys. 2015, 17, 2608–2627. [Google Scholar] [CrossRef]
- Akatsu, T.; Unno, M.; Fujisawa, T. Prestress in alumina-strengthened porcelain as estimated with Raman scattering spectroscopy. J. Ceram. Soc. Jpn. 2021, 129, 267–270. [Google Scholar] [CrossRef]
- Hanfland, M.; Syassen, K.; Fahy, S.; Louie, S.G.; Cohen, M.L. Pressure dependence of the first-order Raman mode in diamond. Phys. Rev. B 1985, 31, 6896. [Google Scholar] [CrossRef]
- Gallas, M.R.; Chu, Y.C.; Piermarini, G.J. Calibration of the Raman effect in α–Al2O3 ceramic for residual stress measurements. J. Mater. Res. 1995, 10, 2817–2822. [Google Scholar] [CrossRef]
- Johnson, K.L. Contact Mechanics, 1st ed.; Cambridge University Press: Cambridge, UK, 1985; pp. 84–106. [Google Scholar]
- Krishnan, R.S. Raman spectrum of alumina and the luminescence and absorption spectra of ruby. Nature 1947, 160, 26. [Google Scholar] [CrossRef]
- Krishnan, R.S. Raman spectrum of alumina and the luminescence of ruby. Proc. Indian Acad. Sci. Sect. A 1947, 26, 450–459. [Google Scholar] [CrossRef]
- Porto, S.P.S.; Krishnan, R.S. Raman effect of corundum. J. Chem. Phys. 1967, 47, 1009–1012. [Google Scholar] [CrossRef]
- Watson, G.H., Jr.; Daniels, W.B.; Wang, C.S. Measurements of Raman intensities and pressure dependence of phonon frequencies in sapphire. J. Appl. Phys. 1981, 52, 956–958. [Google Scholar] [CrossRef]
- Jia, W.; Yen, W.M. Raman scattering from sapphire fibers. J. Raman Spectrosc. 1989, 20, 785–788. [Google Scholar] [CrossRef]
- Brawer, S.A.; White, W.B. Raman spectroscopic investigation of the structure of silicate glasses. I. The binary alkali silicates. J. Chem. Phys. 1975, 63, 2421–2432. [Google Scholar] [CrossRef]
- Scholze, H. New possibilities for variation of glass structure. J. Non Cryst. Solids 1985, 73, 669–680. [Google Scholar] [CrossRef]
- Sprenger, D.; Bach, H.; Meisel, W.; Gütlich, P. Discrete bond model (DBM) of sodium silicate glasses derived from XPS, Raman and NMR measurements. J. Non Cryst. Solids 1993, 159, 187–203. [Google Scholar] [CrossRef]
- Bach, H. Advanced surface analysis of silicate glasses, oxides and other insulating materials: A review. J. Non Cryst. Solids 1997, 209, 1–18. [Google Scholar] [CrossRef]
- Matson, D.W.; Sharma, S.K.; Philpotts, J.A. The structure of high-silica alkali-silicate glasses. A Raman spectroscopic investigation. J. Non Cryst. Solids 1983, 58, 323–352. [Google Scholar] [CrossRef]
- Haiyan, C.; Guosong, H.; Hanfen, M.; Fuxi, G. Structure and Raman spectra of glasses containing several glass-forming oxides and no glass-modifying oxide. J. Non Cryst. Solids 1986, 80, 152–159. [Google Scholar] [CrossRef]
- Park, J.H. Structure–property correlations of CaO–SiO2–MnO slag derived from Raman spectroscopy. ISIJ Int. 2012, 52, 1627–1636. [Google Scholar] [CrossRef] [Green Version]
- Woelffel, W.; Claireaux, C.; Toplis, M.J.; Burov, E.; Barthel, E.; Shukla, A.; Biscaras, J.; Chopinet, M.H.; Gouillart, E. Analysis of soda-lime glasses using non-negative matrix factor deconvolution of Raman spectra. J. Non Cryst. Solids 2015, 428, 121–131. [Google Scholar] [CrossRef] [Green Version]
- Brawer, S.A.; White, W.B. Raman spectroscopic investigation of the structure of silicate glasses (II). Soda-alkaline earth-alumina ternary and quaternary glasses. J. Non Cryst. Solids 1977, 23, 261–278. [Google Scholar] [CrossRef]
- Colomban, P.; Havel, M. Raman imaging of stress-induced phase transformation in transparent ZnSe ceramic and sapphire single crystals. J. Raman Spectrosc. 2002, 33, 789–795. [Google Scholar] [CrossRef]
- Neuville, D.R.; de Ligny, D.; Henderson, G.S. Advances in Raman spectroscopy applied to earth and material sciences. Rev. Mineral. Geochem. 2014, 78, 509–541. [Google Scholar] [CrossRef]
- McMillan, P. Structural studies of silicate glasses and melts—Applications and limitations of Raman spectroscopy. Am. Mineral. 1984, 69, 622–644. [Google Scholar]
- Neuville, D.R. Viscosity, structure and mixing in (Ca, Na) silicate melts. Chem. Geol. 2006, 229, 28–41. [Google Scholar] [CrossRef]
- Galeener, F.L. Planar rings in vitreous silica. J. Non Cryst. Solids 1982, 49, 53–62. [Google Scholar] [CrossRef]
- Deschamps, T.; Martinet, C.; Bruneel, J.L.; Champagnon, B. Soda-lime silicate glass under hydrostatic pressure and indentation: A micro-Raman study. J. Phys. Condens. Matter 2011, 23, 035402. [Google Scholar] [CrossRef]
- Kassir-Bodon, A.; Deschamps, T.; Martinet, C.; Champagnon, B.; Teisseire, J.; Kermouche, G. Raman mapping of the indentation-induced densification of a soda-lime-silicate glass. Int. J. Appl. Glass Sci. 2012, 3, 29–35. [Google Scholar] [CrossRef]
- Muniz, R.F.; Baesso, M.L.; Sato, F.; Bento, A.C.; Rohling, J.H.; Medina, A.N. High pressure effect on the short-and intermediate-range structure of depolymerized soda lime silicate glass: Insights from micro-Raman spectroscopy. Vib. Spectrosc. 2020, 110, 103113. [Google Scholar] [CrossRef]
- Williams, T.; Kelley, C.; Bersch, C.; Broker, H.B.; Campbell, J.; Cunningham, R.; Denholm, D.; Elber, G.; Fearick, R.; Grammes, C.; et al. Gnuplot 5.4: An Interactive Plotting Program. 2022. Available online: http://gnuplot.sourceforge.net/ (accessed on 14 November 2022).
- Johnson, K.L.; Kendall, K.; Roberts, A. Surface energy and the contact of elastic solids. Proc. R. Soc. Lond. A Math. Phys. Sci. 1971, 324, 301–313. [Google Scholar]
- Derjaguin, B.V.; Muller, V.M.; Toporov, Y.P. Effect of contact deformations on the adhesion of particles. J. Colloid Interface Sci. 1975, 53, 314–326. [Google Scholar] [CrossRef]
- Johnson, K.L.; Greenwood, J.A. An adhesion map for the contact of elastic spheres. J. Colloid Interface Sci. 1997, 192, 326–333. [Google Scholar] [CrossRef]


| Band | FWHM | Intensity | Symmetry |
|---|---|---|---|
| (cm) | (cm) | (norm.) | or Assignment |
| 378 | 5.2 | 0.28 | E |
| 417 | 5.3 | 1 | A |
| 430 | 7.1 | 0.11 | E |
| 450 | 4.7 | 0.03 | E |
| 577 | 12.0 | 0.10 | E |
| 645 | 14.2 | 0.27 | A |
| 751 | 13.8 | 0.13 | E |
| Band | FWHM | Intensity | Symmetry |
|---|---|---|---|
| (cm) | (cm) | (norm.) | or Assignment |
| 458 | 27.5 | 0.05 | Q - Sym. strech. |
| 554 | 34.5 | 0.17 | Q - Sym. strech |
| 600 | 82.2 | 0.20 | Q - Sym. strech |
| 789 | 48.0 | 0.06 | Si oscillations |
| 939 | 35.5 | 0.06 | Q - Si-O strech. |
| 991 | 68.1 | 0.15 | Q - Si-O strech. |
| 1096 | 97.9 | 0.70 | Q - Si-O strech. |
| Contact | Radius | Max. Pressure |
|---|---|---|
| Number | in µm | in GPa |
| 1 | 47 | 0.37 ± 0.05 |
| 2 | 53 | 0.41 ± 0.05 |
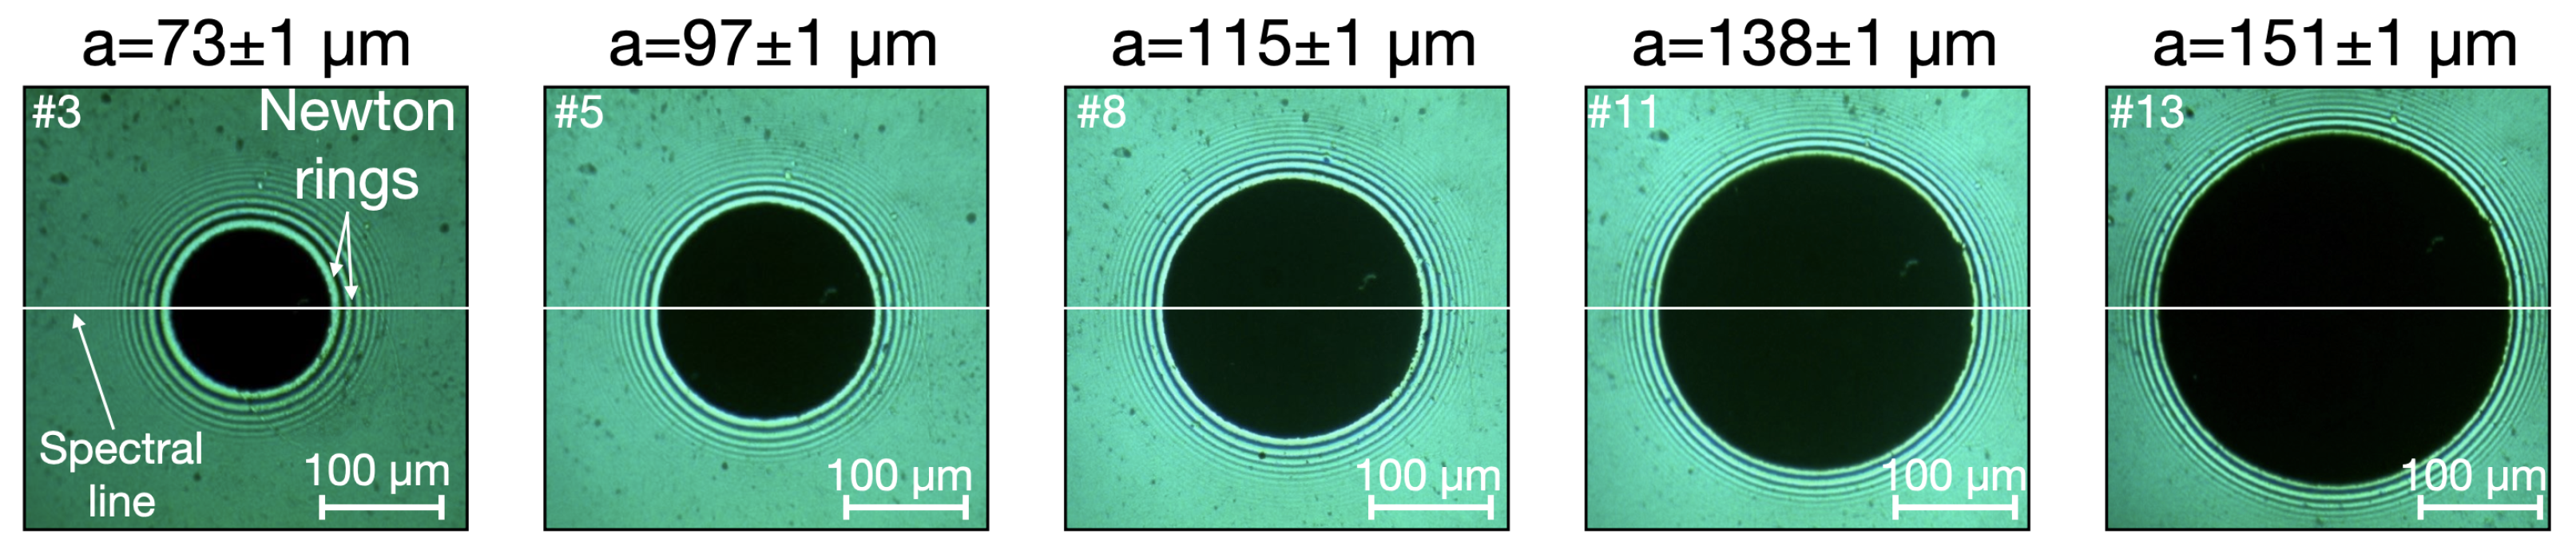
| 3 | 73 | 0.57 ± 0.07 |
| 4 | 88 | 0.69 ± 0.08 |
| 5 | 97 | 0.75 ± 0.09 |
| 6 | 103 | 0.80 ± 0.09 |
| 7 | 108 | 0.84 ± 0.10 |
| 8 | 115 | 0.90 ± 0.10 |
| 9 | 122 | 0.95 ± 0.11 |
| 10 | 126 | 0.98 ± 0.11 |
| 11 | 138 | 1.07 ± 0.12 |
| 12 | 143 | 1.12 ± 0.12 |
| 13 | 151 | 1.17 ± 0.13 |
| Polycrystalline Alumina | Soda–Lime Glass | |||||
|---|---|---|---|---|---|---|
| Contact | ||||||
| Number | in cm | in µm | in GPa | in cm | in µm | in GPa |
| 1 | 0.31 ± 0.02 | 68.0 ± 0.5 | 0.53 ± 0.06 | - | - | - |
| 2 | 0.51 ± 0.02 | 77.3 ± 0.6 | 0.60 ± 0.07 | 1.20 ± 0.02 | 76.8 ± 0.9 | 0.60 ± 0.06 |
| 3 | 0.82 ± 0.02 | 93.5 ± 0.5 | 0.73 ± 0.08 | 2.23 ± 0.03 | 88.8 ± 0.5 | 0.69 ± 0.07 |
| 4 | 1.18 ± 0.02 | 116.6 ± 0.7 | 0.91 ± 0.10 | 3.03 ± 0.04 | 114.4 ± 0.7 | 0.89 ± 0.09 |
| 5 | 1.26 ± 0.02 | 123.4 ± 0.6 | 0.96 ± 0.10 | 3.25 ± 0.02 | 123.6 ± 0.8 | 0.96 ± 0.10 |
| 6 | 1.27 ± 0.02 | 125.0 ± 0.9 | 0.98 ± 0.10 | 3.17 ± 0.05 | 124.3 ± 0.9 | 0.97 ± 0.10 |
| 7 | 1.45 ± 0.02 | 133.5 ± 0.7 | 1.04 ± 0.11 | 3.54 ± 0.04 | 132.0 ± 0.7 | 1.03 ± 0.11 |
| 8 | 1.51 ± 0.02 | 142.6 ± 0.9 | 1.11 ± 0.12 | 3.46 ± 0.12 | 142.0 ± 2.0 | 1.11 ± 0.13 |
| 9 | 1.64 ± 0.02 | 149.4 ± 0.7 | 1.17 ± 0.12 | 3.85 ± 0.06 | 155.0 ± 0.8 | 1.21 ± 0.13 |
| 10 | 1.74 ± 0.03 | 157.1 ± 0.7 | 1.23 ± 0.13 | 4.27 ± 0.05 | 163.8 ± 0.7 | 1.28 ± 0.13 |
| 11 | 1.89 ± 0.03 | 164.4 ± 0.9 | 1.28 ± 0.14 | 4.91 ± 0.05 | 175.2 ± 0.7 | 1.37 ± 0.14 |
| 12 | 2.02 ± 0.03 | 173.3 ± 0.8 | 1.35 ± 0.14 | 4.97 ± 0.06 | 184.2 ± 0.8 | 1.44 ± 0.15 |
| 13 | 2.17 ± 0.03 | 181.0 ± 0.7 | 1.41 ± 0.15 | 4.91 ± 0.06 | 186.9 ± 0.8 | 1.46 ± 0.15 |
Publisher’s Note: MDPI stays neutral with regard to jurisdictional claims in published maps and institutional affiliations. |
© 2022 by the authors. Licensee MDPI, Basel, Switzerland. This article is an open access article distributed under the terms and conditions of the Creative Commons Attribution (CC BY) license (https://creativecommons.org/licenses/by/4.0/).
Share and Cite
Delbé, K.; De Sousa, C.; Grizet, F.; Paris, J.-Y.; Yahiaoui, M. Determination of the Pressure Dependence of Raman Mode for an Alumina–Glass Pair in Hertzian Contact. Materials 2022, 15, 8645. https://doi.org/10.3390/ma15238645
Delbé K, De Sousa C, Grizet F, Paris J-Y, Yahiaoui M. Determination of the Pressure Dependence of Raman Mode for an Alumina–Glass Pair in Hertzian Contact. Materials. 2022; 15(23):8645. https://doi.org/10.3390/ma15238645
Chicago/Turabian StyleDelbé, Karl, Cyril De Sousa, François Grizet, Jean-Yves Paris, and Malik Yahiaoui. 2022. "Determination of the Pressure Dependence of Raman Mode for an Alumina–Glass Pair in Hertzian Contact" Materials 15, no. 23: 8645. https://doi.org/10.3390/ma15238645