
Deterioration of Mechanical Properties and the Damage Constitutive Model of Corroded Steel in an Industrial Environment


Abstract
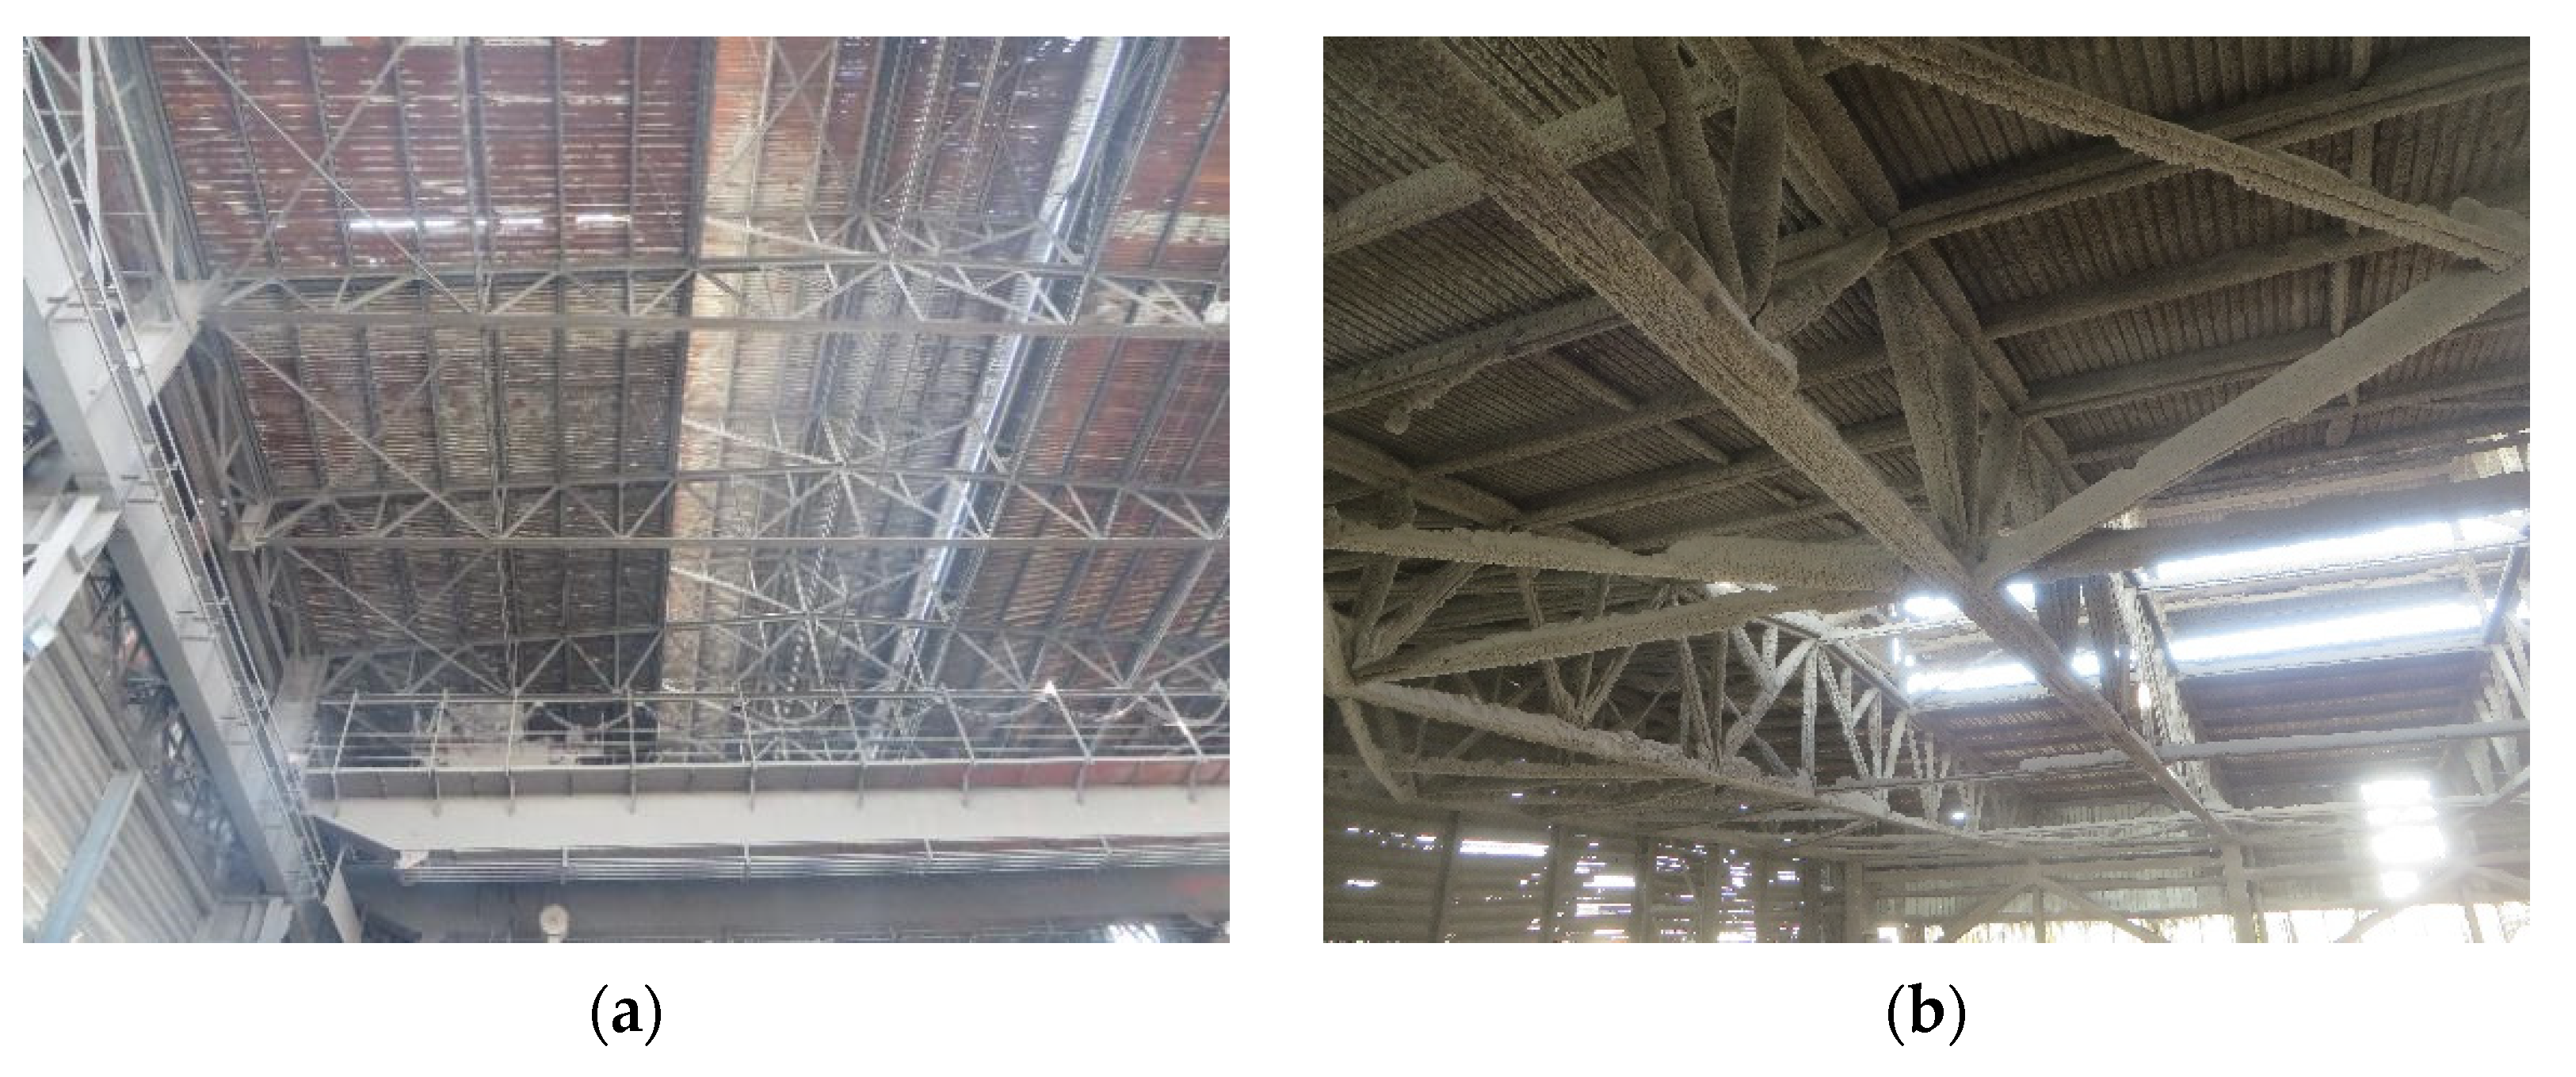
:1. Introduction
2. Experimental Methodology
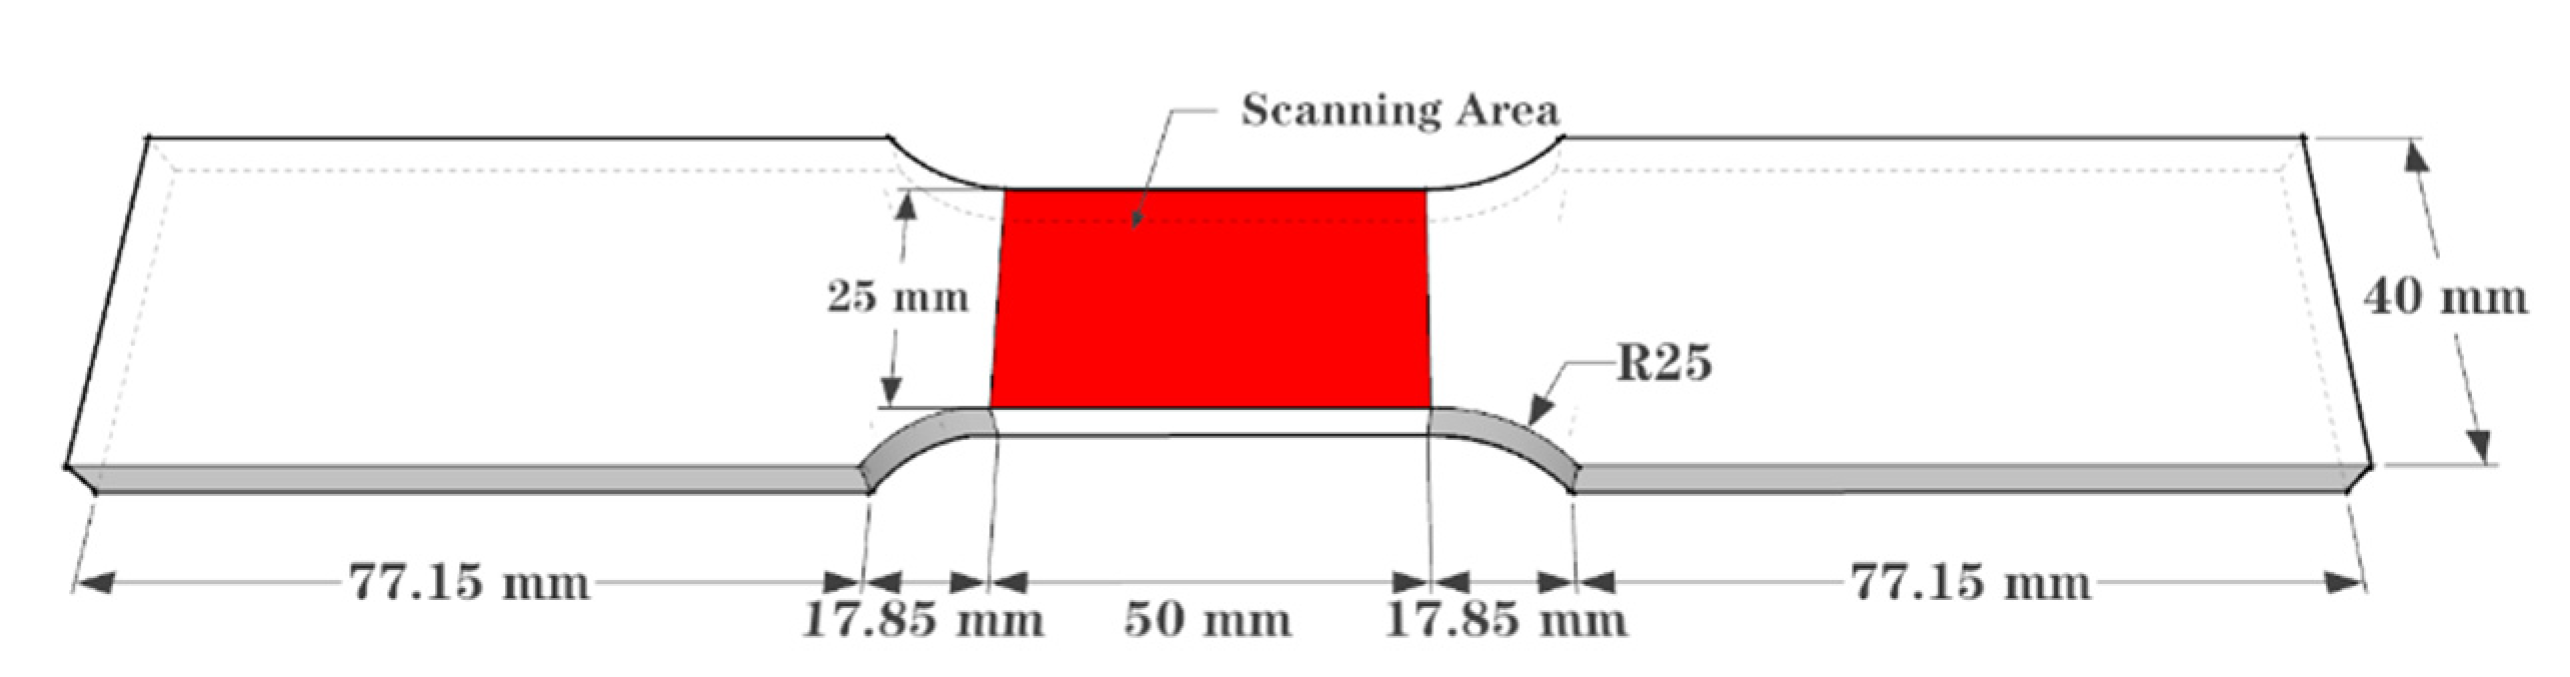
2.1. Specimen Design
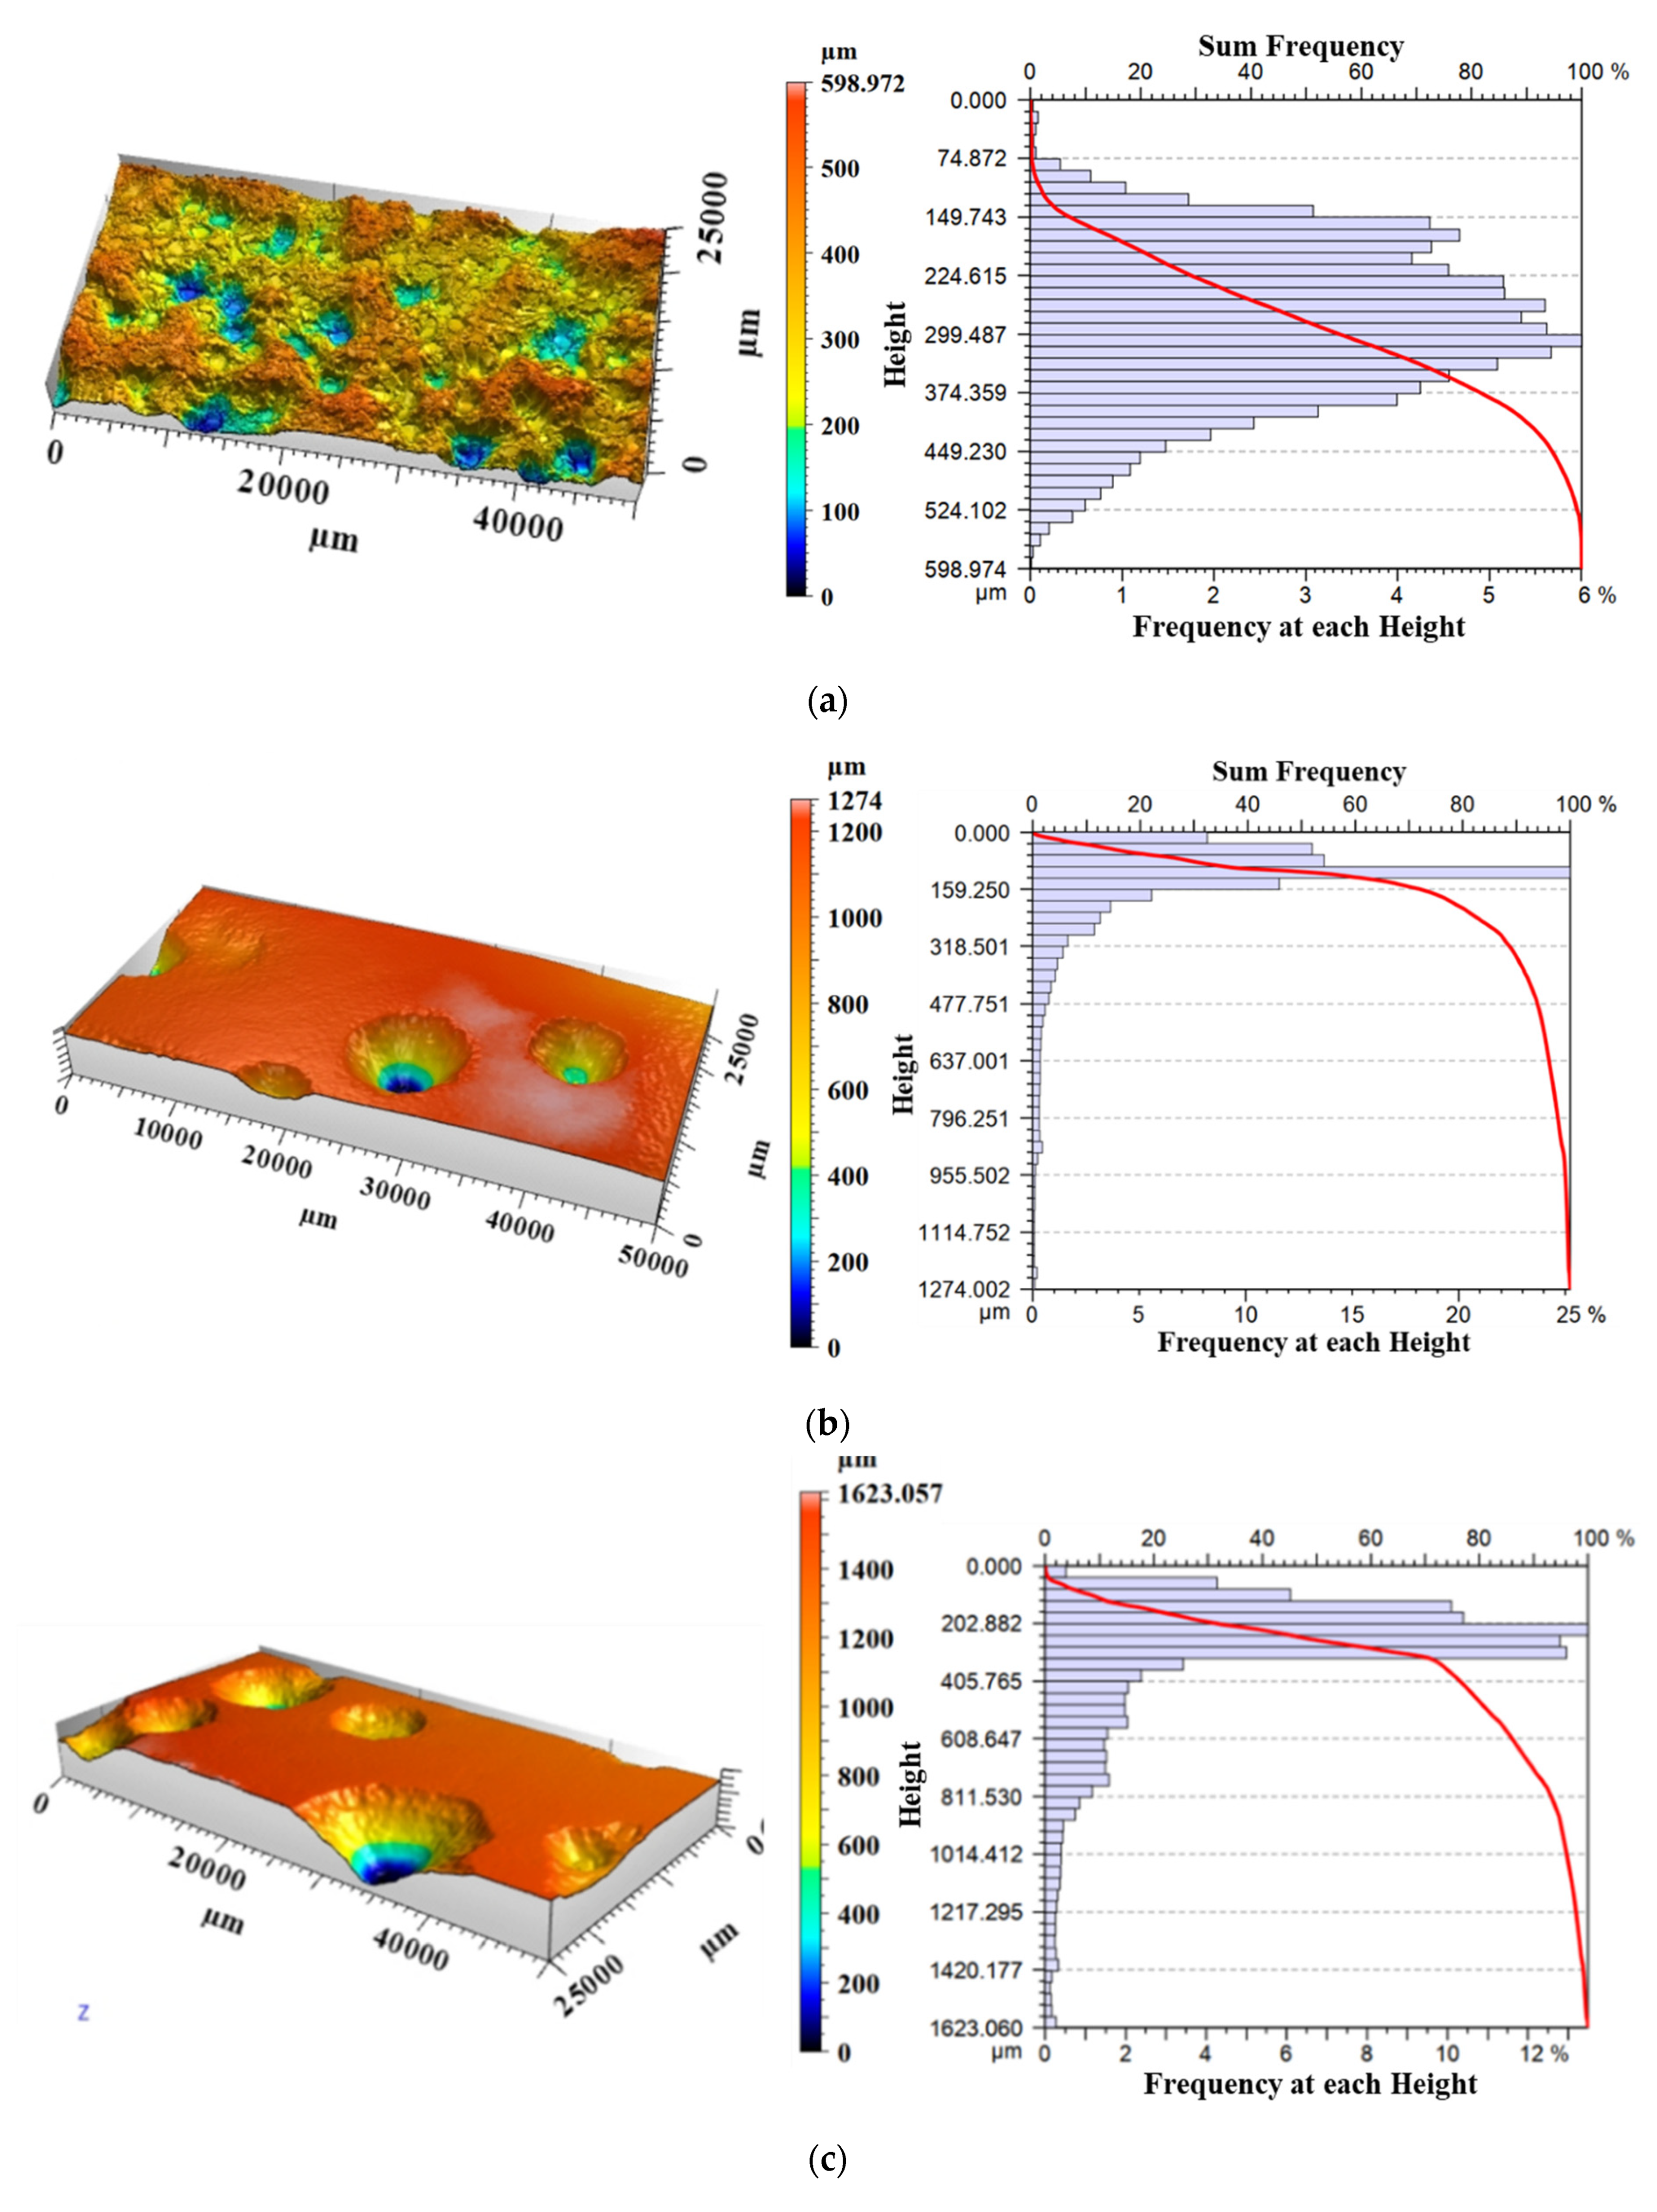
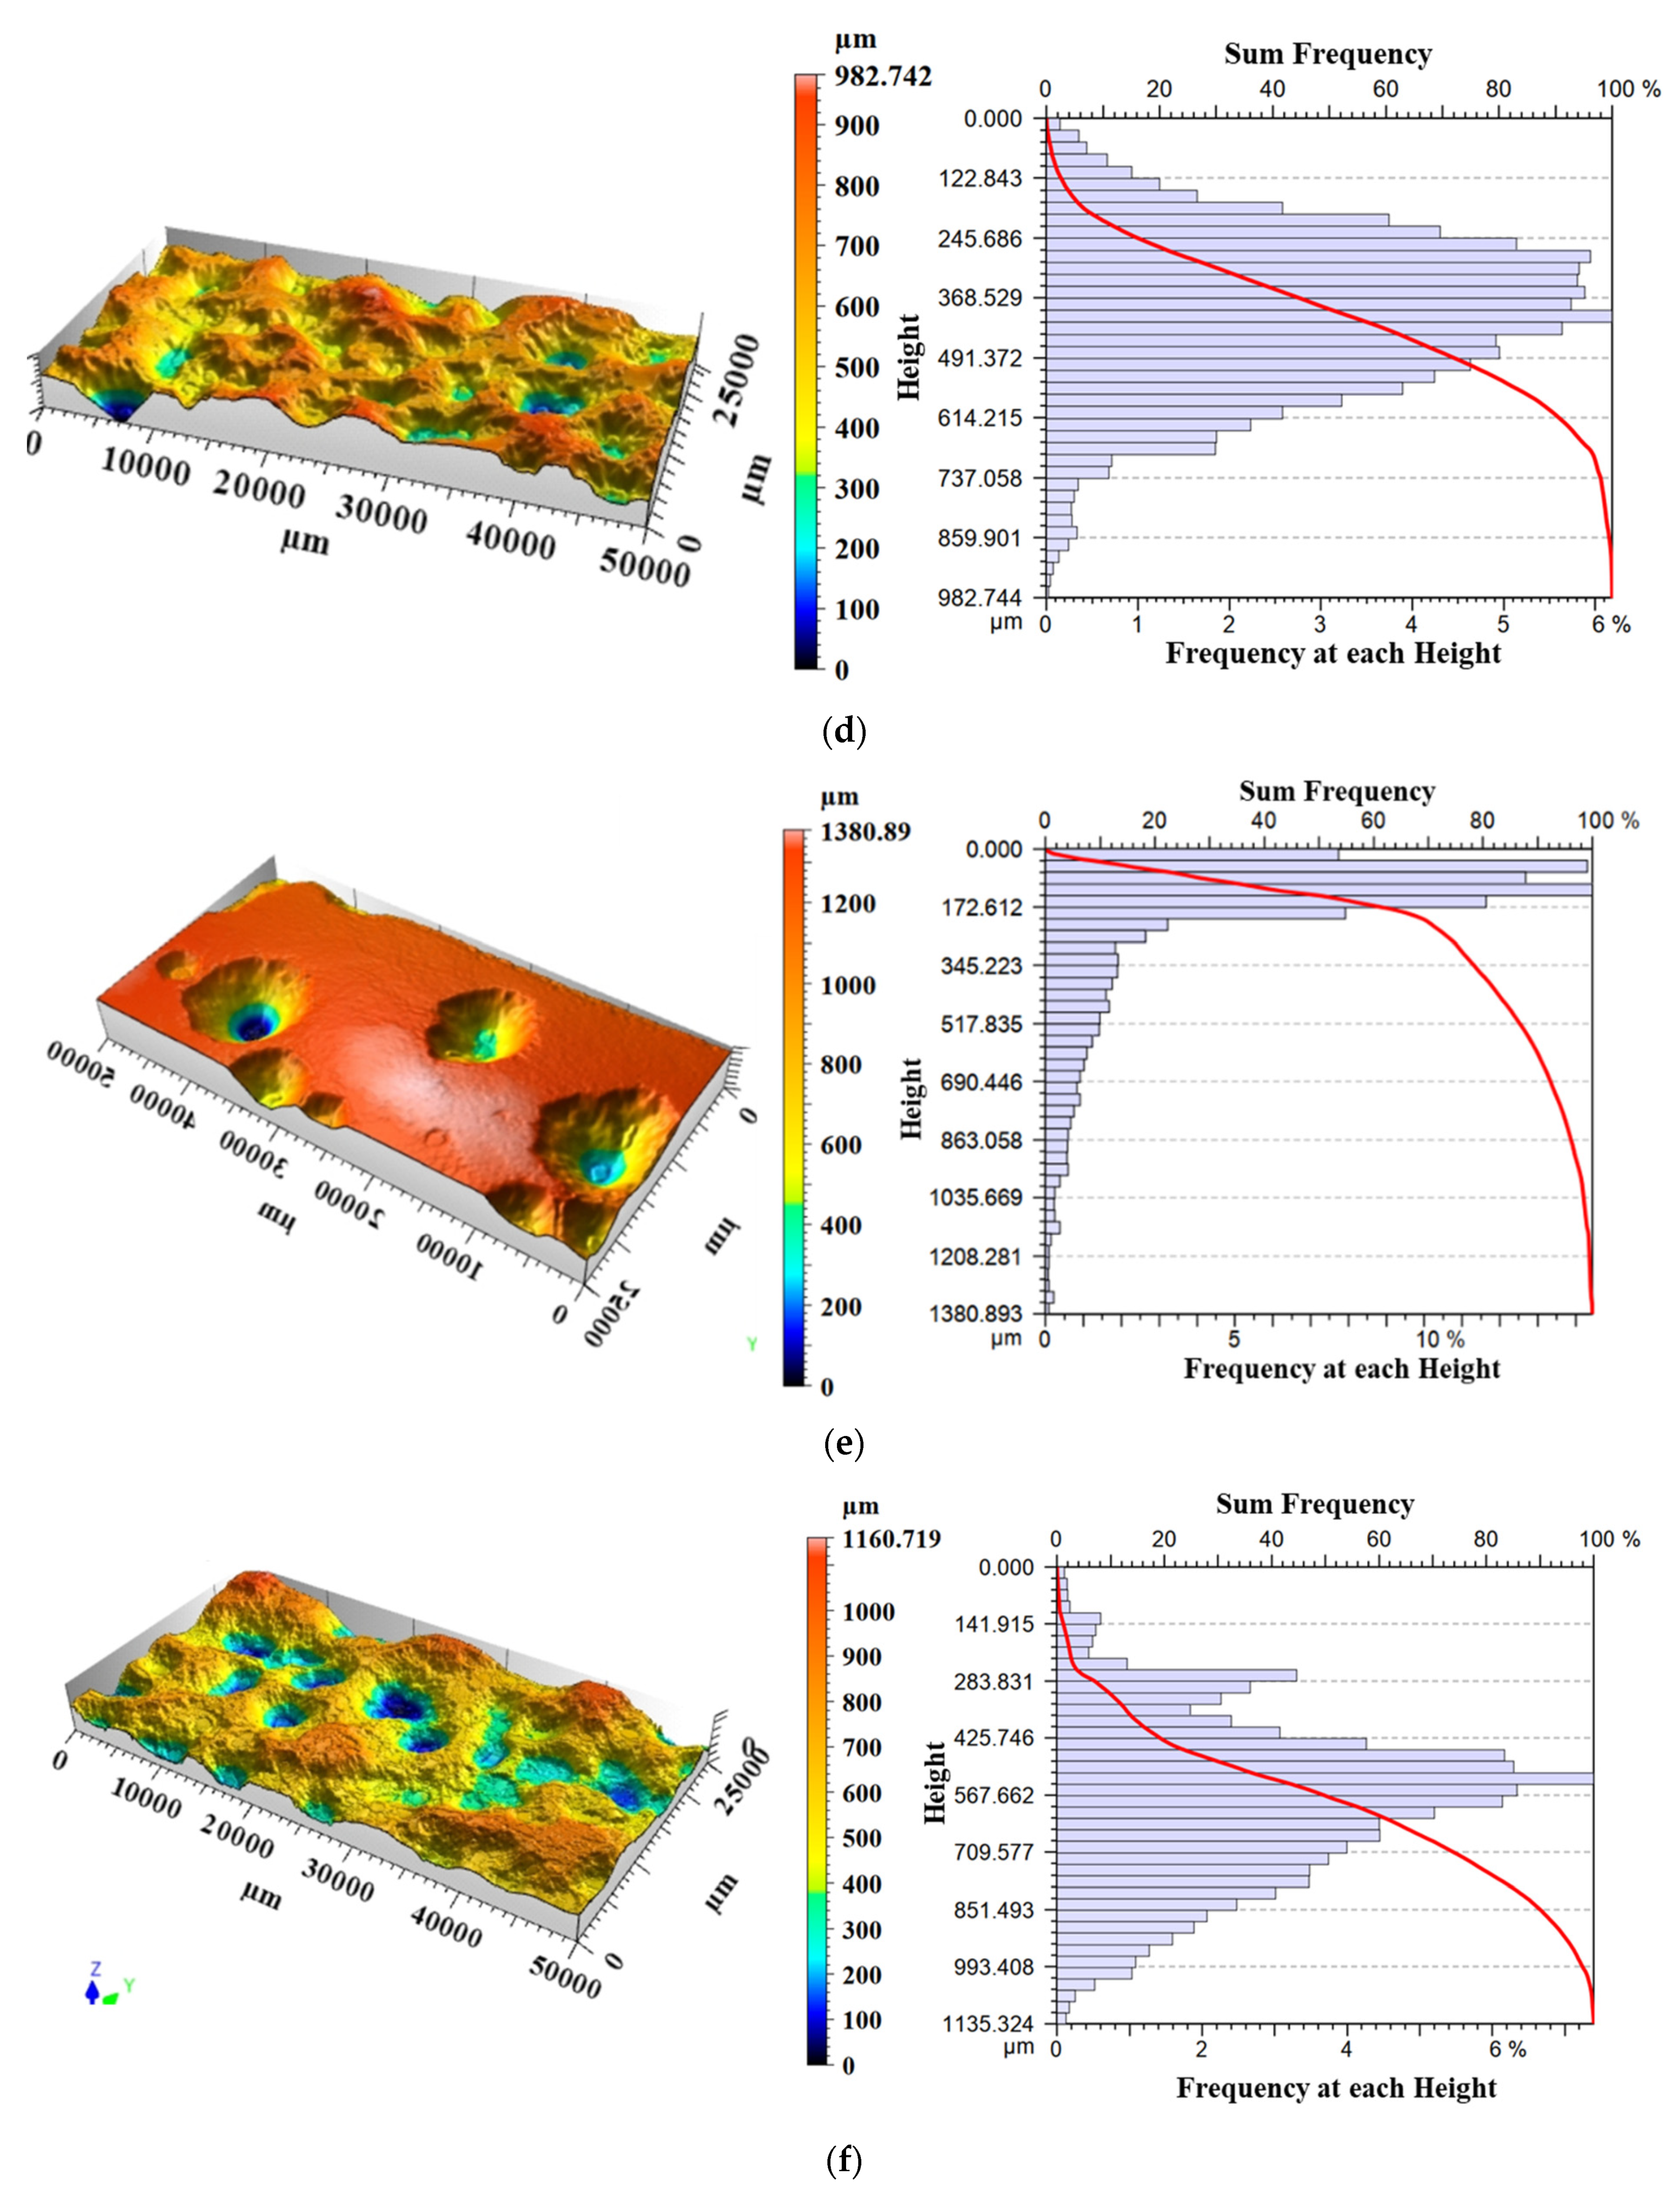
2.2. Evaluation of the Degree of Corrosion
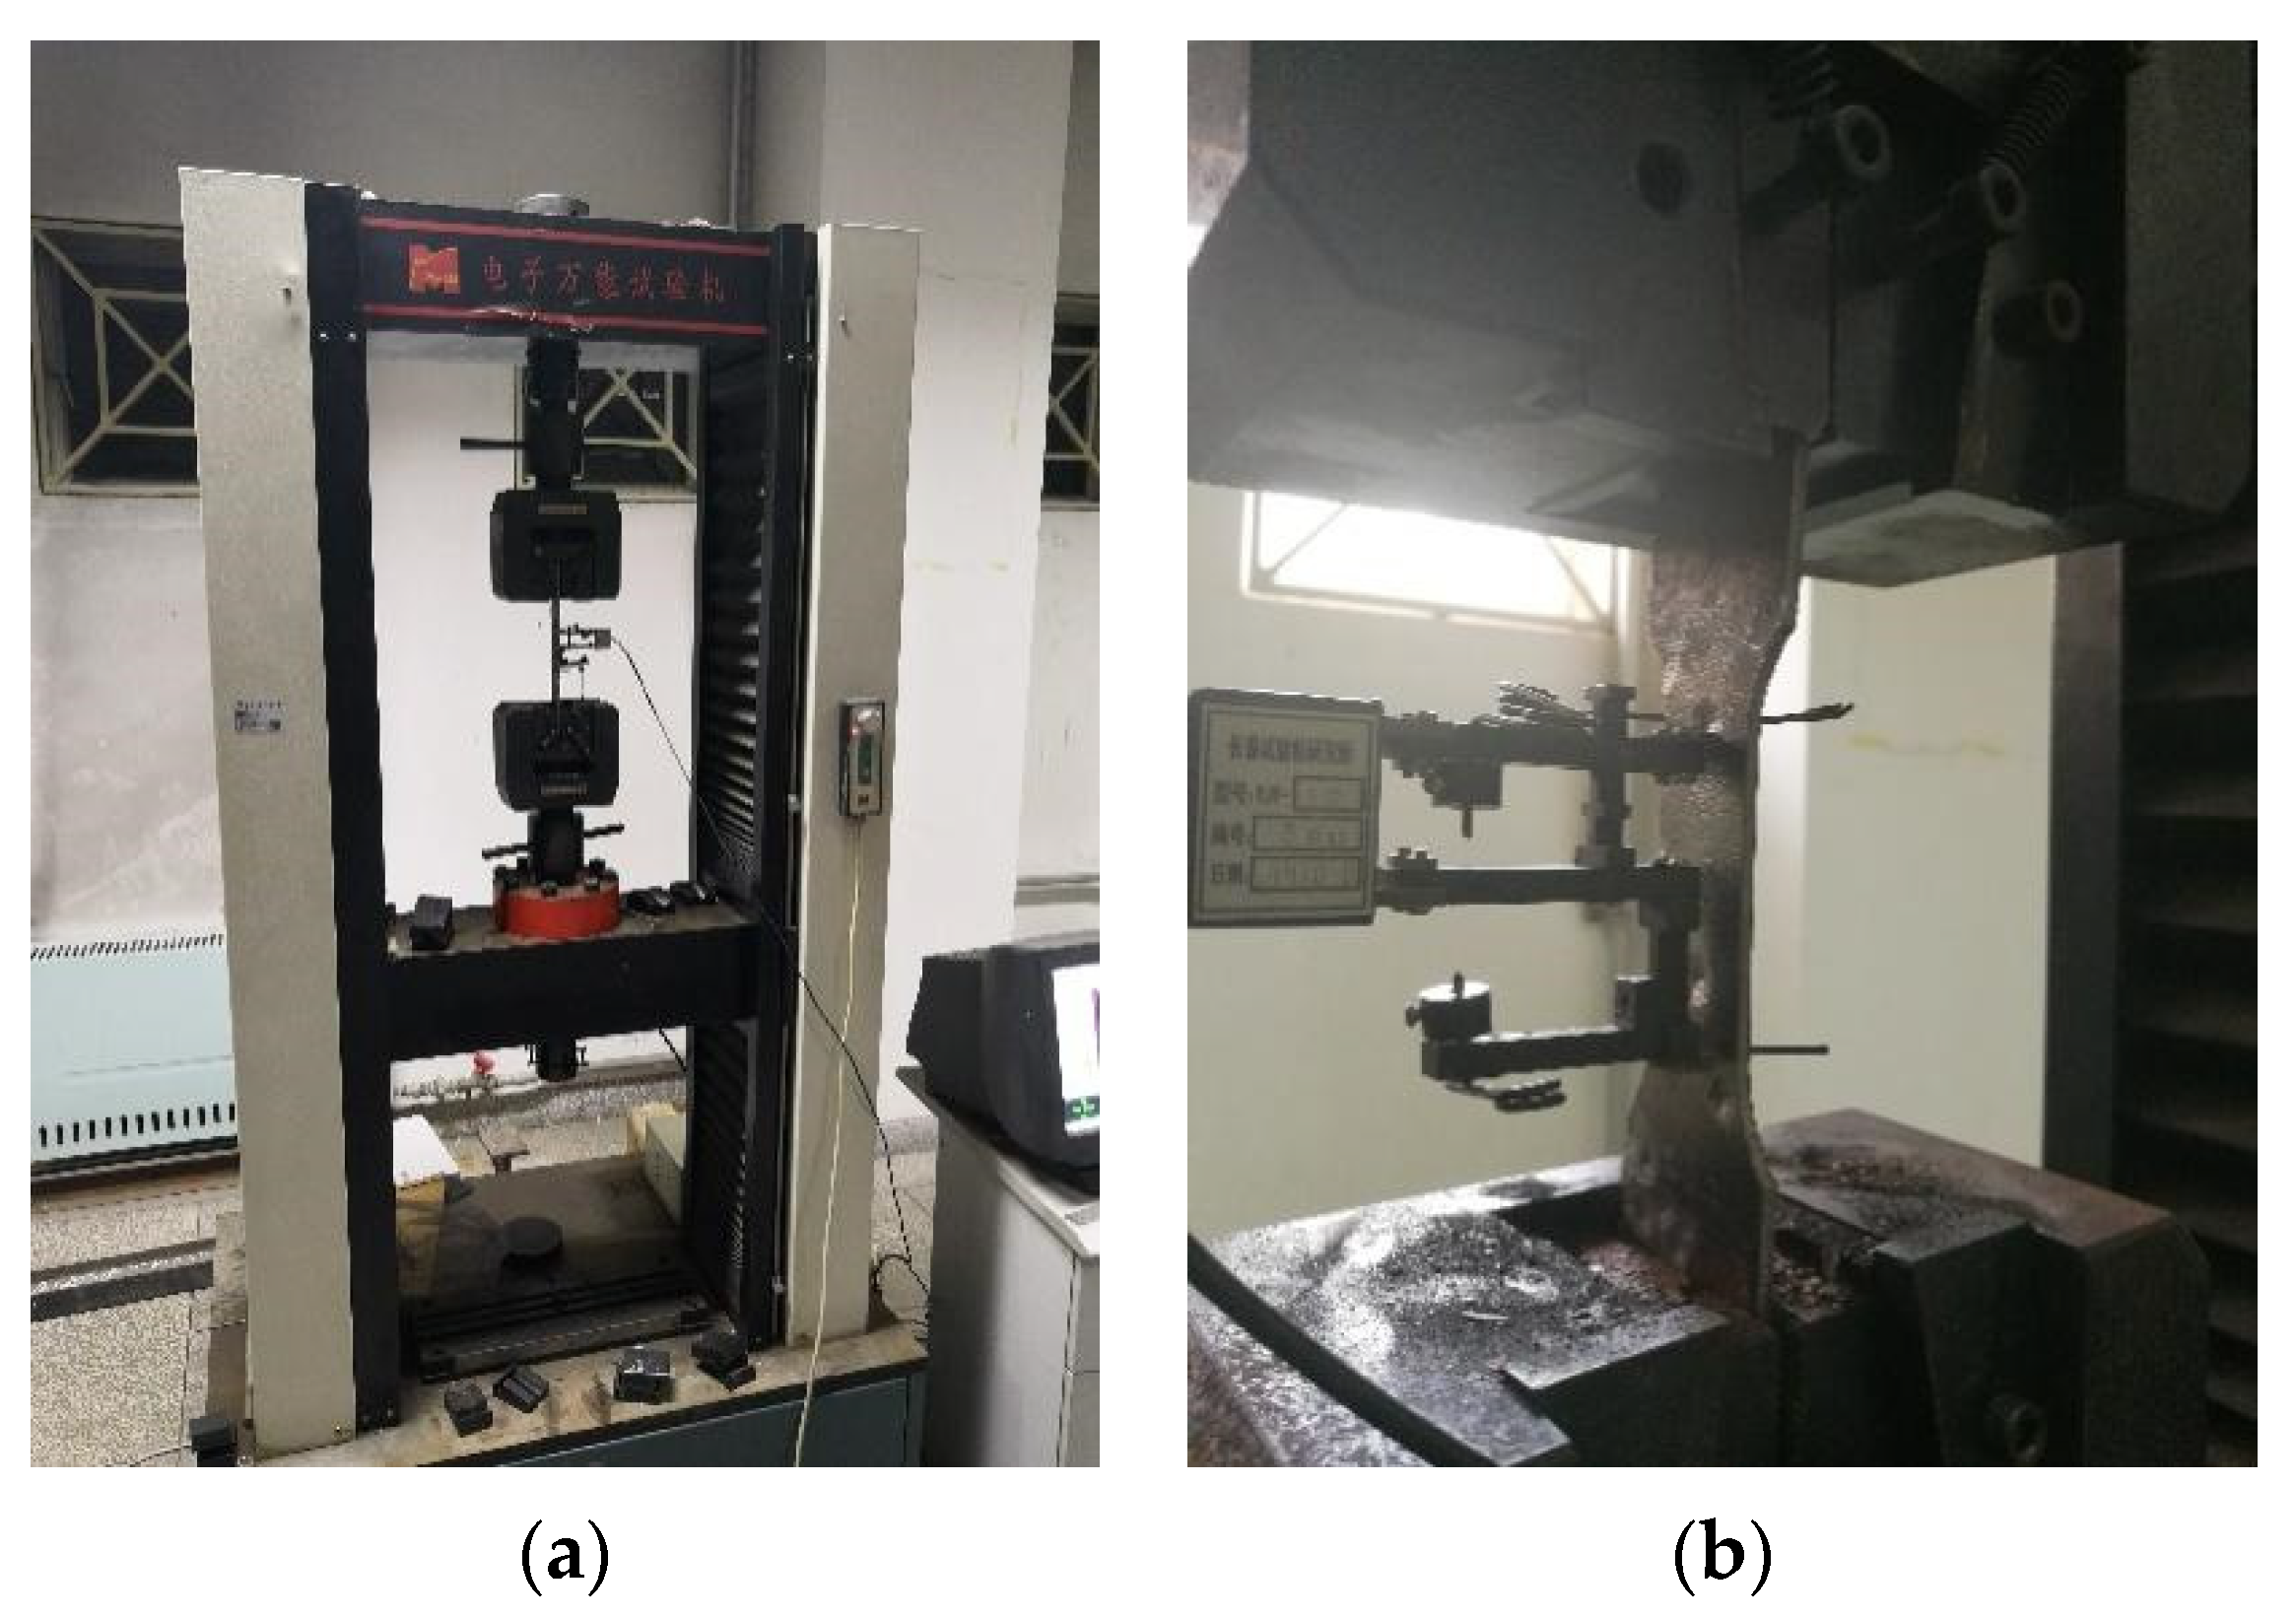
2.3. Strength Test
3. Test Results
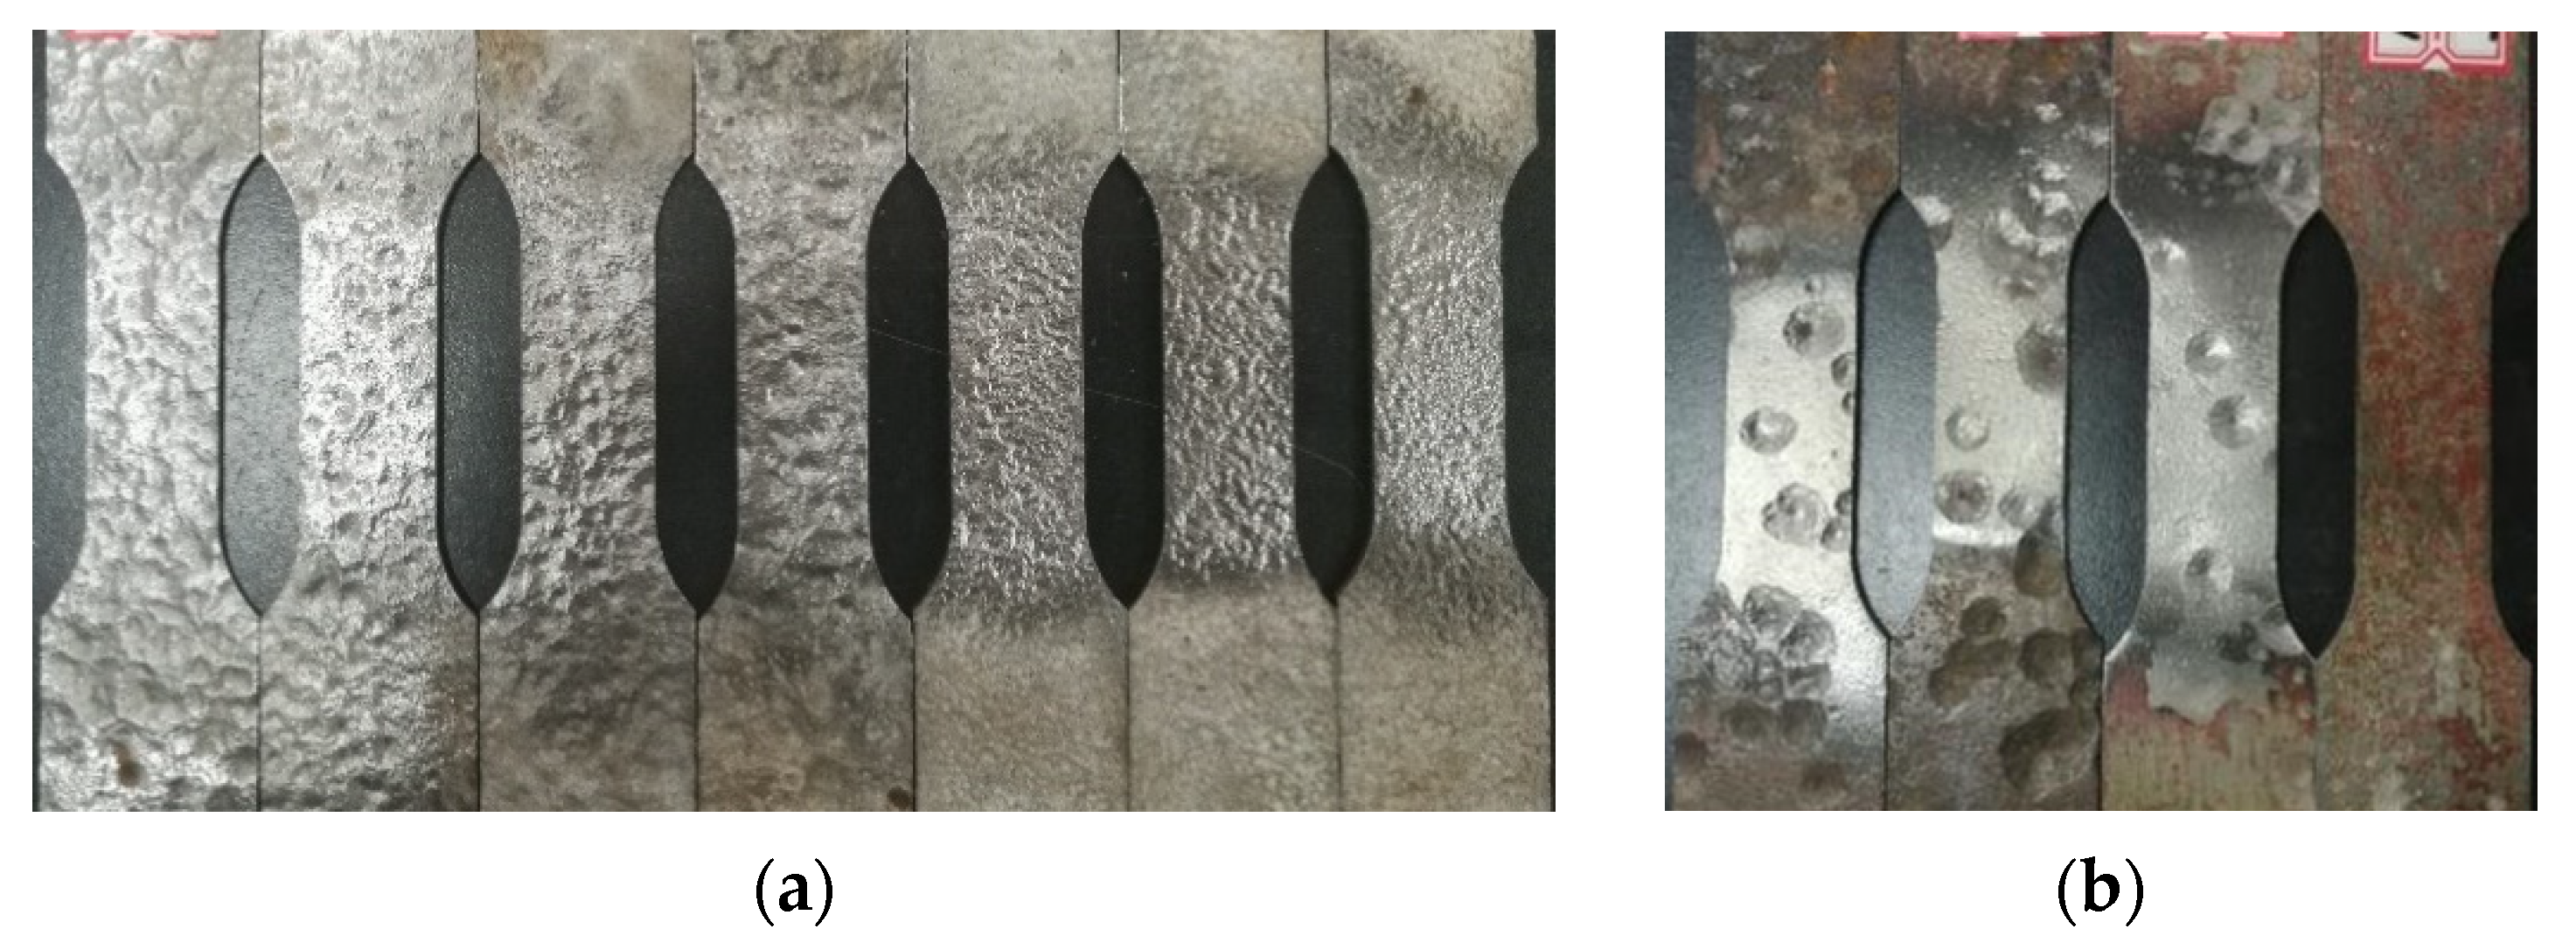
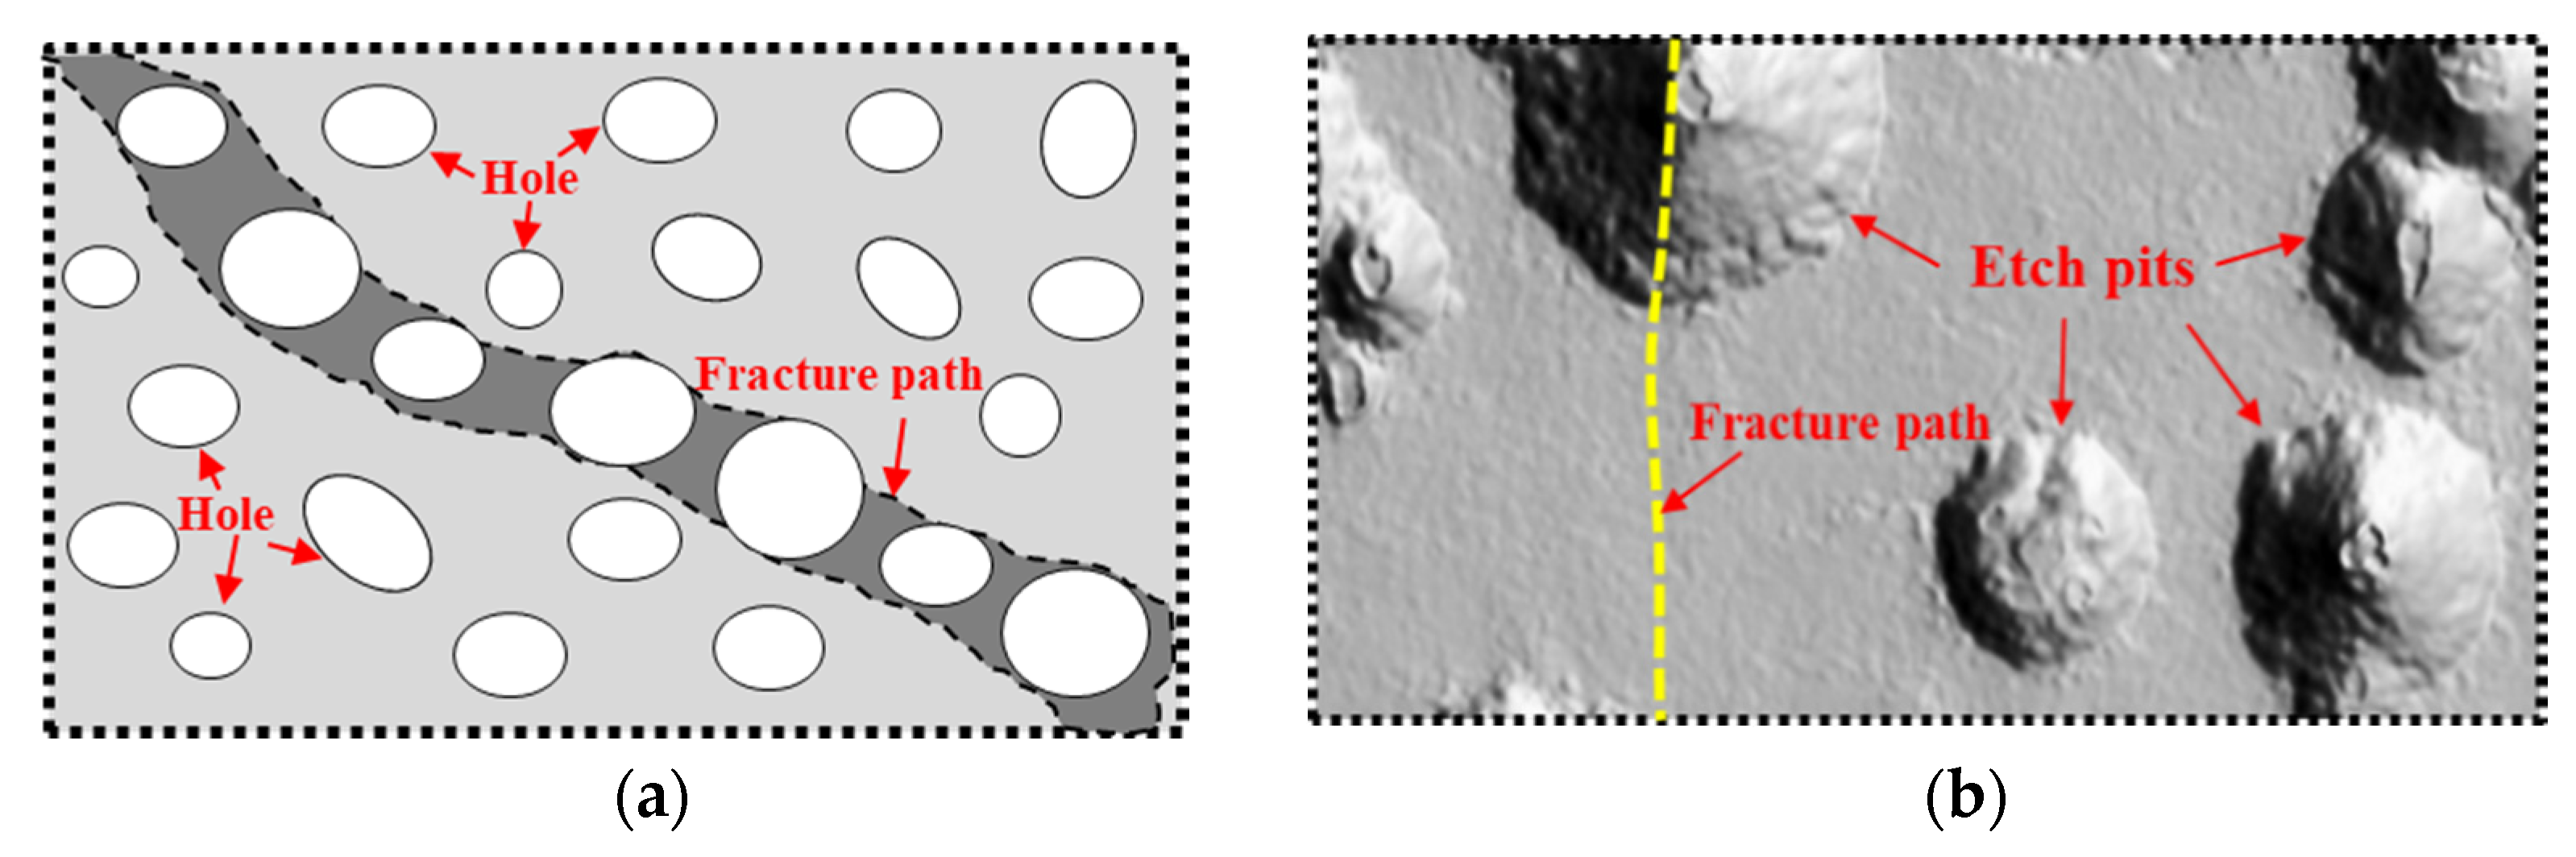
3.1. Failure Modes
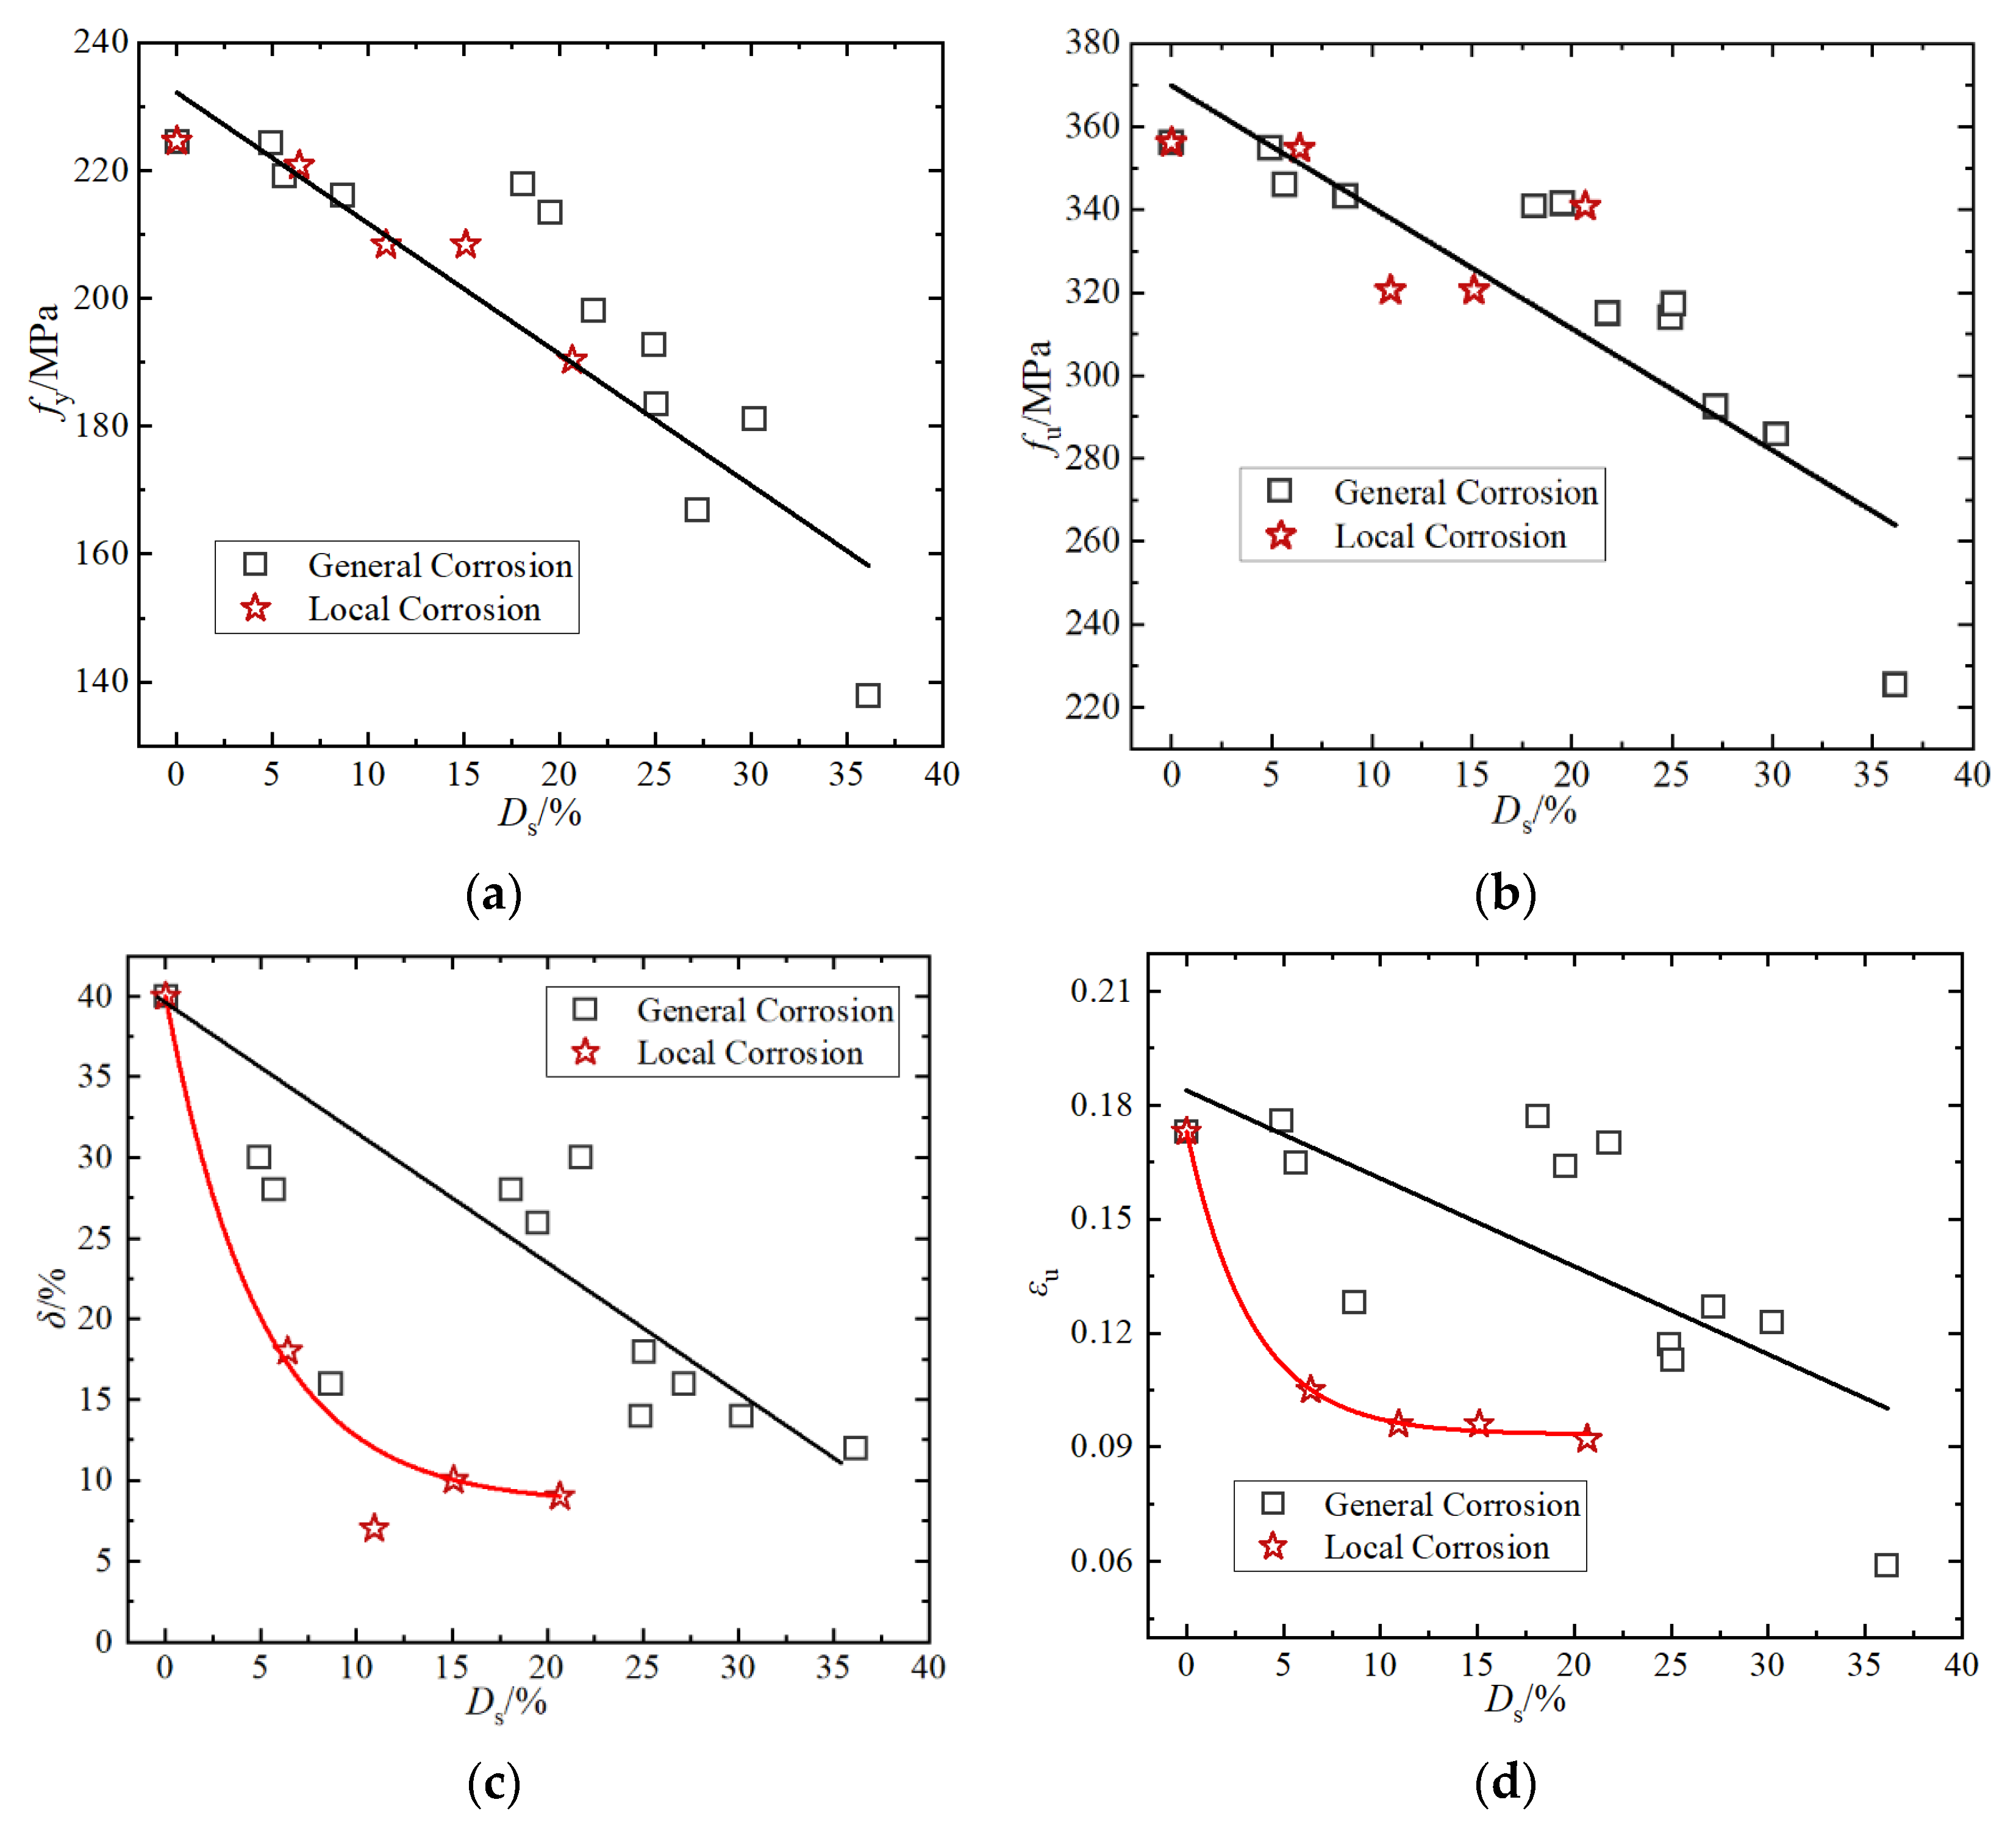
3.2. Analysis of Mechanical Properties
4. The Damage Constitutive Model of Corroded Steel
4.1. Damage Variables
4.2. Damage Evolution Equation
4.3. Equation of Damage Variables
4.4. Parameters of Corrosion Damage Model
5. Conclusions
- (1)
- The failure mode of corroded specimens was related to the degree and type of corrosion. The fracture of the general corroded specimens was step-like and the cross-section was uneven, while that of the local corroded specimens was mainly flat-like, and the fracture path was along the cross section where the larger corroded pits were located. Corrosion pits caused local plastic strain concentration and stress distribution changes, which affected the growth and evolution of micro-void in the surrounding areas of the corrosion pits. The joint action of pores in the matrix and surface distribution pits led to the change of steel fracture mechanism and the diversification of fracture paths.
- (2)
- With the increase of corrosion degree, the yield platform of stress-strain curve of the specimen gradually became shorter or even disappeared. Meanwhile, the ultimate strain and elongation at break decreased, which meant the ductility of the specimen became worse. For example, when the corrosion rate was 15.1%, the ultimate strain and the elongation of the specimens decreased by 44.5% and 75% respectively. On the one hand, it was mainly due to corrosion that the development of stress in the section was not synchronous, and the different positions of the same section showed a gradual yield trend, which was manifested in the disappearance of the yield platform. On the other hand, the severe local corrosion of the specimens resulted in significant local stress concentration, which made the stress failed to be redistributed within the plastic range, and then brittle failure occurred prematurely.
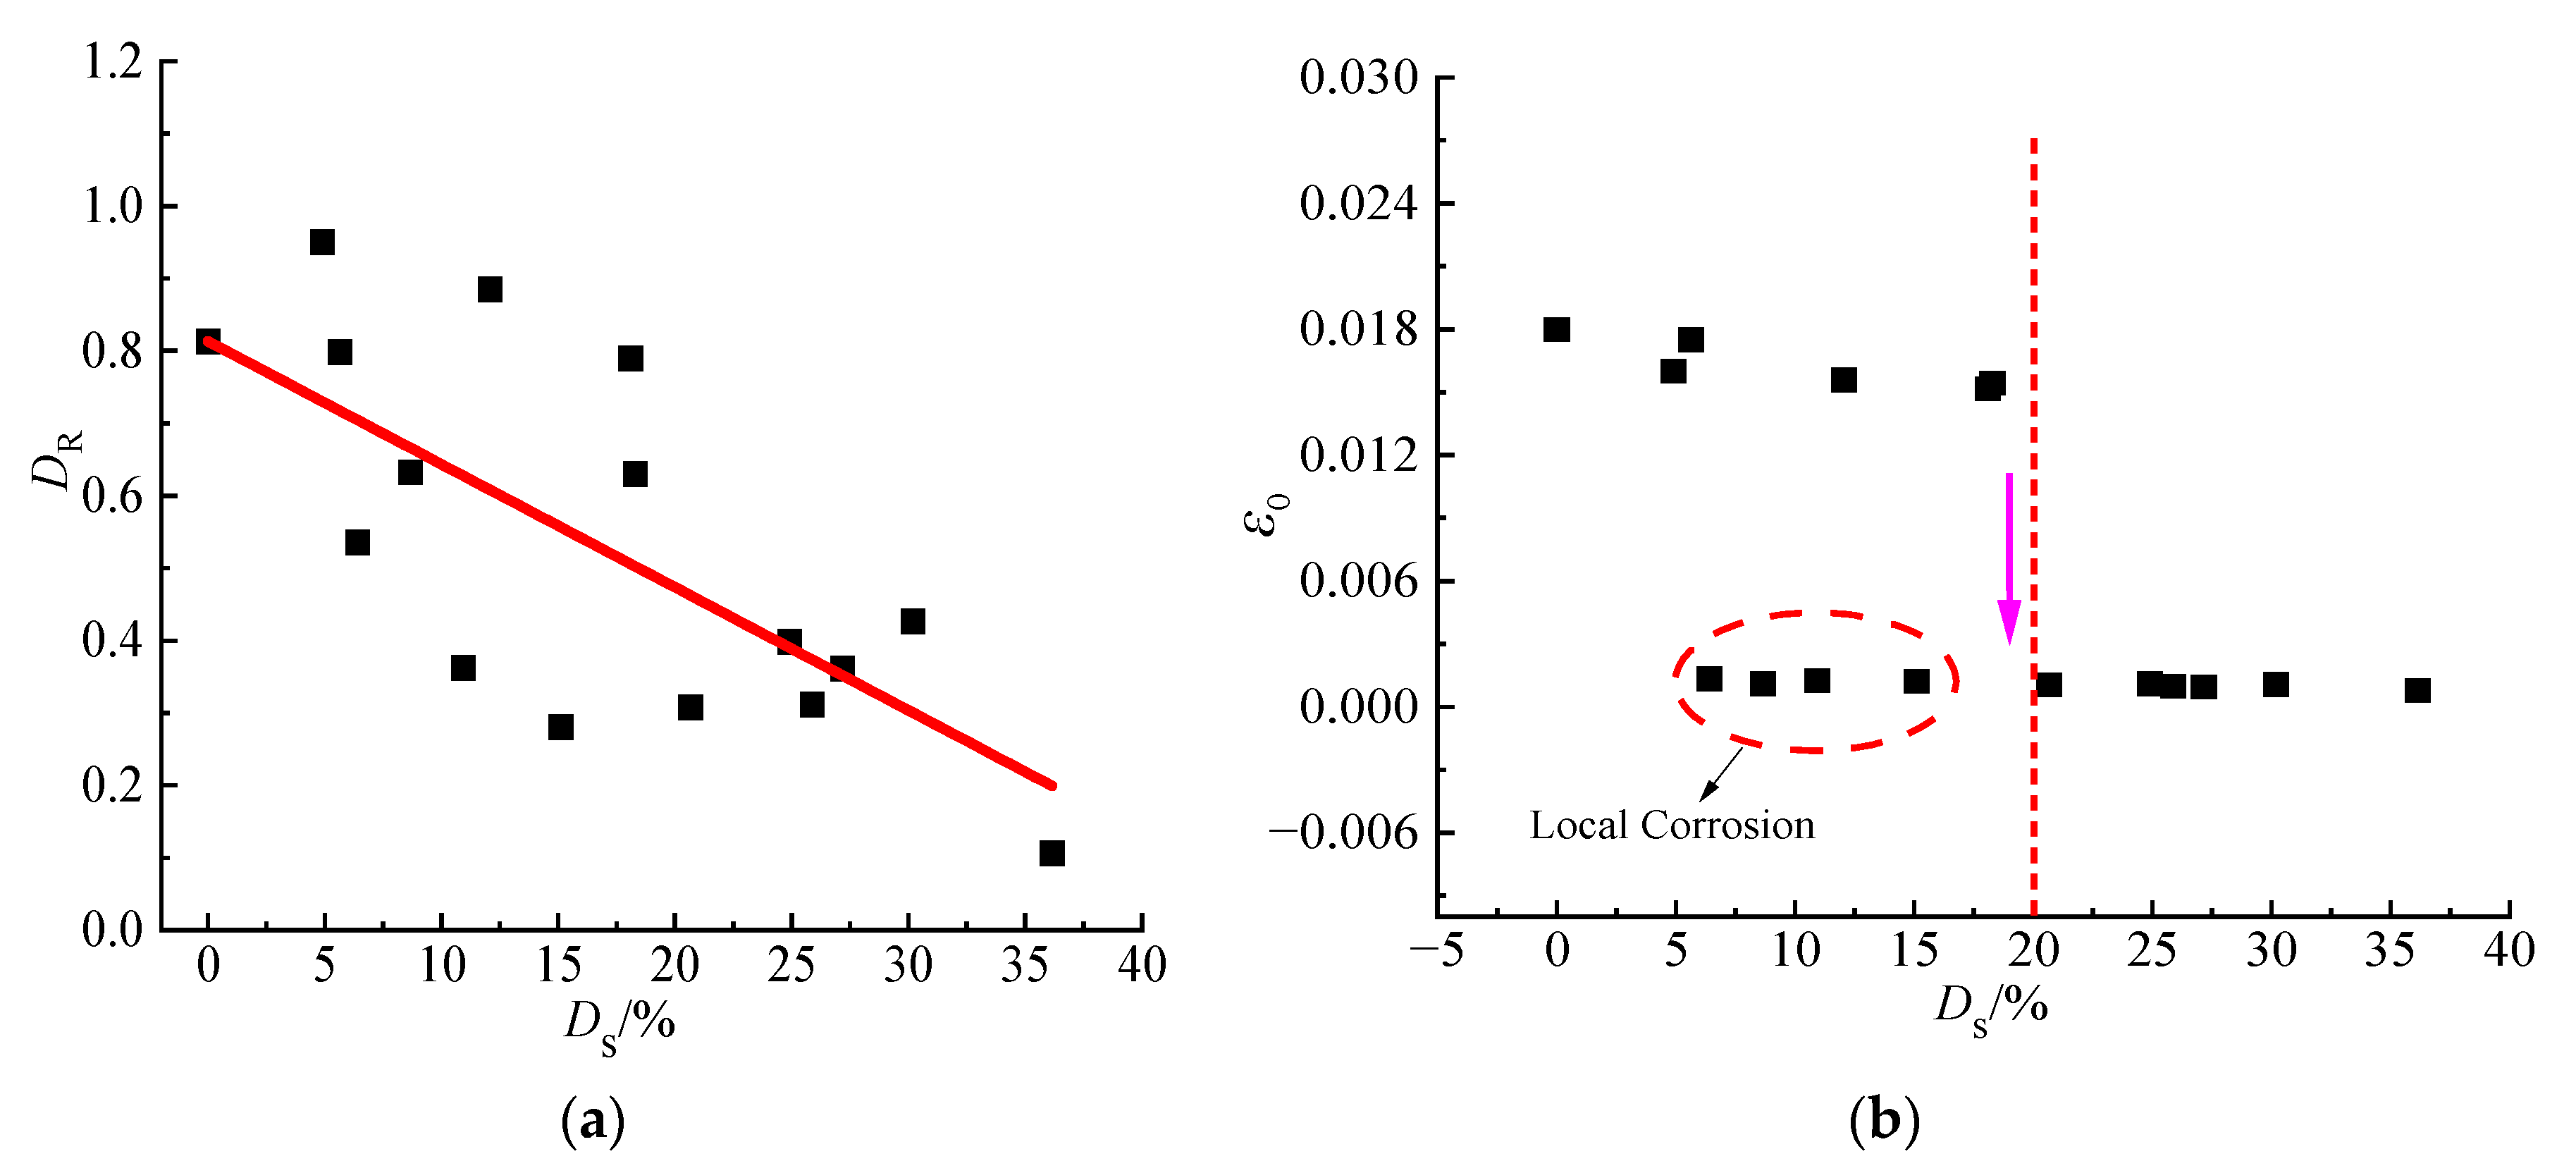
- (3)
- With the increase of the degree of corrosion, the corresponding extreme value of damage variable showed a downward trend on the whole, and the maximum decrease was as high as 62.5%. There was good agreement between the corrosion damage model curve and the test curve, indicating that the damage model could reflect the damage development process of the corroded steel in the tensile process better. Moreover, the corrosion damage resulted in the decrease of the steel damage threshold ε0, and the damage variable D decreased when the section reached the fracture limit.
Author Contributions
Funding
Conflicts of Interest
References
- Panchenko, Y.M.; Marshakov, A.I. Prediction of first-year corrosion losses of carbon steel and zinc in continental regions. Materials 2017, 10, 422. [Google Scholar] [CrossRef] [Green Version]
- Song, F.; Zhang, T.; Xie, X. Effect of Corroded Surface Morphology on Ultra-Low Cycle Fatigue of Steel Bridge Piers. Materials 2021, 14, 666. [Google Scholar] [CrossRef] [PubMed]
- Li, R.; Miao, C.; Yu, J. Effect of characteristic parameters of pitting on strength and stress concentration factor of cable steel wire. Constr. Build. Mater. 2020, 240, 117915. [Google Scholar] [CrossRef]
- Watson, S.; Stafford, D. Cables in trouble. Civ. Eng. 1988, 58, 38–41. [Google Scholar]
- Ruzankina, J.; Vasiliev, O.; Parfenov, V. Anti-corrosion treatment of metal surfaces based on photonics methods. J. Phys. Conf. Ser. 2017, 917, 062039. [Google Scholar] [CrossRef]
- Zhang, Z.; Xu, S.; Nie, B.; Li, R.; Xing, Z. Experimental and numerical investigation of corroded steel columns subjected to in-plane compression and bending. Thin-Walled Struct. 2020, 151, 106735. [Google Scholar] [CrossRef]
- Nie, B.; Xu, S.; Zhang, Z.; Li, A. Surface morphology characteristics and mechanical properties of corroded cold-formed steel channel sections. J. Build. Eng. 2021, 10, 102786. [Google Scholar] [CrossRef]
- Wang, Y.; Zhou, X.; Wang, H.; Kong, D.; Xu, S. Stochastic constitutive model of structural steel based on random field of corrosion depth. Case Stud. Constr. Mat. 2022, 16, e00972. [Google Scholar] [CrossRef]
- Zhang, Z.; Ye, J.; Huang, Z.; Qin, G.; Xu, S. Elastic buckling behavior of corroded uniformly compressed plates with three simply supported edges. Structures. 2022, 40, 946–959. [Google Scholar] [CrossRef]
- Xue, W.; Chen, J.; Zhu, J. Behaviour of corroded single stud shear connectors. Materials 2017, 10, 276. [Google Scholar] [CrossRef] [Green Version]
- Li, R.; Miao, C.; Wei, T. Experimental study on the fatigue behavior of corroded steel wire. J. Constr. Steel Res. 2021, 176, 106375. [Google Scholar] [CrossRef]
- Garbatov, Y.; Saad-Eldeen, S.; Soares, C.G.; Parunov, J.; Kodvanj, J. Tensile test analysis of corroded cleaned aged steel specimens. Corros. Eng. Sci. Technol. 2018, 54, 154–162. [Google Scholar] [CrossRef]
- Nakai, T.; Matsushita, H.; Yamamoto, N. Effect of pitting corrosion on strength of web plates subjected to patch loading. Thin-Walled Struct. 2006, 44, 10–19. [Google Scholar] [CrossRef]
- Nakai, T.; Matsushita, H.; Yamamoto, N.; Arai, H. Effect of pitting corrosion on local strength of hold frames of bulk carriers (1st report). Mar. Struct. 2004, 17, 403–432. [Google Scholar] [CrossRef]
- Nakai, T.; Matsushita, H.; Yamamoto, N. Effect of pitting corrosion on local strength of hold frames of bulk carriers (2nd Report)-Lateral-distortional buckling and local face buckling. Mar. Struct. 2004, 17, 612–641. [Google Scholar] [CrossRef]
- Paik, J.; Lee, J.; Ko, M. Ultimate shear strength of plate elements with pit corrosion wastage. Thin-Walled Struct. 2004, 42, 1161–1176. [Google Scholar] [CrossRef]
- Wang, Y.; Xu, S.; Wang, H.; Li, A. Predicting the residual strength and deformability of corroded steel plate based on the corrosion morphology. Constr. Build. Mater. 2017, 152, 777–793. [Google Scholar] [CrossRef]
- Appuhamy, J.; Kaita, T.; Ohga, M.; Fujii, K. Prediction of residual strength of corroded tensile steel plates. Int. J. Steel Struct. 2011, 11, 65–79. [Google Scholar] [CrossRef]
- Karagah, H.; Shi, C.; Dawood, M. Experimental investigation of short steel columns with localized corrosion. Thin-Walled Struct. 2015, 87, 191–199. [Google Scholar] [CrossRef]
- Xu, S.; Zhang, Z.; Qin, G. Study on the seismic performance of corroded H-shaped steel columns. Eng. Struct. 2019, 191, 39–61. [Google Scholar] [CrossRef]
- Takahashi, K.; Ando, K.; Hisatsune, M.; Hasegawa, K. Failure behavior of carbon steel pipe with local wall thinning near orifice. Nucl. Eng. Des. 2007, 237, 335–341. [Google Scholar] [CrossRef]
- Nie, B.; Xu, S.; Yu, J.; Zhang, H. Experimental investigation of mechanical properties of corroded cold-formed steels. J. Constr. Steel Res. 2019, 162, 105706. [Google Scholar] [CrossRef]
- Xu, S.; Zhang, Z.; Li, R. Effect of cleaned corrosion surface topography on mechanical properties of cold-formed thin-walled steel. Construct. Build. Mater. 2019, 222, 1–14. [Google Scholar] [CrossRef]
- Xu, S.; Wang, H.; Li, A.; Wang, Y.; Su, L. Effects of corrosion on surface characterization and mechanical properties of butt-welded joints. J. Constr. Steel Res. 2016, 126, 50–62. [Google Scholar] [CrossRef]
- GB/T 228.1-2010; China Iron & Steel Association. Tensile Test Method for Metallic Materials at Room Temperature. Standards Press of China: Beijing, China, 2010.
- ISO/TC 156; International Committee for Standardization. Corrosion of Metals and Alloys-Removal of Corrosion Products from Corrosion Test Specimens. ISO Standard: Geneva, Switzerland, 2009.
- Liu, X.; Zhang, W.; Gu, X.; Ye, Z. Assessment of fatigue life for corroded prestressed concrete beams subjected to high-cycle fatigue loading. J. Struct. Eng. 2023, 149, 04022242. [Google Scholar] [CrossRef]
- Liu, X.; Yan, Z.; Wang, D.; Zhao, R.; Niu, D.; Wang, Y. Corrosion cracking behavior of reinforced concrete under freeze-thaw cycles. J. Build. Eng. 2023, 64, 105610. [Google Scholar] [CrossRef]


| Number | S0/mm2 | Ss/mm2 | Smin/mm2 | Ds/% |
|---|---|---|---|---|
| A1 | 75 | 75 | 75 | 0 |
| A2 | 75 | 71.33 | 61.55 | 4.89 |
| A3 | 75 | 70.77 | 68.79 | 5.64 |
| A4 | 75 | 70.20 | 70.20 | 6.40 |
| A5 | 75 | 68.51 | 67.10 | 8.65 |
| A6 | 75 | 70.32 | 66.80 | 10.93 |
| A7 | 75 | 71.99 | 63.68 | 15.10 |
| A8 | 75 | 61.43 | 57.32 | 18.09 |
| A9 | 75 | 60.37 | 54.54 | 19.51 |
| A10 | 75 | 70.55 | 59.51 | 20.66 |
| A11 | 75 | 58.67 | 52.12 | 21.78 |
| A12 | 75 | 56.33 | 59.99 | 24.89 |
| A13 | 75 | 56.22 | 51.62 | 25.04 |
| A14 | 75 | 54.63 | 56.71 | 27.16 |
| A15 | 75 | 52.37 | 54.78 | 30.18 |
| A16 | 75 | 47.90 | 57.52 | 36.14 |
| Specimen Number | Ds/% | εy | ε0 | εR | DR | K | m | E/GPa |
|---|---|---|---|---|---|---|---|---|
| A1 | 0 | 0.00102 | 0.018 | 0.238 | 0.81327 | 3500 | 1.25 | 220 |
| A2 | 4.89 | 0.00124 | 0.01602 | 0.22817 | 0.95076 | 4000 | 1.25 | 181 |
| A3 | 5.64 | 0.00122 | 0.01752 | 0.20200 | 0.79833 | 3500 | 1.25 | 179 |
| A4 | 6.40 | 0.00134 | 0.00134 | 0.11014 | 0.53550 | 4000 | 1.25 | 170 |
| A5 | 8.65 | 0.00110 | 0.01100 | 0.18366 | 0.63264 | 3500 | 1.25 | 178 |
| A6 | 10.93 | 0.00126 | 0.00126 | 0.08284 | 0.36264 | 4000 | 1.25 | 173 |
| A7 | 15.10 | 0.00122 | 0.00122 | 0.06972 | 0.28054 | 4000 | 1.25 | 171 |
| A8 | 18.09 | 0.00125 | 0.01560 | 0.21681 | 0.88557 | 3500 | 1.25 | 174 |
| A9 | 19.51 | 0.00126 | 0.01518 | 0.19782 | 0.78971 | 3500 | 1.25 | 170 |
| A10 | 20.66 | 0.00106 | 0.00106 | 0.09528 | 0.30755 | 4000 | 1.25 | 200 |
| A11 | 21.78 | 0.00113 | 0.01544 | 0.18838 | 0.63057 | 3500 | 1.25 | 178 |
| A12 | 24.89 | 0.00099 | 0.00099 | 0.1190 | 0.31162 | 4000 | 1.25 | 167 |
| A13 | 25.04 | 0.00110 | 0.00110 | 0.13346 | 0.39824 | 4000 | 1.25 | 167 |
| A14 | 27.16 | 0.00096 | 0.00096 | 0.14087 | 0.36139 | 4000 | 1.25 | 174 |
| A15 | 30.18 | 0.00108 | 0.00108 | 0.13654 | 0.42643 | 4000 | 1.25 | 168 |
| A16 | 36.14 | 0.00078 | 0.00078 | 0.06080 | 0.10592 | 3500 | 1.25 | 178 |
Publisher’s Note: MDPI stays neutral with regard to jurisdictional claims in published maps and institutional affiliations. |
© 2022 by the authors. Licensee MDPI, Basel, Switzerland. This article is an open access article distributed under the terms and conditions of the Creative Commons Attribution (CC BY) license (https://creativecommons.org/licenses/by/4.0/).
Share and Cite
Zhang, Z.; Xu, Y.; Qin, G.; Xu, S.; Li, R. Deterioration of Mechanical Properties and the Damage Constitutive Model of Corroded Steel in an Industrial Environment. Materials 2022, 15, 8841. https://doi.org/10.3390/ma15248841
Zhang Z, Xu Y, Qin G, Xu S, Li R. Deterioration of Mechanical Properties and the Damage Constitutive Model of Corroded Steel in an Industrial Environment. Materials. 2022; 15(24):8841. https://doi.org/10.3390/ma15248841
Chicago/Turabian StyleZhang, Zongxing, Yuxuan Xu, Guangchong Qin, Shanhua Xu, and Rou Li. 2022. "Deterioration of Mechanical Properties and the Damage Constitutive Model of Corroded Steel in an Industrial Environment" Materials 15, no. 24: 8841. https://doi.org/10.3390/ma15248841