
Values of Selected Strength Parameters of Miscanthus × Giganteus Stalk Depending on Water Content and Internode Number

 ,
, 
Abstract
:1. Introduction
- Impact strength test: carried out on giant miscanthus [44].
2. Materials and Methods
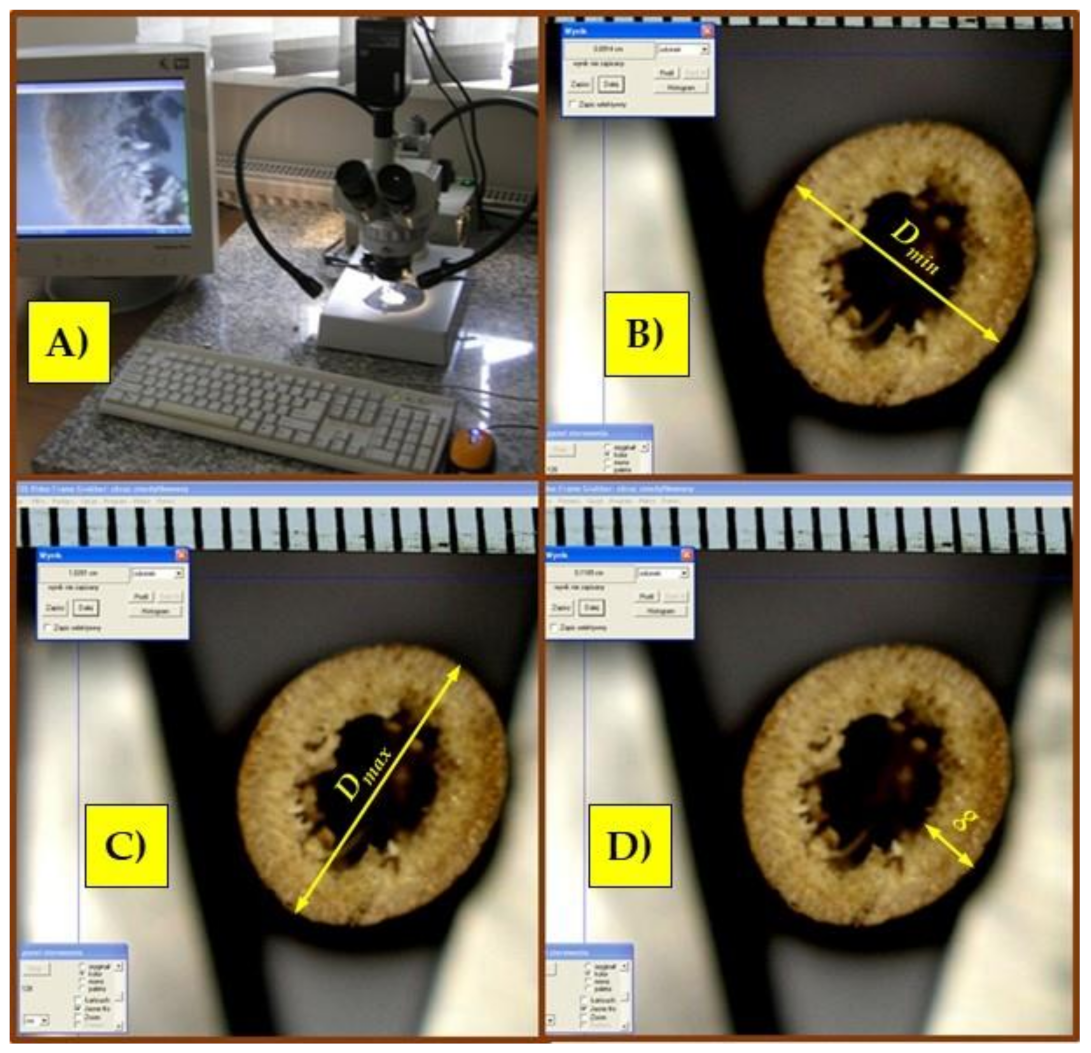
2.1. Method of Preparing Samples for Strength Tests
2.2. Measurement of Moisture Content
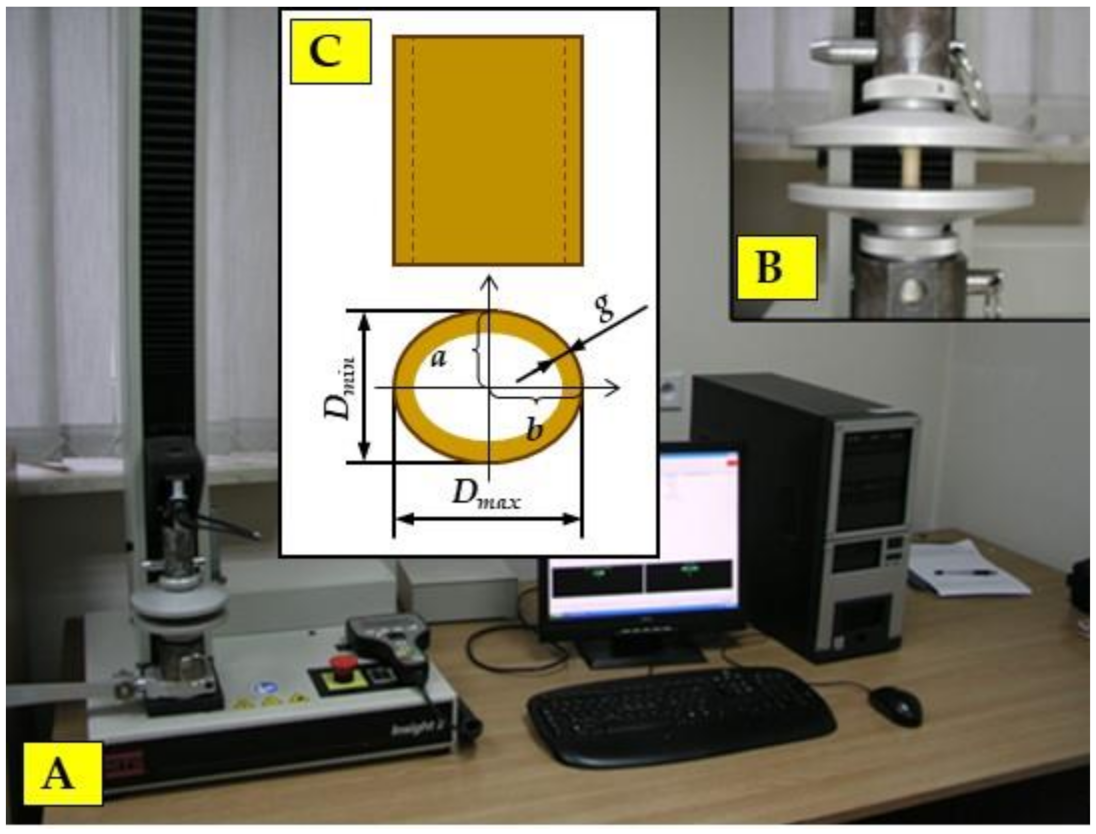
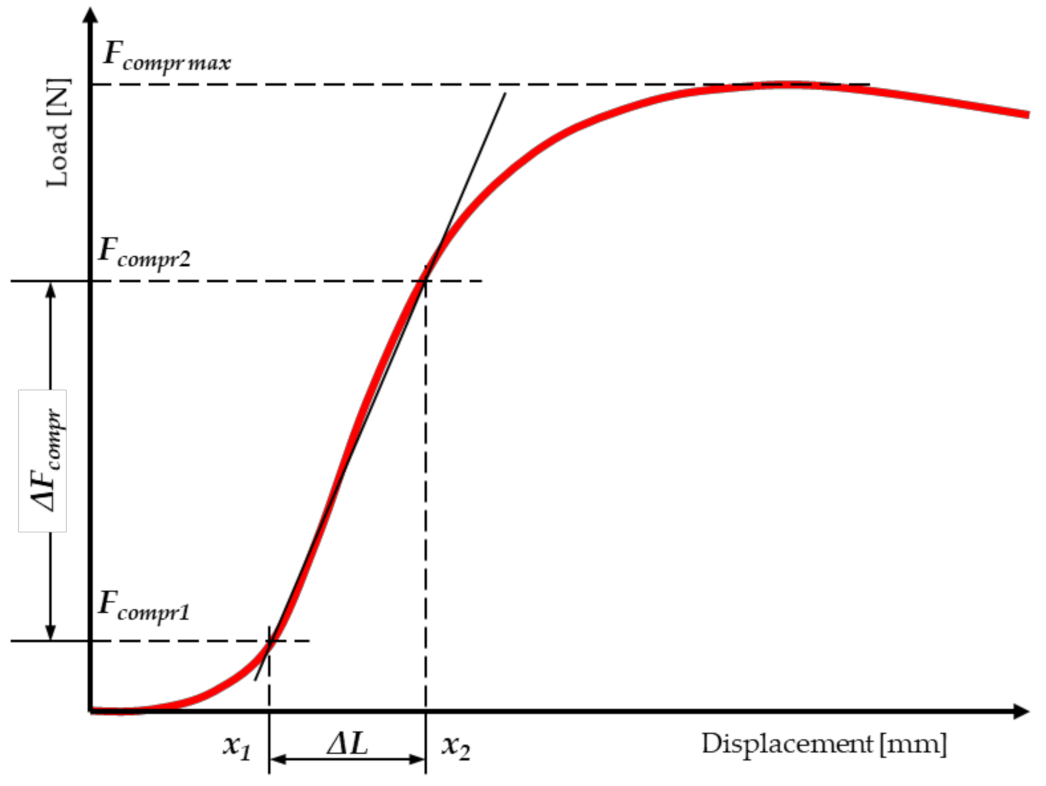
2.3. Static Compression Tests along the Fibres
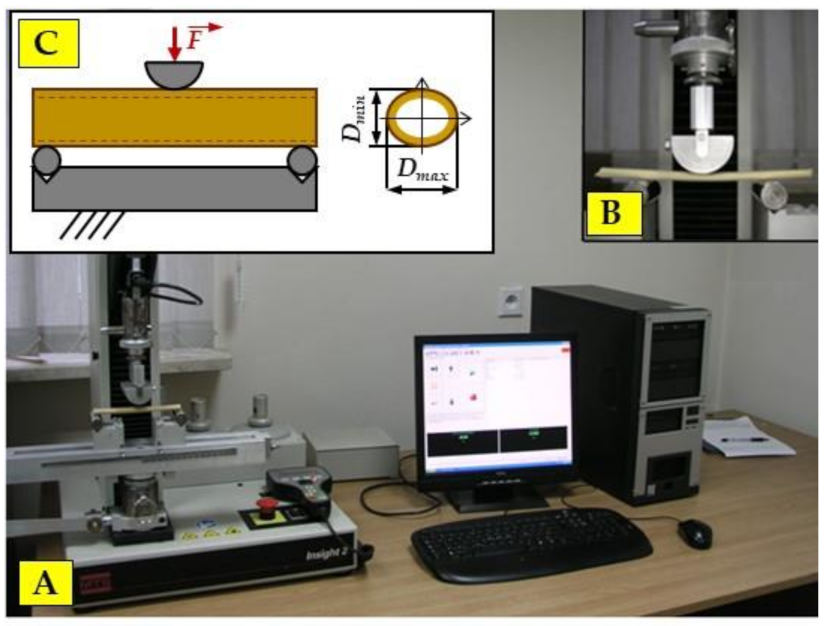
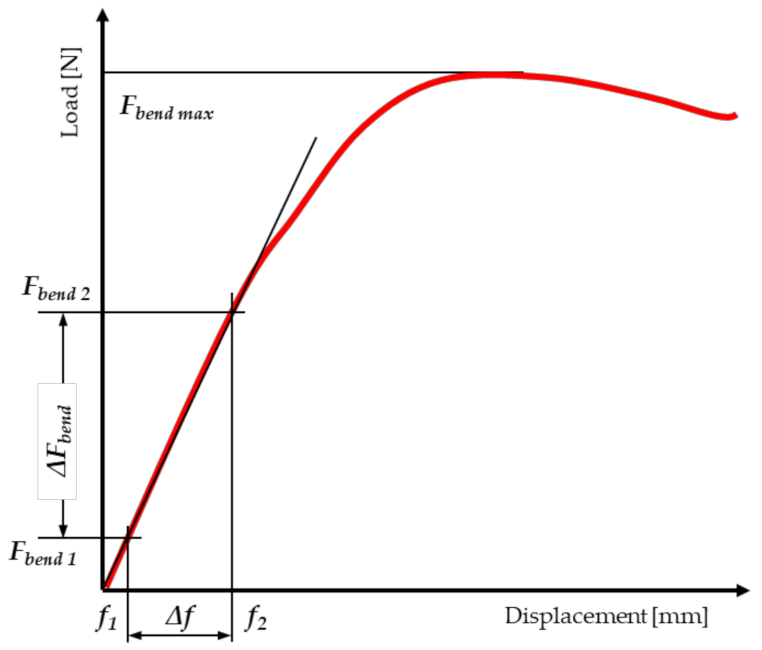
2.4. Static Bending Tests
2.5. Statistical Analysis
- 1.
- Calculating the Sum of Squares (SS), both total and for individual factors:
- 2.
- Calculating the degrees of freedom (df):
- 3.
- Calculating the Mean Squares (MS):
- 4.
- Calculating the F-test value:
- 5.
- If the probability p of obtaining the observed value of the F test is less than 0.05, we reject the null hypothesis (H0: all group means are equal) in favor of the alternative hypothesis (H1: at least two group means differ from each other).
3. Results
3.1. The Results of Samples’ Geometrical Dimension Measurements for Strength Tests
3.2. Strength Test Results
4. Discussion
5. Conclusions
Author Contributions
Funding
Institutional Review Board Statement
Informed Consent Statement
Data Availability Statement
Acknowledgments
Conflicts of Interest
References
- Hao, M.; Wu, H.; Qiu, F.; Wang, X. Interface Bond Improvement of Sisal Fibre Reinforced Polylactide Composites with Added Epoxy Oligomer. Materials 2018, 11, 398. [Google Scholar] [CrossRef] [PubMed] [Green Version]
- Correa, C.R.; Kruse, A. Biobased functional carbon materials: Production, characterization, and applications—A review. Materials 2018, 11, 1568. [Google Scholar] [CrossRef] [PubMed] [Green Version]
- Johnson, P.C.; Clementson, C.L.; Mathanker, S.K.; Grift, T.E.; Hansen, A.C. Cutting energy characteristics of Miscanthus x giganteus stems with varying oblique angle and cutting speed. Biosyst. Eng. 2012, 112, 42–48. [Google Scholar] [CrossRef]
- Colmenares, J.C.; Luque, R.; Campelo, J.M.; Colmenares, F.; Karpiński, Z.; Romero, A.A. Nanostructured photocatalysts and their applications in the photocatalytic transformation of lignocellulosic biomass: An overview. Materials 2009, 2, 2228–2258. [Google Scholar] [CrossRef]
- Karbowniczak, A.; Hamerska, J.; Wrobel, M.; Jewiarz, M.; Necka, K. Evaluation of Selected Species of Woody Plants in Terms of Suitability for Energy Production. In Renewable Energy Sources: Engineering, Technology, Innovation; Mudryk, K., Werle, S., Eds.; Springer: New Delhi, India, 2018; pp. 735–742. [Google Scholar]
- EN ISO 17225-1:2014; Solid Biofuels–Fuel Specifications and Classes–Part 1: General Requirements. International Organization for Standardization: Geneva, Switzerland, 2014.
- Dyjakon, A.; Sobol, Ł.; Krotowski, M.; Mudryk, K.; Kawa, K. The impact of particles comminution on mechanical durability of wheat straw briquettes. Energies 2020, 13, 6186. [Google Scholar] [CrossRef]
- Niemczyk, M.; Bachilava, M.; Wróbel, M.; Jewiarz, M.; Kavtaradze, G.; Goginashvili, N. Productivity and biomass properties of poplar clones managed in short-rotation culture as a potential fuelwood source in georgia. Energies 2021, 14, 3016. [Google Scholar] [CrossRef]
- Wrobel, M.; Jewiarz, M.; Mudryk, K.; Knapczyk, A. Influence of Raw Material Drying Temperature on the Scots Pine (Pinus sylvestris L.) Biomass Agglomeration Process—A Preliminary Study. Energies 2020, 13, 1809. [Google Scholar] [CrossRef] [Green Version]
- Wrobel, M.; Mudryk, K.; Jewiarz, M.; Glowacki, S.; Tulej, W. Characterization of Selected Plant Species in Terms of Energetic Use. In Renewable Energy Sources: Engineering, Technology, Innovation; Mudryk, K., Werle, S., Eds.; Springer Proceedings in Energy: Cham, Switzerland, 2018; pp. 671–681. ISBN 978-3-319-72371-6. [Google Scholar]
- Lewandowski, I.; Clifton-Brown, J.C.; Scurlock, J.M.O.; Huisman, W. Miscanthus: European experience with a novel energy crop. Biomass Bioenergy 2000, 19, 209–227. [Google Scholar] [CrossRef]
- Dołzyńska, M.; Obidziński, S.; Kowczyk-Sadowy, M.; Krasowska, M. Densification and combustion of cherry stones. Energies 2019, 12, 3042. [Google Scholar] [CrossRef] [Green Version]
- García, R.; Gil, M.V.; Rubiera, F.; Pevida, C. Pelletization of wood and alternative residual biomass blends for producing industrial quality pellets. Fuel 2019, 251, 739–753. [Google Scholar] [CrossRef]
- Bryś, A.; Zielińska, J.; Głowacki, S.; Tulej, W.; Bryś, J. Analysis of possibilities of using biomass from cherry and morello cherry stones for energy purposes. E3S Web Conf. 2020, 154, 01005. [Google Scholar] [CrossRef] [Green Version]
- Mudryk, K.; Jewiarz, M.; Wróbel, M.; Niemiec, M.; Dyjakon, A. Evaluation of urban tree leaf biomass-potential, physico-mechanical and chemical parameters of raw material and solid biofuel. Energies 2021, 14, 818. [Google Scholar] [CrossRef]
- Brzychczyk, B.; Hebda, T.; Pedryc, N. The influence of artificial lighting systems on the cultivation of algae: The example of chlorella vulgaris. Energies 2020, 13, 5994. [Google Scholar] [CrossRef]
- Rezania, S.; Ponraj, M.; Din, M.F.M.; Songip, A.R.; Sairan, F.M.; Chelliapan, S. The diverse applications of water hyacinth with main focus on sustainable energy and production for new era: An overview. Renew. Sustain. Energy Rev. 2015, 41, 943–954. [Google Scholar] [CrossRef]
- Ayadi, R.; Koubaa, A.; Braghiroli, F.; Migneault, S.; Wang, H.; Bradai, C. Effect of the Pyro-Gasification Temperature of Wood on the Physical and Mechanical Properties of Biochar-Polymer Biocomposites. Materials 2020, 13, 1327. [Google Scholar] [CrossRef] [PubMed] [Green Version]
- Doczekalska, B.; Bartkowiak, M.; Waliszewska, B.; Orszulak, G.; Cerazy-Waliszewska, J.; Pniewski, T. Characterization of Chemically Activated Carbons Prepared from Miscanthus and Switchgrass Biomass. Materials 2020, 13, 1654. [Google Scholar] [CrossRef] [PubMed] [Green Version]
- Ahmed, W.; Alnajjar, F.; Zaneldin, E.; Al-Marzouqi, A.H.; Gochoo, M.; Khalid, S. Implementing FDM 3D printing strategies using natural fibers to produce biomass composite. Materials 2020, 13, 4065. [Google Scholar] [CrossRef]
- Hu, W.; Xiang, R.; Lin, J.; Cheng, Y.; Lu, C. Lignocellulosic biomass-derived carbon electrodes for flexible supercapacitors: An overview. Materials 2021, 14, 4571. [Google Scholar] [CrossRef]
- Clifton-Brown, J.C.; Lewandowski, I.; Andersson, B.; Basch, G.; Christian, D.G.; Kjeldsen, J.B.; Jørgensen, U.; Mortensen, J.V.; Riche, A.B.; Schwarz, K.U.; et al. Performance of 15 Miscanthus genotypes at five sites in Europe. Agron. J. 2001, 93, 1013–1019. [Google Scholar] [CrossRef] [Green Version]
- Hastings, A.; Clifton-Brown, J.; Wattenbach, M.; Mitchell, C.P.; Smith, P. The development of MISCANFOR, a new Miscanthus crop growth model: Towards more robust yield predictions under different climatic and soil conditions. GCB Bioenergy 2009, 1, 154–170. [Google Scholar] [CrossRef]
- Sacała, E. Biochemical and Physiological Characteristic: A Review. Ecol. Chem. Eng. A 2011, 18, 1615–1624. [Google Scholar]
- Pointeau, S.; Jaguenet, E.; Couty, A.; Dubois, F.; Rambaud, C.; Ameline, A. Differential performance and behavior of the corn leaf aphid, Rhopalosiphum maidis, on three species of the biomass crop miscanthus. Ind. Crops Prod. 2014, 54, 135–141. [Google Scholar] [CrossRef]
- Chae, W.B.; Hong, S.J.; Gifford, J.M.; Lane Rayburn, A.; Widholm, J.M.; Juvik, J.A. Synthetic polyploid production of miscanthus sacchariflorus, miscanthus sinensis, and miscanthus × giganteus. GCB Bioenergy 2013, 5, 338–350. [Google Scholar] [CrossRef]
- Dohleman, F.G.; Heaton, E.A.; Leakey, A.D.B.; Long, S.P. Does greater leaf-level photosynthesis explain the larger solar energy conversion efficiency of Miscanthus relative to switchgrass? Plant Cell Environ. 2009, 32, 1525–1537. [Google Scholar] [CrossRef] [PubMed]
- Clifton-Brown, J.C.; Lewandowski, I. Water use efficiency and biomass partitioning of three different Miscanthus genotypes with limited and unlimited water supply. Ann. Bot. 2000, 86, 191–200. [Google Scholar] [CrossRef]
- Jach-Nocoń, M.; Pełka, G.; Luboń, W.; Mirowski, T.; Nocoń, A.; Pachytel, P. An Assessment of the Efficiency and Emissions of a Pellet Boiler Combusting Multiple Pellet Types. Energies 2021, 14, 4465. [Google Scholar] [CrossRef]
- Fusi, A.; Bacenetti, J.; Proto, A.R.; Tedesco, D.E.A.; Pessina, D.; Facchinetti, D. Pellet Production from Miscanthus: Energy and Environmental Assessment. Energies 2021, 14, 73. [Google Scholar] [CrossRef]
- Francik, S.; Knapczyk, A.; Knapczyk, A.; Francik, R. Decision Support System for the Production of Miscanthus and Willow Briquettes. Energies 2020, 13, 1364. [Google Scholar] [CrossRef] [Green Version]
- Styks, J.; Wróbel, M.; Frączek, J.; Knapczyk, A. Effect of Compaction Pressure and Moisture Content on Quality Parameters of Perennial Biomass Pellets. Energies 2020, 13, 1859. [Google Scholar] [CrossRef] [Green Version]
- Hodgson, E.M.; Nowakowski, D.J.; Shield, I.; Riche, A.; Bridgwater, A.V.; Clifton-Brown, J.C.; Donnison, I.S. Variation in Miscanthus chemical composition and implications for conversion by pyrolysis and thermo-chemical bio-refining for fuels and chemicals. Bioresour. Technol. 2011, 102, 3411–3418. [Google Scholar] [CrossRef]
- Kiesel, A.; Wagner, M.; Lewandowski, I. Environmental Performance of Miscanthus, Switchgrass and Maize: Can C4 Perennials Increase the Sustainability of Biogas Production? Sustainability 2017, 9, 5. [Google Scholar] [CrossRef] [Green Version]
- Smuga-Kogut, M.; Kogut, T.; Markiewicz, R.; Słowik, A. Use of Machine Learning Methods for Predicting Amount of Bioethanol Obtained from Lignocellulosic Biomass with the Use of Ionic Liquids for Pretreatment. Energies 2021, 14, 243. [Google Scholar] [CrossRef]
- Marín, F.; Sánchez, J.L.; Arauzo, J.; Fuertes, R.; Gonzalo, A. Semichemical pulping of Miscanthus giganteus. Effect of pulping conditions on some pulp and paper properties. Bioresour. Technol. 2009, 100, 3933–3940. [Google Scholar] [CrossRef] [PubMed]
- Dias, P.P.; Waldmann, D. Optimisation of the mechanical properties of Miscanthus lightweight concrete. Constr. Build. Mater. 2020, 258, 119643. [Google Scholar] [CrossRef]
- Cudjoe, E.; Hunsen, M.; Xue, Z.; Way, A.E.; Barrios, E.; Olson, R.A.; Hore, M.J.A.; Rowan, S.J. Miscanthus Giganteus: A commercially viable sustainable source of cellulose nanocrystals. Carbohydr. Polym. 2017, 155, 230–241. [Google Scholar] [CrossRef] [PubMed]
- Voicu, G.; Moiceanu, E.; Sandu, M.; Poenaru, I.C.; Voicu, P. Experiments regarding mechanical behaviour of energetic plant miscanthus to crushing and shear stress. In Proceedings of the Engineering for Rural Development, Jelgava, Latvia, 26–27 May 2011; pp. 490–495. [Google Scholar]
- Liu, Q.; Mathanker, S.K.; Zhang, Q.; Hansen, A.C. Biomechanical properties of miscanthus stems. Trans. ASABE 2012, 55, 1125–1131. [Google Scholar] [CrossRef]
- Moiceanu, G.; Voicu, P.; Paraschiv, G.; Voicu, G. Behaviour of Miscanthus at cutting shear with straight knives with different edge angles. Environ. Eng. Manag. J. 2017, 16, 1203–1209. [Google Scholar] [CrossRef]
- Boydaş, M.G.; Çomakli, M.; Sayinci, B.; Kara, M. Effects of moisture content, internode region, and oblique angle on the mechanical properties of sainfoin stem. Turk. J. Agric. For. 2019, 43, 254–263. [Google Scholar] [CrossRef] [Green Version]
- Lubis, A.; Mandang, T.; Hermawan, W. Sutrisno Study of the physical and mechanical characteristics of patchouli plants. AIMS Agric. Food 2021, 6, 525–537. [Google Scholar] [CrossRef]
- Słupska, M.; Dyjakon, A.; Stopa, R. Determination of strength properties of energy plants on the example of miscanthus-giganteus, rosa multiflora and salix viminalis. Energies 2019, 12, 3660. [Google Scholar] [CrossRef] [Green Version]
- Wójcik, A.; Frączek, J.; Niemczewska-Wójcik, M. The relationship between static and kinetic friction for plant granular materials. Powder Technol. 2020, 361, 739–747. [Google Scholar] [CrossRef]
- Wójcik, A.; Frączek, J.; Wota, A.K. The methodical aspects of the friction modeling of plant granular materials. Powder Technol. 2019, 344, 504–513. [Google Scholar] [CrossRef]
- Gomez, F.E.; Muliana, A.H.; Rooney, W.L. Predicting stem strength in diverse bioenergy sorghum genotypes. Crop Sci. 2018, 58, 739–751. [Google Scholar] [CrossRef] [Green Version]
- Kaack, K.; Schwarz, K.-U. Morphological and mechanical properties of Miscanthus in relation to harvesting, lodging, and growth conditions. Ind. Crops Prod. 2001, 14, 145–154. [Google Scholar] [CrossRef]
- Kaack, K.; Schwarz, K.U.; Brander, P.E. Variation in morphology, anatomy and chemistry of stems of Miscanthus genotypes differing in mechanical properties. Ind. Crops Prod. 2003, 17, 131–142. [Google Scholar] [CrossRef]
- Spatz, H.C.; Beismann, H.; Brüchert, F.; Emanns, A.; Speck, T. Biomechanics of the giant reed Arundo donax. Philos. Trans. R. Soc. B Biol. Sci. 1997, 352, 1–10. [Google Scholar] [CrossRef] [Green Version]
- Zhen, C.; Xin, J.; Qingxi, L. Experimental research on physical and mechanical parameters of matured bottom stalk of the reed. Int. J. Agric. Biol. Eng. 2011, 4, 352. [Google Scholar] [CrossRef]
- Wright, C.T.; Pryfogle, P.A.; Stevens, N.A.; Steffler, E.D.; Hess, J.R.; Ulrich, T.H. Biomechanics of wheat/barley straw and corn stover. In Twenty-Sixth Symposium on Biotechnology for Fuels and Chemicals ABAB Symposium; Davison, B.H., Evans, B.R., Finkelstein, M., McMillan, J.D., Eds.; Humana Press: Totova, NJ, USA, 2005; Volume 121, pp. 5–19. [Google Scholar] [CrossRef] [Green Version]
- Hamman, K.D.; Williamson, R.L.; Steffler, E.D.; Wright, C.T.; Hess, J.R.; Pryfogle, P.A. Structural analysis of wheat stems. In Twenty-Sixth Symposium on Biotechnology for Fuels and Chemicals; Davison, B.H., Evans, B.R., Finkelstein, M., McMillan, J.D., Eds.; Humana Press: Totova, NJ, USA, 2005; Volume 121, pp. 71–80. [Google Scholar] [CrossRef]
- Dunn, G.H.; Dabney, S.M. Modulus of elasticity and moment of inertia of grass hedge stems. Trans. Am. Soc. Agric. Eng. 1996, 39, 947–952. [Google Scholar] [CrossRef]
- Moiceanu, G.; Voicu, G.; Paraschiv, G.; Poenaru, I.; Biris, S.S. Mechanical characteristics of miscanthus stalks obtained by compression tests. In Proceedings of the Actual Tasks on Agricultural Engineering: Proceedings of the 40. International Symposium on Agricultural Engineering, Opatija, Croatia, 21–24 February 2012; pp. 507–516. [Google Scholar]
- Annoussamy, M.; Richard, G.; Recous, S.; Guérif, J. Change in mechanical properties of wheat straw due to decomposition and moisture. Appl. Eng. Agric. 2000, 16, 657–664. [Google Scholar] [CrossRef]
- Salzer, C.; Wallbaum, H.; Alipon, M.; Lopez, L.F. Determining material suitability for Low-Rise housing in the Philippines: Physical and mechanical properties of the bamboo species Bambusa blumeana. BioResources 2018, 13, 346–369. [Google Scholar] [CrossRef]
- Suriani, E. A Study of the Physical-Mechanical Properties of Bamboo in Indonesia. In Proceedings of the Built Environment, Science and Technology International Conference, Surabaya, Indonesia, 18–19 September 2018; SCITEPRESS Science and Technology Publications: Setúbal, Portugal; pp. 154–162. [Google Scholar]
- Tomak, E.D.; Topaloglu, E.; Ay, N.; Yildiz, U.C. Effect of accelerated aging on some physical and mechanical properties of bamboo. Wood Sci. Technol. 2012, 46, 905–918. [Google Scholar] [CrossRef]
- Ordóñez-Candelaria, V.R.; Bárcenas-Pazos, G.M. Physical and mechanical properties of three Mexican guaduas (Guadua aculeata, Guadua amplexifolia and Guadua velutina) [Propiedades físicas y mecánicas de tres especies de guaduas mexicanas (Guadua aculeata, Guadua amplexifolia y Guadua velutina)]. Madera Y Bosques 2014, 20, 111–125. [Google Scholar] [CrossRef]
- Dubey, Y.M.; Khanduri, A.K.; Sharma, S.D. Physical and strength properties of Bambusa striata. J. Indian Acad. Wood Sci. 2017, 14, 110–114. [Google Scholar] [CrossRef]
- Dixon, P.G.; Gibson, L.J. The structure and mechanics of Moso bamboo material. J. R. Soc. Interface 2014, 11, 20140321. [Google Scholar] [CrossRef]
- Hu, W.; Chen, B.; Zhang, T. Experimental and numerical studies on mechanical behaviors of beech wood under compressive and tensile states. Wood Res. 2021, 66, 27–38. [Google Scholar] [CrossRef]
- Hu, W.; Wan, H.; Guan, H. Size effect on the elastic mechanical properties of beech and its application in finite element analysis of wood structures. Forests 2019, 10, 783. [Google Scholar] [CrossRef] [Green Version]
- Huang, X.; Li, F.; de Hoop, C.F.; Jiang, Y.; Xie, J.; Qi, J. Analysis of bambusa rigida bamboo culms between internodes and nodes: Anatomical characteristics and physical-mechanical properties. For. Prod. J. 2018, 68, 157–162. [Google Scholar] [CrossRef]
- Huang, X.; Xie, J.; Qi, J.; de Hoop, C.F.; Xiao, H.; Chen, Y.; Li, F. Differences in physical–mechanical properties of bamboo scrimbers with response to bamboo maturing process. Eur. J. Wood Wood Prod. 2018, 76, 1137–1143. [Google Scholar] [CrossRef]
- EN 13183-1:2002; Moisture Content of a Piece of Sawn Timber—Part 1: Determination by Oven Dry Method. European Committee for Standardization: Geneva, Switzerland, 2002.
- Manríquez, M.J.; Moraes, P.D. Influence of the temperature on the compression strength parallel to grain of paricá. Constr. Build. Mater. 2010, 24, 99–104. [Google Scholar] [CrossRef]
- Jiménez-Espada, M.; Herrero-Adán, D.; González-Escobar, R. Characterization of Mechanical and Hygroscopic Properties of Individual Canes of Reed. Materials 2021, 14, 2193. [Google Scholar] [CrossRef]
- Chaowana, K.; Wisadsatorn, S.; Chaowana, P. Bamboo as a sustainable building material—culm characteristics and properties. Sustainability 2021, 13, 7376. [Google Scholar] [CrossRef]
- Zhong, Y.; Ren, H.-Q.; Jiang, Z.-H. Effects of temperature on the compressive strength parallel to the grain of bamboo scrimbe. Materials 2016, 9, 436. [Google Scholar] [CrossRef] [PubMed] [Green Version]
- Al-Zube, L.A.; Robertson, D.J.; Edwards, J.N.; Sun, W.; Cook, D.D. Measuring the compressive modulus of elasticity of pith-filled plant stems. Plant Methods 2017, 13, 1–9. [Google Scholar] [CrossRef] [PubMed]
- Daud, N.M.; Nor, N.M.; Yusof, M.A.; Al Bakhri, A.A.M.; Shaari, A.A. The physical and mechanical properties of treated and untreated Gigantochloa Scortechinii bamboo. Proc. AIP Conf. Proc. 2018, 1930, 020016. [Google Scholar]
- Bui, Q.-B.; Grillet, A.-C.; Tran, H.-D. A bamboo treatment procedure: Effects on the durability and mechanical performance. Sustainability 2017, 9, 1444. [Google Scholar] [CrossRef] [Green Version]
- Al-Zube, L.; Sun, W.; Robertson, D.; Cook, D. The elastic modulus for maize stems. Plant Methods 2018, 14, 1–12. [Google Scholar] [CrossRef]
- Slater, D.; Ennos, A.R. Determining the mechanical properties of hazel forks by testing their component parts. Trees Struct. Funct. 2013, 27, 1515–1524. [Google Scholar] [CrossRef]
- Skubisz, G. Method for the determination of the mechanical properties of pea stems. Int. Agrophys. 2002, 16, 73–77. [Google Scholar]
- Francik, R.; Kryczyk-Kozioł, J.; Francik, S.; Gryboś, R.; Krośniak, M. Bis(4,4′-dimethyl-2,2′-bipyridine) oxidovanadium(IV) Sulfate Dehydrate: Potential Candidate for Controlling Lipid Metabolism? Biomed Res. Int. 2017, 2017, 1–5. [Google Scholar] [CrossRef]
- Francik, S.; Francik, R.; Sadowska, U.; Bystrowska, B.; Zawiślak, A.; Knapczyk, A.; Nzeyimana, A. Identification of phenolic compounds and determination of antioxidant activity in extracts and infusions of salvia leaves. Materials 2020, 13, 5811. [Google Scholar] [CrossRef]
- Lima, D.M.; Linhares, T.S.; Lima, S.N.L.; Carvalho, E.M.; Loguercio, A.D.; Bauer, J.; Carvalho, C.N. Effect of sonic application of self-adhesive resin cements on push-out bond strength of glass fiber posts to root dentin. Materials 2019, 12, 1930. [Google Scholar] [CrossRef] [PubMed] [Green Version]
- Shahrul, S.; Mohammed, B.S.; Wahab, M.M.A.; Liew, M.S. Mechanical properties of crumb rubber mortar containing nano-silica using response surface methodology. Materials 2021, 14, 5496. [Google Scholar] [CrossRef] [PubMed]
- Skoczylas, A.; Zaleski, K.; Zaleski, R.; Gorgol, M. Analysis of surface properties of nickel alloy elements exposed to impulse shot peening with the use of positron annihilation. Materials 2021, 14, 7328. [Google Scholar] [CrossRef] [PubMed]
- Correal, D.J.F.; Juliana Arbeláez, C. Influence of age and height position on colombian Guadua angustifolia bambo mechanical properties. Maderas Cienc. Y Tecnol. 2010, 12, 105–113. [Google Scholar] [CrossRef] [Green Version]


| Authors | MOEbend [GPa] | Source |
|---|---|---|
| Słupska et al. | 2.93–4.42 | [44] |
| Nowakowski et al. | 1.70–1.84 | [44] |
| Kaack and Schwartz | 2–8 (mean 4.5) | [48] |
| Kaack et al. | 4.27 | [49] |
| Liu et al. | 4.6–10.3 | [40] |
| MC 1 | NrNod 1 | Dmax 1 Mean (Max/Min) [mm] | Dmin 1 Mean (Max/Min) [mm] | g 1 Mean (Max/Min) [mm] |
|---|---|---|---|---|
| 20.7% | 1 | 9.8 (11.2/9.09) | 8.81 (8.91/8.65) | 1.46 (1.59/1.37) |
| 3 | 8.57 (10.05/7.67) | 8 (8.41/7.48) | 1.3 (1.42/1.22) | |
| 5 | 8.35 (9.97/7.3) | 6.76 (7.22/5.92) | 1.14 (1.24/1.07) | |
| 7 | 6.99 (8.6/5.75) | 5.63 (6.34/4.55) | 0.93 (1.01/0.87) | |
| 9 | 6.68 (8.39/5.36) | 5.53 (6.46/4.1) | 0.74 (0.8/0.69) | |
| 25.8% | 1 | 9.78 (10.66/9.25) | 8.83 (8.99/8.63) | 1.47 (1.54/1.32) |
| 3 | 8.63 (9.54/8) | 8.09 (8.57/7.53) | 1.31 (1.37/1.18) | |
| 5 | 8.43 (9.43/7.78) | 6.85 (7.38/6.26) | 1.15 (1.2/1.03) | |
| 7 | 6.99 (8.16/6.36) | 5.81 (6.47/5.13) | 0.94 (0.98/0.84) | |
| 9 | 6.68 (8.01/6.12) | 5.73 (6.4/5.06) | 0.74 (0.78/0.67) |
| MC 1 | NrNod 1 | Dmax 1 Mean (Max/Min) [mm] | Dmin 1 Mean (Max/Min) [mm] | g 1 Mean (Max/Min) [mm] |
|---|---|---|---|---|
| 22.6% | 1 | 9.6 (10.83/8.27) | 8.6 (9.2/8) | 1.47 (1.7/1.28) |
| 3 | 8.5 (9.83/7.27) | 7.91 (8.6/7.3) | 1.34 (1.63/1.25) | |
| 5 | 8.32 (9.99/6.89) | 6.77 (7.7/6.1) | 1.2 (1.41/1.04) | |
| 7 | 7.1 (8.71/5.7) | 5.67 (6.6/4.8) | 1.01 (1.21/0.81) | |
| 9 | 6.69 (7.95/5.54) | 5.55 (6.6/4.7) | 0.8 (0.99/0.66) | |
| 29.8% | 1 | 9.69 (10.16/9.05) | 8.79 (8.9/8.58) | 1.46 (1.66/1.12) |
| 3 | 8.64 (9.98/7.71) | 8.07 (8.56/7.55) | 1.29 (1.47/0.99) | |
| 5 | 8.32 (9.62/7.3) | 6.87 (8.19/5.91) | 1.15 (1.31/0.88) | |
| 7 | 6.96 (8.16/5.75) | 5.84 (7.08/4.92) | 0.94 (1.07/0.72) | |
| 9 | 6.61 (7.96/5.36) | 5.78 (6.94/4.76) | 0.75 (0.86/0.58) | |
| 38.8% | 1 | 9.66 (10.33/9.05) | 8.78 (8.91/8.59) | 1.46 (1.59/1.31) |
| 3 | 8.63 (9.67/7.77) | 8.09 (8.65/7.65) | 1.32 (1.44/1.18) | |
| 5 | 8.42 (9.71/7.66) | 6.72 (7.79/6.02) | 1.17 (1.27/1.05) | |
| 7 | 6.98 (8.54/5.98) | 5.6 (6.83/4.66) | 0.97 (1.05/0.87) | |
| 9 | 6.66 (8.21/5.74) | 5.52 (6.75/4.5) | 0.78 (0.85/0.7) |
| Mean (Standard Deviation) [Mpa] | ||||||
|---|---|---|---|---|---|---|
| Parameter | MC [%] | NrNod = 1 | NrNod = 3 | NrNod = 5 | NrNod = 7 | NrNod = 9 |
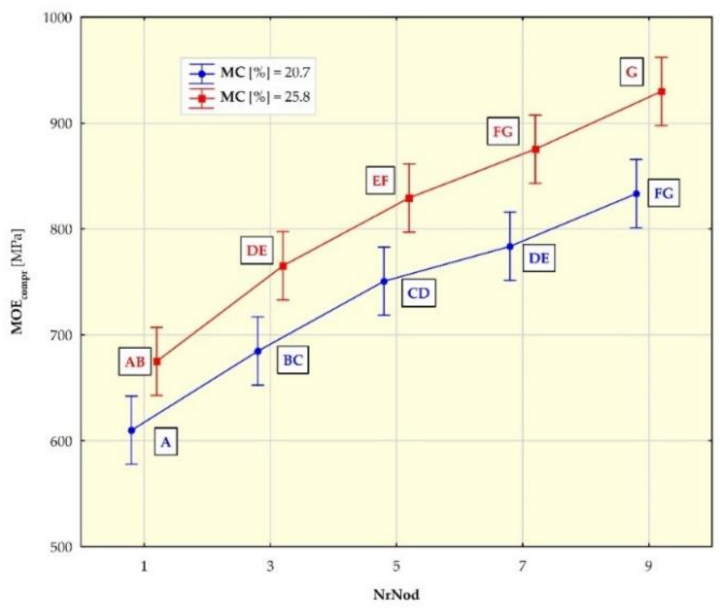
| MOEcompr 1 [Mpa] | 20.7 | 610 (85) | 685 (50) | 751 (91) | 784 (39) | 833 (61) |
| 25.8 | 675 (63) | 765 (59) | 829 (51) | 875 (59) | 930 (55) | |
| σcompr 1 [Mpa] | 20.7 | 27.3 (0.4) | 28.4 (0.3) | 31.1 (0.9) | 32.6 (1.3) | 37.9 (1.4) |
| 25.8 | 26.1 (1.1) | 27.5 (1) | 29 (1.2) | 30.1 (1.3) | 34.1 (1.2) | |
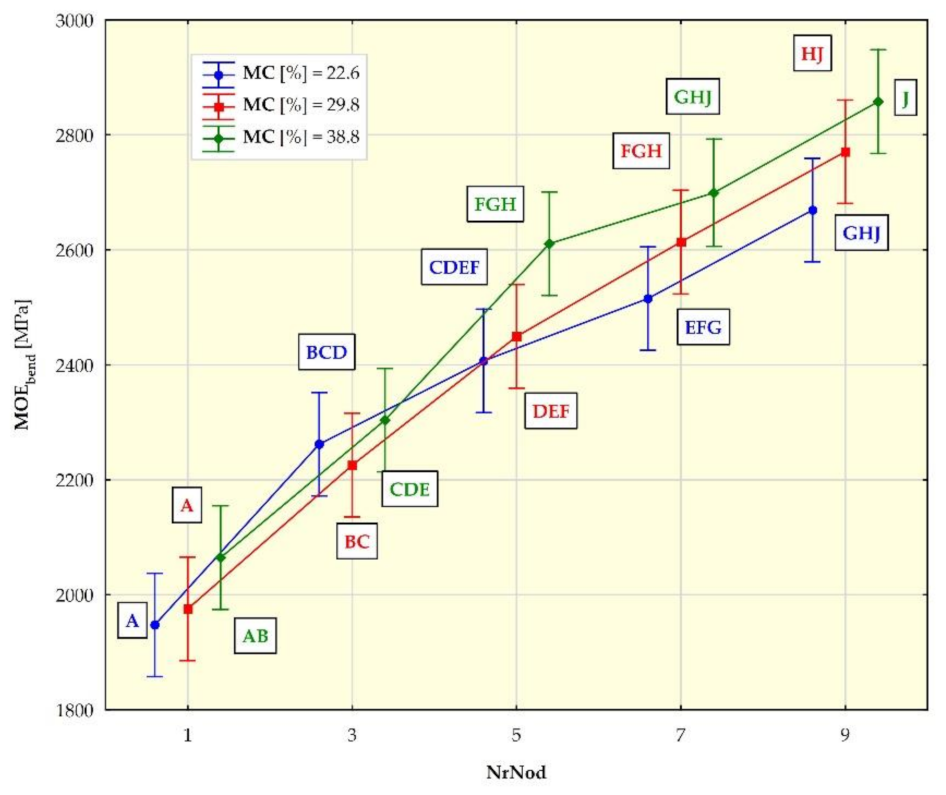
| MOEbend 1 [Mpa] | 22.6 | 1948 (257) | 2262 (180) | 2407 (219) | 2515 (236) | 2669 (233) |
| 29.8 | 1976 (183) | 2226 (92) | 2450 (193) | 2614 (225) | 2771 (79) | |
| 38.8 | 2065 (169) | 2304 (99) | 2611 (142) | 2699 (106) | 2858 (79) | |
| σbend 1 [Mpa] | 22.6 | 71.1 (4.2) | 82.9 (5) | 97.5 (6.8) | 126.9 (13.4) | 137.8 (14.5) |
| 29.8 | 62.5 (3.3) | 77.4 (9.6) | 90.4 (15.1) | 109 (22) | 123.7 (27.4) | |
| 38.8 | 58.3 (1.8) | 69.2 (3.9) | 83.1 (4.6) | 98.3 (7) | 112 (8.7) | |
| Source of Variation | SS 1 | df 1 | MS 1 | F 1 | p 1 | Significant |
|---|---|---|---|---|---|---|
| MC | 255,205 | 1 | 255,205 | 64.13 | 0.0000 | Yes |
| NrNod | 1,038,906 | 4 | 259,727 | 65.27 | 0.0000 | Yes |
| MC * NrNod | 4499 | 4 | 1125 | 0.28 | 0.8888 | No |
| Error | 557,135 | 140 | 3980 |
| Source of Variation | SS 1 | df 1 | MS 1 | F 1 | p 1 | Significant |
|---|---|---|---|---|---|---|
| MC | 161.4 | 1 | 161.4 | 138.5 | 0.0000 | Yes |
| NrNod | 1487.9 | 4 | 372.0 | 319.1 | 0.0000 | Yes |
| MC * NrNod | 38.4 | 4 | 9.6 | 8.2 | 0.0000 | Yes |
| Error | 159.7 | 137 | 1.2 |
| Source of Variation | SS 1 | df 1 | MS 1 | F 1 | p 1 | Significant |
|---|---|---|---|---|---|---|
| MC | 8.408 × 10⁵ | 2 | 4.204 × 10⁵ | 13.42 | 0.0000 | Yes |
| NrNod | 1.636 × 10⁷ | 4 | 4.090 × 10⁶ | 130.59 | 0.0000 | Yes |
| MC * NrNod | 1.796 × 10⁵ | 8 | 2.245 × 10⁴ | 0.72 | 0.6768 | No |
| Error | 6.547 × 10⁶ | 209 | 3.132 × 10⁴ |
| Source of Variation | SS 1 | df 1 | MS 1 | F 1 | p 1 | Significant |
|---|---|---|---|---|---|---|
| MC | 13,613 | 2 | 6806 | 45.84 | 0.0000 | Yes |
| NrNod | 108,566 | 4 | 27,141 | 182.80 | 0.0000 | Yes |
| MC * NrNod | 1825 | 8 | 228 | 1.54 | 0.1462 | No |
| Error | 30,883 | 208 | 148 |
Publisher’s Note: MDPI stays neutral with regard to jurisdictional claims in published maps and institutional affiliations. |
© 2022 by the authors. Licensee MDPI, Basel, Switzerland. This article is an open access article distributed under the terms and conditions of the Creative Commons Attribution (CC BY) license (https://creativecommons.org/licenses/by/4.0/).
Share and Cite
Francik, S.; Knapik, P.; Łapczyńska-Kordon, B.; Francik, R.; Ślipek, Z. Values of Selected Strength Parameters of Miscanthus × Giganteus Stalk Depending on Water Content and Internode Number. Materials 2022, 15, 1480. https://doi.org/10.3390/ma15041480
Francik S, Knapik P, Łapczyńska-Kordon B, Francik R, Ślipek Z. Values of Selected Strength Parameters of Miscanthus × Giganteus Stalk Depending on Water Content and Internode Number. Materials. 2022; 15(4):1480. https://doi.org/10.3390/ma15041480
Chicago/Turabian StyleFrancik, Sławomir, Paweł Knapik, Bogusława Łapczyńska-Kordon, Renata Francik, and Zbigniew Ślipek. 2022. "Values of Selected Strength Parameters of Miscanthus × Giganteus Stalk Depending on Water Content and Internode Number" Materials 15, no. 4: 1480. https://doi.org/10.3390/ma15041480