
Coupling Analysis on Microstructure and Residual Stress in Selective Laser Melting (SLM) with Varying Key Process Parameters


Abstract
:1. Introduction
2. Materials and Methods
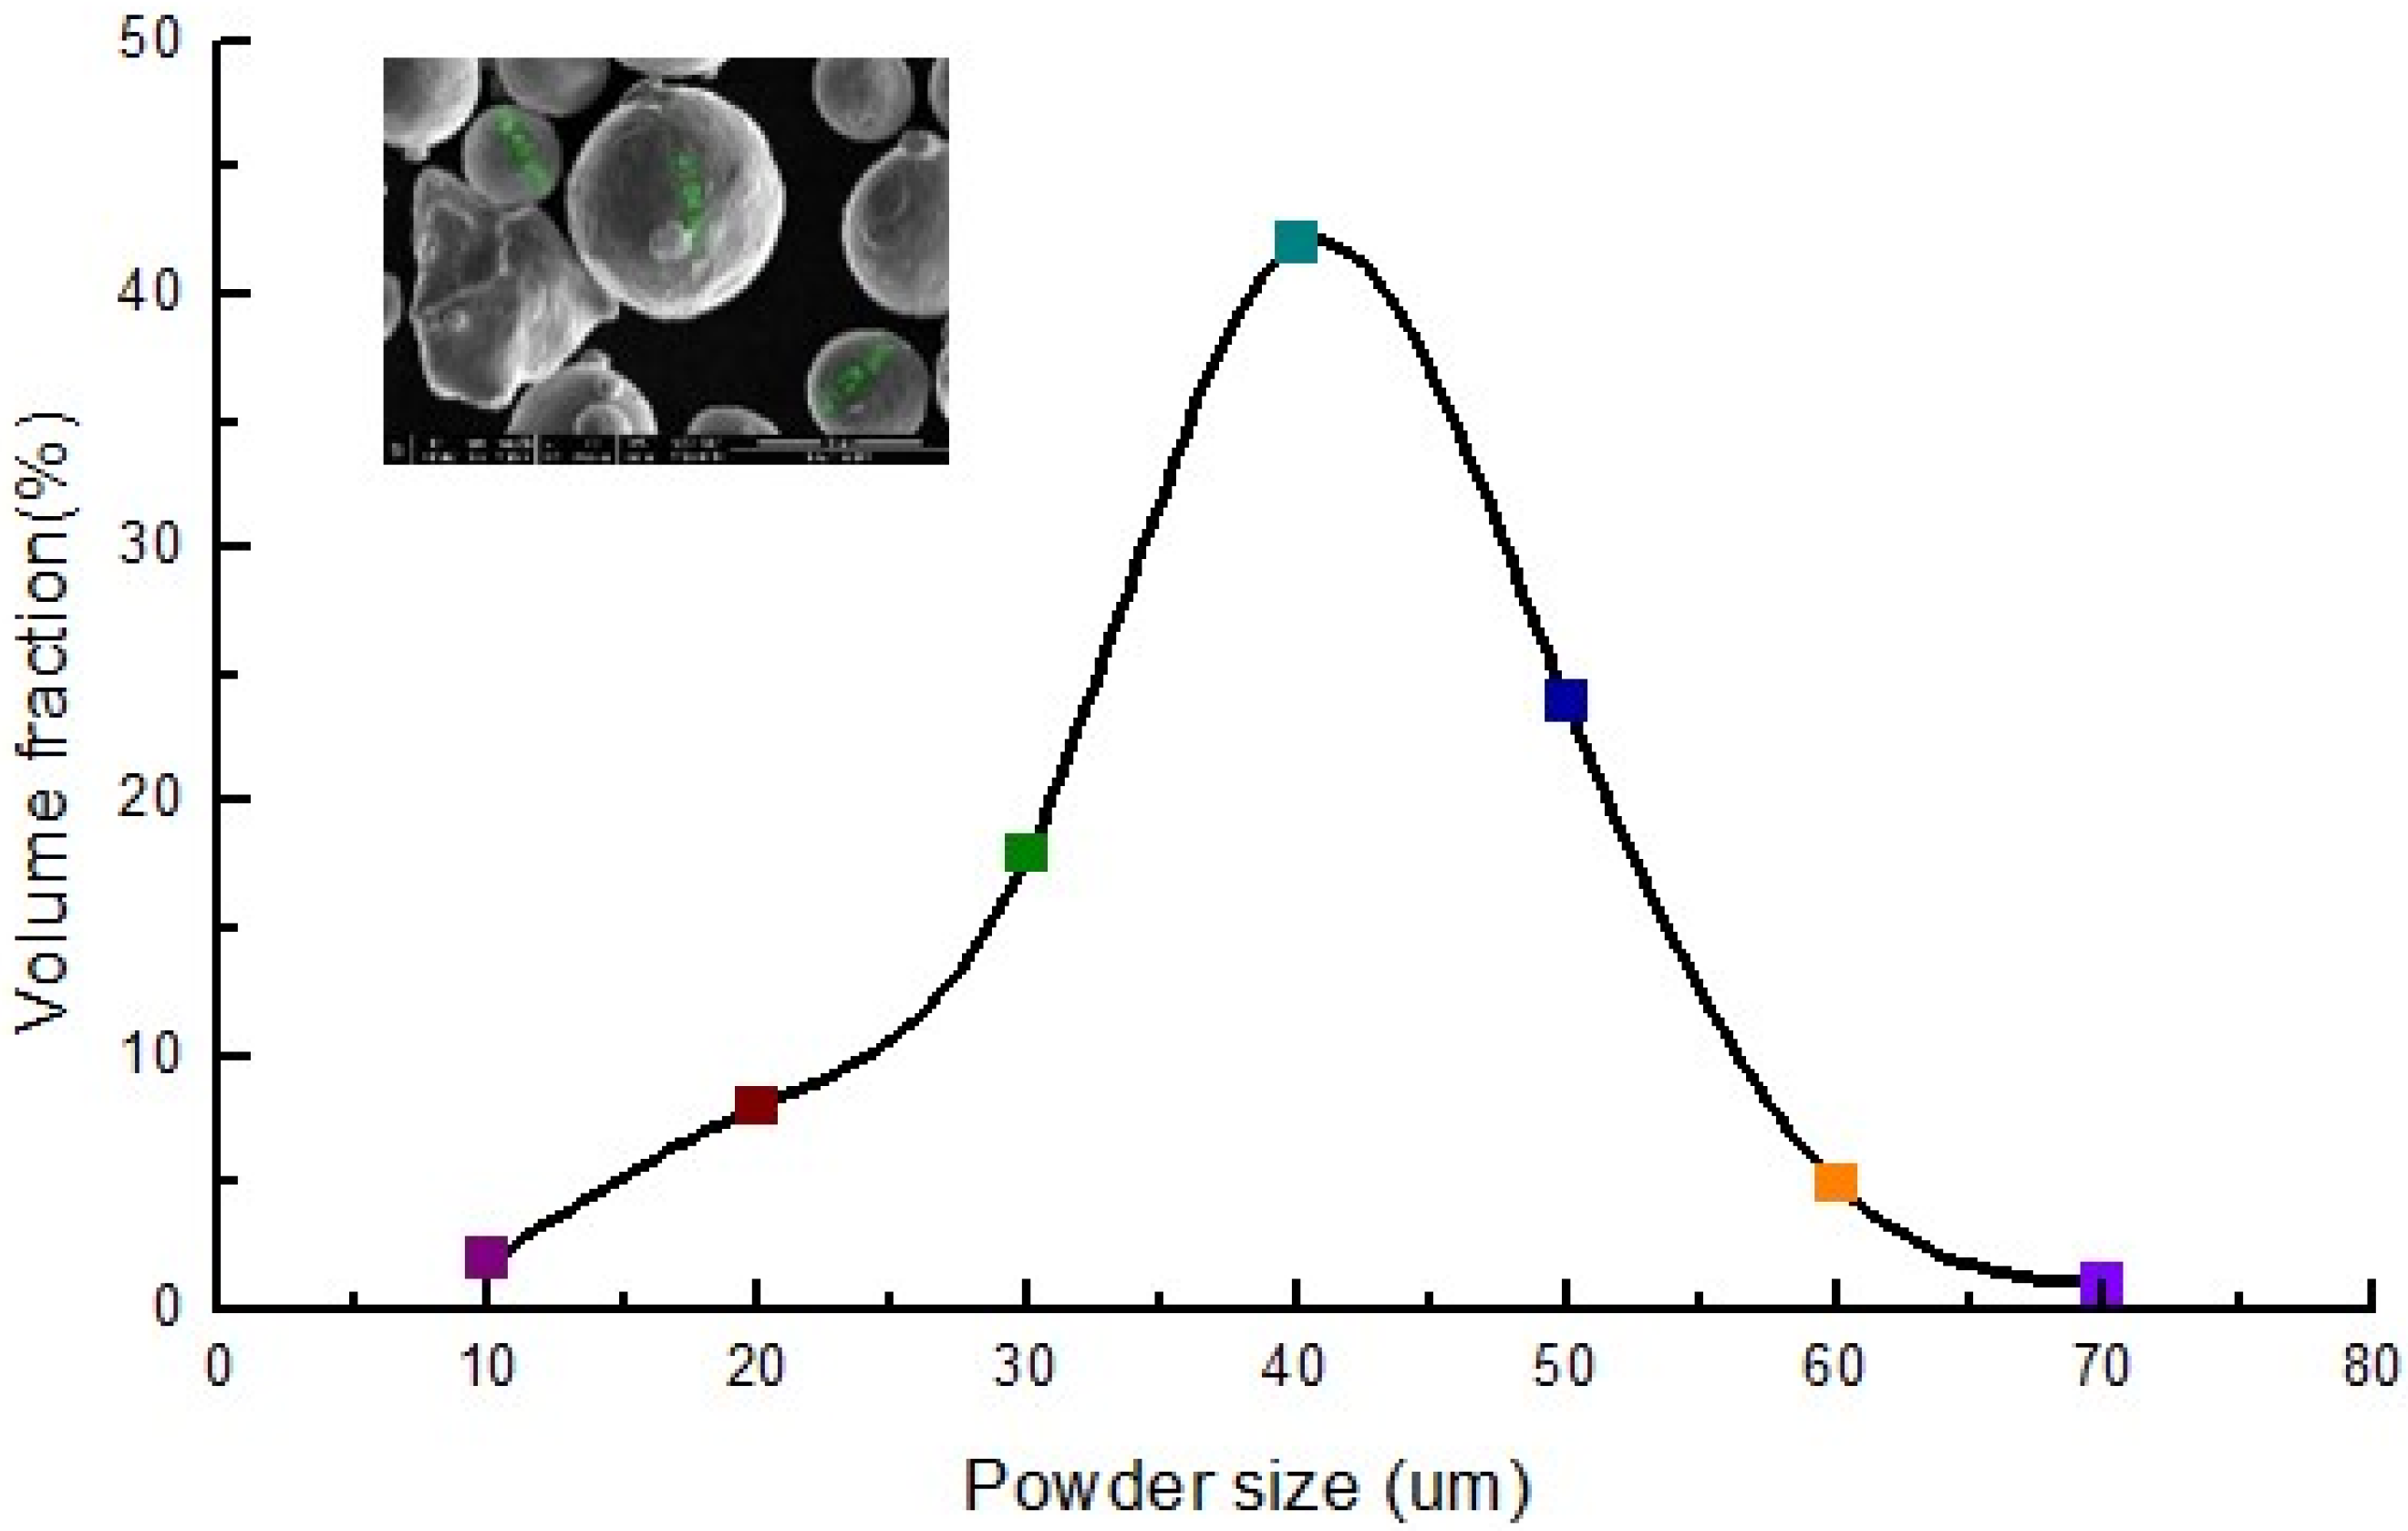
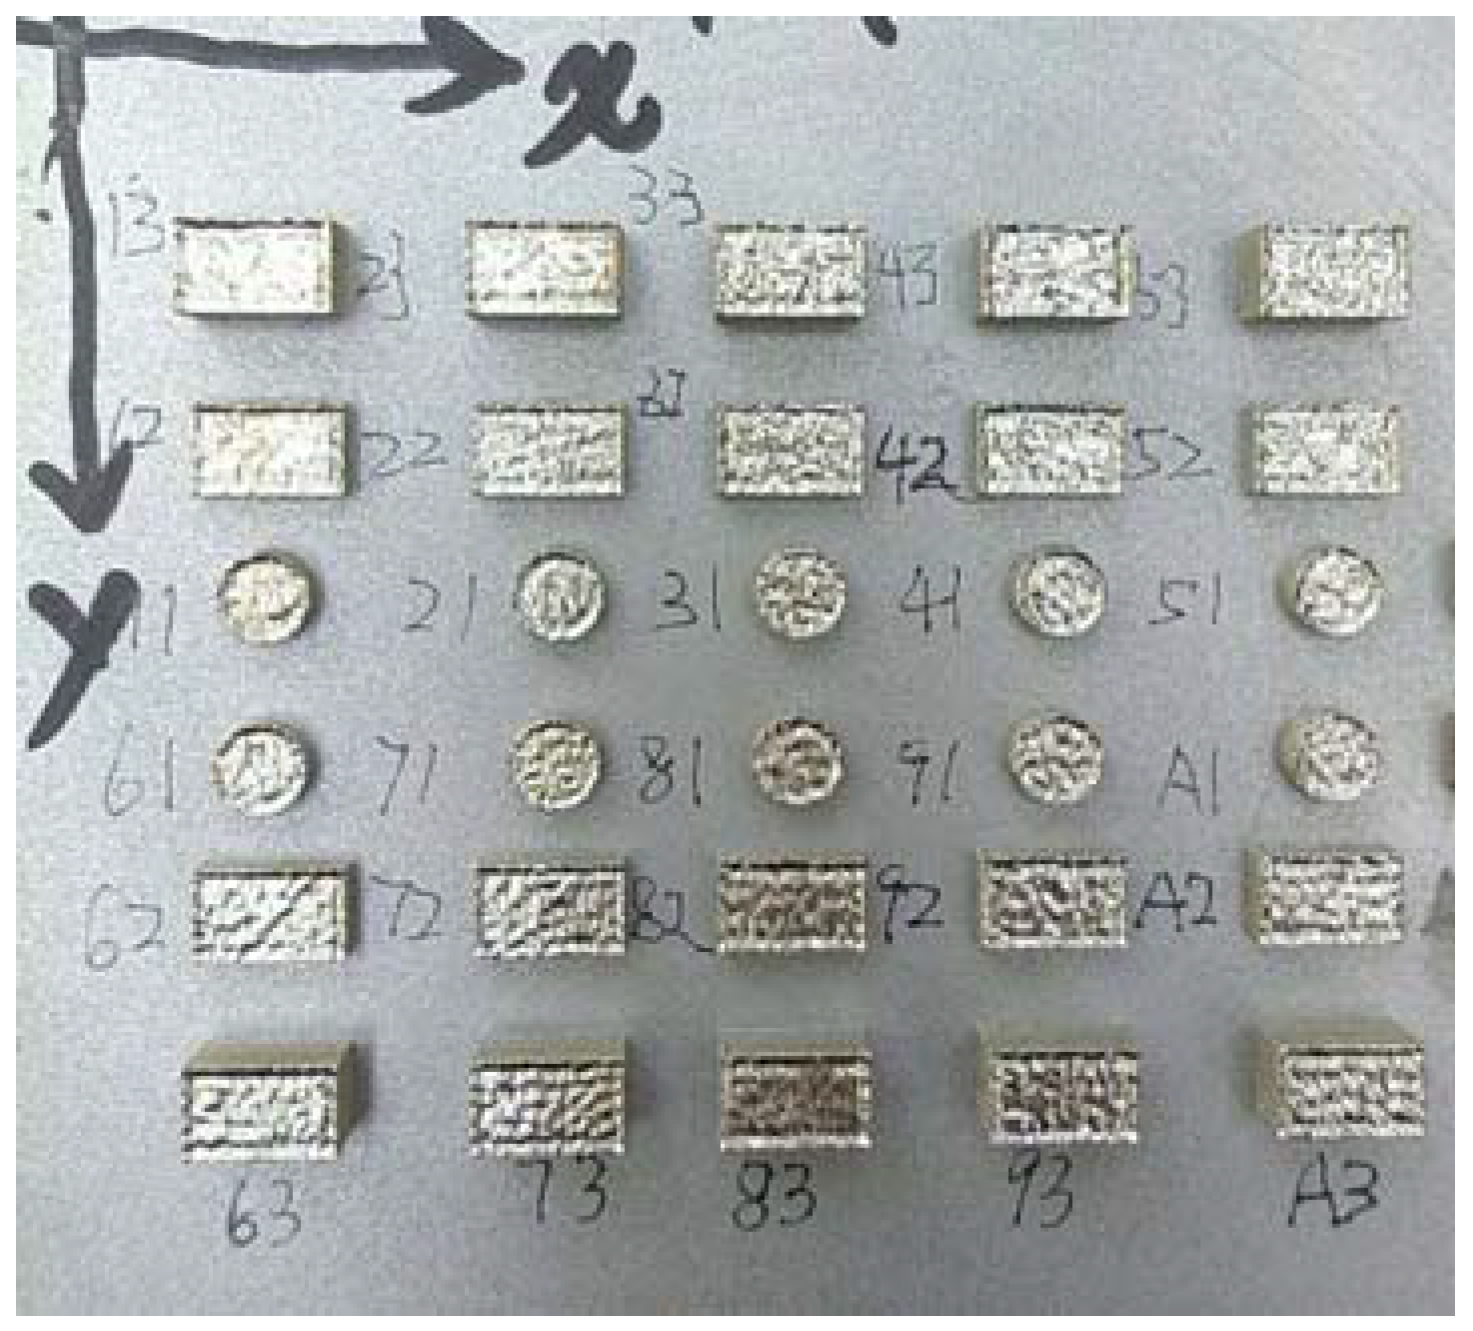
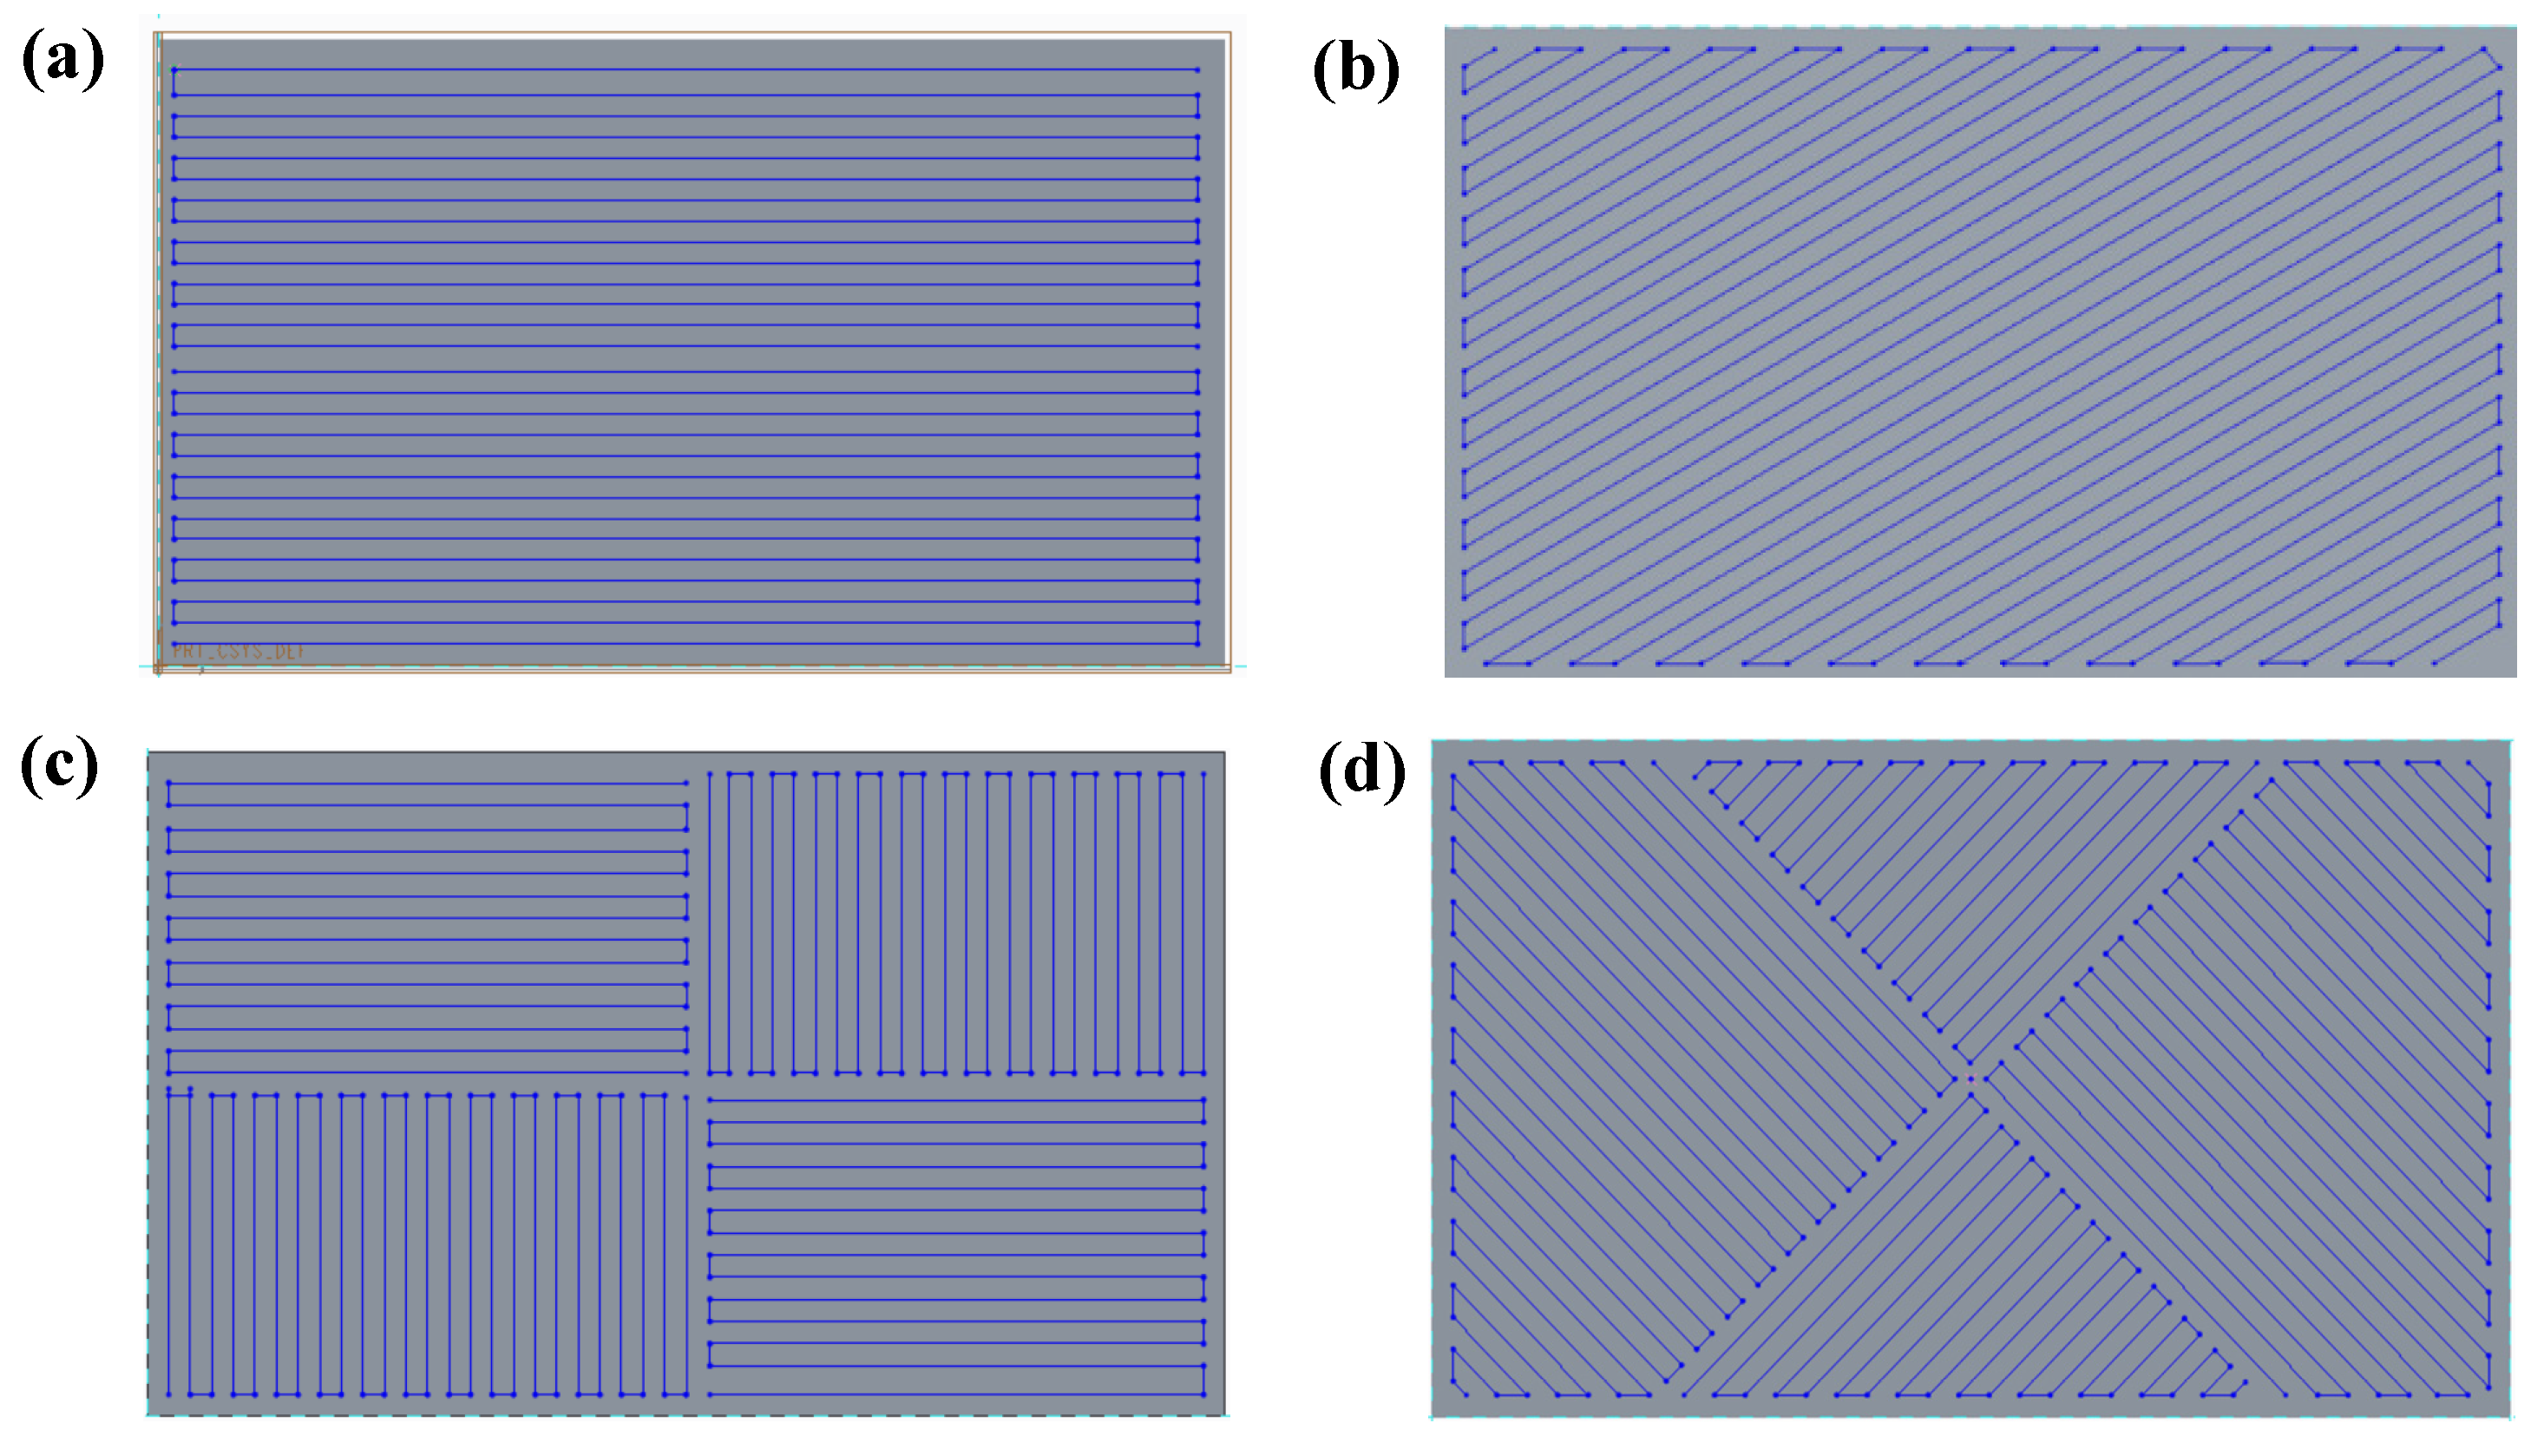
2.1. Manufacturing Process
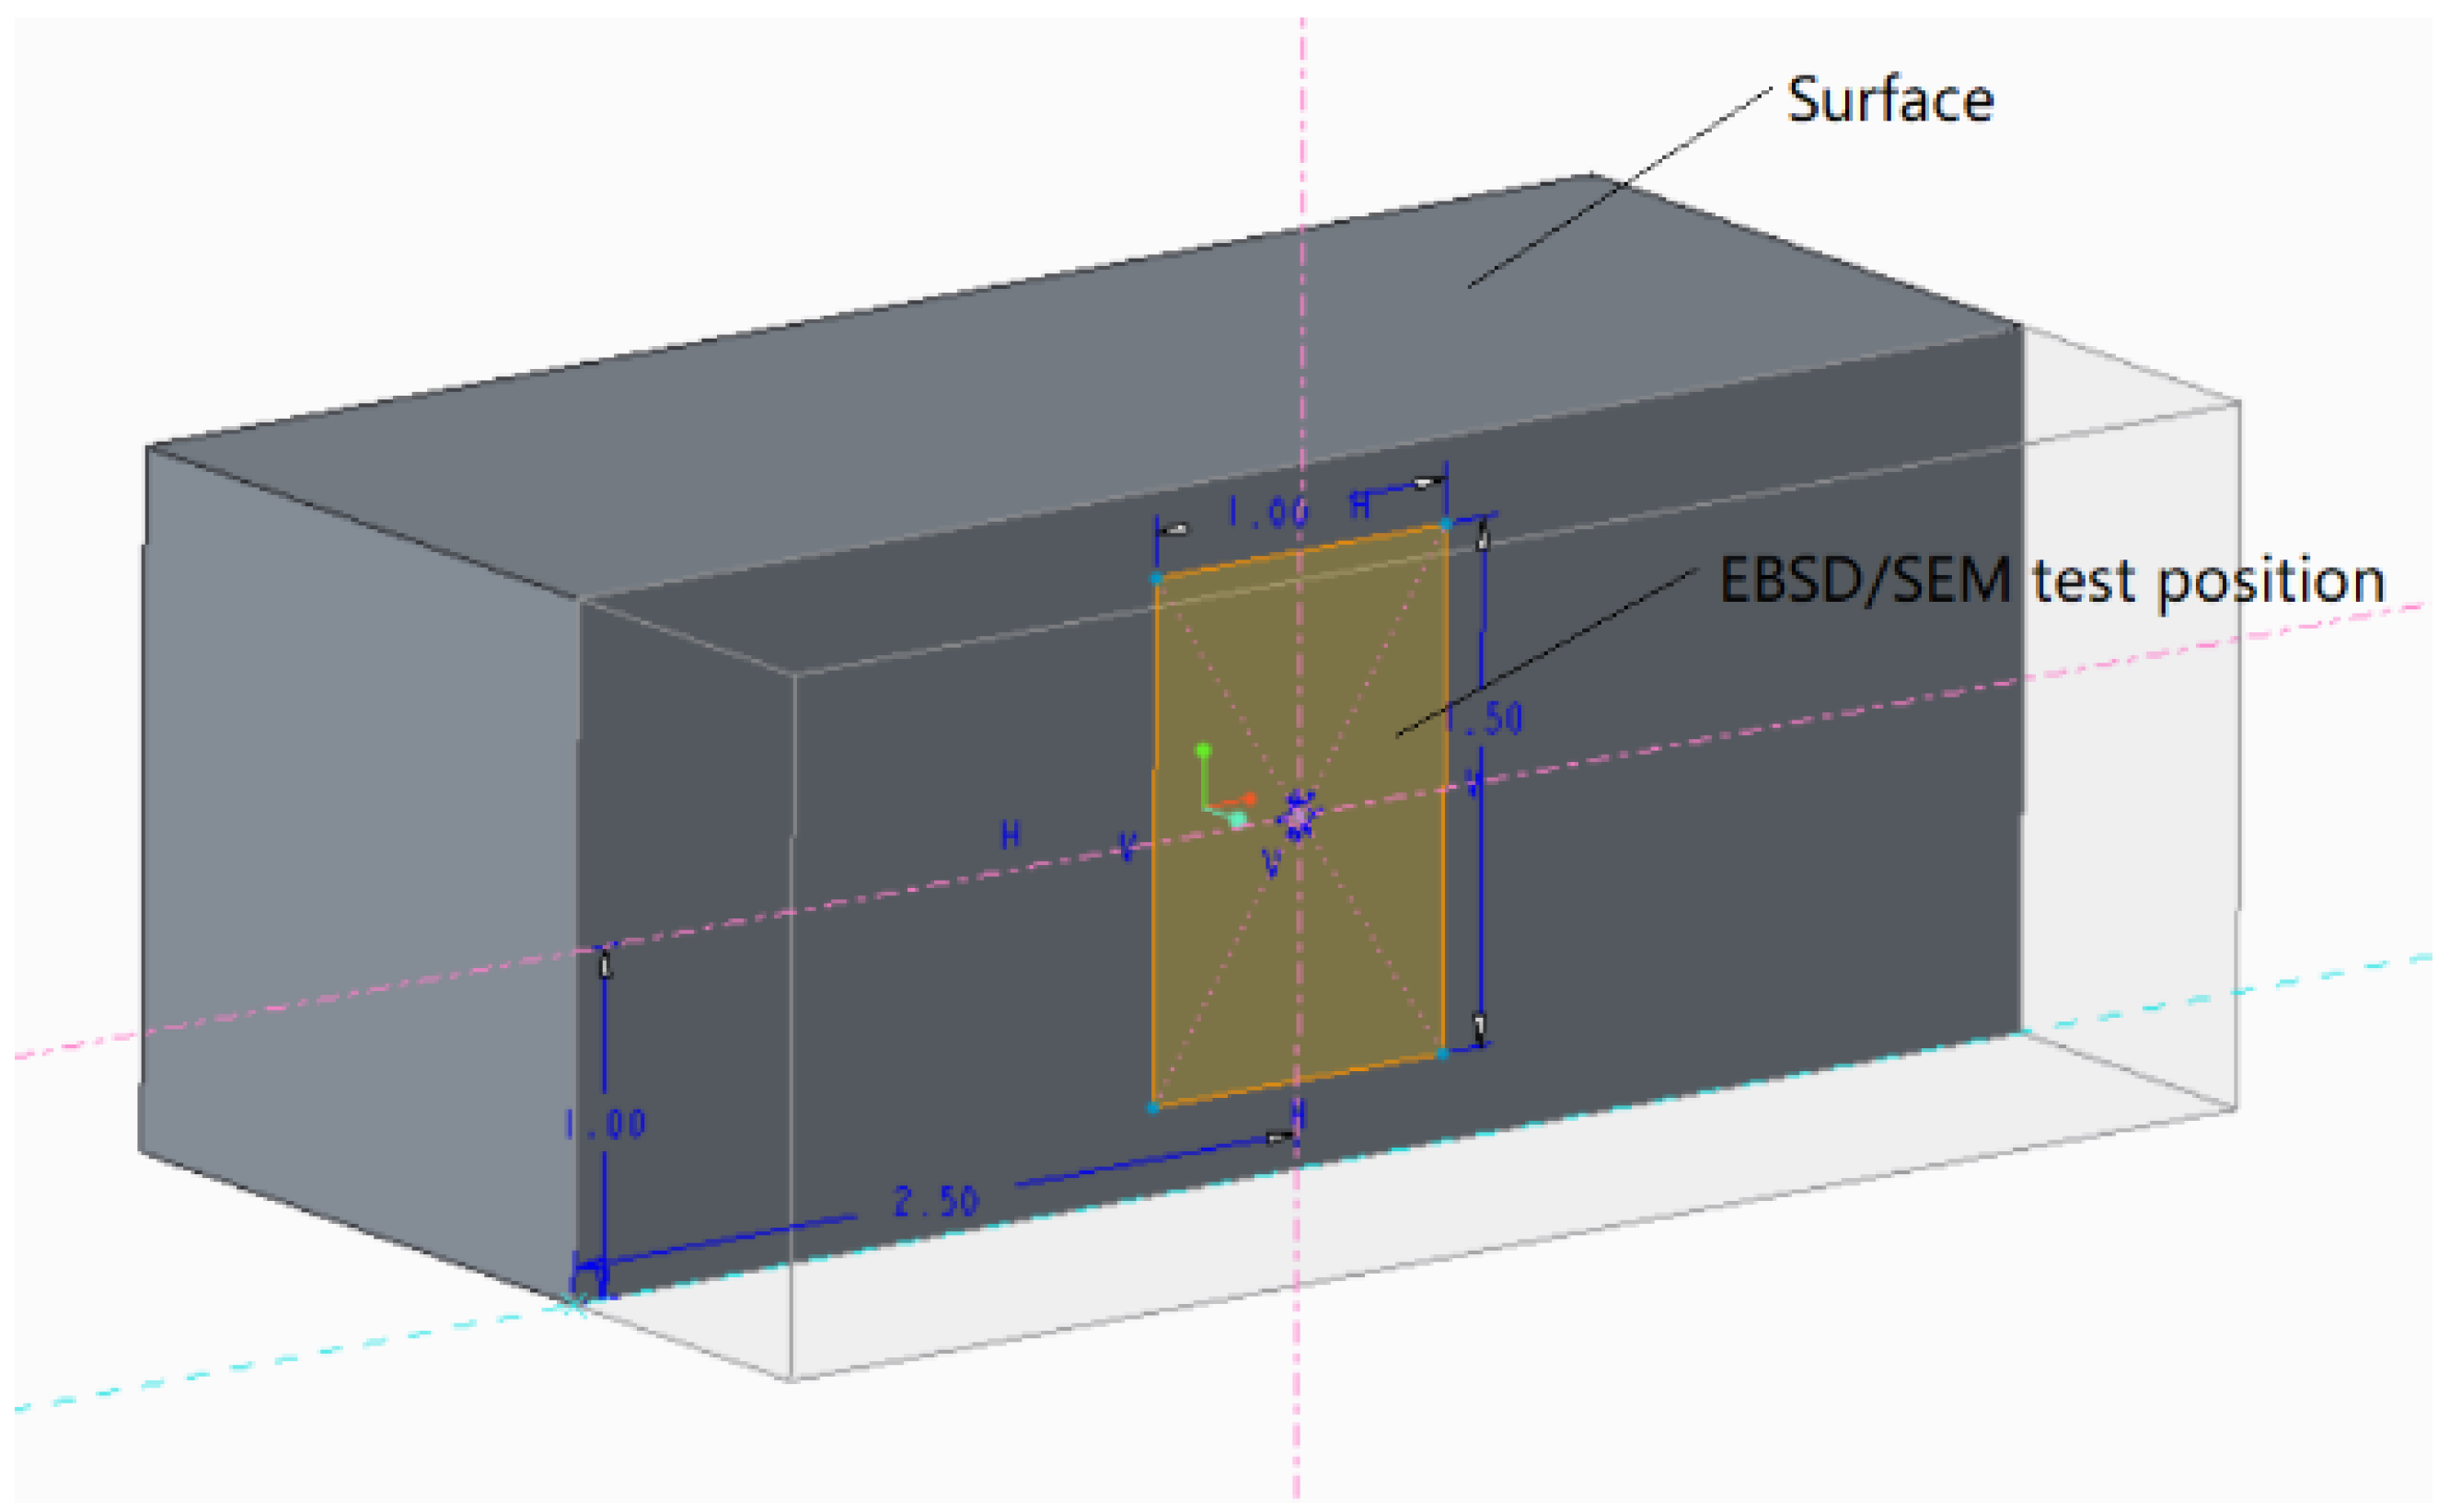
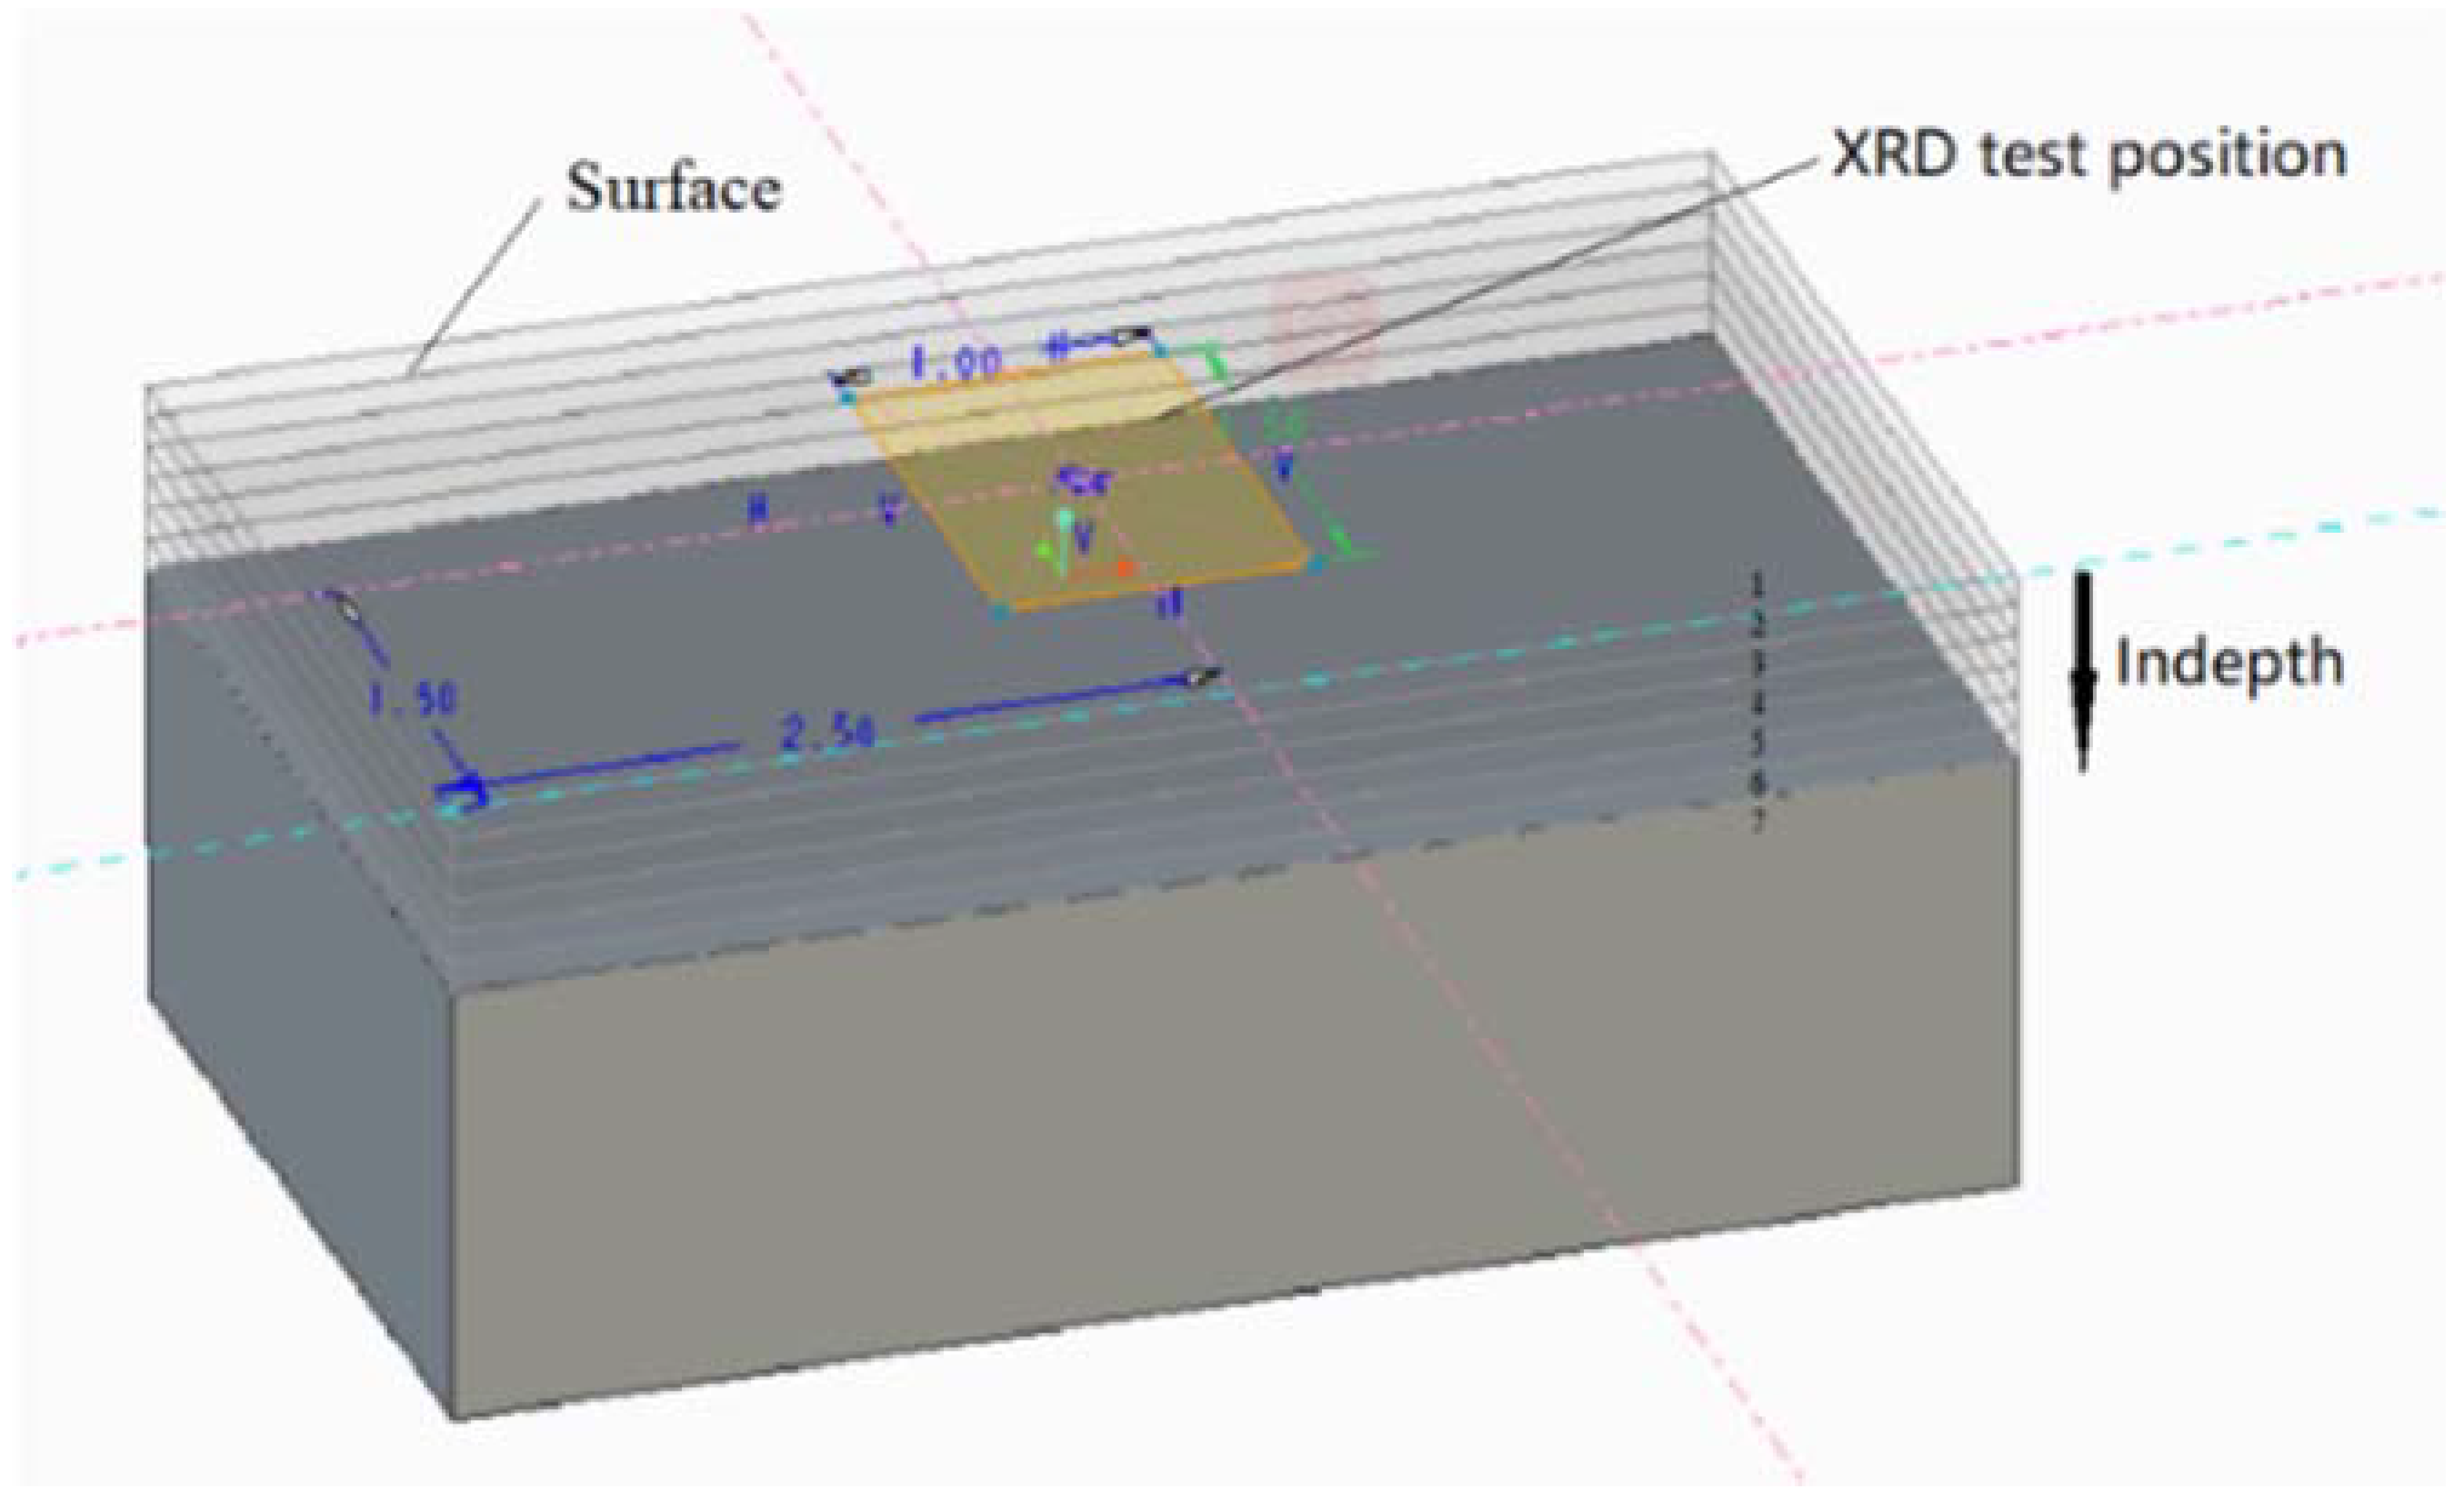
2.2. Test Methods
3. Results
3.1. Molten Pool Morphology
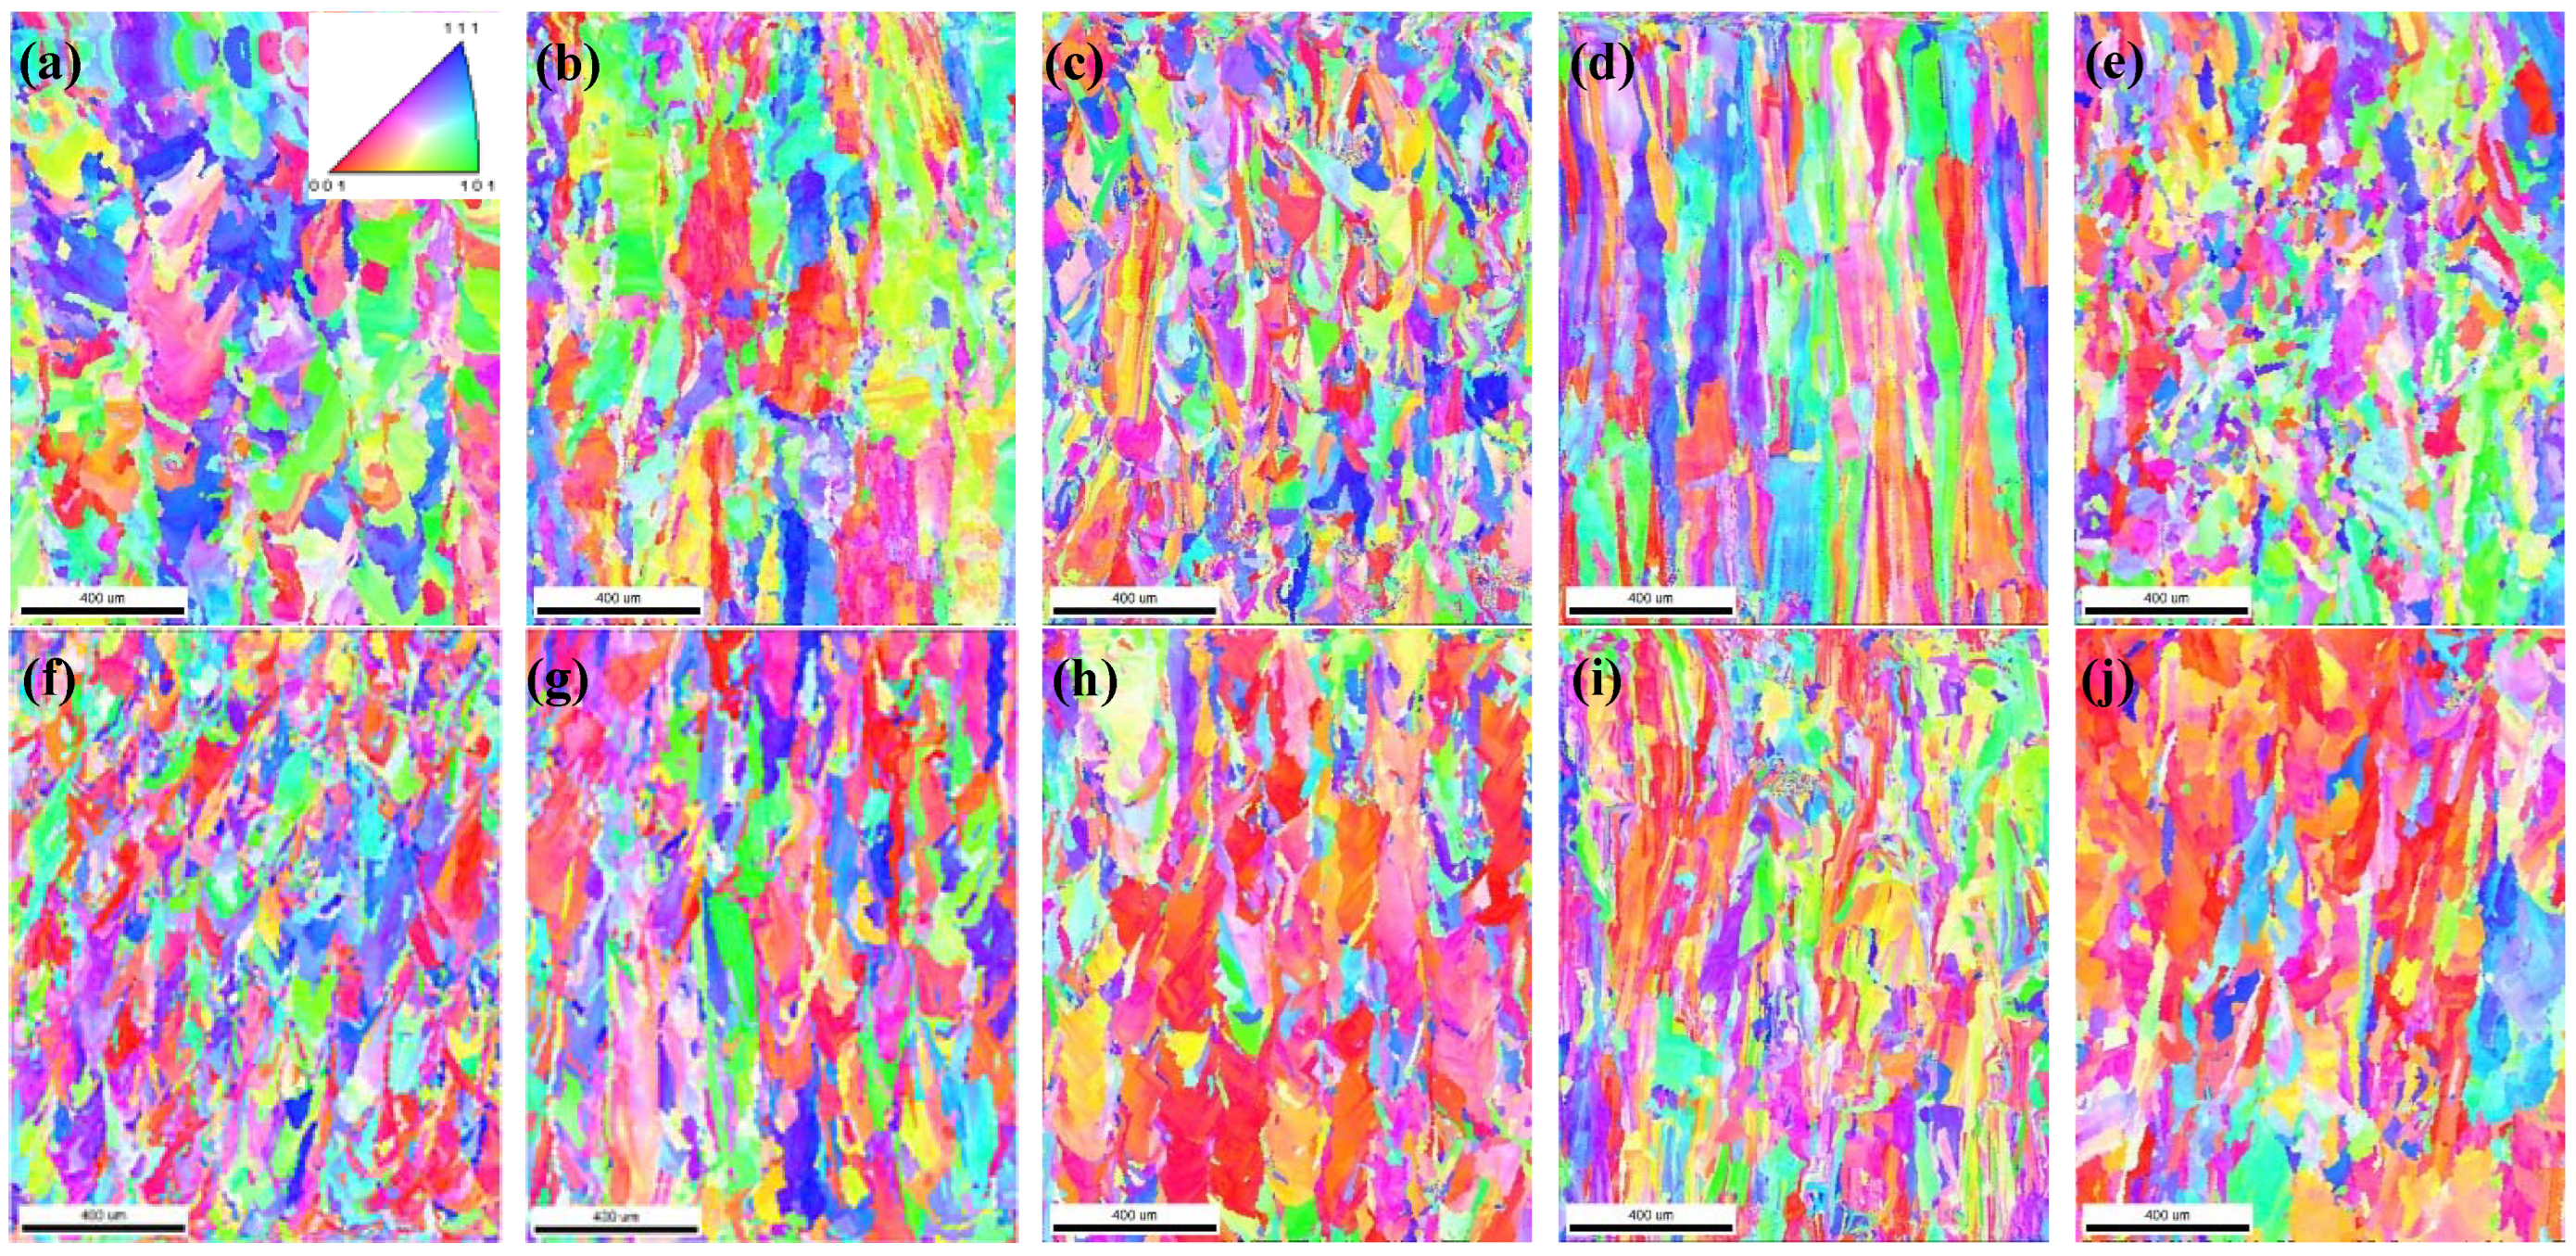
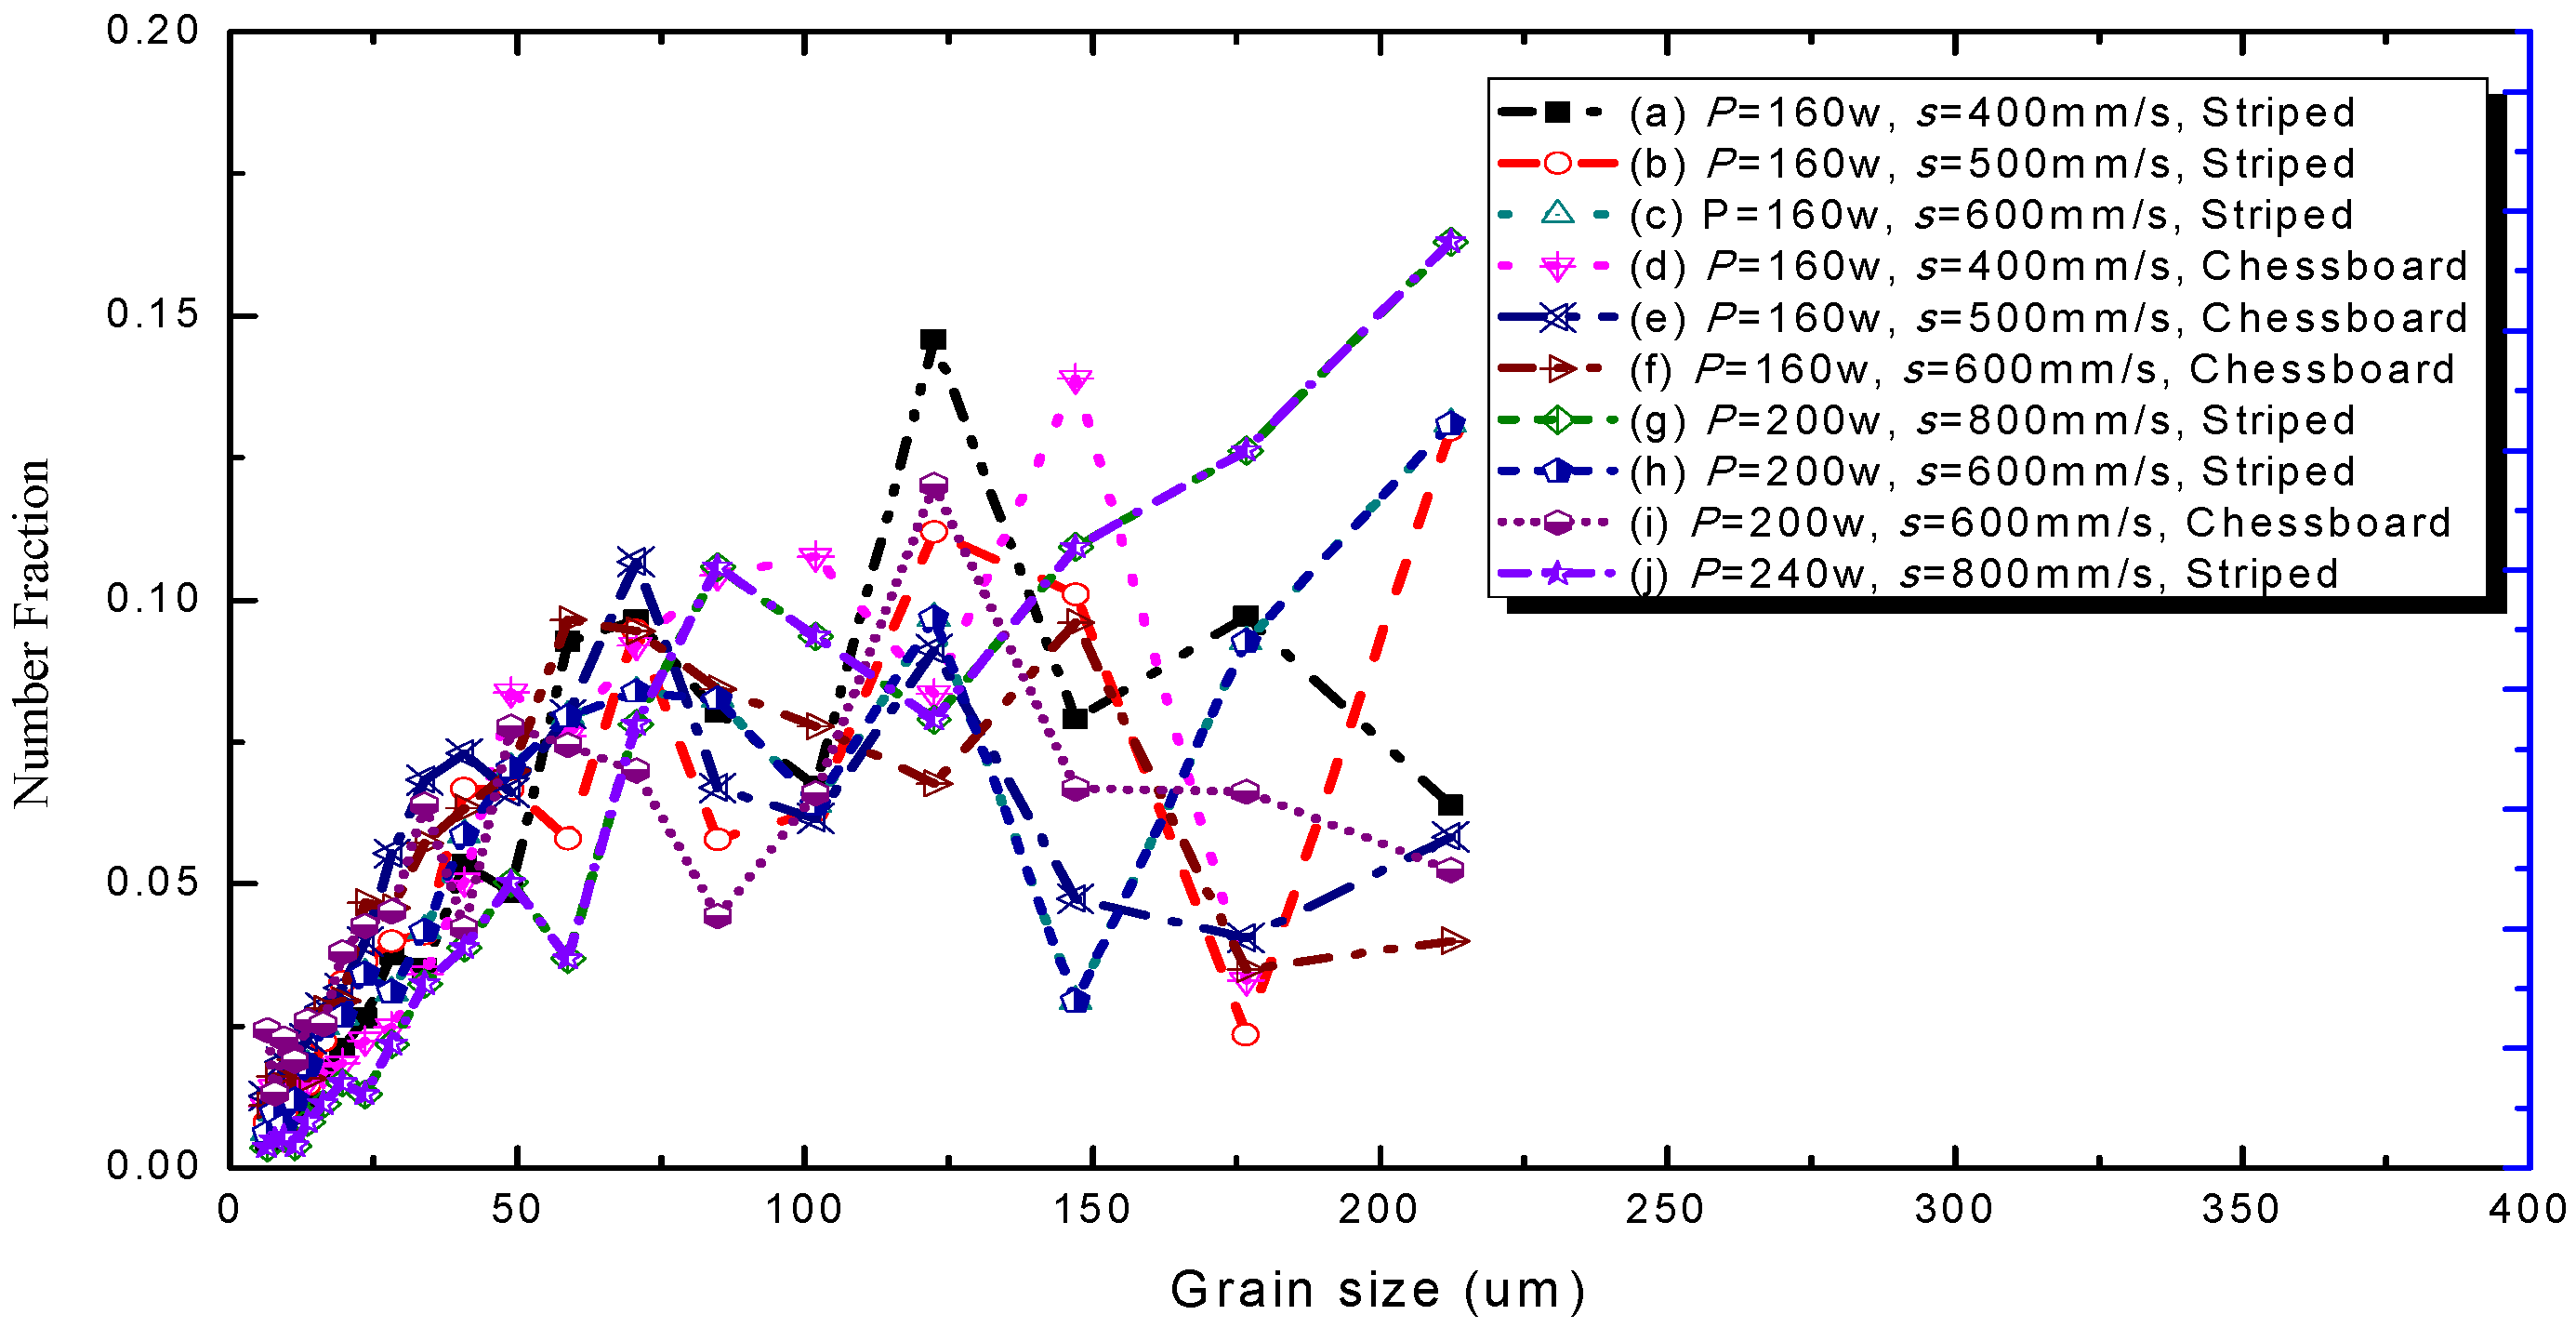
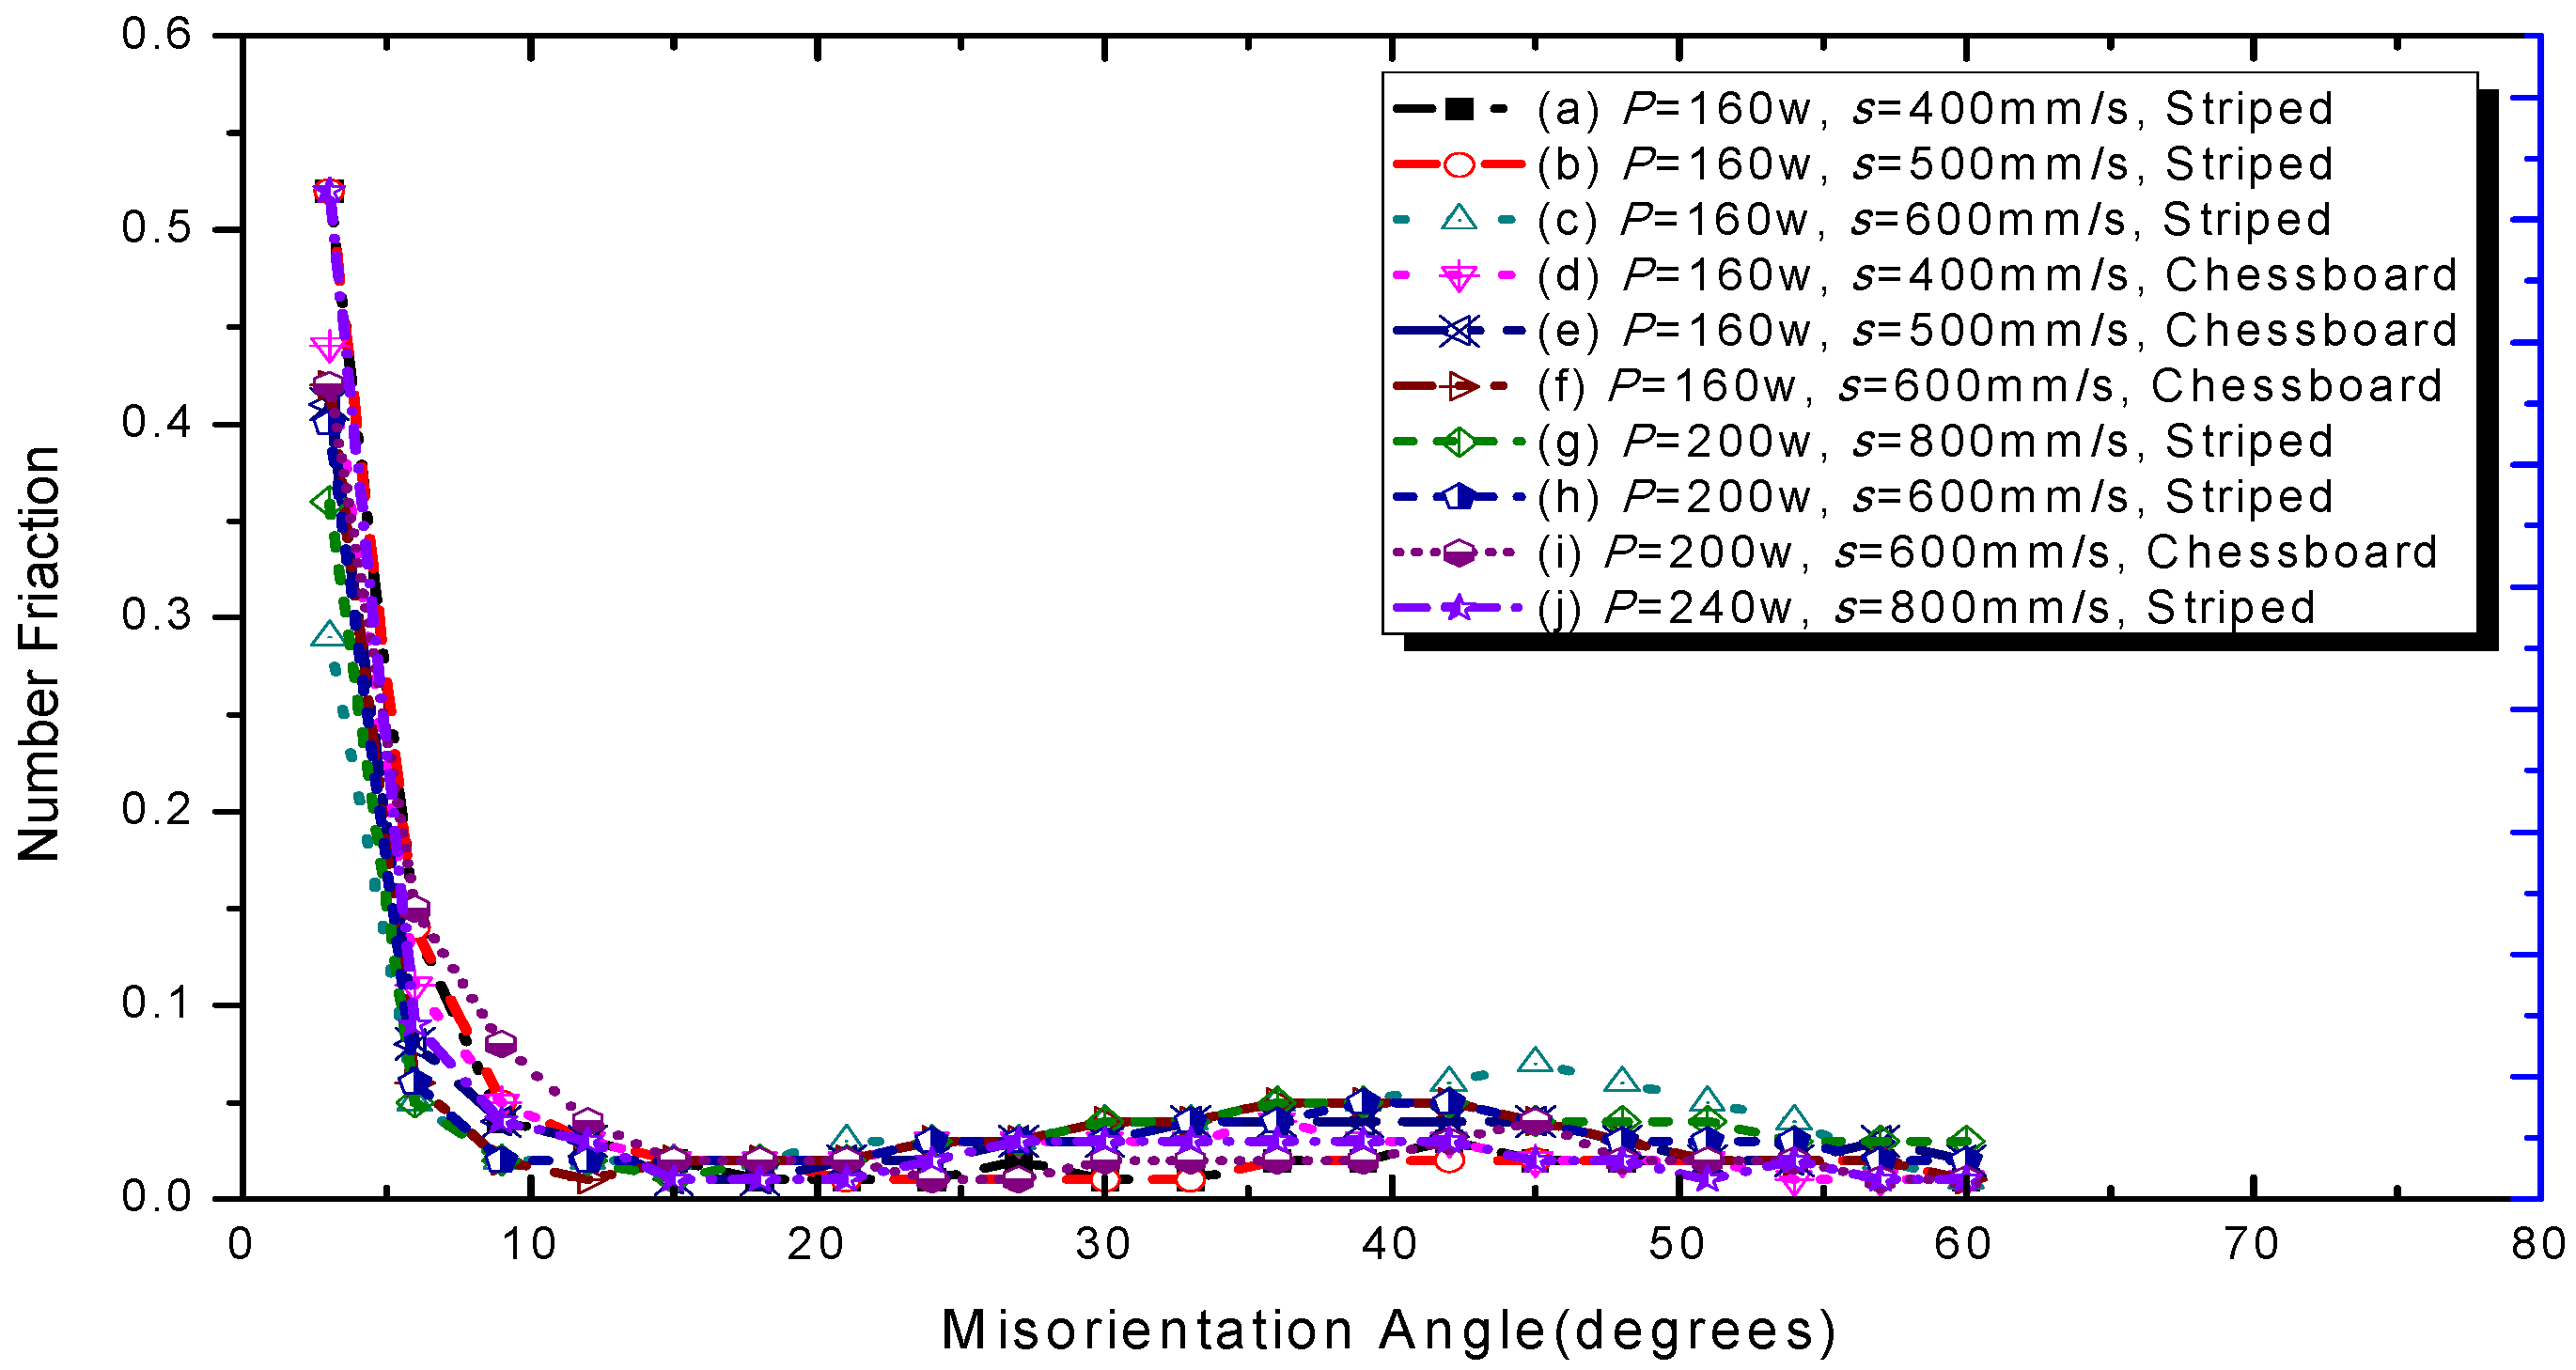
3.2. Grains and Orientation
3.3. Residual Stress
4. Discussion
5. Conclusions
- (1)
- Laser power has the main effect on the microstructure. As the power increases, the molten pool increases significantly and the crystalline grain is larger, which also causes a larger thermal stress and residual stress in a case where the other parameters remain unchanged.
- (2)
- The scanning speed also has a great influence on the microstructure of the forming part. The lower the scanning speed is, the longer the heating time of the molten pool, which leads to a larger geometrical size and crystallization and to an increase in residual stress when the other parameters remain the same.
- (3)
- The scanning mode, i.e., the length of the scanning track, also has a significant effect. In general, a short scanning trajectory has better organization and performance indicators.
- (4)
- The matching and coordination of the process parameters have a significant influence on the microstructure and mechanical properties of SLM forming, which can be evaluated by the accepted energy density. It was confirmed that reasonable matching of the relationship between the process parameters can obtain excellent forming properties, e.g., grain refinement and columnar grain, which presented as approximately directional solidification.
Author Contributions
Funding
Institutional Review Board Statement
Informed Consent Statement
Data Availability Statement
Acknowledgments
Conflicts of Interest
References
- Hamidi, M.; Wan, S.; Khalil, N.Z.; Samykano, M. Microstructural comparison and mechanical properties of stainless steel 316L fabricated by selective laser melting and metal injection moulding processes. Int. J. Manuf. Technol. Manag. 2019, 33, 76–87. [Google Scholar] [CrossRef]
- Laakso, P.; Riipinen, T.; Laukkanen, A. Optimization and Simulation of SLM Process for High Density H13 Tool Steel Parts. Phys. Procedia 2016, 83, 26–35. [Google Scholar] [CrossRef] [Green Version]
- Kamath, C.; El-Dasher, B.; Gallegos, G.F.; King, W.E.; Sisto, A. Density of additively-manufactured, 316L SS parts using laser powder-bed fusion at powers up to 400 W. Int. J. Adv. Manuf. Technol. 2014, 4, 65–78. [Google Scholar] [CrossRef] [Green Version]
- Sun, Z.; Tan, X.; Shu, B.T.; Yeong, W.Y. Selective laser melting of stainless steel 316L with low porosity and high build rates. Mater. Des. 2016, 4, 197–204. [Google Scholar] [CrossRef]
- Diao, S.; Chen, X. Problem Consciousness and Scientific Methodology in SLM Process Test—Taking warp problen for example. Henan Sci. Technol. 2018, 4, 56–57. [Google Scholar]
- Rans, C.; Michielssen, J.; Walker, M.; Wang, W.; Hoen-Velterop, L. Beyond the Orthogonal: On the Influence of Build Orientation on Fatigue Crack Growth in SLM Ti-6Al-4V. Int. J. Fatigue 2018, 116, 344–354. [Google Scholar] [CrossRef]
- Martin, L.; Maciej, M.; Hugh, W.; Yang, E.; Ahmad, A.; Bill, L. Inconel 625 lattice structures manufactured by selective laser melting (SLM): Mechanical properties, deformation and failure modes. Mater. Des. 2018, 4, 179–199. [Google Scholar]
- Chen, J.; Yang, Y.; Song, C.; Zhang, M.; Wu, S.; Wang, D. Interfacial microstructure and mechanical properties of 316l/cusn10 multi-material bimetallic structure fabricated by selective laser melting. Mater. Sci. Eng. 2019, 752, 75–85. [Google Scholar] [CrossRef]
- Wang, Y.; Chen, R.; Cheng, X.; Zhu, Y.; Zhang, J.; Wang, H. Effects of microstructure on fatigue crack propagation behavior in a bi-modal tc11 titanium alloy fabricated via laser additive manufacturing. J. Mater. Sci. Technol. 2019, 35, 403–408. [Google Scholar] [CrossRef]
- Khorasani, A.M.; Gibson, I.; Awan, U.S.; Ghaderi, A. The Effect of SLM Process Parameters on Density, Hardness, Tensile Strength and Surface Quality of Ti-6Al-4V. Addit. Manuf. 2018, 25, 176–186. [Google Scholar] [CrossRef]
- Zheng, M.; Wei, L.; Chen, J.; Zhang, Q.; Huang, W. On the role of energy input in the surface morphology and microstructure during selective laser melting of Inconel 718 alloy. J. Mater. Res. Technol. 2021, 11, 392–403. [Google Scholar] [CrossRef]
- Miao, X.; Wu, M.; Han, J.; Li, H.; Ye, X. Effect of Laser Rescanning on the Characteristics and Residual Stress of Selective Laser Melted Titanium Ti6Al4V Alloy. Materials 2020, 13, 3940. [Google Scholar] [CrossRef] [PubMed]
- Bian, P.; Shi, J.; Liu, Y.; Xie, Y. Influence of laser power and scanning strategy on residual stress distribution in additively manufactured 316L steel. Opt. Laser Technol. 2020, 4, 106477. [Google Scholar] [CrossRef]
- Zheng, Z.; Wang, L.; Yan, B. Effects of laser power on the microstructure and mechanical properties of 316L stainless steel prepared by selective laser melting. Int. J. Mod. Phys. B 2017, 31, 1744015. [Google Scholar] [CrossRef]
- Li, X.P.; Van Humbeeck, J.; Kruth, J.P. Selective laser melting of weak-textured commercially pure titanium with high strength and ductility: A study from laser power perspective. Mater. Des. 2017, 4, 352–358. [Google Scholar] [CrossRef]
- Wang, J.; Cheng, Y.X.; Li, P. Influence of Laser Scan Speed on Density and Mechanical Properties of a Ti6A14V Part Produced by Means of Selective Laser Melting (SLM). Lasers Eng. 2012, 4, 395–401. [Google Scholar]
- Spierings, A.B.; Dawson, K.; Uggowitzer, P.J.; Wegener, K. Influence of SLM scan-speed on microstructure, precipitation of Al_3Sc particles and mechanical properties in Sc- and Zr-modified Al-Mg alloys. Mater. Des. 2018, 4, 134–143. [Google Scholar] [CrossRef]
- Lu, Y.; Wu, S.; Gan, Y.; Huang, T.; Yang, C.; Lin, J. Study on the microstructure, mechanical property and residual stress of slm inconel-718 alloy manufactured by differing island scanning strategy. Opt. Laser Technol. 2015, 4, 197–206. [Google Scholar] [CrossRef]
- Jia, S.; Wu, W.; Liang, Z.; He, B.; Lin, L.; Ni, X. Role of scanning strategy on residual stress distribution in Ti-6Al-4V alloy prepared by selective laser melting. Optik 2018, 4, 342–352. [Google Scholar]
- Giganto, S.; Zapico, P.; Castro-Sastre, M.Á.; Martínez-Pellitero, S.; Leo, P.; Perulli, P. Influence of the scanning strategy parameters upon the quality of the SLM parts. Procedia Manuf. 2019, 41, 698–705. [Google Scholar] [CrossRef]
- Hajnys, J.; Petru, J. Influence of Scanning Strategy Parameters on Residual Stress in the SLM Process According to the Bridge Curvature Method for AISI 316L Stainless Steel. Materials 2020, 13, 1659. [Google Scholar] [CrossRef] [Green Version]
- Simson, T.; Emmel, A.; Dwars, A.; Böhm, J. Residual stress measurements on AISI 316L samples manufactured by selective laser melting. Addit. Manuf. 2017, 4, 183–189. [Google Scholar] [CrossRef]
- Liverani, E.; Toschi, S.; Ceschini, L.; Fortunato, A. Effect of selective laser melting (SLM) process parameters on microstructure and mechanical properties of 316L austenitic stainless steel. J. Mater. Processing Technol. 2017, 4, 255–263. [Google Scholar] [CrossRef]
- Teng, X.; Liang, J.; Li, H.; Liu, Q.; Cui, Y.; Cui, T. Parameter optimization and microhardness experiment of AlSi10Mg alloy prepared by selective laser melting. Mater. Res. Express 2019, 6, 086592. [Google Scholar] [CrossRef]
- Bang, G.B.; Kim, W.R.; Kim, H.K.; Park, H.K.; Kim, G.H.; Hyun, S.K. Effect of process parameters for selective laser melting with SUS316L on mechanical and microstructural properties with variation in chemical composition. Mater. Des. 2020, 197, 109221. [Google Scholar] [CrossRef]
- Huang, M.; Zhang, Z.; Chen, P. Effect of selective laser melting process parameters on microstructure and mechanical properties of 316L stainless steel helical micro-diameter spring. Int. J. Adv. Manuf. Technol. 2019, 104, 2117–2131. [Google Scholar] [CrossRef]
- Lee, H.J.; Dao, V.H.; Ma, Y.W.; Yu, J.M.; Yoon, K.B. Effects of process parameters on the high temperature strength of 17-4ph stainless steel produced by selective laser melting. J. Mech. Sci. Technol. 2020, 4, 3261–3272. [Google Scholar] [CrossRef]
- Ravichander, B.B.; Amerinatanzi, A.; Moghaddam, N.S. Study on the effect of powder-bed fusion process parameters on the quality of as-built in718 parts using response surface methodology. Met.-Open Access Metall. J. 2020, 10, 1180. [Google Scholar] [CrossRef]
- Li, J.; Wu, Y.; Zhou, B.; Wei, Z. Laser powder bed fusion of pure tungsten: Effects of process parameters on morphology, densification, microstructure. Materials 2020, 14, 165. [Google Scholar] [CrossRef]
- Pekok, M.A.; Setchi, R.; Ryan, M.; Han, Q.; Gu, D. Effect of process parameters on the microstructure and mechanical properties of AA2024 fabricated using selective laser melting. Int. J. Adv. Manuf. Technol. 2021, 112, 175–192. [Google Scholar] [CrossRef]
- Chen, J.; Yang, Y.; Song, C.; Wang, D.; Zhang, M. Influence mechanism of process parameters on the interfacial characterization of selective laser melting 316L/CuSn10. Mater. Sci. Eng. A 2020, 792, 139316. [Google Scholar] [CrossRef]
- Aqilah, D.N.; Sayuti, A.; Farazila, Y.; Suleiman, D.Y.; Amirah, M.; Izzati, W. Effects of Process Parameters on the Surface Roughness of Stainless Steel 316L Parts Produced by Selective Laser Melting. J. Test. Eval. 2018, 4, 1673–1683. [Google Scholar] [CrossRef]
- Woźniak, A.; Adamiak, M.; Chladek, G.; Kasperski, J. The influence of the process parameters on the microstructure and properties SLM processed 316L stainless stee. Arch. Metall. Mater. 2020, 65, 73–80. [Google Scholar]
- Yang, L.; Pang, Z.; Jian, Z. Comparative study on the influence of subsequent thermal cycling on microstructure and mechanical properties of selective laser melted 316L stainless steel. Appl. Phys. A 2017, 123, 688. [Google Scholar]
- Yakout, M.; Elbestawi, M.A.; Veldhuis, S.C. Density and mechanical properties in selective laser melting of invar 36 and stainless steel 316l. J. Mater. Processing Technol. 2019, 4, 397–420. [Google Scholar] [CrossRef]
- Wang, D.; Song, C.; Yang, Y.; Bai, Y. Investigation of crystal growth mechanism during selective laser melting and mechanical property characterization of 316L stainless steel parts. Mater. Des. 2016, 100, 291–299. [Google Scholar] [CrossRef]
- Yan, J.J.; Zheng, D.L.; Li, H.X.; Jia, X.; Yan, M. Selective laser melting of h13: Microstructure and residual stress. J. Mater. Sci. 2017, 4, 12476–12485. [Google Scholar] [CrossRef]
- Mishra, A.K.; Kumar, A. Numerical and experimental analysis of the effect of volumetric energy absorption in powder layer on thermal-fluidic transport in selective laser melting of Ti6Al4V. Opt. Laser Technol. 2019, 4, 227–239. [Google Scholar] [CrossRef]
- Greco, S.; Gutzeit, K.; Hotz, H.; Kirsch, B.; Aurich, J.C. Selective laser melting (SLM) of AISI 316L—impact of laser power, layer thickness, and hatch spacing on roughness, density, and microhardness at constant input energy density. Int. J. Adv. Manuf. Technol. 2020, 108, 1551–1562. [Google Scholar] [CrossRef]


| Samples | Laser Power | Scanning Speed | Scanning Strategy | Hatching Distance | Layer Thickness | Serial No. |
|---|---|---|---|---|---|---|
| 1 | P = 160 W | s = 400 mm/s | striped | 0.1 mm | 50 μm | 11, 12, 13 |
| 2 | P = 160 W | s = 500 mm/s | striped | 0.1 mm | 50 μm | 21, 22, 23 |
| 3 | P = 160 W | s = 600 mm/s | striped | 0.1 mm | 50 μm | 31, 32, 33 |
| 4 | P = 160 W | s = 400 mm/s | chessboard | 0.1 mm | 50 μm | 41, 42, 43 |
| 5 | P = 160 W | s = 500 mm/s | chessboard | 0.1 mm | 50 μm | 51, 52, 53 |
| 6 | P = 160 W | s = 600 mm/s | chessboard | 0.1 mm | 50 μm | 61, 62, 63 |
| 7 | P = 200 W | s = 800 mm/s | striped | 0.1 mm | 50 μm | 71, 72, 73 |
| 8 | P = 200 W | s = 600 mm/s | striped | 0.1 mm | 50 μm | 81, 82, 83 |
| 9 | P = 200 W | s = 600 mm/s | chessboard | 0.1 mm | 50 μm | 91, 92, 93 |
| A | P = 240 W | s = 800 mm/s | striped | 0.1 mm | 50 μm | A1, A2, A3 |
| Rank | Different Laser Power | Different Scanning Speed | Different Scan Trajectories |
|---|---|---|---|
| 1 | 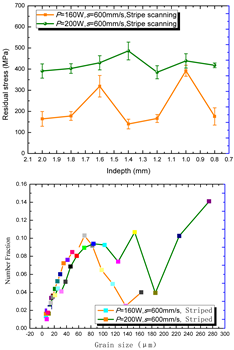 |  | 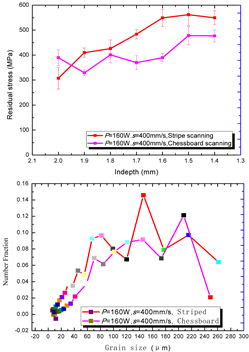 |
| 2 | 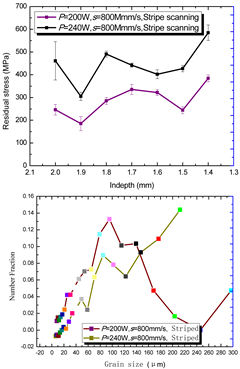 | 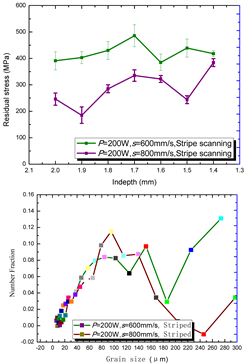 | 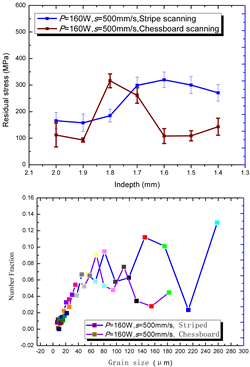 |
| 3 | 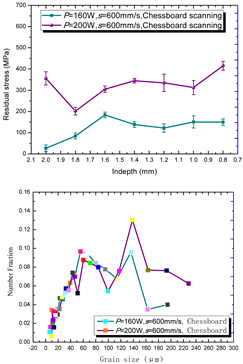 | 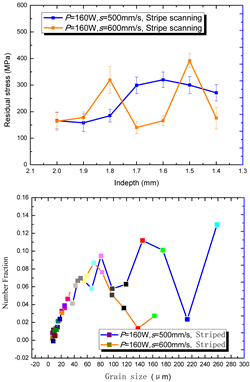 | 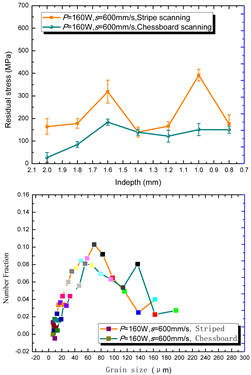 |
| 4 | ———————— |  |  |
| 5 | ———————— |  | ———————— |
| Method | Group 1 | Group 2 | Group 3 | Group 4 | Group 5 | |||||
|---|---|---|---|---|---|---|---|---|---|---|
| Power comparison | s = 600 mm/s; | s = 800 mm/s; Striped scanning | s = 600 mm/s; Chessboard scanning | ------ | ------ | |||||
| P = 200 | P = 160 | P = 240 | P = 200 | P = 200 | P = 160 | |||||
| 421.7 | 199.3 | 444.7 | 285.8 | 324.4 | 122.6 | |||||
| Speed comparison | P = 160 W; Striped scanning | P = 160 W; Striped scanning | P = 200 W; Striped scanning | P = 160 W; Chessboard scanning | P = 160 W; Chessboard scanning | |||||
| s = 400 | s = 500 | s = 500 | s = 600 | s = 600 | s = 800 | s = 400 | s = 500 | s = 400 | s = 600 | |
| 469.7 | 242.7 | 242.7 | 199.3 | 421.7 | 285.5 | 405 | 163.2 | 405 | 122.6 | |
| Different scanning strategy | P = 160 W; s = 400 mm/s | P = 160 W; s = 600 mm/s | P = 200 W; s = 600 mm/s | P = 160 W; s = 500 mm/s | ------ | |||||
| Striped | Chessboard | Striped | Chessboard | Striped | Chessboard | Striped | Chessboard | |||
| 469.7 | 405 | 199.3 | 122.6 | 421.7 | 324.4 | 242.7 | 163.2 | |||
| Sample | Power | Scanning Speed | Scanning Strategy | Energy Density (E(t)) | Energy Density (E(a)) | Molten Pool (mm) | Grain Size (mm) | Residual Stress (MPa) |
|---|---|---|---|---|---|---|---|---|
| 1 | 160 W | 400 mm/s | Striped | 56 | 62 | 122 × 60 | 112.9 | 469.7 |
| 2 | 160 W | 500 mm/s | Striped | 45 | 50 | 112 × 45 | 111.6 | 242.7 |
| 3 | 160 W | 600 mm/s | Striped | 37 | 40 | 100 × 40 | 58.1 | 199.3 |
| 4 | 160 W | 400 mm/s | Chessboard | 56 | 56 | 115 × 35 | 113.1 | 405 |
| 5 | 160 W | 500 mm/s | Chessboard | 45 | 45 | 110 × 32 | 69.9 | 163.2 |
| 6 | 160 W | 600 mm/s | Chessboard | 37 | 37 | 100 × 38 | 72.1 | 122.6 |
| 7 | 200 W | 800 mm/s | Striped | 35 | 39 | 145 × 38 | 91.3 | 285.5 |
| 8 | 200 W | 600 mm/s | Striped | 46 | 51 | 155 × 48 | 118.8 | 421.7 |
| 9 | 200 W | 600 mm/s | Chessboard | 46 | 46 | 125 × 35 | 91.7 | 324.4 |
| A | 240 W | 800 mm/s | Striped | 42 | 48 | 150 × 40 | 115.5 | 444.7 |
Publisher’s Note: MDPI stays neutral with regard to jurisdictional claims in published maps and institutional affiliations. |
© 2022 by the authors. Licensee MDPI, Basel, Switzerland. This article is an open access article distributed under the terms and conditions of the Creative Commons Attribution (CC BY) license (https://creativecommons.org/licenses/by/4.0/).
Share and Cite
Bian, P.; Wang, C.; Xu, K.; Ye, F.; Zhang, Y.; Li, L. Coupling Analysis on Microstructure and Residual Stress in Selective Laser Melting (SLM) with Varying Key Process Parameters. Materials 2022, 15, 1658. https://doi.org/10.3390/ma15051658
Bian P, Wang C, Xu K, Ye F, Zhang Y, Li L. Coupling Analysis on Microstructure and Residual Stress in Selective Laser Melting (SLM) with Varying Key Process Parameters. Materials. 2022; 15(5):1658. https://doi.org/10.3390/ma15051658
Chicago/Turabian StyleBian, Peiying, Chunchang Wang, Kewei Xu, Fangxia Ye, Yongjian Zhang, and Lei Li. 2022. "Coupling Analysis on Microstructure and Residual Stress in Selective Laser Melting (SLM) with Varying Key Process Parameters" Materials 15, no. 5: 1658. https://doi.org/10.3390/ma15051658