Article

Experimental Research on Mechanical Properties and Compression Constitutive Relationship of PVA Fiber-Reinforced Coral Concrete

1
School of Civil Engineering, Xi’an University of Architecture & Technology, Xi’an 710055, China
2
School of Civil and Architectural Engineering, Kaifeng University, Kaifeng 475004, China
3
Central Research Institute of Building and Construction Co., Ltd., MCC, Beijing 100088, China
*
Author to whom correspondence should be addressed.
Materials 2022, 15(5), 1762; https://doi.org/10.3390/ma15051762
Submission received: 27 September 2021 / Revised: 8 February 2022 / Accepted: 9 February 2022 / Published: 26 February 2022
(This article belongs to the Special Issue Concrete and Construction Materials)

Abstract

:
In this paper, the mechanical properties of coral concrete with different strength and different polyvinyl alcohol (PVA) fiber content under compression were experimentally investigated. The results show that adding an appropriate amount of PVA fiber could obtain satisfactory mechanical properties of coral concrete. The stress–strain constitutive relationship of plain and PVA fiber-reinforced coral concrete was investigated by prism uniaxial compression test. The results shown that the incorporation of PVA fiber had a significant effect on limiting the development of concrete internal cracks, and effectively improved the mechanical properties of coral concrete after cracking, especially the toughness. Different constitutive models from previous research were used to describe the axial compressive stress–strain relationship of plain and PVA fiber-reinforced coral concrete, and a piecewise function model was finally selected which is most consistent with the experimental curve and its characteristic points. In addition, determination of critical parameters for the selected constitutive model was proposed, and experimental validations confirmed its accuracy.

1. Introduction

In recent years, many countries have increased their investment in ocean engineering in response to the increasing depletion of land resources. For example, the construction of artificial islands is receiving more attention in many coastal countries, and the sea sand-broken reef aggregate concrete material is also becoming a research focus in construction materials. For off-shore islands and reefs lacking traditional construction materials, the problem of cost increase is inevitable and unacceptable. Fortunately, the coral resources in many off-shore islands and reefs are rich. Therefore, inventing a new kind of concrete with the best use of coral resources becomes a potential approach in off-shore islands and reef engineering construction.
As early as the 1950s, the application and research of coral concrete had been started in the United States. Dempsey [1] and Narver [2] described the configuration requirements of coral concrete, and evaluated the coral concrete buildings. On some islands, such as Midway, Wake and Bikini, coral concrete was used to build airports and roads, and some of them are still in service [3]. In 1974, Howdyshell [4] investigated the coral concrete buildings, and confirmed that it was feasible to use coral aggregate instead of traditional coarse aggregate to prepare concrete. In 2015, Yuan [5] prepared high performance coral concrete with strength up to 60 MPa using fly ash and slag instead of part of P∙Ⅱ52.5 ordinary Portland cement in the mix proportion of coral concrete. So far, many researches have been conducted on the mix proportion, strength and durability of coral concrete [6,7]. However, there are few researches completed in terms of its constitutive relationship, especially the constitutive relationship of fiber-reinforced coral concrete. As the constitutive relationship of concrete is one of the most important factors that determine the servicing capacity of concrete engineering structures, the existing research results of coral concrete are still not enough for detailed engineering application or performance-based engineering design, and further research is needed.
In 2000, Sun [8] studied the mechanical properties of coral aggregate and pointed out that coral particles had great compressibility and were prone to being broken in the process of compression and shear because of its high porosity, which might be the major factor affecting the ductility of coral concrete, and lead to its mechanical performance significantly different from ordinary aggregate concrete, light aggregate concrete and recycled aggregate concrete [9,10,11,12,13]. It deserved more research to improve the ductility of coral concrete so as to better meet the ductility demand of engineering structures. In recent years, many scholars have carried out researches on fiber reinforced concrete, such as Mukhopadhyay [14], Pereira [15], Nia [16], and Yoo [17], which shown that fibers had significant effects on the crack resistance, toughness, impact resistance and other performances of the concrete. From 2014 to 2016, Wang [18,19,20], studied the basic mechanical indices of coral concrete mixed with carbon fiber, sisal fiber and polypropylene fiber, respectively. The results show that the fiber significantly improved the mechanical properties of coral concrete.
In general, due to the particularity of the marine environment, the durability of concrete structures with different kinds of fibers is obviously different. Coral concrete, as a special building material in the marine environment, not only requires the fiber to play a role of toughening and strengthening, but also to present the properties of weather resistance and corrosion resistance etc. Therefore, compared with other fibers, polyvinyl alcohol (PVA) fiber with low price and excellent performance might be a better choice.
PVA fiber is a kind of synthetic fiber with many advantages, such as high strength, high elasticity, good wear resistance, strong acid-base resistance, and good corrosion resistance [21]. Due to its strong affinity with cement base material and non-toxic or pollution characteristics, it has become one of the new generations of high-tech green building materials. Existing research results show that the addition of PVA fiber could effectively improve the strength, ductility [22,23], crack resistance [24] and durability [21] of concrete. However, there are few investigations on PVA fiber-reinforced coral aggregate concrete, which will be investigated in this study to supplement.
In this study, the experiments on cube compressive strength, prism axial compressive strength of plain and PVA fiber-reinforced coral concrete were carried out. Based on the experiment results, the influences of PVA fiber on the compression strength, elastic modulus and Poisson’s ratio of coral concrete were studied. Furthermore, the compression stress–strain curve characteristics of plain and PVA fiber-reinforced coral concrete were comparatively studied, and the constitutive model for uniaxial compression stress–strain curve of plain and PVA fiber-reinforced coral concrete was also proposed. The results might be referable for engineering application or performance-based engineering design.

2. Materials and Methods

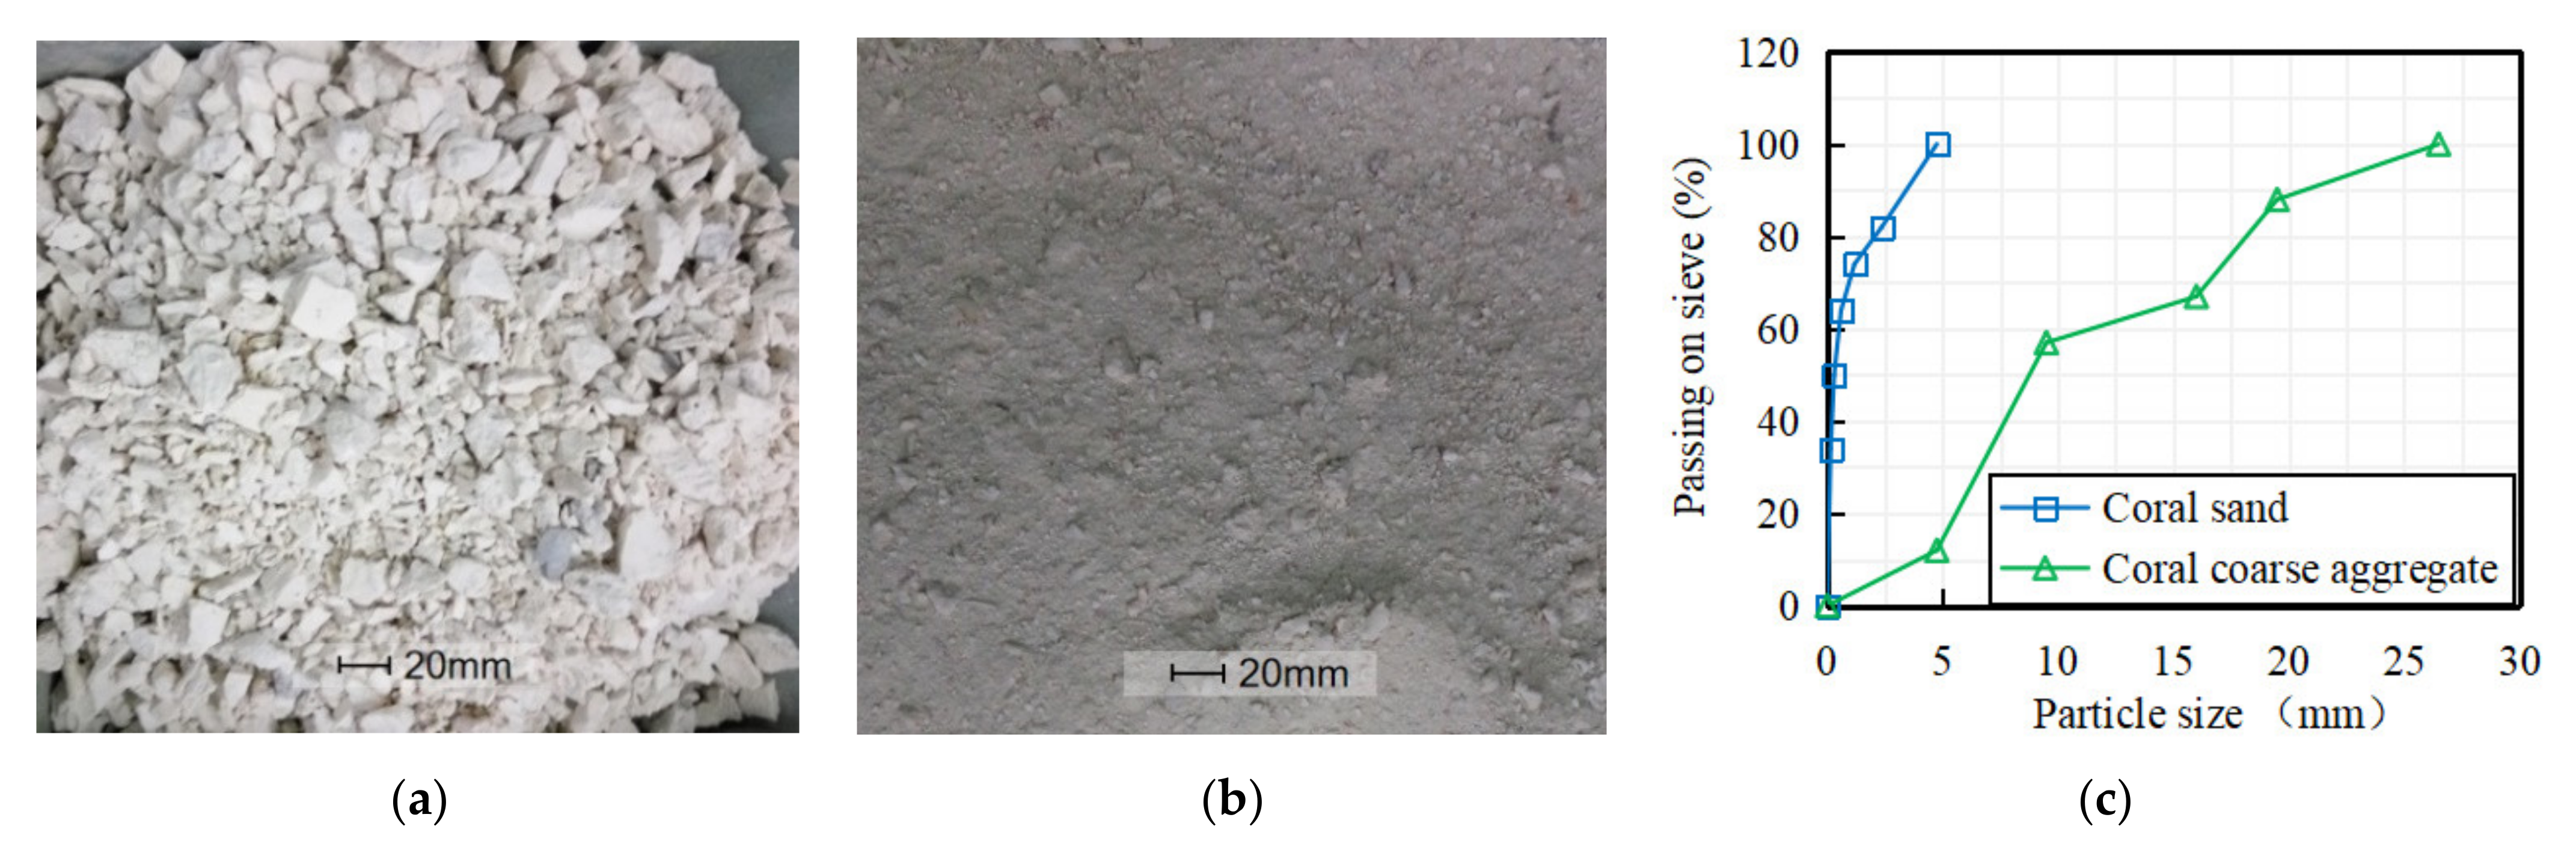
2.1. Materials and Properties

The coral from a Southern China Sea island was broken into irregular particles with a maximum diameter of 26.5 mm. After sieving, aggregate with continuous particle size of 4.75 to 26.5 mm was used as coarse aggregate (Figure 1a), and particles with continuous particle size less than 4.75 mm was used as fine aggregate (Figure 1b), which had a fineness modulus of 1.7. According to ASTM C33/C33M-2018 [25] and GB/T 17431.2-2010 [26] the particle size distribution and the physical properties of coral aggregate were measured as shown in Figure 1c and Table 1.
Ordinary Portland Cement P. O 42.5 (OPC), slag (SG) and silica fume (SF) were used in the tested mixtures, their chemical compositions are shown in Table 2. In this test, the coral concrete was also mixed with PVA fiber, the details of PVA fiber’s physical properties are shown in Table 3. According to the literature [27], artificial seawater was prepared according to the composition of the seawater in the Southern China Sea, and its chemical composition is given in Table 4. Polycarboxylate superplasticizer (SP) with solid content of 40% was used in the test.

2.2. Mix Proportion

According to Chinese technical specification for lightweight aggregate concrete (JGJ51-2002) [28] and Chinese standard for test methods for fiber reinforced concrete (CECS13: 2009) [29], different mix proportions were designed in this test. Through the equal quality substitution method, silica fume with substitution rate (by weight) of 5–7.5% and slag with substitution rate of 15–22.5% were used to replace part of cement to prepare coral concrete. Based on C40 specimen group, the mix proportions of coral concrete with different fiber content were designed, and compared with the reference group (C40), the fiber groups (FC1–FC4) were only different in fiber content, the fiber dosages were 0.8125 kg/m3, 1.625 kg/m3, 3.25 kg/m3 and 6.5 kg/m3, respectively, as shown in Table 5.

2.3. Specimen Production

Due to the water-absorption and water-release characteristics of coral aggregates [8,30], the problem of high drying shrinkage of coral concrete is prominent [10], however, investigations suggested that pre-wetting aggregate and adding shrinkage reducing agent could effectively inhibit the shrinkage deformation of coral concrete [31]. Hence, the coral aggregate was pre wetted during the preparation of coral concrete [32], and the preparation procedure of coral concrete was formulated as follows: (1) Added the coarse and fine gravel aggregate of coral coarse into the mixer and stirred for 1 min; (2) Added about 50% of the seawater which could be absorbed by the aggregate and stirred for 1–2 min; (3) Added the cementitious material and stirred for 1 min; (4) Added PVA fibers evenly to the mix while stirring, and continuously stirred for 1–2 min; (5) Added the polycarboxylate superplasticizer into the remaining water and mixed well, and then added it to the mixture in 2–3 times and mixed continuously for 1–2 min. The slump and dispersion of coral concrete were measured immediately after mixing. After the concrete was placed in molds of specific size, vibrated on a vibration table, the exposed surface concrete was covered with plastic film to prevent water dispersion, and then all specimens were demolded after curing under normal temperature (20 ± 3 °C) for 24 h. Finally, all the pieces were placed in the standard curing room for 28 days until being tested.
The test methods of mechanical properties of coral concrete were conducted according to Chinese standard for method of mechanical properties on ordinary concrete (GB/T 50081-2002) [33], and eight groups of specimens were prepared. Each group included nine specimens, of which three specimens with dimensions of 100 mm × 100 mm × 100 mm were used to test the cubic compressive strength, three specimens with dimensions of 100 mm × 100 mm × 300 mm were used to test the prism axial compression, and three specimens with dimensions of 100 mm × 100 mm × 300 mm were used for the uniaxial compressive stress–strain curve test.

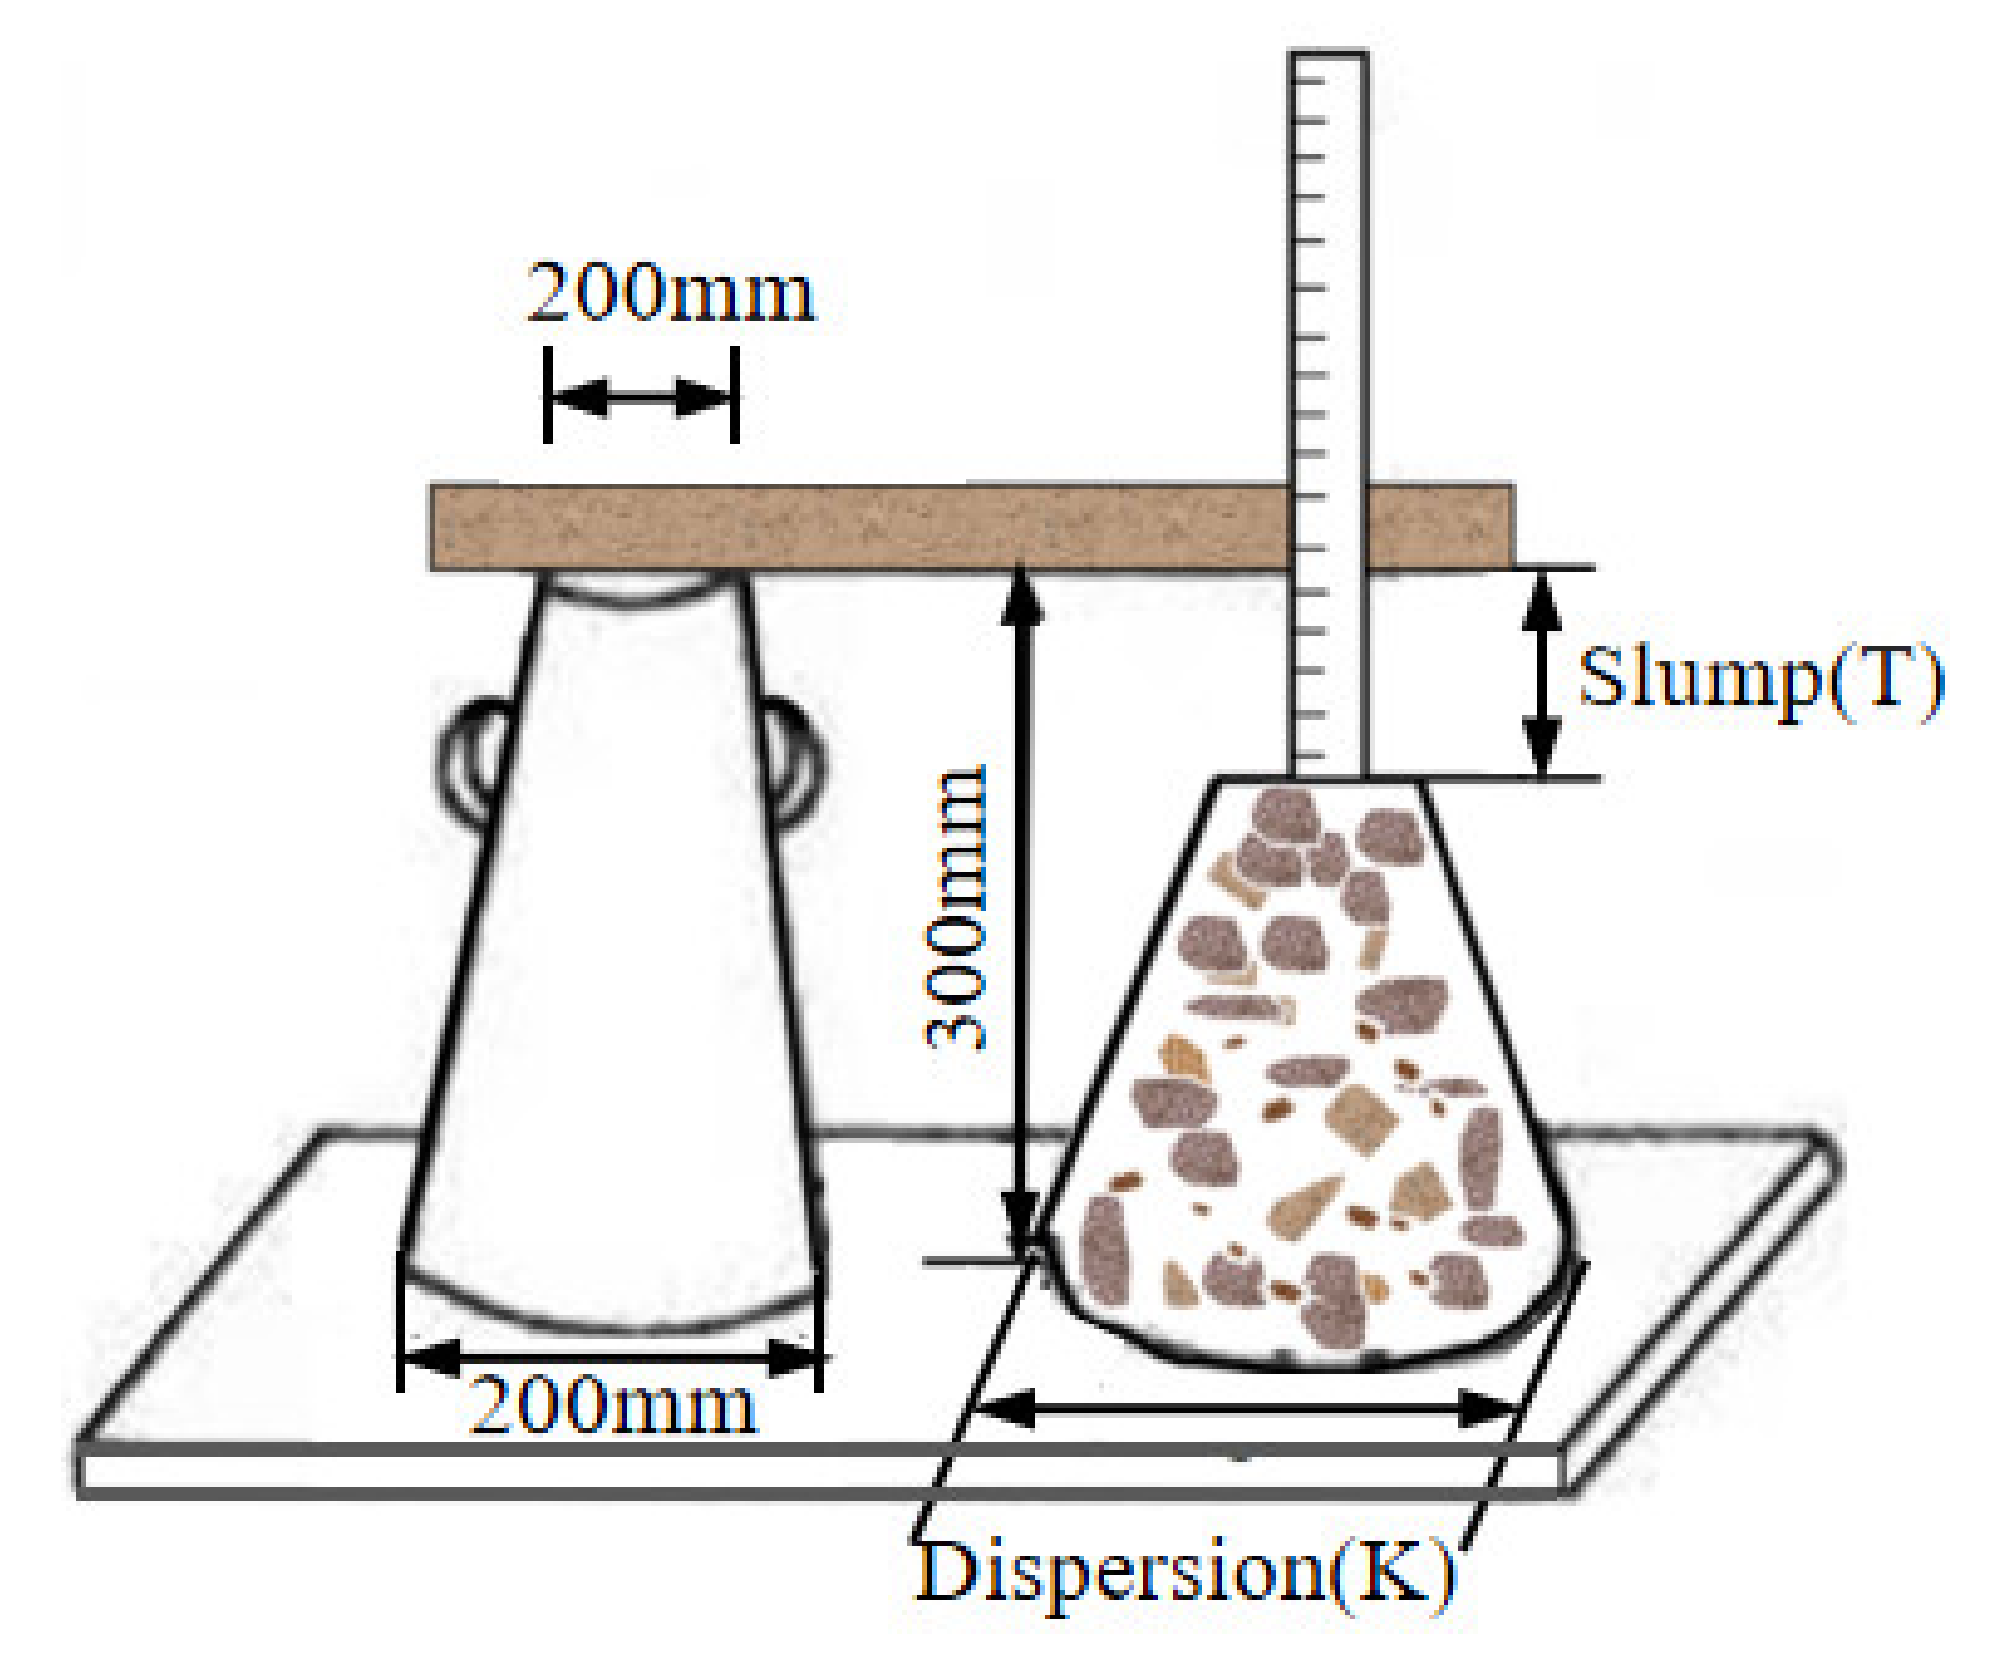
2.4. Test Procedures

The electro-hydraulic servo universal testing machine (WAW-2000D, Jinan Zhonglu Chang testing machine Manufacturing Co., LTD, Jinan, China) was used for uniaxial compression test, with a maximum capacity of 2000 kN, as shown in Figure 2. During the compression strength test, the loading speed was kept in a uniform loading speed of 0.5 kN/s until the failure. During the loading of stress–strain curve test, the first step was to preload with 1 kN/s to 15% of the estimated ultimate load and then unload. This step was repeated three times. The second step was to check the strain collection values of two sides of the test specimens to ensure alignment. After three preloads, keep loading to 60% of the estimated ultimate load at the speed of 1 kN/s, and then continued to load until failure at the speed of 0.025 mm/min.
Three rubber-based strain gauges were pasted on each stress–strain curve test specimen, in which two longitudinal strain gauges were arranged at sides B and D, and one transverse strain gauge at side C, respectively, as shown in Figure 2b (as the specimen is molded, the surface side A is rough and uneven, so no strain gauge is set on side A), connected with the computer for synchronous strain acquisition before peak load, in addition, two linear voltage-displacement transducers (LVDT) were arranged in the both sides of the specimen to record the axial deformation. During the loading process, the load values of the test specimen were measured by the machine through the pressure sensors, then according to the measured data the computer automatically generated the curve of loading and unloading. The phenomenon was recorded during the test process. Due to the low strength and high brittleness of coral aggregate, the specimen generally cracked and then collapsed rapidly when it was loaded around the peak load, and therefore displacement gauge could just collect few data during the post peak stage.

3. Results and Discussion

3.1. Basic Physical and Mechanical Properties

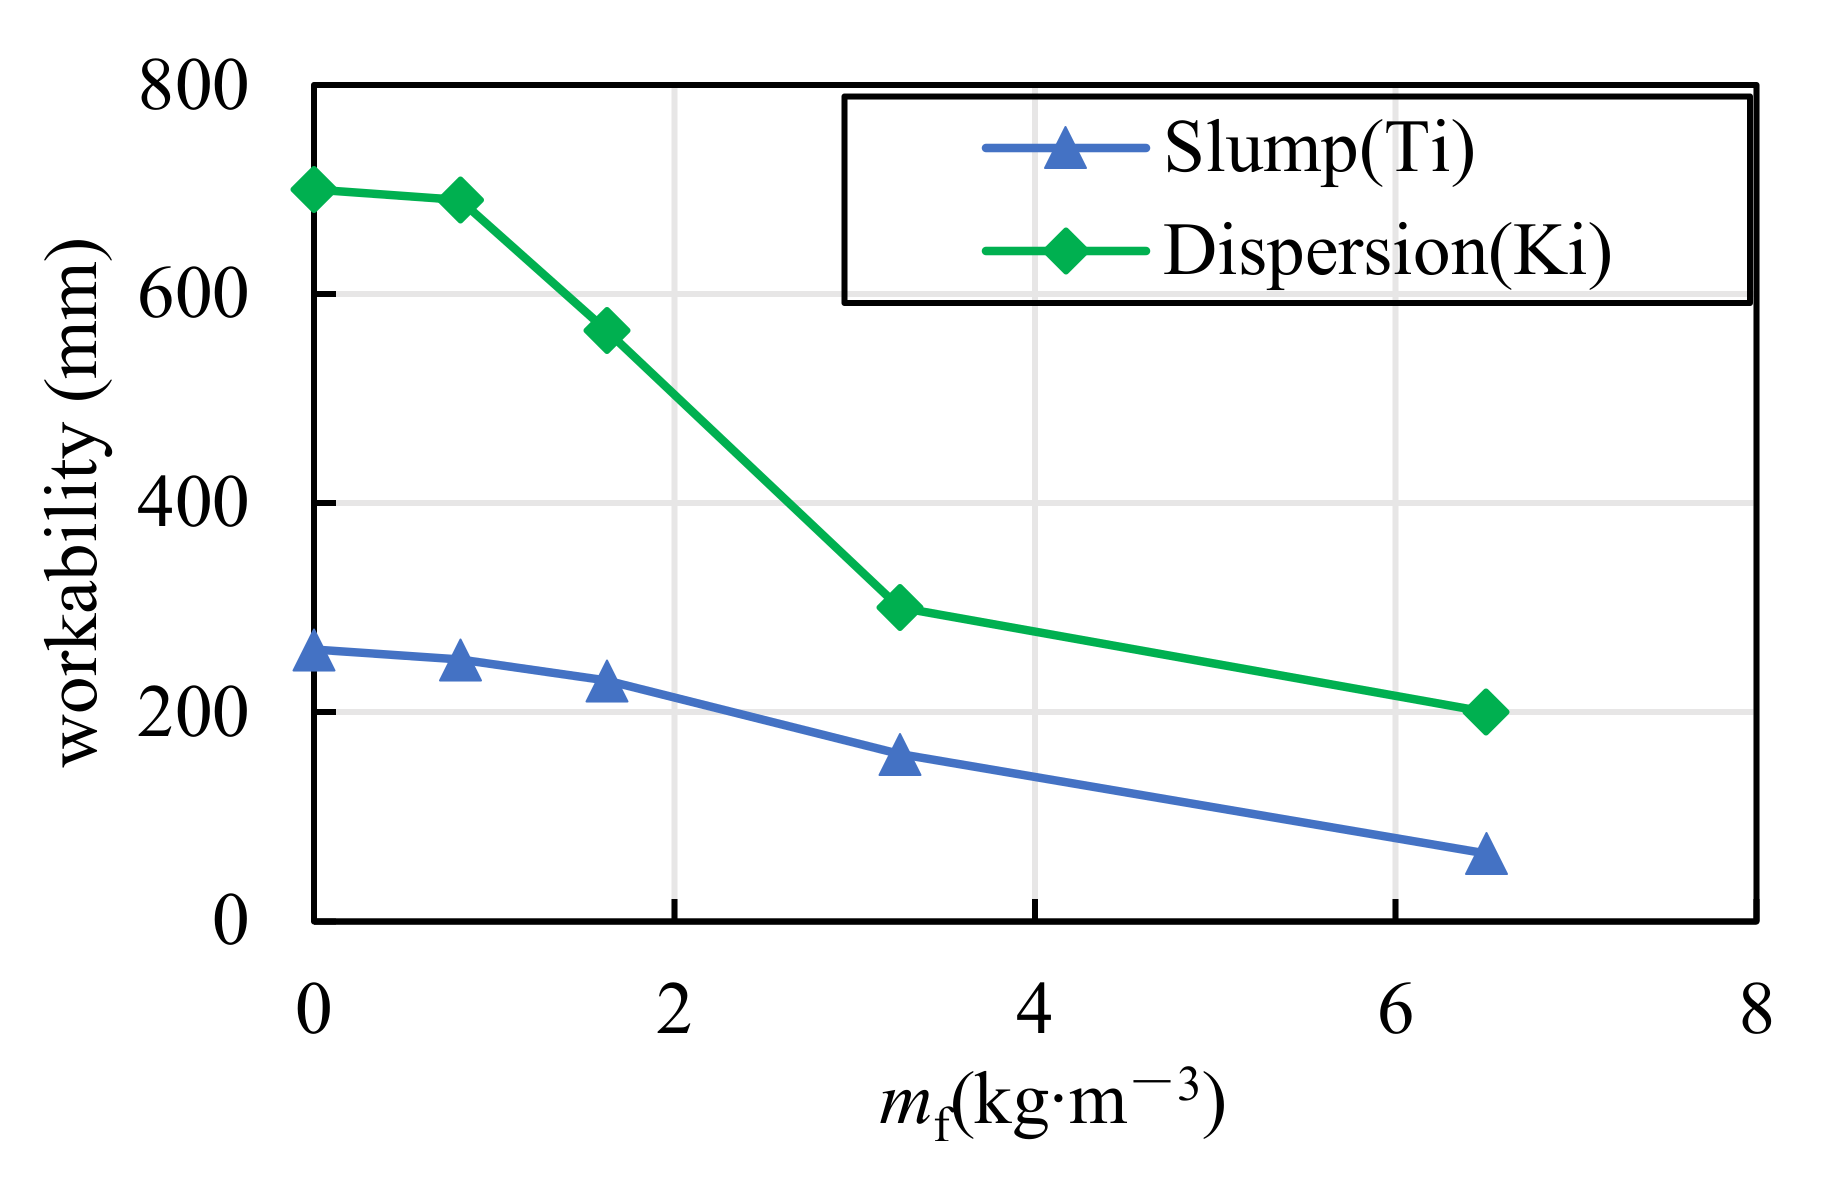
3.1.1. Working Performance

The tests of slump and dispersion were conducted according to Chinese standard GB/T 50080-2016 [34], as shown in Figure 3. The workability performance of coral concrete was classified according to Chinese standard GB50164-2011 [35], as shown in Table 6. Table 7 shows the original data measured in the test. In Figure 4, the curves show the relationship between concrete workability (slump T i or dispersion K i ) and fiber content ( m f ).
From Table 7, the workability of all plain coral concrete groups in this paper was very good, yet it can be seen that the slump and dispersion of coral concrete show a rapid downward trend indicating that the viscosity of coral concrete significantly increased with the increase of PVA fiber content (as shown in Figure 4). Moreover, when the PVA fiber content increased to V f = 6 . 5 kg / m 3 , the coral concrete’s fluidity was almost completely lost, and the slump value decreased to 65 mm, only 25% of the reference group (C40). This is mainly due to the following two reasons. On the one hand, PVA fiber has a large specific surface area and good cement compatibility; with the increase of fiber content, more and more cement slurry is used to wrap the fiber, resulting in an increased cohesion of coral concrete. On the other hand, the disordered fibers scattered in the concrete form a bridging effect, which hinders the flow of coral concrete more with the increase of fiber content. As the slump of concrete shall not be less than 70 mm during construction in high temperature environment [36], it is suggested that the PVA fiber dosage of coral concrete should not exceed 5 kg/m3 in marine environment construction. Besides, the dispersion of pumped concrete should not be less than 500 mm [35], and thus it is suggested that the PVA fiber dosage should not be more than 2.0 kg/m3 if using pumping construction.

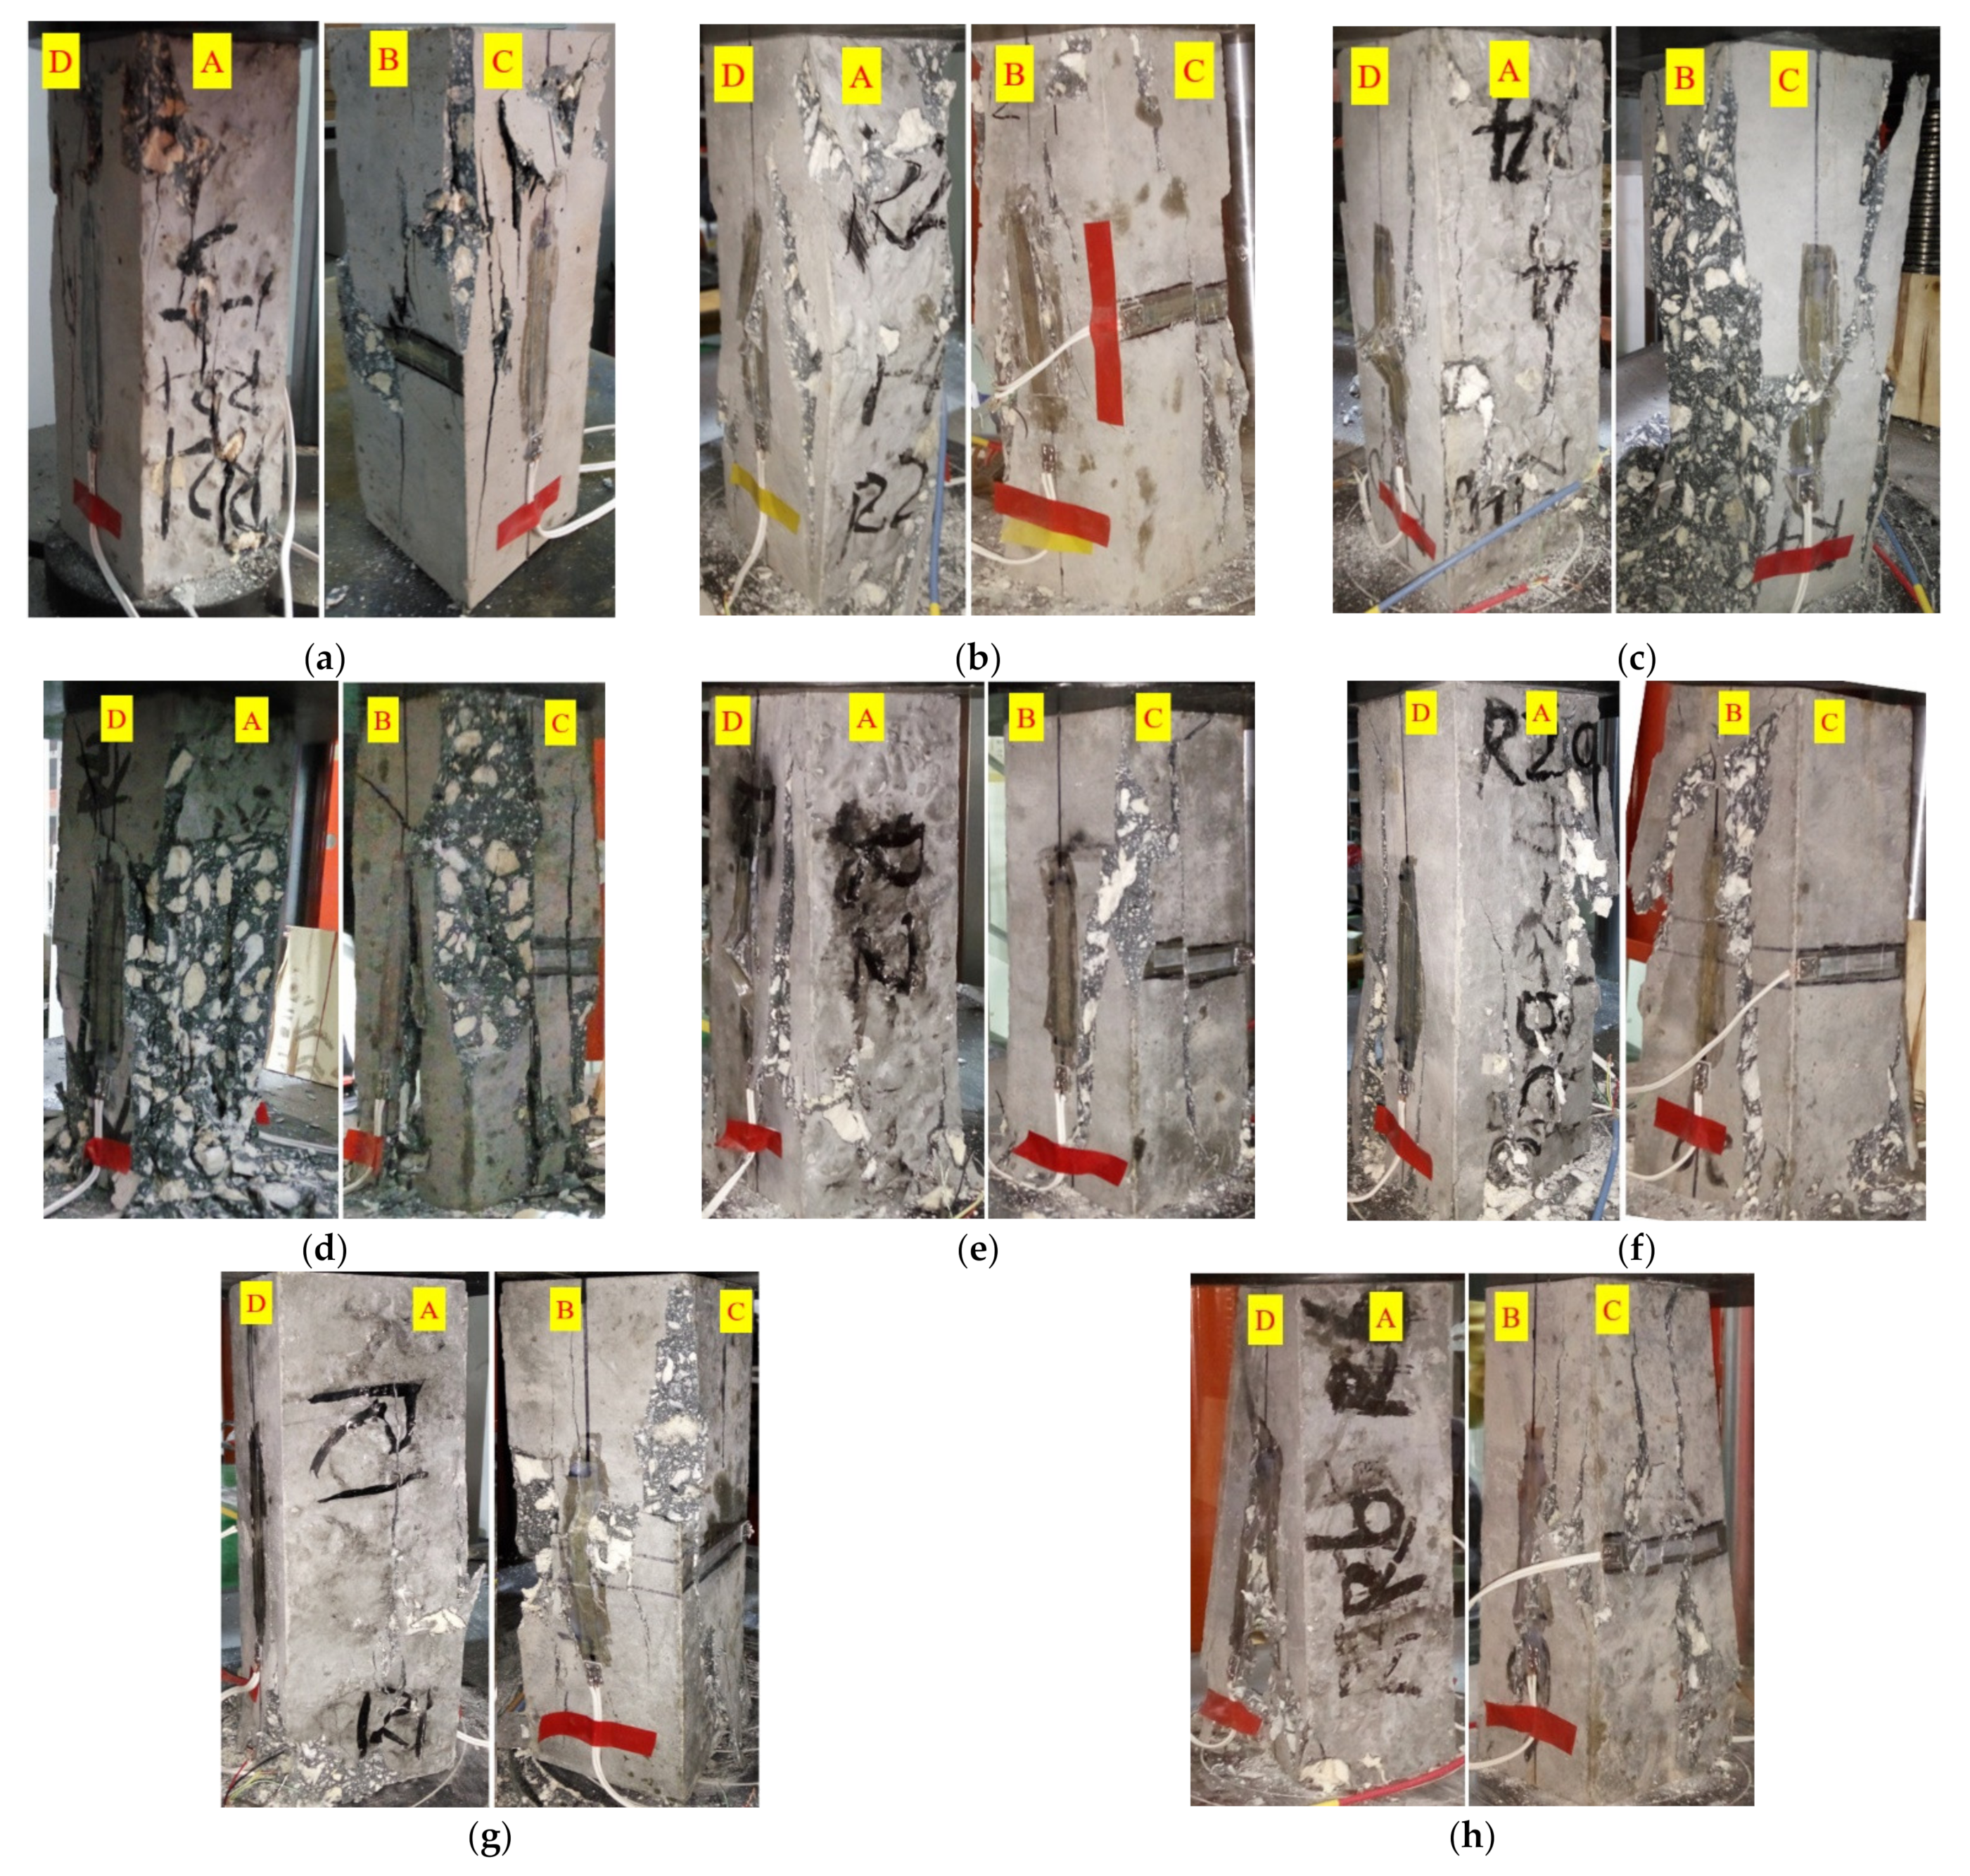
3.1.2. Test Phenomenon

During compression loading, almost all of the specimens shown obviously brittle failure. Most of the specimens began to appear obvious destructive cracks after bearing about 90% of the ultimate load. With the load approaching the peak load, the cracks spread rapidly and some of the concrete at the corners of the test specimens was torn into slag and dropped. Finally, the test specimen was destroyed immediately with a sound of cracking.
The typical failure of plain coral concrete specimen was mainly compression crushing, as shown in Figure 5, and some specimens were directly decomposed into several blocks by a few major cracks. Different from the crack propagation around the aggregate of ordinary concrete, all cracks in coral concrete specimens directly initiated and propagate through the coral aggregate, which indicated that the low strength and high porosity of coral aggregate leaded to the high brittleness of coral concrete. In addition, there are many visible holes of different sizes in the interior and surface of the coral concrete blocks with maximum diameter of about 2–3 mm. This may be due to the high porosity of coral aggregate, which exhausts the gas in the internal pores during water absorption.
However, the brittleness of coral concrete was obviously improved by adding PVA fiber. Compared with the plain coral concrete group (C40), the integrity of the specimen with PVA fibers (FC1 to FC4) was better due to the bridging and toughening effect of PVA fiber, and the local chipping and peeling was also significantly reduced, some specimens still remained integrity after failure, as shown in Figure 6.

3.1.3. Mechanical Properties

The mechanical properties of experimental specimens are summarized in Table 8, and the measurement results are taken as the average of the three samples in each group. With comparison of specimens C40 and FC1 to FC4, it can be seen that adding an appropriate amount of PVA fiber can improve the compressive strength, peak strain, Poisson’s ratio, and residual stress after crushing failure also increased significantly. Yet, the effect of PVA fiber content on the elastic modulus of coral concrete is less than 3.5%.
In this paper, the slope of the linear segment between two points ( ( ε 1 , σ 1 ) and ( ε 2 , σ 2 ) ) of the ascent section of the longitudinal stress–strain curve was taken as the elastic modulus E c [37,38] of coral concrete, and this method is reasonable. The formula is as follows:
E c = ( σ 2 σ 1 ) / ( ε 2 ε 1 )
where σ 1 = 0 . 2 σ cr , σ 2 = 0 . 4 σ cr , ε 2 and ε 1 are the longitudinal strains corresponding to σ 2 and σ 1 on the stress–strain curve, respectively [38].
Poisson’s ratio is defined as the absolute value of the ratio of the transverse strain to the longitudinal strain of the specimen [39]. In this paper, the ratio of the transverse strain to the longitudinal strain of two points ( ( ε 1 , ε t 1 , σ 1 ) and ( ε 2 , ε t 2 , σ 2 ) ) corresponding to E c is taken as Poisson’s ratio, and the formula is as follows:
μ = ( ε t 2 ε t 1 ) / ( ε 2 ε 1 )
where ε t 1 ( ε t 2 ) and ε 1 ( ε 2 ) are the transverse strain and longitudinal strain corresponding to the stress of 0 . 2 σ cr and 0 . 4 σ cr , respectively, on the ascend stage of the uniaxial compression stress–strain curve.

3.2. Discussions on Uniaxial Compression Stress–Strain Curves
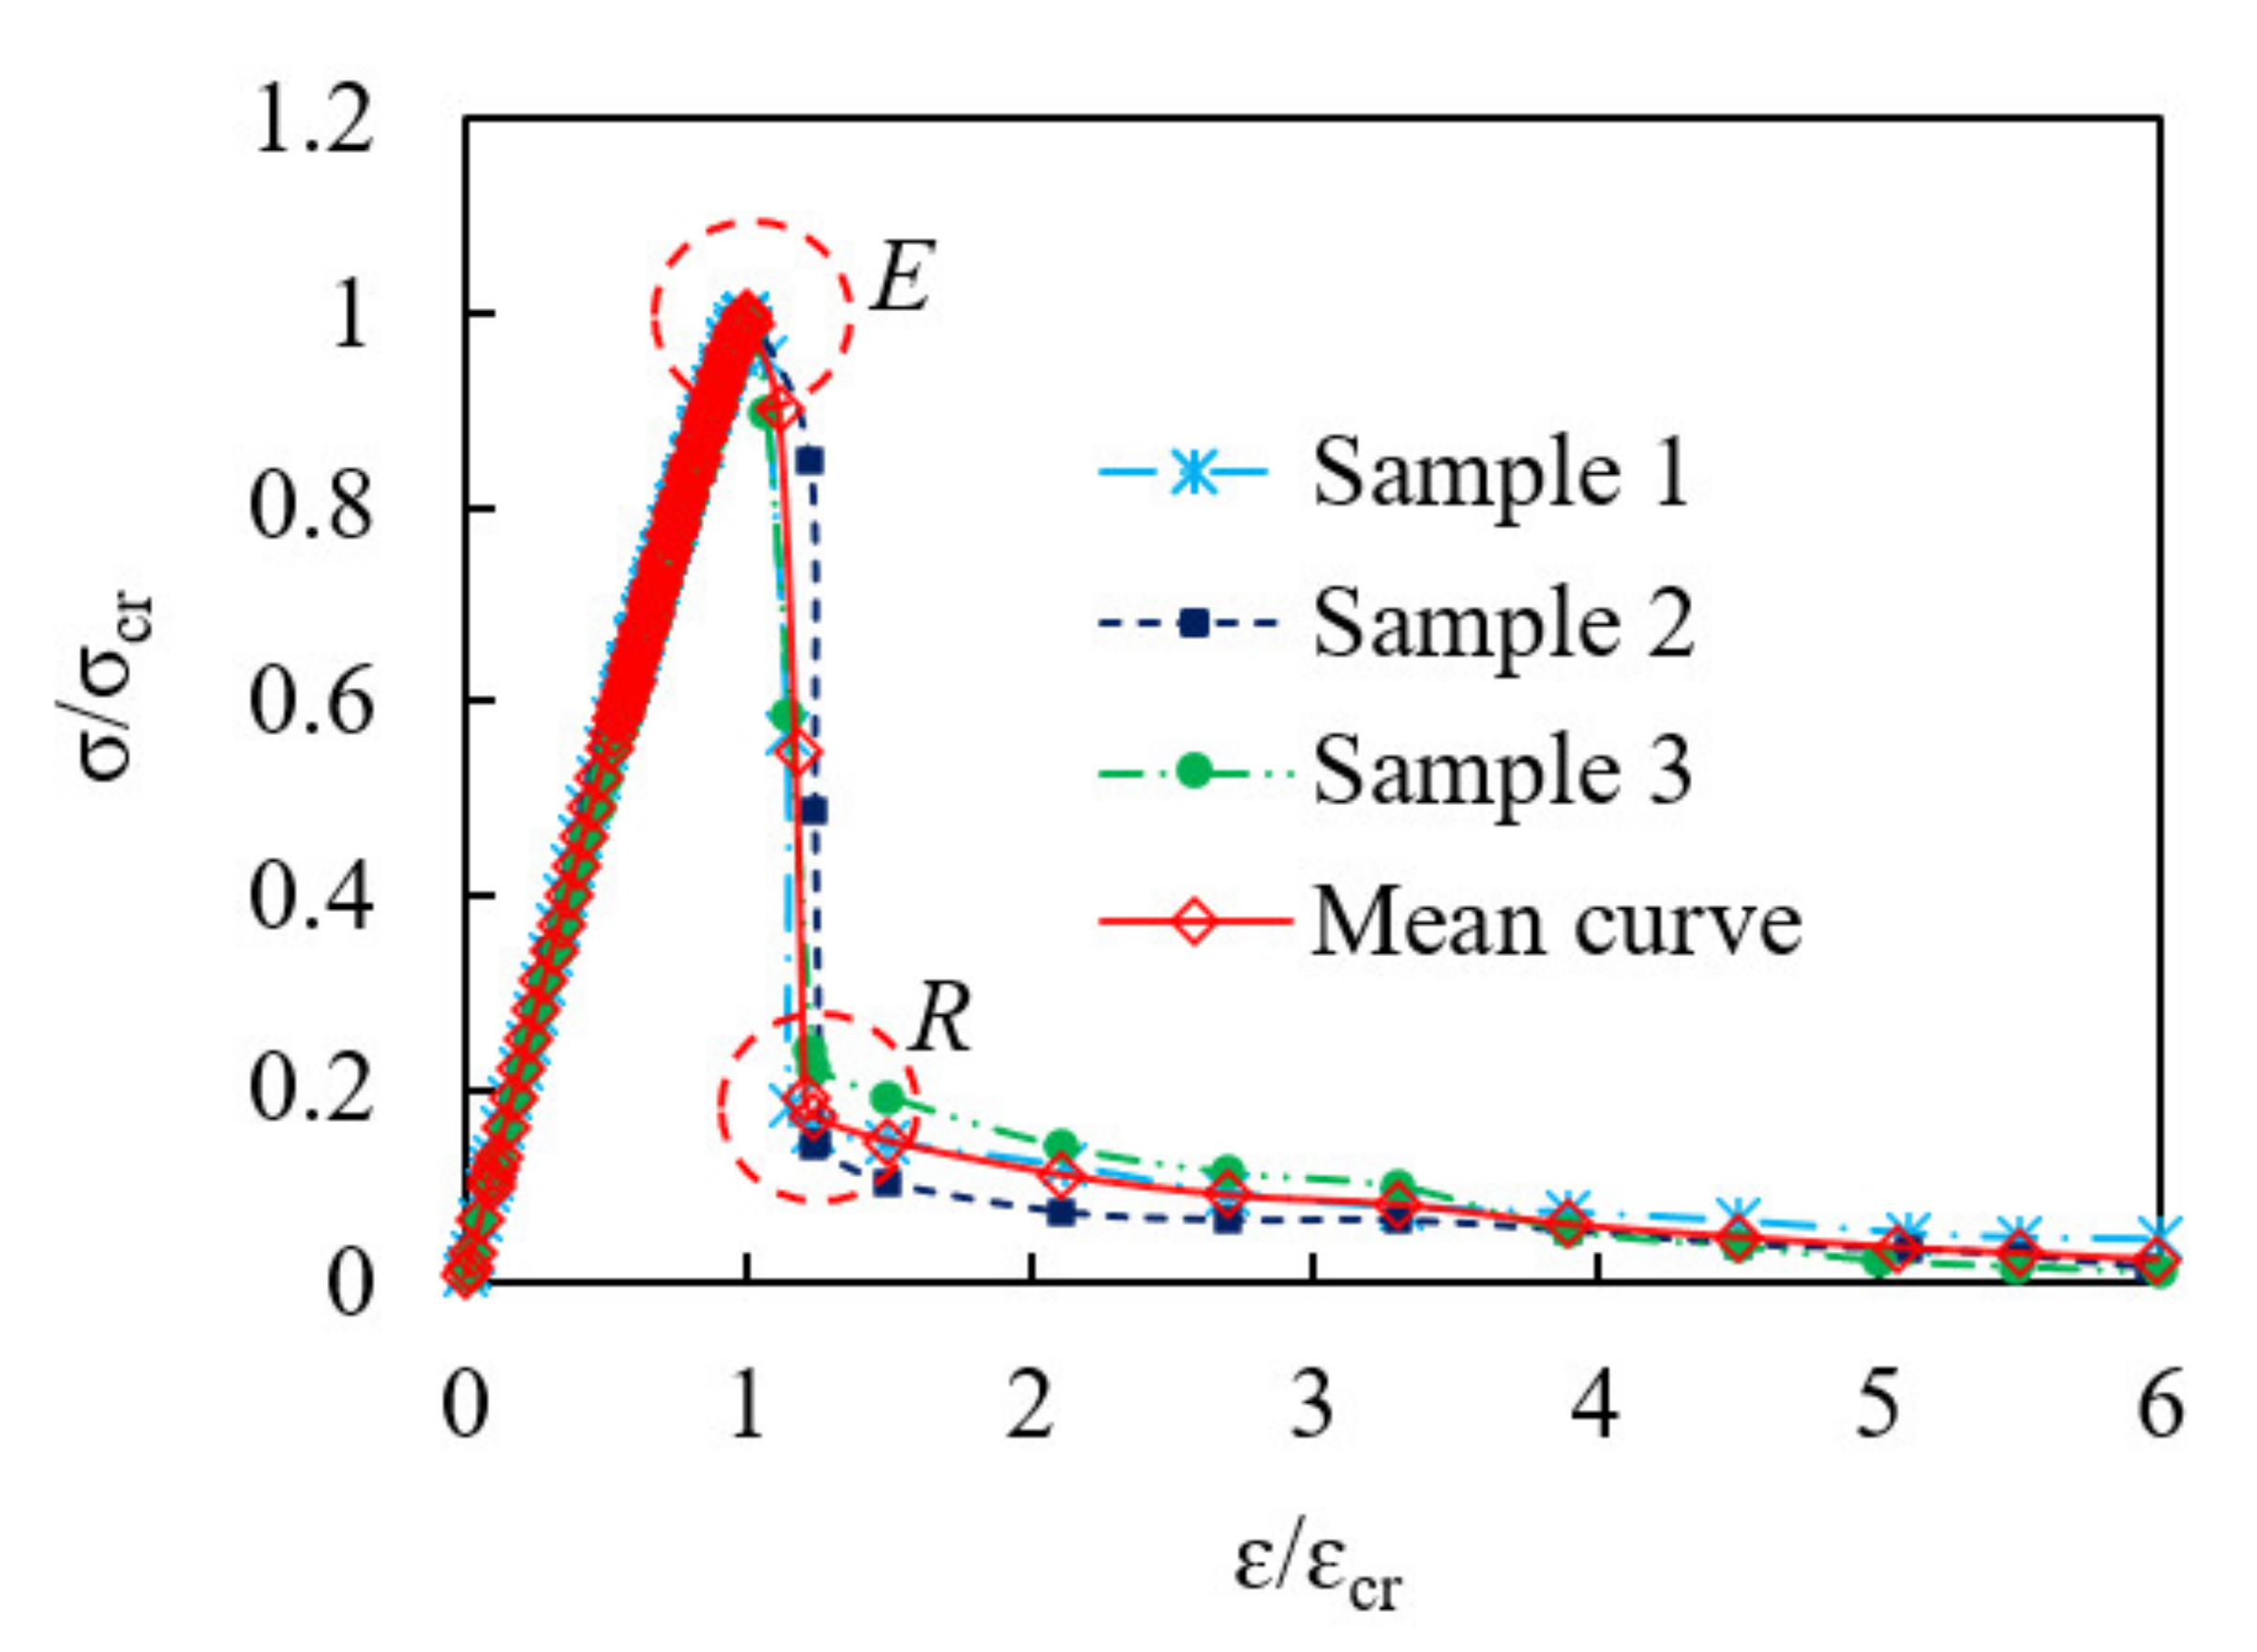
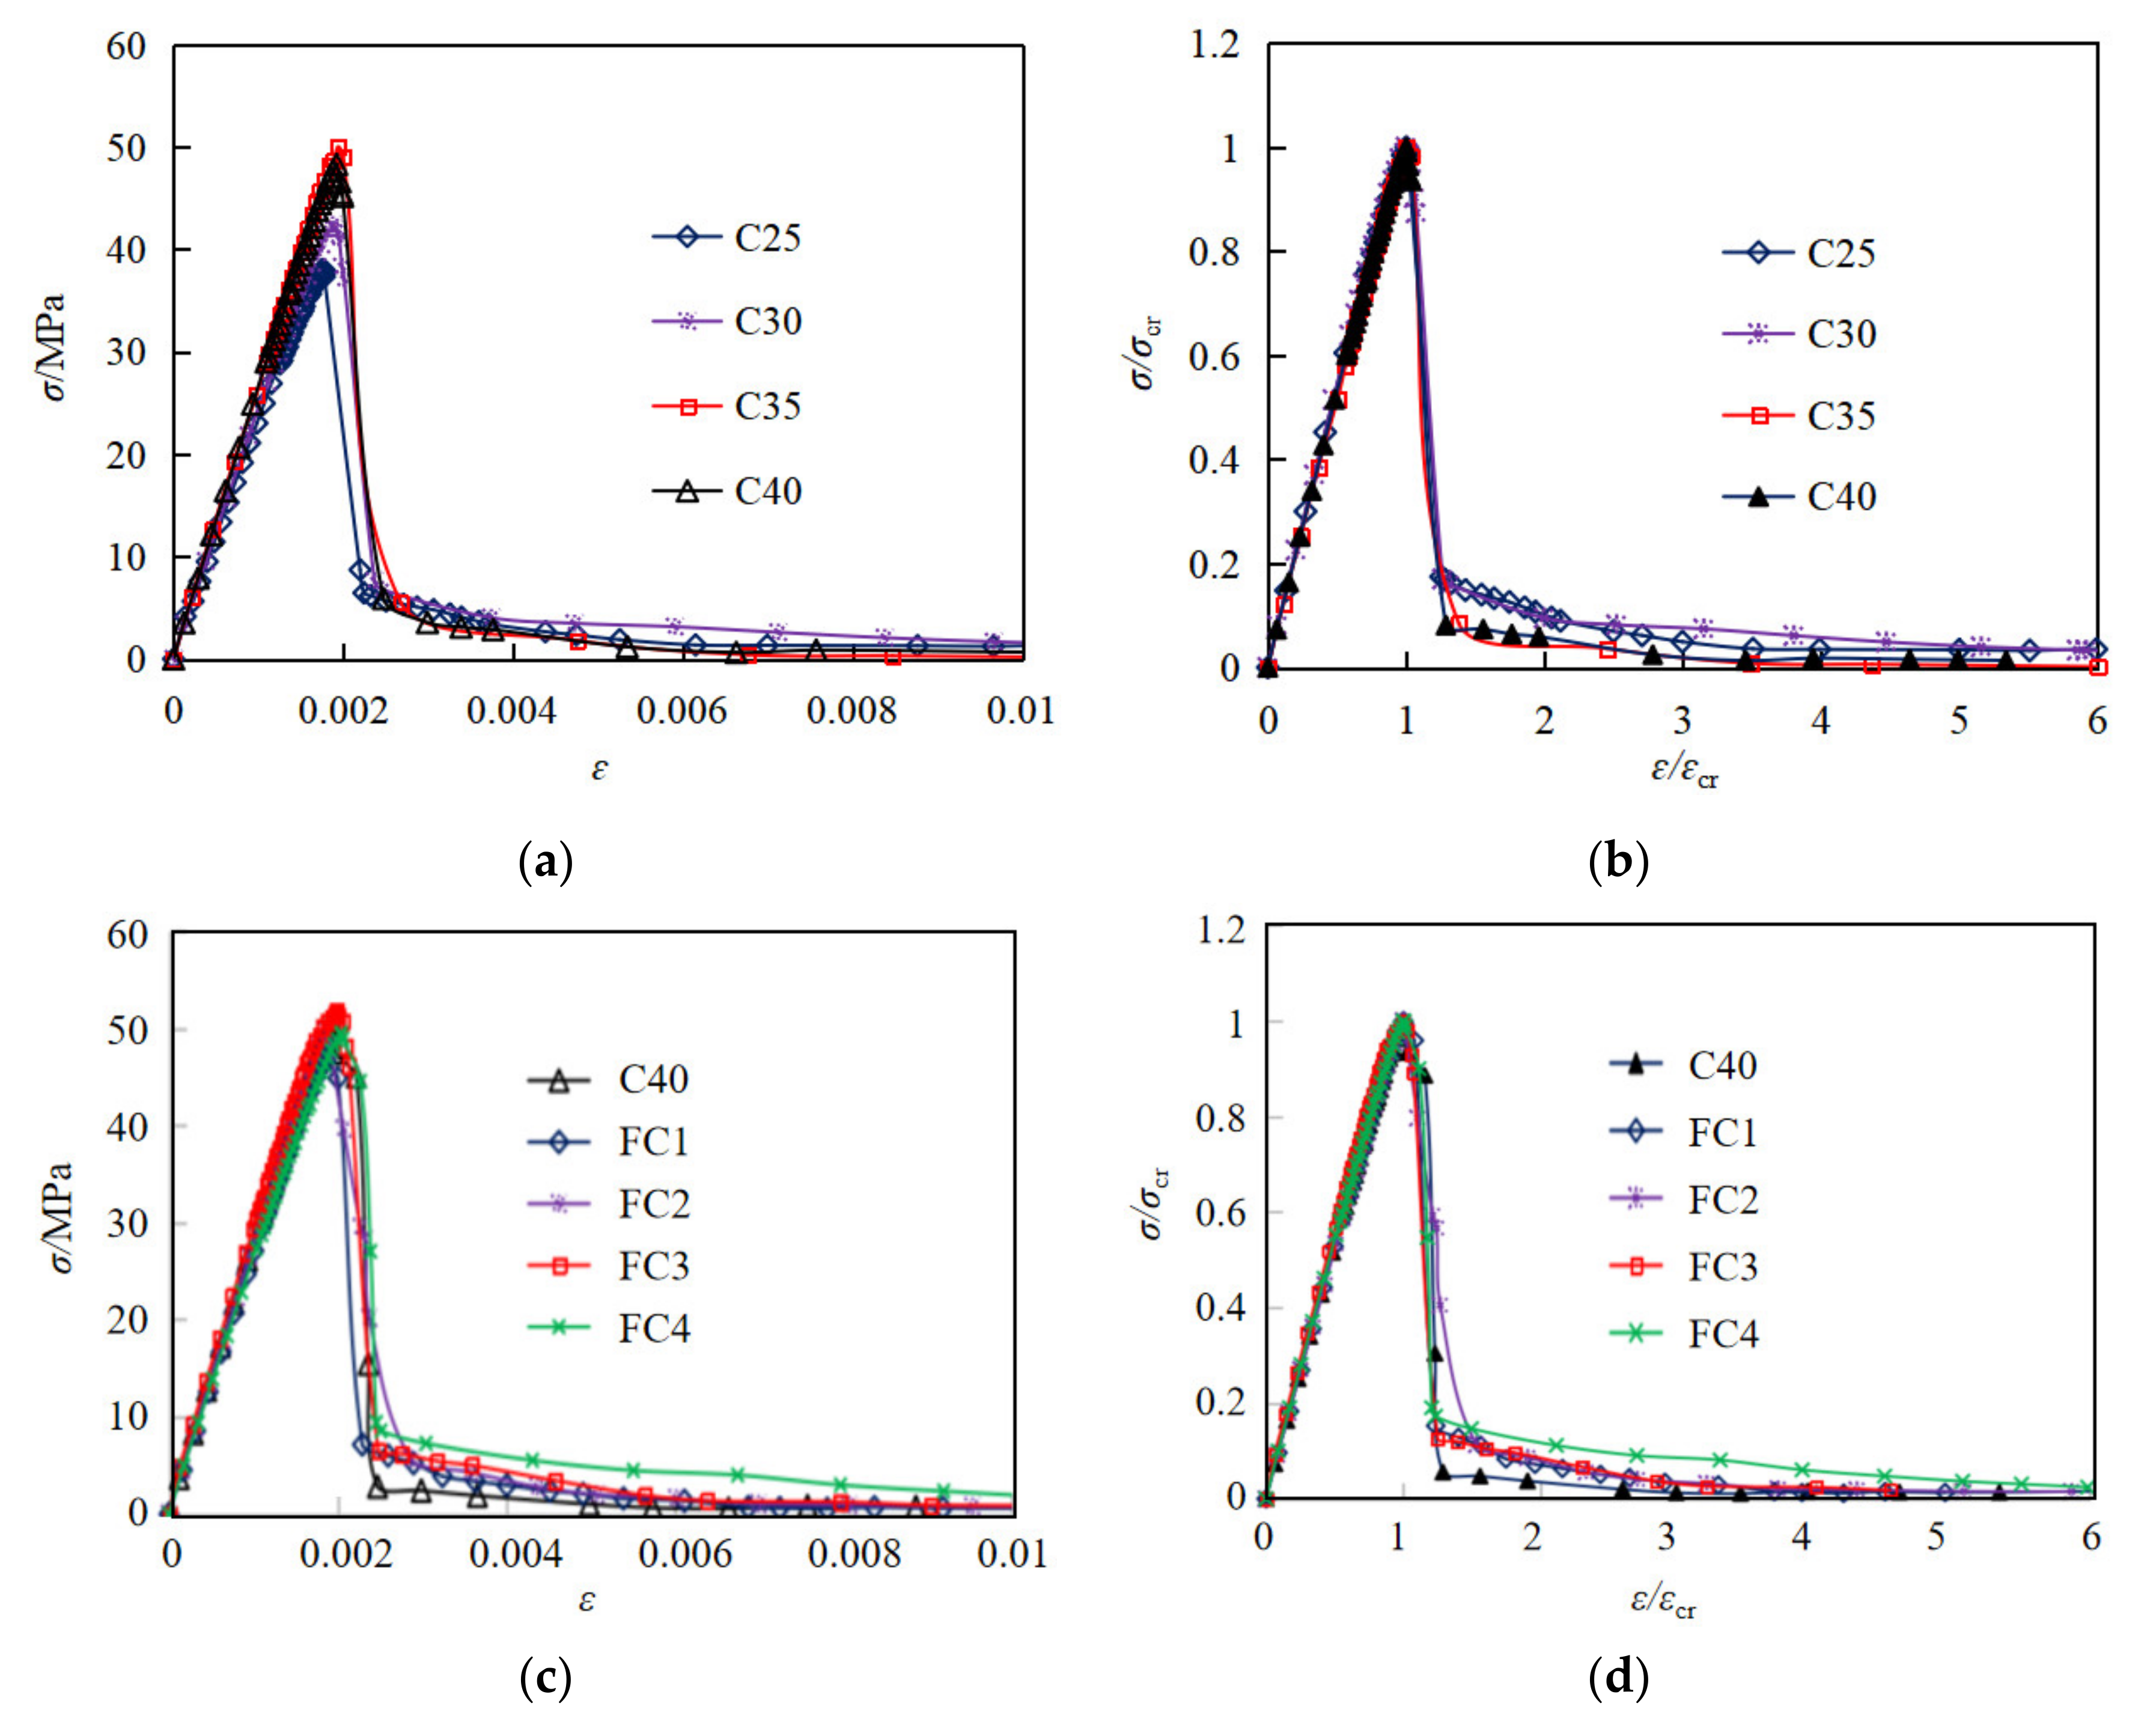
3.2.1. Test Results

According to Equations (3) and (4), the measured load and longitudinal displacement were converted into stress σ and strain ε .
σ = P / A
ε = ( ε L + ε R ) / 2 Δ L / L                         ( σ σ cr )                         ( σ > σ cr )
where σ is stress of concrete specimen (MPa); P is axial pressure (N); A is concrete specimen compression area (mm2); ε is longitudinal strain of concrete specimen; L is the longitudinal displacement (mm); Δ L is longitudinal deformation (mm); ε L , ε R are longitudinal strains measured by the longitudinal strain gauges on the B side and D side of the specimen (see Figure 2b) before loading to the ultimate load.
In order to analyze the stress–strain curve and toughness index accurately, the author normalized the measured data as follows:
Firstly, the stress values and the strain values of the stress–strain curve were divided by the peak stress and peak strain, respectively, as follows:
y = σ / σ c r
x = ε / ε c r
where σ cr is peak stress (MPa); ε cr is peak strain.
Secondly, on the basis of the equal or close strain values ( x 1 i x 2 i x 3 i ), calculating the weighted average of the stress values of three specimens from the same group (the weighting coefficient is 1/3), i.e., as follows:
x i = x 1 i + x 2 i + x 3 i 3
y i = y 1 i + y 2 i + y 3 i 3
where x 1 i , x 2 i , x 3 i are the relative strain values (dimensionless) of three samples in the same group respectively, y 1 i , y 2 i , y 3 i are the relative stress values (dimensionless) corresponding to x 1 i , x 2 i , x 3 i , respectively.
In order to get accurate and effective normalized stress–strain curve, it is necessary to pay attention to the continuous transition around the peak point (E) and residual point (R) to ensure the consistency with the original curve shapes, taking group 5 as an example, shown in Figure 7.
Finally, according to the above steps, the normalized curves of all test groups were obtained, and the stress and strain values (dimensionless) of the normalized stress–strain curves were multiplied by the average peak stress and average peak strain of the same group, respectively, so as to obtain the average stress–strain curves of each group, as shown in Figure 8.
As shown in Figure 8, before 90% of the peak stress, the slope is constant, indicating that the strain increases linearly with the stress. As the stress approaches 90% of the peak stress, some visible cracks begin to appear on the surface of concrete and then develops rapidly. Afterwards, with increasing the stress up to ultimate stress, the curves start to clearly deviate from the straight line. When the stress exceeds the ultimate stress, the stress decreases sharply and then the specimens are crushed rapidly. As a result, only a few data points in the declining stage of curves could be collected due to the rapid failure process.
With an increase of concrete strength, the slope of stress–strain relationship increases correspondingly, indicating the elastic modulus of coral concrete increases, and the peak strain also increases, as shown in Figure 8a. However, the residual stress generally decreases with increasing concrete strength, as shown in Figure 8a and Table 8. From the normalized stress–strain relationship in Figure 8b, it can be seen that the curves of coral concrete with different strengths almost coincide in the linear part before 90% of the peak stress, thus it can be concluded that the elastic modulus of coral concrete may have an approximate linear relationship with the strength.
As can be seen from Figure 8c and Table 8, compared with the control group (C40), when the content of PVA fiber was 0.8125 kg/m3,1.625 kg/m3,3.25 kg/m3, 6.5 kg/m3, the peak stress of coral concrete increased by −3.1%, 3.1%, 7.3%, 2.5%, the peak strain increased by −1.7%, −2.5%, 4.7%, 8.0%, the residual stress after failure increased by 27.1%, 20.3%, 25.4%, 66.1%, and the Poisson’s ratio increased by 6.7%, 23.8%, 25.8%, 3.3%, respectively, indicating that the addition of an appropriate amount of PVA fiber had a positive toughening effect. However, the initial elastic modulus was rarely influenced by fiber content before 50% of the peak stress. In addition, the shape and the feature point of the normalized stress–strain curves of the coral concrete with different fiber content had a minor difference.

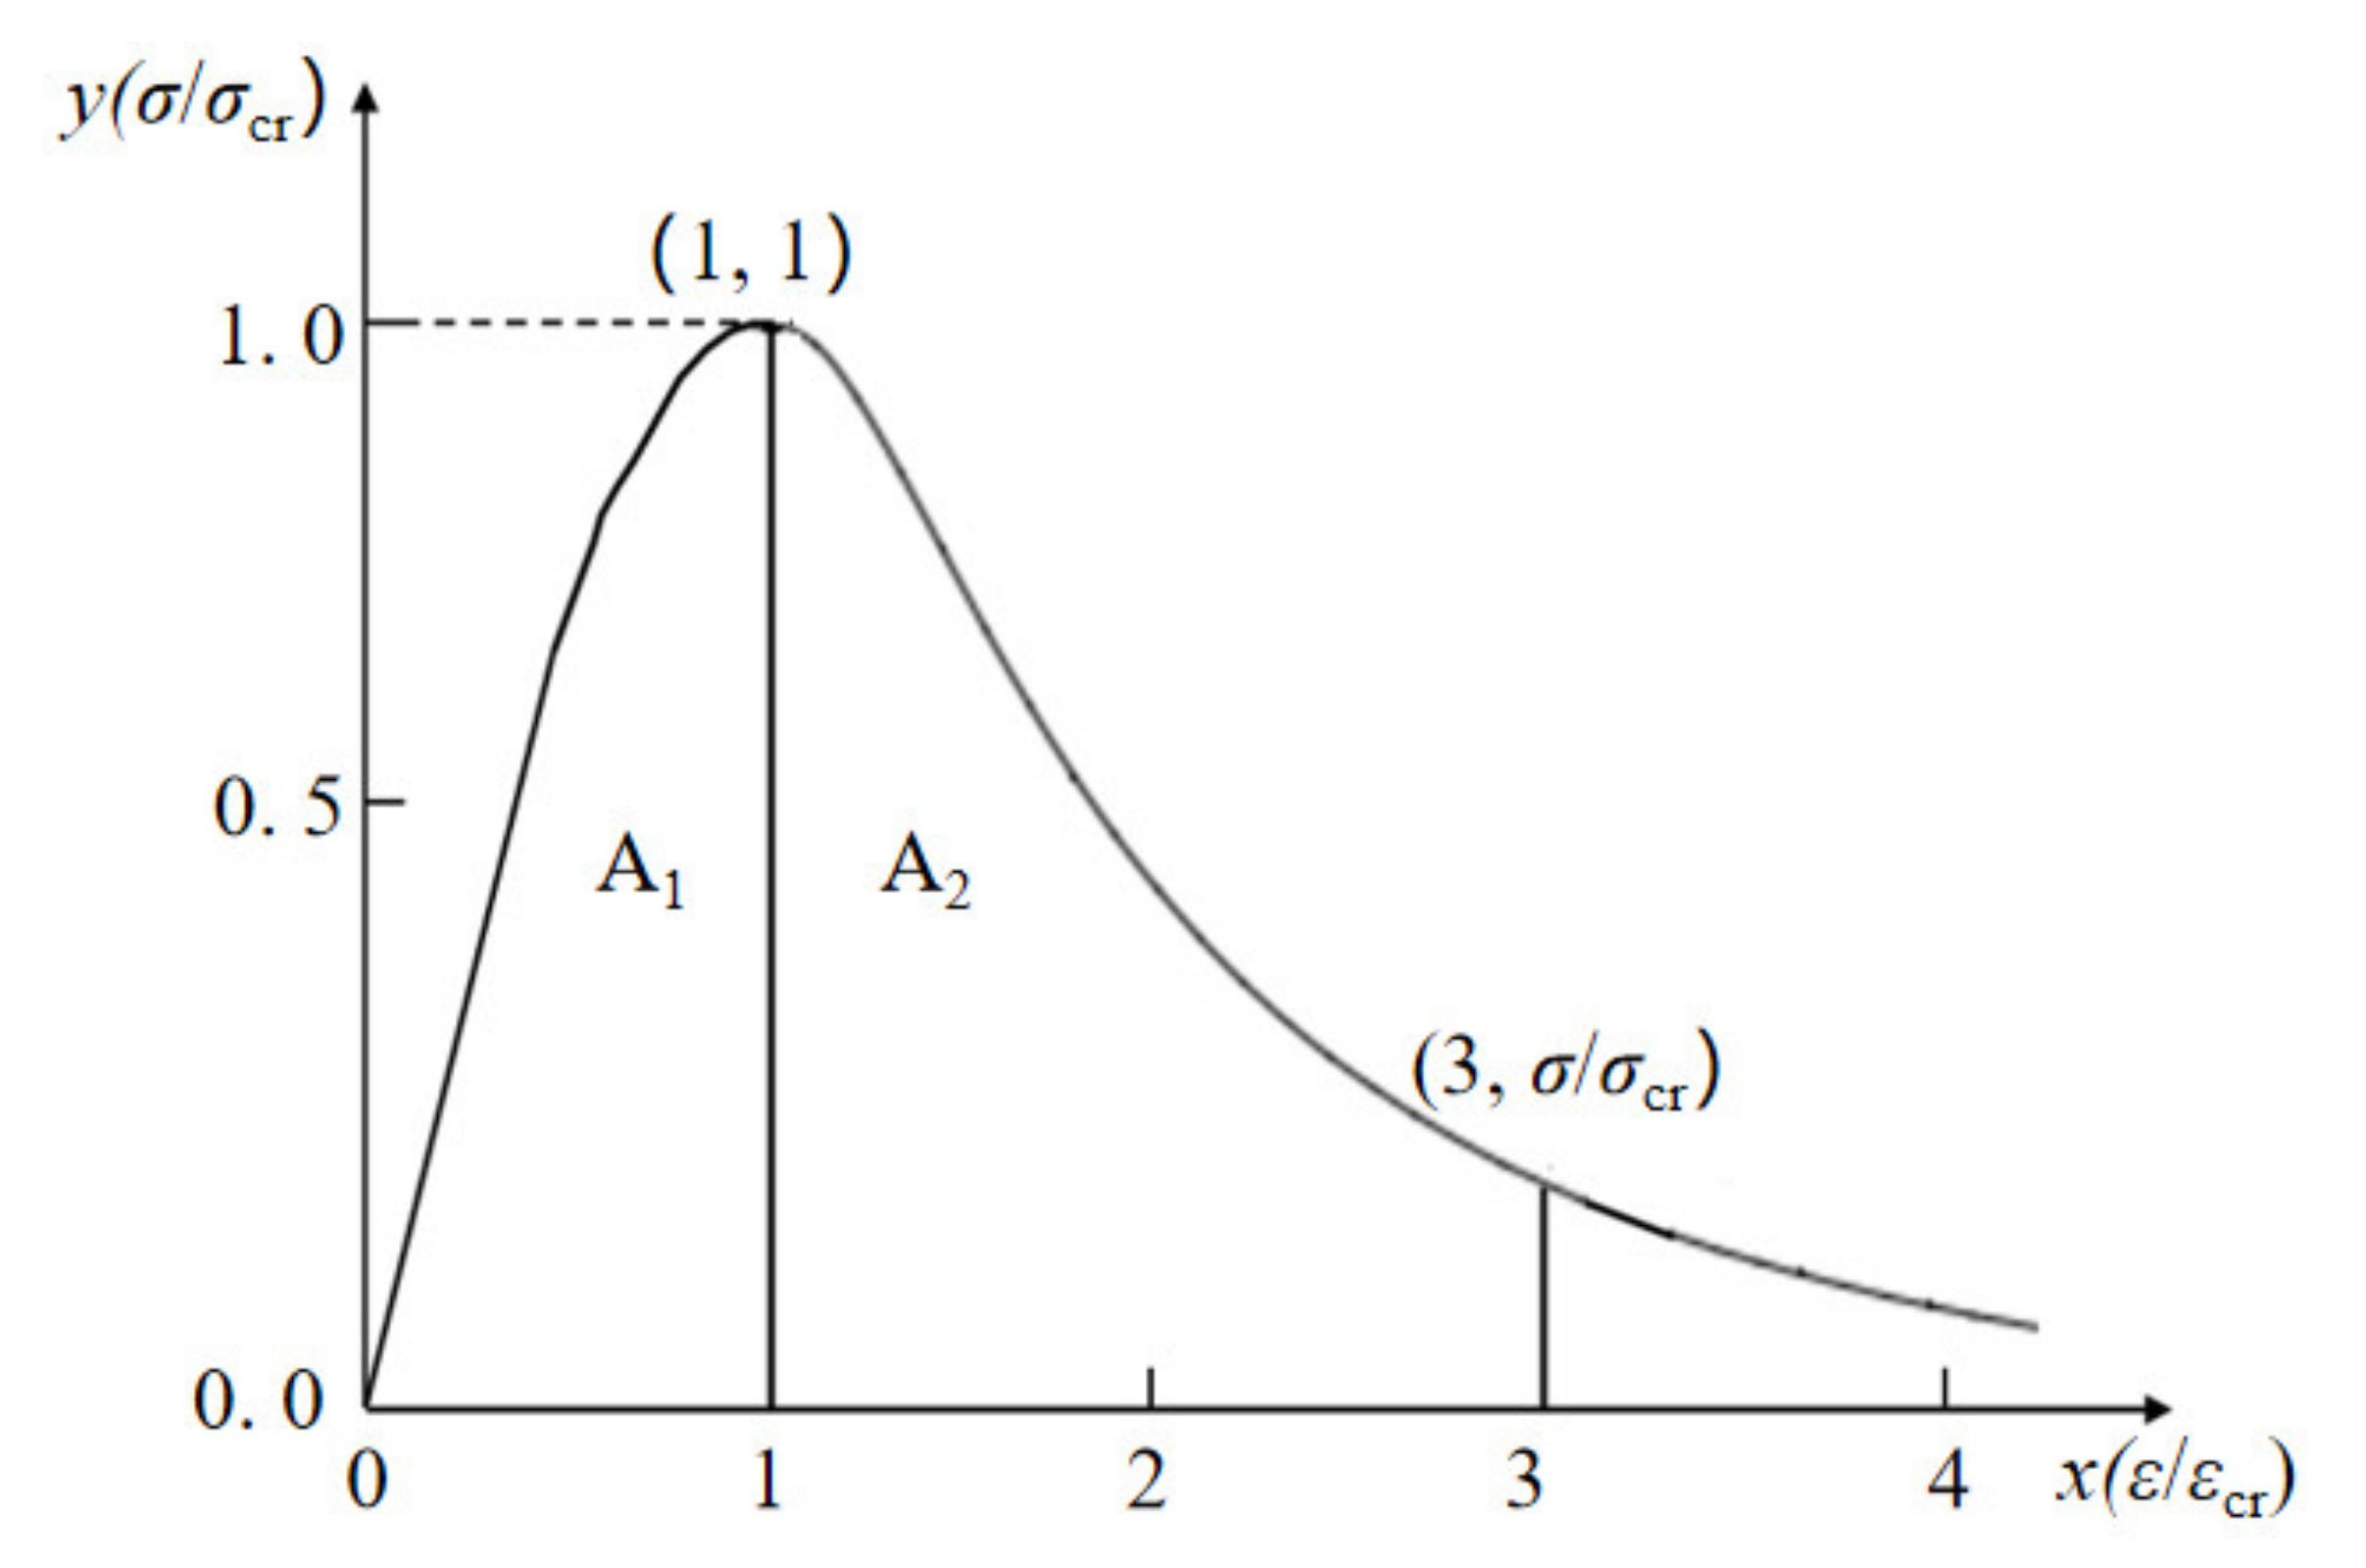
3.2.2. Toughness Index

Toughness is an important index to evaluate the deformation ability of materials or structures after reaching the ultimate load [40]. Referring to the evaluation method of concrete toughness index [41] and some suggestions from literature [42], the paper used the area parameters under the stress–strain curve of uniaxial compression (normalized) to describe the toughness, with the peak point ( σ c r , ε c r ) as the first feature point and the 3 ε c r point as the second characteristic point, as shown in Figure 9. The formulas are given as follows:
δ = A 1 + A 2 A 1 = 0 3 ε c r σ d ε 0 ε c r σ d ε = ( σ c r × ε c r ) 0 3 y d ε ( σ c r × ε c r ) 0 1 y d ε = 0 3 y d ε 0 1 y d ε
β = A 1 A 2 = 0 ε c r σ d ε ε c r 3 ε c r σ d ε = ( σ c r × ε c r ) 0 1 y d ε ( σ c r × ε c r ) 1 3 y d ε = 0 1 y d ε 1 3 y d ε = 1 δ 1
where δ is the toughness index of coral concrete; β is the brittleness index of coral concrete; A 1 is the area enclosed by the stress–strain curve in the strain ( 0 ε c r ) interval, which represents the energy density absorbed before concrete failure; A 2 is the area enclosed by the stress–strain curve in the strain ( ε c r , 3 ε c r ) interval, which represents the energy density released during the concrete failure process.
As shown in Figure 10, with increase of concrete strength, the area parameter A2 decreases obviously while the area parameter A1 rarely changes. Thus, the corresponding toughness index δ decreases and brittleness index β increases.
As shown in Figure 11, the area parameter A1 of fiber reinforced coral concrete increased slightly, but the influence of different fiber content is not obvious among the different specimen fiber contents. However, the fiber has significant influence on area parameter A2. Compared with group C40 without fiber, when the fiber content is 0.8125 kg/m3, 1.625 kg/m3, 3.25 kg/m3 and 6.5 kg/m3, the parameter A2 increases by 23.6%, 37.9%, 54.0% and 49.4%, respectively, and the toughness index δ increased by 7.5%, 12.3%, 15.0% and 14.5%, respectively. Correspondingly, the brittleness index β declined by 18.9%, 27.6%, 31.8% and 31.1%, respectively, which shows that the ductility of the coral concrete is effectively improved by adding fiber.

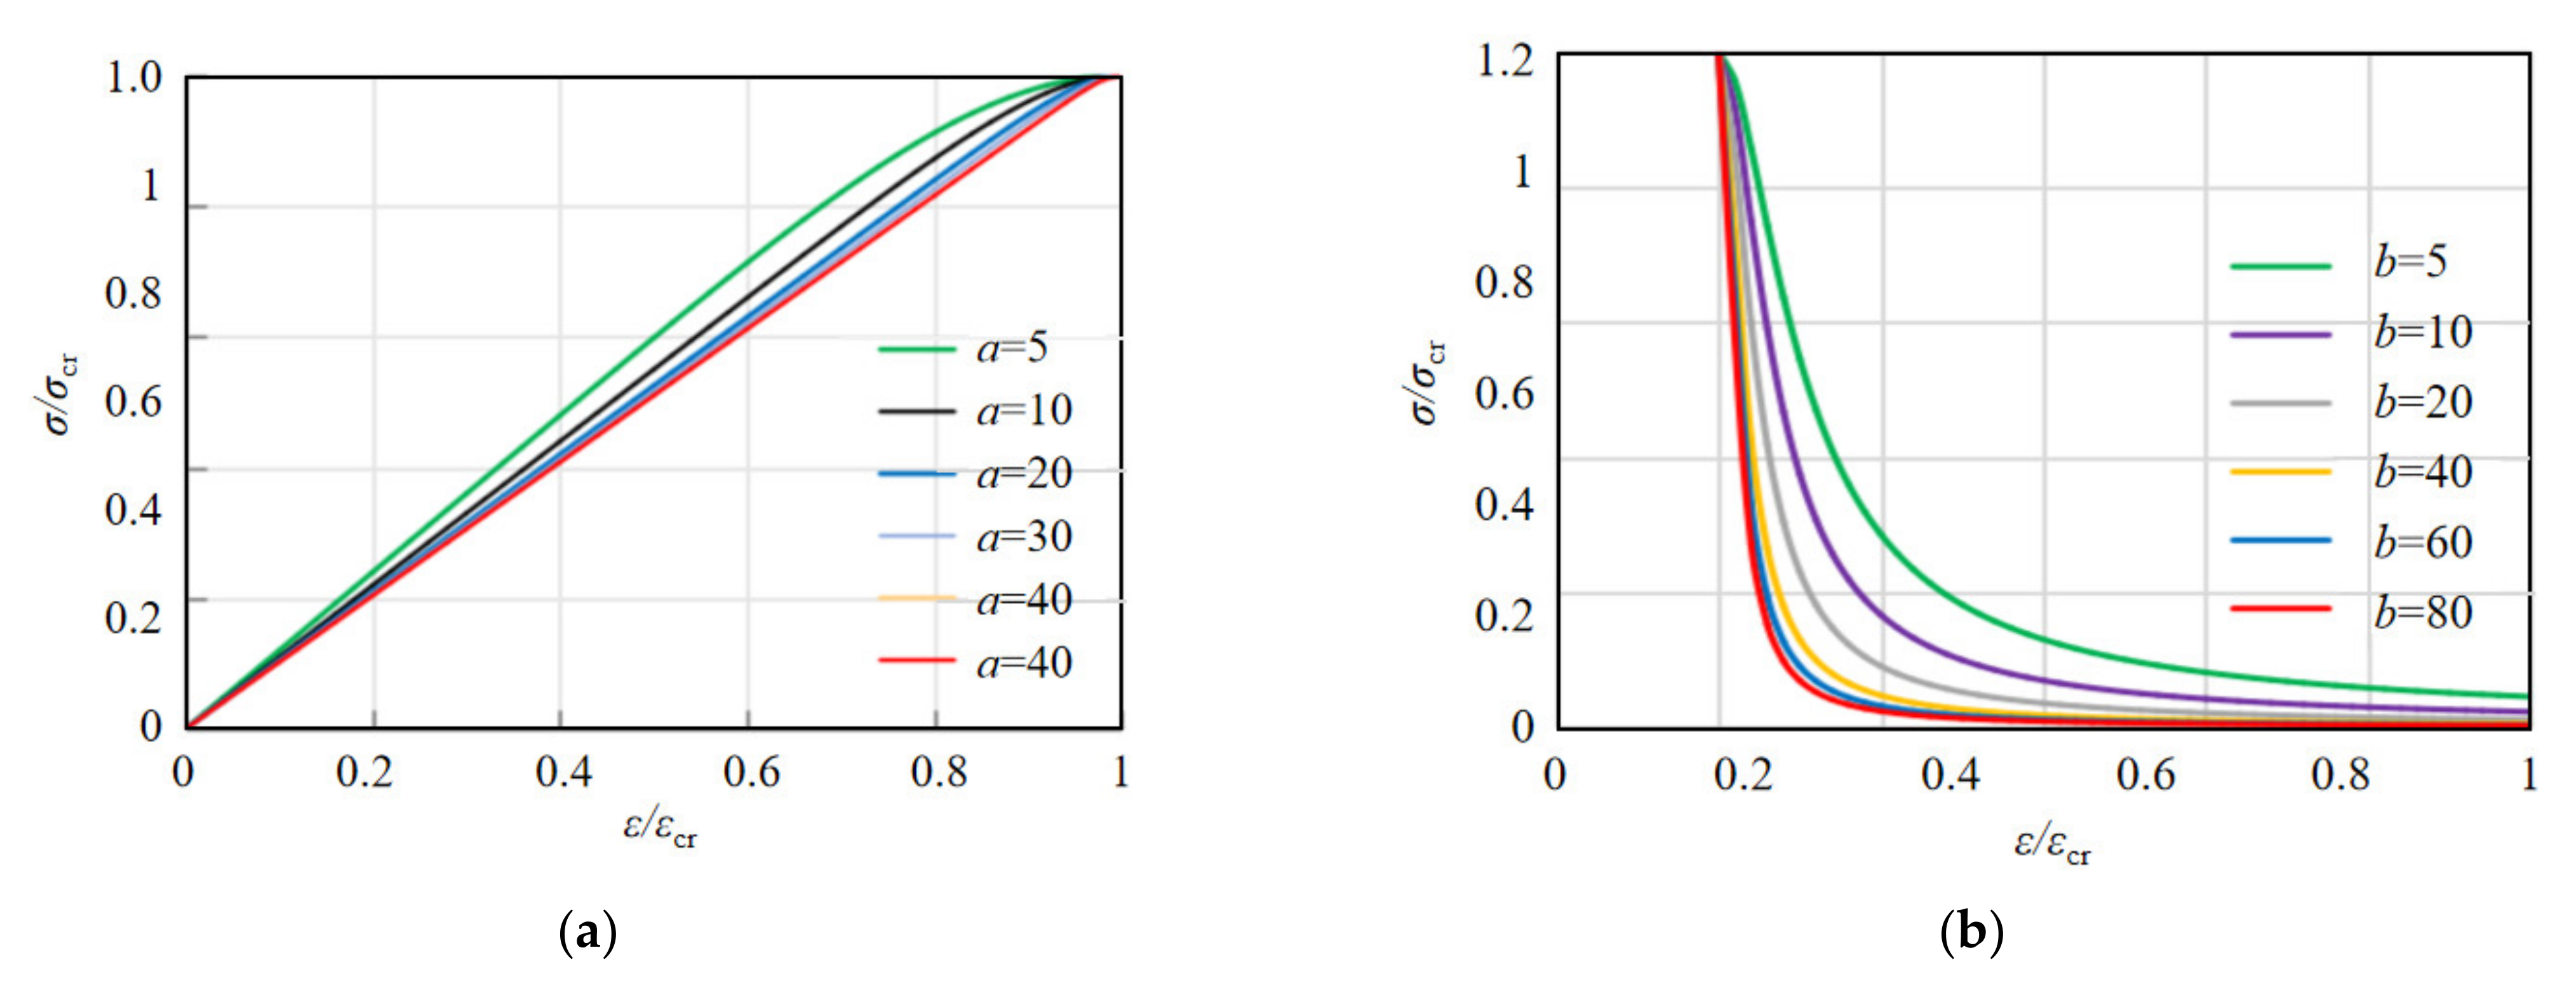
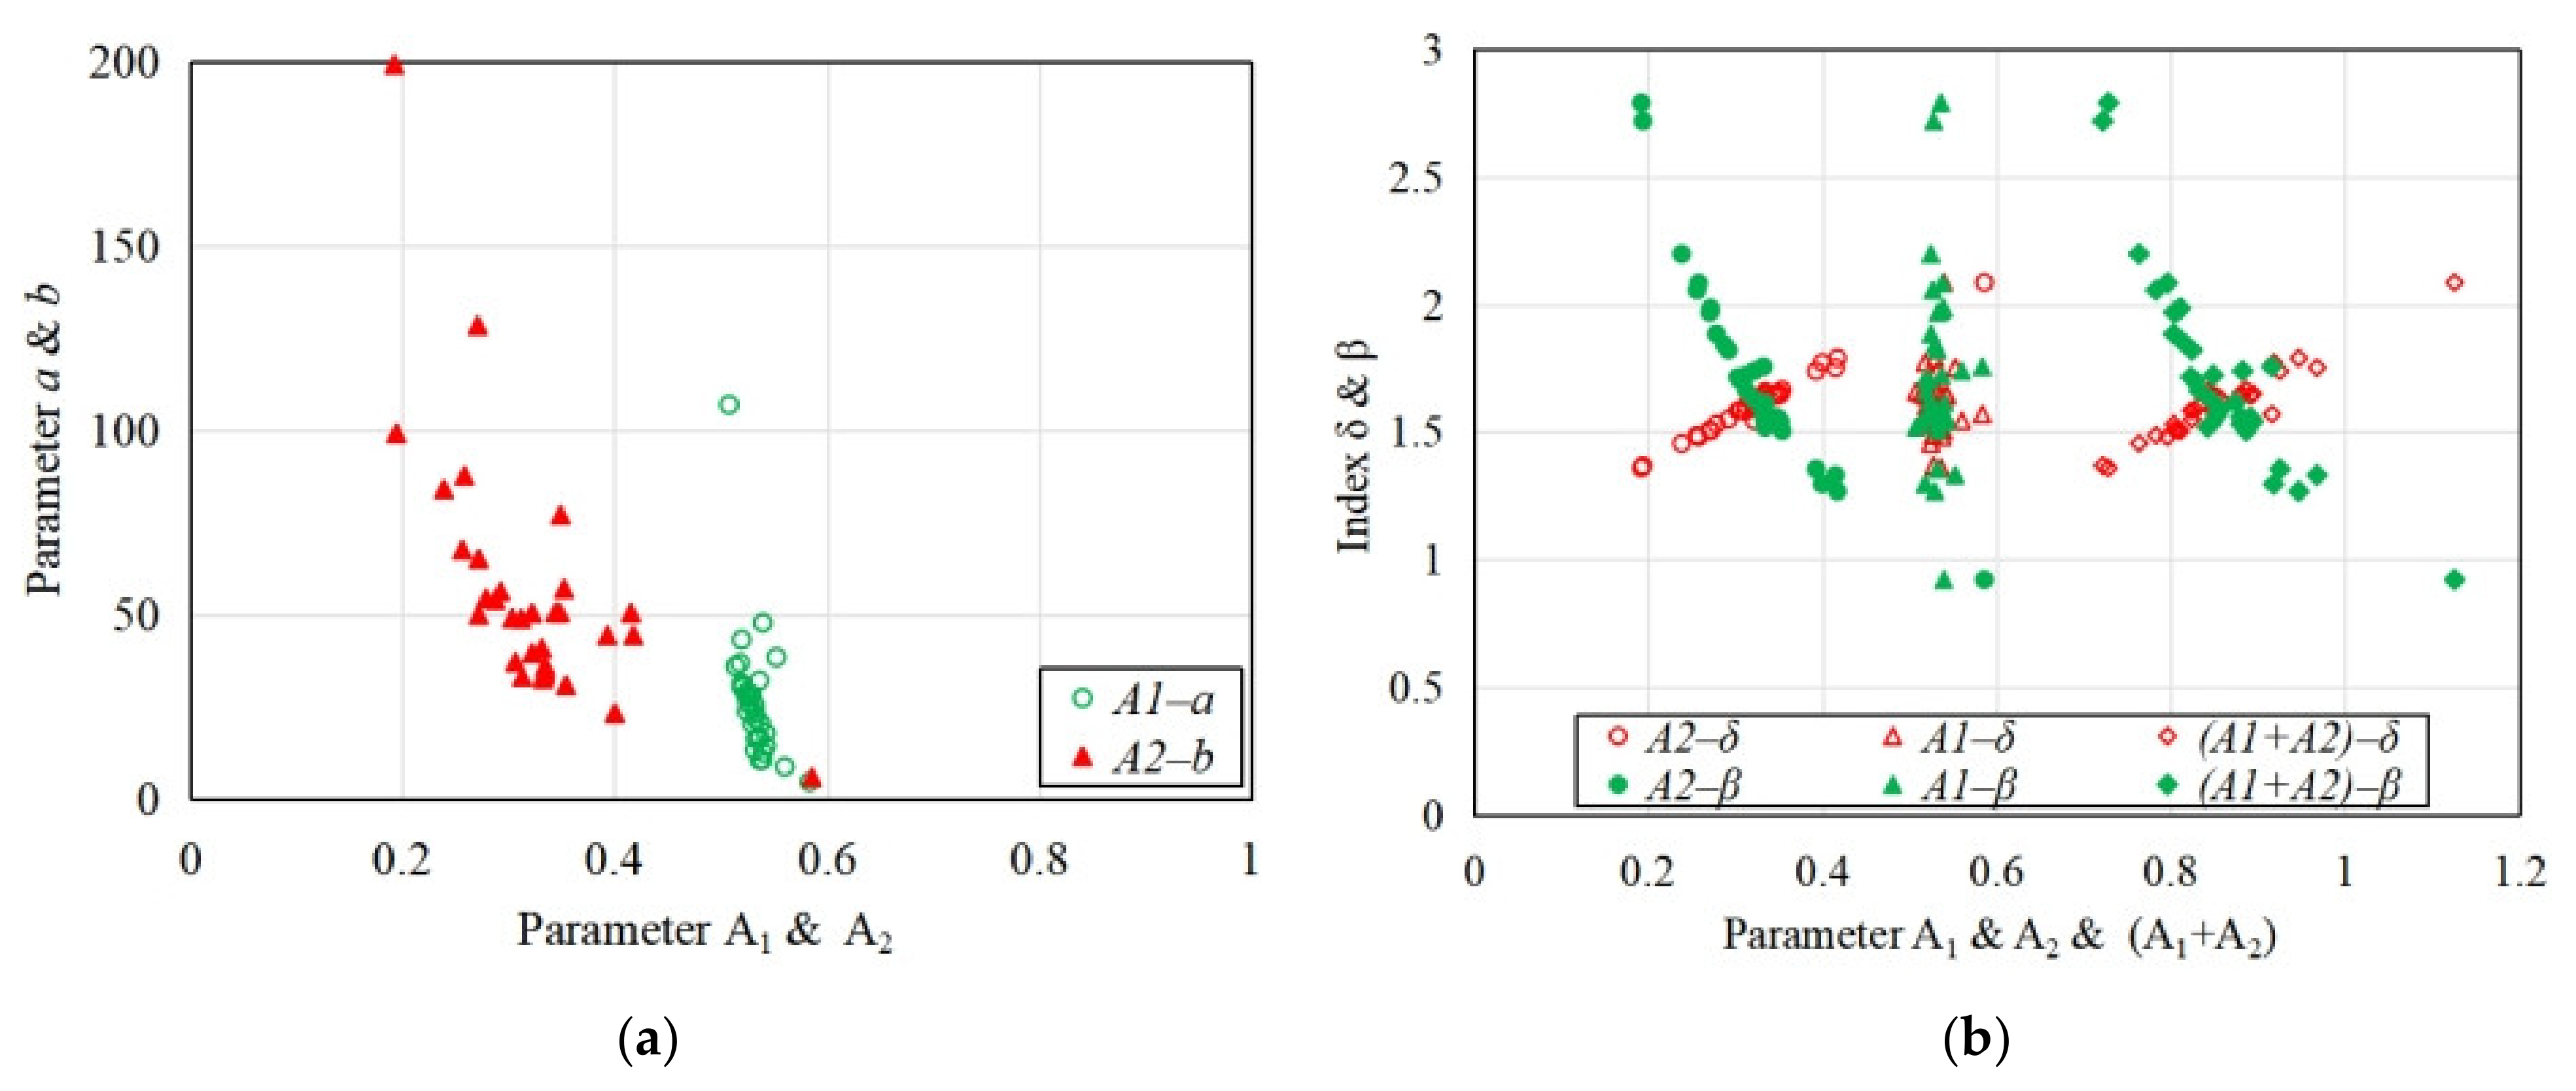
3.2.3. Numerical Modeling

The existing literatures show that there is no unified conclusion about the expression of the uniaxial compression stress–strain curve of coral concrete. Based on the existing concrete constitutive models and the test data, there is no unified constitutive models to describe the compression behavior of coral concrete. Considering the significant differences in the stress–strain curve between the ascending and declining stages of coral concrete, piecewise functions are used to describe the curve.
In this paper, according to the curve characteristics of coral concrete, three models with different mathematical presentations are selected to calculate the ascending and declining stages of the curve, as shown in Table 9, and the accuracy of different models is shown in Figure 12 ( R a 2 and R d 2 ) represent the fitting degree of the model in the ascending stages and descending stages, respectively).
As can be seen from Figure 12, in the ascending stage, the predicted results of model 2 and model 3 are in good agreement with the experimental data ( R a 2 0 . 99 ), while in the descending stage, the predicted results of model 1 and model 2 are in good agreement with the experimental data ( R d 2 0 . 95 ). Considering the coincidence with experimental curve and characteristic points of stress–strain curve, generally model 2 presents better results. Thus, the constitutive relationship of plain and PVA fiber-reinforced coral concrete can be recommend by the piecewise function model as the following equations, of which Equation (11) proposed by Yang [44] can be used to describe the ascending stage, and Equation (12) suggested by GB50010-2010 [47] can be used to describe the declining stage.
y = ( a + 1 ) x a + x a + 1
y = x b ( x 1 ) 2 + x

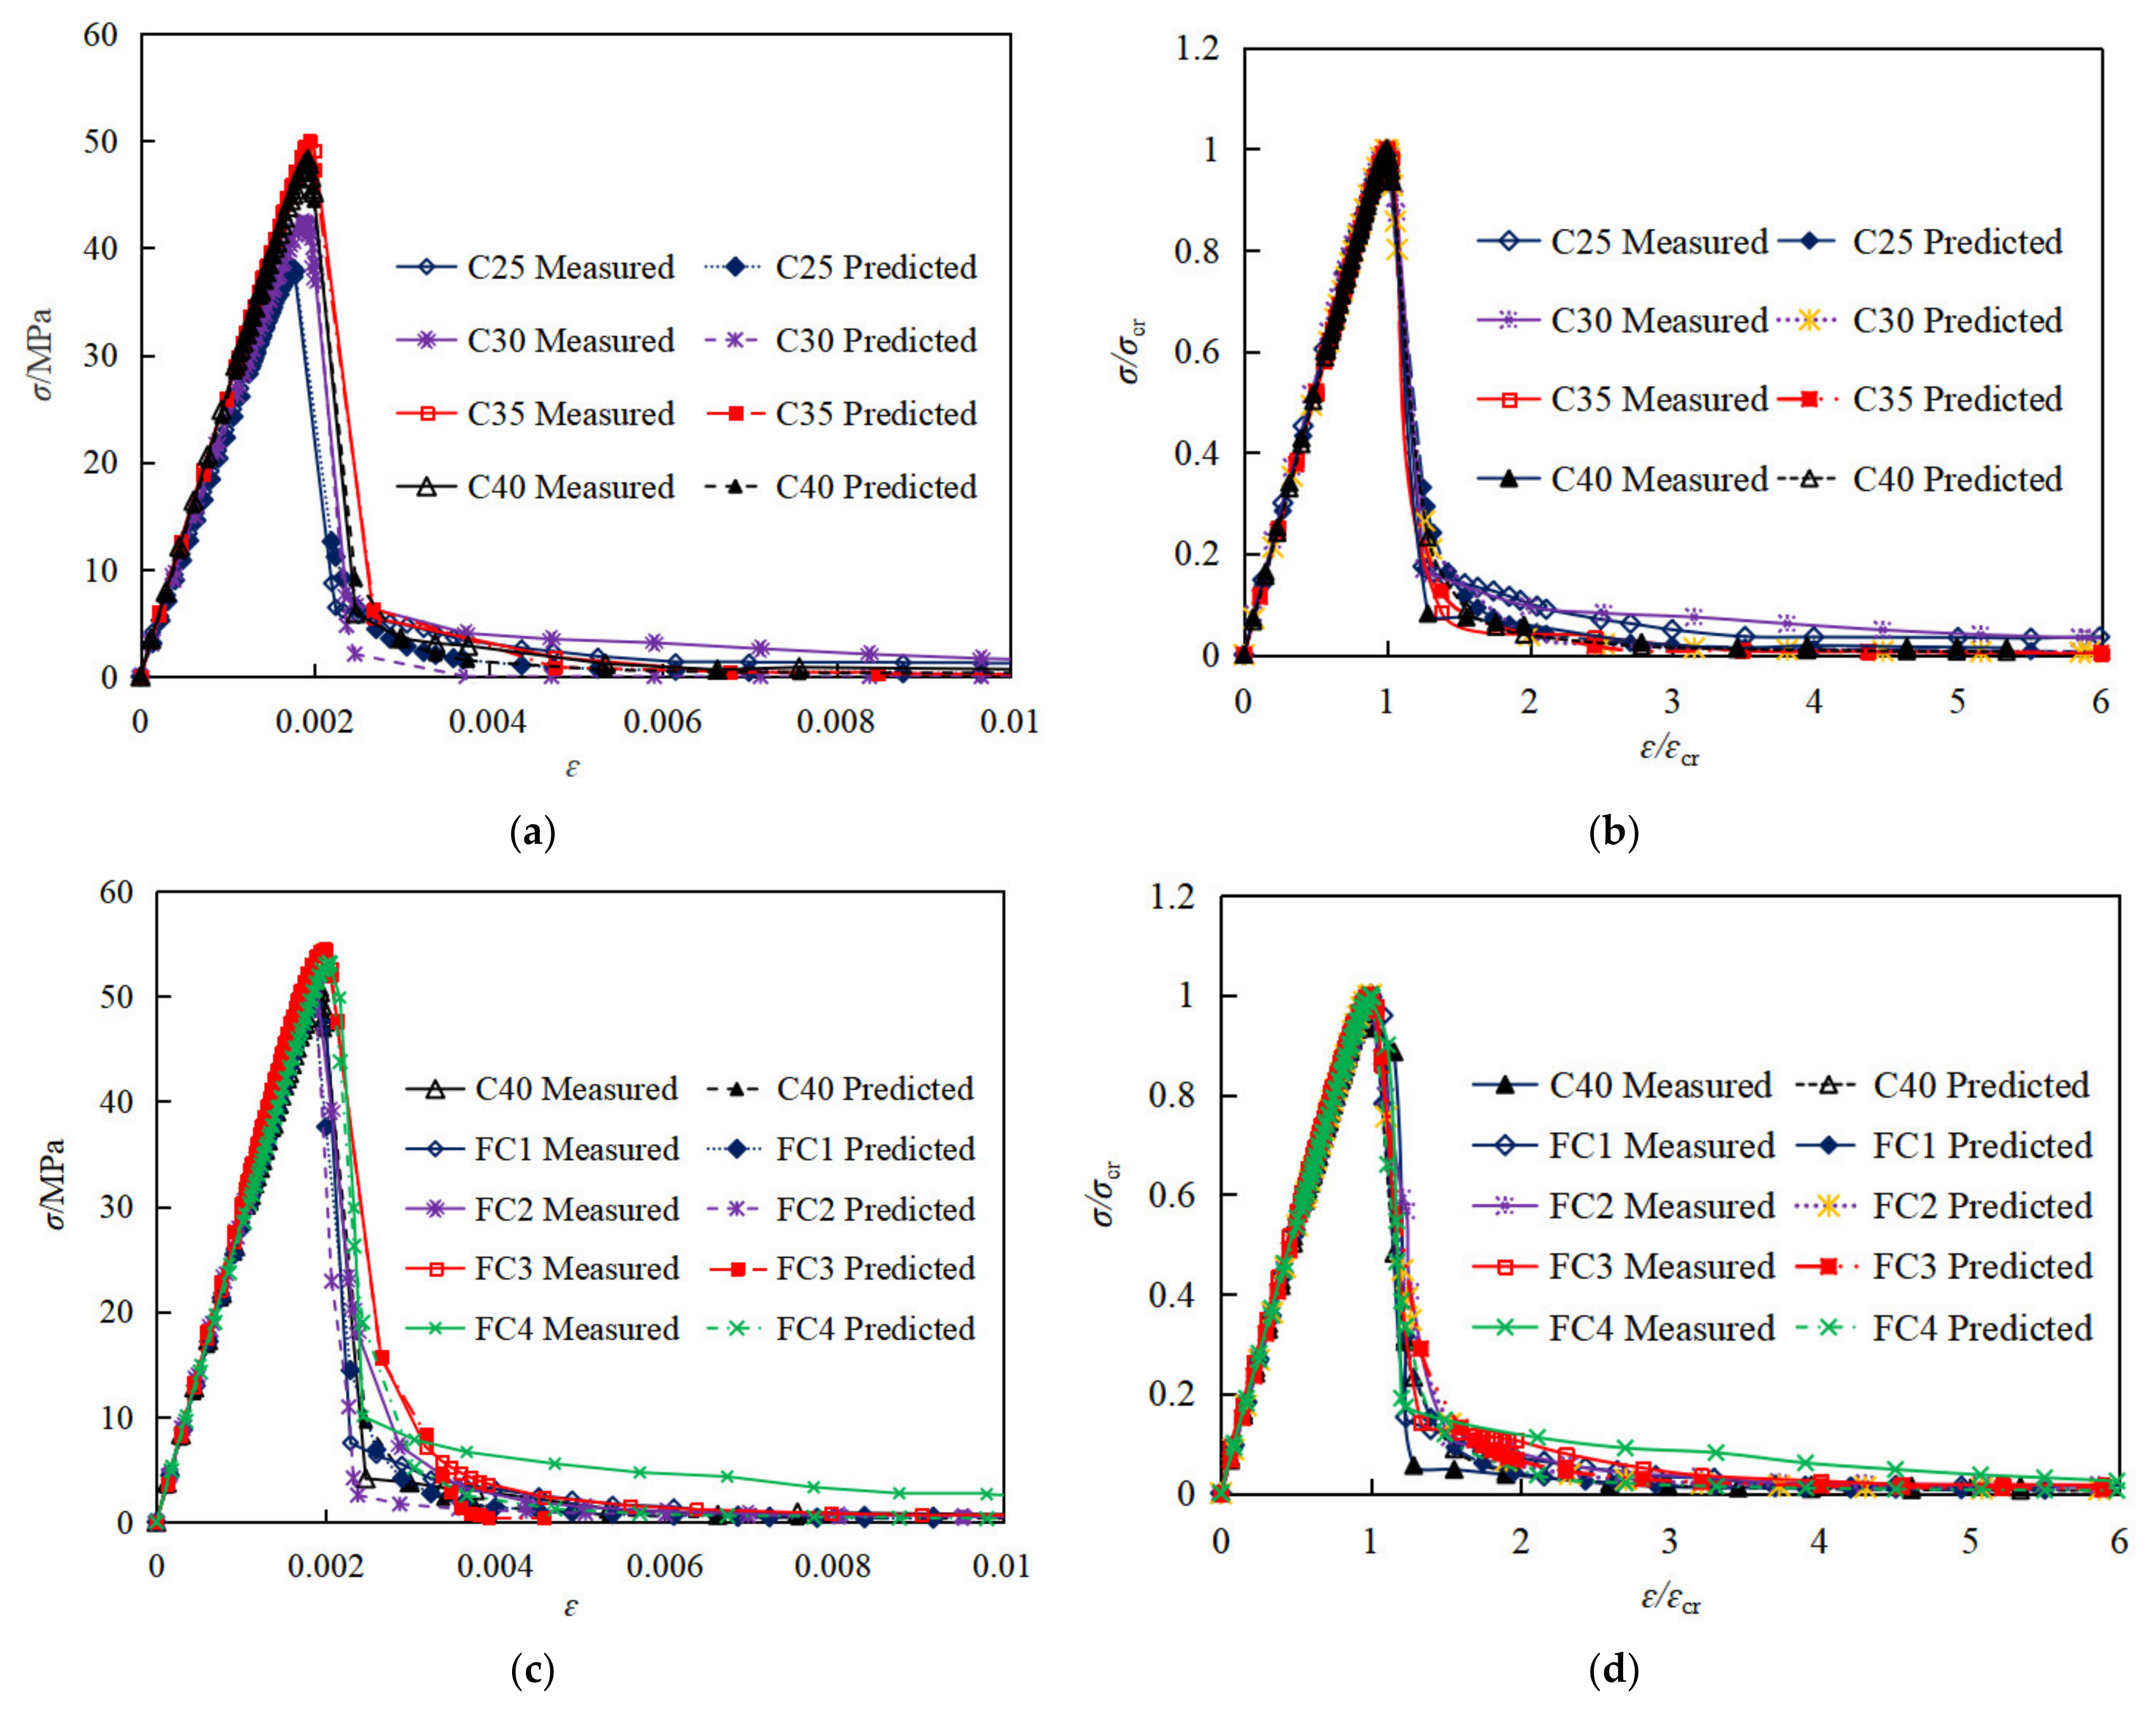
3.2.4. Determination of Parameters and Model Validation

As important parameters of concrete, elastic modulus and peak strain are both critical parameters to reflect uniaxial compression behavior. Several studies have identified that there are many factors affecting the elastic modulus and peak strain of concrete, such as concrete strength and aggregate type [44,48].
As shown in Table 8 and discussed in Section 3.1.2 of this paper, the fiber has rarely influence on the elastic modulus of concrete. As shown in Figure 8a, the elastic modulus and the peak strain of coral concrete increases with an increase of concrete strength. Previous research has reported that the type of aggregate will also affect the elastic modulus of concrete, which is reflected by concrete density wc [44]. Thus, based on the test data of plain and fiber-reinforced coral concrete from this research and previous literatures, the prediction approach of coral concrete elastic modulus Ec can be established with the prism compression strength fc and concrete density wc by regression analysis with 78 specimen test data, as shown in Equation (13). The validation of the prediction approach for elastic modulus is shown in Figure 13, with the determination coefficient R2 = 0.799. As shown in Figure 8a,c, the peak strain of coral concrete increases to some extent with increasing prism compression strength, and also increases obviously with increasing PVA fiber content. By regression analysis with 42 specimen test data, the prediction approach of peak strain for coral concrete can be established with the prism compression strength fc, elastic modulus Ec and fiber content mf. The validation of the prediction approach for peak strain is shown in Figure 14, with the determination coefficient R2 = 0.661. Among the experimental specimens, fc representing the prism compression strength varies from 25 MPa to 75 MPa, wc representing the concrete density varies from 1900 kg/m3 to 2300 kg/m3, and mf representing the fiber content varies from 1 kg/m3 to 6.2 kg/m3.
E c = 8220 ( f c ) 1 / 3 ( w c / 2300 ) 0 . 862       ( R 2 = 0 . 799 )
ε c r = 0 . 00108 exp ( 319 f c / E c ) ( 0 . 0025 m f 2     0 . 0082 m f + 1 )       ( R 2 = 0 . 661 )
As discussed above, Equations (11) and (12) are used to describe the uniaxial compression stress–strain behavior of plain and PVA fiber-reinforced coral concrete. Herein, the critical undetermined parameters a and b in Equations (11) and (12) needs to be determined for plain and PVA fiber reinforced coral concrete.
As can be seen from Figure 15, the smaller the value of parameter a, the plumper the curve, and the lower the strain growth rate of concrete in the loading process, then the more energy it would absorb. Similarly, the smaller the value of parameter b, the plumper the curve, the lower the slope of the curve in the unloading process, the slower the failure process, and the more energy released, which means the ductility of the coral concrete will be better. According to Figure 8 and Figure 15, it can be concluded that a and b should decrease with increasing coral concrete strength and increase with increasing fiber content.
As shown in Figure 16, the test data of the specimens of coral concrete are collected and calculated to obtain the relationship between model parameters a or b and the toughness index of coral concrete. The results show that with the decrease of parameter a or b, the toughness parameters A1 or A2 tends to increase, simultaneously, A2 or “A1 + A2” is positively correlated with the toughness index δ, and negatively correlated with the brittleness index β, but the relationship between A1 and δ or β is not obvious. That is to say, with smaller parameters a and b, the corresponding A1 and A2 will become larger, and “A1 + A2” will also become larger, resulting in a larger toughness index δ and lower brittleness index β, indicating better deformation performance of the coral concrete. This is consistent with the conclusion of Figure 15. The results above from Figure 15 and Figure 16 show that the model parameters are related to the shape of the stress–strain curve.
Based on the analysis of the calculated results of the proposed model and the experimental data, the parameters a and b are both related to the fiber content and the compressive strength of coral concrete. In addition, the parameter a influencing the curve shape of the ascending stage may be also related to the elastic modulus Ec and peak strain εcr of coral concrete because they also influenced the curve shape, the toughness index δ and the brittleness index β. Therefore, the critical undetermined parameters a and b in Equations (11) and (12) are fitted by regression analysis of the experimental results, with consideration of potential influencing parameters including concrete strength fc, PVA fiber content mf, elastic modulus Ec and peak strain εcr. The stress–strain expression calculated by the proposed model for all the specimen groups tested in this work and the determination approach for critical parameter a and b are shown in Table 10. In addition, the predicted stress–strain curves for experimental specimens using Equations (11) and (12) and the proposed the determination approach for critical parameter a and b in Table 10 is shown in Figure 17.
As shown in Table 10 and Figure 17, the coefficients of determination ( R 2 ) of both the ascending and descending stages are greater than 0.95, and the predicted results of the proposed model are in good agreement with the experimental results. Thus, it can be concluded that the proposed model and the suggested determination approach of parameter a and b are capable of accurately describing the constitutive relationship of plain and PVA fiber-reinforced coral concrete.
In addition, the best PVA fiber content for coral concrete with different compressive strength is also analyzed using Equations (11) and (12) and the suggested determination approach of parameter a and b in Table 10, as shown in Figure 18. With an increase of the concrete strength, the parameters a and b increase correspondingly, meaning that the brittleness index β increases and the toughness index δ decreases. As is known from experimental results, with increasing concrete strength, the elastic modulus and the brittleness of concrete also increases, evidencing that the prediction approach gives good consideration of the influence of concrete strength. In addition, with the increase of PVA fiber content, the parameter a and b decrease firstly when V f does not exceed 4 kg/m3, and then increase after mf exceeds 4 kg/m3. As presented above, the smaller parameter a and b, the better toughness and smaller brittleness of coral concrete. That is to say, the best content of PVA fiber may be about 4 kg/m3, which coincides with the experimental results. This phenomenon could be attributed to the bridging effect of PVA fiber, which effectively prevents the expansion of transverse cracks and consumes energy when fracture. However, when the fiber content is too large, it would cause fiber winding and clusters, forming weak areas in the coral concrete, resulting in the reduction of fiber toughening effect. As shown in Figure 18, with an increase of concrete strength, the best content of PVA fiber increases slightly around 4 kg/m3. Therefore, the best content of PVA fiber can be suggested as 4 kg/m3 regardless of concrete strength.

4. Conclusions

  • According to a certain proportion of silica fume, slag, P.O. 42.5 cement, coral coarse and fine aggregate, artificial sea water, etc., coral aggregate–seawater concrete with the compressive strength of 30 to 50 MPa and good performance can be prepared.
  • With an increase of PVA fiber content, the slump and dispersion of coral concrete decreases significantly. In order to ensure the working performance of coral concrete, it is suggested that the PVA fiber content of coral concrete should not exceed 5 kg/m3 in marine environment construction, and not exceed 2 kg/m3 if using pumping construction.
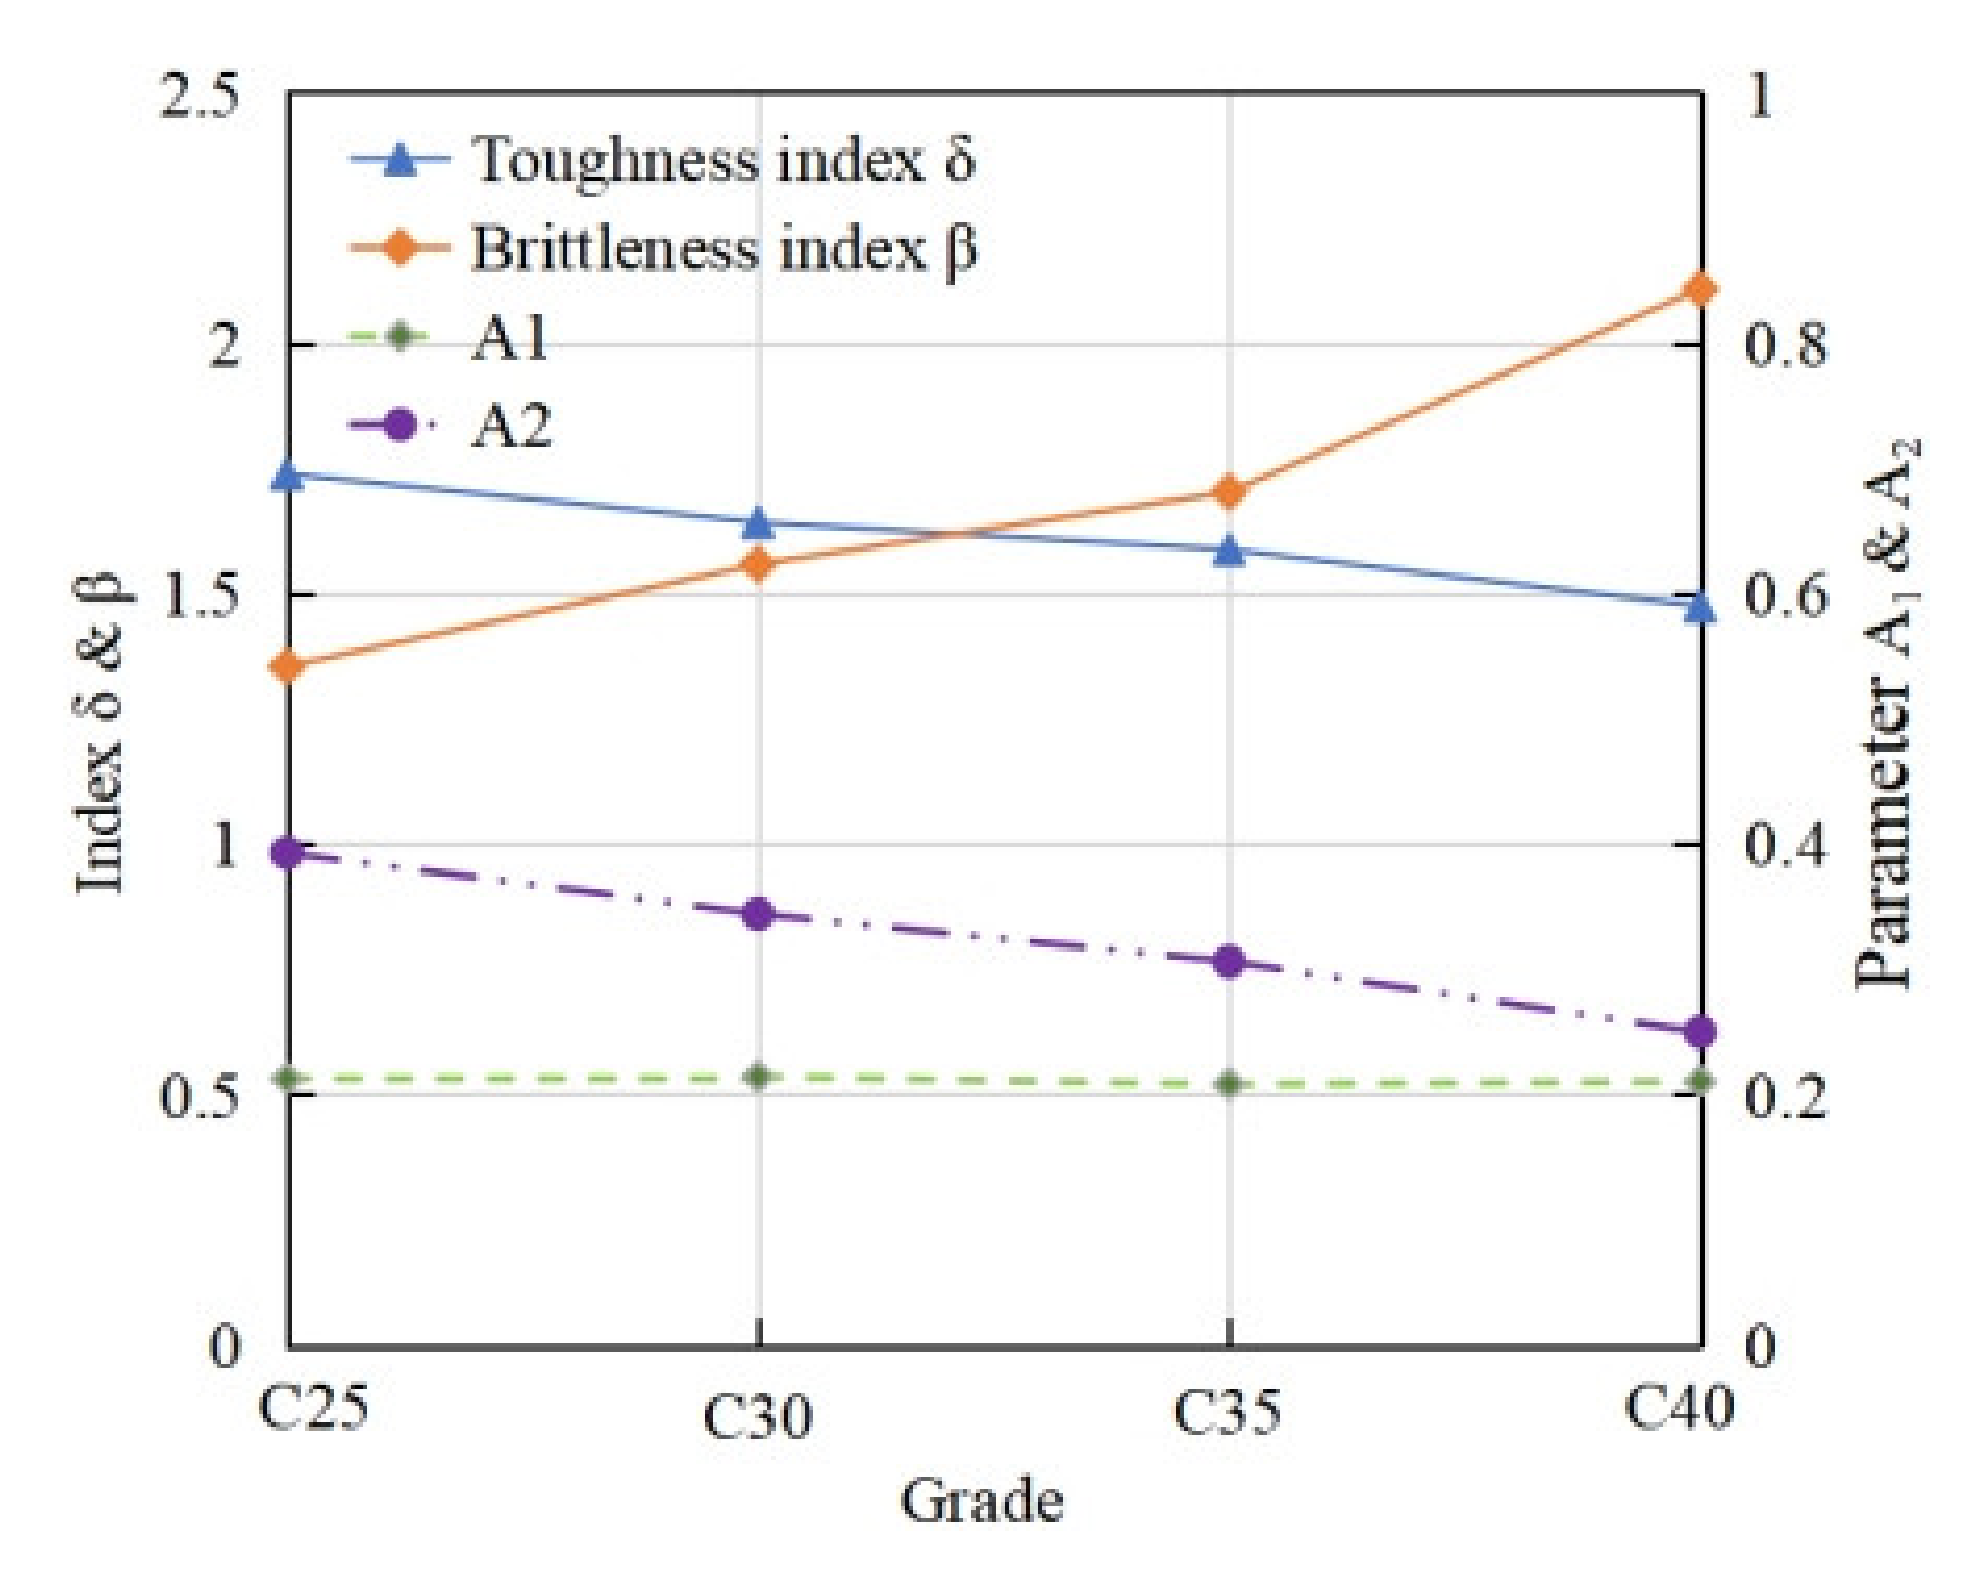
  • With increasing strength of coral concrete, the elastic modulus, Poisson’s ratio and peak strain increase, but the residual stress and the toughness decrease.
  • PVA fiber effectively improves the compression strength of coral concrete, as well as the ductility and mechanical properties after peak load. Compared with the reference coral concrete, the maximum growth rate of cubic compressive strength fcu is up to 9.9%. The optimal amount of PVA fibers to optimize mechanical properties of coral concrete is about 2–3 kg/m3.
  • PVA fiber has remarkable effect on improving the toughness of coral concrete. When the fiber content ranges from 0.8 to 6.5 kg/m3, the toughness index δ of coral concrete increases by 2.9% to 10.1%, and the brittleness index β decreases by 15.3–28.8%.
  • The constitutive relationship of plain and PVA fiber-reinforced coral concrete can be described by the recommended piecewise function model and the proposed approach to determining critical parameter a and b. In addition, through analysis of the model, the optimal PVA fiber content of coral concrete may be 4 kg/m3.
  • To meet the requirements of structure design and environmental benefits, it plays a very important guiding role in the engineering application of coral concrete to optimize the mix ratio design and improve the corrosion resistance, high temperature resistance and drying shrinkage resistance of coral concrete structure. However, more validation experiments are needed though.

Author Contributions

Conceptualization, Methodology, Investigation, Formal analysis, Writing—original draft preparation, Writing—review and editing, L.R.; Conceptualization, Formal analysis, Validation, L.W.; Resources, Methodology, Y.Z. All authors have read and agreed to the published version of the manuscript.

Funding

This research was funded by the National Natural Science Foundation of China (51890903), Henan Province Young Backbone Teacher Training Plan of China (2019GZGG075), the National Key Research Program of China (2017YFC0703403), Collaborative Innovation Center for New Energy-Saving Building Materials of Kaifeng University, Solid waste recycling and harmless Engineering Technology Research Center of Kaifeng.

Data Availability Statement

All data reported in this paper is contained within the manuscript.

Acknowledgments

The authors would like to thank the National Natural Science Foundation of China (51890903), the Henan Province Young Backbone Teacher Training Plan of China (2019GZGG075), the National Key Research Program of China (2017YFC0703403), Collaborative Innovation Center for New Energy-Saving Building Materials of Kaifeng University, Solid waste recycling and harmless Engineering Technology Research Center of Kaifeng.

Conflicts of Interest

The authors declare no conflict of interest.

References

  1. Dempsey, G. Coral and salt water as concrete materials. J. Am. Concr. Inst. 1951, 48, 157–166. [Google Scholar]
  2. Narver, D.L. Good concrete made with coral and water. Civ. Eng. 1964, 24, 654–858. [Google Scholar]
  3. Ehlert, R. Coral concrete at bikini atoll. Concr. Int. 1991, 13, 19–24. [Google Scholar]
  4. Howdyshell, P.A. The Use of Coral as an Aggregate for Portland Cement Concrete Structures; Army Construction Engineering Research Laboratory: Champaign, IL, USA, 1974. [Google Scholar]
  5. Yuan, Y.F. Mix Design and Property of Coral Aggregate Concrete. Master’s Thesis, Nanjing University of Aeronautics and Astronautics, Nanjing, China, 2015. (In Chinese). [Google Scholar]
  6. Zhang, Z.H.; Sang, Z.Q.; Zhang, L.Y.; Ma, Z.X.; Zhang, Y. Experimental Research on Durability of Concrete Made by Seawater and Sea-Sand. Adv. Mater. Res. 2013, 641–642, 385–388. [Google Scholar] [CrossRef]
  7. Wang, Y.; Zhang, S.; Niu, D.; Su, L.; Luo, D. Effects of silica fume and blast furnace slag on the mechanical properties and chloride ion distribution of coral aggregate concrete. Constr. Build. Mater. 2019, 214, 648–658. [Google Scholar] [CrossRef]
  8. Sun, Z.X. Engineering properties of coral sand in Nansha Islands. Trop. Ocean 2000, 19, 1–8. (In Chinese). [Google Scholar]
  9. Liu, J.; Ou, Z.; Peng, W.; Guo, T.; Deng, W.; Chen, Y. Literature Review of Coral Concrete. Arab. J. Sci. Eng. 2018, 43, 1529–1541. [Google Scholar] [CrossRef]
  10. Cheng, S.; Shui, Z.H.; Sun, T.; Yu, R.; Zhang, G. Durability and microstructure of coral sand concrete incorporating supplementary cementitious materials. Constr. Build. Mater. 2018, 171, 44–53. [Google Scholar] [CrossRef]
  11. Bentz, D. Influence of internal curing using lightweight aggregates on interfacial transition zone percolation and chloride ingress in mortars. Cem. Concr. Compos. 2009, 31, 285–289. [Google Scholar] [CrossRef]
  12. De Domenico, D.; Faleschini, F.; Pellegrino, C.; Ricciardia, G. Structural behavior of RC beams containing EAF slag as recycled aggregate: Numerical versus experimental results. Constr. Build. Mater. 2018, 171, 321–337. [Google Scholar] [CrossRef]
  13. Le, H.B.; Bui, Q.B. Recycled aggregate concretes–a state-of-the-art from the microstructure to the structural performance. Constr. Build. Mater. 2020, 257, 119522. [Google Scholar] [CrossRef]
  14. Mukhopadhyay, S.; Khatana, S. A review on the use of fibers in reinforced cementitious concrete. J. Ind. Text. 2015, 45, 239–264. [Google Scholar] [CrossRef]
  15. Pereira, E.B.; Fischer, G.; Barros, J.A. Effect of hybrid fiber reinforcement on the cracking process in fiber reinforced cementitious composites. Cem. Concr. Compos. 2012, 34, 1114–1123. [Google Scholar] [CrossRef]
  16. Nia, A.A.; Hedayatian, M.; Nili, M.; Afroughsabet, V. An experimental and numerical study on how steel and polypropylene fibers affect the impact resistance in fiber-reinforced concrete. Int. J. Impact Eng. 2012, 46, 62–73. [Google Scholar] [CrossRef]
  17. Yoo, D.-Y.; Banthia, N.; Yoon, Y.-S. Impact Resistance of Reinforced Ultra-High-Performance Concrete Beams with Different Steel Fibers. ACI Struct. J. 2017, 114, 113–124. [Google Scholar] [CrossRef]
  18. Wang, L.; Liu, C.P.; Xiong, J.Z. Study test on mechanical property of sisal fiber reinforced coral concrete. J. Henan Polytech. Univ. 2014, 33, 826–830. (In Chinese). [Google Scholar]
  19. Wang, L.; Deng, X.L.; Wang, G.X. Experimental research on the mechanical properties of carbon fiber coral concrete. Concrete 2014, 8, 88–91. (In Chinese). [Google Scholar]
  20. Wang, L.; Yi, J.; Deng, X.L.; Li, J.Y. Study on mechanical property and damage morphology analysis of coral aggregate concrete with fiber. J. Henan Polytech. Univ. 2016, 35, 713–718. (In Chinese). [Google Scholar]
  21. Wang, J.; Dai, Q.; Si, R.; Guo, S. Investigation of properties and performances of Polyvinyl Alcohol (PVA) fiber-reinforced rubber concrete. Constr. Build. Mater. 2018, 193, 631–642. [Google Scholar] [CrossRef]
  22. Arisoy, B.; Wu, H.-C. Material characteristics of high performance lightweight concrete reinforced with PVA. Constr. Build. Mater. 2008, 22, 635–645. [Google Scholar] [CrossRef]
  23. Passuello, A.; Moriconi, G.; Shah, S.P. Cracking behavior of concrete with shrinkage reducing admixtures and PVA fibers. Cem. Concr. Compos. 2009, 31, 699–704. [Google Scholar] [CrossRef]
  24. Noushini, A.; Samali, B.; Vessalas, K. Effect of polyvinyl alcohol (PVA) fiber on dynamic and material properties of fiber reinforced concrete. Constr. Build. Mater. 2013, 49, 374–383. [Google Scholar] [CrossRef]
  25. ASTM C33/C33M-18; Standard Specification for Concrete Aggregates. American Society for Testing and Materials: West Conshohocken, PA, USA, 2018.
  26. GB/T 17431.2-2010; Light Aggregates and Test Methods-Part 2: Light Aggregate Test Method. AQSIQ and SAC (General Administration of Quality Supervision, Inspection and Quarantine/Standardization Administration of the People’s Republic of China): Beijing, China, 2010. (In Chinese).
  27. Da, B.; Yu, H.; Ma, H.; Tan, Y.; Mi, R.; Dou, X. Experimental investigation of whole stress-strain curves of coral concrete. Constr. Build. Mater. 2016, 122, 81–89. [Google Scholar] [CrossRef]
  28. JGJ/T 12-2019; Technical Standard for Application of Lightweight Aggregate Concrete. China Architecture & Building Press: Beijing, China, 2002. (In Chinese).
  29. CECS13: 2009; Standard for Test Methods for Fiber Reinforced Concrete. China Planning Press: Beijing, China, 2009. (In Chinese).
  30. Wang, L.; Fan, L. Analysis of strength characteristics and failure modes of coral debris concrete. China Concr. Cem. Prod. 2015, 1, 1–4. (In Chinese). [Google Scholar]
  31. Liu, J.; Ou, Z.; Mo, J.; Chen, Y.; Guo, T.; Deng, W. Effectiveness of Saturated Coral Aggregate and Shrinkage Reducing Admixture on the Autogenous Shrinkage of Ultrahigh Performance Concrete. Adv. Mater. Sci. Eng. 2017, 2017, 1–11. [Google Scholar] [CrossRef] [Green Version]
  32. Li, L.; Zhao, Y.L.; Lu, H.B.; Han, C. Coral aggregate pre-wet on the mechanical properties of concrete. Concrete 2011, 1, 85–86. (In Chinese). [Google Scholar]
  33. GB/T 50081-2019; Standard for Method of Mechanical Properties on Ordinary Concrete. China Architecture and Building Press: Beijing, China, 2019. (In Chinese).
  34. GB/T 50080-2016; Standard for Test Method of Performance on Ordinary Fresh Concrete. China Architecture & Building Press: Beijing, China, 2017. (In Chinese).
  35. GB 50164-2011; Standard for Quality Control of Concrete. China Architecture & Building Press: Beijing, China, 2012. (In Chinese).
  36. GB50666-2011; Code for Construction of Concrete Structure. China Architecture & Building Press: Beijing, China, 2011. (In Chinese).
  37. ASTM C 469; Standard Test Method for Static Modulus of Elasticity and Poisson’s Ratio of Concrete. ASTM International: West Conshohocken, PA, USA, 2014.
  38. Wang, S.H. Research of Material Confect and Property of High Strength and High Content Hybrid Fiber Reinforced Concrete. Master’s Thesis, Tongji University, Shanghai, China, 2007. (In Chinese). [Google Scholar]
  39. Liu, H.W. Mechanics of Materials; Higher Education Press: Beijing, China, 1997. (In Chinese). [Google Scholar]
  40. Li, J.J.; Niu, J.G.; Liu, H.Z.; Zhu, C.; Zhang, Z. Comparative study of evaluation methods for toughness index in steel fiber reinforced lightweight aggregate concrete. Build. Struct. 2016, 46, 39–42. (In Chinese). [Google Scholar]
  41. ASTM-C 1018-97; Standard Test Method for Flexural Toughness and First-Crack Strength of Fiber Reinforced Concrete. ASTM International: West Conshohocken, PA, USA, 1997.
  42. Liu, X.; Wu, T.; Liu, Y. Stress-strain relationship for plain and fibre-reinforced lightweight aggregate concrete. Constr. Build. Mater. 2019, 225, 256–272. [Google Scholar] [CrossRef]
  43. Guo, Z.H.; Zhang, X.Q. Stress-strain full curves of concrete under cyclic loading. Ind. Constr. 1981, 11, 13–17. (In Chinese). [Google Scholar]
  44. Yang, K.-H.; Mun, J.-H.; Cho, M.-S.; Kang, T.H.-K. Stress-Strain Model for Various Unconfined Concretes in Compression. ACI Mater. J. 2014, 111, 819–826. [Google Scholar] [CrossRef]
  45. Zhang, Y. Research on Dynamic and Static Mechanical Properties of Coral Aggregate Concrete. Master’s Thesis, Nanjing University of Aeronautics and Astronautics, Nanjing, China, 2016. (In Chinese). [Google Scholar]
  46. Zhao, M.S. Stress-Strain Behaviors of Steel Fiber Reinforced Full-Lightweight Concrete under Compression. Master’s Thesis, North China University of Water Resources and Electric Power, Zhengzhou, China, 2016. (In Chinese). [Google Scholar]
  47. GB50010-2010; Code for Design of Concrete Structures. China Architecture & Building Press: Beijing, China, 2011. (In Chinese).
  48. Shannag, M. Characteristics of lightweight concrete containing mineral admixtures. Constr. Build. Mater. 2011, 25, 658–662. [Google Scholar] [CrossRef]
Figure 1. Coral aggregate from a South China Sea island. (a) Coarse aggregate, (b) Fine aggregate, (c) Size distribution of coral aggregate.
Materials 15 01762 g001
Figure 2. Test device and strain gauge arrangements. (a) Schematic diagram of test device, (b) Strain gauge diagram.
Materials 15 01762 g002
Figure 3. Slump and dispersion test method.
Materials 15 01762 g003
Figure 4. Effect of fiber content on concrete workability.
Materials 15 01762 g004
Figure 5. Typical failure modes of specimens in cube compression tests.
Materials 15 01762 g005
Figure 6. Failure modes of specimens in uniaxial compression stress–strain curve tests. (a) C25, mf = 0 kg·m−3; (b) C30, mf = 0 kg·m−3; (c) C35, mf = 0 kg·m−3; (d) C40, mf = 0 kg·m−3; (e) FC1, mf = 0. 8125 kg·m−3; (f) FC2, mf = 1.625 kg·m−3; (g) FC3, mf = 3.25 kg·m−3; (h) FC4, mf = 6.5 kg·m−3.
Materials 15 01762 g006
Figure 7. Standardization of stress–strain curve (CF4).
Materials 15 01762 g007
Figure 8. Comparative stress–strain relationship for coral concrete with different strengths and fiber content. (a) stress–strain relationship for coral concrete with different strengths, (b) normalized stress–strain relationship for coral concrete with different strengths (dimensionless), (c) stress–strain relationship for coral concrete with different fiber content, (d) normalized stress–strain relationship for coral concrete with different fiber content (dimensionless).
Materials 15 01762 g008
Figure 9. Feature points of toughness index.
Materials 15 01762 g009
Figure 10. Toughness of coral concrete with different strengths.
Materials 15 01762 g010
Figure 11. Toughness of coral concrete with different fiber contents.
Materials 15 01762 g011
Figure 12. The fitting effect of stress–strain curves using different models. (a) C25, (b) C30, (c) C35, (d) C40, (e) FC1, (f) FC2, (g) FC3, (h) FC4.
Materials 15 01762 g012aMaterials 15 01762 g012b
Figure 13. Comparison of test values and predicted values of elastic modulus.
Materials 15 01762 g013
Figure 14. Comparison of test values and predicted values of peak strain.
Materials 15 01762 g014
Figure 15. Effect of parameters “a” and “b” on σ/σcrε/εcr curve. (a) Ascending stage, (b) Descent stage.
Materials 15 01762 g015
Figure 16. The relationship between model parameters and the toughness index of coral concrete. (a) The relationship between a and A1 (or b and A2), (b) The relationship between δ, β and A1, A2,A1 + A2”.
Materials 15 01762 g016
Figure 17. Fitting effect of model prediction. (a) Different strengths, (b) Different strengths (dimensionless), (c) Different fiber content, (d) Different fiber content (dimensionless).
Materials 15 01762 g017
Figure 18. The relationship between model parameters and fiber content and concrete strength. (a) Parameter a , (b) Parameter b .
Materials 15 01762 g018
Table 1. Physical property of coral aggregate.
TypeBulk Density
(kg/m3)
Apparent Density
(kg/m3)
Water Absorption
(%)
Cylindrical Strength
(MPa)
Void Content (%)
Coarse aggregate8881870123.852.5
Fine aggregate1392238010-42.5
Table 2. Chemical composition of cementitious materials.
Test ProjectW%Specific Surface Area (m2·kg−1)Loss of IgnitionDensity
(kg/m3)
SiO2Al2O3Fe2O3CaOMgOSO3LOI
OPC22.474.832.9759.281.972.39--2.753100
SG33.6515.30.4635.4210.20.700.154240.712940
SF95.700.540.060.760.540.011.3218,4652.95330
Table 3. Physical properties of PVA fiber.
Length (mm)Diameter (μm)Density
(kg/m3)
Young Modulus
(Gpa)
Tensile Strength (Mpa)Elongation
(%)
11–1342–46129033.814306–11
Table 4. Chemical composition of artificial seawater (g/L).
NaClMgCl2·6H20Na2SO4CaCl2KClNaHCO3
22.211.33.861.080.750.21
Table 5. Coral concrete mix proportions.
GroupsMix Proportions (kg/m3)Total
w/b
OPCS95SF95Coarse AggregateCoral SandTotal WaterSPFiber
C2525582277297292462.900.68
C3028893317097092413.700.58
C35420135457007002357.200.39
C4048090306256252201000.37
FC14809030625625220100.81250.37
FC24809030625625220101.6250.37
FC34809030625625220103.250.37
FC44809030625625220106.50.37
Note: “w/b” is water-binder ratio, where, “w” denotes dosage of water in the mix, in kg/m3; b = mC + mSG + mSF, mC, mSG and mSF represent the dosage of OPC, SG, SF, respectively, in kg/m3.
Table 6. Classification of workability (mm).
Slump10–4050–90100–150160–210≥220---
GradesS1S2S3S4S5---
Dispersion≤340350–410420–480490–550560–620≥630
GradesF1F2F3F4F5F6
Note: Slump and dispersion are quantitative indexes to measure the workability of concrete, and the greater the slump and dispersion, the better the workability. From S1 to S5 or from F1 to F6, the workability of concrete is getting better.
Table 7. Workability of coral concrete.
GroupsC25C30C35C40FC1FC2FC3FC4
Slump Ti/mm19022025026025023016065
Dispersion Ki/mm430490610700690565300200
Slump gradeS4S5S5S5S5S5S4S2
Dispersion gradeF3F4F5F6F6F5F1F1
Note: using the test method in Figure 3, the slump value T i 300 mm and the dispersion value K i 200 mm .
Table 8. Measured mechanical properties of coral concrete.
Groups m f ( kg / m 3 ) f cu , 100 , 28 d ( MPa ) σ cr ( MPa ) ε c ( μ ε ) E c ( MPa ) μ σ r ( MPa ) w c ( kg / m 3 )
C25030.538.1175424,9600.2298.72040
C30035.542.4187426,1790.2247.62140
C35041.850.0194028,8860.2424.82110
C40045.948.3188928,5420.2423.92220
FC10.812548.146.8185628,0930.2377.52214
FC21.62551.249.8184129,4060.3027.12193
FC33.2554.951.8197728,4880.2866.82171
FC46.550.349.5204027,5480.2529.12150
Note: m f is fiber content; f cu , 100 , 28 d is the cube compressive strength of concrete at 28 days with the size of 100 mm × 100 mm × 100 mm; σ cr is the peak stress of concrete with the size of 100 mm × 100 mm × 300 mm; ε c is peak strain; E c is elastic modulus; μ is Poisson’s ratio; σ r is residual stress; w c is apparent density.
Table 9. Different models of stress–strain curve equation.
SectionNumbersMathematical ModelProposer/Literature
Ascending stagemodel 1 y = a x + ( 3 2 a ) x 2 + ( a 2 ) x 3 Guo [43]
model 2 y = ( a + 1 ) x ( a + x a + 1 ) Yang [44]
model 3 y = x e a ( 1 x ) Sahlin [45] modified
Declining stagemodel 1 y = x b ( x 1 ) c + x Zhao [46]
model 2 y = x b ( x 1 ) 2 + x GB50010-2010 [47]
model 3 y = x b ( x 1 ) + x Da [27]
Notes: x = εc/εcr, y = σc/σcr, σcr, εcr is the peak stress and peak strain; a, b and c are the undetermined parameters of the model.
Table 10. Determination of parameters a and b.
TypesModelParameterC25C30C35C40FC1FC2FC3FC4Key Parameter Value
Ascend stage y = ( a + 1 ) a + x a + 1 a21.8422.4830.6428.5321.6217.5214.3618.47 a = ( 0 . 1642 m f 2 1 . 213 m f + 3 . 2 ) ( 1 f c / ( E c ε cr ) ) R 2 = 0 . 9407
R20.9990.9990.9990.9990.9990.9990.9980.998
Decline stage y = x b ( x 1 ) 2 + x b39.6850.6765.8051.6448.7533.2929.5045.41 b = ( 0 . 0011 m f 2 0 . 0083 m f + 0 . 0256 ) f c 2 R 2 = 0 . 7676
R20.9900.9890.9850.9680.9690.9810.9870.959
Note: R2 refers to the fitting degree of regression line to corresponding data.
Publisher’s Note: MDPI stays neutral with regard to jurisdictional claims in published maps and institutional affiliations.

