Article

Effect of Electroless Cu Plating Ti3AlC2 Particles on Microstructure and Properties of Gd2O3/Cu Composites

State Key Laboratory of Metastable Materials Science & Technology, Yanshan University, Qinhuangdao 066004, China
*
Author to whom correspondence should be addressed.
Materials 2022, 15(5), 1846; https://doi.org/10.3390/ma15051846
Submission received: 24 January 2022 / Revised: 24 February 2022 / Accepted: 26 February 2022 / Published: 1 March 2022

Abstract

:
Ti3AlC2 presents a hexagonal layered crystal structure and bridges the gap between metallic and ceramic properties, and Gadolinia (Gd2O3) has excellent thermodynamic stability, which make them potentially attractive as dispersive phases for Cu matrix composites. In this paper, Cu@Ti3AlC2-Gd2O3/Cu composites, Ti3AlC2-Gd2O3/Cu composites, and Gd2O3/Cu composites were prepared by electroless Cu plating, internal oxidation, and vacuum hot press sintering. The microstructure and the effect of the Cu plating on the properties of the Cu@Ti3AlC2-Gd2O3/Cu composites were discussed. The results showed that a Cu plating with a thickness of about 0.67 μm was successfully plated onto the surface of Ti3AlC2 particles. The ex situ Ti3AlC2 particles were distributed at the Cu grain boundary, while the in situ Gd2O3 particles with a grain size of 20 nm were dispersed in the Cu grains. The electroless Cu plating onto the surface of the Ti3AlC2 particles effectively reduces their surfactivity and improves the surface contacting state between the Cu@Ti3AlC2 particles and the Cu matrix, and reduces electron scattering, so that the tensile strength reached 378.9 MPa, meanwhile, the electrical conductivity and elongation of the Cu matrix composites was maintained at 93.6 IACS% and 17.6%.

1. Introduction

Because of the ease of fabrication, high thermal and electrical conductivities, and excellent corrosion resistance, copper and its alloys are widely used in industrial machinery such as heat exchangers, the divertor components such as fusion reactors, electrical equipment (wiring and motors), and construction for plumbing [1,2,3,4,5]. Particle-reinforced Cu matrix composites strengthened by low-content reinforcement particles could have a high strength performance, but the scattering of electrons was inevitably increased due to the addition of heterogeneous particles in the Cu matrix, consequently reducing the electrical conductivity of the Cu matrix composites. Therefore, the preparation of a particle-reinforced Cu matrix composite with high tensile strength and high electrical conductivity is still a challenge at present.
The reinforced particles can be introduced by in situ synthesizing or ex situ addition into the Cu matrix composites [6,7,8,9,10]. The compressive strength of an in situ (1.0 wt%) Al2O3/Cu composite synthesized from powders obtained by electrical explosion of wire was increased nearly 1.6 times compared with pure copper, but its electrical conductivity decreased from 95%IACS to 72%IACS [6]. Another Cu matrix composite strengthened by 3.0 wt% ex situ Al2O3 particles was fabricated using the hot-pressing method [7], the hardness of the composite increased nearly 1.5 times compared with pure copper, but its electrical conductivity was down to 77%IACS. The average size of the in situ and ex situ Al2O3 particles was 30 nm and 65 μm, respectively. The composite strengthened by ex situ Al2O3 particles had a weak interface between the Al2O3 particle and the Cu matrix because of their large misfit in lattice parameters, CTE, and elastic modulus. Cr plating on the surface of the Al2O3 particles could improve surface contacting state between the reinforced particles and the Cu matrix [8], and the tensile strength of the Cr@Al2O3/Cu composites was improved comparing with the Al2O3/Cu composites. In summary, the advantages of the in situ synthesized method over the ex situ method included offering a smaller particle size with the improved surface contacting state between the reinforced phase and Cu matrix, so that a better reinforcement effect could be achieved.
Gadolinia (Gd2O3) and many other rare earth oxides are more attractive as dispersive phases than Al2O3 for Cu matrix composites due to their excellent thermodynamic stability [11,12,13,14]. Moreover, those rare earth elements show a low diffusivity and solubility in the metal matrix because of their larger atomic radii, consequently, could improve the microstructural stability of the metal matrix against coarsening [15,16,17,18]. The addition of in situ synthesized Y2O3 in Cu matrix led to the increase in ultimate tensile strength by nearly three times after cold rolling [11]. Therefore, the Cu matrix composites strengthened by in situ Gd2O3 nanoparticles were expected to have both high tensile strength and high electrical conductivity.
MAX phases present a hexagonal layered crystal structure and bridge the gap between metallic and ceramic properties [19,20,21,22,23]. Comparing with Al2O3, TiB2, and ZrB2, Ti3AlC2 presents high elastic moduli, high electrical conductivity, and low density relatively [24,25,26,27], which make Ti3AlC2 a potentially attractive dispersion phase for Cu matrix composites. For example, Cu composite with 60 vol% ex situ Ti3AlC2 particles prepared by ball milling for 10 h followed by hot press exhibited a superior ultimate compressive strength (1242 ± 24 MPa) and low electrical resistance (0.32 × 10⁻⁶ Ω·m) [19]. However, due to the limitation of in situ synthesized raw materials, reaction conditions, and reaction time, the content of in situ synthesized reinforcement phase is low, strengthening efficiency of the in situ reinforcement phase was limited, so the combination method of in situ synthesized and ex situ added reinforcement phase provides a way to prepare the particle-reinforced Cu matrix composites towards high tensile strength and high electrical conductivity, which was one innovation point of this paper.
The other innovation point of this paper was to prepare a Cu matrix composite with improved strength and stable electrical conductivity, the approach was to introduce in situ Gd2O3 (internal oxidation) and ex situ Ti3AlC2 (directly added) particles into a Cu matrix, and a layer of Cu was coated onto the surface of the Ti3AlC2 particles before adding them into the Cu matrix to reduce their surfactivity and improve the surface contacting state between the Cu@Ti3AlC2 particles and the Cu matrix. At the same time, the microstructure evolution and the effect of the Cu plating on the properties of the Cu@Ti3AlC2-Gd2O3/Cu composites were also discussed.

2. Materials and Methods

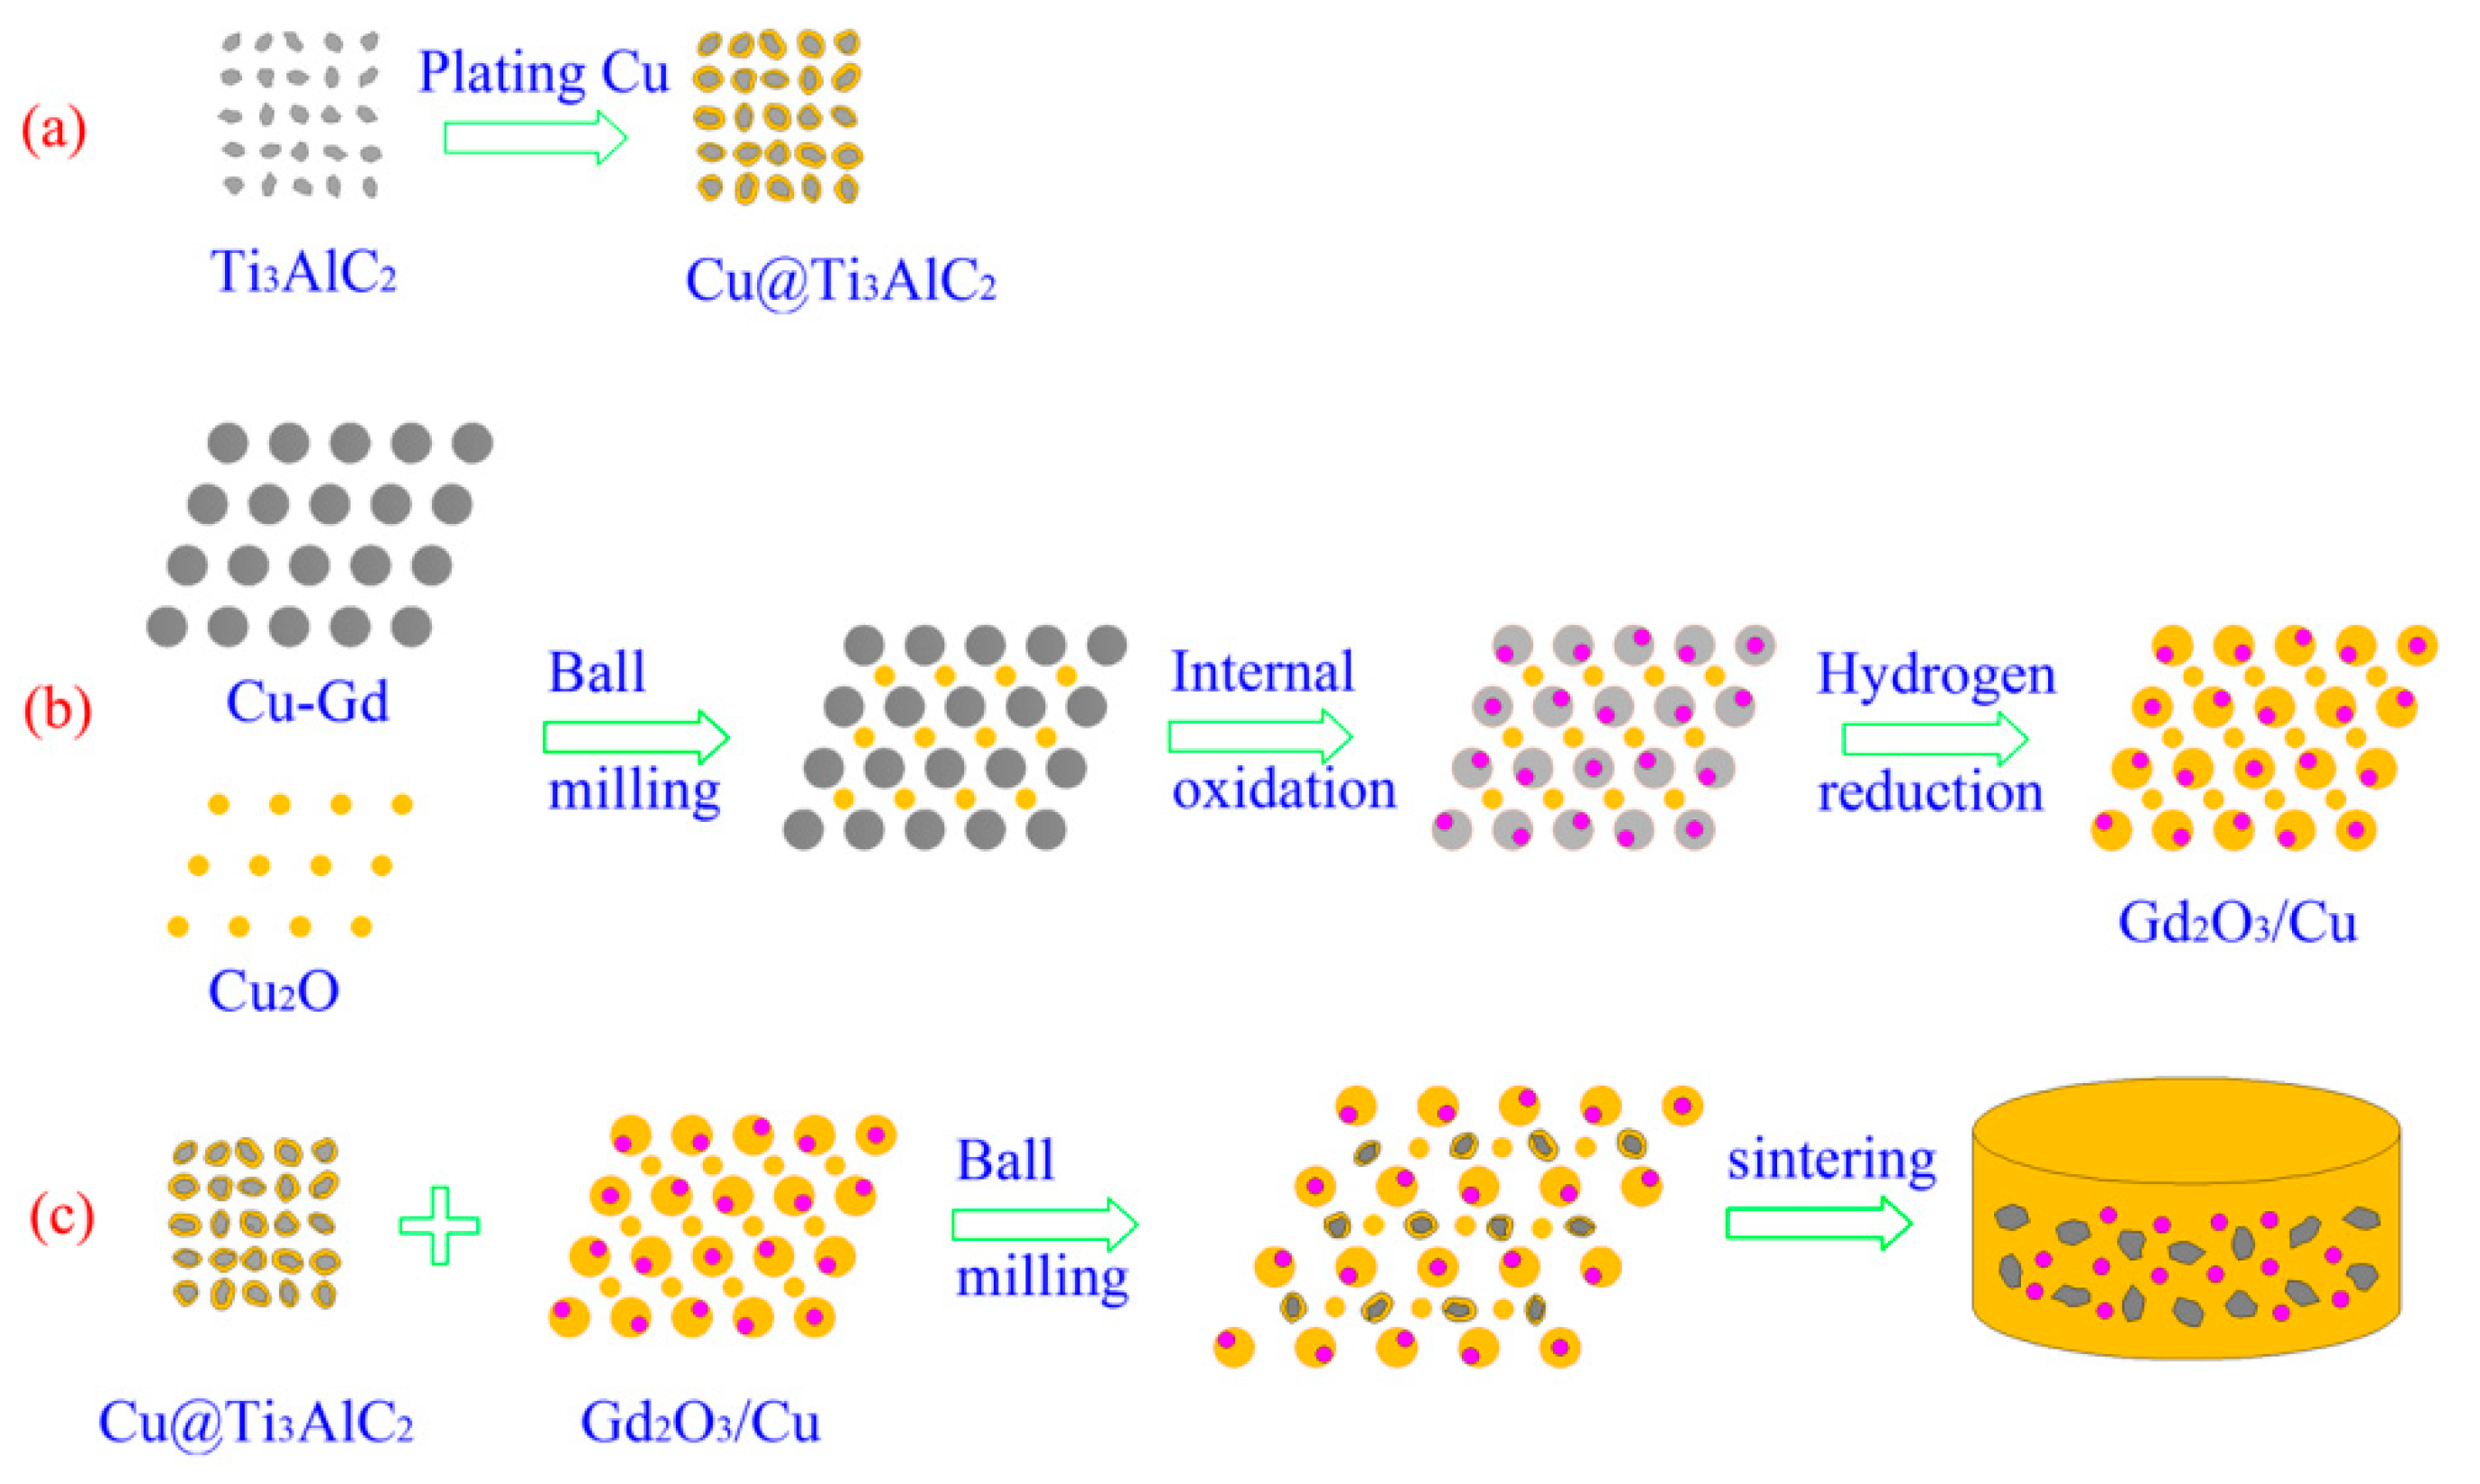
2.1. Raw Materials and Preparation Procedure

The raw materials for preparing Cu@Ti3AlC2-Gd2O3/Cu composites include Cu-Gd alloy powder (Central South University, Changsha, China), cuprous oxide (Cu2O) powder, and Ti3AlC2 powder (Beijing Forsman Technology Co., Ltd, Beijing, China), their purities are above 99.0%, and their sizes are about 10, 2, and 2 µm. The Cu-Gd alloy powder was atomized by high purity Ar gas from the inductive melting of Cu-Gd alloy ingots, which was made from Cu and Gd powders. The element content of Gd in Cu-Gd alloy powder is about 0.84 at% (2.04 wt%), which was analyzed using an X-ray fluorescence spectrometer (ARL, Switzerland).
Figure 1 presents the preparation process diagram of the Cu@Ti3AlC2-Gd2O3/Cu composite, which mainly included (a) electroless Cu plating on the surface of the Ti3AlC2 particles, (b) in situ synthesis of Gd2O3 reinforced phase, (c) the ball milling and sintering of the Cu@Ti3AlC2 and Gd2O3/Cu powders.

2.1.1. Electroless Cu Plating on the Surface of the Ti3AlC2 Particles

Formaldehyde (HCHO) (Shanghai Aladdin Biochemical Technology Co., Ltd., Shanghai, China) was used as the reductant to coat Cu plating on the surface of Ti3AlC2 particles in the bluestone solution (CuSO4), which could reduce the surfactivity of the Ti3AlC2 particles, to enhance the surface contacting state between the Ti3AlC2 particles and the Cu matrix. The reaction of electroless Cu plating on the surface of Ti3AlC2 particles was followed by the Equation (1):
Cu 2 + + 2 HCHO   + 4 OH Cu + 2 HCOO + H 2 + 2 H 2 O  
The electroless Cu plating process on the surface of Ti3AlC2 particles mainly included the following steps: (a) pretreatment before electroless Cu plating, (b) electroless Cu plating process, and (c) treatment after electroless Cu plating.
(a) Pretreatment before electroless Cu plating: firstly, the Ti3AlC2 particles were cleaned in acetone solution by ultrasonic bath for 10 min to remove the oil and other dirt attached on their surfaces. Then, the Ti3AlC2 particles were stirred in a solution with a NaOH concentration of 30% and temperature of 363 K for 20 min using a constant temperature electromagnetic stirrer. Finally, the Ti3AlC2 particles were cleaned with distilled water and dried in a vacuum oven.
(b) Electroless Cu plating process: the Cu electroless plating process was carried out in a constant temperature electromagnetic stirrer (INESA Scientific Instrument Co., Ltd., Shanghai, China) at a temperature of 333~338 K and a pH value of 12.0~12.5 with a stirring speed 60 r/min. Table 1 shows the composition and concentration of the bath solution used in electroless Cu plating on the surface of Ti3AlC2 powder particles.
The required concentration solution of CuSO4·5H2O (Shanghai Aladdin Biochemical Technology Co., Ltd., Shanghai, China), 2,2′-bipyridine (Shanghai Aladdin Biochemical Technology Co., Ltd., Shanghai, China), Na2EDTA (Shanghai Aladdin Biochemical Technology Co., Ltd., Shanghai, China), and NaOH (Shanghai Aladdin Biochemical Technology Co., Ltd., Shanghai, China) were prepared, respectively, before electroless Cu plating. Then, the prepared Na2EDTA solution, the NaOH solution, the 2,2′-bipyridine solution, and the Ti3AlC2 powder particles were successively and slowly added into the CuSO4 solution. During the whole electroless Cu plating process, the electromagnetic stirrer remained running to keep the mixed solution in a uniform condition. The HCHO solution was finally added into the mixture after the temperature reached to 333~338 K and the pH value between 12.0 and 12.5, then the Cu in the mixed solution began to deposit on Ti3AlC2 particles.
Due to the consumption of OH- ions and the generation of H2 during the plating process, the pH value of the mixed solution would decrease, the NaOH solution should be continuously added into the mixed solution to keep the PH value between 12.0 and 12.5. As the electroless plating process went on, the Cu2+ in the mixed solution was gradually reduced to Cu and deposited on the surface of Ti3AlC2 powder particles, the color of the mixed solution gradually became lighter and lighter, and finally colorless and transparent, indicating that almost all the Cu2+ in the mixed solution was consumed to Cu to deposit onto the surface of Ti3AlC2 particles, and the electroless Cu plating process was over.
(c) Treatment after electroless Cu plating: after the reaction, the beaker with the mixed solution was removed from the electromagnetic mixer agitator (INESA Scientific Instrument Co., Ltd., Shanghai, China) and left for stratifying. The size and density of the Ti3AlC2 particles were greatly increased as a layer of Cu grains was deposited onto the surface of Ti3AlC2 particles after electroless plating. Therefore, the electroless Cu plating Ti3AlC2 (Cu@Ti3AlC2) particles almost all sank at the bottom of the beaker after simple standing for a few minutes.
After pouring out the residual plating solution, distilled water and alcohol were repeatedly used to clean and wash the Cu@Ti3AlC2 particles alternately three times, and the Cu@Ti3AlC2 particles were then dried in a vacuum oven.

2.1.2. In Situ Synthesis of Gd2O3 Reinforced Phase

The Gd2O3 reinforced phase was in situ synthesized by internal oxidation method according to the following reaction Equation (2) [5]:
2 Gd + 3 Cu 2 O = Gd 2 O 3 + 6 Cu   Δ H 1198 0 = 1329 . 5 kJ   Δ G 1198 0 = 1252 . 8   kJ  
The Cu-Gd alloy powder and Cu2O powder were planetary ball milled for 4 h in an Ar atmosphere, the weight ratio of the ball-to-powder and milling speed were 4:1 and 180 rpm, respectively. Then, the mixed powders were oxidized in a vacuum furnace (0.3 Pa) at 1198 K for 1 h. Subsequently, the mixed powders were reduced by high purity hydrogen at 698 K for 2 h to remove excess oxygen, and finally the Gd2O3/Cu powder was obtained.

2.1.3. The Ball Milling and Sintering of the Cu@Ti3AlC2 and Gd2O3/Cu Powders
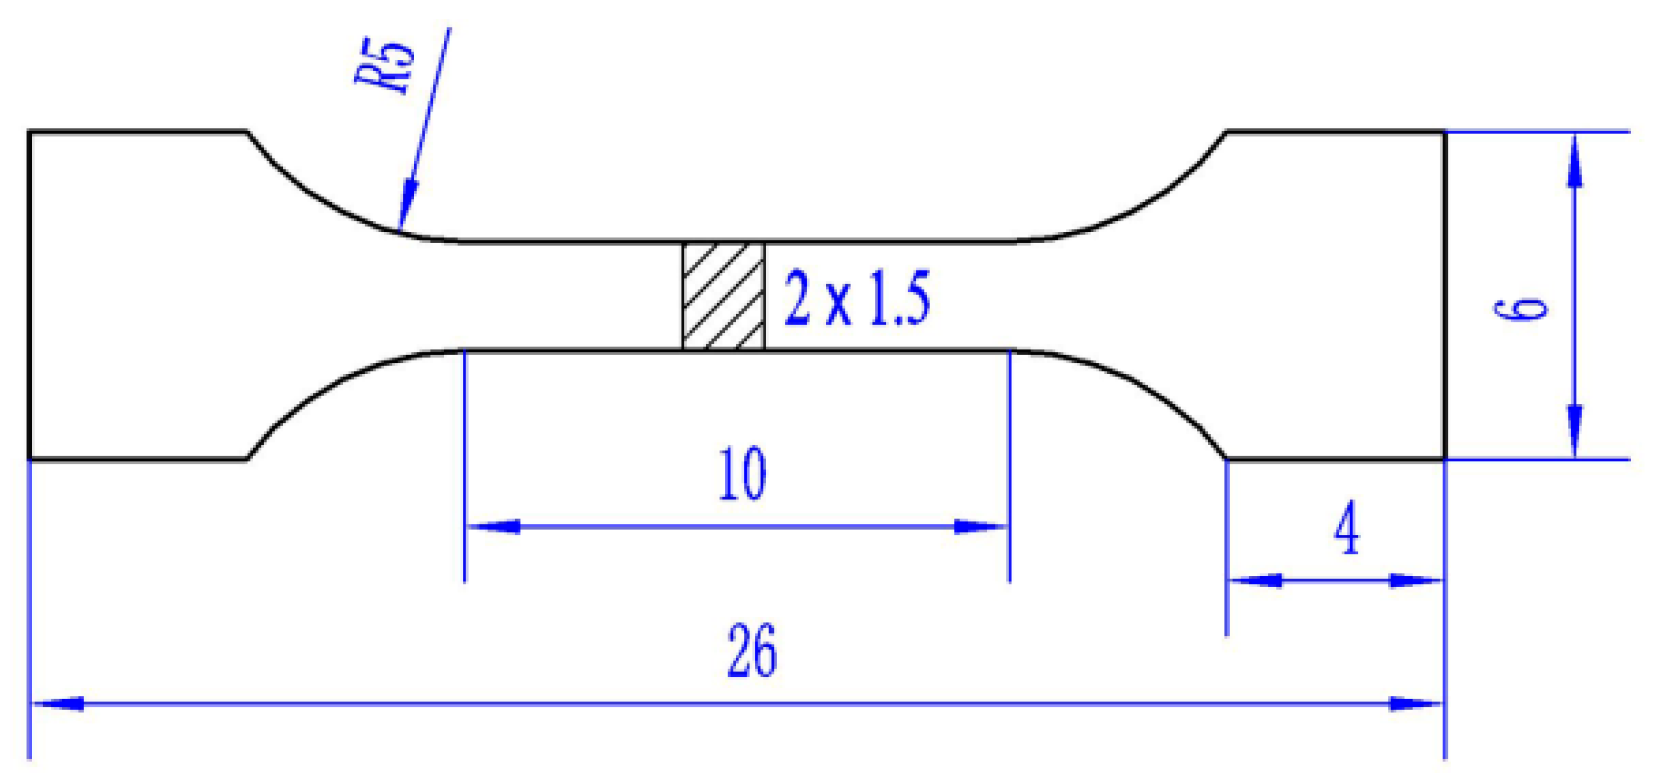
A certain amount of Cu@Ti3AlC2 powder and Gd2O3/Cu powder were planetary ball milled under the same milling condition in Section 2.1.2. Then, the mixed powders containing 1.5 wt% Ti3AlC2 and 2.0 wt% Gd2O3 were prepressed at 10 MPa, followed by sintering in a vacuum hot pressure sintering furnace (Shanghai Chenhua Science Technology Co., Ltd., Shanghai, China) (3.0 × 10⁻² Pa) at 1173 K for 30 min. The uniaxial pressure of 30 MPa and heating rate of 10 K/min were applied. Ti3AlC2-Gd2O3/Cu composites (1.5 wt% Ti3AlC2 without electroless Cu plating and 2.0 wt% in situ Gd2O3) and Gd2O3/Cu composites (2.0 wt% in situ Gd2O3) were also prepared under the same conditions for comparison, a certain amount of spherical pure Cu powder (99.9% purity, ∼10 µm in diameter) was added to maintain the same amount of reinforcement in the composites.

2.2. Test Methods

The morphologies and microstructures of the reinforced particles and the interfaces in the composites were conducted by scanning electron microscopy with an acceleration voltage of 25 kV (SEM, KYKY-EM3200, KYKY, Beijing, China) and transmission electron microscopy at 300 kV (TEM, Tecnai G2 F30, FEI, Hillsboro, OR, USA), which was equipped with an energy-dispersive X-ray spectrometric (EDS, Mahwah, NJ, USA) system. The ex situ Ti3AlC2 powder, ex situ Cu@Ti3AlC2 powder, the mixed powders of Cu-Gd alloy powder and Cu2O powder before internal oxidation and after H2 reduction were evaluated by X-ray diffraction (XRD, D/MAX-2500/PC, Tokyo, Japan) method, respectively. The electrical conductivity of the samples was tested with a four probes method at ambient temperature, the tip distance of the four probes is 1 mm, and the size of the electrical conductivity sample is φ 30 mm × 4.5 mm. Nine different areas in each sample were randomly selected for the electrical conductivity tests to minimize the error. A TH5000 universal testing machine (Jiangsu Tianhui Experimental Machinery Co., Ltd., Yangzhou, China) was used for tensile tests at ambient temperature according to GB/T 228.1-2010, the crosshead speed was 0.3 mm/min. The schematic diagram of the tensile specimens is shown in Figure 2, the gage length was 10 mm, and cross sections of 2 × 1.5 mm, respectively. Three specimens were tested from each sintered billet for tensile and electrical conductivity tests to minimize the error. The average tensile strengths and elongation of the samples were calculated from the recorded tensile stress–strain curves.

3. Results and Discussion

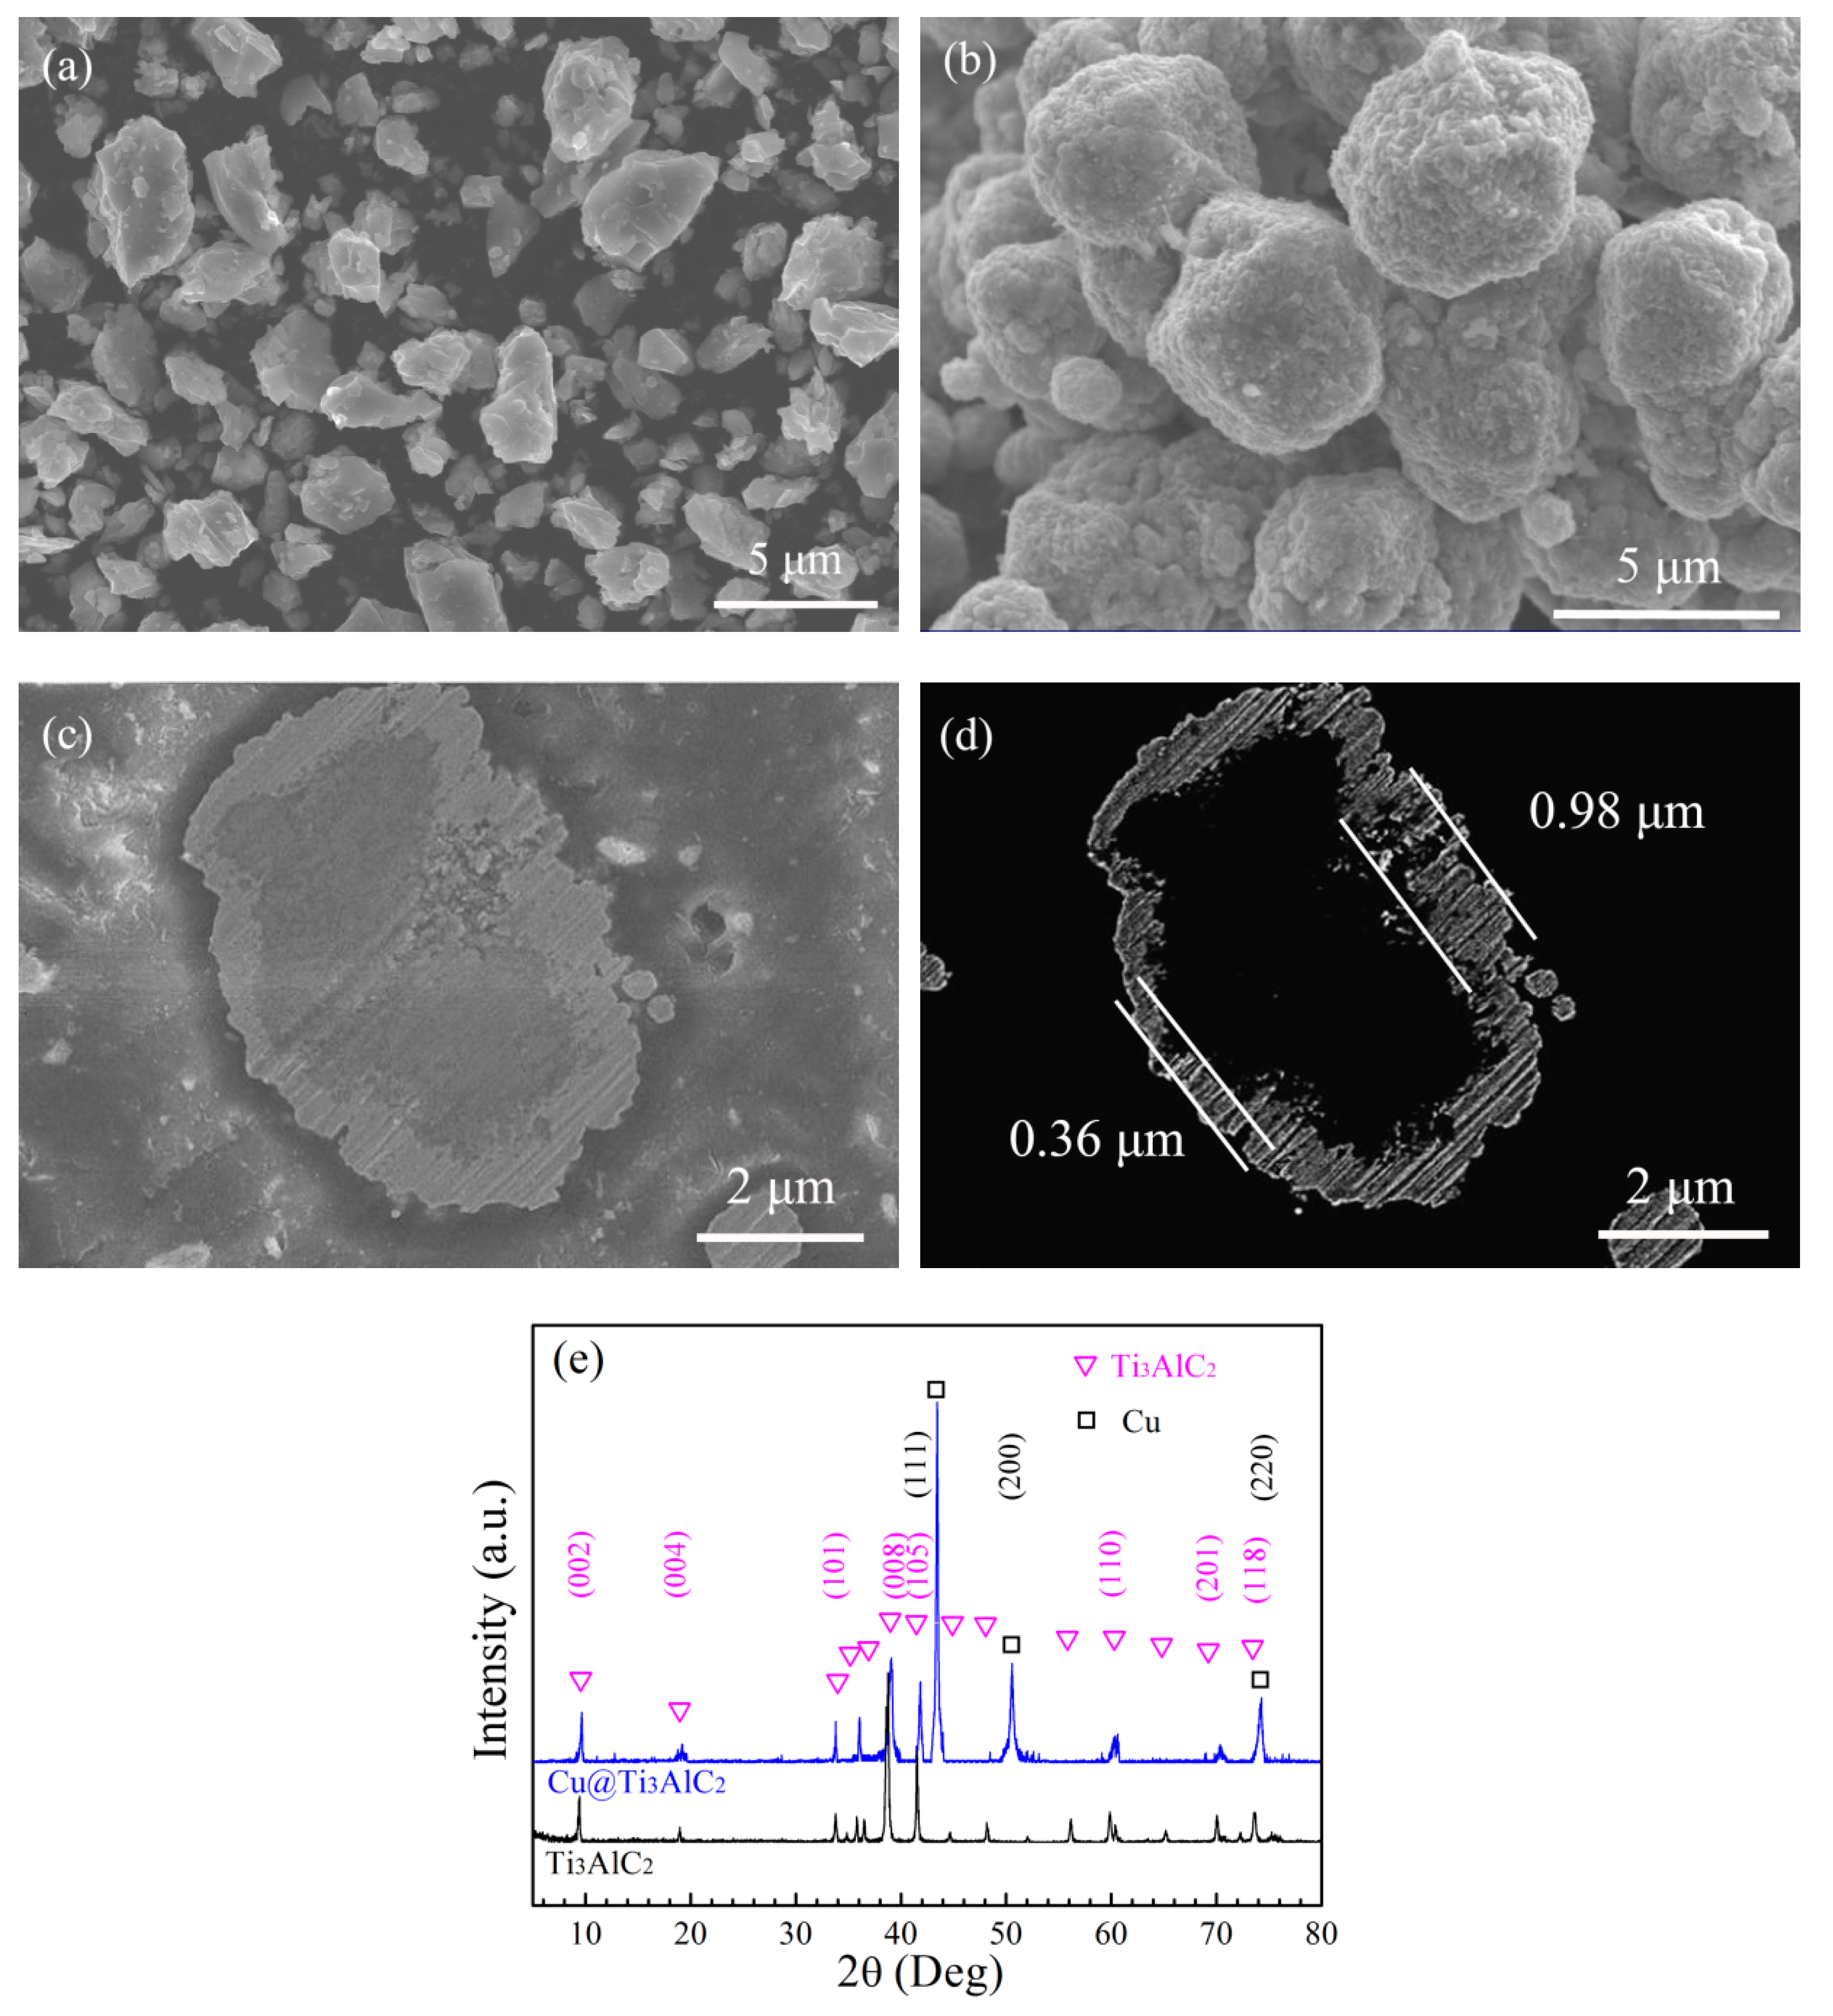
3.1. Electroless Cu Plating on the Surface of Ti3AlC2 Particles

The morphologies and XRD patterns of the Ti3AlC2 powder and Cu@Ti3AlC2 powder were conducted to analyze the quality of the Cu plating. Figure 3a shows the angular morphology of the Ti3AlC2 particles with a size of about 2 μm, the Ti3AlC2 particles became smooth and ellipsoidal after electroless Cu plating (Figure 3b), and fine size Cu particles were uniformly distributed onto the Ti3AlC2 particles’ surfaces without micropores. From Figure 3c,d, Ti3AlC2 particle was completely wrapped by the Cu plating without gaps or micropores, and the thickness of the Cu plating varied from 0.36 to 0.98 μm and averaged 0.67 μm. Figure 3e presents the XRD patterns of the Ti3AlC2 powder and Cu@Ti3AlC2 powder. Strong peaks of Ti3AlC2 were seen in Ti3AlC2 powder in Figure 3e; the characteristic peak of Cu was sharp and strong, while the characteristic peak of Ti3AlC2 was weak in Cu@Ti3AlC2 powder in Figure 3e (Ti3AlC2:PDF#52-0875, Cu: PDF#04-0836). The initial weight of Ti3AlC2 powder was 0.50 g, which increased to 4.11 g (Cu@Ti3AlC2) after electroless copper plating. The calculated average thickness of the Cu plating of 0.66 μm was obtained according to the theoretical density of Ti3AlC2 and pure Cu, the weight increment, and the size of Ti3AlC2; the value was close to the average value in Figure 3d.

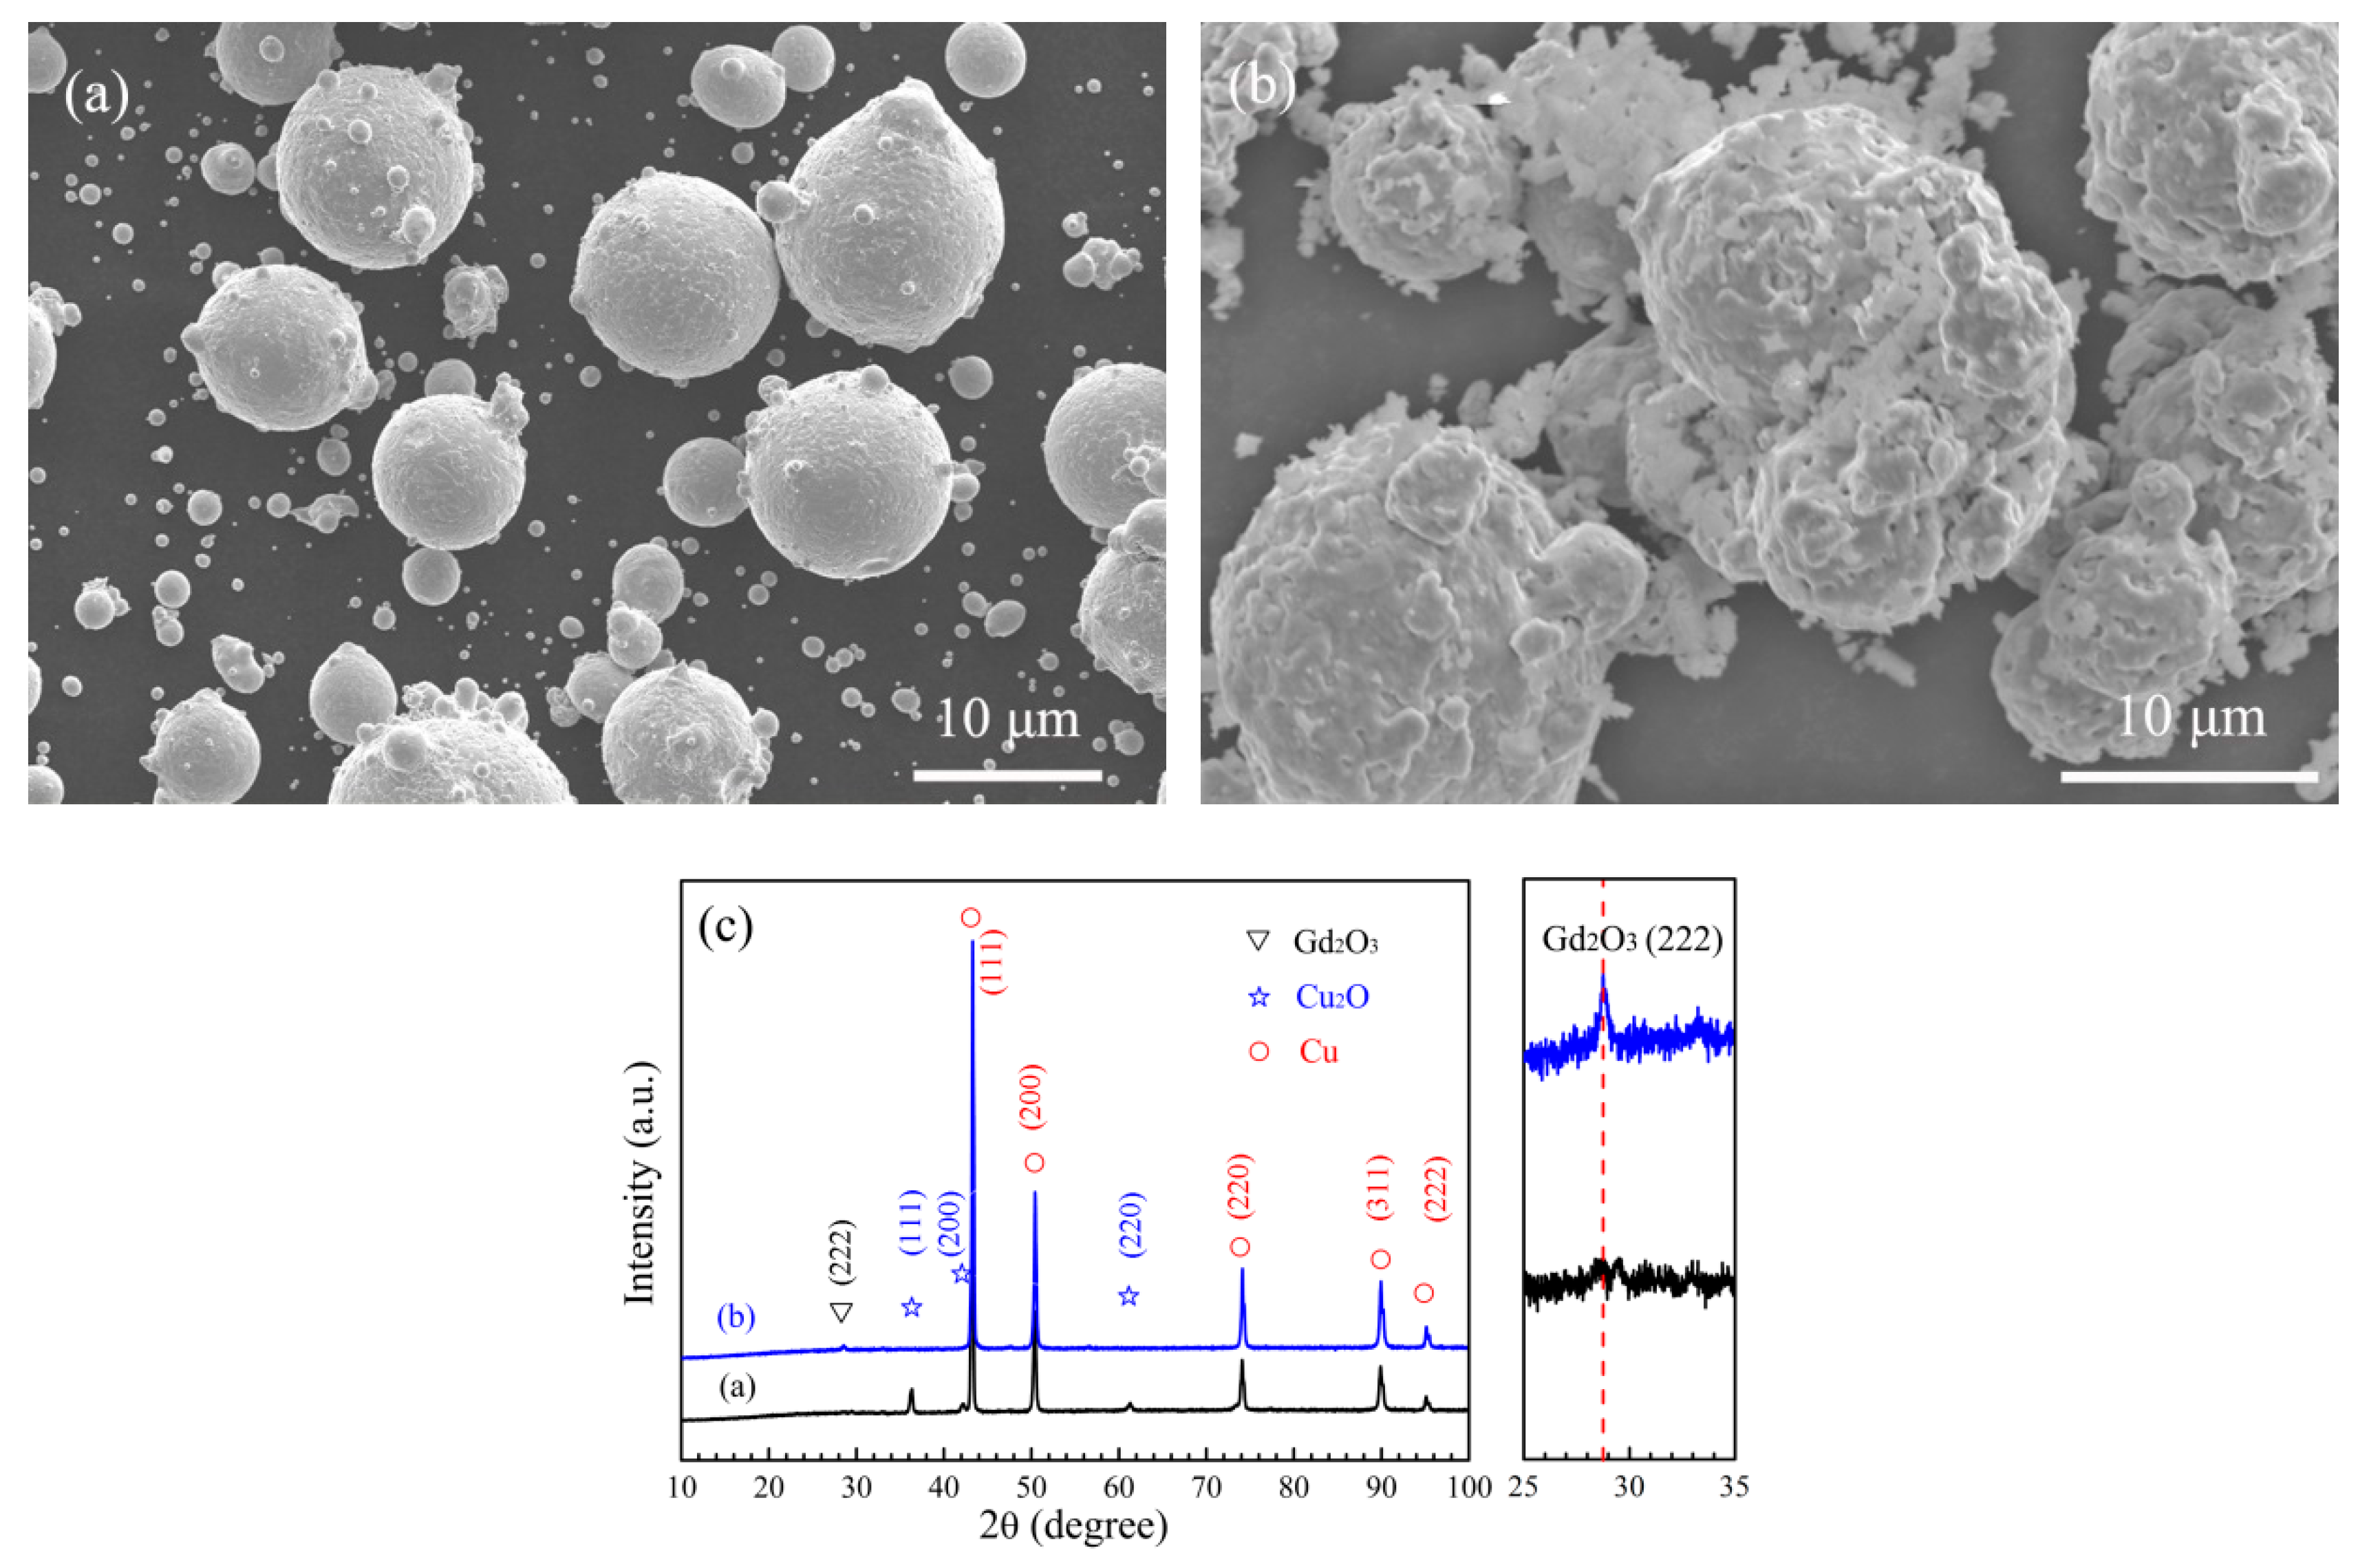
3.2. In Situ Synthesis of Gd2O3

Figure 4 shows the powder analysis of in situ synthesis of Gd2O3, and Figure 4a presents SEM images of Cu-Gd alloy powder mixed with Cu2O powder before internal oxidation. The diffusing distance of O in the Cu2O into the Cu-Gd alloy powder was reduced because the fine Cu2O powder adhered to the surface of the larger Cu-Gd alloy powder after ball milling, which was beneficial to the reaction between the Gd in Cu-Gd alloy powder and O in Cu2O powder during the internal oxidation process, and the synthesis of Gd2O3 would be easier and more efficient. Figure 4b shows the SEM images of Cu-Gd alloy powder mixed with Cu2O powder after H2 reduction, the Cu2O powder adhering to the surface of Cu-Gd alloy powder gradually integrated after the mixed powder was oxidized at 1198 K for 1h and reduced by H2 at 698K for 2 h, meanwhile, the surface of the mixed powders became rougher. Figure 4c presents the XRD patterns of the mixed powders in Figure 4a,b, a weak characteristic peak of Gd2O3 (222) could be seen in the XRD patterns of the mixed powders after internal oxidation and H2 reduction, indicating that Gd2O3 reinforced phase was in situ synthesized. At the same time, the characteristic peak of Cu2O disappeared, indicating that Cu2O was reacted to Cu during the H2 reduction.

3.3. Microstructure

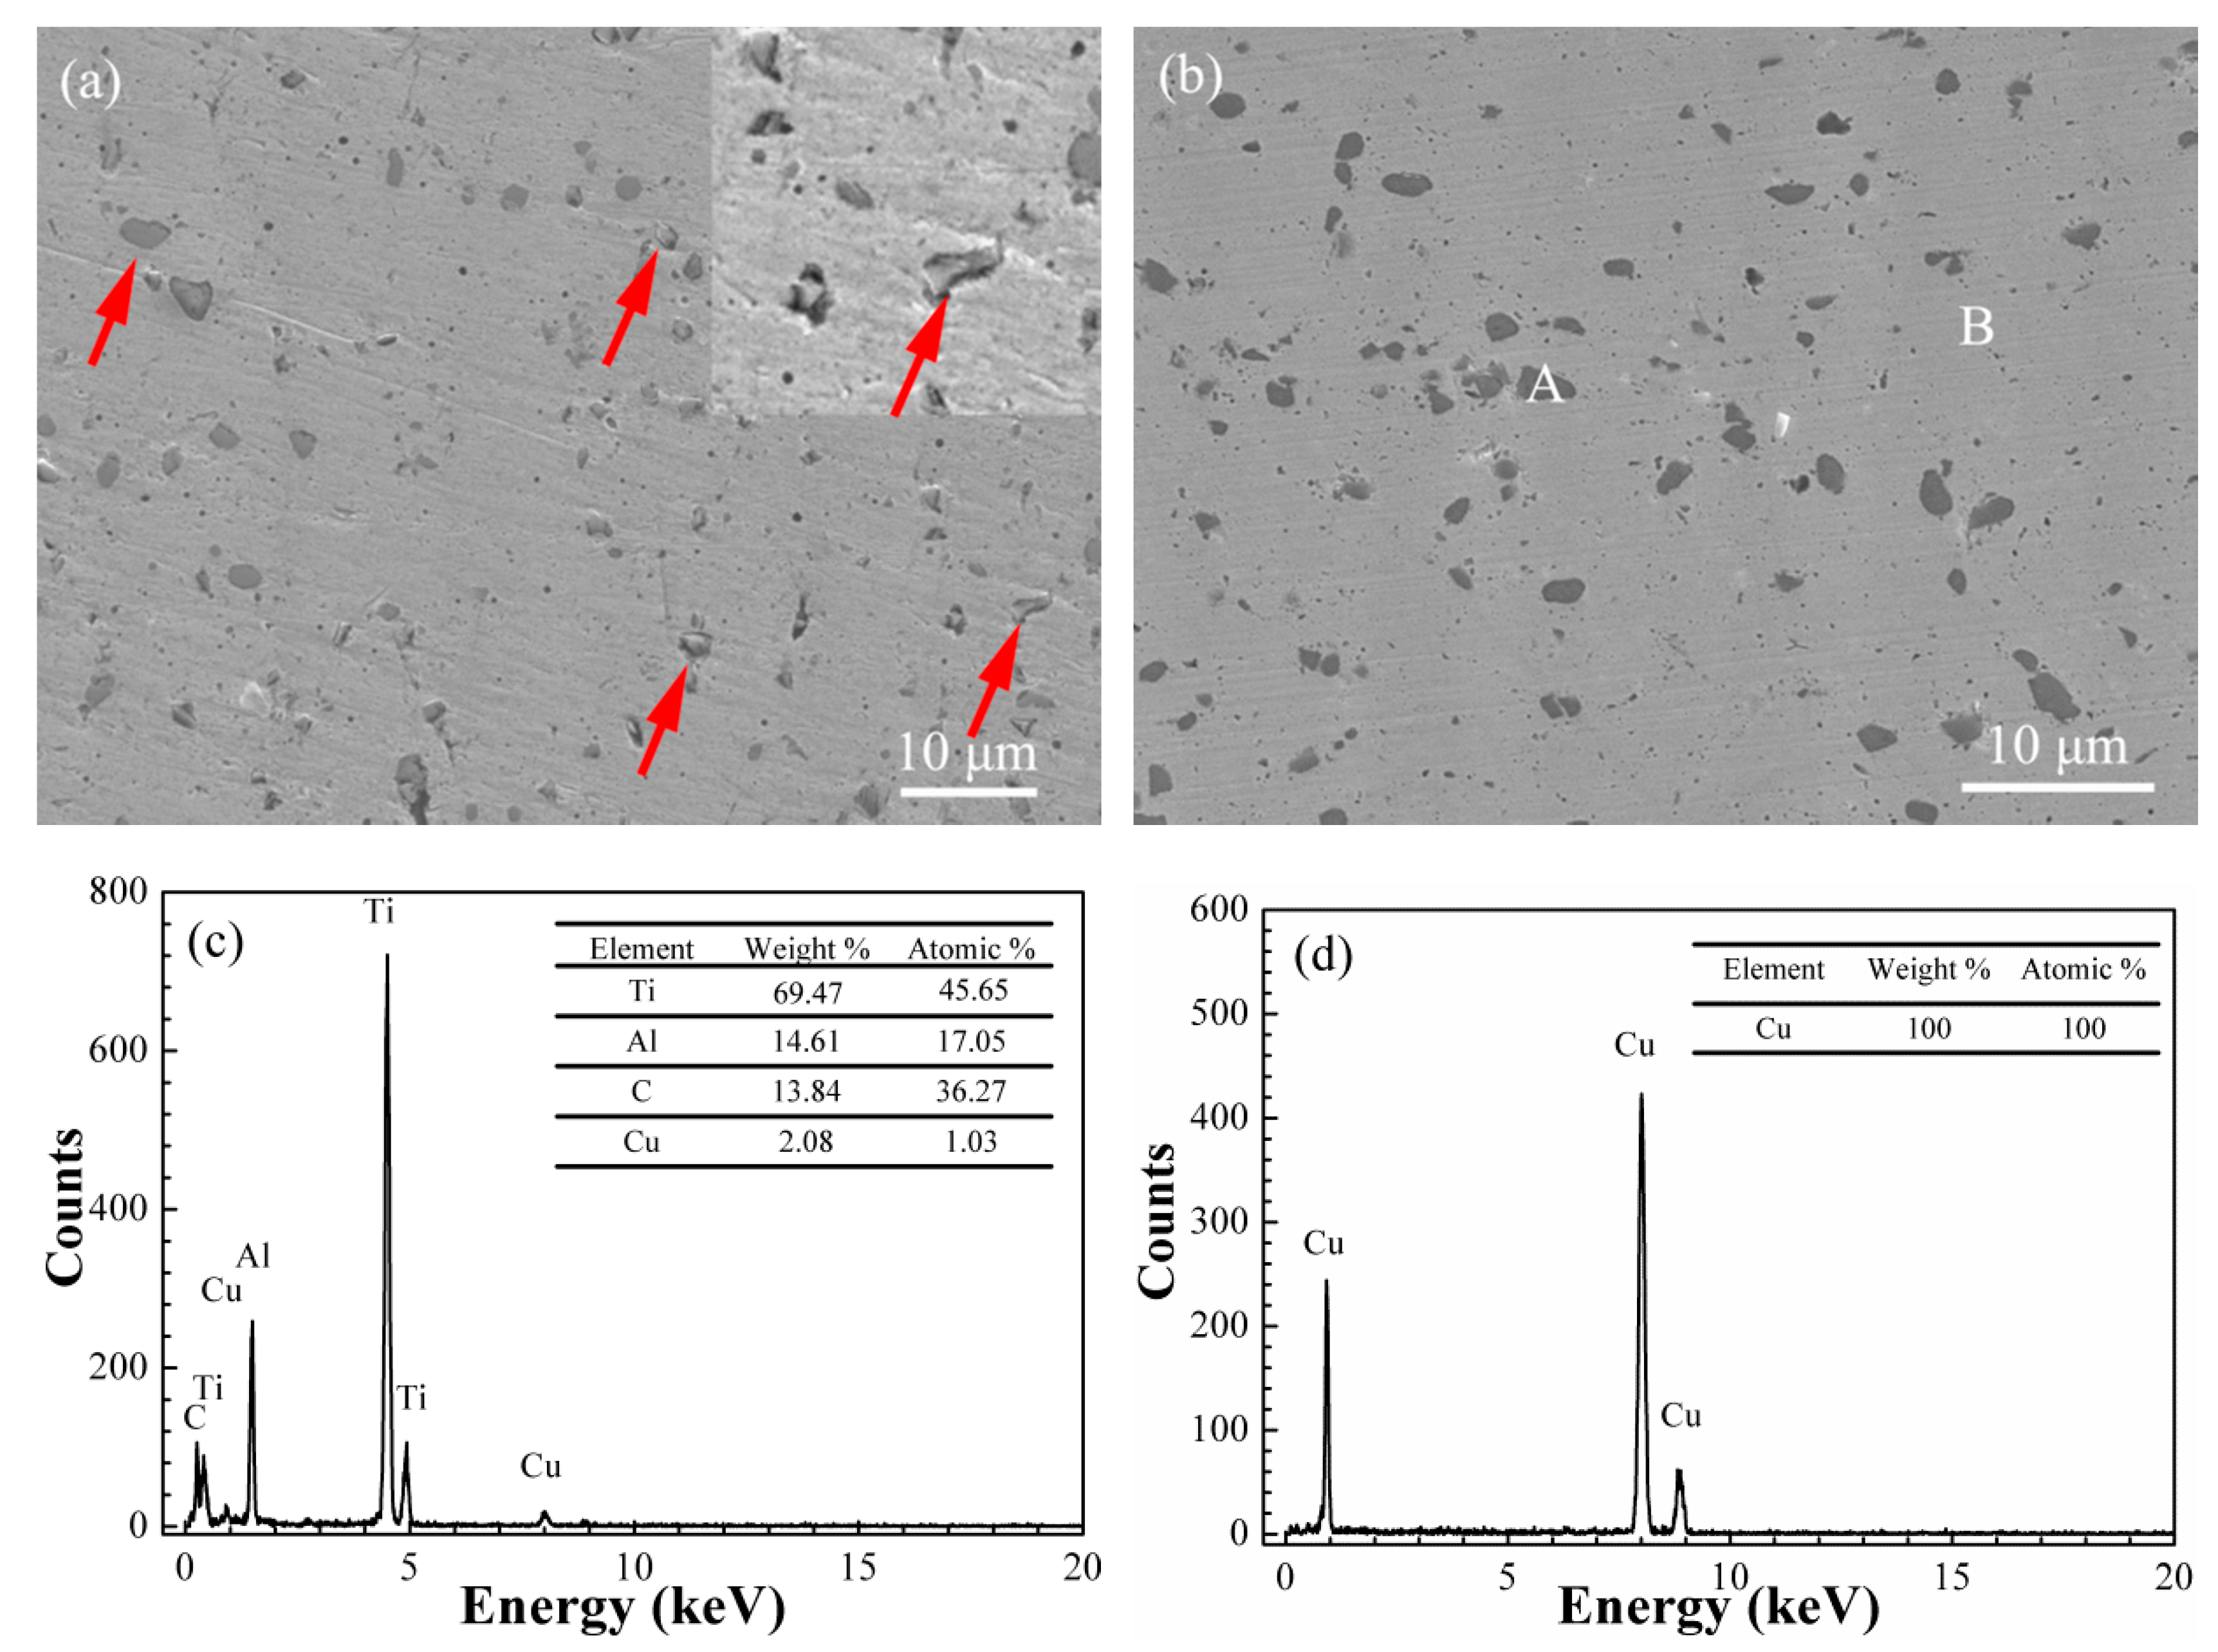
3.3.1. The Distribution of Ti3AlC2 in the Cu Matrix

In order to analyze the effect of electroless Cu plating on the Ti3AlC2 particles and the distribution of the Ti3AlC2 phase in the Cu matrix, the samples of the Ti3AlC2-Gd2O3/Cu composite and the Cu@Ti3AlC2-Gd2O3/Cu composite were inlaid in one billet for polishing. SEM and EDS images in both composites were collected and their results are shown in Figure 5.
The dark particles with a size of about 2μm were uniformly distributed in the light-colored area, as shown in Figure 5a,b. From Figure 5a, small cracks and micropores (indicated by red arrows) existed between the dark particles and the matrix in the Ti3AlC2-Gd2O3/Cu composite, while the dark particles were closely combined with the matrix without gaps and micropores in the Cu@Ti3AlC2-Gd2O3/Cu composite (Figure 5b). Figure 5c shows that the elements in area A in Figure 5b were Ti, Al, C, and Cu, and their atomic percentages were 45.65%, 17.05%, 36.27%, and 1.03%, respectively. The proportion of Cu element was very small, and the ratio of Ti, Al, and C elements was close to 3:1:2, so the dark particle at area A was Ti3AlC2. All elements in area B in Figure 5b were Cu, indicating that the light-colored area was the Cu matrix.
From Figure 5a, cracks in Ti3AlC2-Gd2O3/Cu composites were mainly seen in the interface between the Ti3AlC2 particles and the Cu matrix due to their large misfit in lattice parameters, CTE, and elastic modulus. By electroless plating Cu onto the surface of the Ti3AlC2 particles, the surface contacting state between the Ti3AlC2 particles and Cu matrix was improved and no cracks at the interface were observed in the Cu@Ti3AlC2-Gd2O3/Cu composites.

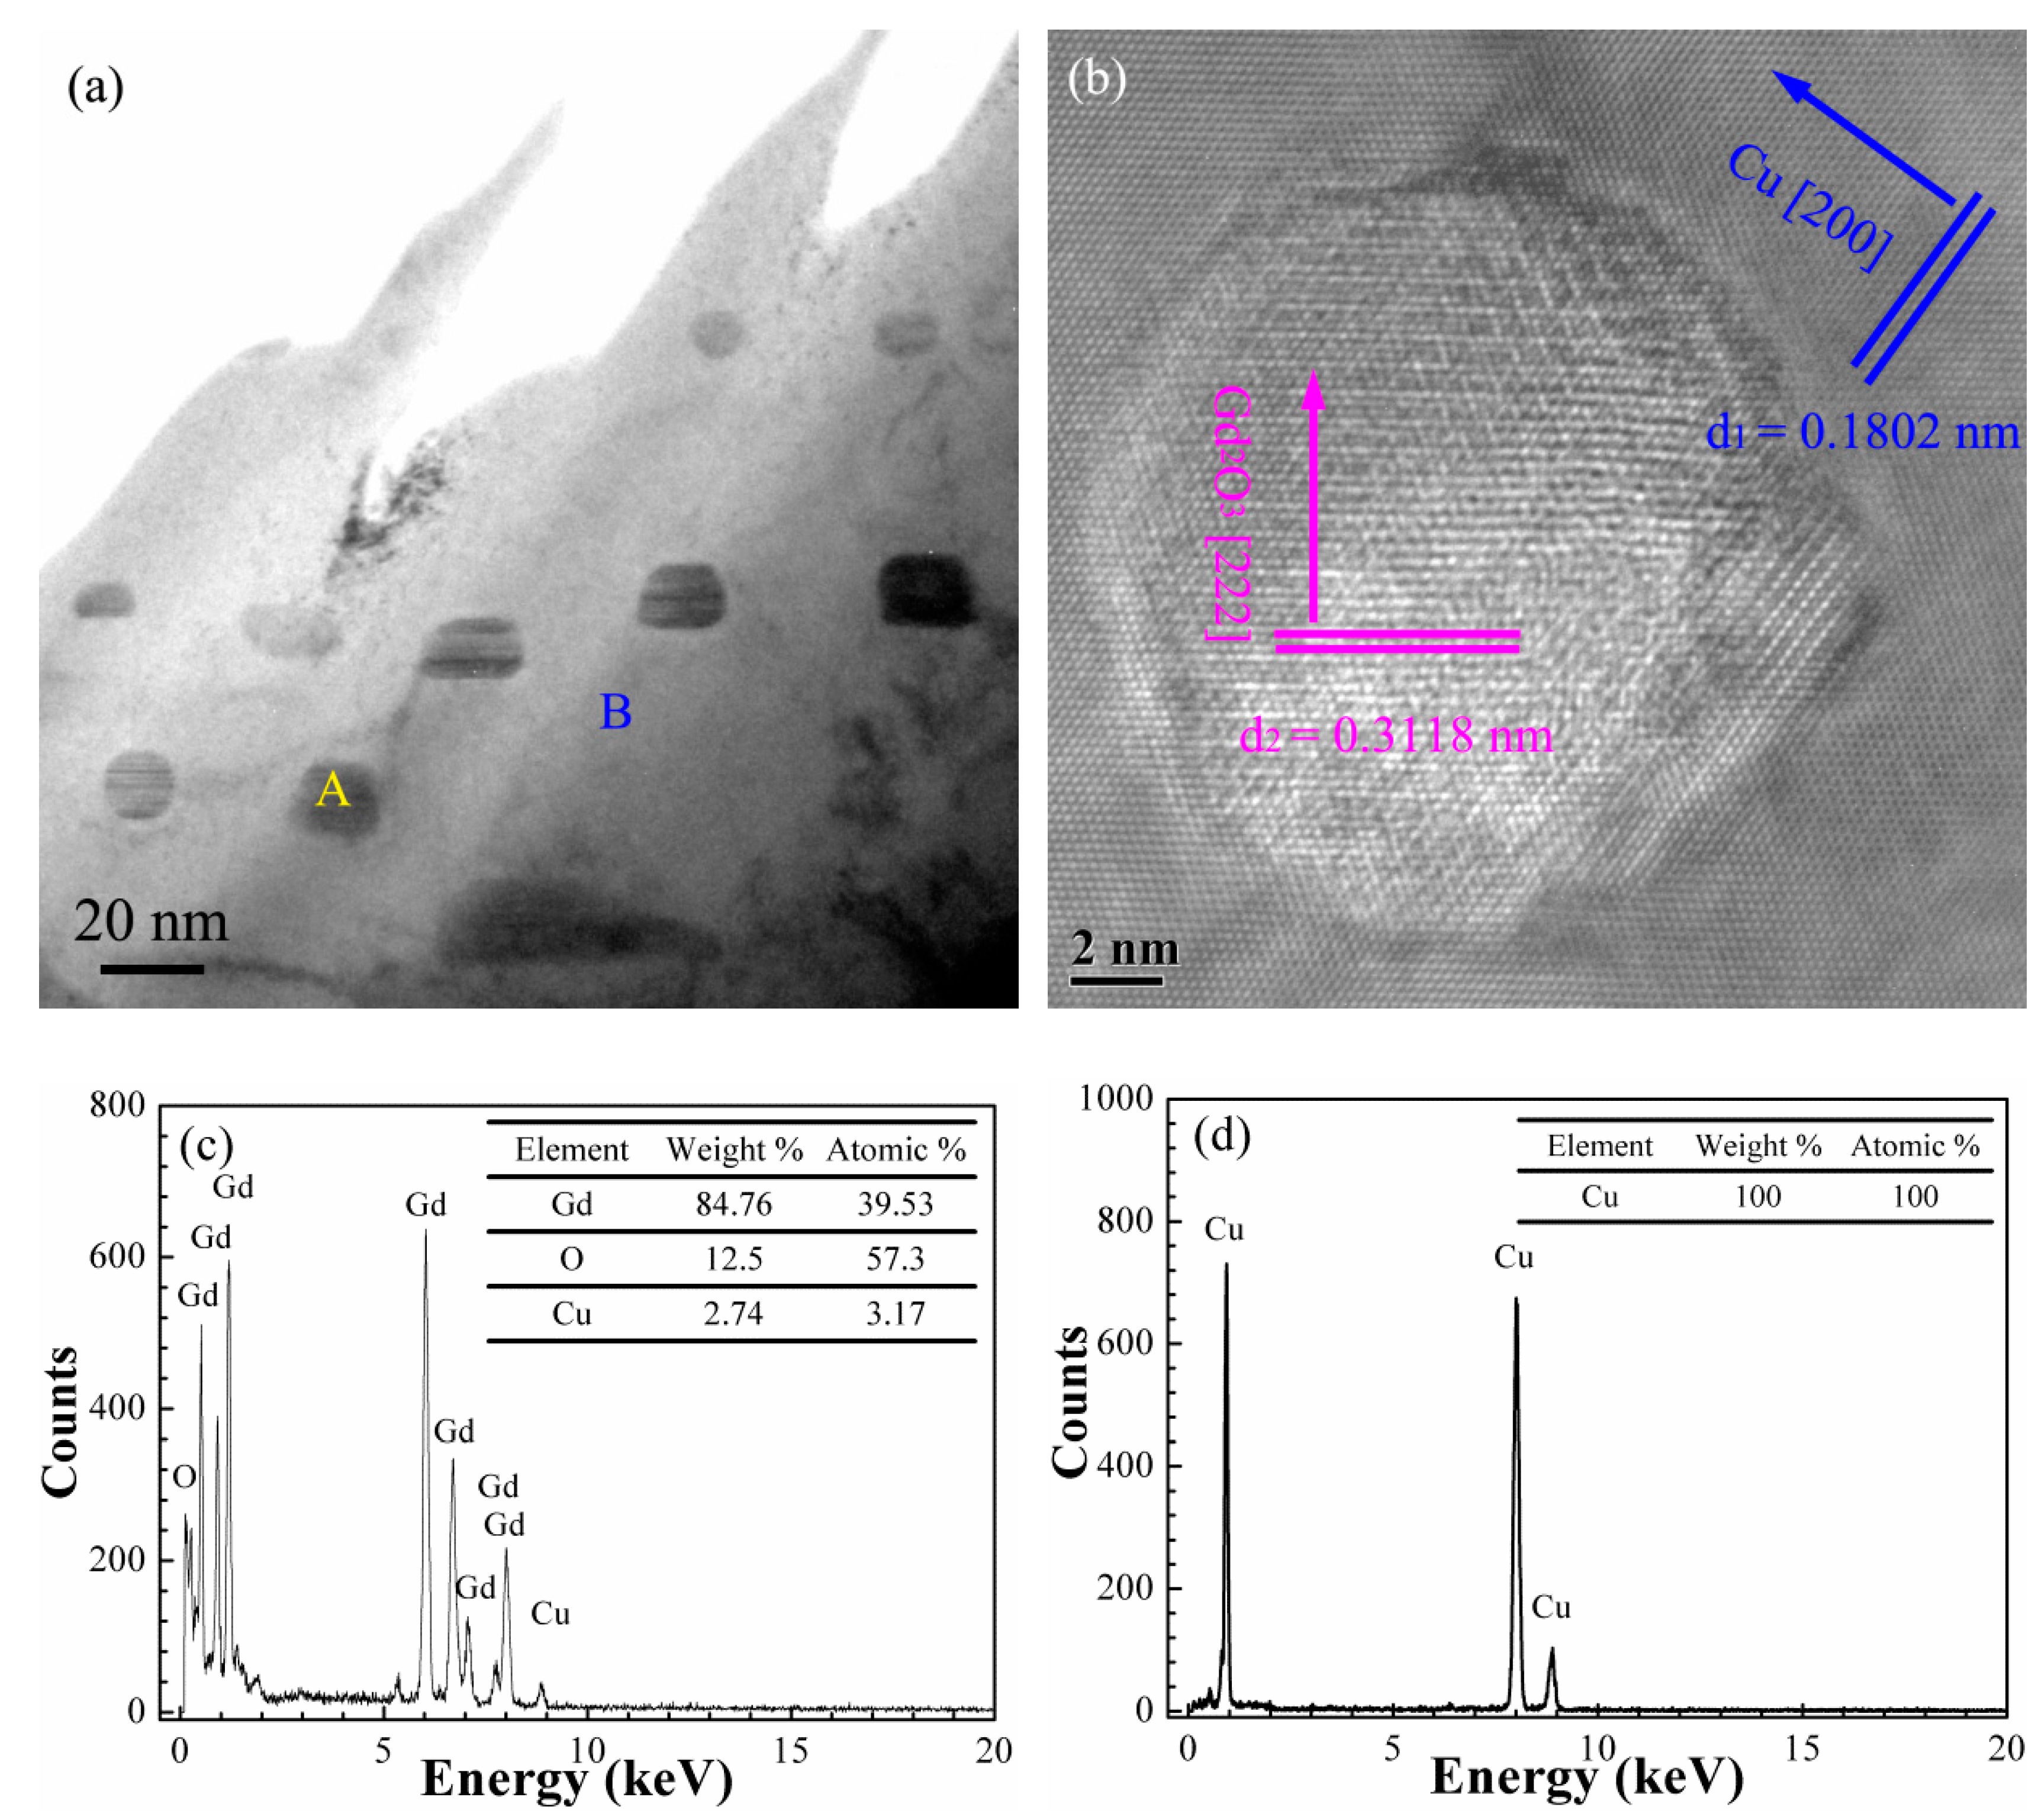
3.3.2. Microstructure of the Gd2O3/Cu Composites

Figure 6 shows the TEM and EDS images of Gd2O3/Cu composite prepared by the internal oxidation method, which was used for further confirming the components of the particles dispersed in the matrix. Figure 6a displays the bright field image, and dark particles (marked as A) and a large bright flat area (marked as B) were selected for EDS analysis. The bright field image showed that the spherical reinforcement phase with a size of about 20 μm was distributed in the matrix. Only Gd, O, and Cu elements existed in the dark area A from the EDS spectrum in Figure 6c, and the atomic percentages of Gd and O elements were 39.53% and 57.30%, their atomic ratio was close to 3:2, illustrating that the spherical reinforcement phase was Gd2O3, which was synthesized in the composite during the internal oxidation process. Only Cu existed in area B (Figure 6d), which indicated that the bright area was the Cu matrix.
Further analysis of the high-resolution TEM image of area A in Figure 6a showed that the interplanar spacings of 0.3118 and 0.1802 nm matched with the Gd2O3 (222) plane (0.3122 nm, PDF 12-0797) and Cu (200) plane (0.1808 nm, PDF 04-0836), respectively (Figure 6b). The Gd2O3 (222) in Figure 6 was consistent with the XRD result in Figure 4c. The Gd2O3 particles existed in the Cu matrix without other phases between them due to the in situ nucleation and growth of the Gd2O3 particles in the Cu matrix, which improved their interface strength and the tensile strength of the Gd2O3/Cu composite.

3.3.3. Microstructure of the Ti3AlC2-Gd2O3/Cu Composites

Figure 7a shows the bright field image of the Ti3AlC2-Gd2O3/Cu composite, and Figure 7b shows the high-resolution image of the white box in Figure 7a. According to the calibration analysis of the high-resolution image, the interplanar spacings of d1 and d2 were 0.2118 and 0.1845 nm, which were highly in accordance with Ti3AlC2 (105) plane (0.2159 nm, PDF#52-0875) and Cu (200) plane (0.1808 nm, PDF#04-0836), respectively, because the percentage of the differentials between the test values and the standard values is less than 2%.
There was a micropore between the Cu matrix and the Ti3AlC2 particles (the yellow oval in Figure 7a), which might be caused by the high surface energy between the Ti3AlC2 particles and the Cu matrix due to their structural characteristics, resulting in the defect during the sintering process. The reinforced phase Ti3AlC2 had a clear boundary with the Cu matrix, which was mechanically bound. This indicated that the interfacial bonding between the Cu matrix and the Ti3AlC2 particles without Cu plating was weaker, which may weaken the enhancement effect. The result further confirmed the finding in Section 3.3.1.

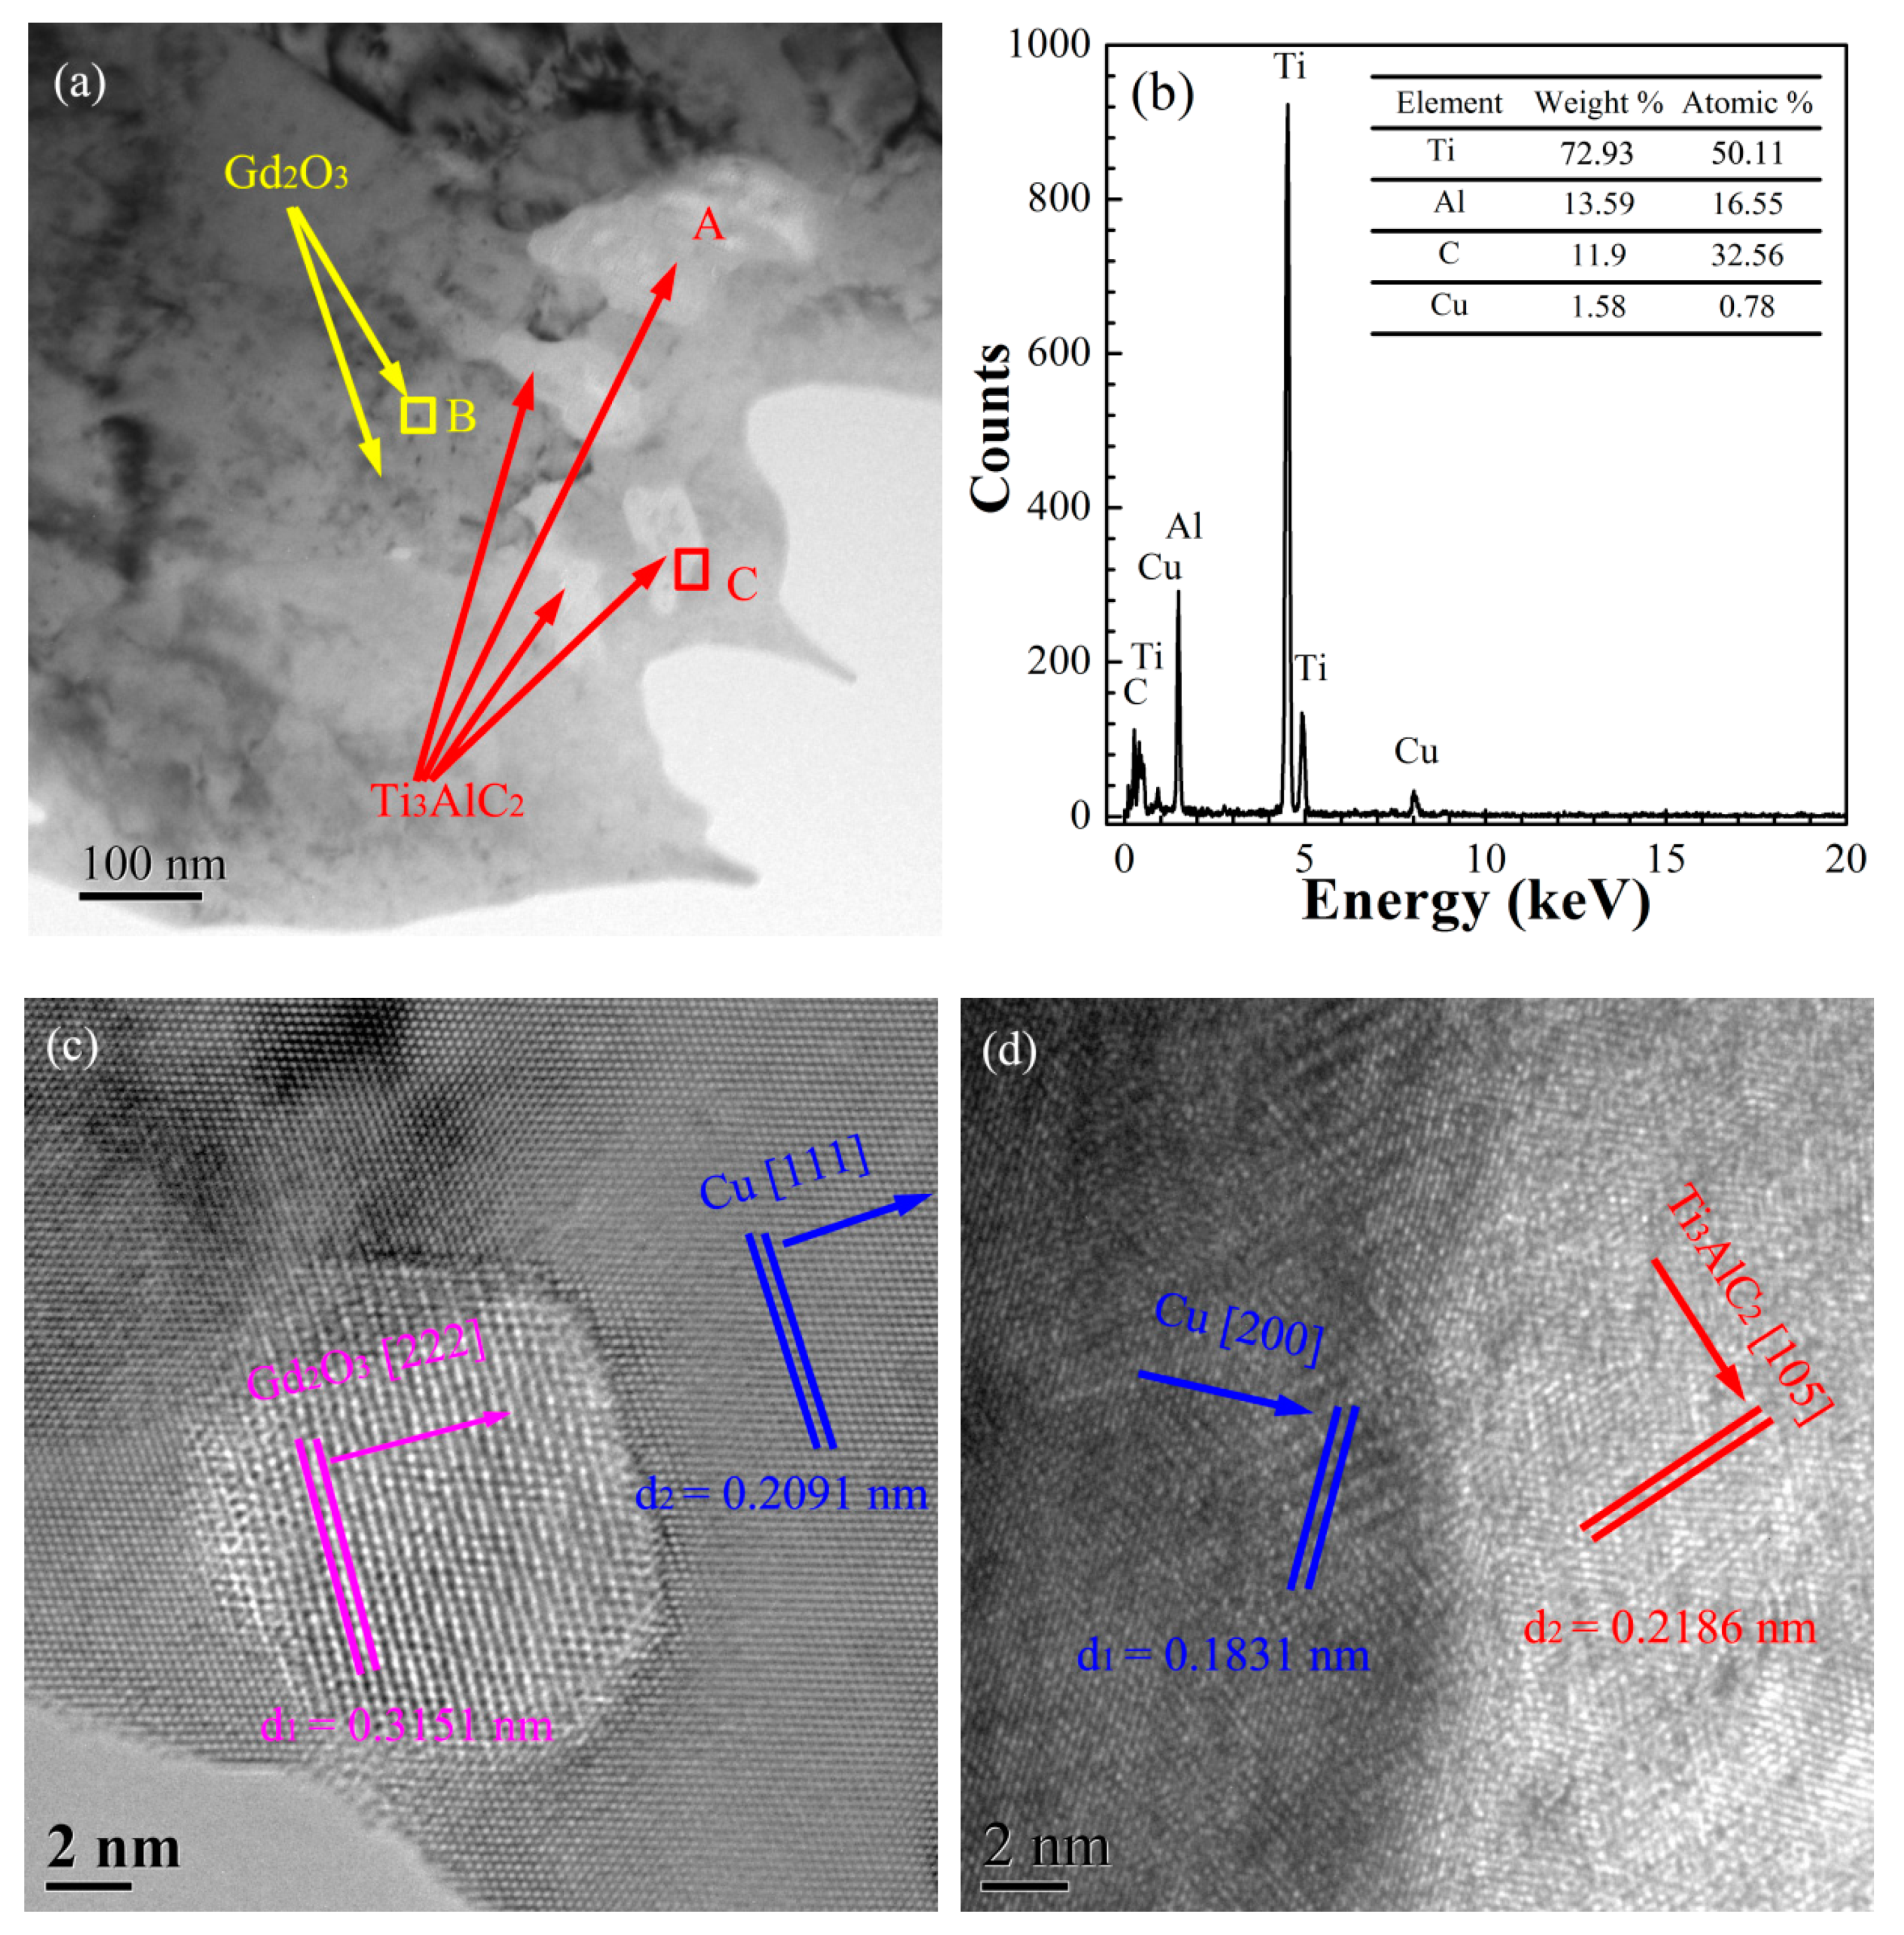
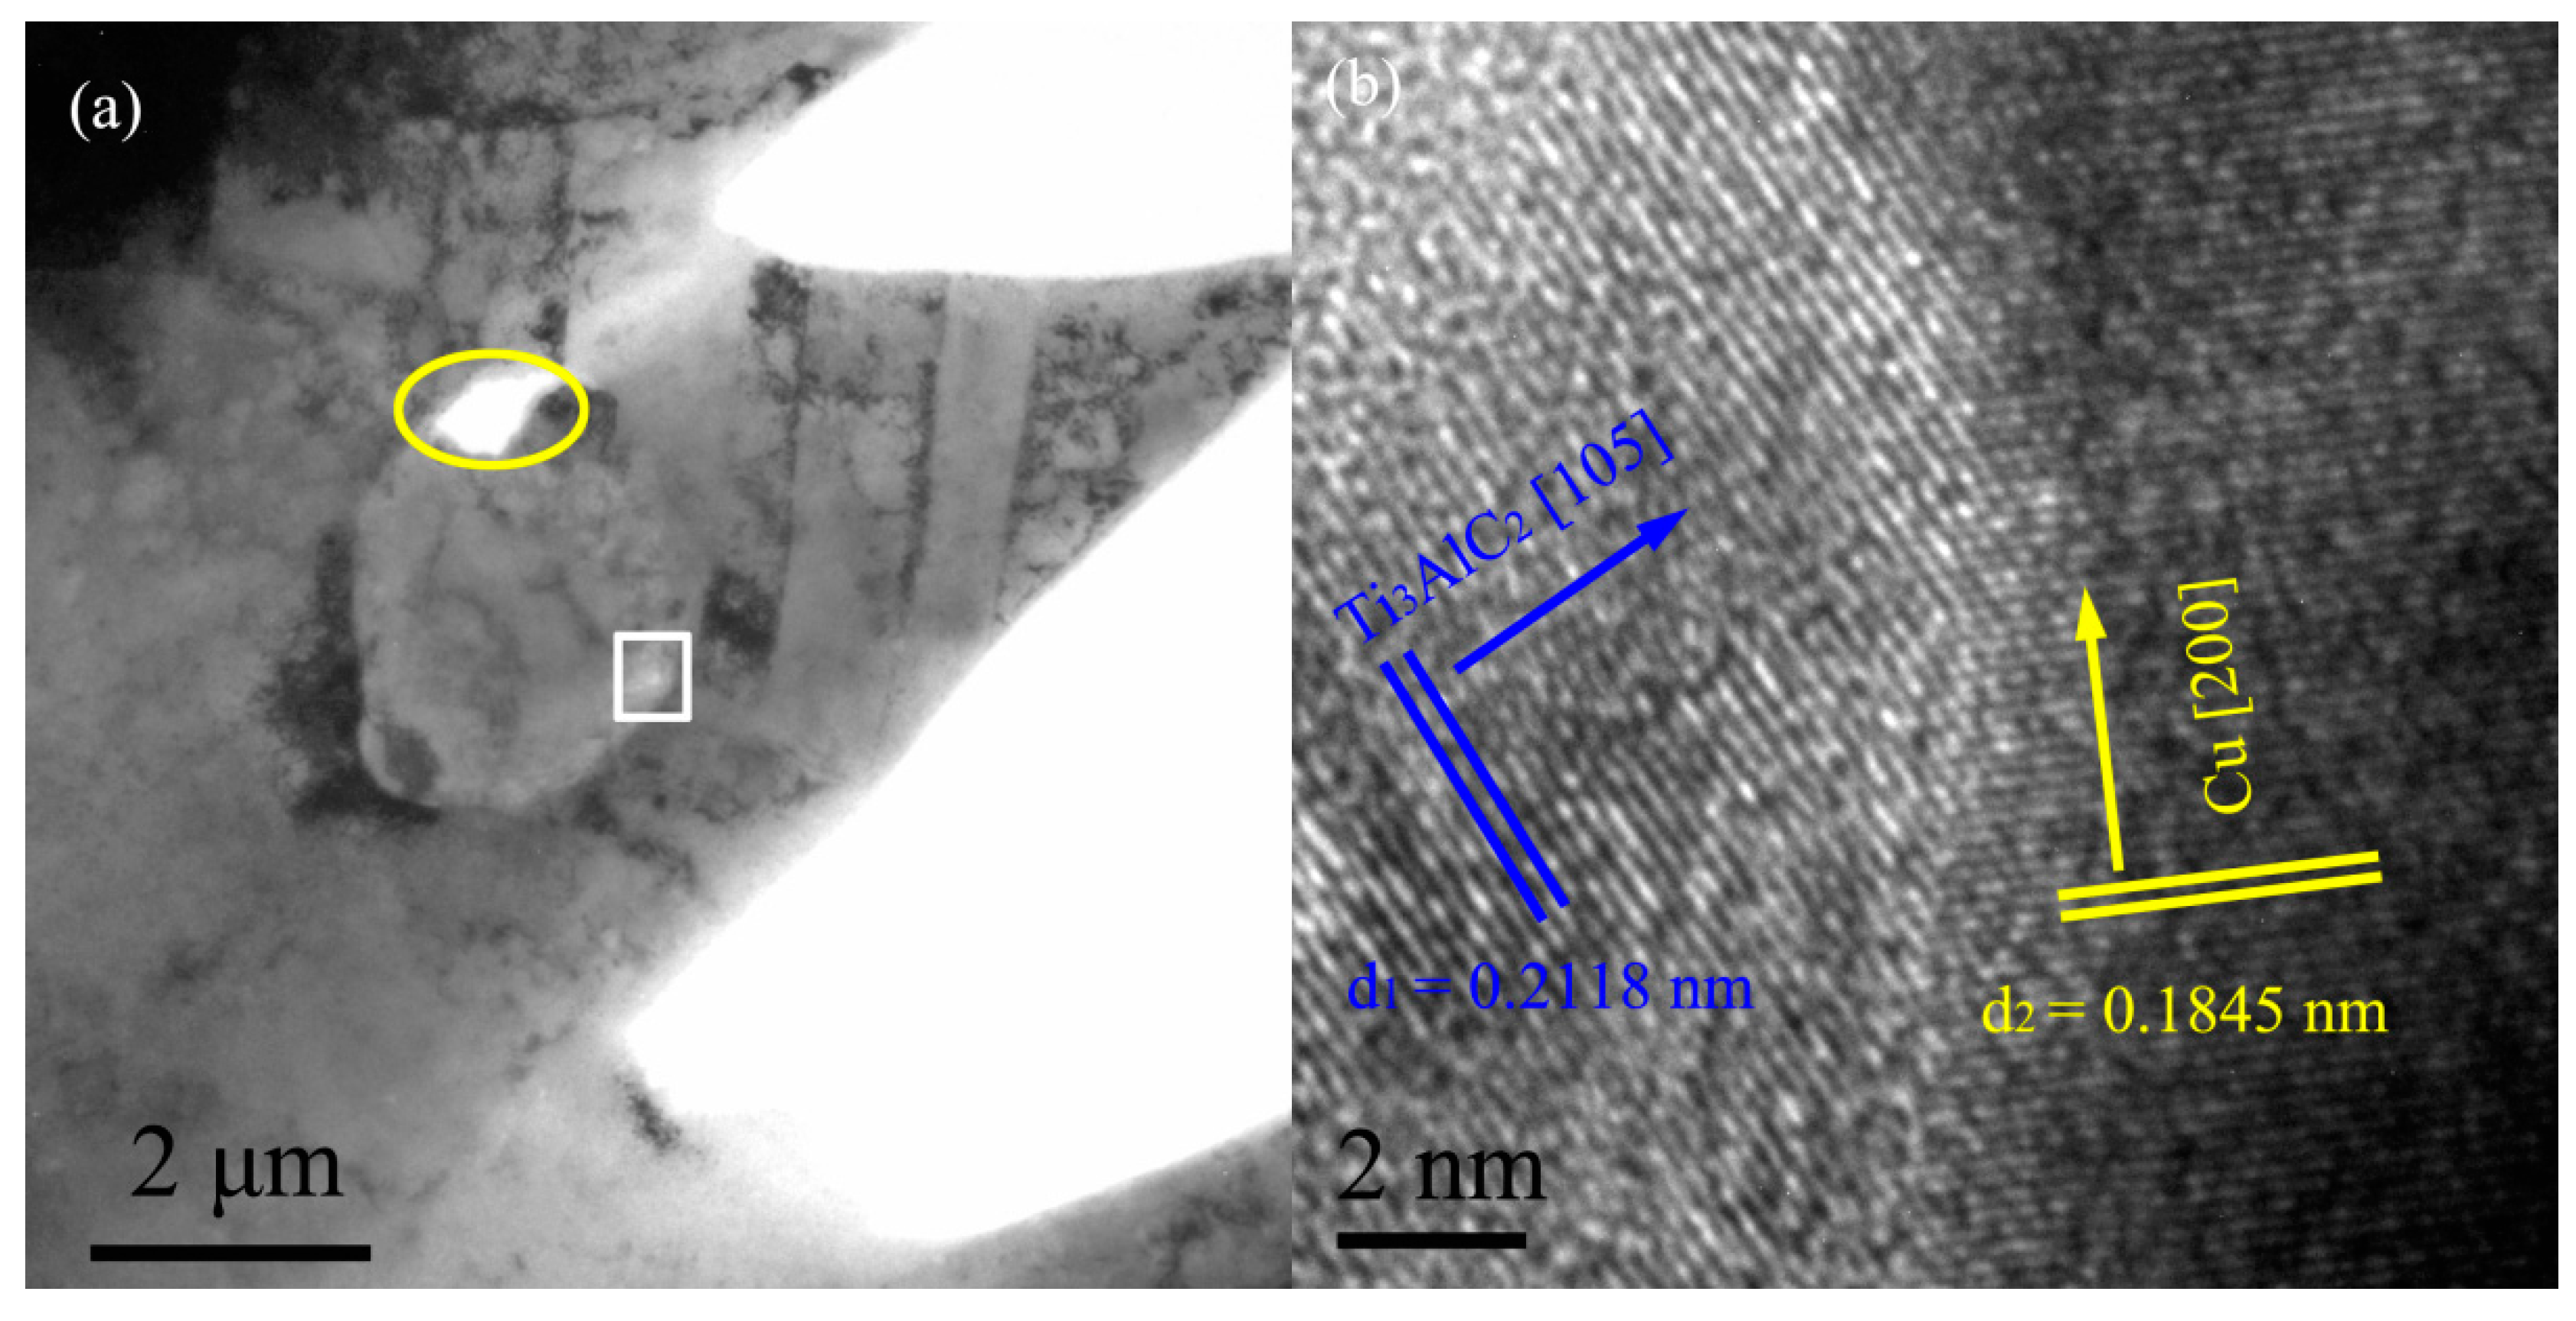
3.3.4. Microstructure of the Cu@Ti3AlC2-Gd2O3/Cu Composites

In order to assess the effect of the electroless Cu plating on the Ti3AlC2 particles, the TEM images of the Cu@Ti3AlC2-Gd2O3/Cu composite were collected. Figure 8 presents the TEM and EDS images of Cu@Ti3AlC2-Gd2O3/Cu composite prepared by electroless Cu plating, internal oxidation, and vacuum hot press sintering.
The fine dark particles were dispersed in the Cu matrix (highlighted by yellow arrows in Figure 8a), which should be the in situ Gd2O3 inferred by their sizes in Figure 6a. In order to confirm that the dark particles were the in situ Gd2O3, the high-resolution TEM image was taken and analyzed as shown in Figure 8c, the interplanar spacings of 0.3151 and 0.2091 nm were in accordance with the Gd2O3 (222) plane and Cu (111) plane, respectively. The in situ Gd2O3 particles were in situ nucleated and grew up in the Cu matrix without other phases between them, which improved the tensile strength of the composite. The larger white particles were distributed at the Cu grain boundary in Figure 8a, the EDS (Figure 8b) showed that the main elements in area A were Ti, Al, and C, and only 1.58% of Cu existed, the atomic ratio of Ti, Al, and C elements was close to 3:1:2; the result suggested that the white phase should be Ti3AlC2. The high-resolution TEM image at area C was analyzed to further confirm the components. As shown in Figure 8d, the interplanar spacings were 0.2186 and 0.1831 nm and in accordance with the Ti3AlC2 (105) plane and Cu (200) plane, respectively. Results indicated that the white enhanced phase at area C was Ti3AlC2. There were no micropores and cracks between the Ti3AlC2 particles and the Cu matrix because of the electroless Cu plating on the surface of the Ti3AlC2 particles.
The in situ Gd2O3 particles and the Ti3AlC2 particles in the Cu matrix acted as obstacles to the moving dislocations according to the Orowan strengthening mechanism [28,29], and the dislocation density around the reinforcements in the Cu matrix might be increased due to the thermal expansion coefficient difference between the Cu matrix and reinforcing phase [30,31], leading to an increase in the strength of the Cu@Ti3AlC2-Gd2O3/Cu composite.

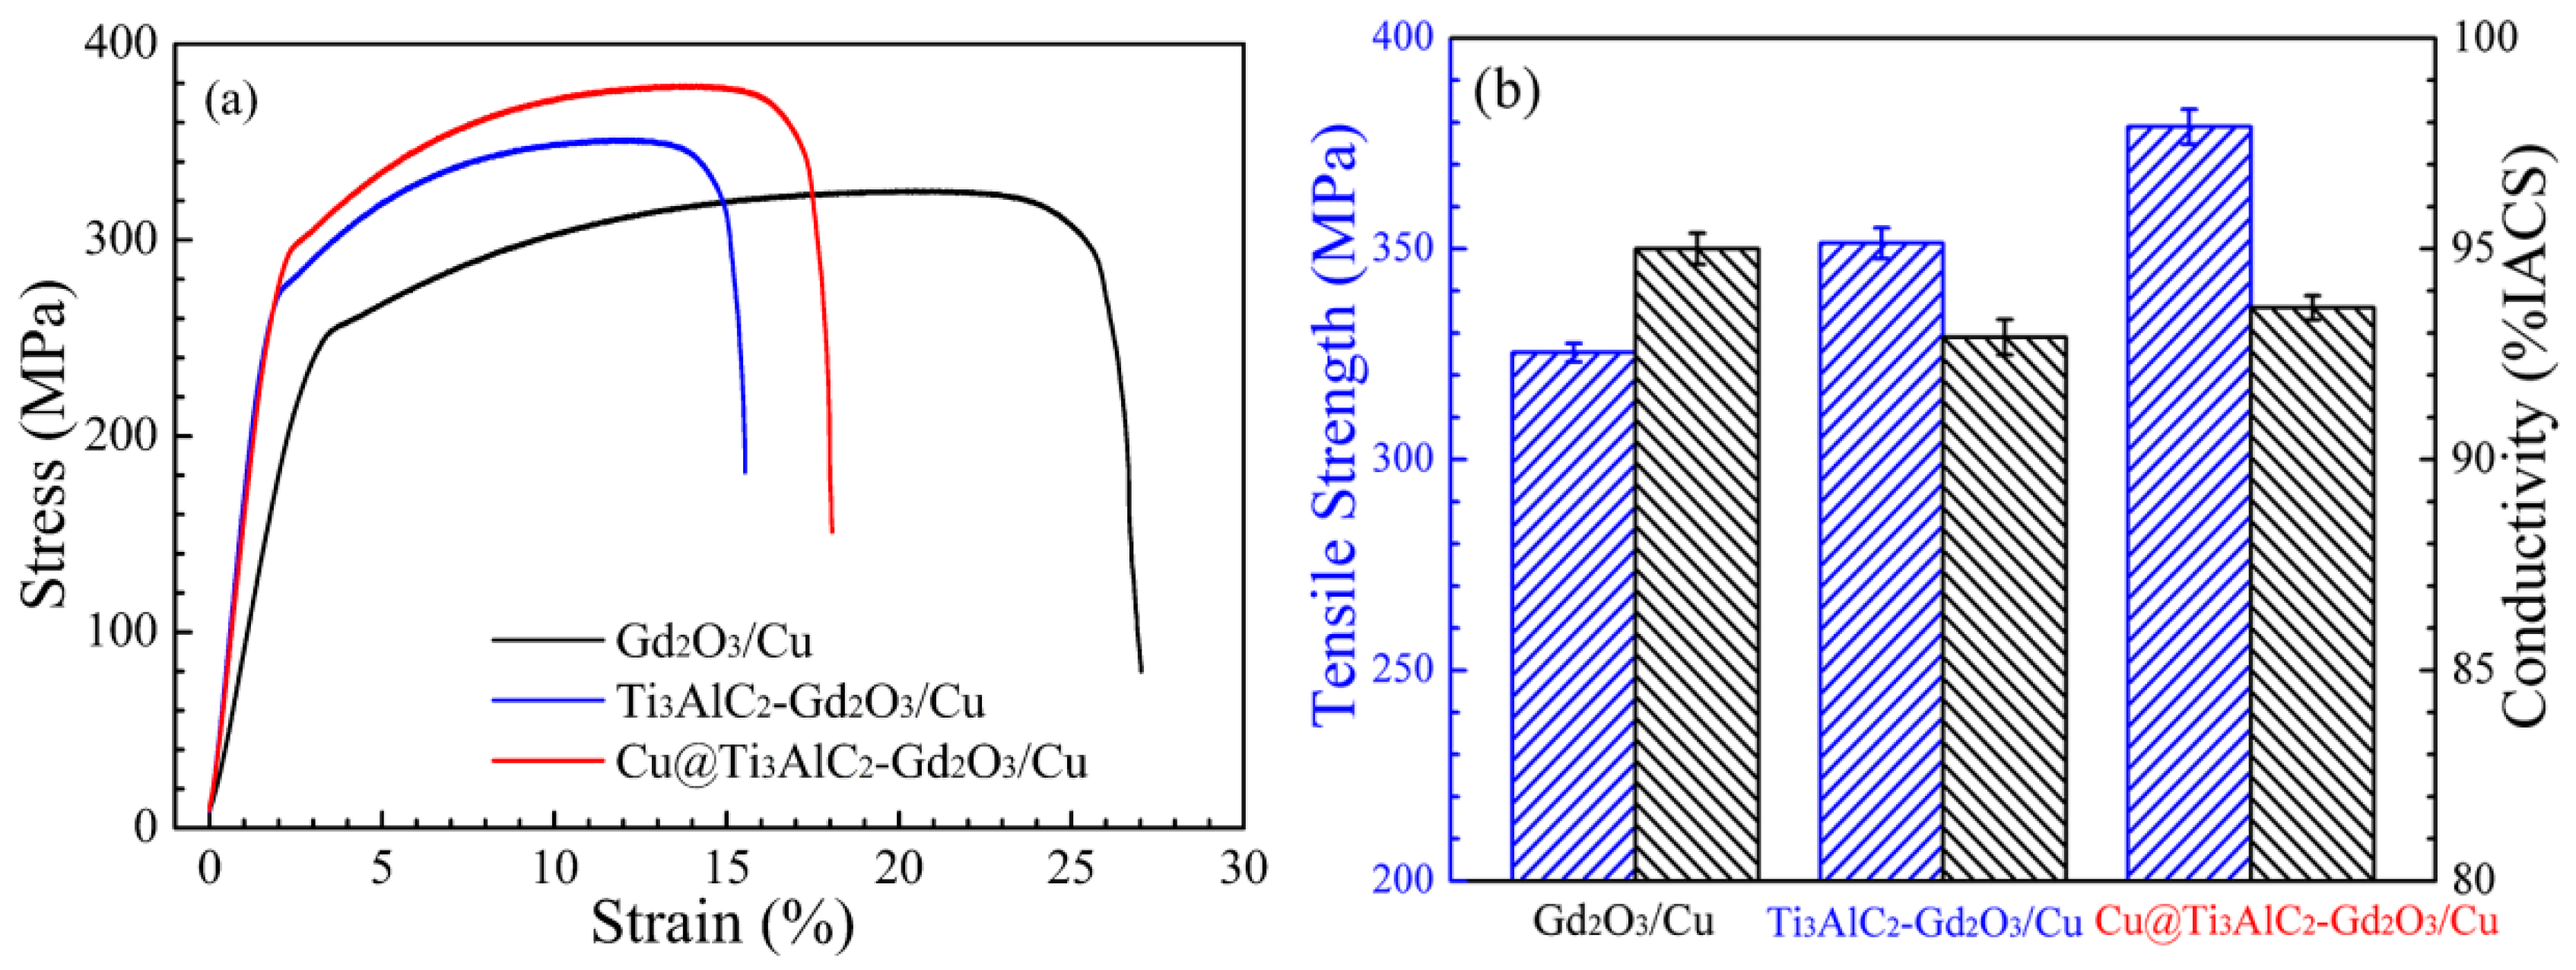
3.4. Tensile Strength and Electrical Conductivity

Figure 9 shows the stress–strain curve (a), tensile strength and electrical conductivity (b) of three different composites: Gd2O3/Cu composite, the Ti3AlC2-Gd2O3/Cu composite, and the Cu@Ti3AlC2-Gd2O3/Cu composite.
As could be seen from Figure 9a, a large plastic deformation occurred before fracture during the tensile test, the tensile strength was improved by ex situ Ti3AlC2 particles from 325.4 (Gd2O3/Cu composite) to 351.4 MPa (Ti3AlC2-Gd2O3/Cu composite), the modulus of the Ti3AlC2-Gd2O3/Cu composite was also increased at the same time, but the elongation decreased from 26.1 ± 0.2% to 15.2 ± 0.3%. After electroless Cu plating on the surface of the Ti3AlC2 particles, the tensile strength of the Cu@Ti3AlC2-Gd2O3/Cu composite was further increased to 378.9 MP and elongation at break reached 17.6 ± 0.2%. The tensile strength and elongations of the Cu@Ti3AlC2-Gd2O3/Cu composite were improved by 27.5MPa and 2.4%, respectively, comparing with the Ti3AlC2-Gd2O3/Cu composite. The electrical conductivity decreased slightly from 95.0%IACS of the Gd2O3/Cu composite to 92.9%IACS of Ti3AlC2-Gd2O3/Cu composite by directly adding Ti3AlC2 particles, but it still remained above 90.0%IACS. Comparing with the Ti3AlC2-Gd2O3/Cu composite without electroless Cu plating on the surface of the Ti3AlC2, the electrical conductivity of the Cu@Ti3AlC2-Gd2O3/Cu composite with Cu plating was slightly increased to 93.6%IACS. The electrical conductivity and elongation of the Cu@Ti3AlC2-Gd2O3/Cu composites prepared by the combination of in situ synthesized and ex situ added methods were 93.6%IACS and 17.6% (this paper), which were much higher than that of the TiB2/Cu composite in [9]. However, the tensile strength of the Cu@Ti3AlC2-Gd2O3/Cu composite was lower than that of the TiB2/Cu composite because 1 wt% Fe was added into the TiB2/Cu composite.
Comparing with the Gd2O3/Cu composite, the tensile strength increase in the Ti3AlC2-Gd2O3/Cu composite was due to the pining of the dislocation movement caused by the in situ Gd2O3 particles in the Cu grains and the Ti3AlC2 particles at the boundary of the Cu grains according to the grain boundary strengthening, Orowan strengthening, thermal mismatch strengthening, and load transfer strengthening mechanisms [29,32,33,34]. The decrease in electrical conductivity in the Ti3AlC2-Gd2O3/Cu composite was due to the electron concentration decrease and the increases in free electron scattering caused by the Ti3AlC2 particles at the Cu grain boundary [35]. Comparing with the Ti3AlC2-Gd2O3/Cu composite, the tensile strength and electrical conductivity of the Cu@Ti3AlC2-Gd2O3/Cu composite were simultaneously increased because the surfactivity between the Cu matrix and the Ti3AlC2 particles was reduced after electroless Cu plating on their surface, which led to the better surface contacting state and less electron scattering after sintering.
For the Ti3AlC2-Gd2O3/Cu composite, the load would be transferred from the Cu matrix to the Ti3AlC2 particles during the tensile test, which hindered the plastic deformation of the Cu matrix and reduced its elongation. With the addition of Cu@Ti3AlC2 particles into the Gd2O3/Cu composite, the interfacial bonding between the Cu@Ti3AlC2 particles and Cu matrix was improved due to the Cu plating on the surface of the Ti3AlC2 particles. The opportunity of crack initiation between the Cu@Ti3AlC2 particles and Cu matrix was low under the same load condition, resulting in the continuous plastic deformation of the Cu matrix, so increased tensile strength and elongation of Cu@Ti3AlC2-Gd2O3/Cu composite were seen.

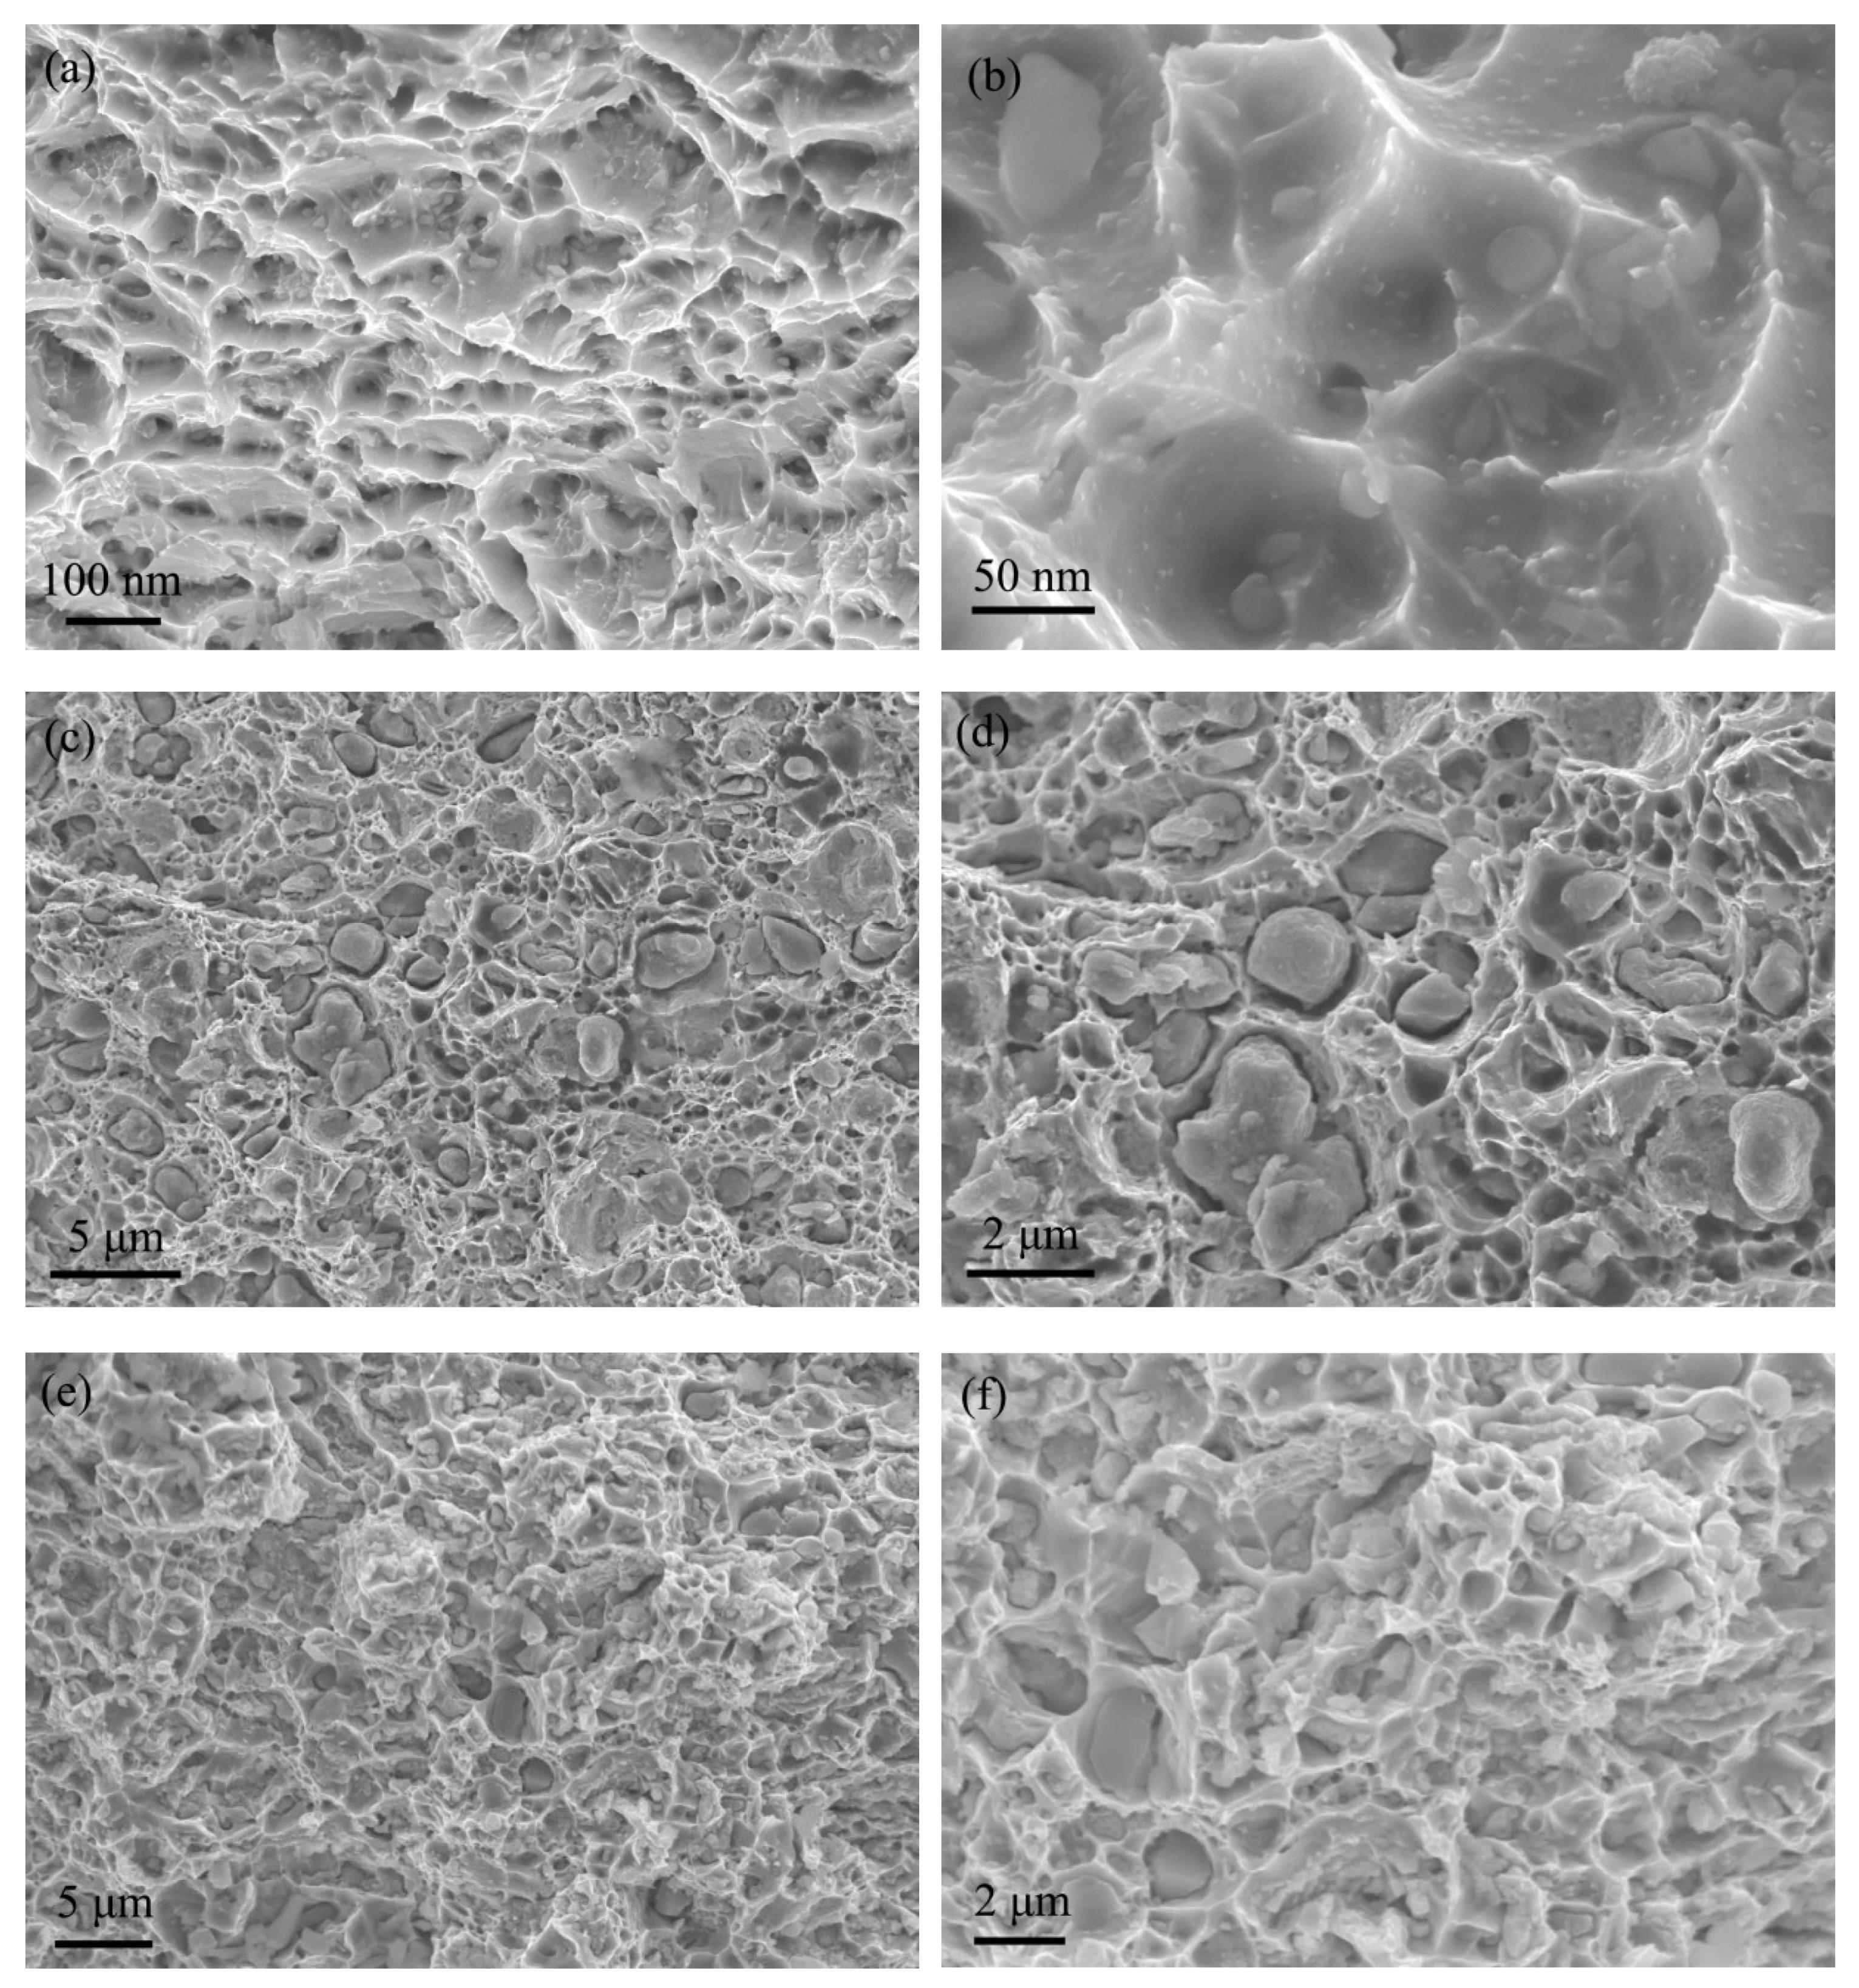
3.5. Fracture Morphology

A large number of dimples with uniform sizes distributed on the fracture surface of the Gd2O3/Cu composites are shown in Figure 10a, and these typical ductile fractures indicated that the Gd2O3/Cu composite was plastically deformed before fracture. The enlarged image in Figure 10b showed in situ Gd2O3 particles existing at the bottom of the dimples, which proved the movement of the dislocation would be impeded by the in situ Gd2O3 particles during the tensile test and helped to improve the tensile strength of the Gd2O3/Cu composite [26,27]. The size of the in situ Gd2O3 particles was about 20 nm, and the value was consistent with the results in Figure 6a,b and Figure 8c.
There were relatively obvious gaps between the Cu matrix and the Ti3AlC2 particles in the fracture morphology of the Ti3AlC2-Gd2O3/Cu composite (Figure 10c,d), and Ti3AlC2 particles with a size of about 2 μm existed at the bottom of the dimples. After electroless Cu plating on the surface of the Ti3AlC2 particles, no gaps existed in the Cu@Ti3AlC2-Gd2O3/Cu composite, as shown in Figure 10e,f, and it could be seen that dimples with uniform size were distributed in the fracture morphology of the Cu@Ti3AlC2-Gd2O3/Cu composite.
The reason for the gaps formed in the Ti3AlC2-Gd2O3/Cu composite might be the weak interface bonding due to their large misfit in lattice parameters, CTE, and elastic modulus between the Ti3AlC2 particles and the Cu matrix. During the tensile testing process, the load would be transferred from the Cu matrix to Ti3AlC2 particles via the interface; with the increase in the load, the Ti3AlC2 particles could hinder the dislocation movement so that the tensile strength of the Ti3AlC2-Gd2O3/Cu composite was improved. As the load increased further to the level that exceeded the interface bonding strength, the cracks initiated from the interface between Ti3AlC2 particles and Cu matrix and interface debonding happened, so the gaps between Ti3AlC2 particles and Cu matrix were observed. With the electroless Cu plating onto the surface of the Ti3AlC2 particles, the surfactivity between the Cu@Ti3AlC2 particles and the Cu matrix was reduced, and a better surface contacting state was achieved after the sintering process, so that no interface debonding was formed between the Cu@Ti3AlC2 particles and the Cu matrix during the tensile process. Higher tensile strength and elongation was achieved in the Cu@Ti3AlC2-Gd2O3/Cu composite.

4. Conclusions

According to the preparation and performance analysis of the Cu@Ti3AlC2-Gd2O3/Cu composites, Ti3AlC2-Gd2O3/Cu composites, and Gd2O3/Cu composites, the innovation points of the combination method and the composites with high tensile strength and electrical conductivity were achieved, and the major findings were as follows:
The Cu@Ti3AlC2-Gd2O3/Cu composites with high tensile strength and electrical conductivity were prepared using the combination method of in situ synthesized and ex situ added reinforcement phase.
The Gd2O3 particles were in situ synthesized during the internal oxidation, and the Gd2O3 particles with a size of about 20 nm were dispersed in the Cu grains. The Ti3AlC2 particles were successfully wrapped by a Cu plating without gaps and micropores, which existed at the Cu grain boundary.
The interfacial bonding between the Ti3AlC2 particles and Cu matrix was effectively improved by the Cu plating onto the surface of Ti3AlC2 particles, and the tensile strength, reached 378.9 MPa, meanwhile, electrical conductivity and elongation of the Cu@Ti3AlC2-Gd2O3/Cu composites remained at 93.6 IACS% and 17.6%.
Only the reinforcement by in situ rare earth oxides and ex situ MAX phases were characterized in this paper, and reinforcements using other particles in Cu matrix composites will be studied in the future.

Author Contributions

Conceptualization, H.C., Z.Z.; methodology, H.C., Z.Z., X.L.; validation, H.C., Z.Z.; formal analysis, H.C., X.L.; investigation, H.C., Z.Z.; data curation, H.C., Z.Z.; writing—original draft preparation, H.C., Z.Z.; writing—review and editing, H.C., Z.Z., X.L.; supervision, H.C., Z.Z., X.L. All authors have read and agreed to the published version of the manuscript.

Funding

This work was supported by the Natural Science Foundation of Hebei Province (grant number E2017203298).

Institutional Review Board Statement

Not applicable.

Informed Consent Statement

Not applicable.

Data Availability Statement

Data is contained within the article.

Conflicts of Interest

The authors declare no conflict of interest.

References

  1. Peng, J.; Chen, B.; Wang, Z.; Guo, J.; Wu, B.; Hao, S.; Zhang, Q.; Gu, L.; Zhou, Q.; Liu, Z.; et al. Surface coordination layer passivates oxidation of copper. Nature 2020, 586, 390–394. [Google Scholar] [CrossRef] [PubMed]
  2. Zhang, S.; Kang, H.; Wang, Z.; Guo, E.; Chen, Z.; Wang, T. Microstructure and properties of dual-scale particulate reinforced copper matrix composites with superior comprehensive properties. J. Alloy. Compd. 2021, 860, 157888. [Google Scholar] [CrossRef]
  3. Ma, B.; Hishinuma, Y.; Noto, H.; Shimada, Y.; Muroga, T. Development of Y2O3 dispersion strengthened Cu alloy using Cu6Y and Cu2O addition through the MA-HIP process. Fusion Eng. Des. 2020, 161, 112045. [Google Scholar] [CrossRef]
  4. Huang, B.; Ma, B.; Hishinuma, Y.; Noto, H.; Muroga, T. Investigations on the formation of multi-modal size distribution of mechanochemically processed Cu-Y-CuO powders. Fusion Eng. Des. 2020, 158, 111852. [Google Scholar] [CrossRef]
  5. Cao, H.; Zhan, Z.; Lv, X. Microstructure Evolution and Properties of an In-Situ Nano-Gd2O3/Cu Composite by Powder Metallurgy. Materials 2021, 14, 5021. [Google Scholar] [CrossRef]
  6. Chandrasekhar, S.B.; Sudhakara Sarma, S.; Ramakrishna, M.; Suresh Babu, P.; Rao, T.N.; Kashyap, B.P. Microstructure and properties of hot extruded Cu-1wt% Al2O3 nano-composites synthesized by various techniques. Mater. Sci. Eng. A 2014, 591, 46–53. [Google Scholar] [CrossRef]
  7. Güler, O.; Varol, T.; Alver, Ü.; Canakci, A. Effect of Al2O3 content and milling time on the properties of silver coated Cu matrix composites fabricated by electroless plating and hot pressing. Mater. Today Commun. 2020, 24, 101153. [Google Scholar] [CrossRef]
  8. Wang, X.; Li, J.; Zhang, Y.; Wang, Y. Improvement of interfacial bonding and mechanical properties of Cu-Al2O3 composite by Cr-nanoparticle-induced interfacial modification. J. Alloy. Compd. 2017, 695, 2124–2130. [Google Scholar] [CrossRef] [Green Version]
  9. Pan, S.; Zheng, T.; Yao, G.; Chi, Y.; Rosa, I.D.; Li, X. High-strength and high-conductivity in situ Cu–TiB2 nanocomposites. Mater. Sci. Eng. A 2022, 831, 141952. [Google Scholar] [CrossRef]
  10. Hwang, J.; Yoon, T.; Jin, S.H.; Lee, J.; Kim, T.; Hong, S.H.; Jeon, S. Enhanced Mechanical Properties of Graphene/Copper Nanocomposites Using a Molecular-Level Mixing Process. Adv. Mater. 2013, 25, 6724–6729. [Google Scholar] [CrossRef]
  11. Zhuo, H.; Tang, J.; Ye, N. A novel approach for strengthening Cu-Y2O3 composites by in situ reaction at liquidus temperature. Mater. Sci. Eng. A 2013, 584, 1–6. [Google Scholar] [CrossRef]
  12. Kudashov, D.V.; Baum, H.; Martin, U.; Heilmaier, M.; Oettel, H. Microstructure and room temperature hardening of ultra-fine-grained oxide-dispersion strengthened copper prepared by cryomilling. Mater. Sci. Eng. A 2004, 387–389, 768–771. [Google Scholar] [CrossRef]
  13. Shabadi, R.; Avettand-Fènoël, M.N.; Simar, A.; Taillard, R.; Jain, P.K.; Johnson, R. Thermal conductivity in yttria dispersed copper. Mater. Des. 2015, 65, 869–877. [Google Scholar] [CrossRef]
  14. Mo, F.; Feng, Y.; Chen, Y.; Wang, Y.; Qian, G.; Dou, Y.; Zhang, X. Effect of La2O3 on electrical friction and wear properties of Cu-graphite composites. J. Rare Earths. 2015, 33, 327–333. [Google Scholar] [CrossRef]
  15. Groza, J.R.; Gibeling, J.C. Principles of particle selection for dispersion-strengthened copper. Mater. Sci. Eng. A 1993, 171, 115–125. [Google Scholar] [CrossRef]
  16. Zheng, R.; Zhan, Z.; Wang, W. Wear behavior of Cu-La2O3 composite with or without electrical current. Wear 2010, 268, 72–76. [Google Scholar] [CrossRef]
  17. Aghamiri, S.M.S.; Oono, N.; Ukai, S.; Kasada, R.; Noto, H.; Hishinuma, Y.; Muroga, T. Microstructure development and high tensile properties of He/H2 milled oxide dispersion strengthened copper. J. Alloy. Compd. 2019, 783, 674–679. [Google Scholar] [CrossRef]
  18. Huang, F.; Wang, H.; Yang, B.; Liao, T.; Wang, Z. Uniformly dispersed Y2O3 nanoparticles in nanocrystalline copper matrix via multi-step ball milling and reduction process. Mater. Lett. 2019, 242, 119–122. [Google Scholar] [CrossRef]
  19. Hu, W.; Huang, Z.; Wang, Y.; Li, X.; Zhai, H.; Zhou, Y.; Chen, L. Layered ternary MAX phases and their MX particulate derivative reinforced metal matrix composite:A review. J. Alloy. Compd. 2021, 586, 517313. [Google Scholar] [CrossRef]
  20. Sobolev, K.; Gorshenkov, M.; Manfrinetti, P.; Peddis, D.; Pazniak, A.; Rodionova, V. Synthesis of phase-pure highly-doped MAX-phase (Cr1-xMnx)2AlC. Ceram. Inf. 2021, 47, 21069–21076. [Google Scholar] [CrossRef]
  21. Wang, W.; Zhai, H.; Chen, L.; Zhou, Y.; Huang, Z.; Bei, G.; Greil, P. Sintering and properties of mechanical alloyed Ti3AlC2-Cu composites. Mater. Sci. Eng. A 2017, 685, 154–158. [Google Scholar] [CrossRef]
  22. Griseri, M.; Tunca, B.; Lapauw, T.; Huang, S.; Popescu, L.; Barsoum, M.W.; Lambrinou, K.; Vleugels, J. Synthesis, properties and thermal decomposition of the Ta4AlC3 MAX phase. J. Eur. Ceram. Soc. 2019, 39, 2973–2981. [Google Scholar] [CrossRef] [Green Version]
  23. Badie1, S.; Dash, A.; Sohn, Y.J.; Vaßen, R.; Guillon, O. Gonzalez-Julian, J. Synthesis, sintering, and effect of surface roughness on oxidation of submicron Ti2AlC ceramics. J. Am. Ceram. Soc. 2021, 104, 1669–1688. [Google Scholar] [CrossRef]
  24. Was′kowska, A.; Gerward, L.; Olsen, J.S.; Babu, K.R.; Vaitheeswaran, G.; Kanchana, V.; Svane, A.; Filipov, V.B.; Levchenko, G.; Lyaschenko, A. Thermoelastic properties of ScB2, TiB2, YB4 and HoB4: Experimental and theoretical studies. Acta Mater. 2011, 59, 4886–4894. [Google Scholar] [CrossRef]
  25. Guo, M.; Shen, K.; Wang, M. Relationship between microstructure, properties and reaction conditions for Cu-TiB2 alloys prepared by in situ reaction. Acta Mater. 2009, 57, 4568–4579. [Google Scholar] [CrossRef]
  26. Magnuson, M.; Wilhelmsson, O.; Palmquist, J.-P.; Jansson, U.; Mattesini, M.; Li, S.; Ahuja, R.; Eriksson, O. Electronic structure and chemical bonding in Ti2AlC investigated by soft x-ray emission spectroscopy. Phys. Rev. B 2006, 74, 195180. [Google Scholar] [CrossRef] [Green Version]
  27. Gonzalez-Julian, J. Processing of MAX phases: From synthesis to applications. J. Am. Ceram. Soc. 2021, 104, 659–690. [Google Scholar] [CrossRef]
  28. Hao, Z.; Hao, Z.; Xie, G.; Liu, X.; Tan, Q.; Wang, R. The precipitation behaviours and strengthening mechanism of a Cu-0.4 wt% Sc alloy. J. Mater. Sci. Technol. 2022, 98, 1–13. [Google Scholar] [CrossRef]
  29. Ma, K.; Wen, H.; Hu, T.; Topping, T.D.; Isheim, D.; Seidman, D.N.; Lavernia, E.J.; Schoenung, J.M. Mechanical behavior and strengthening mechanisms in ultrafine grain precipitation-strengthened aluminum alloy. Acta Mater. 2014, 62, 141–155. [Google Scholar] [CrossRef]
  30. Arsenault, R.J.; Shi, N. Dislocation generation due to differences between the coefficients of thermal expansion. Mater. Sci. Eng. 1986, 81, 175–187. [Google Scholar] [CrossRef]
  31. Dunand, D.C.; Mortensen, A. Reinforced silver chloride as a model material for the study of dislocations in metal matrix composites. Mater. Sci. Eng. A 1991, 144, 179–188. [Google Scholar] [CrossRef]
  32. Deng, K.; Shi, J.; Wang, C.; Wang, X.; Wu, Y.; Nie, K.; Wu, K. Microstructure and strengthening mechanism of bimodal size particle reinforced magnesium matrix composite. Compos. Part A Appl. Sci. Manuf. 2012, 43, 1280–1284. [Google Scholar] [CrossRef]
  33. Xiong, B.; Yu, H.; Xu, Z.; Yan, Q.; Cai, C. Fabrication of SiC particulate reinforced AZ91D composite by vacuum-assisted pressure infiltration technology. J. Alloy. Compd. 2011, 509, L279–L283. [Google Scholar] [CrossRef]
  34. Yan, S.; Dai, S.; Zhang, X.; Yang, C.; Hong, Q.; Chen, J.; Lin, Z. Investigating aluminum alloy reinforced by graphene nanoflakes. Mater. Sci. Eng. A 2014, 612, 440–444. [Google Scholar] [CrossRef]
  35. Pan, S.; Yuan, J.; Zhang, P.; Sokoluk, M.; Yao, G.; Li, X. Effect of electron concentration on electrical conductivity in in situ Al-TiB2 nanocomposites. Appl. Phys. Lett. 2020, 116, 014102. [Google Scholar] [CrossRef]
Figure 1. The preparation process diagram of the Cu@Ti3AlC2-Gd2O3/Cu composite: (a) electroless Cu plating on the surface of the Ti3AlC2 particles, (b) in situ synthesis of Gd2O3 reinforced phase, (c) the ball milling and sintering of the Cu@Ti3AlC2 and Gd2O3/Cu powders.
Materials 15 01846 g001
Figure 2. Schematic diagram of tensile specimen (unit: mm).
Materials 15 01846 g002
Figure 3. The Ti3AlC2 powder particles before and after electroless Cu plating: (a,b) the morphology of Ti3AlC2 powder and Cu@Ti3AlC2 powder; (c,d) the profile of the Cu@Ti3AlC2 powder; (e) the XRD patterns of Ti3AlC2 powder and Cu@Ti3AlC2 powder.
Materials 15 01846 g003
Figure 4. The powder analysis of in situ synthesis of Gd2O3: (a,b) the morphology of Cu-Gd alloy powder mixed with Cu2O powder before internal oxidation and after H2 reduction; (c) the XRD patterns of the mixed powders in Figure 4a,b.
Materials 15 01846 g004
Figure 5. The distribution of the Ti3AlC2 particles in the Cu matrix: (a) Ti3AlC2-Gd2O3/Cu; (b) Cu@Ti3AlC2-Gd2O3/Cu; (c,d) are the energy spectra of areas A and B in Figure 5b; small cracks and micropores were indicated by red arrows.
Materials 15 01846 g005
Figure 6. The TEM and EDS images of the Gd2O3/Cu composite: (a) bright field image; (b) high resolution image; (c,d) the corresponding EDS spectrum at areas A and B in Figure 6a respectively.
Materials 15 01846 g006
Figure 7. The TEM images of the Ti3AlC2-Gd2O3/Cu composite: (a) bright field image; (b) high resolution image; a micropore was indicated by the yellow circle and the high resolution image was from the white box in Figure 7a.
Materials 15 01846 g007
Figure 8. The TEM and EDS images of Cu@Ti3AlC2-Gd2O3/Cu composite: (a) the bright field image; (b) the energy spectra of area A in Figure 8a; (c,d) are the high-resolution images of areas B and C in Figure 8a, respectively.
Materials 15 01846 g008
Figure 9. The stress–strain curve, tensile strength, and electrical conductivity of the composites: (a) the stress–strain curve and (b) the tensile strength and electrical conductivity.
Materials 15 01846 g009
Figure 10. The fracture morphology of the composites: (a,b) the Gd2O3/Cu composite; (c,d) the Ti3AlC2-Gd2O3/Cu composite; (e,f) the Cu@Ti3AlC2-Gd2O3/Cu composite.
Materials 15 01846 g010
Table 1. The composition and concentration of bath solution.
FunctionMain SaltReductantPH RegulatorStabilizerComplex
CompositionCuSO4·5H2OHCHO (37%)NaOH2,2′-BipyridylNa2EDTA
Concentration 18 g/L20 mL/L8 g/L0.05 g/L30 g/L
Publisher’s Note: MDPI stays neutral with regard to jurisdictional claims in published maps and institutional affiliations.

