Article

Investigation of the Oxidation Behavior of Cr20Mn17Fe18Ta23W22 and Microdefects Evolution Induced by Hydrogen Ions before and after Oxidation

1
Key Laboratory of Radiation Physics and Technology, Ministry of Education, Institute of Nuclear Science and Technology, Sichuan University, Chengdu 610064, China
2
Multi-Disciplinary Research Center, Institute of High Energy Physics, Chinese Academy of Sciences (CAS), Beijing 100049, China
*
Author to whom correspondence should be addressed.
Materials 2022, 15(5), 1895; https://doi.org/10.3390/ma15051895
Submission received: 31 January 2022 / Revised: 25 February 2022 / Accepted: 28 February 2022 / Published: 3 March 2022
(This article belongs to the Special Issue Advanced Applications and Novel Technologies of Positron Annihilation)

Abstract

:
The oxidation behavior of body-centered cubic (bcc) structure Cr20Mn17Fe18Ta23W22 refractory high-entropy alloy (RHEA) and the microdefects induced by hydrogen ions before and after oxidation were investigated. The results revealed that compared with oxidizing Cr20Mn17Fe18Ta23W22 at 800 °C (6.7 °C/min) for 4 h (ST3, Ar:O2 = 3:1), the heating procedure of oxidizing Cr20Mn17Fe18Ta23W22 at 300 °C (6 °C/min) for 2 h and then increased to 800 °C (5 °C/min) for 4 h is more conducive to the production of oxides without spalling on the surface, i.e., HT1 (Ar:O2 = 1:1), HT2 (Ar:O2 = 2:1) and HT3 (Ar:O2 = 3:1) samples. The oxidation of Cr20Mn17Fe18Ta23W22 RHEA is mainly controlled by the diffusion of cations instead of affinities with O. Additionally, HT1 and HT3 samples irradiated with a fluence of 3.9 × 1022 cm−2 hydrogen ions (60 eV) were found to have a better hydrogen irradiation resistance than Cr20Mn17Fe18Ta23W22 RHEA. The microdefects in irradiated Cr20Mn17Fe18Ta23W22 mainly existed as hydrogen bubbles, hydrogen-vacancy (H-V) complexes and vacancy/vacancy clusters. The microdefects in irradiated HT3 were mainly vacancies and H-V complexes, while the microdefects in irradiated HT1 mainly existed as vacancies and vacancy clusters, as large amounts of hydrogen were consumed to react with oxides on the HT1 surface. The oxides on the surface of the HT3 sample were more stable than those on HT1 under hydrogen irradiation.

1. Introduction

Hydrogen isotopes (deuterium and tritium) are the primary fuel for nuclear fusion; however, the migration and retention of hydrogen in structural materials affect the fuel efficiency, which could lead to hydrogen embrittlement [1,2,3,4,5]. Therefore, research on preparing stable hydrogen permeation barriers to reduce hydrogen solubility and diffusivity has become an important issue in the study of nuclear materials [6,7,8,9]. To simulate the bombardment of the material in the fusion reactor by hydrogen isotopes plasma, hydrogen irradiation experiments have been conducted and investigated by researchers [10,11]. Hydrogen irradiation often produces lots of vacancy type defects, like vacancy and H-V complexes. These defects ultimately lead to irreversible plastic deformation of materials. Therefore, investigating the evolution of defects caused by hydrogen irradiation is crucial for the development of fusion reactor material. However, related research is rare to date. Lu et al. [12] observed monovacancies in FeMnNiCoCr HEA using positron annihilation spectroscopy (PAS) after irradiation with low doses of hydrogen. Ramachandran et al. [13] applied PAS to investigate the evolution of defects with temperature in RAFM steel irradiated by hydrogen and helium. The results revealed that H-vacancy complexes emerged after being irradiated with only hydrogen, and the S-parameter, which could reflect vacancy type defects, increased when hydrogen was released from H-V complexes at 373 K. However, after annealing at 673 K, the defects recovered completely.
High entropy alloys (HEAs), as new materials which are mainly composed of five or more elements with a single or two phases, have attracted lots of attention and are considered as a potential high-performance structural material due to their extraordinary properties, like high strength, hardness and irradiation resistance [14,15,16]. In the meantime, refractory high entropy alloys (RHEAs), a subcategory of of HEAs that contain refractory metal elements, have also been extensively studied in recent years due to their extraordinary mechanical properties at high temperature and the resistance to radiation damage. RHEAs also have been applied as structural materials in harsh environments like nuclear fusion reactors [17,18,19,20,21,22,23]. To promote their hydrogen permeation resistance properties, oxidizing RHEAs directly is a solution to increase the cohesiveness between the oxides and the RHEA structural material. However, the oxidation properties of RHEAs have not been fully addressed due to their complex composition [24]. Beyond their affinity with O, the element diffusion in alloy matrices and deuterogenic oxides also affect the oxidation process; nonetheless, related research has been minimal. For instance, compared with commercial stainless steels and Fe-Cr alloys, FeCoNiCrMn HEA displayed a sluggish diffusion behavior [25]; elements diffuse in FeCoNiCrMn HEA mainly through vacancies [26]. The sequence of diffusivities from fastest to slowest in CoCrFeMnNi composition was DMn > DCr ≈ DFe > DCo ≈ DNi [27]. In addition, previous studies about the oxidation of Fe-Cr based alloys including Mn indicated that the diffusion rates of metal ions through chromium oxide are DMn > DFe > DNi > DCr [28]. The lattice diffusivity of Mn is greater than that of the other element (two orders of magnitude), while the values of Cr, Fe, and Ni are in the same scope in chromium oxide [29].
In this work, a BCC structure Cr20Mn17Fe18Ta23W22 RHEA coating was prepared by magnetron sputtering. The five elements are low neutron activation elements and satisfy the element selection requirements for a fusion reactor (Cr, Mn and Fe: no limit; Ta and W: several %) [30]. To form an effective hydrogen permeation barrier on a potential structural material, i.e., Cr20Mn17Fe18Ta23W22, selective oxidation was conducted, which is a simple preparation method. This material is suitable for use in tubular structures in fusion reactors. The oxidation behavior of Cr20Mn17Fe18Ta23W22 is discussed. Hydrogen ion irradiation tests were carried out at a plasma surface interaction (PSI) facility. The PSI facility is able to produce ions with low energy and high fluence. In addition, it can achieve both stress and temperature field corrosion, and simulate the reactor conditions more effectively than ordinary hydrogen (isotope) permeation tests. The evolution of microstructure defects in Cr20Mn17Fe18Ta23W22 before and after oxidation induced by hydrogen-ion irradiation was mainly investigated by the positron annihilation Doppler broadening technique. Low activation Cr20Mn17Fe18Ta23W22 with an oxide layer has the potential to prevent hydrogen irradiation and withstand high temperatures.

2. Materials and Methods

2.1. Materials

A Cr-Mn-Fe-Ta-W coating was deposited on Si (100) single crystal (Zhongnuo New Material Co., Beijing, China) substrates using a magnetron sputtering system (QX-600, CHENGDU QIXING VACUUM COATING TECHNOLOGY CO., LTD, Chengdu, China) with a power of 100 W for 2 h. Before the deposition, the Si substrates were ultrasonically washed in ethanol, acetone and deionized water, respectively. The Cr-Mn-Fe-Ta-W target (99.9% in purity) was obtained by mixed smelting 20% Cr, 20% Mn, 20% Fe, 20% Ta and 20% W (at.%). The target diameter was 50.8 mm and the base pressure was 4.0 × 10⁻⁴ Pa. The atom proportion of each element in the deposited Cr-Mn-Fe-Ta-W, as determined by EDS, was 20% Cr, 17% Mn, 18% Fe, 23% Ta and 22% W. Therefore, Cr20Mn17Fe18Ta23W22 RHEA was obtained after being normalized.
Then, Cr20Mn17Fe18Ta23W22 RHEA was oxidized in a tube furnace (BTF-1700C, BEST EQUIPMENT Co., Hefei, China). The first Cr20Mn17Fe18Ta23W22 sample was oxidized at 800 °C (6.7 °C/min) for 4 h; the ratio of argon (Ar) to oxygen (O2) was 3:1 (Ar:O2 = 90 sccm:30 sccm, i.e., 3:1) and the total oxidation time was 11 h (marked as ST3). Other samples were oxidized at 300 °C (6 °C/min) for 2 h, increasing to 800 °C (5 °C/min) for 4 h; the total oxidation time was 13.5 h. The ratios of argon to oxygen were 30 sccm:30 sccm (1:1), 60 sccm:30 sccm (2:1) and 90 sccm:30 sccm (3:1), respectively. These three oxidized samples were marked as HT1 (Ar:O2 = 1:1), HT2 (Ar:O2 = 2:1) and HT3 (Ar:O2 = 3:1). The entire process was aerated until the temperature dropped to 50 °C. The device was then turned off and the air outlet was closed.

2.2. Hydrogen Ions Irradiation Experiments

Hydrogen ion irradiation experiments were conducted at the plasma surface interaction (PSI) facility in Sichuan University. The base pressure was 5 × 10⁻² Pa. Hydrogen plasma with an electron density of 1.69 × 10¹⁹ m−3 and electron temperature of 1.87 eV was obtained in a steady state. The magnetic field strength was 0.3 T and the hydrogen ion flux was 1.64 × 10²³ m−2s−1. The hydrogen energy was 60 eV by adding a −60 V bias voltage to the target during irradiation. The exposure time was 40 min, and the corresponding fluence was 3.9 × 1022 cm−2. The temperature during irradiation was about 350 °C, which was measured by a thermocouple near the specimen.

2.3. Microstructure Characterization

Phase identification was conducted by Grazing incidence (2.0°) X-ray diffraction (GIXRD, Philips X Pert Pro MPD DY129, Cu Kα source, Philips, Amsterdam, Holland), and the surface morphology and cross-section microstructures were tested using a scanning electron microscope (SEM) equipped with EDS (JSM7500F, JEOL, Tokyo, Japan). Besides, to better identify the content of O element, X-ray Photoelectron Spectroscopy (XPS, AXIS Supra, Al Kα source, Kratos, Manchester, UK) analysis was conducted. The phase and element distribution were detected by a high-resolution transmission electron microscope (HRTEM, Libra200FE, Carl Zeiss AG, Oberkochen, Germany) with an energy dispersive spectrometer (EDS), and selected area electron-diffraction (SAED). TEM samples were prepared by mechanical polishing to a thickness of ~50 μm, followed by ion milling (Leica EM RES101, Leica, Weztlar, Germany) to no more than 200 nm.
The positron annihilation Doppler broadening spectroscopy (DBS) method, which can reflect vacancy type defects, was carried out on the slow positron beam device at the Institute of High Energy Physics (IHEP) [31]. The positron energy ranged from 0.18 keV to 20.18 keV. In the DBS spectra, the S parameter conveys the vacancy defect information of the sample, and the W parameter provides precipitation information from around the positron annihilation sites [32,33]. According to the two-state capture model of positrons captured by defects,   S and W can be expressed by the following relationship:
S = 1 f S b + f S d ,
W = 1 f W b + f W d
According to Equations (1) and (2), S = R × W W b + S b could be obtained. f represents the share of positron annihilation in the defect, and S b W b and S d W d refer to the specific S and W value of the free state of the positive electron and the bound state of the defect, respectively. The slope of S W curve R = ( S d S b ) / W d W b   is only related to the defect type. Therefore, the change of defect type can be judged according to the change of slope of the S W curve.

3. Results and Discussion

3.1. Microstructures of the Deposited Cr20Mn17Fe18Ta23W22 RHEA

The GIXRD pattern of Cr20Mn17Fe18Ta23W22 RHEA revealed that the structure of the as-deposited Cr20Mn17Fe18Ta23W22 was a BCC phase (Figure 1a). Additionally, the BCC peak had a significant broadening as the grain of Cr20Mn17Fe18Ta23W22 RHEA was nanocrystalline and the grain size was ~9 nm. Therefore, it could be deduced that there were lots of grain boundaries due to the small nanocrystals, and that these boundaries could provide channels for element diffusion and promote the oxidation process. The surface morphology of the as-deposited specimen was smooth and intact, and the thickness was ~1.07 μm (Figure 1b,c). Additionally, it was found that the five elements in Cr20Mn17Fe18Ta23W22 were evenly distributed according to the EDS mapping results shown in Figure 2.

3.2. Oxidation of Cr20Mn17Fe18Ta23W22 RHEA

Figure 3 shows SEM images of Cr20Mn17Fe18Ta23W22 after oxidization at 800 °C (6.7 °C/min) for 4 h (ST3). Lots of spallation emerged on the surface as shown in Figure 3a,b. Besides, according to Figure 3c, it can be found that there are lots of pores in the c region of Figure 3b. To investigate the element content of the oxide layer on the surface, EDS and XPS were conducted, as shown in Table 1. The depth of the EDS test reached ~1μm of the samples, but the oxygen content could not be measured accurately by EDS due to the light atomic weight of the element, so the relative content of each metal element was obtained by subtracting the O content and then normalizing. Additionally, to investigate the O content, an XPS test was conducted. However, the XPS test could only reach a depth of several nanometers, so the results only reflected the outermost oxide layers of the samples, and one or several kinds of oxides could be identified. Combined with the EDS and XPS results, it could be deduced that lots of O was distributed on the surface, and that the oxides mainly consisted of Mn, Fe and Cr oxides, with Mn oxides being distributed on the outermost layer.
The cross-sectional images in Figure 4a–c shows that the thickness of the oxidized coating increased to ~1.93 μm, and the spallation was mainly composed of the oxidation scale. Besides, most oxidation scales presented as irregular polygons, especially columnar polygons. Additionally, according to the EDS line scan in Figure 4d–i, most of the Mn was distributed on the outer surface, followed by Fe and Cr, while Ta and W stayed at the bottom (Mn-Fe-Cr rich region: ~0.75 μm, Ta-W rich region: ~1.18 μm). The Pauling electronegativity of each alloy is shown in Table 2. Generally, metallic elements with lower electronegativity values tend to be oxidized first; as such, the order of oxidation would be Ta, Mn, Cr, Fe and W. However, our results were not completely consistent with this trend. Ta and W were distributed as expected, i.e., the bottom layer, while Mn, Fe, Cr and O were distributed on the surface. This is ascribed to Ta and W, as the refractory metallic elements with a high melting point are not easy to spread. Meanwhile, Mn, Fe and Cr diffuse more rapidly [25], and the related oxides form as a barrier, further hindering the oxidation of Ta and W. After more and more oxide of Mn, Fe and Cr formed, the volume expansion of each oxide was different, which inevitably led to the generation of internal stress in a tension or compression way, ultimately leading to spallation.
Based on the analysis above, it was found that the oxidation process of Cr20Mn17Fe18Ta23W22 RHEA was mainly controlled by the outward diffusion of metal cations in the alloy and oxides. Additionally, numerous pores formed in the Ta-W layer adjacent to the Mn-Fe-Cr oxide scale (Figure 3c). This was attributed to the vacancies generated by the rapid diffusion of Mn, Fe and Cr ions, combining to form pores [34,35]. Thus Mn, Fe and Cr were depleted in the Ta-W layer. Moreover, pores and cracks created the main channels for element diffusion and accelerated the oxidation process [36].
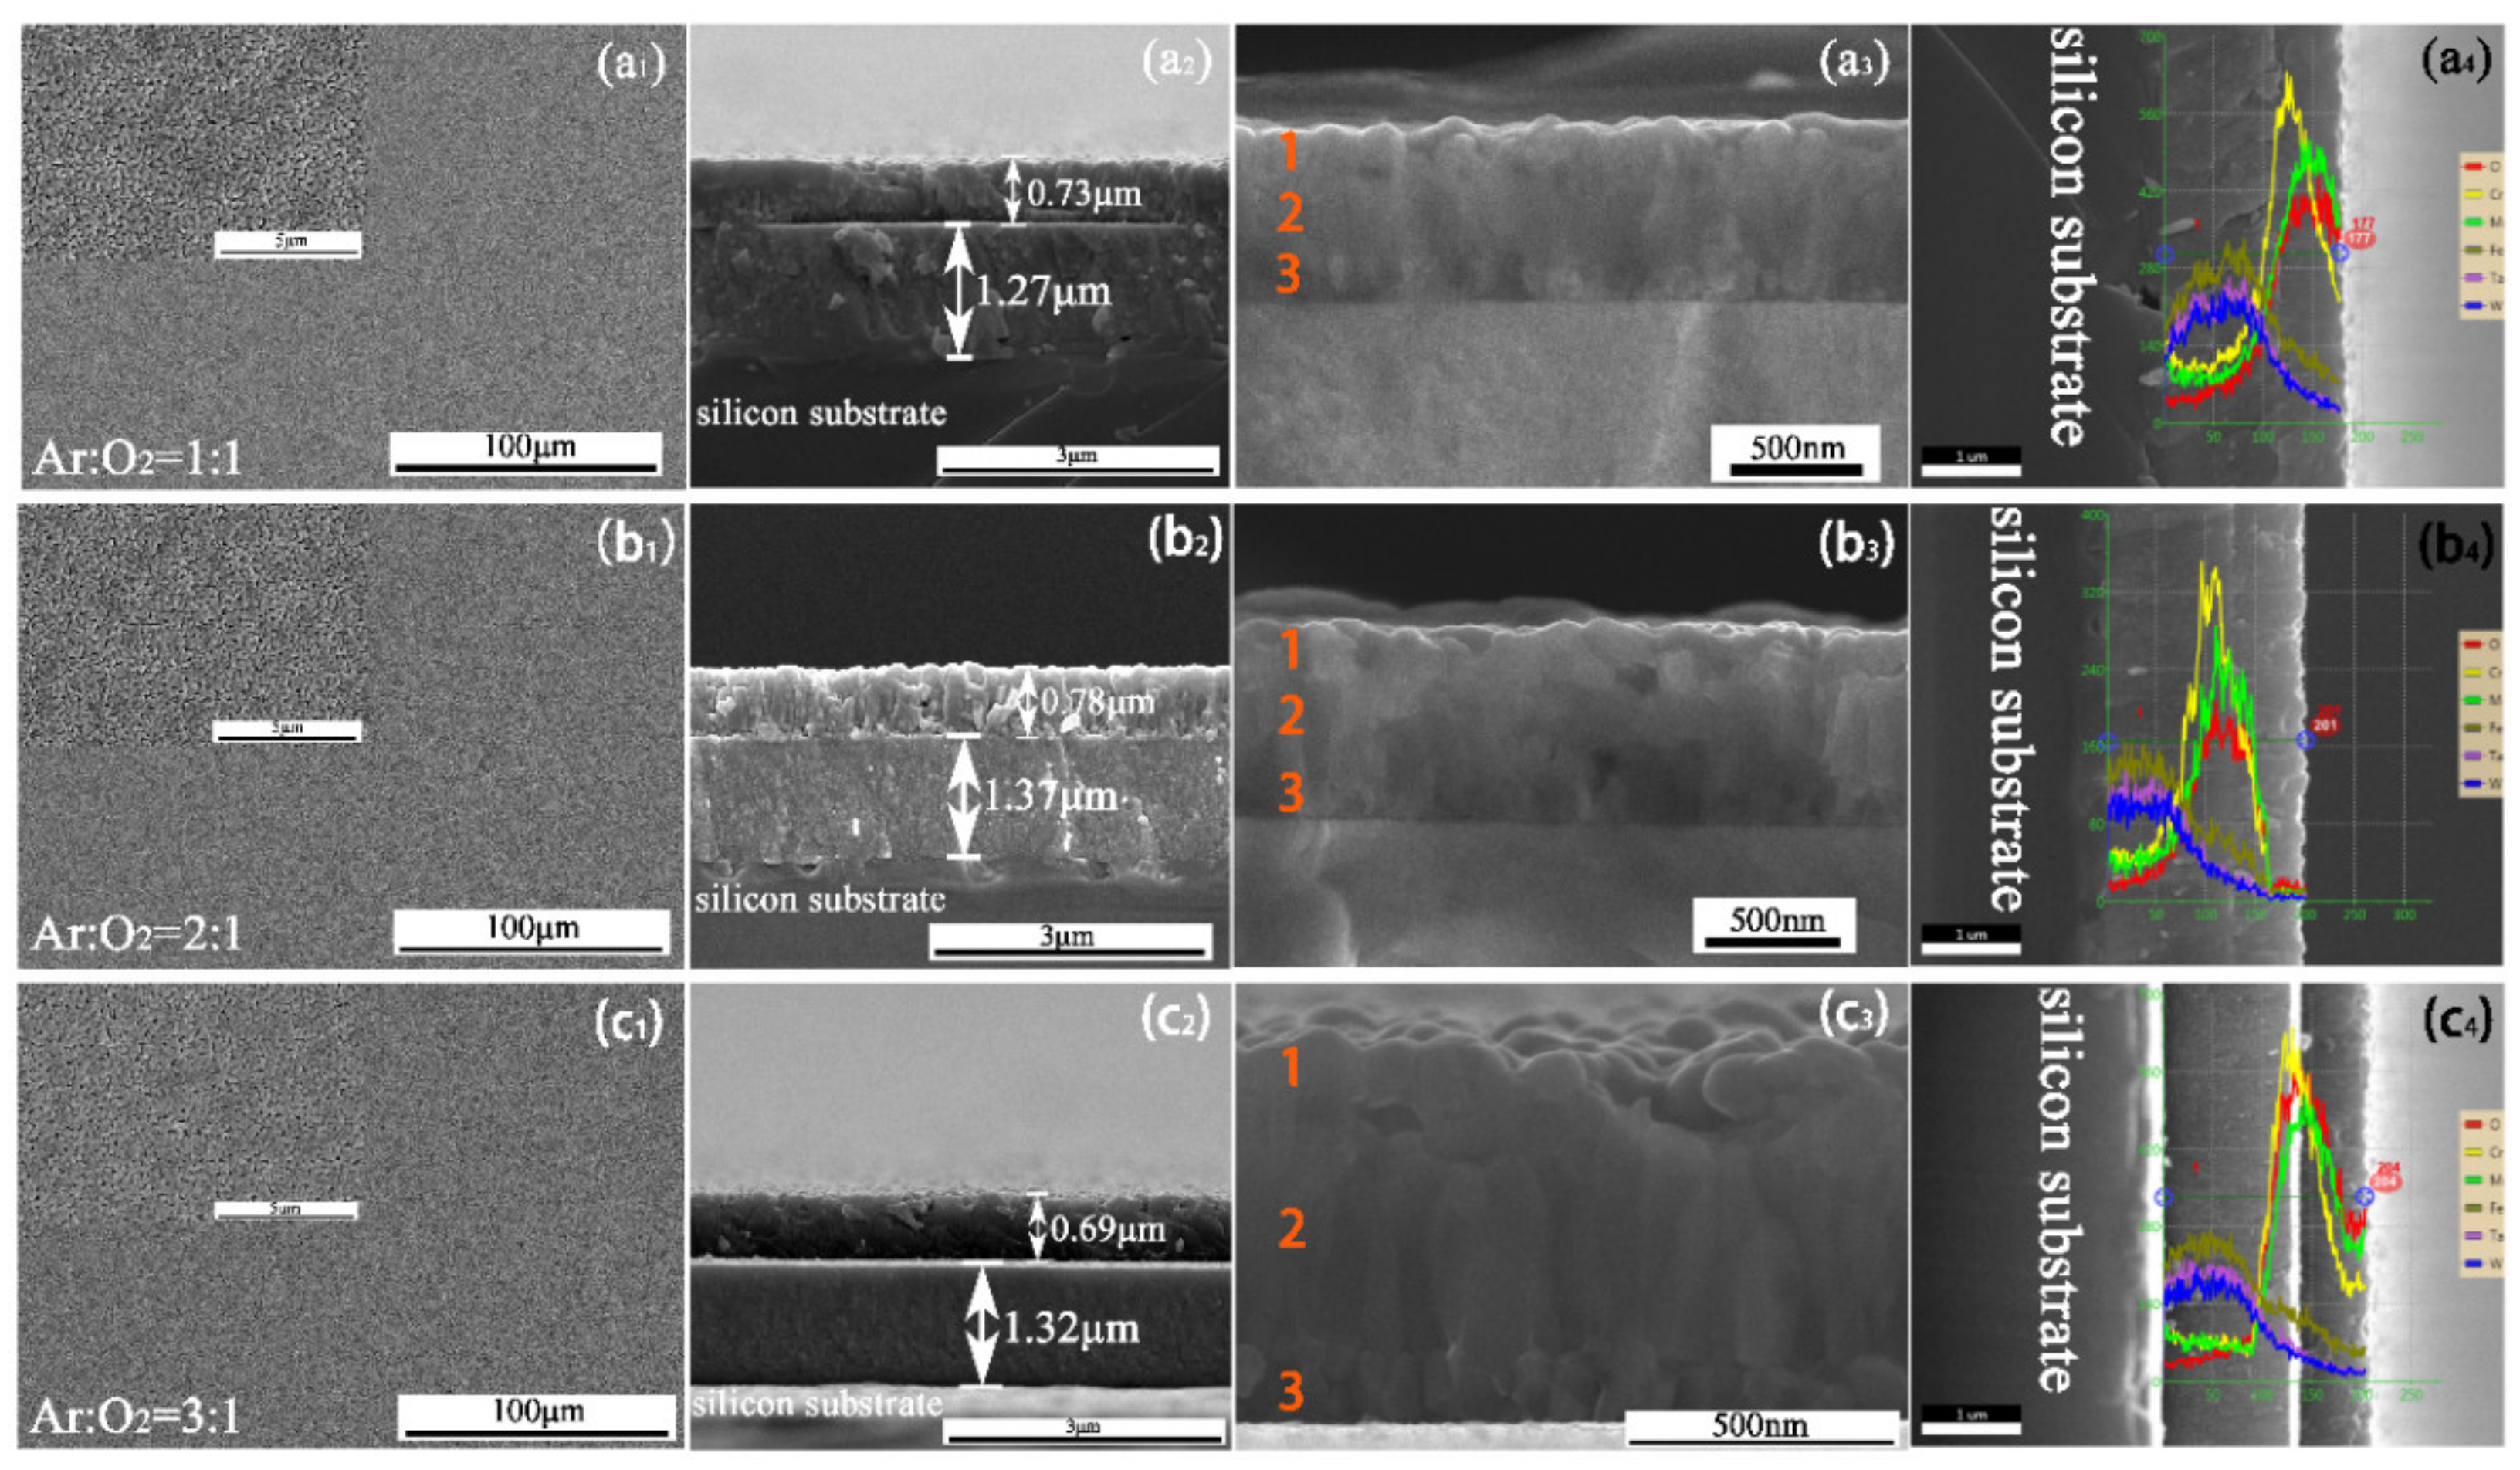
To improve the spalling phenomena, the heating process was changed. Figure 5 exhibits the surface and cross-section topographies of specimens oxidized at 300 °C for 2 h, and then increased to 800 °C for 4 h. The ratios of argon to oxygen were 3:1, 2:1, 1:1 in the HT1, HT2 and HT3 samples, respectively. No obvious spalling or cracks on the oxide scale were observed, but lots of tiny voids were distributed on the outer surface according to the high magnification shown in Figure 5(a1–c1), which could facilitate the entry of oxygen. According to Figure 5(a2–c2), the thickness of the three coatings, i.e., those on HT1, HT2 and HT3, were ~2 μm (oxidation layer: ~0.73 μm, bottom layer: ~1.27 μm), 2.15 μm (oxidation layer: ~0.78 μm, bottom layer: ~1.37 μm) and 2.01 μm (oxidation layer: ~0.69 μm, bottom layer ~1.32 μm), respectively (Figure 5(a2–c2)). The oxide scale present in Figure 5(a3–c3) may be divided into three regions (marked as 1, 2 and 3, respectively). The superficial oxide layer (1) presented a granular structure, the middle layer (2) was columnar, and the bottom oxide layer (3), which connected the Fe-Ta-W layer, presented as polygonal prisms.
To investigate the distribution of elements, EDS line scans were conducted. Figure 5(a4–c4) reveals that most Mn was distributed on the outer surface, followed by Cr, while most O was distributed in the Mn-Cr-rich layer. The distribution trends of Fe, Ta and W were consistent, i.e., these elements stayed in the bottom layer. Table 3 lists the contents of each element on the surface of HT1, HT2 and HT3. The analysis method was similar to that used in Table 1. Combined with the EDS and XPS results, it can be deduced that lots of O was distributed on the surfaces of the HT1, HT2 and HT3 samples. The oxides mainly consisted of Mn and Cr oxides, although Mn oxides were also distributed in the outermost layer.
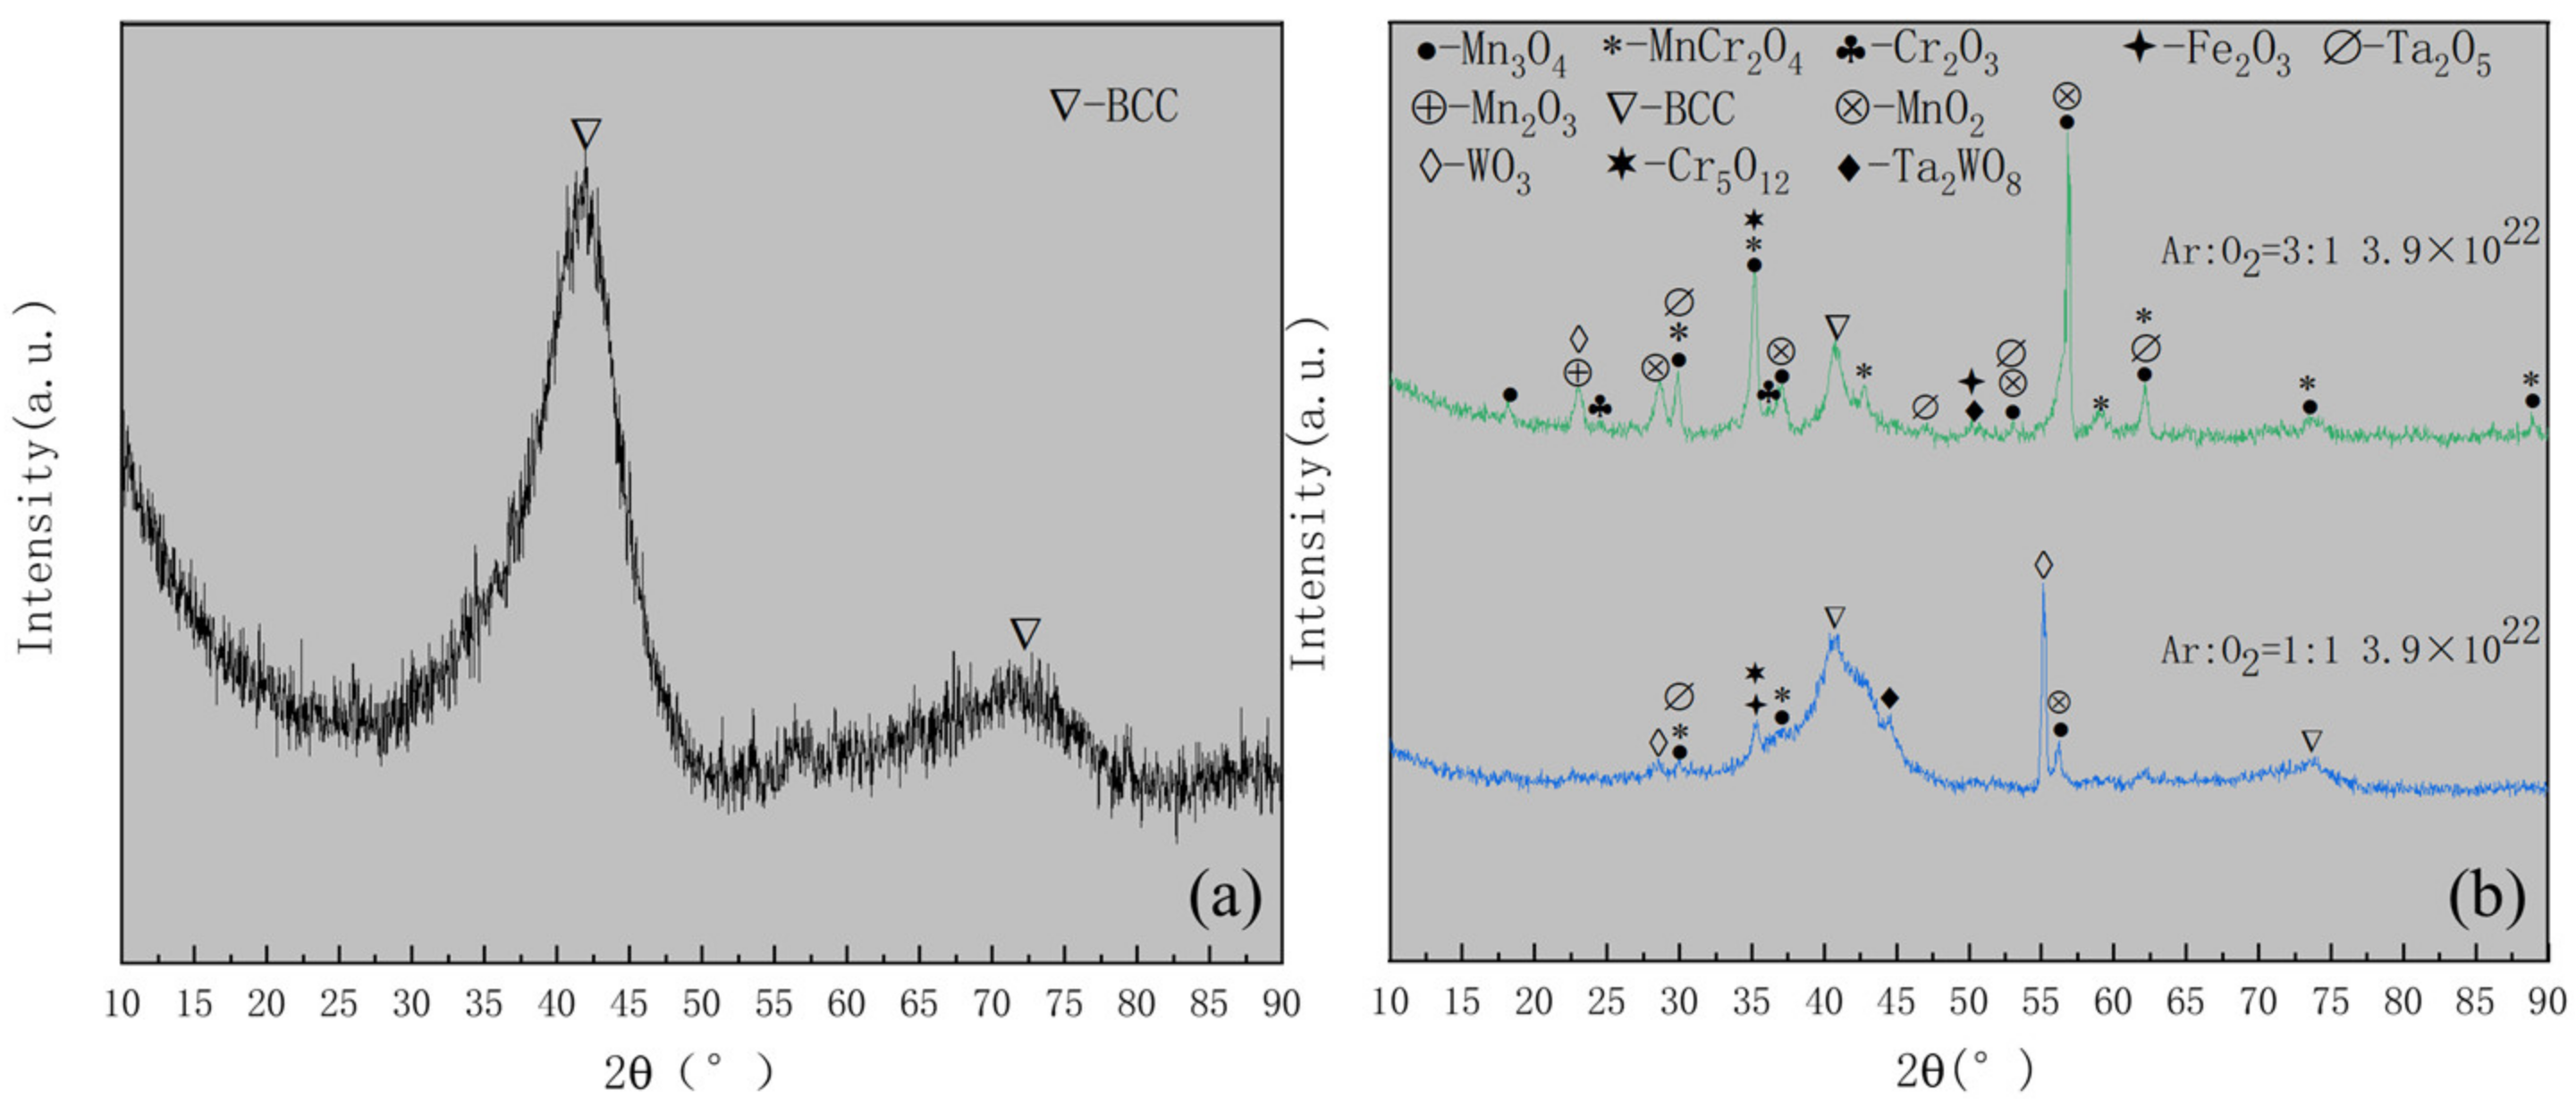
The GIXRD pattern of the ST3 specimen is shown in Figure 6a. Combined with the EDS line scan results (Figure 4d–i), it can be deduced that the oxides mainly comprised of Mn2O3, FeMnO3, Fe2O3, Cr2O3 and Cr5O12.Few WO3, MnWO4 and Ta2O5. Figure 6b shows the GIXRD patterns of the other three samples, i.e., HT1, HT2 and HT3 respectively. Combining with EDS line scan results (Figure 5(a4–c4)), the oxides of the three samples were shown to mainly contain MnO2, Mn3O4, Mn2O3, MnCr2O4, Cr2O3 and Cr5O12, and small amounts of Fe2O3, Fe2WO6, Ta2O5, WO3 and Ta2WO8. Compared with ST3 and HT1, the BCC phase was detected in HT2 and HT3, illustrating that the degrees of oxidation were not as strong as those of ST3 and HT1. The peak intensity of the BCC phase in HT3 surpassed that of HT2. Additionally, Cr2O3 in HT3, as the predecessor of Cr5O12, emerged more than HT2. This indicated that the degree of oxidation decreased as the ratio of argon to oxygen increased.
Therefore, it was found that under the two different heating procedures, different oxidation degrees and oxide products were obtained, and the distribution of Fe was different. These two heating procedures reflect two different oxidation rates of Cr20Mn17Fe18-Ta23W22 RHEA, as determined by calculating the unit time variation of film thickness before and after oxidation. Representative samples were ST3 and HT3, which were both under the same gas environment, i.e., Ar:O2 = 3:1. To compare the effects of different oxidation rates on oxidation behavior, we further studied microstructural differences in ST3 and HT3 more precisely through TEM.
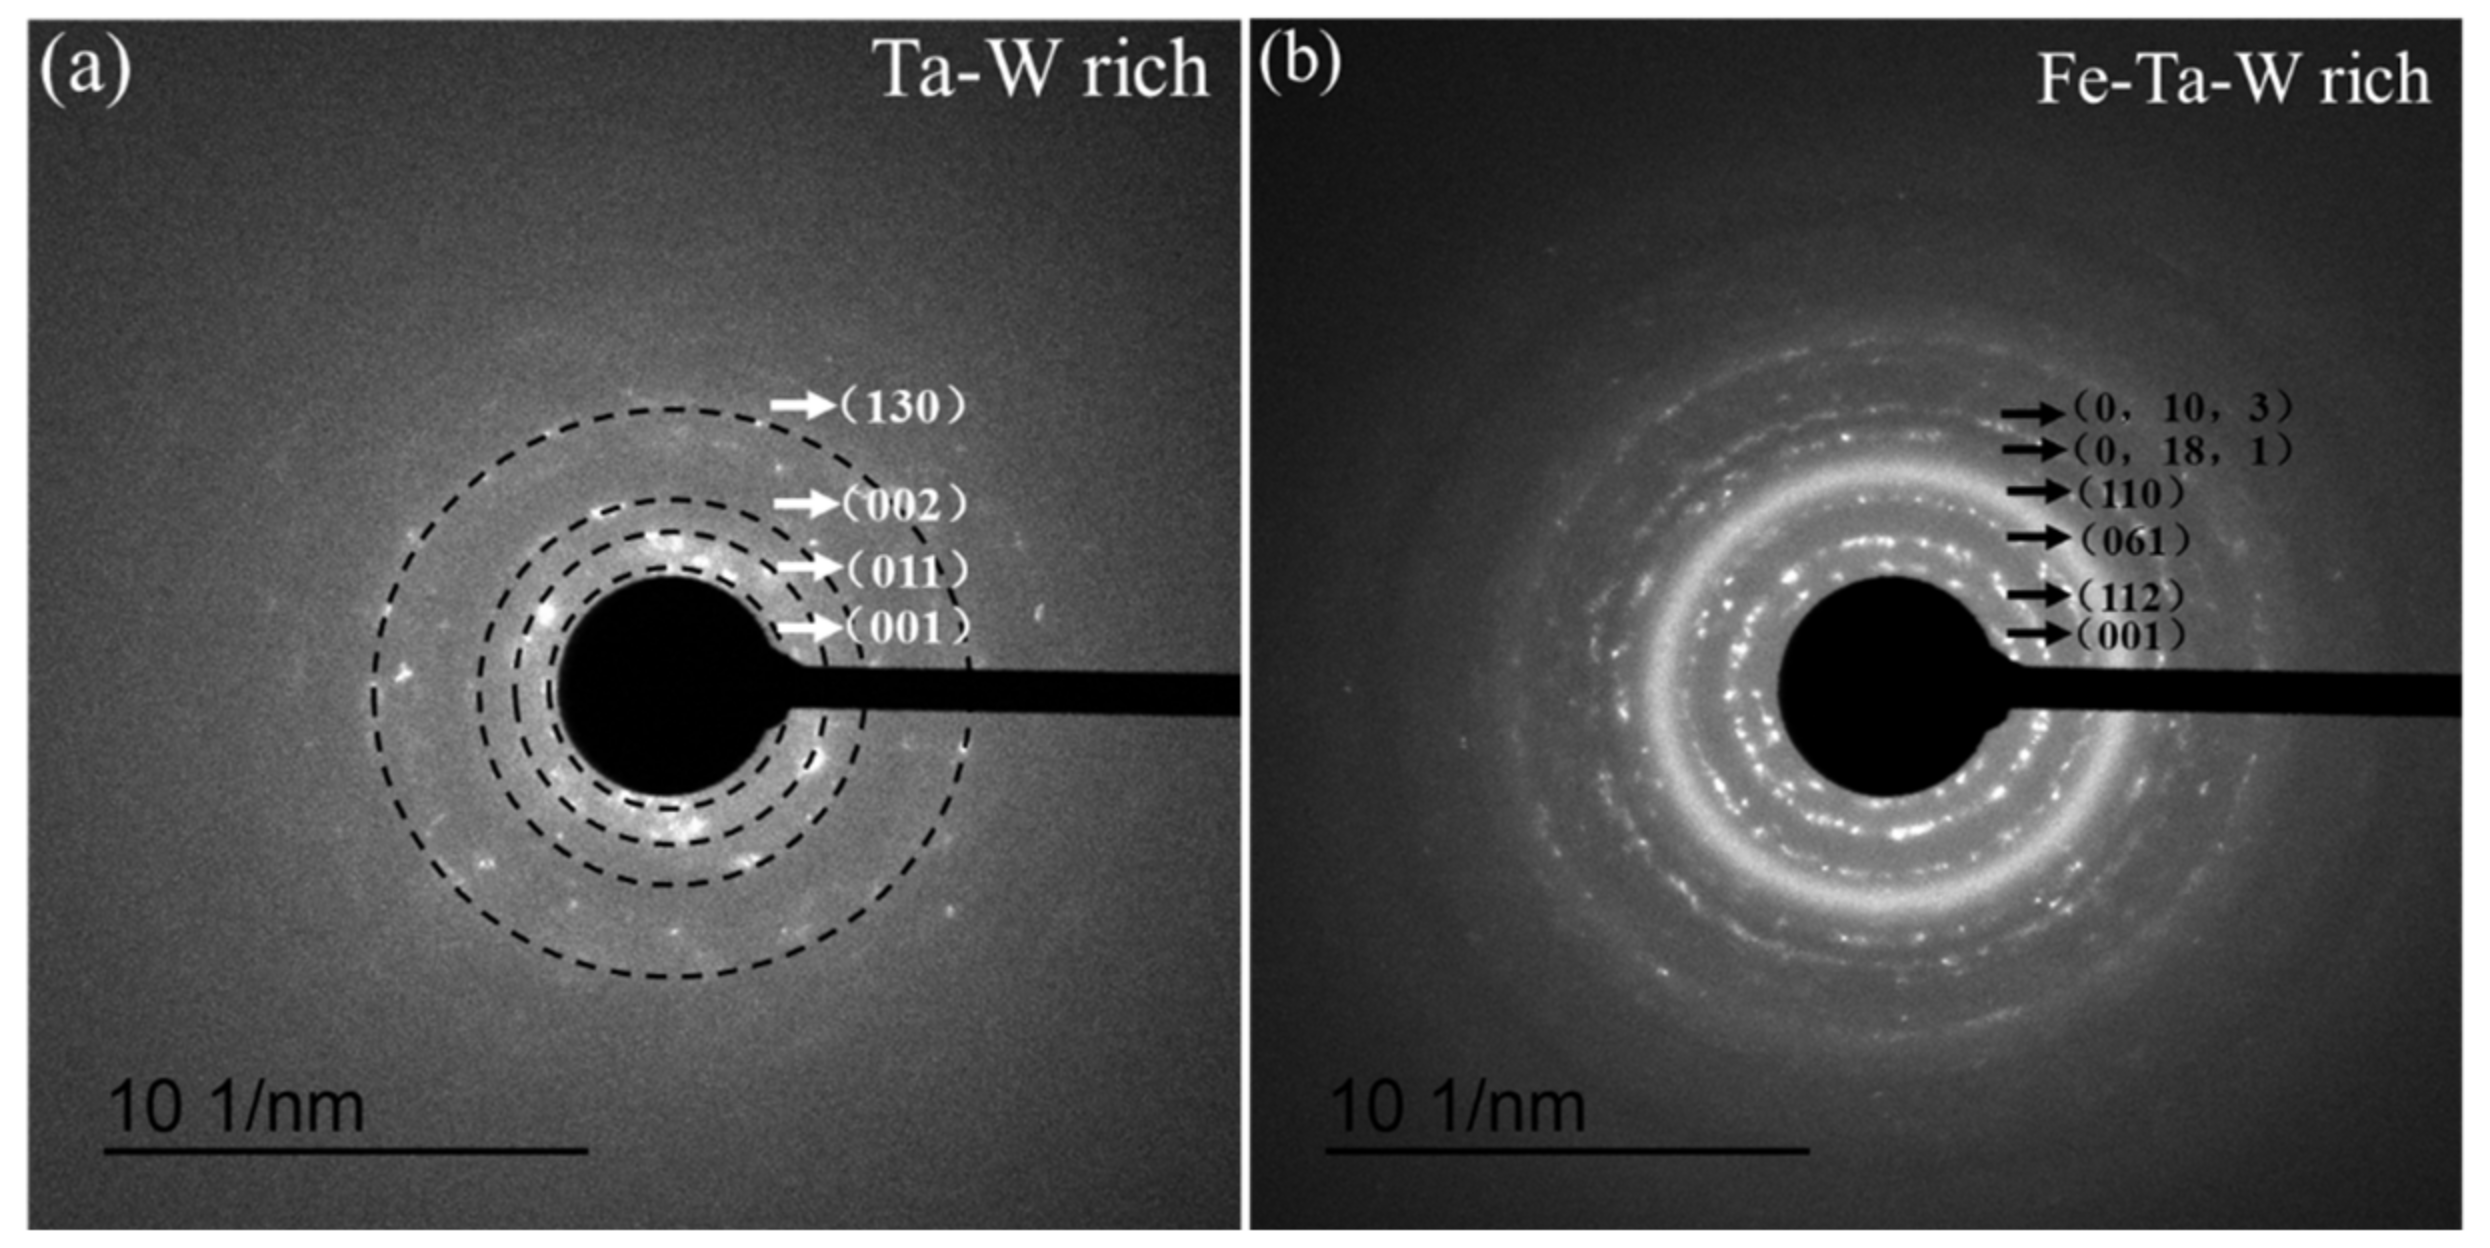
Figure 7a,c is the cross-sectional HAADF images of ST3 and HT3 samples, while Figure 7b,d presents the EDS-mapping images of ST3 and HT3 samples. The results of EDS-mapping about the distribution of each element in ST3 sample are consistent with the EDS line scan results in Figure 4d–i. Most O was distributed in the Mn-Fe-Cr layer, although a little was present in the Ta-W layer. The SAED pattern of the Ta-W rich layer in ST3 is shown in Figure 8a. This demonstrates that WO3 ((001) and (011)) and MnWO4 ((002) and (130)) existed in the Ta-W rich layer, which was consistent with the XRD result (Figure 6a).
Therefore, it can be deduced that during the oxidation process of ST3, the diffusion of Mn was fastest in Cr20Mn17Fe18Ta23W22 RHEA, followed by Cr and Fe, due to DMn > DCr ≈ DFe [25], as such, MnxOy formed at first. As the inner diffusion of oxygen and the Pauling electronegativity of Cr are lower than that of Fe (Table 2), CrxOy also formed. The diffusion rates of metal ions through chromium oxide are DMn > DFe > DCr [37,38]. Therefore, Fe would have diffused through CrxOy and formed FexOy. A little TaxOy and WxOy formed due to the inner diffusion of oxygen, and a small amount of MnWO4 formed by MnO reacting with WO3.
In HT3, most O clustered in the Mn-Cr-rich zone, although a little was present in the Fe-Ta-W layer (Figure 7d). WO3 (001) and (112), Fe2WO6 (061), Ta2O5 (0,18,1) and Ta2WO8 (0,10,3) existed in the Fe-Ta-W rich layer of HT3, according to the SAED result presented in Figure 8b. BCC (110) was also detected in the Fe-Ta-W rich area. This is consistent with EDS and XRD results shown above.
Combined with the GIXRD, EDS line scans, EDS mapping and the SAED and HRTEM results, it can be concluded that for HT3, Mn diffused firstly in Cr20Mn17Fe18Ta23W22 RHEA and formed MnxOy, before CrxOy was formed. This process is the same as that observed in ST3. However, the heating process remained at 300 °C and the oxidation rate slowed down, which may have facilitate the rapid formation of MnCr2O4. A MnCr2O4 spinel could act as a protective coating to prevent the diffusion of Fe3+ or Fe2+ and restrict the formation of Fe oxide.
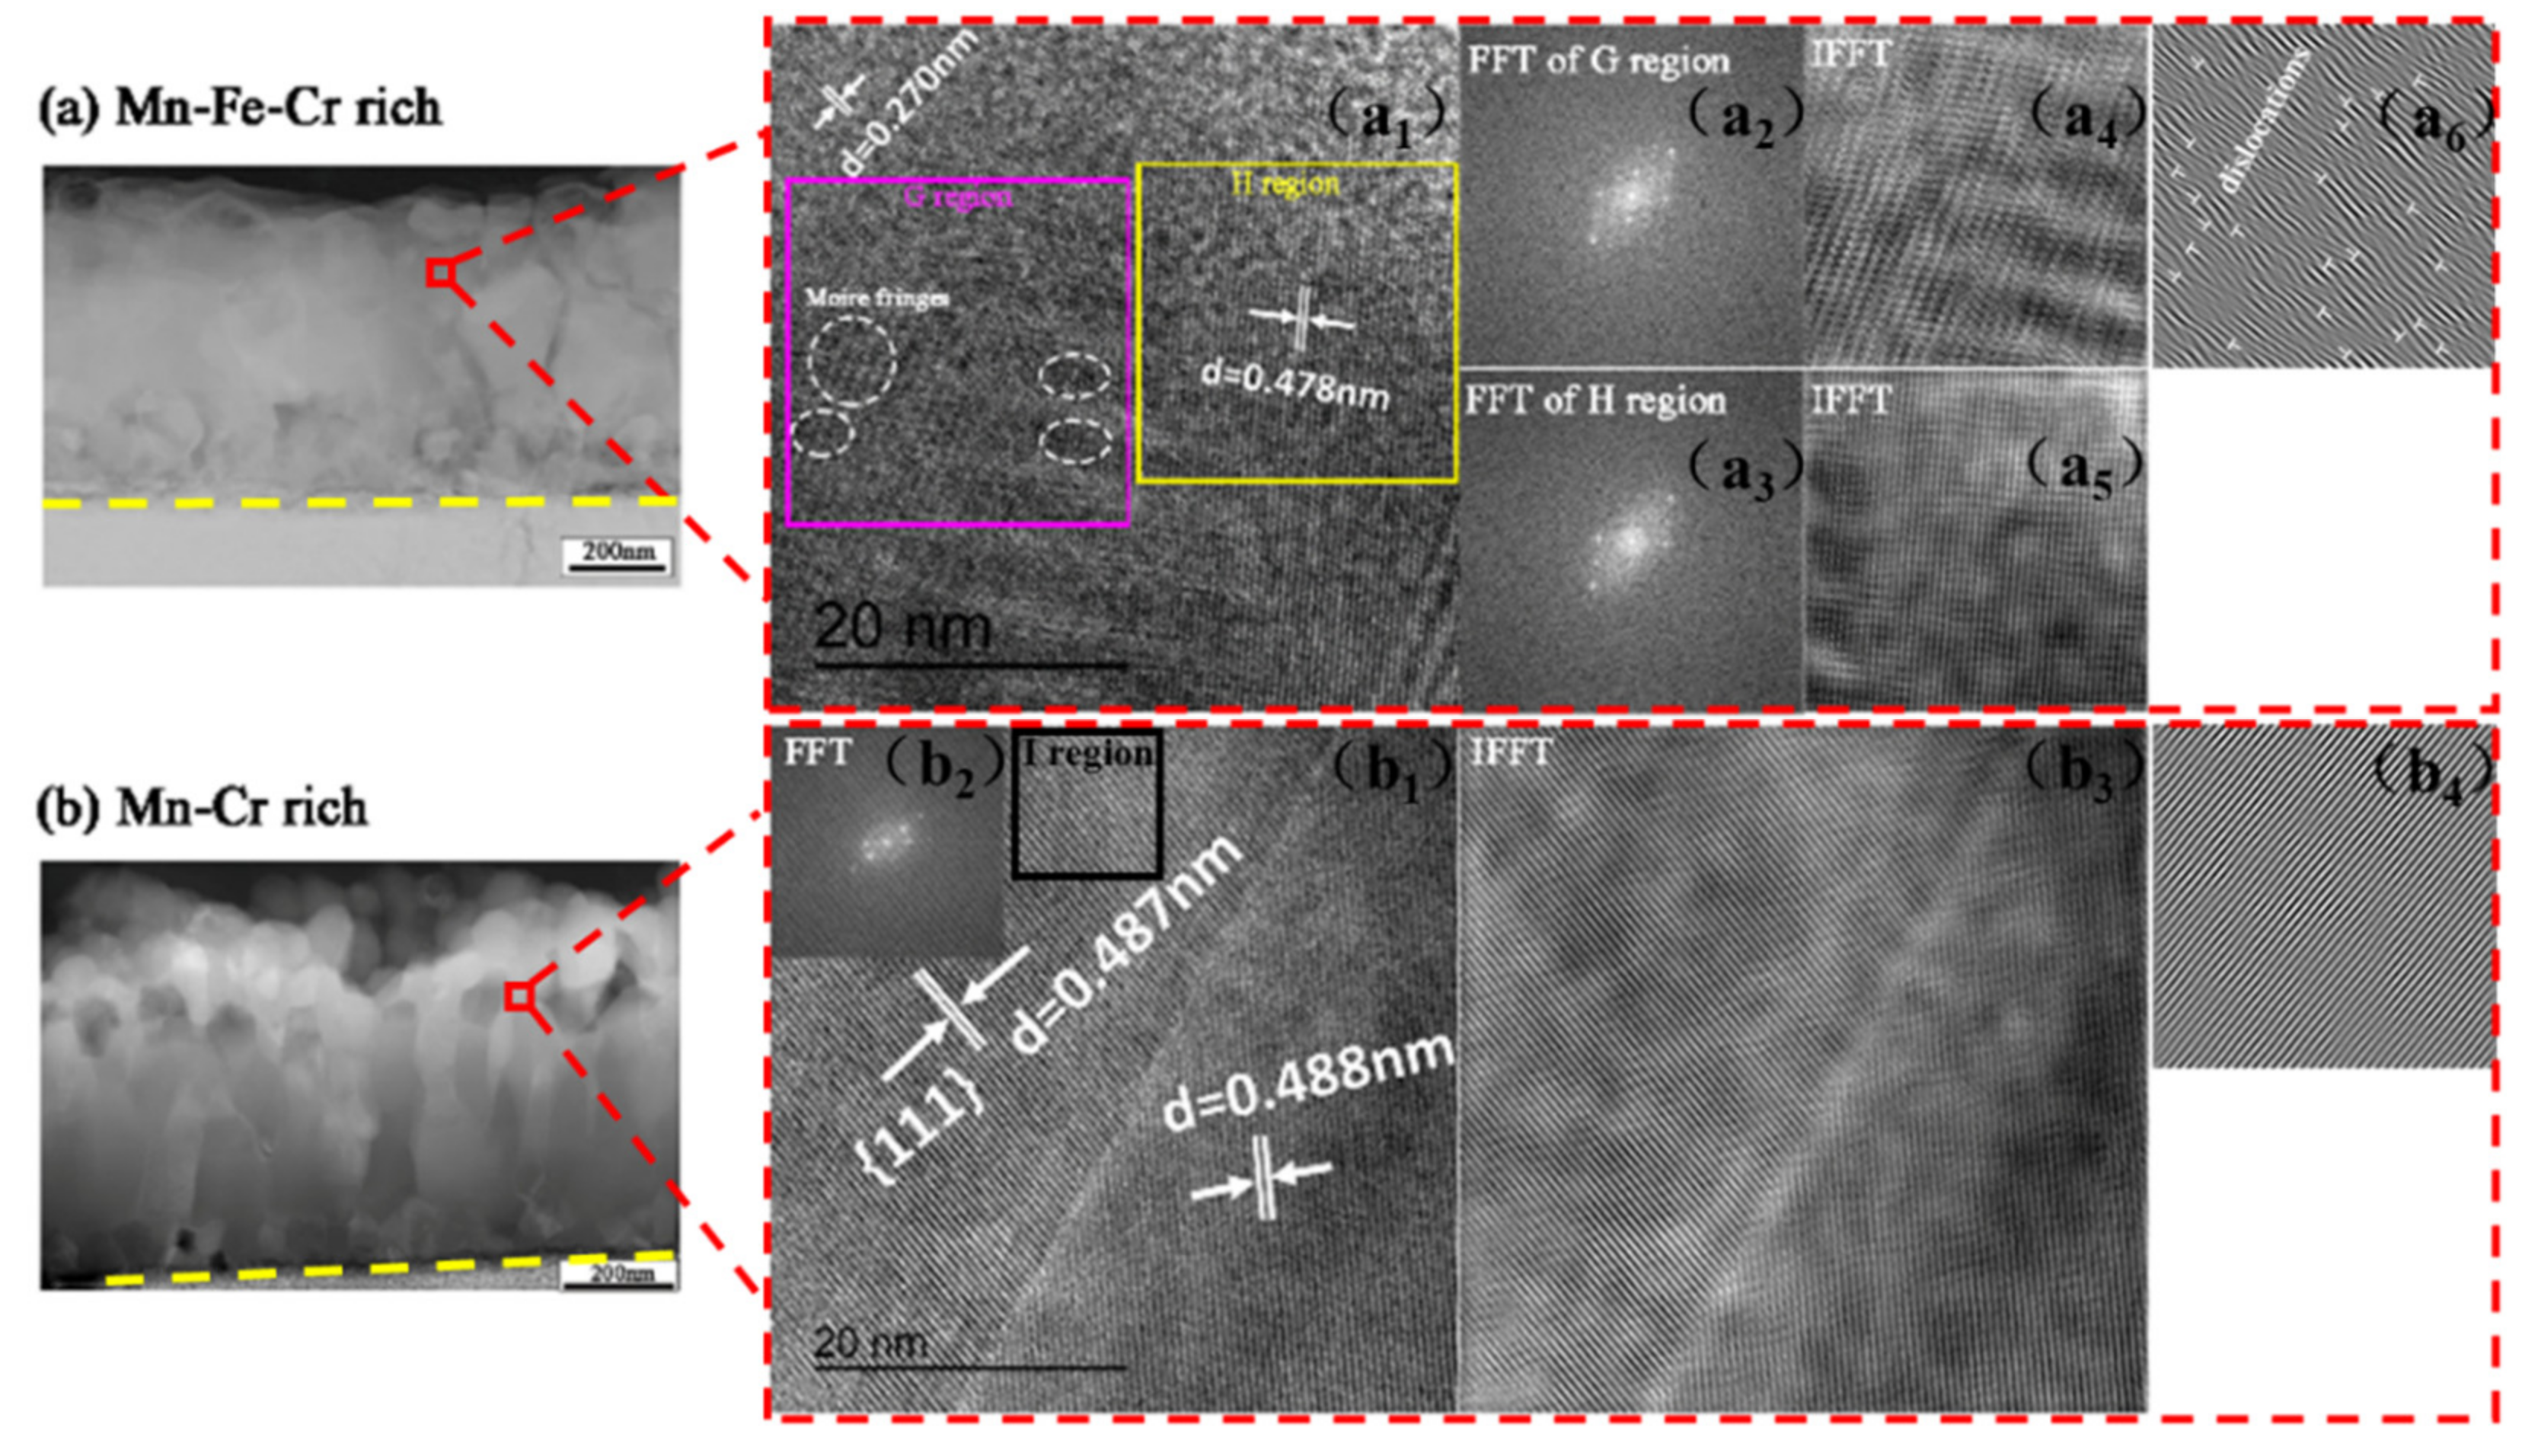
Figure 9a,b shows HAADF and HRTEM images of the oxide scales of ST3 and HT3. As shown in Figure 9(a2), a double lattice appeared, like a “satellite spot”, and lots of moire fringes distributed in the G region. Furthermore, plenty of edge dislocations and lattice distortion existed in the G region after oxidation, as shown in Figure 9(a6), while in the H region, the grain spacing was clear, and no moire fringes and little lattice distortion were observed. To a certain extent, this revealed that after some oxidation scale had peeled off in the form of flakes (see Figure 3), stress was released and lots of twisted lattice fringes and edge dislocations stayed. It can be inferred that during the oxidation process, the growth stress and the relatively high thermal stress resulted in a high density of dislocation close to the material surface. In turn, these defects accelerated oxidation [39]. In addition, we report that the activation energy of the diffusion element along the dislocation decreased to 1/2 that of the body diffusion [40]. This also explains the higher oxidation rates observed with ST3 compared to HT1, HT2 and HT3.
According to Figure 9(b1,b2), which present HRTEM and FFT images of the selected region in Figure 9b, the grain was polycrystal. Combined with the XRD results (Figure 6), it could be deduced that the grain comprised MnCr2O4 ({111}) polycrystals. Compared with ST3 sample, there were no moire fringes, edge dislocations or lattice distortion in the polycrystals according to the IFFT (b3) and IFFT (b4) filters, and the dislocation density was relatively low.

3.3. Oxidized Cr20Mn17Fe18Ta23W22 Irradiated with Hydrogen Ions (60 eV)

Based on the analysis above, HT1 (Ar:O2 = 1:1) and HT3 (Ar:O2 = 3:1) were chosen to study the hydrogen permeation resistance properties after the oxidation of Cr20Mn17Fe18Ta23W22; these represent two extreme oxidation degrees under the same heating procedure. Figure 10 shows the GIXRD patterns of Cr20Mn17Fe18Ta23W22, HT1 and HT3 specimens irradiated with a fluence of 3.9 × 1022 cm−2 hydrogen ions (60 eV). Compared with Figure 1a, it may be seen that the phase of Cr20Mn17Fe18Ta23W22 was stable after irradiation with hydrogen ions (Figure 10a). However, comparing the GIXRD results of the original HT1 and HT3 samples in Figure 6b, it can be found that HT1 underwent a remarkable change after irradiation (see Figure 10b), i.e., Mn2O3 disappeared, a BCC peak appeared, and some diffraction peaks of other oxides also largely disappeared, indicating that HT1 had undergone hydrogen reduction to a large extent. Zhang et al. [41] reported that high entropy alloys exhibit stronger activation than pure metals under hydrogen exposure, and that the oxides on the surface of HEA are easily reduced. This is consistent with our results. However, for HT3 irradiated with hydrogen ions, no oxide disappeared, but rather, only the diffraction peak intensities of some oxides changed, while the diffraction peak of BCC phase became slightly stronger (Figure 10b), indicating that there was a certain degree of hydrogen reduction, albeit not as significant as that observed with HT1. This may have been due to the presence of Cr2O3 in HT3, as Cr2O3 has good hydrogen permeation resistance properties [42]. Therefore, it can be considered that the oxides on the surface of HT3 were more stable and had better hydrogen permeation resistance than those on the surface of HT1.
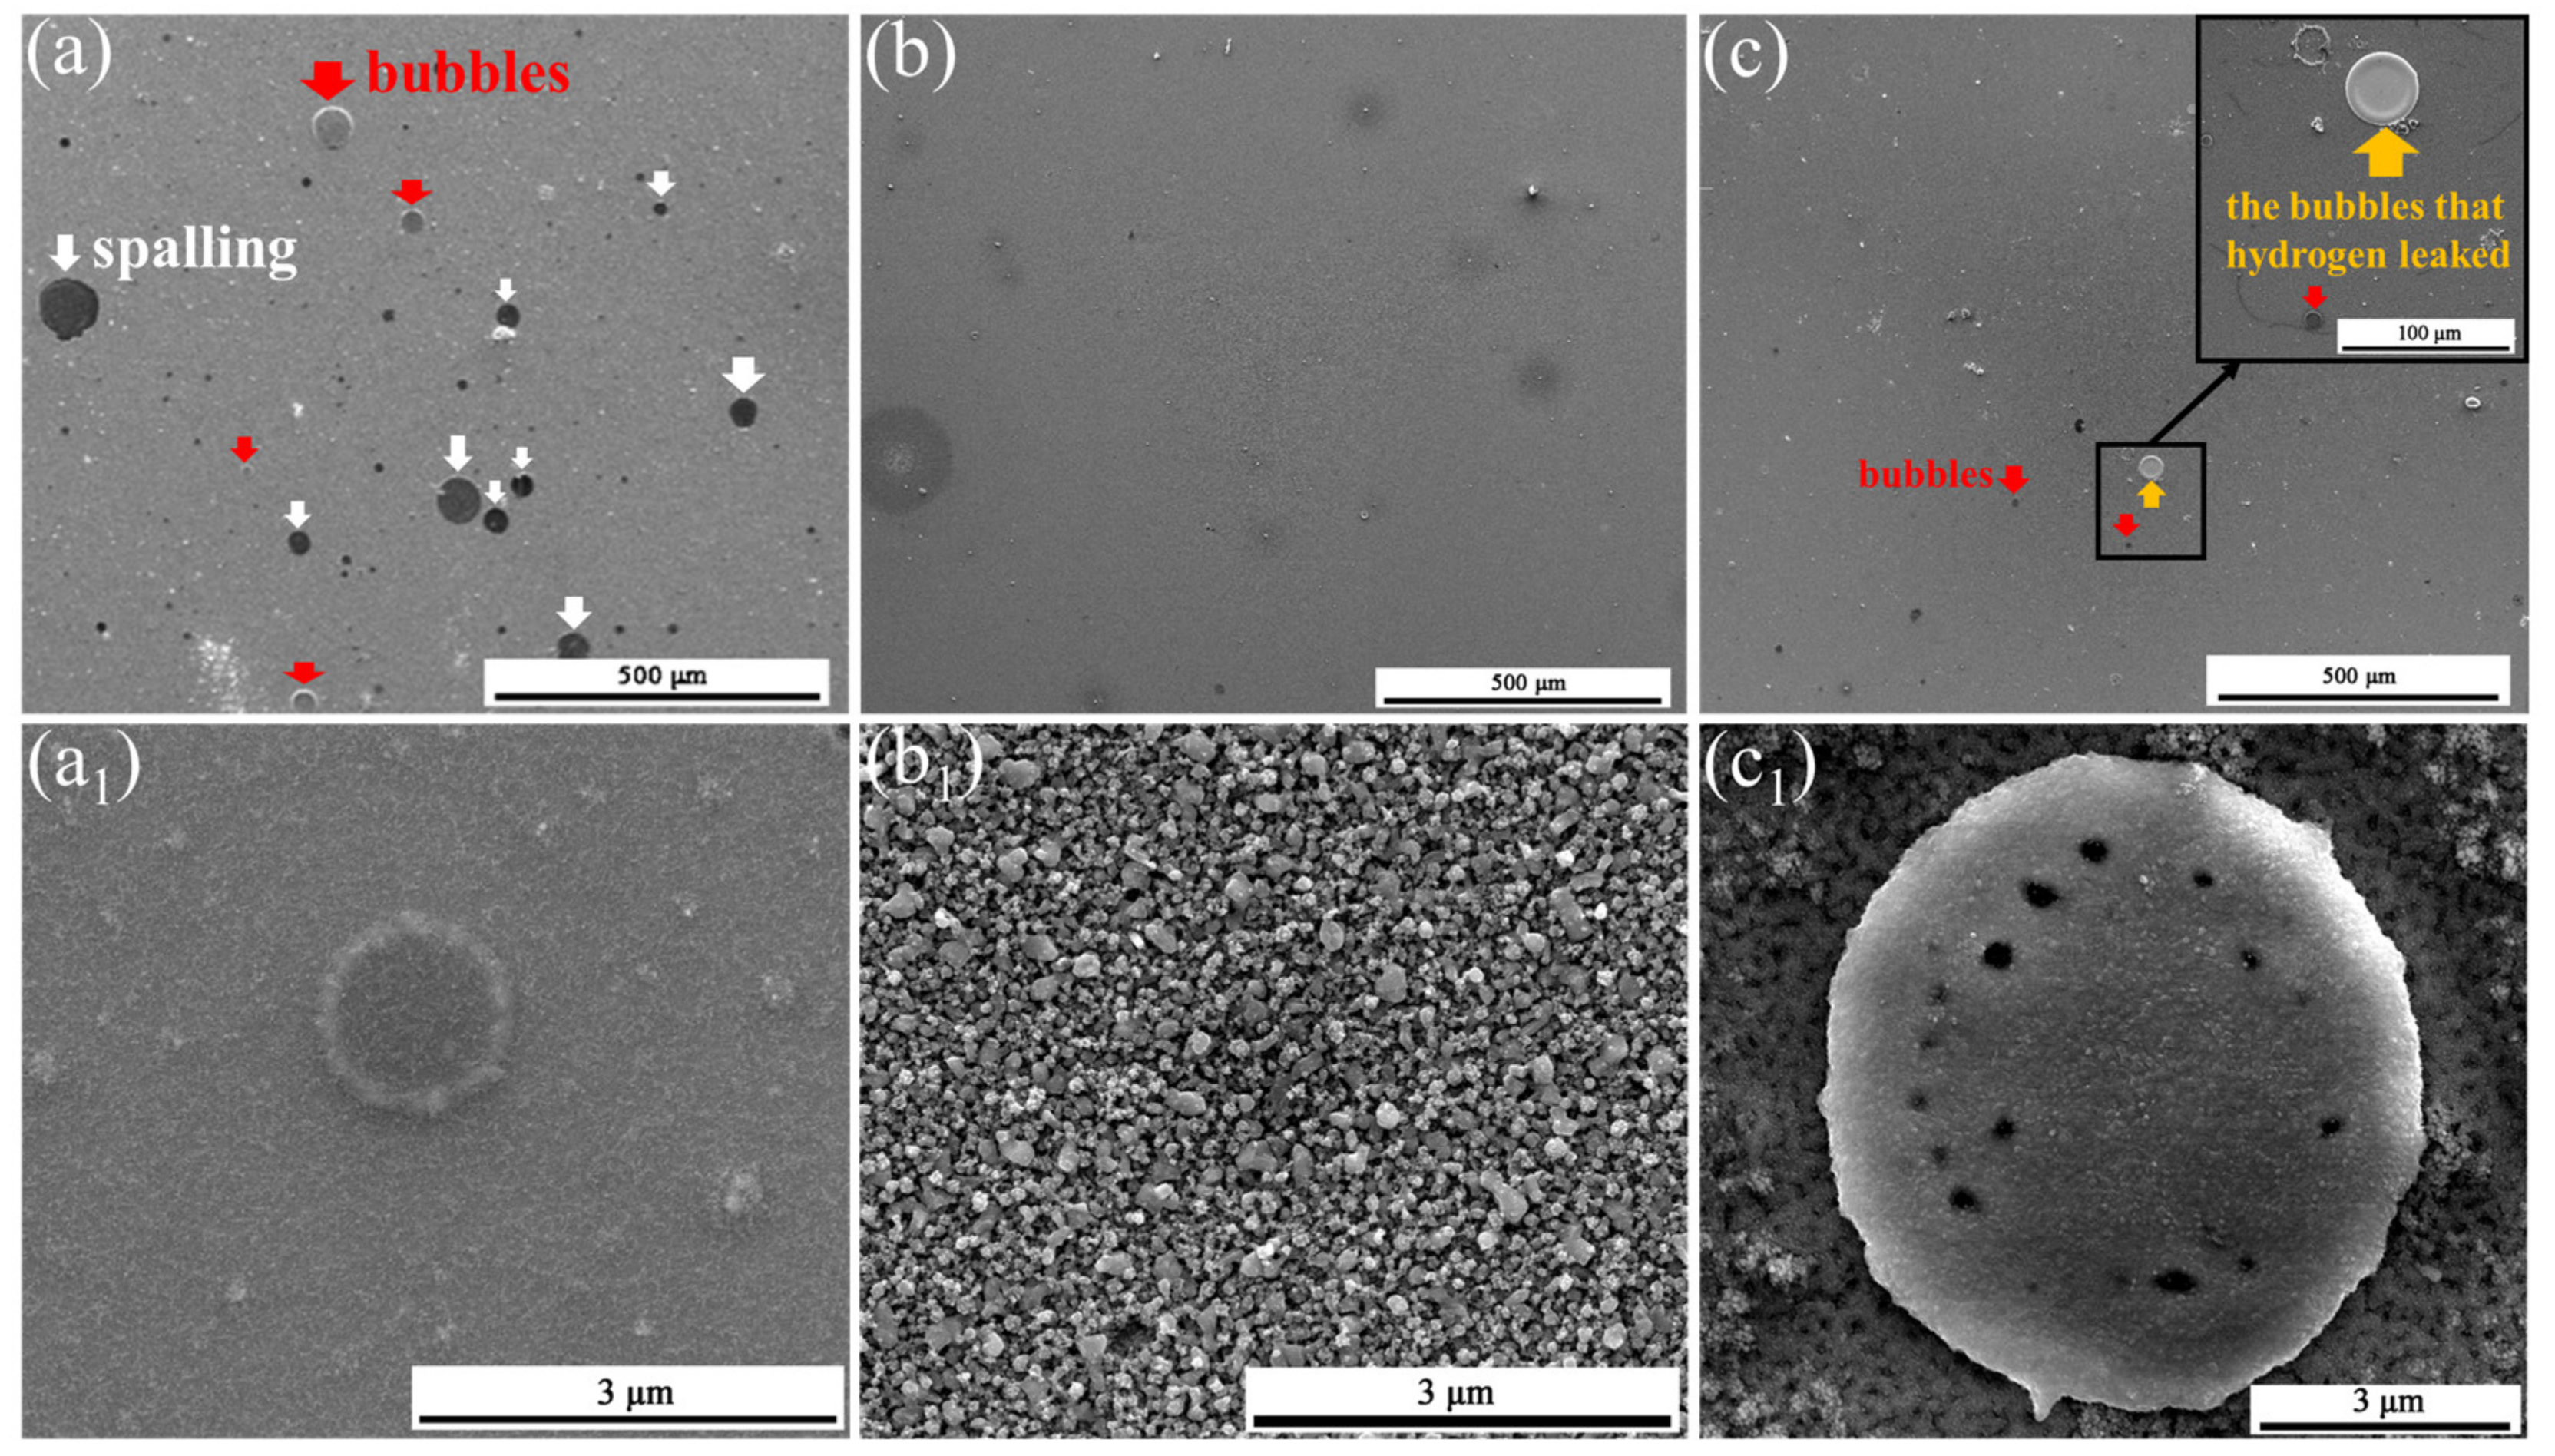
Figure 11 presents surface SEM images of Cr20Mn17Fe18Ta23W22, HT1 and HT3 irradiated with hydrogen ions. Compared with the surface SEM images of the original samples (Figure 3), it can be seen that lots of bubbles and spalling appeared on the surface of Cr20Mn17Fe18Ta23W22 after irradiation, and a shallow layer of fuzz was observed, as shown in Figure 11(a1). This may have been caused by the formation and breakup of tiny hydrogen bubbles. According to Figure 11b, no bubbles or spalling were observed on irradiated HT1, while the morphology of the particles on the surface changed compared with that in Figure 5(a1). This was consistent with the GIXRD result presented in Figure 10b, i.e., most oxides on the HT1 samples were reduced by hydrogen. Figure 11(c,c1) shows surface images of irradiated HT3. It can be seen that few bubbles emerged on HT3 after irradiation. Comparing Figure 11(c1) with Figure 5(c1) and Figure 11(b1), it can be seen that the morphology of the particles on the surface of irradiated HT3 did not change much; this was also consistent with the GIXRD result, in which few oxides on irradiated HT3 were shown to be reduced.
To investigate the evolution of vacancy-type defects of Cr20Mn17Fe18Ta23W22, HT1 and HT3 specimens before and after hydrogen ion irradiation, slow positron annihilation spectra were recorded. Generally, the higher the positron energy, the deeper it entered into the sample. The vacancy/vacancy cluster and H-V complex/hydrogen bubbles could be detected by PAS. The H-V complex formed due to some vacancies that would be trapped by hydrogen during hydrogen bombardment, and the H-V complex could also absorb more hydrogen and form hydrogen bubbles.
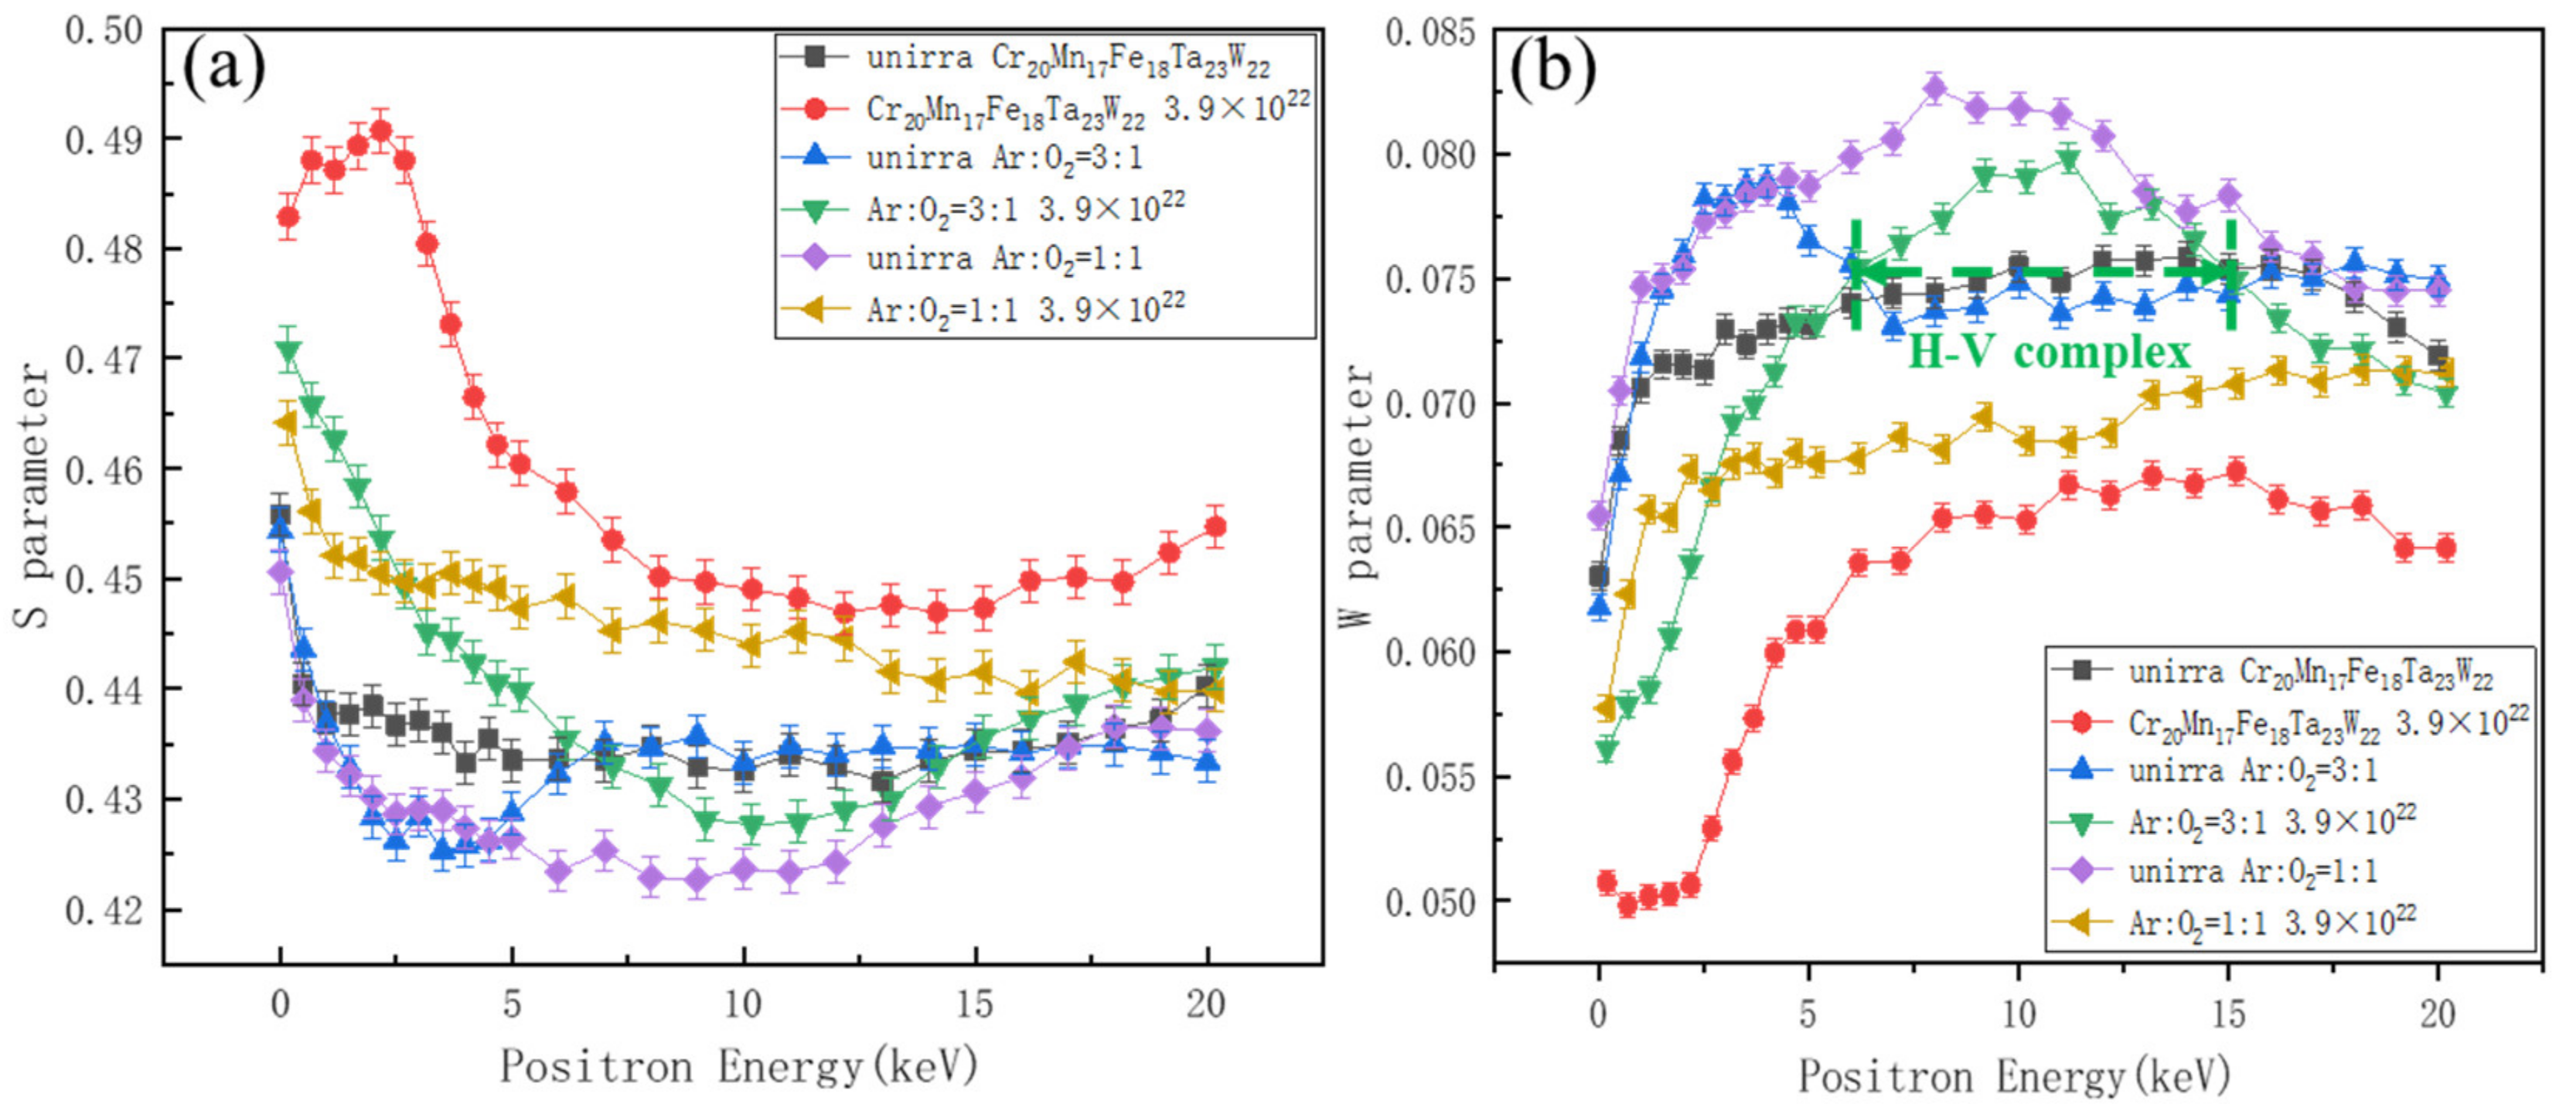
Figure 12a,b present the S and W parameters as a function of positron energy for the specimens before and after irradiation with hydrogen ions, respectively. It can be seen that the S value of Cr20Mn17Fe18Ta23W22 after irradiation was the largest (see Figure 12a), indicating the presence of vacancy defects in Cr20Mn17Fe18Ta23W22 after irradiation. According to the surface SEM images of HT1 and HT3 shown in Figure 5, the oxides on the surface were sparse and contained a large number of open volume defects; therefore, the S values near the surface of HT1 and HT3 were the highest, as shown in Figure 12a. Additionally, it can be seen that the S value of the HT1 and HT3 decreased to a relatively stable value and then began to increase; this was mainly due to the diffusion of elements to the surface during selective oxidation, and the presence of lots of vacancy defects in the Fe-Ta-W layer.
Additionally, it was found that for the HT1 specimen, the S value after irradiation was larger than that of primary HT1, indicating that a large number of vacancy type defects were produced. Additionally, most oxides in HT1 were reduced; therefore, it can be deduced that the hydrogen ions in HT1 were consumed, and the defects mainly existed as vacancies or vacancy clusters in HT1 after irradiation. However, the S value of HT3 after irradiation was smaller than that of primary HT3 when the positron energy ranged from 7.18 keV to 14.18 keV. This may have been due to the formation of H-V complexes, which could result in a decrease of S ; the higher the proportion of H in the H-V complex, the lower the value of S [43]. This was confirmed by comparing S with the evolution of W , as shown in Figure 12a,b.
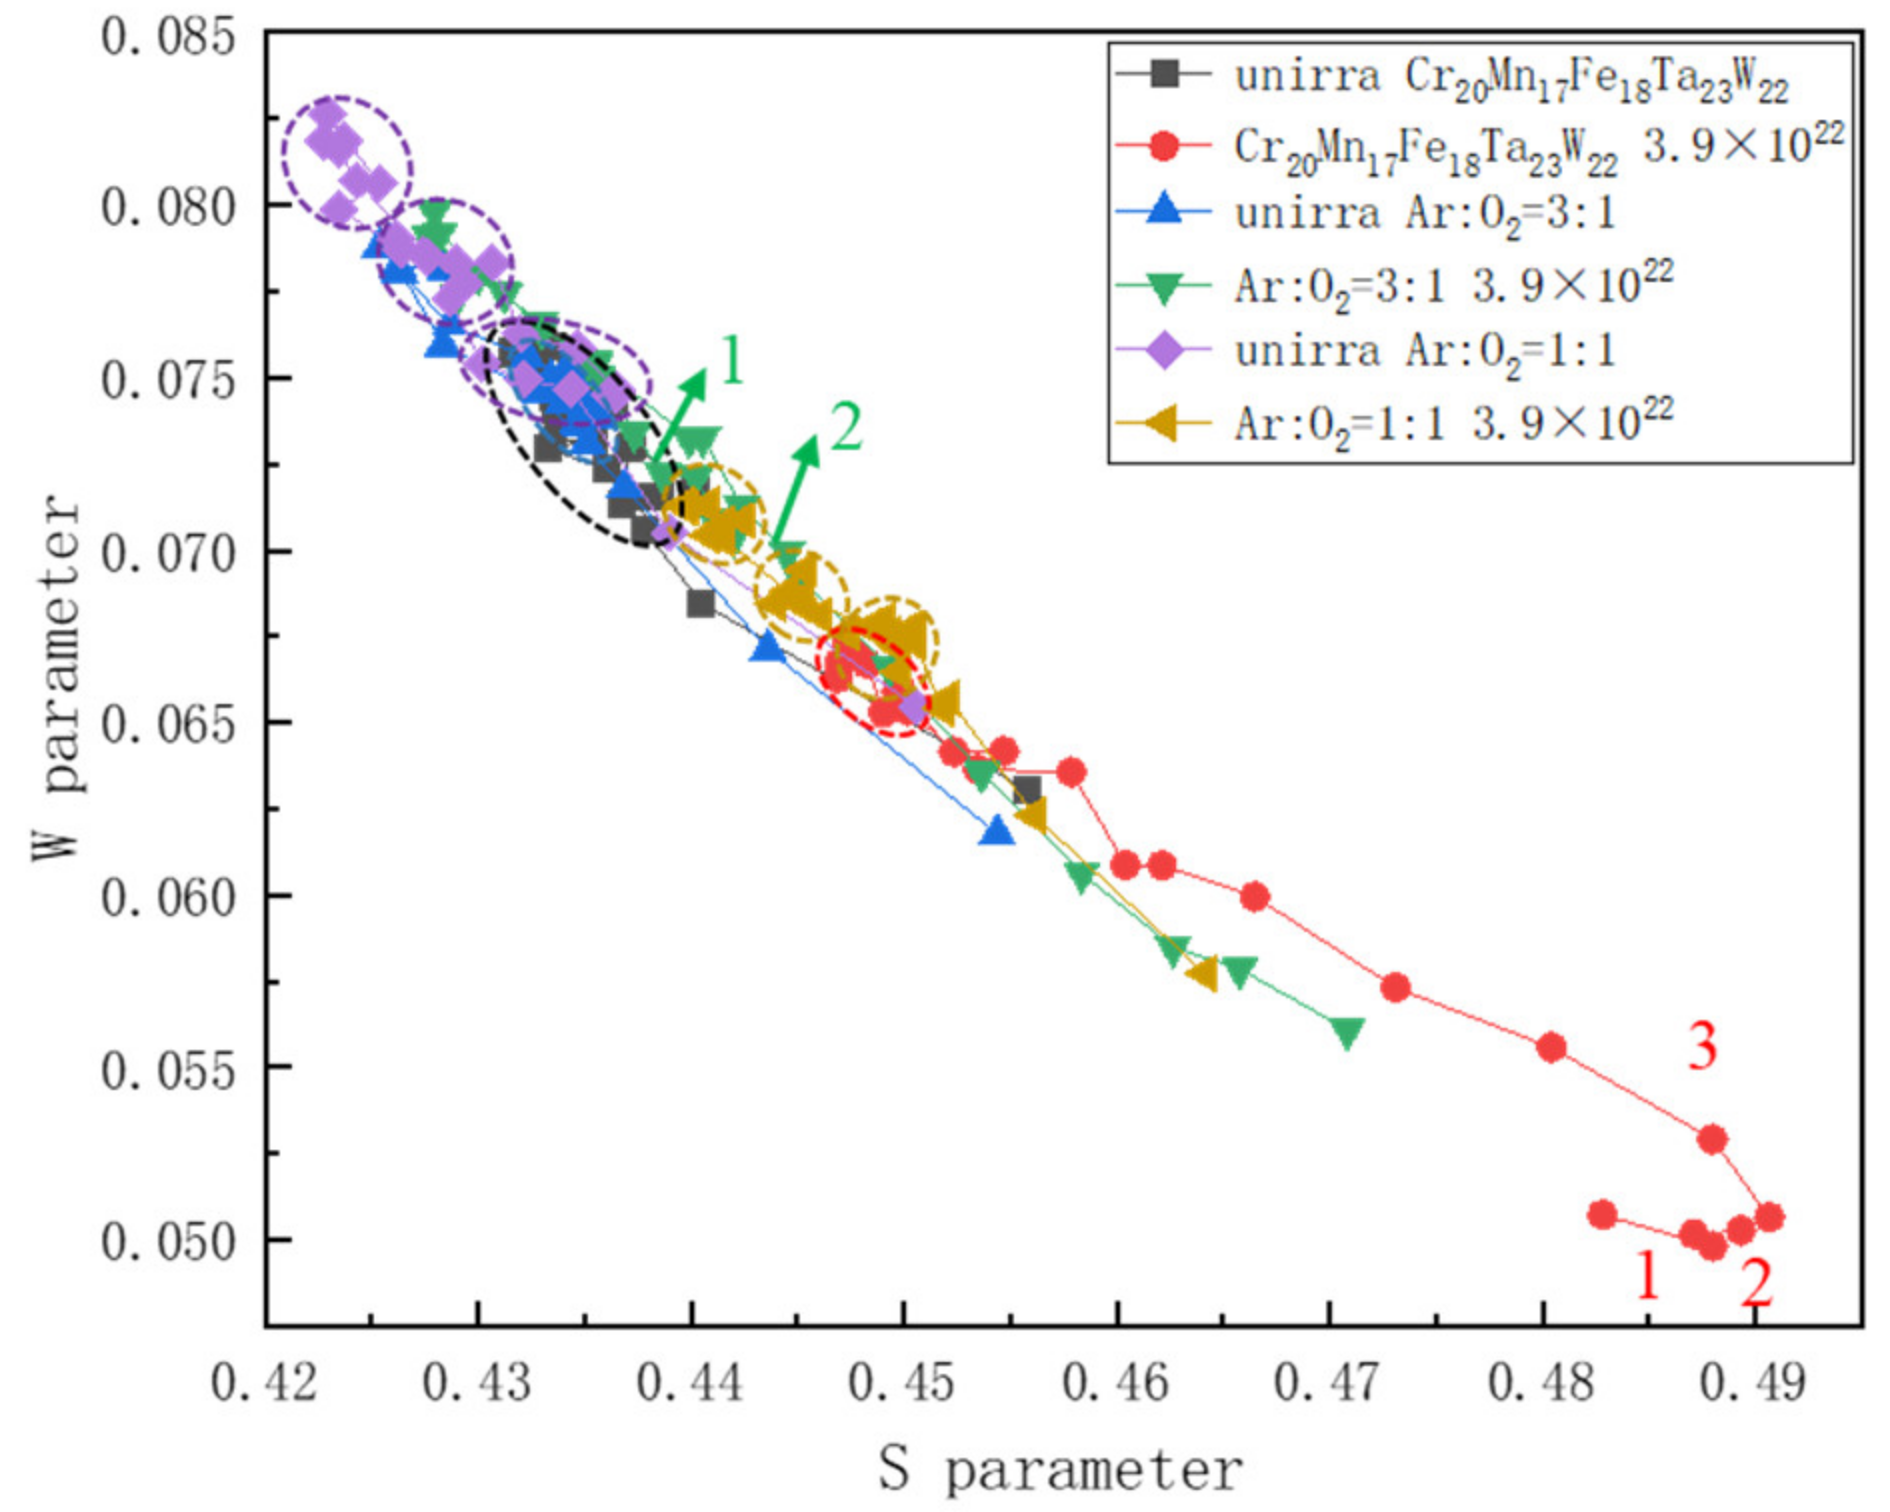
Figure 13 shows the S W curve of Cr20Mn17Fe18Ta23W22, HT1 and HT3 specimens before and after hydrogen ion irradiation. The S W curve presenting as a linear function indicated that only one defect type existed [44]. It was found that the ( S ,   W ) points of the specimens before irradiation were mostly distributed in regions with smaller S and larger W values, and that there were some   ( S ,   W ) aggregation regions which represented small vacancy clusters (marked with black, blue and purple circles, respectively). However, the   ( S ,   W ) points of the irradiated samples were mostly distributed in the region with larger S and smaller W values, indicating the generation of a certain number of vacancy type defects after irradiation.
According to Figure 13, the S W curve slope of Cr20Mn17Fe18Ta23W22 after irradiation had three different degrees of deviation (marked with 1,2 and 3). This, combined with SEM, S E and W E plot results, it could be concluded that the microdefects mainly existed as hydrogen bubbles, H-V complexes and vacancy/vacancy clusters (marked with red circles). The S W curve slope of HT1 after irradiation basically presented a straight line with some S , W point aggregations (marked with yellow circles). Therefore, combined with the analysis of GIXRD and S E plot results, it can be concluded that the defects were mainly vacancy (V) and vacancy clusters. However, for the HT3 after irradiation, the S W curve of the irradiated samples deviated to two different degrees (marked 1 and 2), suggesting that two different types of defects emerged after irradiation. Combined with the analysis above, it can be concluded that the microdefects in HT3 after irradiation mainly existed as V and H-V complexes.

4. Conclusions

In this work, a Cr20Mn17Fe18Ta23W22 RHEA coating was fabricated via magnetron sputtering. The oxidation mechanism of Cr20Mn17Fe18Ta23W22 RHEA and the evolution of defects induced by hydrogen ion irradiation before and after oxidation were studied. The following conclusions can be drawn:
(1) The oxidation behavior of Cr20Mn17Fe18Ta23W22 RHEA is mainly controlled by the diffusion of cations instead of affinities with O. For the sample oxidized at 800 °C (6.7 °C/min) for 4 h (ST3, Ar:O2 = 3:1), the oxide scale with plenty of spallation and crack; on a micro-level, twisted lattice fringes and edge dislocations remained. These defects, formed during oxidation, facilitated the diffusion of metal cations and oxygen, and accelerated oxidation. However, after slowing the oxidation rates, i.e., oxidizing Cr20Mn17Fe18Ta23W22 at 300 °C (6 °C/min) for 2 h and then increasing the temperature to 800 °C (5 °C/min) for 4 h (HT1 (Ar:O2 = 1:1), HT2 (Ar:O2 = 2:1) and HT3 (Ar:O2 = 3:1) samples), the surface spalling improved, and no obvious twisted lattice fringes or edge dislocations were observed.
(2) The distributions of Fe in oxidized samples under two different heating procedures were different. For ST3, Fe3+ or Fe2+ diffused through CrxOy, formed Fe2O3 and FeMnO3; therefore, the oxide scale was Mn-Fe-Cr oxide. However, for HT1, HT2 and HT3, compared with ST3, the heating process stayed at 300 °C and the oxidation rate slowed. Under these conditions, MnCr2O4 formed relatively rapidly and hindered the diffusion of Fe3+ or Fe2+, and as such, the formation of Fe oxide was restricted. Therefore, the oxide scale was Mn-Cr oxide, while Fe-Ta-W stayed at the bottom.
(3) Compared with Cr20Mn17Fe18Ta23W22, the oxidized Cr20Mn17Fe18Ta23W22, i.e., HT1 (Ar:O2 = 1:1) and HT3 (Ar:O2 = 3:1), demonstrated better hydrogen irradiation resistance. Microdefects in Cr20Mn17Fe18Ta23W22 after irradiation mainly existed as hydrogen bubbles, H-V complexed and vacancy/vacancy clusters. The microdefects in HT1 after irradiation mainly existed as vacancies and vacancy clusters, as large amount of hydrogen were consumed to react with oxides on the HT1 surface, while the microdefects in HT3 after irradiation were mainly vacancies and H-V complexes. Finally, the oxides on the HT3 surface were more stable than those of HT1.

Author Contributions

Conceptualization, Y.W.; methodology, B.-Z.W. and Z.-M.Y.; validation, B.-Z.W. and Y.W.; formal analysis, B.-Z.W. and T.Z.; investigation, X.-Z.C. and K.Z.; resources, Y.W., X.-Z.C., K.Z. and F.-J.G.; data curation, Y.W. and X.-Z.C.; writing—original draft preparation, B.-Z.W.; writing—review and editing, B.-Z.W.; visualization, B.-Z.W. and T.Z.; supervision, Y.W., K.Z. and F.-J.G.; project administration, Y.W. and X.-Z.C.; funding acquisition, Y.W. and X.-Z.C. All authors have read and agreed to the published version of the manuscript.

Funding

This research was funded by the National Natural Science Foundation of China (Grant Nos. 11775150 and 12005229).

Institutional Review Board Statement

Not applicable.

Informed Consent Statement

Not applicable.

Data Availability Statement

Not applicable.

Conflicts of Interest

The authors declare no conflict of interest.

References

  1. Maier, H.; Neu, R.; Schwarz-Selinger, T.; Von Toussaint, U.; Manhard, A.; Dürbeck, T.; Hunger, K. Tungsten heavy alloy: An alternative plasma-facing material in terms of hydrogen isotope retention. Nucl. Fusion 2020, 60, 126044. [Google Scholar] [CrossRef]
  2. Cherkeza, D.I.; Spitsynab, A.V.; Golubevaa, A.V.; Chernovc, V.M. Deuterium permeation through the low-activated V–4Cr–4Ti alloy under plasma irradiation. Nucl. Mater. Energy 2020, 23, 100756. [Google Scholar] [CrossRef]
  3. Wang, L.; Zhou, H.-S.; Liu, H.-D.; Xu, Q.; Oya, Y.; Zhao, M.-Z.; Tanabe, T.; Luo, G.-N. Studies on accelerated hydrogen isotopes permeation through plasma-facing components of fusion reactors. Phys. Scr. 2020, T171, 014032. [Google Scholar] [CrossRef]
  4. Vehovar, L. Hydrogen embrittlement of Microalloyed structural steels. Mater. Corros. 1994, 45, 349–354. [Google Scholar] [CrossRef]
  5. Humrickhouse, P.; Merrill, B.J. Tritium aspects of the fusion nuclear science facility. Fusion Eng. Des. 2018, 135, 302–313. [Google Scholar] [CrossRef]
  6. Wang, X.; Ran, G.; Wang, H.; Xiao, C.; Zhang, G.; Chen, C. Current Progress of Tritium Fuel Cycle Technology for CFETR. J. Fusion Energy 2018, 38, 125–137. [Google Scholar] [CrossRef]
  7. Zhou, H.-S.; Liu, H.-D.; Wang, L.; Yang, X.; Oya, Y.; Zhao, M.-Z.; Tanabe, T.; Xu, Y.-P.; Yuan, X.-G.; Li, B.; et al. A tritium permeation ‘short cut’ for plasma-facing components of fusion reactors. Nucl. Fusion 2019, 59, 014003. [Google Scholar] [CrossRef]
  8. Houben, A.; Rasinski, M.; Linsmeier, C. Hydrogen Permeation in Fusion Materials and the Development of Tritium Permeation Barriers. Plasma Fusion Res. 2020, 15, 2405016. [Google Scholar] [CrossRef]
  9. Urabe, Y.; Hashizume, K.; Otsuka, T.; Sakamoto, K. Tritium Permeation through Ce-ODS Steel. Fusion Sci. Technol. 2020, 76, 392–397. [Google Scholar] [CrossRef]
  10. An, X.; Zhu, T.; Wan, M.; Li, Y.; Wang, Q.; Zhang, P.; Liu, J.; Song, Y.; Zhang, Z.; Wang, B.; et al. Investigation of the interaction between hydrogen and irradiation defects in titanium by using positron annihilation spectroscopy. Int. J. Hydrogen Energy 2021, 46, 13162–13170. [Google Scholar] [CrossRef]
  11. Zhang, W.; Guo, L.; Shen, Z.; Xin, J.; Huang, Q.; Wei, Y.; Long, Y.; Zhou, X.; Chen, C. Evolution of Dislocation Loops Induced by Different Hydrogen Irradiation Conditions in Reduced-Activation Martensitic Steel. Materials 2018, 11, 2276. [Google Scholar] [CrossRef] [PubMed] [Green Version]
  12. Lu, E.; Makkonen, I.; Mizohata, K.; Li, Z.; Räisänen, J.; Tuomisto, F. Effect of interstitial carbon on the evolution of early-stage irradiation damage in equi-atomic FeMnNiCoCr high-entropy alloys. J. Appl. Phys. 2020, 127, 025103. [Google Scholar] [CrossRef]
  13. Ramachandran, R.; David, C.; Magudapathy, P.; Rajaraman, R.; Govindaraj, R.; Amarendra, G. Study of defect complexes and their evolution with temperature in hydrogen and helium irradiated RAFM steel using positron annihilation spectroscopy. Fusion Eng. Des. 2019, 142, 55–62. [Google Scholar] [CrossRef]
  14. Niu, C.; LaRosa, C.R.; Miao, J.; Mills, M.J.; Ghazisaeidi, M. Magnetically-driven phase transformation strengthening in high entropy alloys. Nat. Commun. 2018, 9, 1–9. [Google Scholar] [CrossRef]
  15. Duan, Y.; Song, L.; Cui, Y.; Pang, H.; Zhang, X.; Wang, T. FeCoNiCuAl high entropy alloys microwave absorbing materials: Exploring the effects of different Cu contents and annealing temperatures on electromagnetic properties. J. Alloy. Compd. 2020, 848, 156491. [Google Scholar] [CrossRef]
  16. Kim, J.; Wakai, A.; Moridi, A. Materials and manufacturing renaissance: Additive manufacturing of high-entropy alloys. J. Mater. Res. 2020, 35, 1963–1983. [Google Scholar] [CrossRef]
  17. Patel, D.; Richardson, M.; Jim, B.; Akhmadaliev, S.; Goodall, R.; Gandy, A. Radiation damage tolerance of a novel metastable refractory high entropy alloy V2.5Cr1.2WMoCo0.04. J. Nucl. Mater. 2020, 531, 152005. [Google Scholar] [CrossRef]
  18. Chang, S.; Tseng, K.-K.; Yang, T.-Y.; Chao, D.-S.; Yeh, J.-W.; Liang, J.-H. Irradiation-induced swelling and hardening in HfNbTaTiZr refractory high-entropy alloy. Mater. Lett. 2020, 272, 127832. [Google Scholar] [CrossRef]
  19. Senkov, O.N.; Miracle, D.B.; Chaput, K.J.; Couzinie, J.-P. Development and exploration of refractory high entropy alloys—A review. J. Mater. Res. 2018, 33, 3092–3128. [Google Scholar] [CrossRef] [Green Version]
  20. Xu, Z.; Ma, Z.; Wang, M.; Chen, Y.; Tan, Y.; Cheng, X. Design of novel low-density refractory high entropy alloys for high-temperature applications. Mater. Sci. Eng. A 2019, 755, 318–322. [Google Scholar] [CrossRef]
  21. Wang, M.; Ma, Z.L.; Xu, Z.Q.; Cheng, X.W. Designing VxNbMoTa refractory high-entropy alloys with improved properties for high-temperature applications. Scr. Mater. 2021, 191, 131–136. [Google Scholar] [CrossRef]
  22. Moschetti, M.; Xu, A.L.; Schuh, B.; Hohenwarter, A.; Couzinié, J.-P.; Kruzic, J.J.; Bhattacharyya, D.; Gludovatz, B. On the Room-Temperature Mechanical Properties of an Ion-Irradiated TiZrNbHfTa Re-fractory High Entropy Alloy. J. Miner. Met. Mater. Soc. 2020, 72, 130–138. [Google Scholar] [CrossRef]
  23. Bhandari, U.; Zhang, C.; Zeng, C.; Guo, S.; Yang, S. Computational and experimental investigation of refractory high entropy alloy Mo15Nb20Re15Ta30W20. J. Mater. Res. Technol. 2020, 9, 8929–8936. [Google Scholar] [CrossRef]
  24. Wei, Y.; Fu, Y.; Pan, Z.-M.; Ma, Y.-C.; Cheng, H.-X.; Zhao, Q.-C.; Luo, H.; Li, X.-G. Influencing factors and mechanism of high-temperature oxidation of high-entropy alloys: A review. Int. J. Miner. Met. Mater. 2021, 28, 915–930. [Google Scholar] [CrossRef]
  25. Tsai, K.-Y.; Tsai, M.-H.; Yeh, J.-W. Sluggish diffusion in Co–Cr–Fe–Mn–Ni high-entropy alloys. Acta Mater. 2013, 61, 4887–4897. [Google Scholar] [CrossRef]
  26. Huang, E.-W.; Chou, H.-S.; Tu, K.N.; Hung, W.-S.; Lam, T.-N.; Tsai, C.-W.; Chiang, C.-Y.; Lin, B.-H.; Yeh, A.-C.; Chang, S.-H.; et al. Element Effects on High-Entropy Alloy Vacancy and Heterogeneous Lattice Distortion Subjected to Quasi-equilibrium Heating. Sci. Rep. 2019, 9, 1–10. [Google Scholar] [CrossRef] [Green Version]
  27. Dąbrowa, J.; Danielewski, M. State-of-the-Art Diffusion Studies in the High Entropy Alloys. Metals 2020, 10, 347. [Google Scholar] [CrossRef] [Green Version]
  28. Cox, M.G.C.; McEnaney, B.; Scott, V.D. A chemical diffusion model for partitioning of transition elements in oxide scales on alloys. Philos. Mag. 1972, 26, 839–851. [Google Scholar] [CrossRef]
  29. Lobnig, R.E.; Schmidt, H.P.; Hennesen, K.; Grabke, H.J. Diffusion of cations in chromia layers grown on iron-base alloys. Oxid. Met. 1992, 37, 81–93. [Google Scholar] [CrossRef]
  30. Feng, S.J.; Wang, Y.; Zhang, C.; Luo, C.; Xu, J.; Suo, J. Preparation of Al2O3/Cr2O3 tritium permeation barrier with combination of pack cementation and sol-gel methods. Fusion Eng. Des. 2018, 131, 1–7. [Google Scholar] [CrossRef]
  31. Zhu, T.; Wang, B.; Yuan, D.; Jin, S.; Zhang, P.; Lu, E.; Song, L.; Liu, Y.; Ma, H.; Zhang, Q.; et al. Effect of temperature and dose on vacancy-defect evolution in 304L stainless steel irradiated by triple ion beam. J. Nucl. Mater. 2018, 512, 94–99. [Google Scholar] [CrossRef]
  32. Zhang, J.; Zhang, X.; Li, Y.; Du, Q.; Liu, X.; Qi, X. High-entropy oxides 10La2O3-20TiO2-10Nb2O5-20WO3-20ZrO2 amorphous spheres prepared by containerless solidification. Mater. Lett. 2019, 244, 167–170. [Google Scholar] [CrossRef]
  33. Chen, K.; Pei, X.; Tang, L.; Cheng, H.; Li, Z.; Li, C.; Zhang, X.; An, L. A new five-component entropy-stabilized fluorite oxide. J. Eur. Ceram. Soc. 2018, 38, 4161–4164. [Google Scholar] [CrossRef]
  34. Kim, Y.-K.; Joo, Y.-A.; Kim, H.S.; Lee, K.-A. High temperature oxidation behavior of Cr-Mn-Fe-Co-Ni high entropy alloy. Intermetallics 2018, 98, 45–53. [Google Scholar] [CrossRef]
  35. Jackson, P.R.S.; Wallwork, G.R. High temperature oxidation of iron-manganese-aluminum based alloys. Oxid. Met. 1984, 21, 135–170. [Google Scholar] [CrossRef]
  36. Zhu, G.; Liu, Y.; Ye, J. Early high-temperature oxidation behavior of Ti(C,N)-based cermets with multi-component AlCo-CrFeNi high-entropy alloy binder. Int. J. Refract. Met. Hard Mater. 2014, 44, 35–41. [Google Scholar] [CrossRef]
  37. Senkov, O.N.; Senkova, S.V.; Dimiduk, D.M.; Woodward, C.; Miracle, D.B. Oxidation behavior of a refractory NbCrMo0.5Ta0.5TiZr alloy. J. Mater. Sci. 2012, 47, 6522–6534. [Google Scholar] [CrossRef]
  38. Kai, W.; Li, C.; Cheng, F.; Chu, K.; Huang, R.; Tsay, L.; Kai, J.; Kai, W.; Li, C.; Cheng, F.; et al. The oxidation behavior of an equimolar FeCoNiCrMn high-entropy alloy at 950 °C in various oxygen-containing atmospheres. Corros. Sci. 2016, 108, 209–214. [Google Scholar] [CrossRef]
  39. Marrocchelli, D.; Sun, L.; Yildiz, B. Dislocations in SrTiO3: Easy To Reduce but Not so Fast for Oxygen Transport. J. Am. Chem. Soc. 2015, 137, 4735–4748. [Google Scholar] [CrossRef]
  40. Love, G. Dislocation pipe diffusion. Acta Met. 1964, 12, 731–737. [Google Scholar] [CrossRef]
  41. Zhang, C.; Wu, Y.; You, L.; Cao, X.; Lu, Z.; Song, X. Investigation on the activation mechanism of hydrogen absorption in TiZrNbTa high entropy alloy. J. Alloy. Compd. 2018, 781, 613–620. [Google Scholar] [CrossRef]
  42. Li, Q.; Mo, L.-B.; Wang, J.; Yan, K.; Tang, T.; Rao, Y.-C.; Yao, W.-Q.; Cao, J.-L. Performances of Cr2O3 –hydrogen isotopes permeation barriers. Int. J. Hydrogen Energy 2015, 40, 6459–6464. [Google Scholar] [CrossRef]
  43. Zhang, P.; Jin, S.; Lu, E.; Wang, B.; Zheng, Y.; Yuan, D.; Cao, X. Effect of annealing on VmHn complexes in hydrogen ion irradiated Fe and Fe-0.3%Cu alloys. J. Nucl. Mater. 2015, 459, 301–305. [Google Scholar] [CrossRef]
  44. Xu, Y.-P.; Liu, H.-D.; Lyu, Y.-M.; Zhou, H.-S.; Ding, F.; Li, Z.-D.; Li, X.-C.; Wang, J.; Yuan, X.-G.; Wang, X.-L.; et al. Effects of high-energy C ions irradiation on the deuterium retention behavior in V-5Cr-5Ti. J. Nucl. Mater. 2018, 509, 513–516. [Google Scholar] [CrossRef]
Figure 1. As-deposited Cr20Mn17Fe18Ta23W22 RHEA: (a) The GIXRD pattern; (b) SEM surface image; (c) Cross-section SEM image.
Materials 15 01895 g001
Figure 2. The as-deposited Cr20Mn17Fe18Ta23W22: (a) The cross-sectional HAADF image; (b) EDS-mapping images.
Materials 15 01895 g002
Figure 3. (a) The SEM surface morphology image of the ST3 sample (i.e., Cr20Mn17Fe18Ta23W22 coating after oxidization at 800 °C (6.7 °C/min) for 4 h (Ar:O2 = 3:1)); (b) The enlarged SEM surface morphology image of the region marked with black box in (a); (c) The enlarged SEM surface morphology image of the region marked with letter c and black box in (b).
Materials 15 01895 g003
Figure 4. ST3 specimen: (ac) Cross-section images; (di) EDS line scan of cross-section of the coating after being oxidized. The line scan followed the direction of the red arrow in (b).
Materials 15 01895 g004
Figure 5. The morphology and element distribution of S1, HT2 and HT3: (a1c1) SEM surface images; (a2,a3), (b2,b3), (c2,c3) Cross-section images; (a4c4) EDS line scan images.
Materials 15 01895 g005
Figure 6. (a) The GIXRD pattern of ST3, i.e., Cr20Mn17Fe18Ta23W22 RHEA oxidized at 800 °C (6.7 °C/min) for 4 h (Ar:O2 = 3:1); (b) The GIXRD results of HT1, HT2 and HT3, i.e., Cr20Mn17Fe18Ta23W22 RHEA oxidized at 300 °C (6 °C/min) for 2 h and then increased to 800 °C (5 °C/min) for 4 h; the ratios of argon to oxygen were 3:1, 2:1 and 1:1, respectively.
Materials 15 01895 g006
Figure 7. (a) The cross-sectional HAADF image of ST3 sample; (b) The EDS–mapping image of ST3 sample; (c) The cross-sectional HAADF image of HT3 sample; (d) The EDS–mapping image of HT3 sample.
Materials 15 01895 g007
Figure 8. (a) The selected area electron diffraction (SAED) pattern of the Ta-W rich layer in the ST3 sample; (b) SAED patterns of the Fe-Ta-W rich layer in the HT3 sample.
Materials 15 01895 g008
Figure 9. (a) HAADF images of the oxide layer of ST3 sample; (a1) HRTEM images of a selected region in (a); (a2,a3) Fast Fourier transform (FFT) images of G and H regions in (a1); (a4,a5) Inverse Fast Fourier transform (IFFT) images of G and H regions (filter); (a6) IFFT image of G region; (b) HAADF image of oxide layer of HT3 sample; (b1) HRTEM image of selected region in (b); (b2) FFT image of (b1,b3); IFFT image of (b1) (filter); (b4) IFFT image of I region in (b1).
Materials 15 01895 g009
Figure 10. The GIXRD patterns the specimens irradiated with fluence of 3.9 × 1022 cm−2 hydrogen ions: (a) Cr20Mn17Fe18Ta23W22; (b) HT1 (Ar: O2 = 1:1) and HT3 (Ar:O2 = 3:1) specimens.
Materials 15 01895 g010
Figure 11. Surface SEM images of specimens irradiated with fluence of 3.9 × 1022 cm−2 hydrogen ions: (a,a1) Cr20Mn17Fe18Ta23W22; (b,b1) HT1 (Ar:O2 = 1:1) and (c,c1) HT3 (Ar:O2 = 3:1).
Materials 15 01895 g011
Figure 12. (a,b) S and W parameters as a function of the positron energy for Cr20Mn17Fe18Ta23W22; HT1 and HT3 specimens before and after H+ irradiation, respectively.
Materials 15 01895 g012
Figure 13. W—parameter as a function of S—parameter for Cr20Mn17Fe18Ta23W22, HT1 and HT3 specimens before and after H+ irradiation. The numbers represent the slope deviations.
Materials 15 01895 g013
Table 1. Content of each element of Region 1 in Figure 3 by EDS and XPS results for the HT3 sample surface.
ElementsOCrMnFeTaW
at.%
EDS
(Region 1)
25.6921.8323.8425.471.541.63
-29.3832.0834.282.072.19
XPS65.335.0618.319.560.250.47
Table 2. Pauling electronegativity of each element in Cr20Mn17Fe18Ta23W22.
ElementCrMnFeTaW
Pauling electronegativity1.661.551.831.502.36
Table 3. The contents of each element on the surfaces of HT1, HT2 and HT3, as detected by EDS and XPS.
SamplesElementsOCrMnFeTaW
at.%
HT1EDS42.8423.0530.421.250.791.66
-40.3253.212.191.382.9
XPS66.987.921.081.890.621.51
HT2EDS43.0623.3230.751.010.591.26
-40.96541.781.042.22
XPS65.989.2320.822.720.480.76
HT3EDS42.3723.9229.981.630.561.54
-41.5152.022.830.972.67
XPS65.88.7820.522.761.021.12
Publisher’s Note: MDPI stays neutral with regard to jurisdictional claims in published maps and institutional affiliations.