
Study on Preparation of Superhydrophobic Copper Surface by Milling and Its Protective Performance


Abstract
:1. Introduction
2. Materials and Methods
2.1. Materials
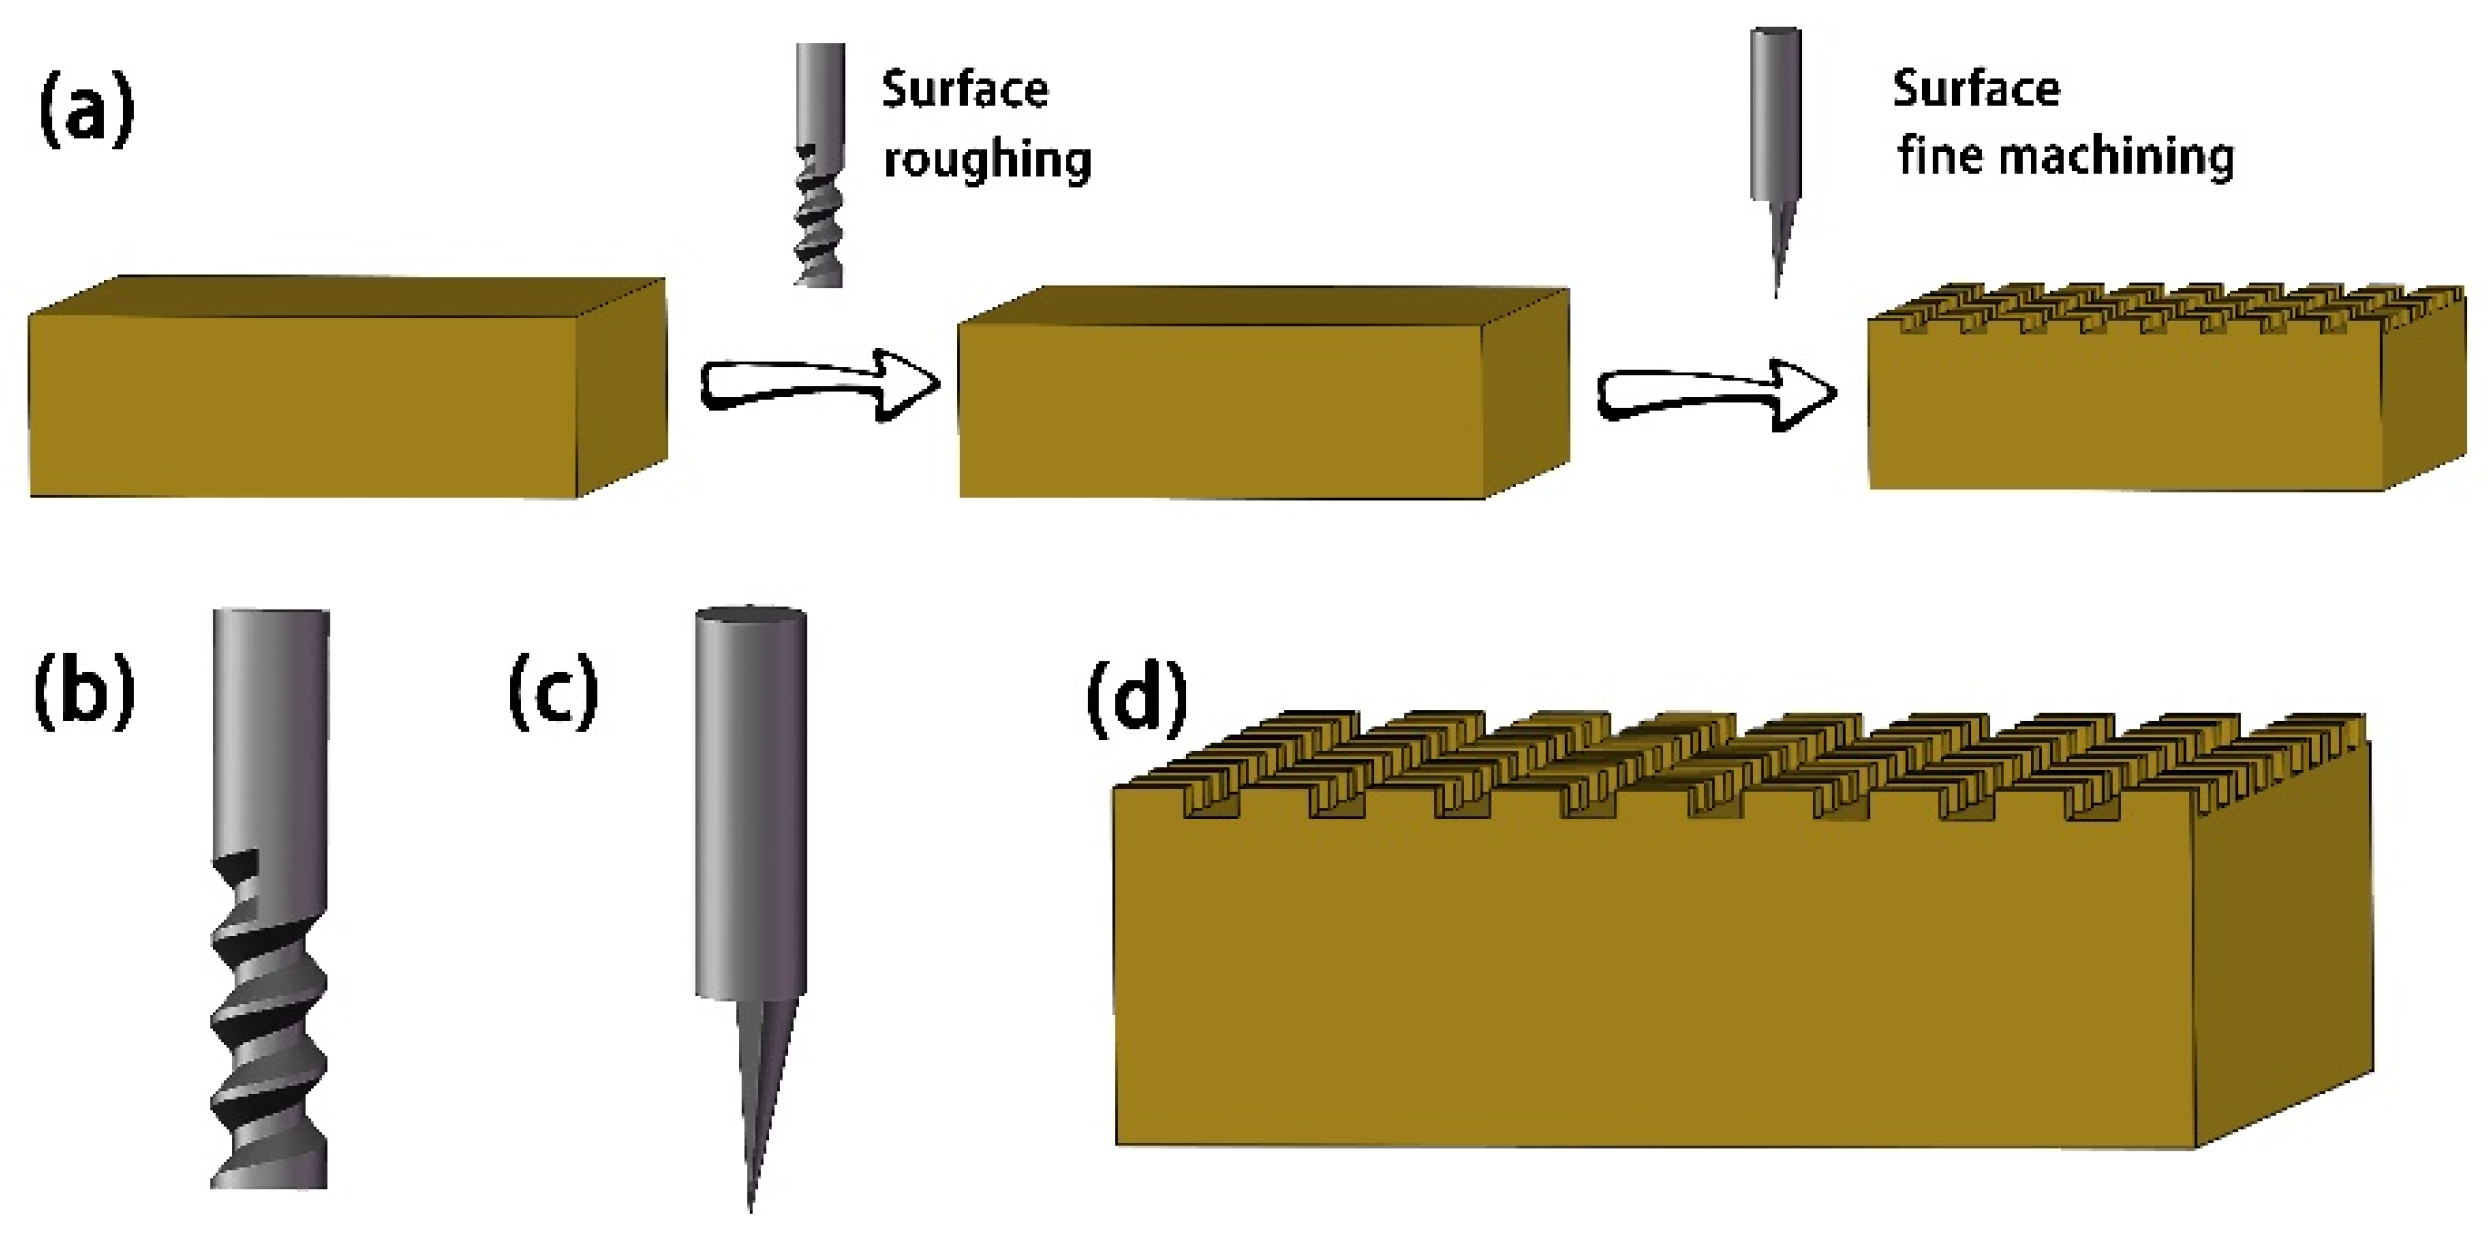
2.2. Methods
2.3. Sample Characterization
2.4. Corrosion Resistance Evaluation
3. Results and Discussion
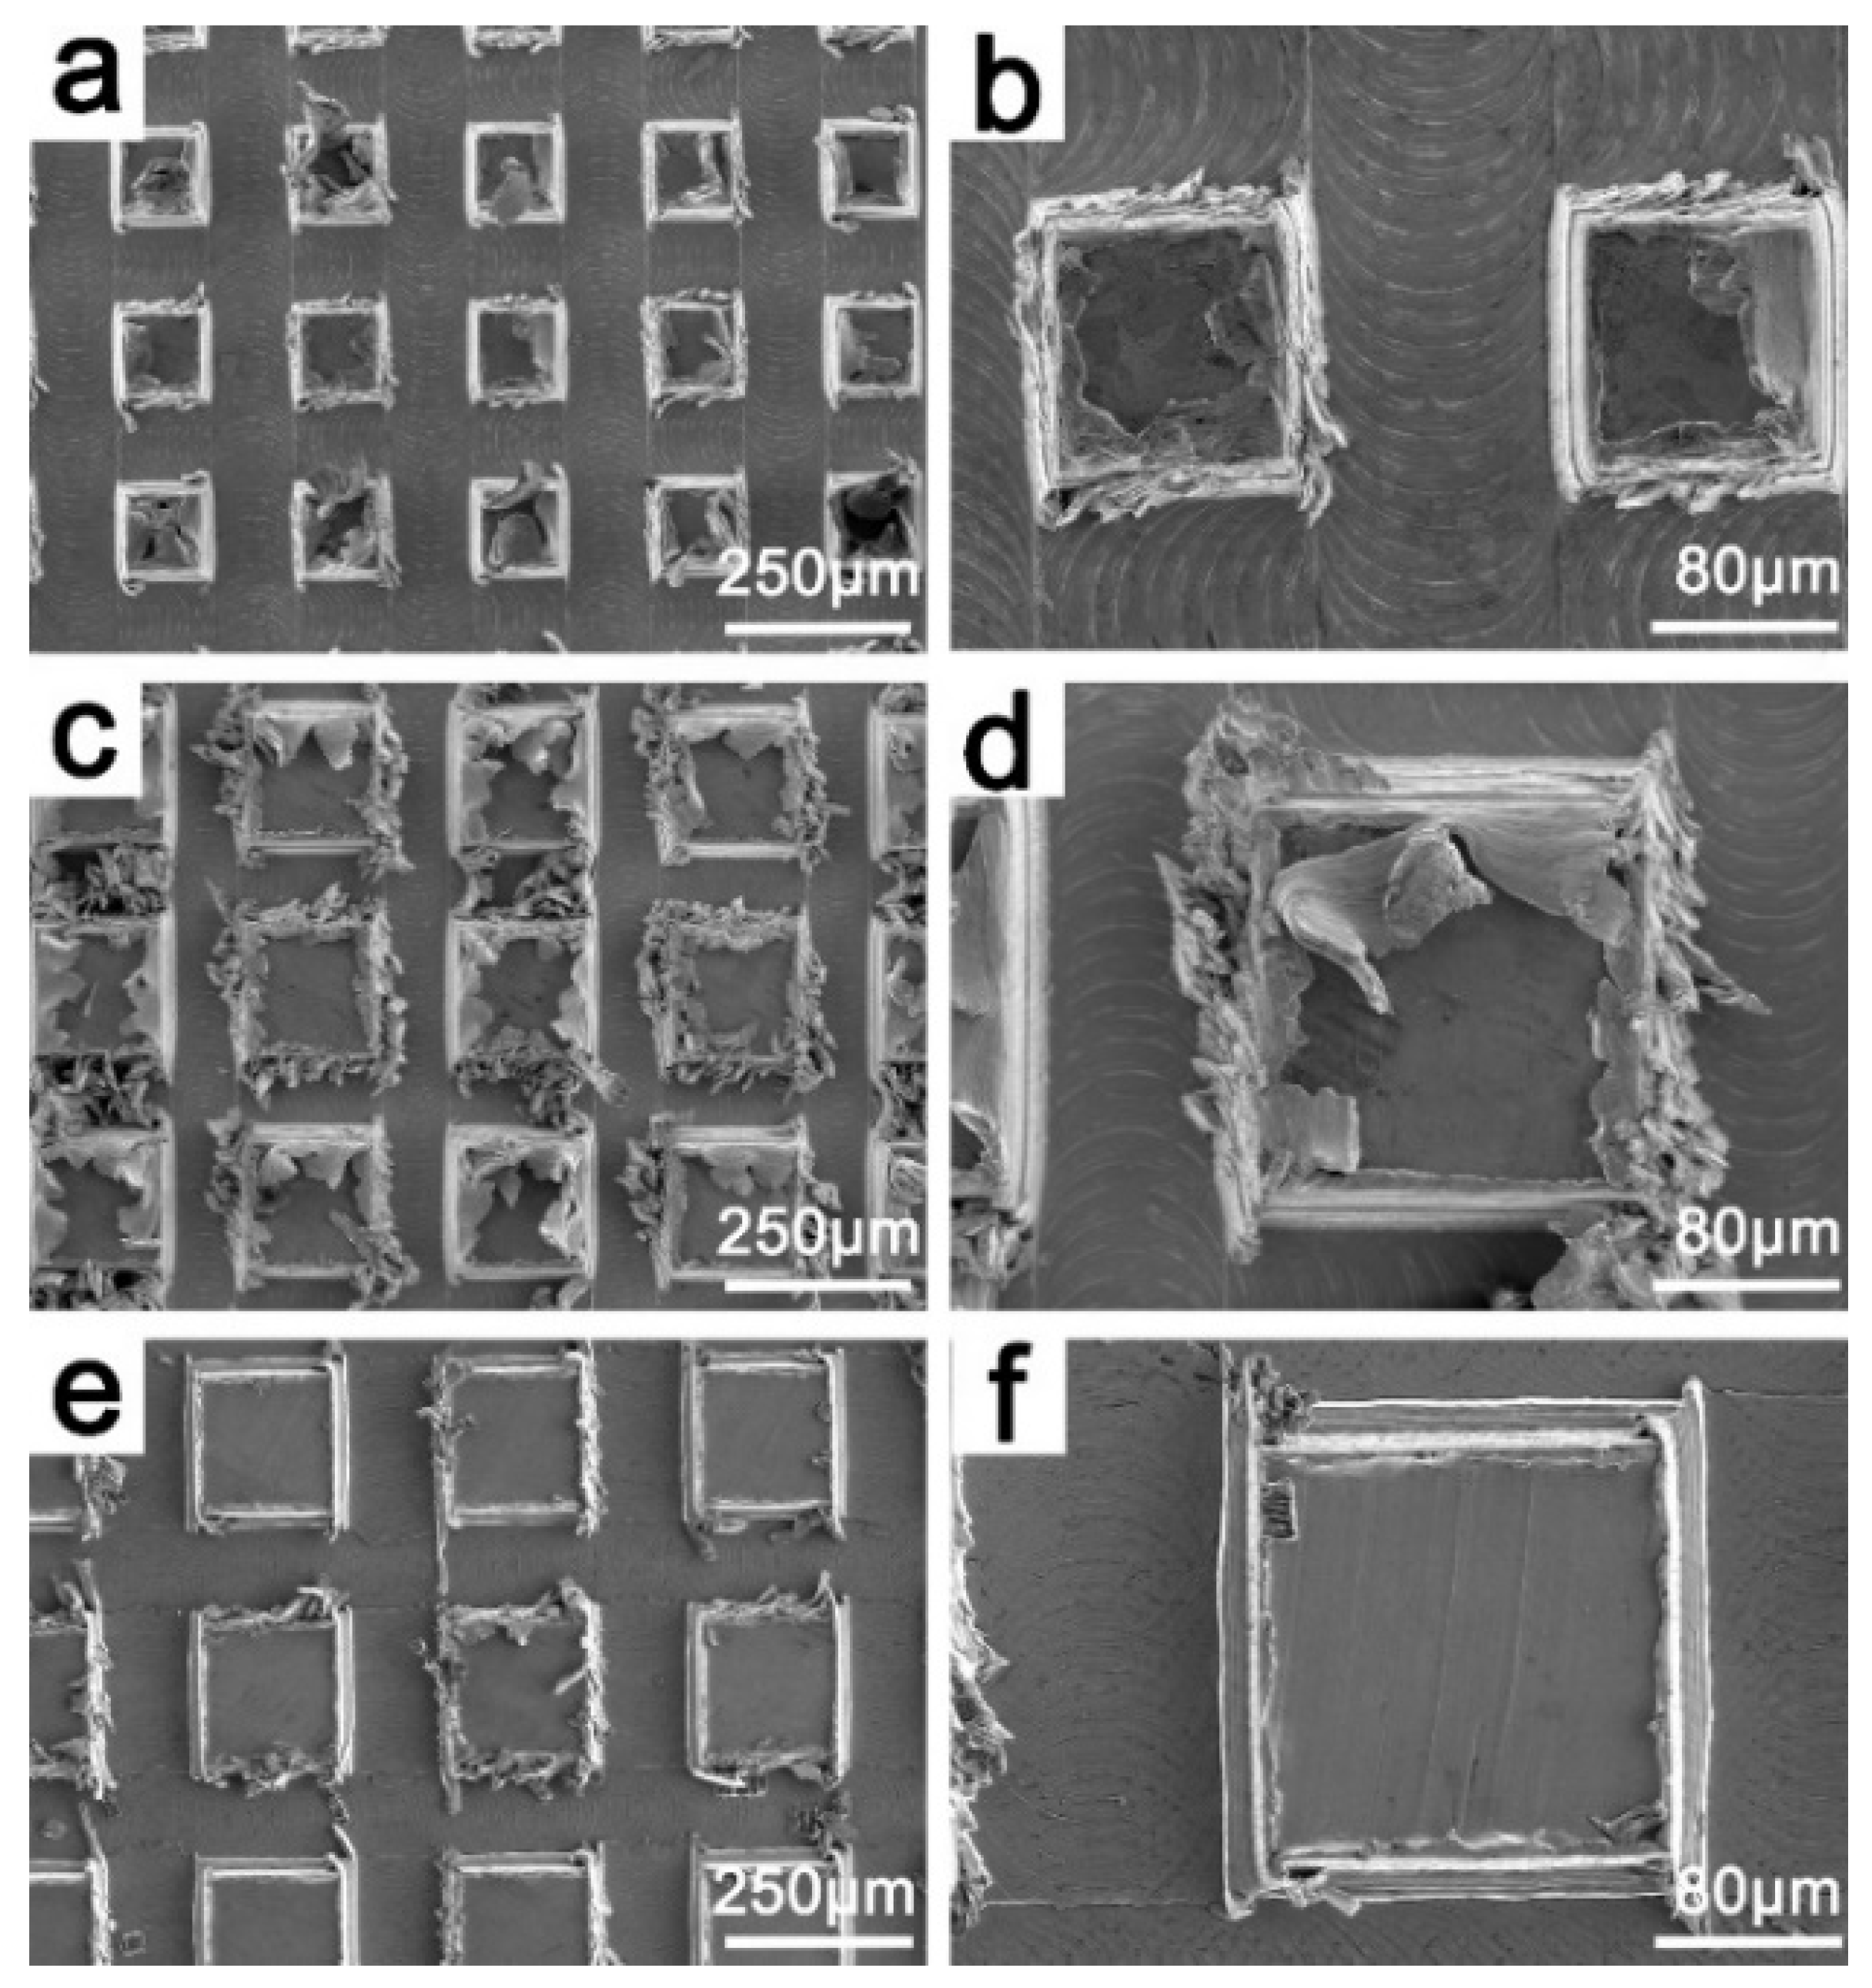
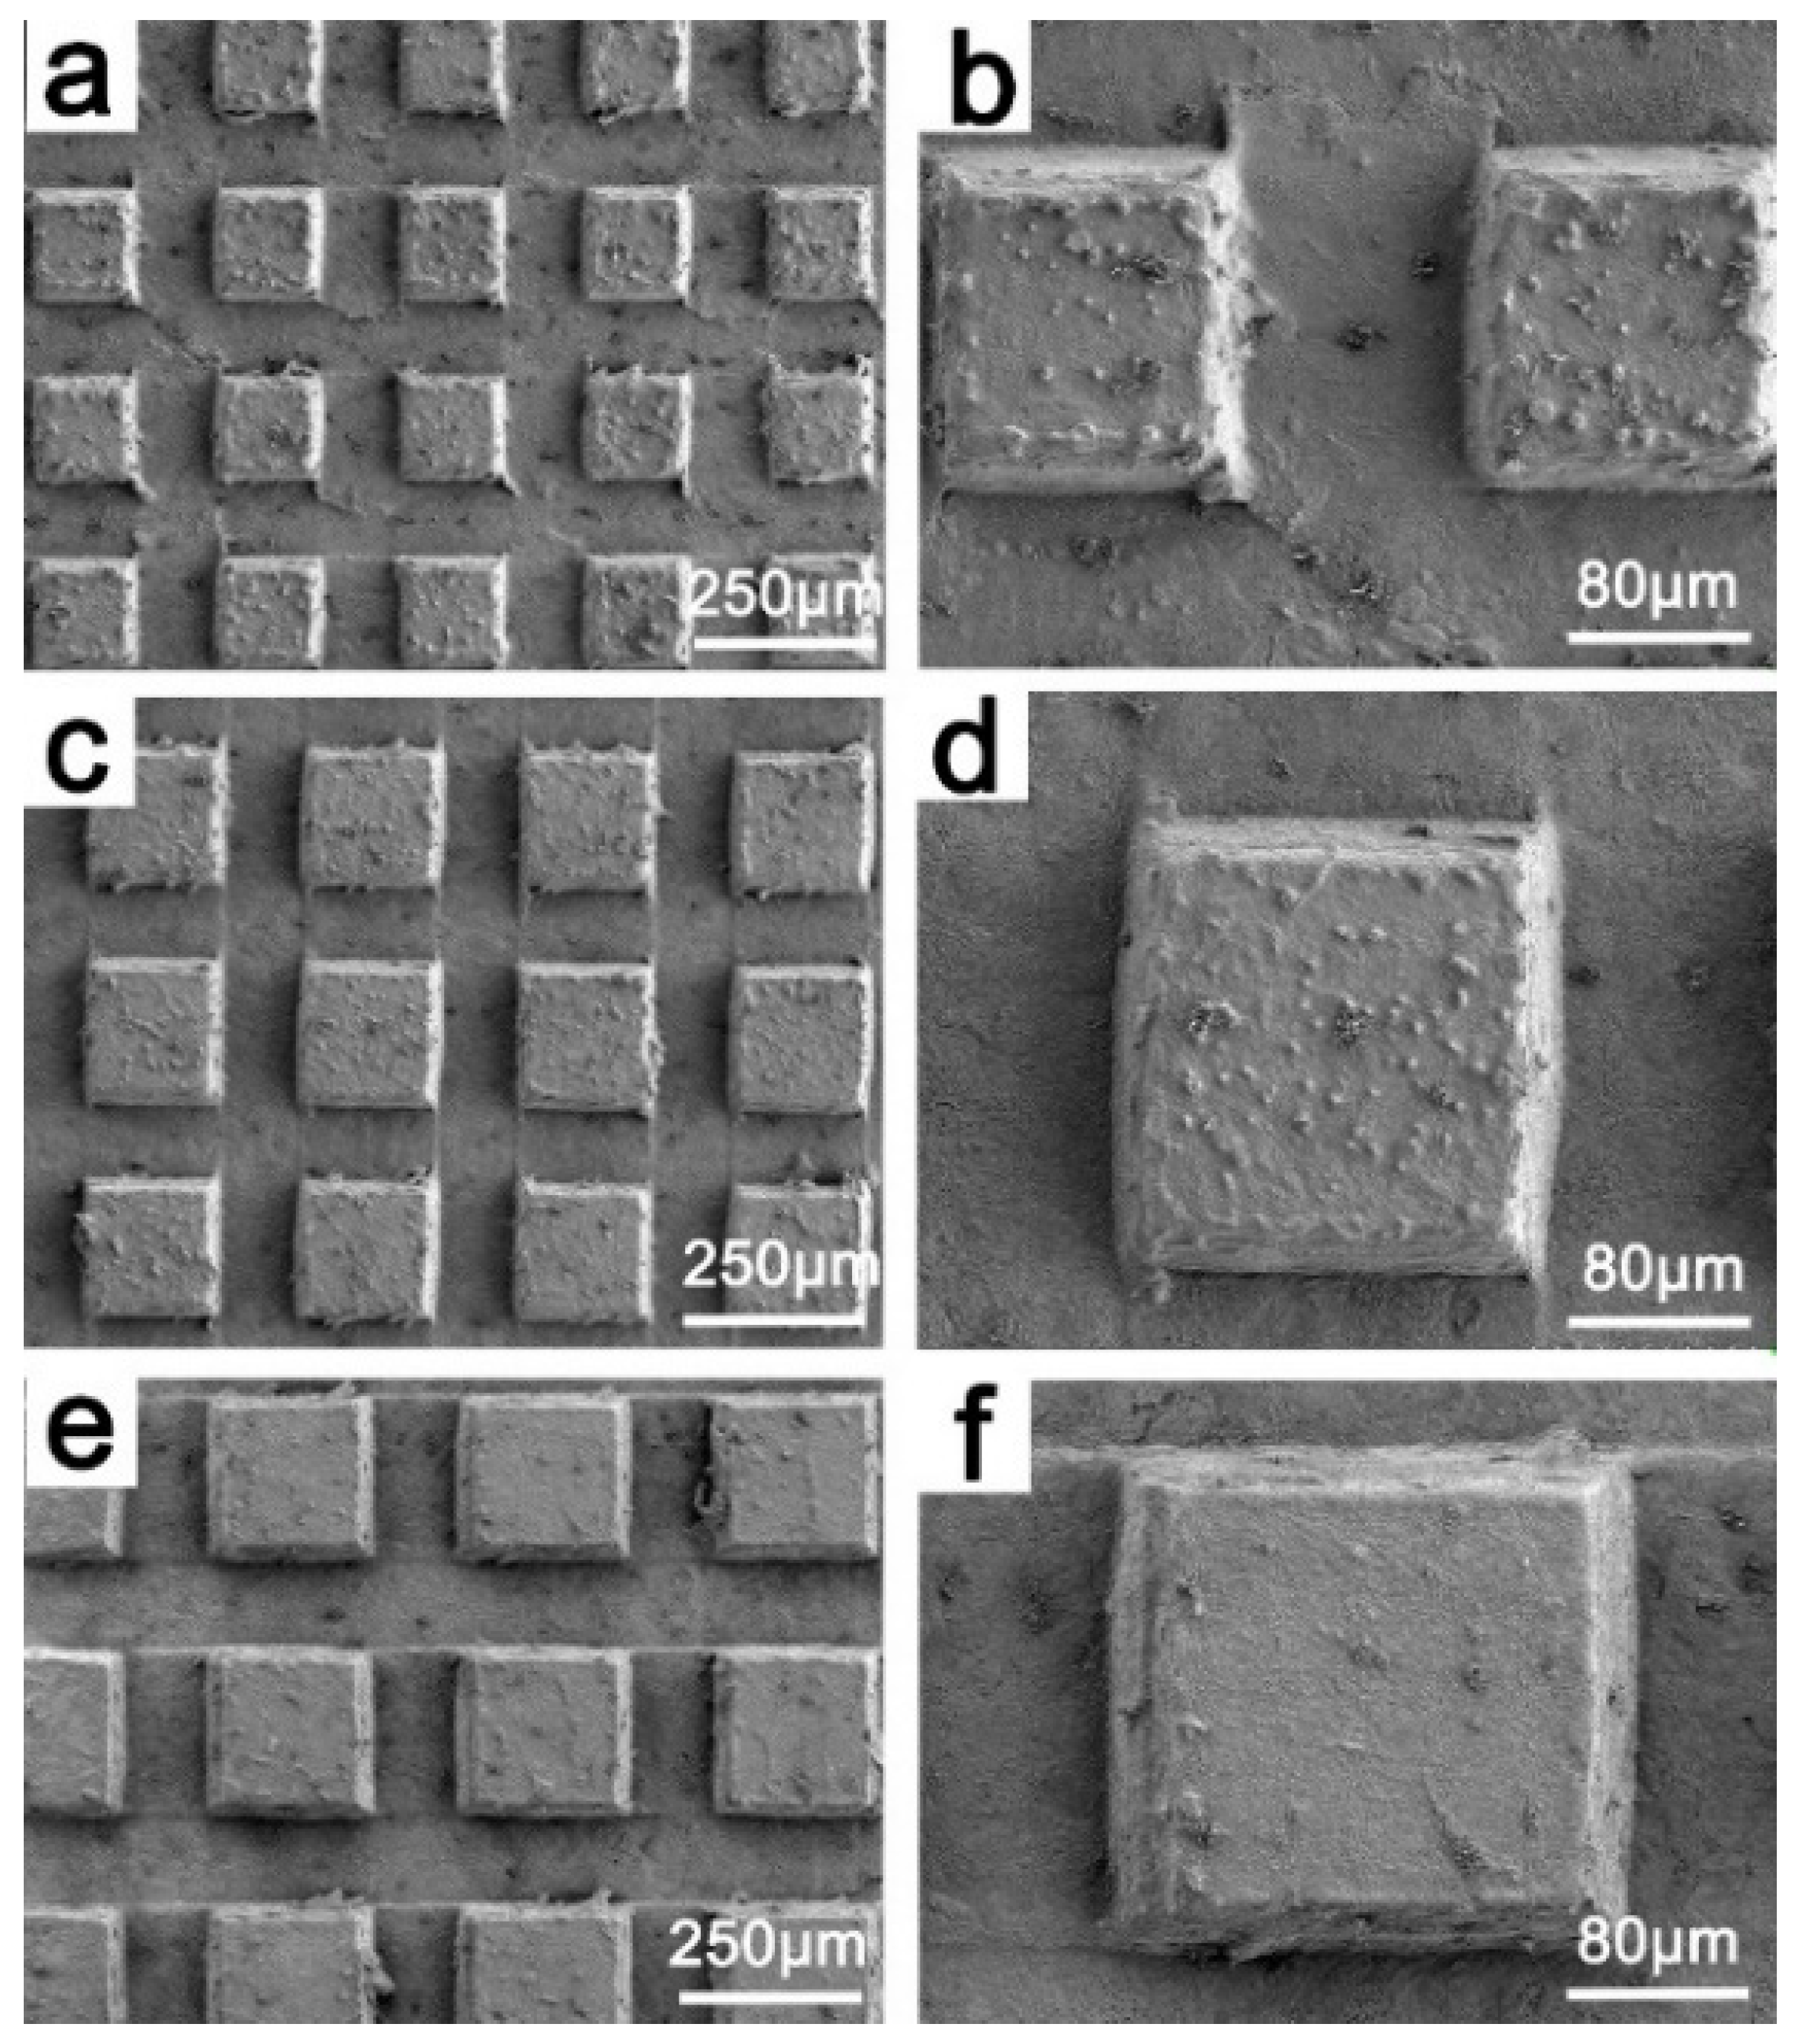
3.1. Sample Characterization
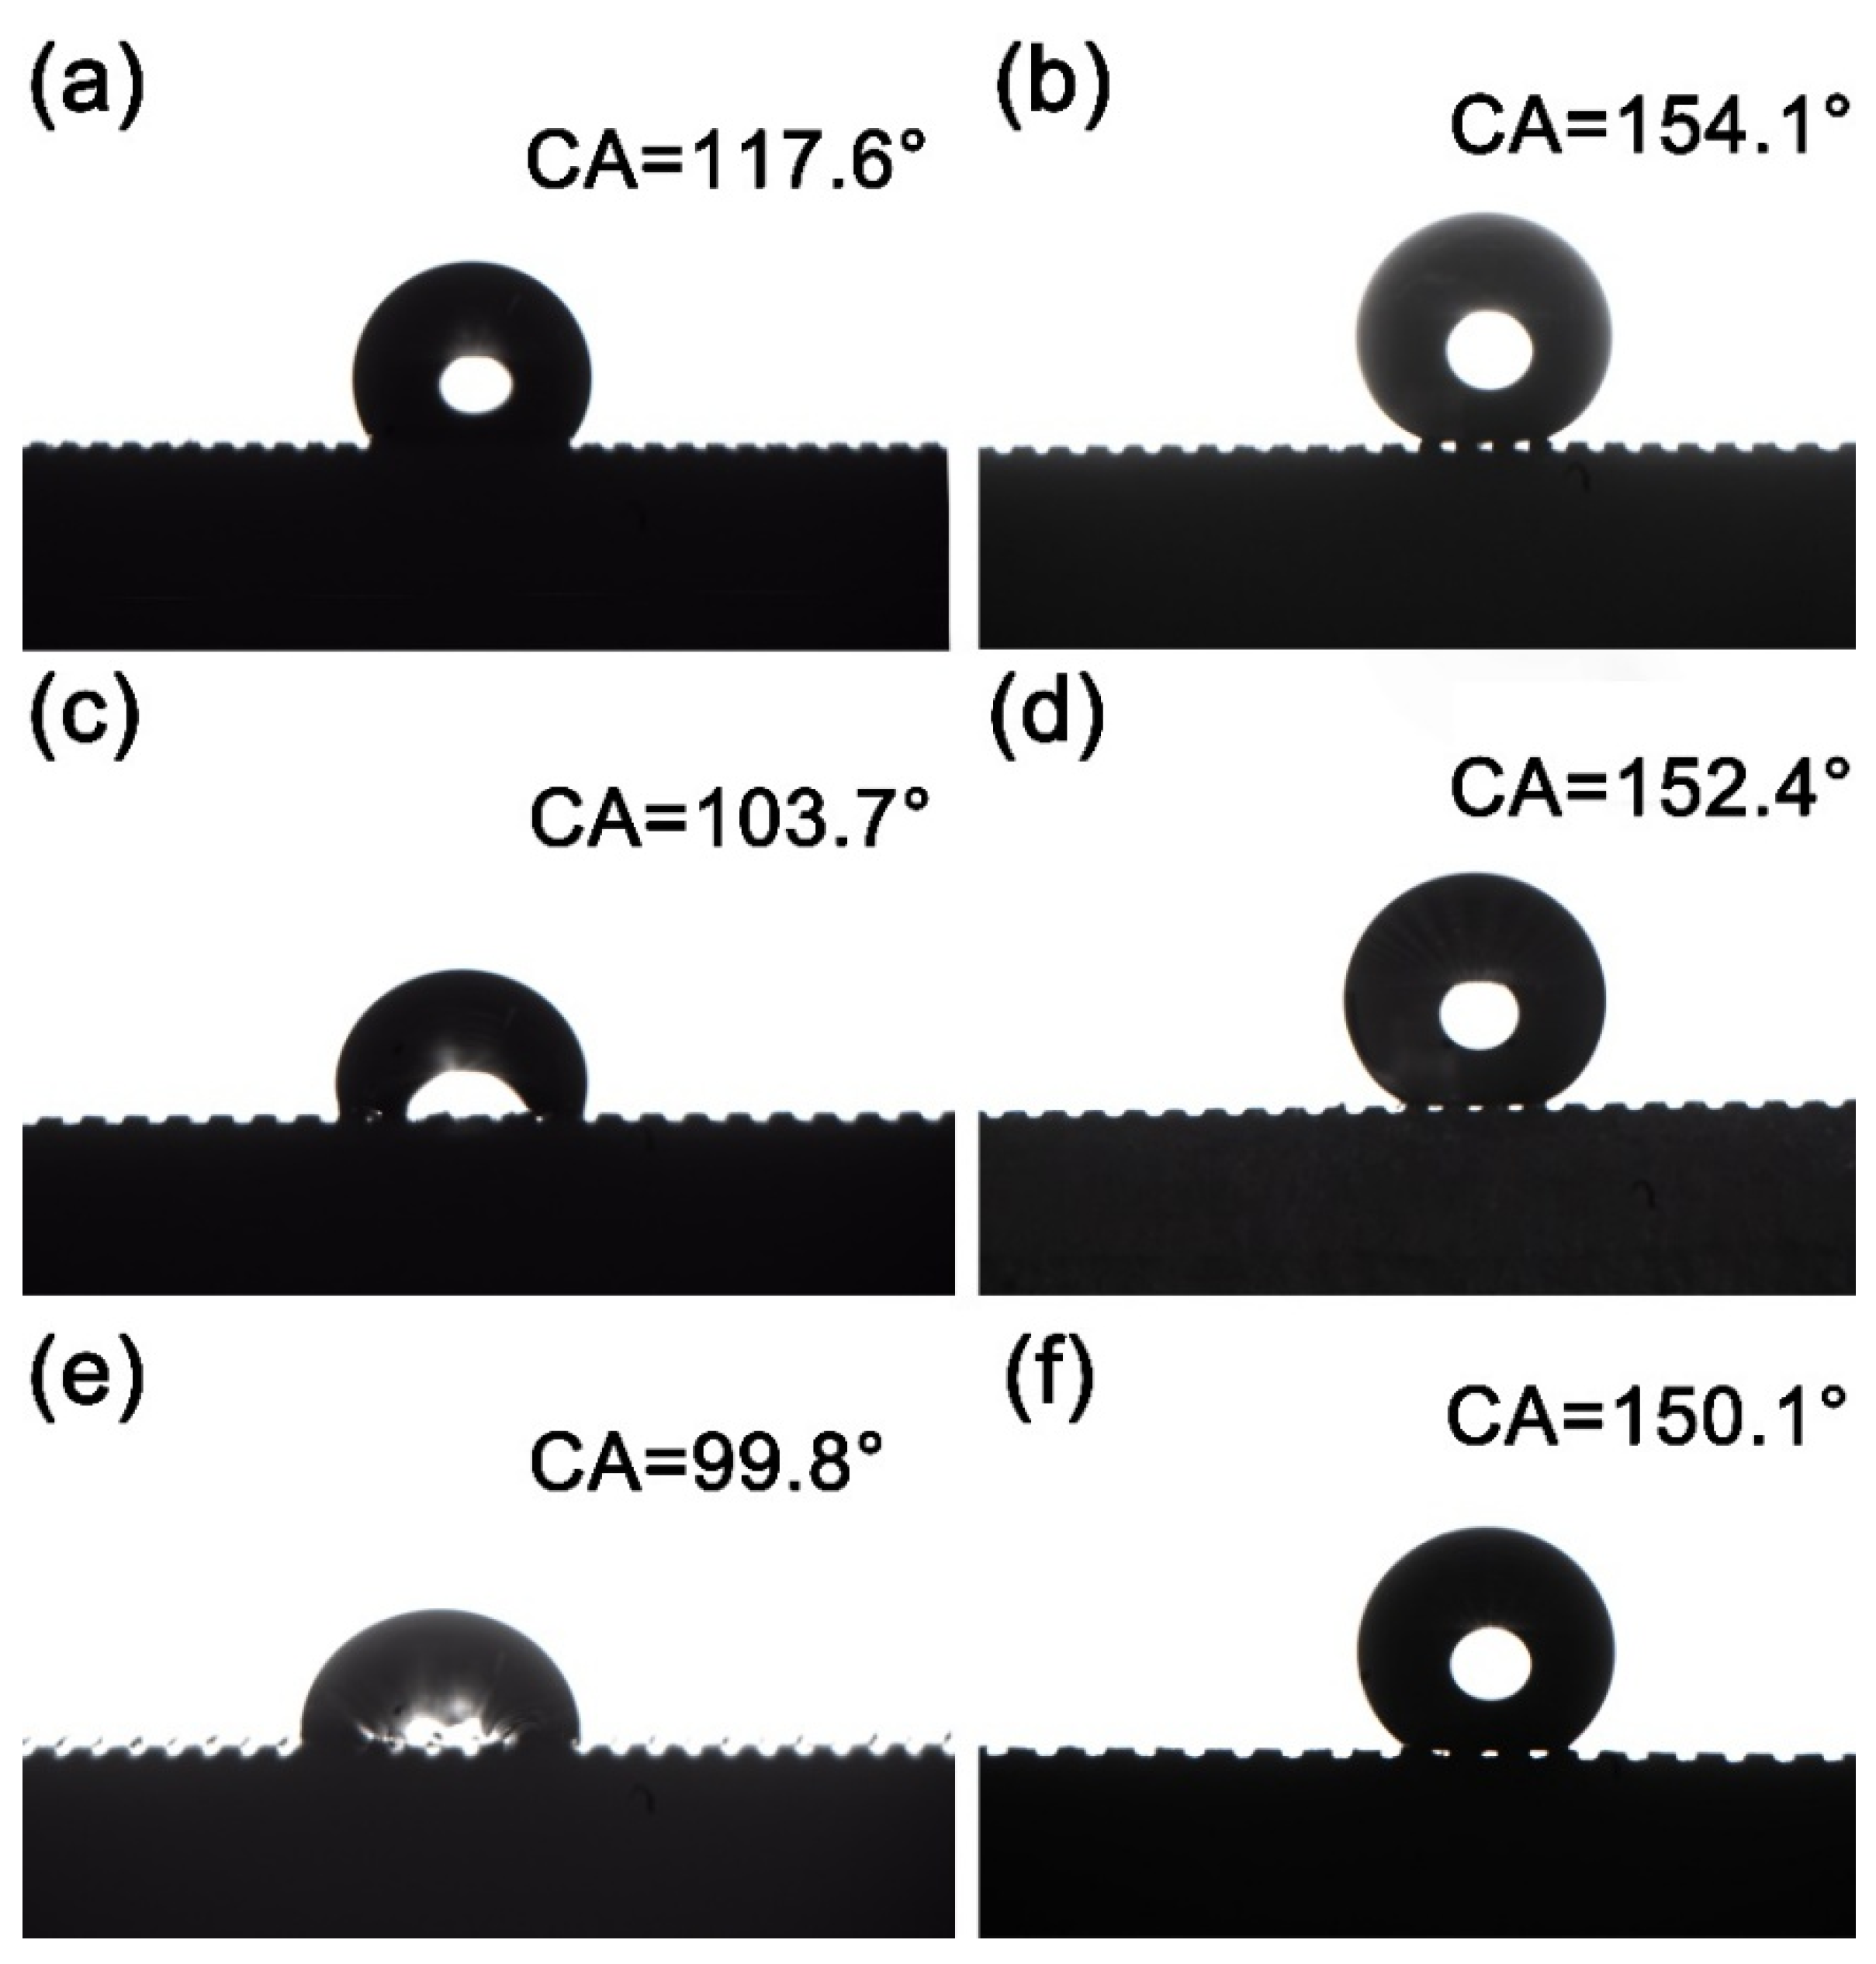
3.2. Surface Wettability Analysis
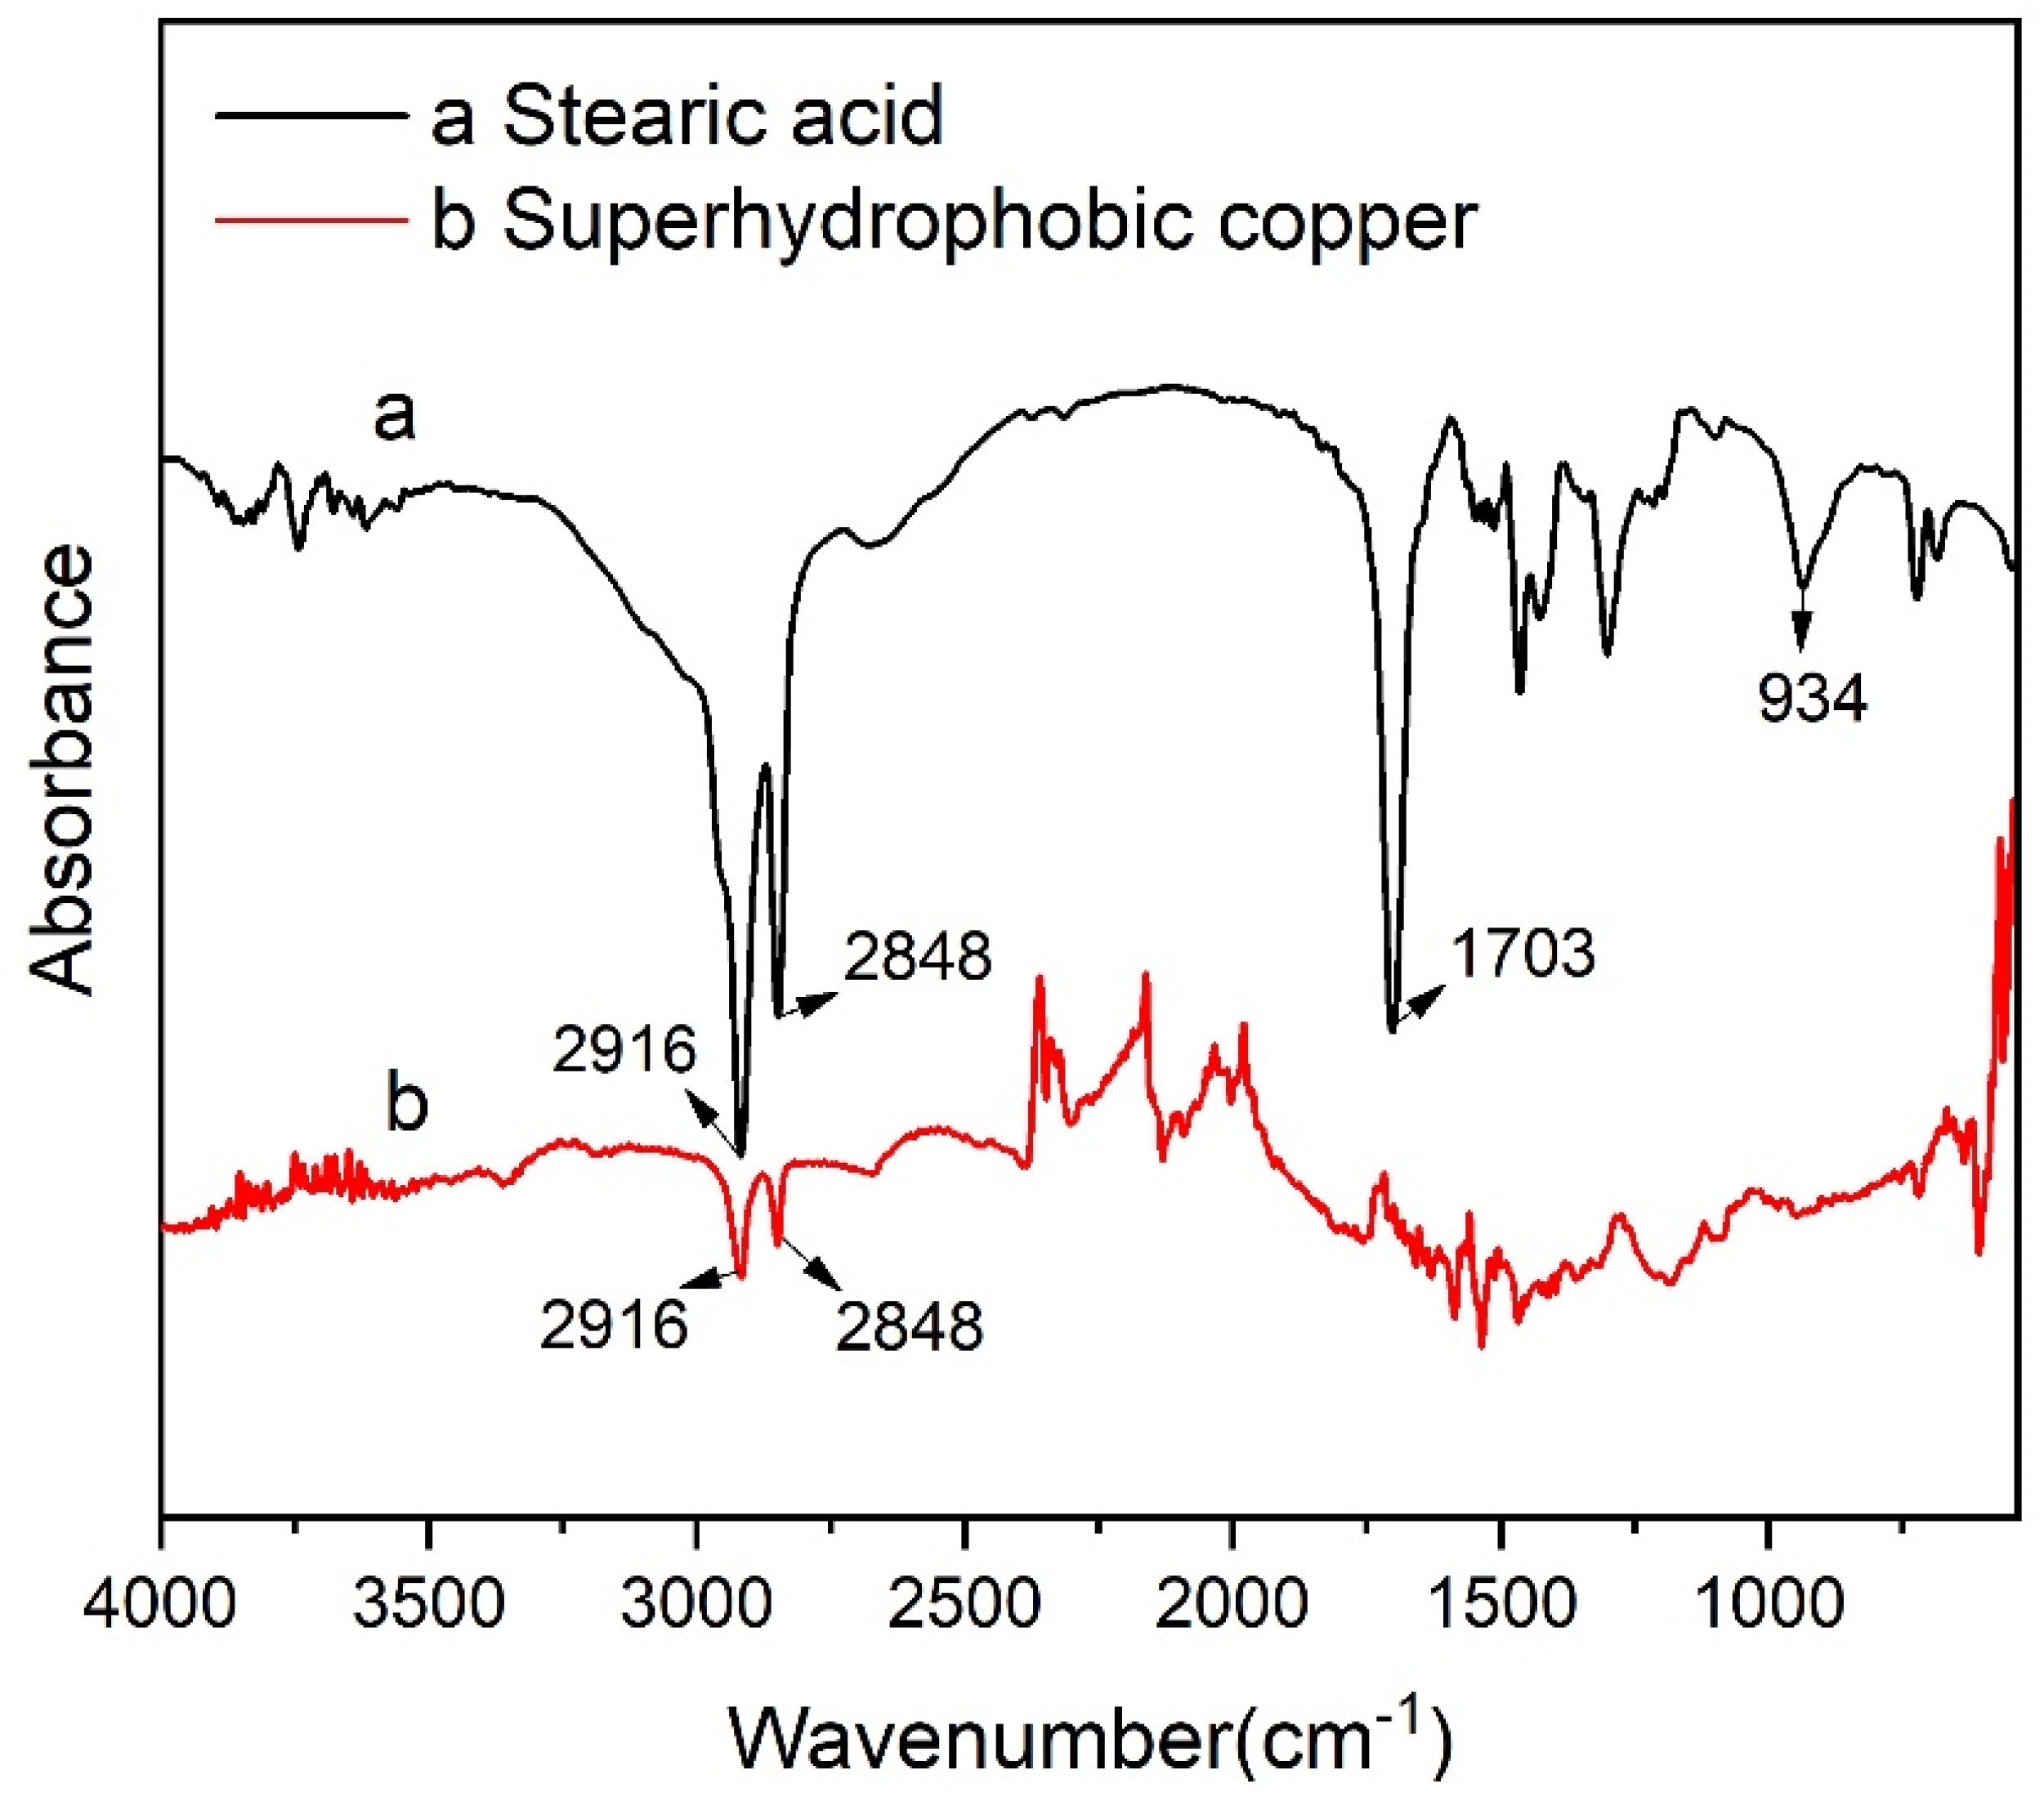
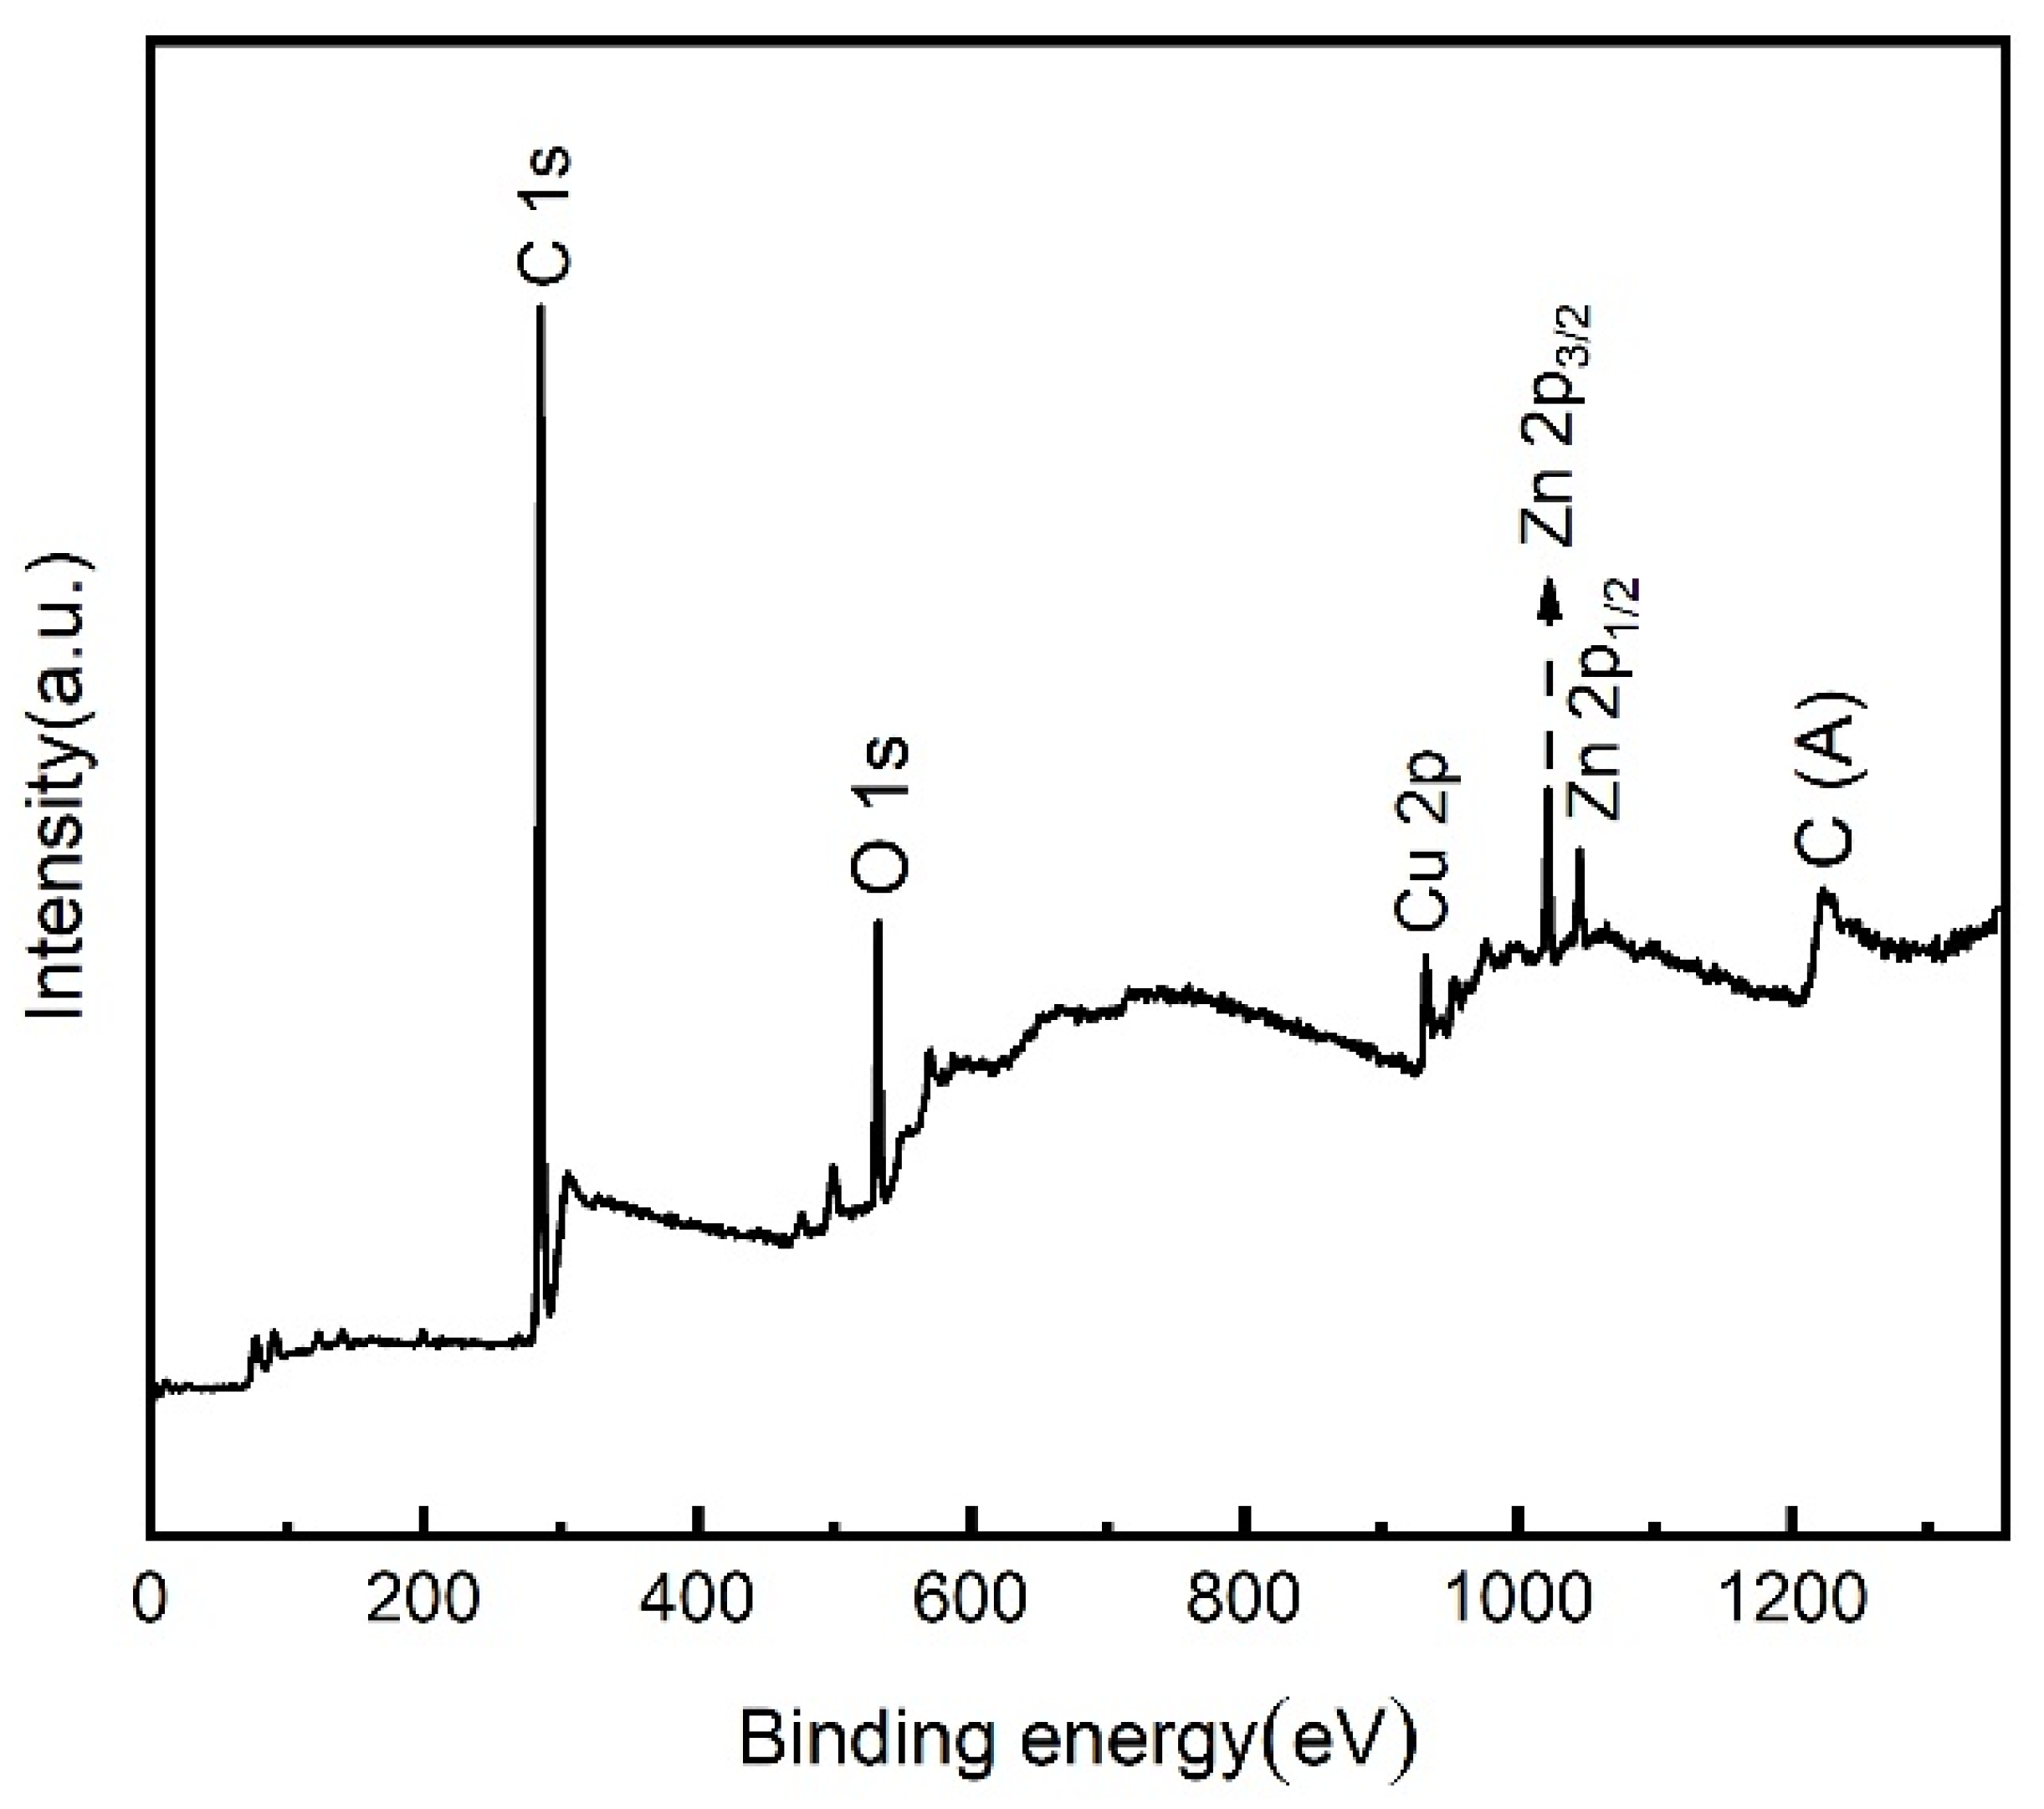
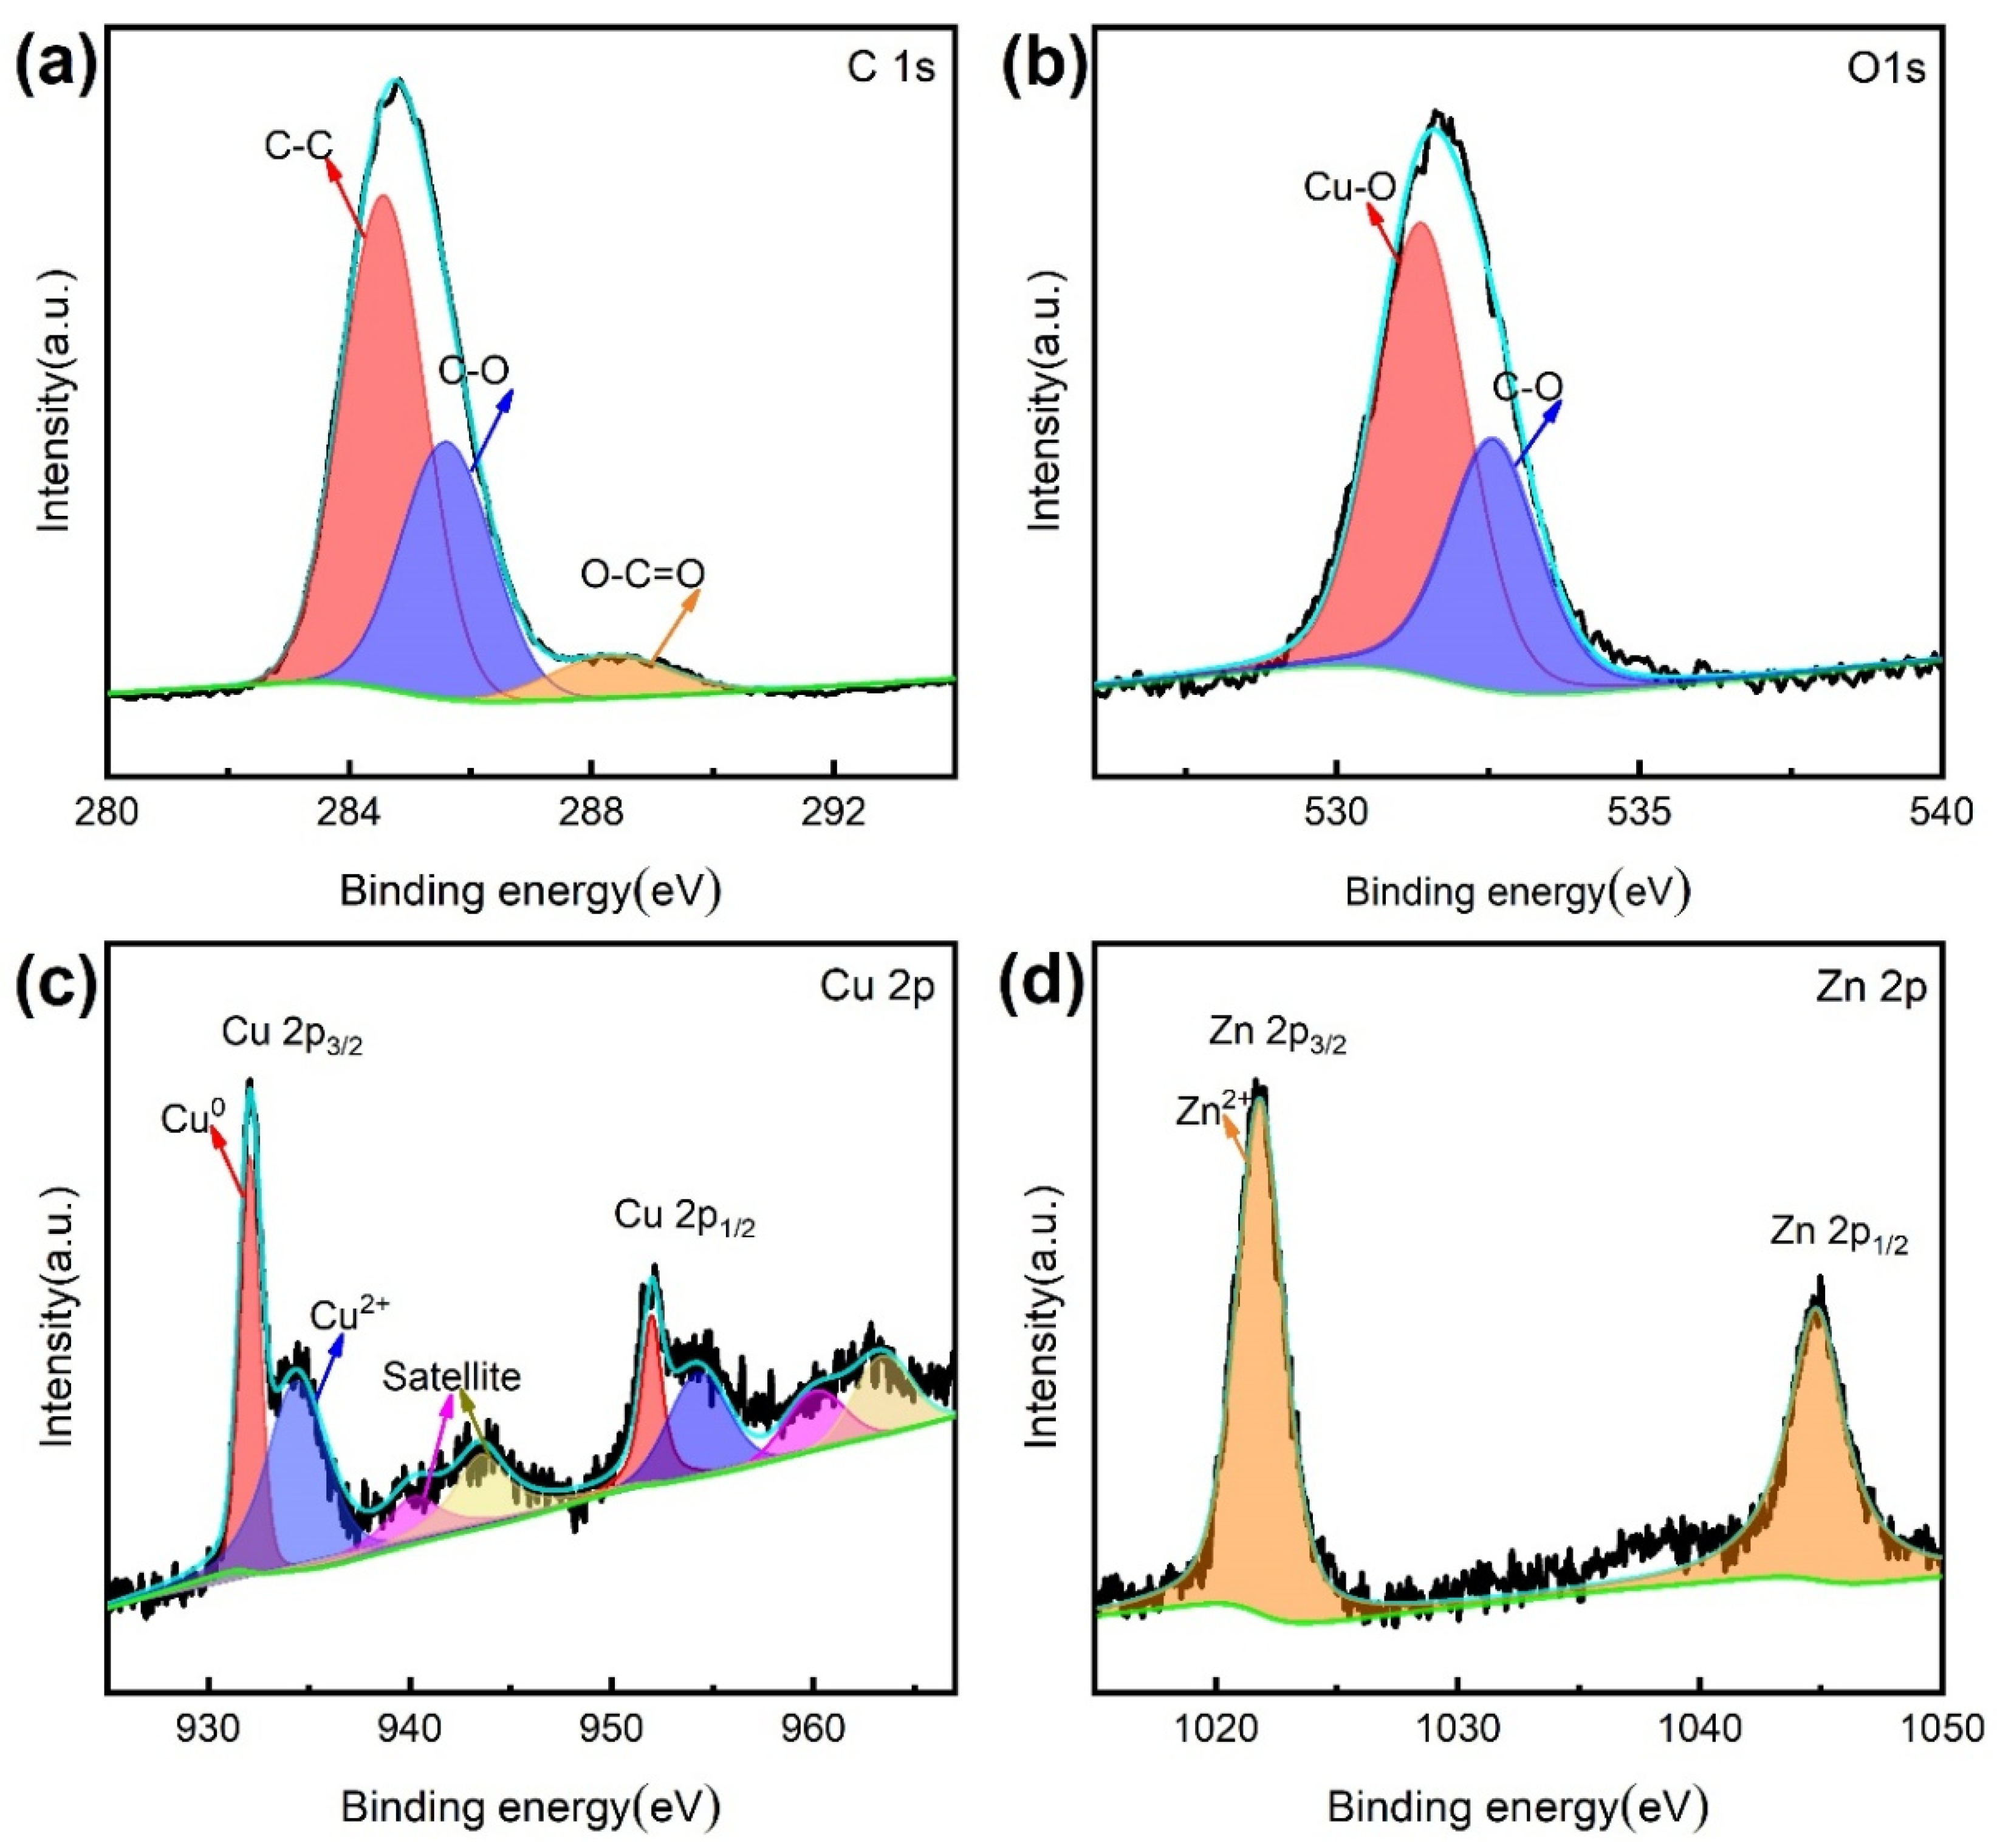
3.3. Surface Composition Analysis
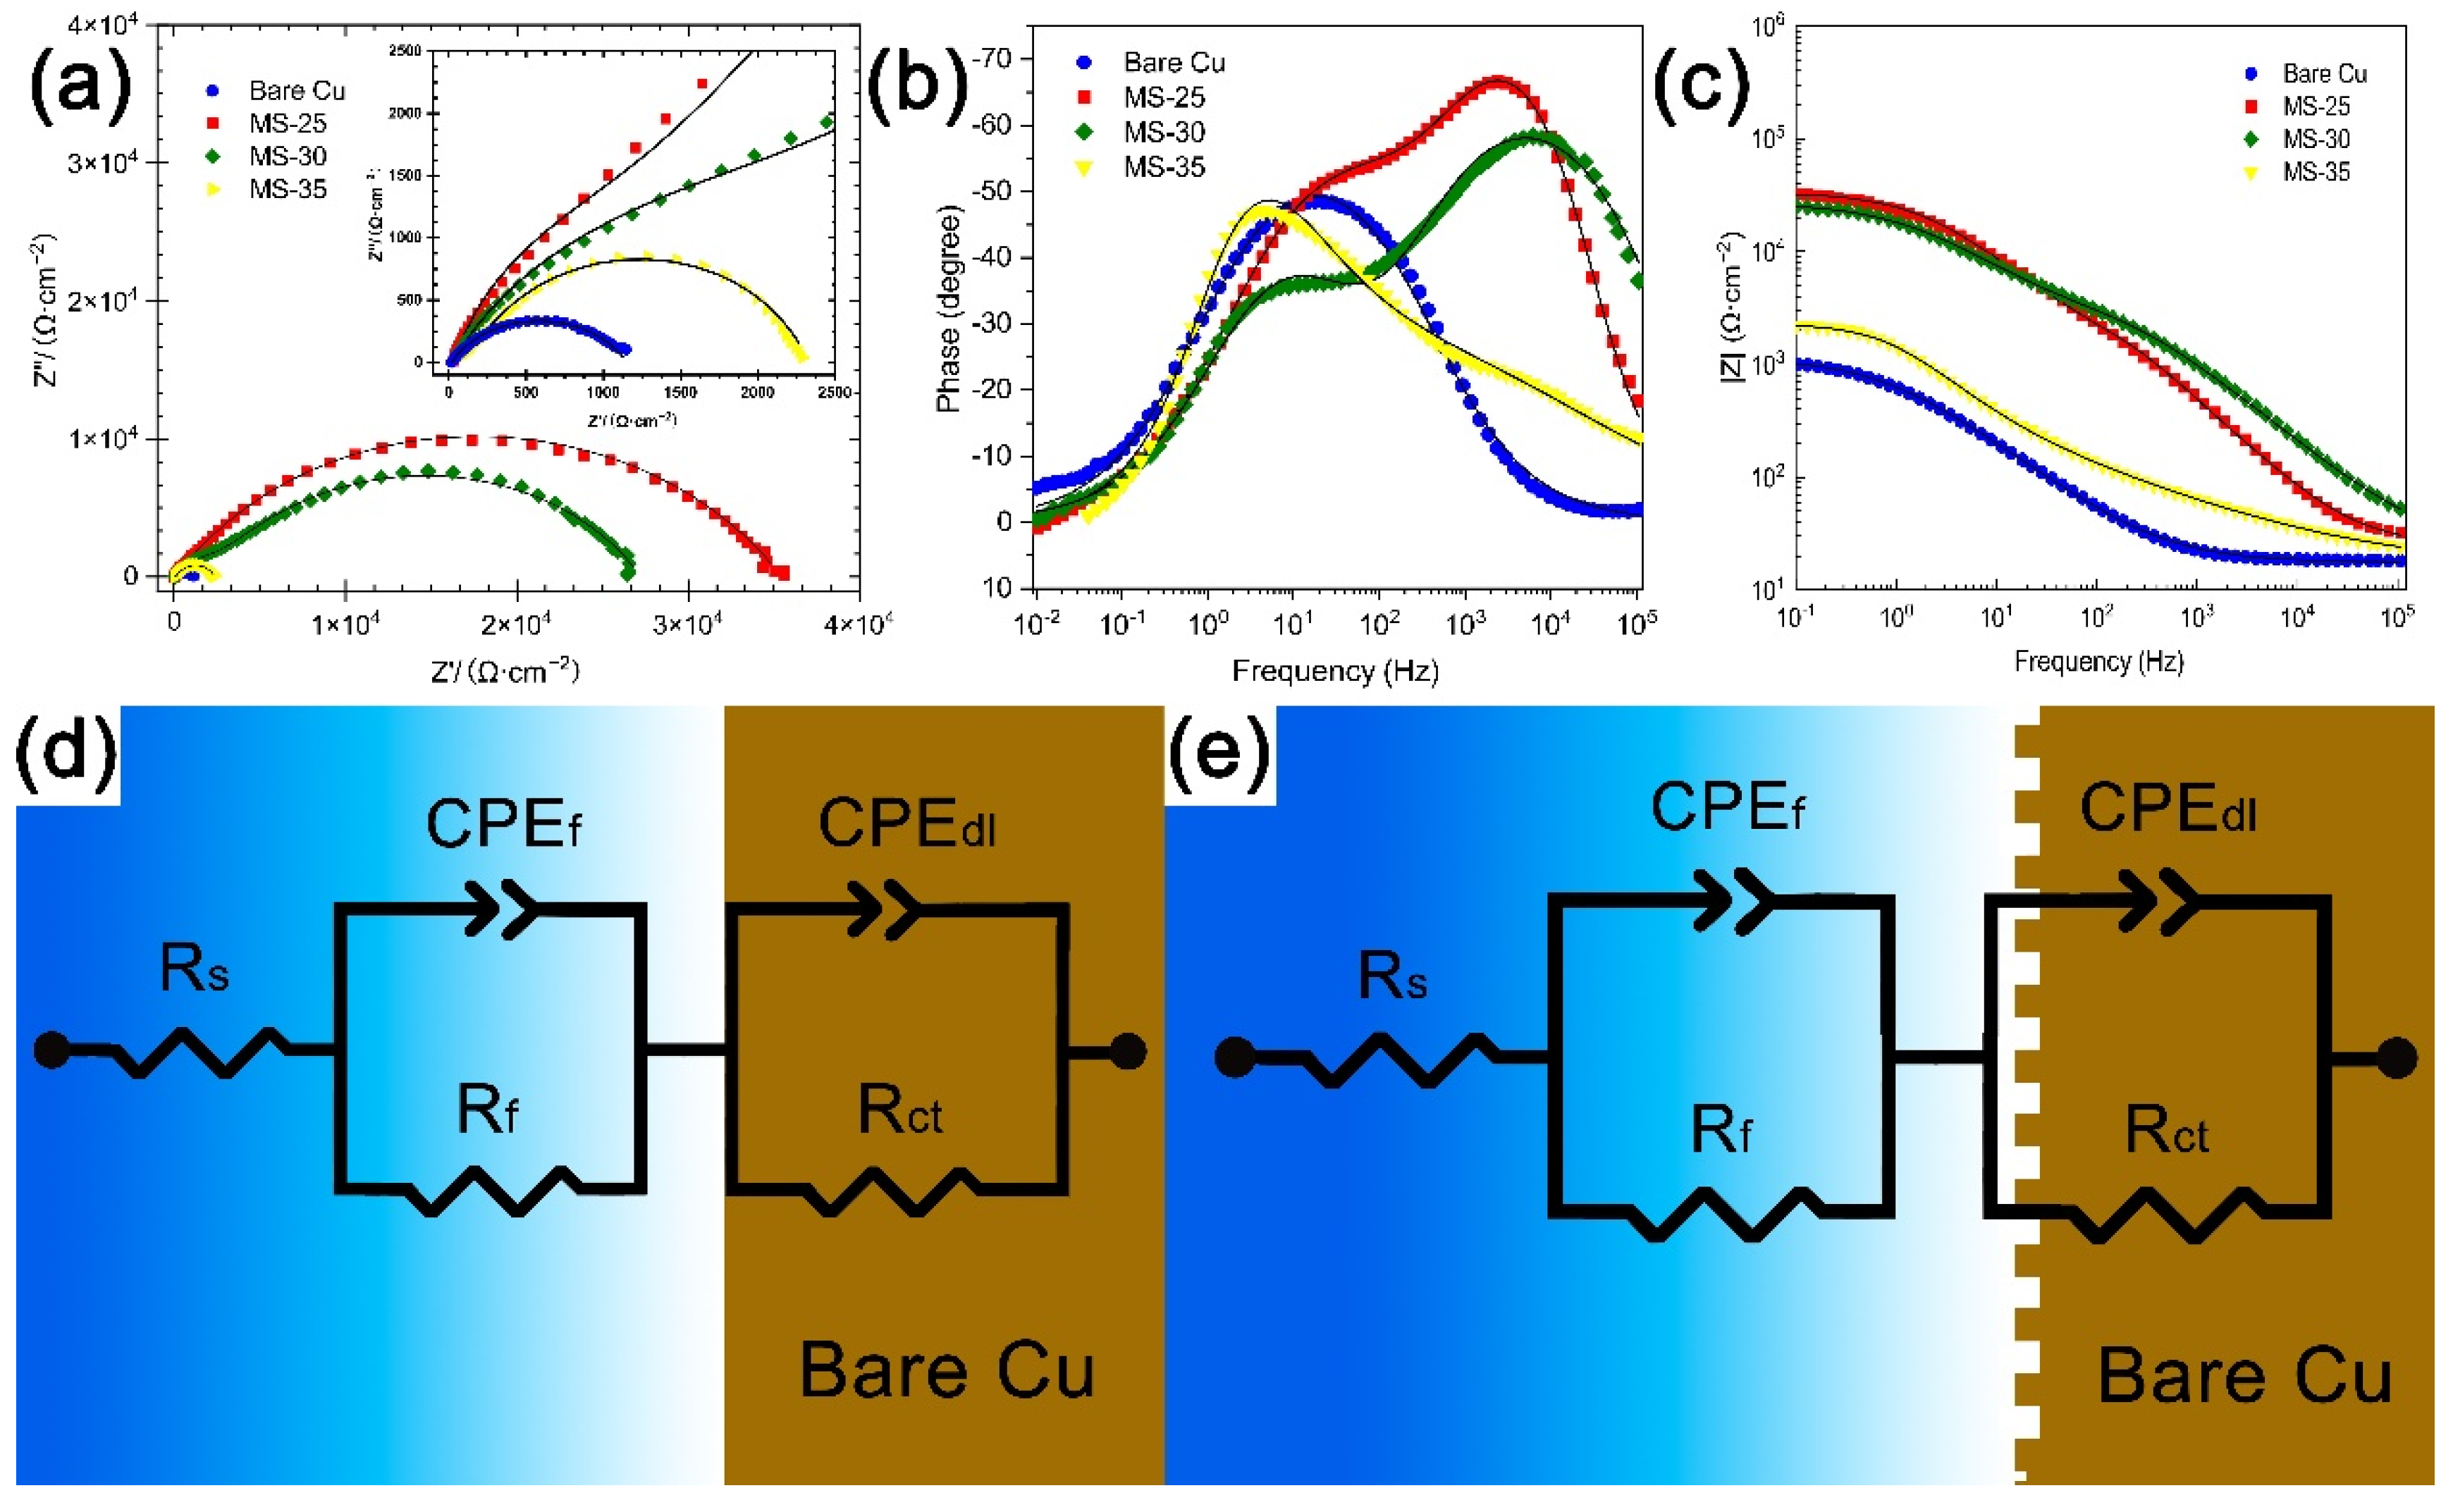
3.4. Analysis of Surface Corrosion Resistance
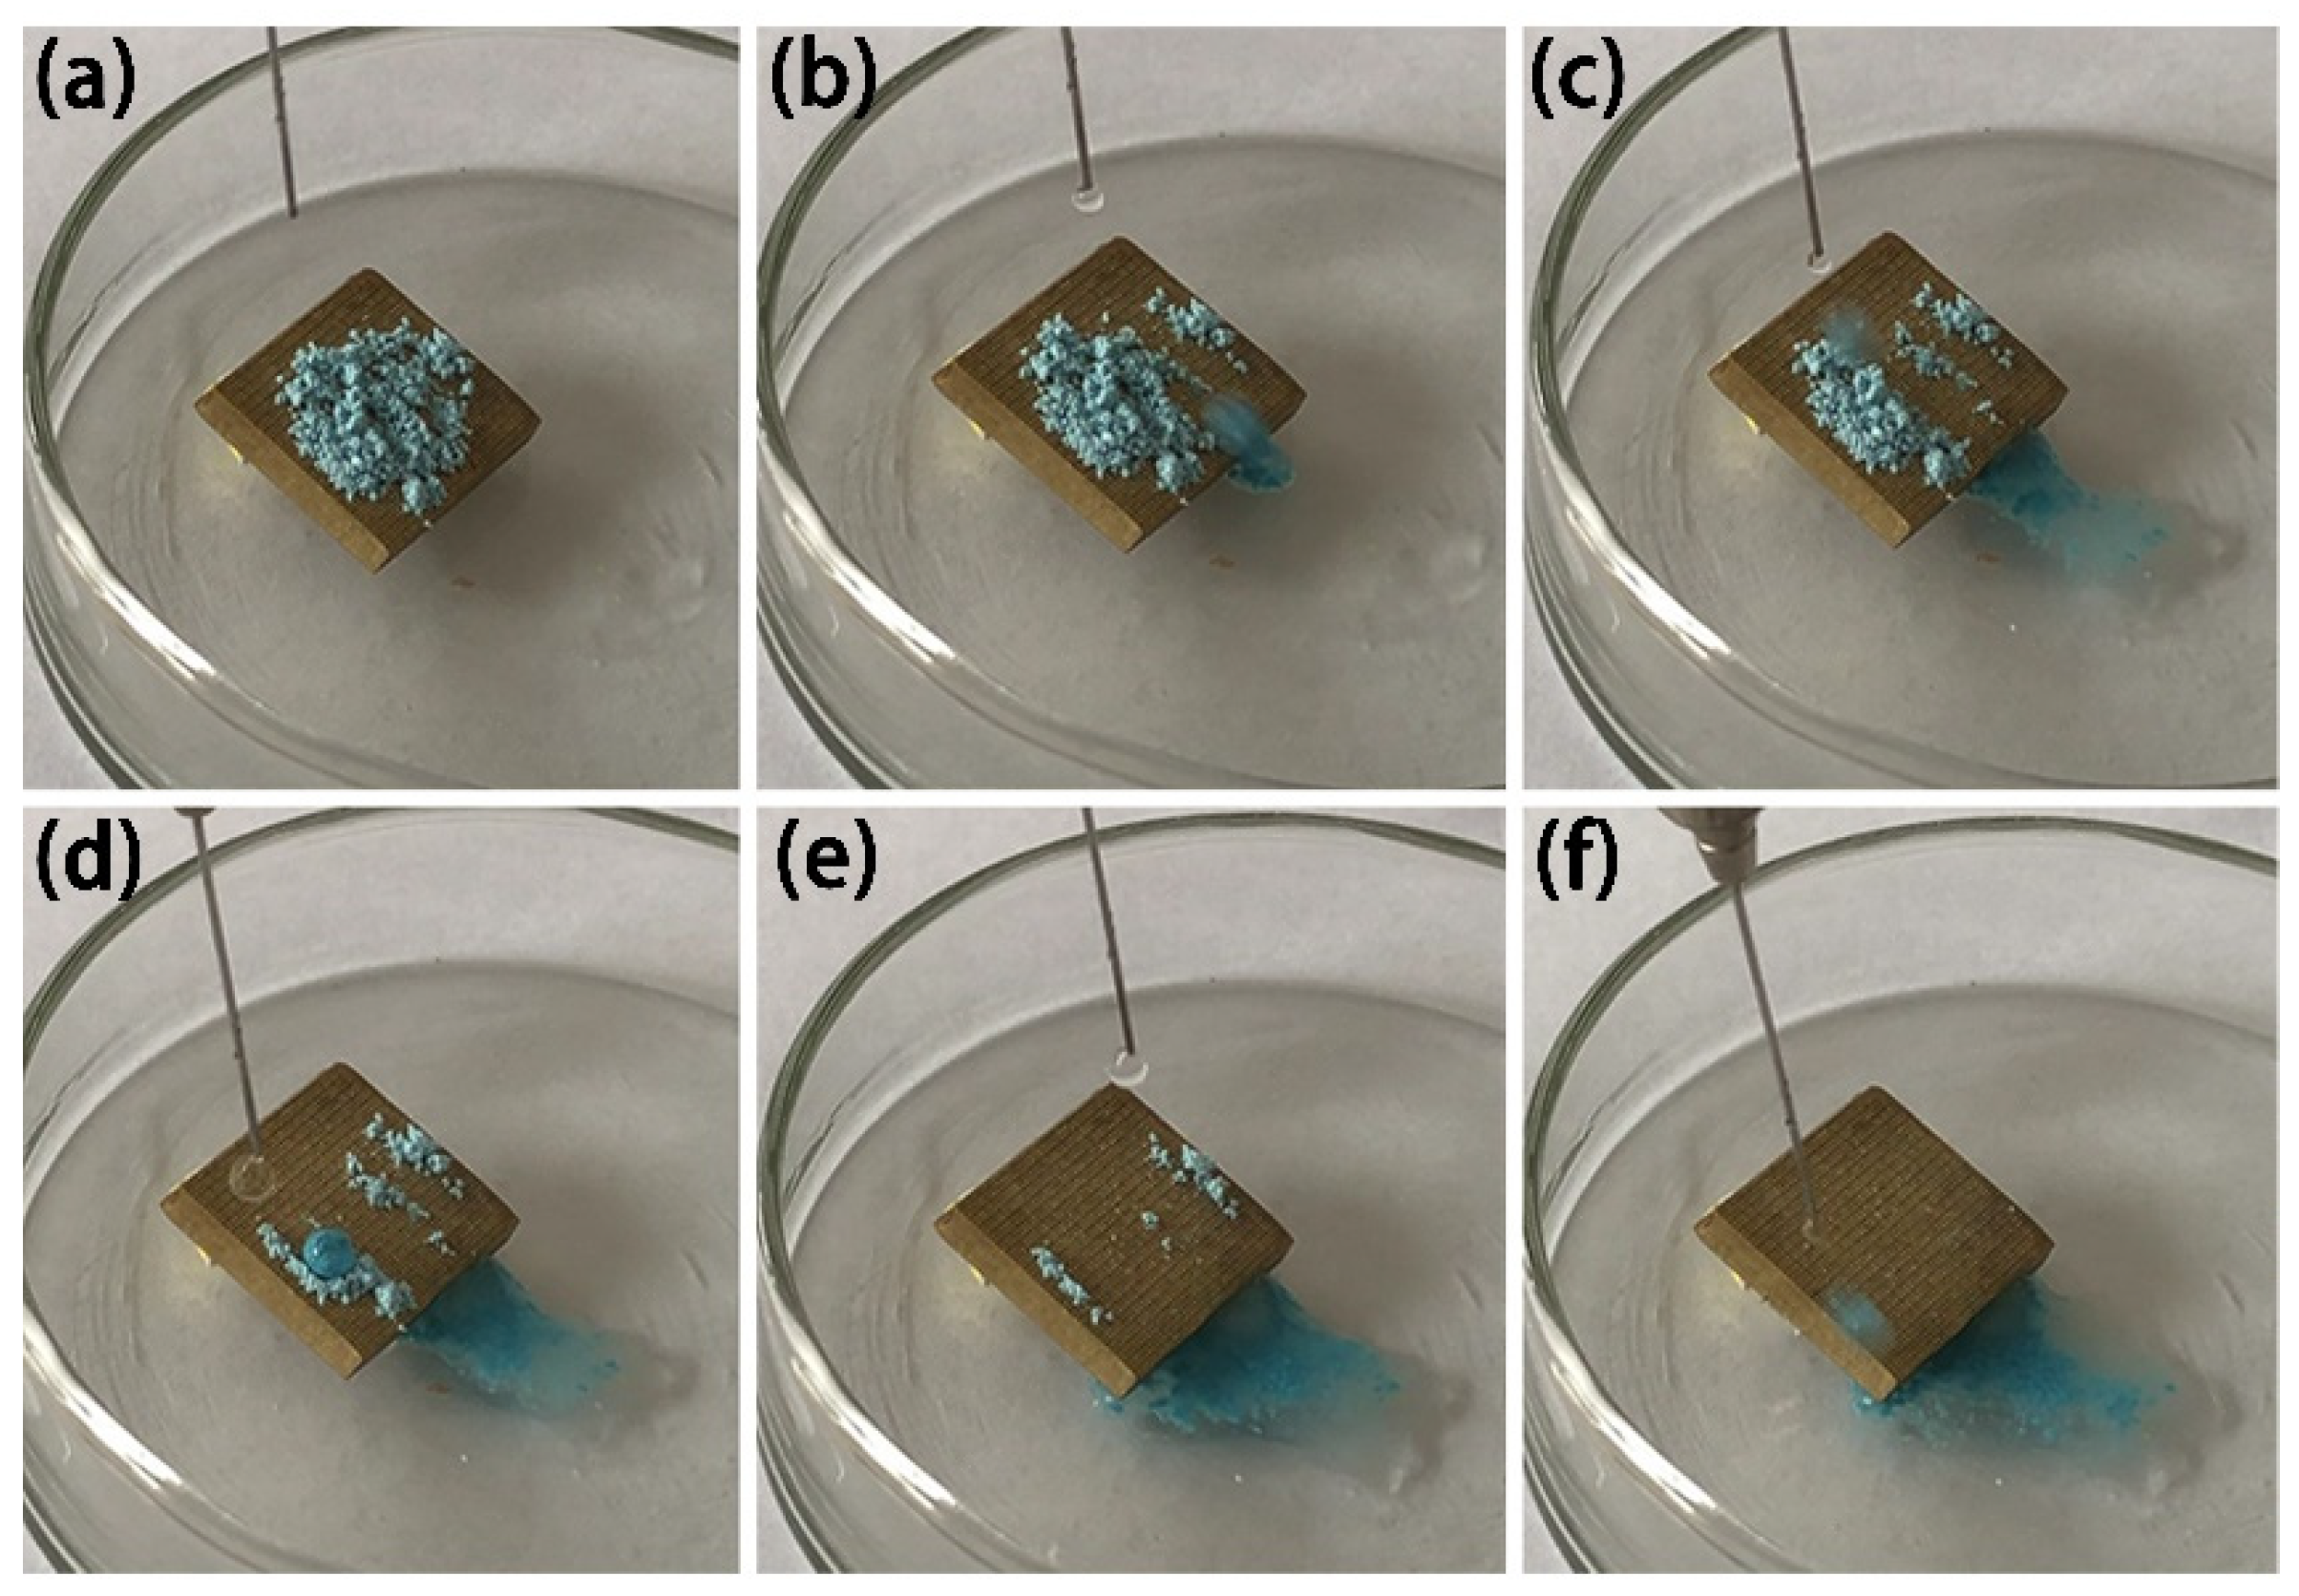
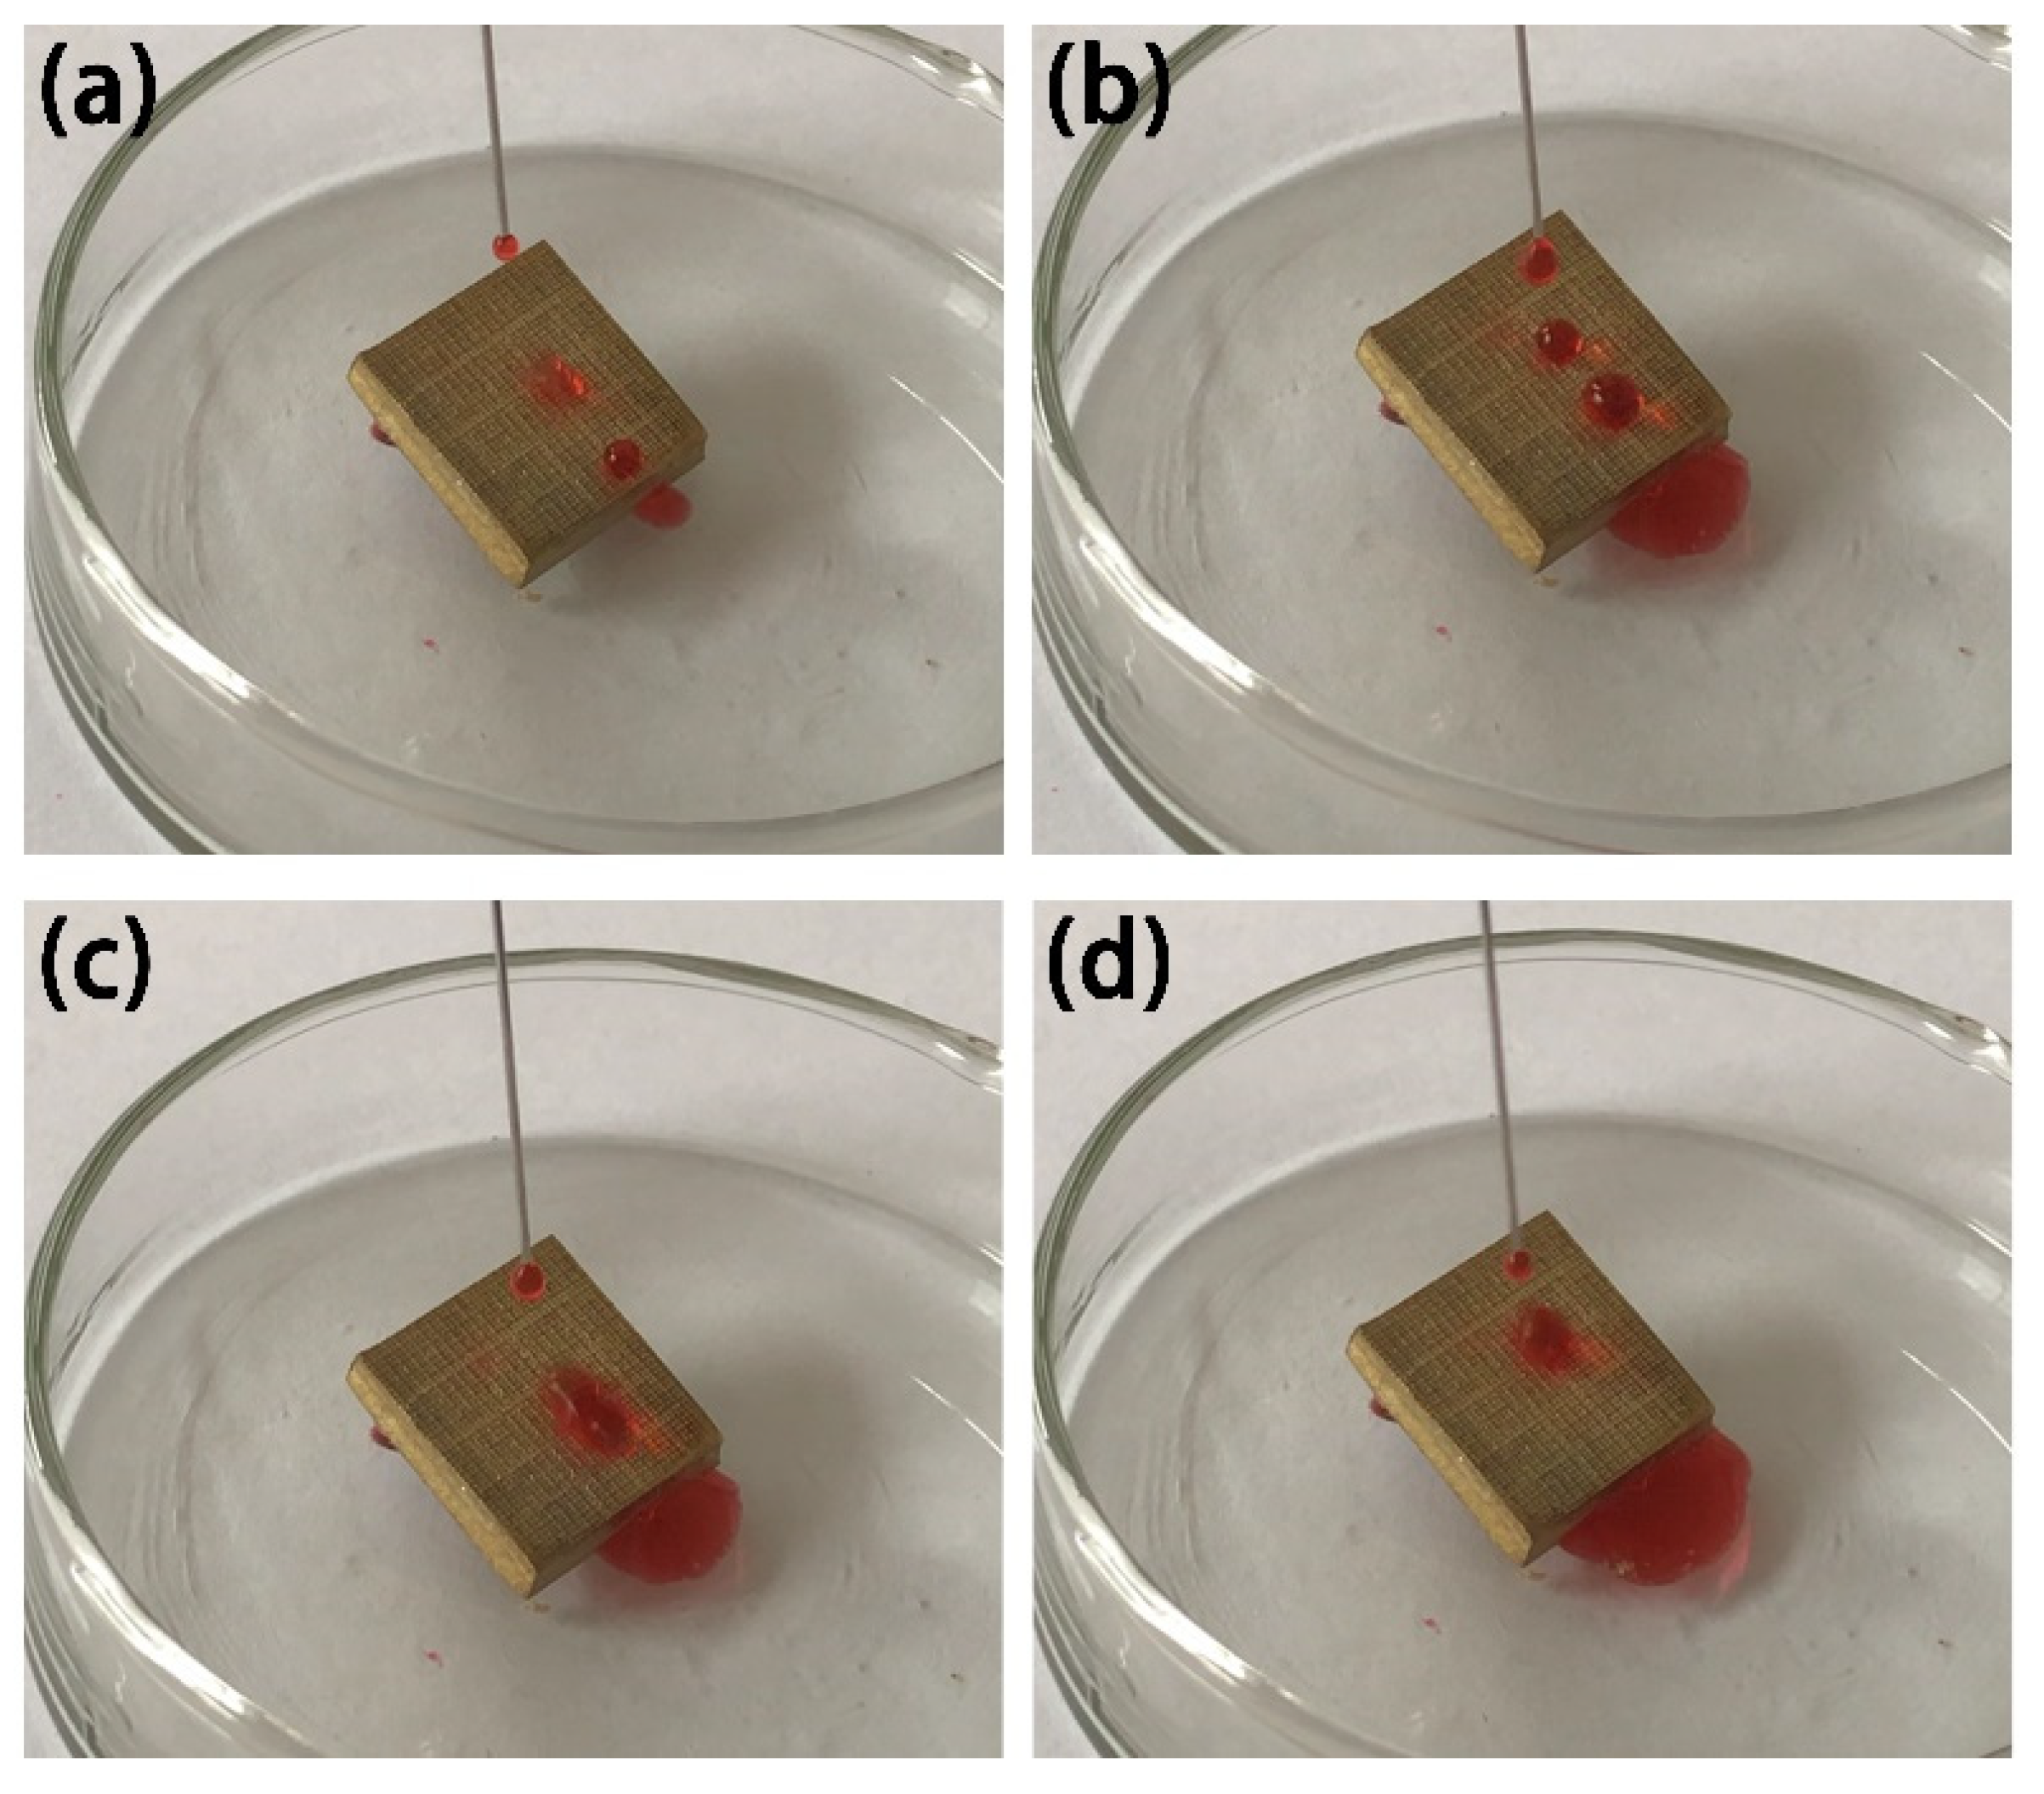
3.5. Self-Cleaning Effect
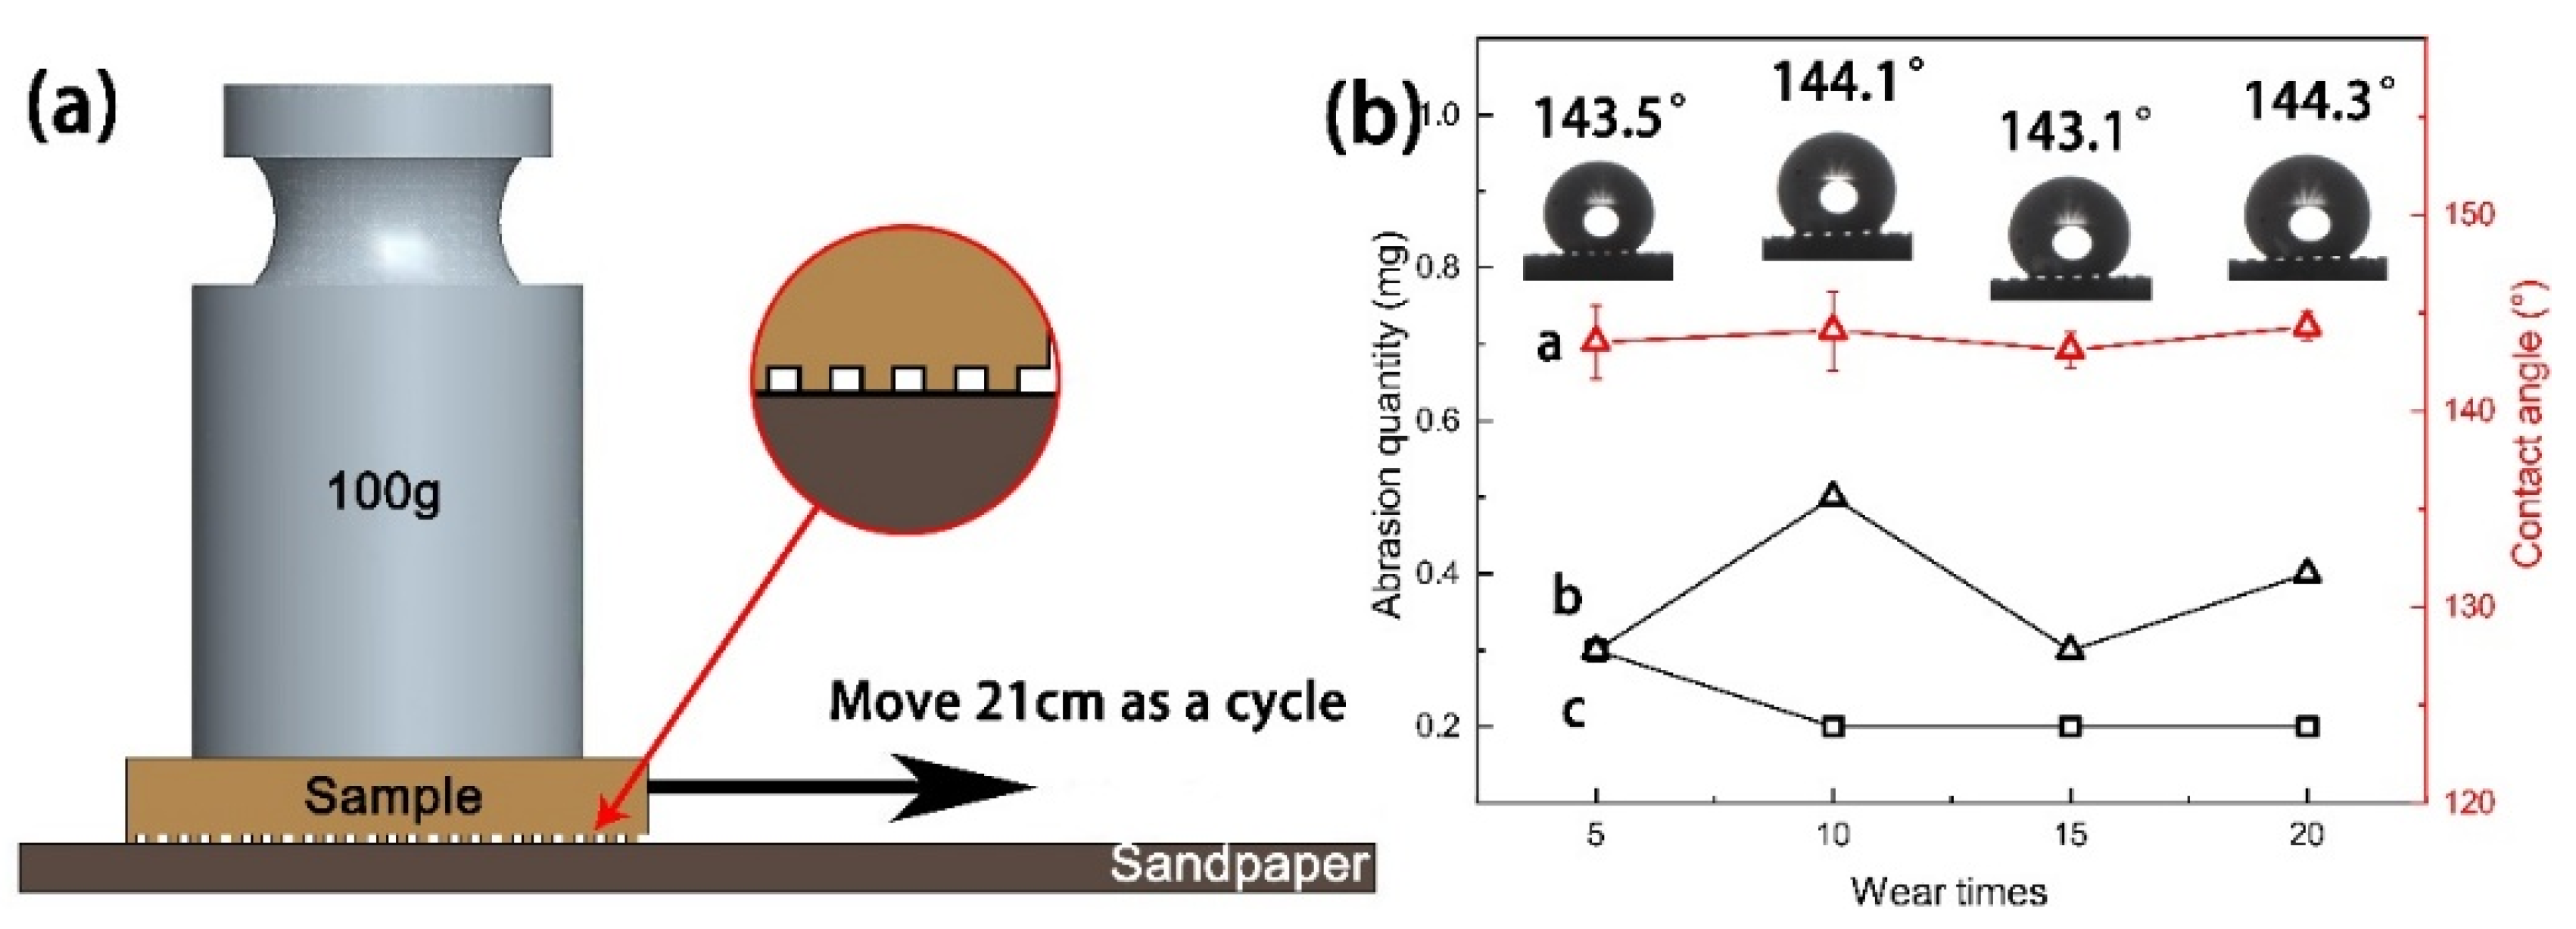
3.6. Mechanical Durability and Stability
4. Conclusions
Author Contributions
Funding
Institutional Review Board Statement
Informed Consent Statement
Data Availability Statement
Conflicts of Interest
References
- Shim, J.J.; Kim, J.G. Copper corrosion in potable water distribution systems: Influence of copper products on the corrosion behavior. Mater. Lett. 2004, 58, 2002–2006. [Google Scholar] [CrossRef]
- Shinato, K.W.; Zewde, A.A.; Jin, Y. Corrosion protection of copper and copper alloys in different corrosive medium using environmentally friendly corrosion inhibitors. Corros. Rev. 2020, 38, 101–109. [Google Scholar] [CrossRef]
- Mohamed, M.E.; Mahgoub, F.M.; Ragheb, D.M.; Abdel-Gaber, A.M. Novel and facile method for fabrication of robust superhydrophobic film on copper surface and its chemical, mechanical, and corrosion performance. Surf. Eng. 2021, 37, 1255–1265. [Google Scholar] [CrossRef]
- Shi, X.T.; Zhao, L.B.; Wang, J.; Feng, L.B. Toward Easily Enlarged Superhydrophobic Copper Surfaces with Enhanced Corrosion Resistance, Excellent Self-Cleaning and Anti-Icing Performance by a Facile Method. J. Nanosci. Nanotechnol. 2020, 20, 6317–6325. [Google Scholar] [CrossRef] [PubMed]
- Chen, J.S.; Guo, J.; Qiu, M.B.; Yang, J.M.; Huang, D.Z.; Wang, X.L.; Ding, Y.F. Preparation of Copper-Based Superhydrophobic Surfaces by Jet-Electrodeposition. Mater. Trans. 2018, 59, 793–798. [Google Scholar]
- Mohamed, A.M.A.; Abdullah, A.M.; Younan, N.A. Corrosion behavior of superhydrophobic surfaces: A review. Arab. J. Chem. 2015, 8, 749–765. [Google Scholar] [CrossRef] [Green Version]
- Qu, M.N.; Hou, L.G.; He, J.M.; Ma, X.R.; Yuan, M.J.; Liu, X.R. Research and Development of Functional Superhydrophobic Materials. Prog. Chem. 2016, 28, 1774–1787. [Google Scholar]
- Zhao, W.Y.; Li, J.; Jin, Y.; Chen, M. Preparation and corrosion resistance of superhydrophobic film by one-step electrodeposition. Mater. Res. Express 2021, 8, 9. [Google Scholar] [CrossRef]
- Qian, B.T.; Shen, Z.Q. Fabrication of superhydrophobic surfaces by dislocation-selective chemical etching on aluminum, copper, and zinc substrates. Langmuir 2005, 21, 9007–9009. [Google Scholar] [CrossRef]
- Liu, T.; Yin, Y.S.; Chen, S.G.; Chang, X.T.; Cheng, S. Super-hydrophobic surfaces improve corrosion resistance of copper in seawater. Electrochim. Acta 2007, 52, 3709–3713. [Google Scholar] [CrossRef]
- Rao, A.V.; Latthe, S.S.; Mahadik, S.A.; Kappenstein, C. Mechanically stable and corrosion resistant superhydrophobic sol-gel coatings on copper substrate. Appl. Surf. Sci. 2011, 257, 5772–5776. [Google Scholar] [CrossRef]
- Wu, L.K.; Zhang, X.F.; Hu, J.M. Corrosion protection of mild steel by one-step electrodeposition of superhydrophobic silica film. Corrosion Sci. 2014, 85, 482–487. [Google Scholar] [CrossRef]
- Crick, C.R.; Parkin, I.P. CVD of copper and copper oxide thin films via the in situ reduction of copper (II) nitrate-a route to conformal superhydrophobic coatings. J. Mater. Chem. 2011, 21, 14712–14716. [Google Scholar] [CrossRef]
- Zhang, F.; Shi, Z.W.; Chen, L.S.; Jiang, Y.J.; Xu, C.Y.; Wu, Z.H.; Wang, Y.Y.; Peng, C.S. Porous superhydrophobic and superoleophilic surfaces prepared by template assisted chemical vapor deposition. Surf. Coat. Technol. 2017, 315, 385–390. [Google Scholar] [CrossRef]
- Scarratt, L.R.J.; Steiner, U.; Neto, C. A review on the mechanical and thermodynamic robustness of superhydrophobic surfaces. Adv. Colloid Interface Sci. 2017, 246, 133–152. [Google Scholar] [CrossRef]
- Sun, T.L.; Wang, G.J.; Feng, L.; Liu, B.Q.; Ma, Y.M.; Jiang, L.; Zhu, D.B. Reversible switching between superhydrophilicity and superhydrophobicity. Angew. Chem. Int. Ed. 2004, 43, 357–360. [Google Scholar] [CrossRef]
- Mousavi, S.M.A.; Pitchumani, R. A study of corrosion on electrodeposited superhydrophobic copper surfaces. Corros. Sci. 2021, 186, 16. [Google Scholar] [CrossRef]
- Forooshani, H.M.; Aliofkhazraei, M.; Rouhaghdam, A.S. Superhydrophobic copper surfaces by shot peening and chemical treatment. Surf. Rev. Lett. 2017, 24, 6. [Google Scholar] [CrossRef]
- Ta, D.V.; Dunn, A.; Wasley, T.J.; Kay, R.W.; Stringer, J.; Smith, P.J.; Connaughton, C.; Shephard, J.D. Nanosecond laser textured superhydrophobic metallic surfaces and their chemical sensing applications. Appl. Surf. Sci. 2015, 357, 248–254. [Google Scholar] [CrossRef] [Green Version]
- Tian, Y.L.; Zhao, Y.C.; Yang, C.J.; Wang, F.J.; Liu, X.P.; Jing, X.B. Fabrication of bio-inspired nitinol alloy surface with tunable anisotropic wetting and high adhesive ability. J. Colloid Interface Sci. 2018, 527, 328–338. [Google Scholar] [CrossRef]
- Yang, Z.; Liu, X.P.; Tian, Y.L. Hybrid Laser Ablation and Chemical Modification for Fast Fabrication of Bio-inspired Super-hydrophobic Surface with Excellent Self-cleaning, Stability and Corrosion Resistance. J. Bionic Eng. 2019, 16, 13–26. [Google Scholar] [CrossRef] [Green Version]
- Zhu, J.Y.; Hu, X.F. A new route for fabrication of the corrosion-resistant superhydrophobic surface by milling process. J. Coat. Technol. Res. 2019, 16, 249–255. [Google Scholar] [CrossRef]
- Rahman, M.A.; Jacobi, A.M. Wetting Behavior and Drainage of Water Droplets on Microgrooved Brass Surfaces. Langmuir 2012, 28, 13441–13451. [Google Scholar] [CrossRef]
- Pratap, T.; Patra, K. Mechanical micro-texturing of Ti-6Al-4V surfaces for improved wettability and bio-tribological performances. Surf. Coat. Technol. 2018, 349, 71–81. [Google Scholar] [CrossRef]
- Hou, B.; Wu, C.Y.; Li, X.G.; Huang, J.J.; Chen, M.J. Contact line-based model for the Cassie-Wenzel transition of a sessile droplet on the hydrophobic micropillar-structured surfaces. Appl. Surf. Sci. 2021, 542, 12. [Google Scholar] [CrossRef]
- Feng, L.B.; Zhang, H.X.; Wang, Z.L.; Liu, Y.H. Superhydrophobic aluminum alloy surface: Fabrication, structure, and corrosion resistance. Colloid Surf. A-Physicochem. Eng. Asp. 2014, 441, 319–325. [Google Scholar] [CrossRef]
- Elia, A.; De Wael, K.; Dowsett, M.; Adriaens, A. Electrochemical deposition of a copper carboxylate layer on copper as potential corrosion inhibitor. J. Solid State Electrochem. 2012, 16, 143–148. [Google Scholar] [CrossRef] [Green Version]
- Liu, L.J.; Chen, R.F.; Liu, W.K.; Zhang, Y.B.; Shi, X.B.; Pan, Q. Fabrication of superhydrophobic copper sulfide film for corrosion protection of copper. Surf. Coat. Technol. 2015, 272, 221–228. [Google Scholar] [CrossRef]
- Daubert, J.S.; Hill, G.T.; Gotsch, H.N.; Gremaud, A.P.; Ovental, J.S.; Williams, P.S.; Oldham, C.J.; Parsons, G.N. Corrosion Protection of Copper Using Al2O3, TiO2, ZnO, HfO2, and ZrO2 Atomic Layer Deposition. ACS Appl. Mater. Interfaces 2017, 9, 4192–4201. [Google Scholar] [CrossRef]
- Rao, B.V.A.; Reddy, M.N. Formation, characterization and corrosion protection efficiency of self-assembled 1-octadecyl-1H-imidazole films on copper for corrosion protection. Arab. J. Chem. 2017, 10, S3270–S3283. [Google Scholar]
- Redondo, M.L.; de la Blanca, E.S.; Garcia, M.V.; Gonzalez-Tejera, M.J. Poly(N-methylpyrrole) electrodeposited on copper: Corrosion protection properties. Prog. Org. Coat. 2009, 65, 386–391. [Google Scholar] [CrossRef]
- Wu, Y.M.; Zhao, W.J.; Lu, Z.B.; Wang, L.P. Fluorinated graphene film for corrosion control on copper: Experimental and theoretical studies. Carbon 2021, 179, 445–457. [Google Scholar] [CrossRef]
- Wan, Y.X.; Chen, M.J.; Liu, W.; Shen, X.X.; Min, Y.L.; Xu, Q.J. The research on preparation of superhydrophobic surfaces of pure copper by hydrothermal method and its corrosion resistance. Electrochim. Acta 2018, 270, 310–318. [Google Scholar] [CrossRef]
- Zhu, J.Y.; Liao, K.J. A Facile Method for Preparing a Superhydrophobic Block with Rapid Reparability. Coatings 2020, 10, 1202. [Google Scholar] [CrossRef]
- Mirmohammadi, S.M.; Hoshian, S.; Jokinen, V.P.; Franssila, S. Fabrication of elastic, conductive, wear-resistant superhydrophobic composite material. Sci. Rep. 2021, 11, 12646. [Google Scholar]

| Sample | Ecorr (V vs. Ag/AgCl) | Icorr (A cm−2) (A/cm2) | η (%) |
|---|---|---|---|
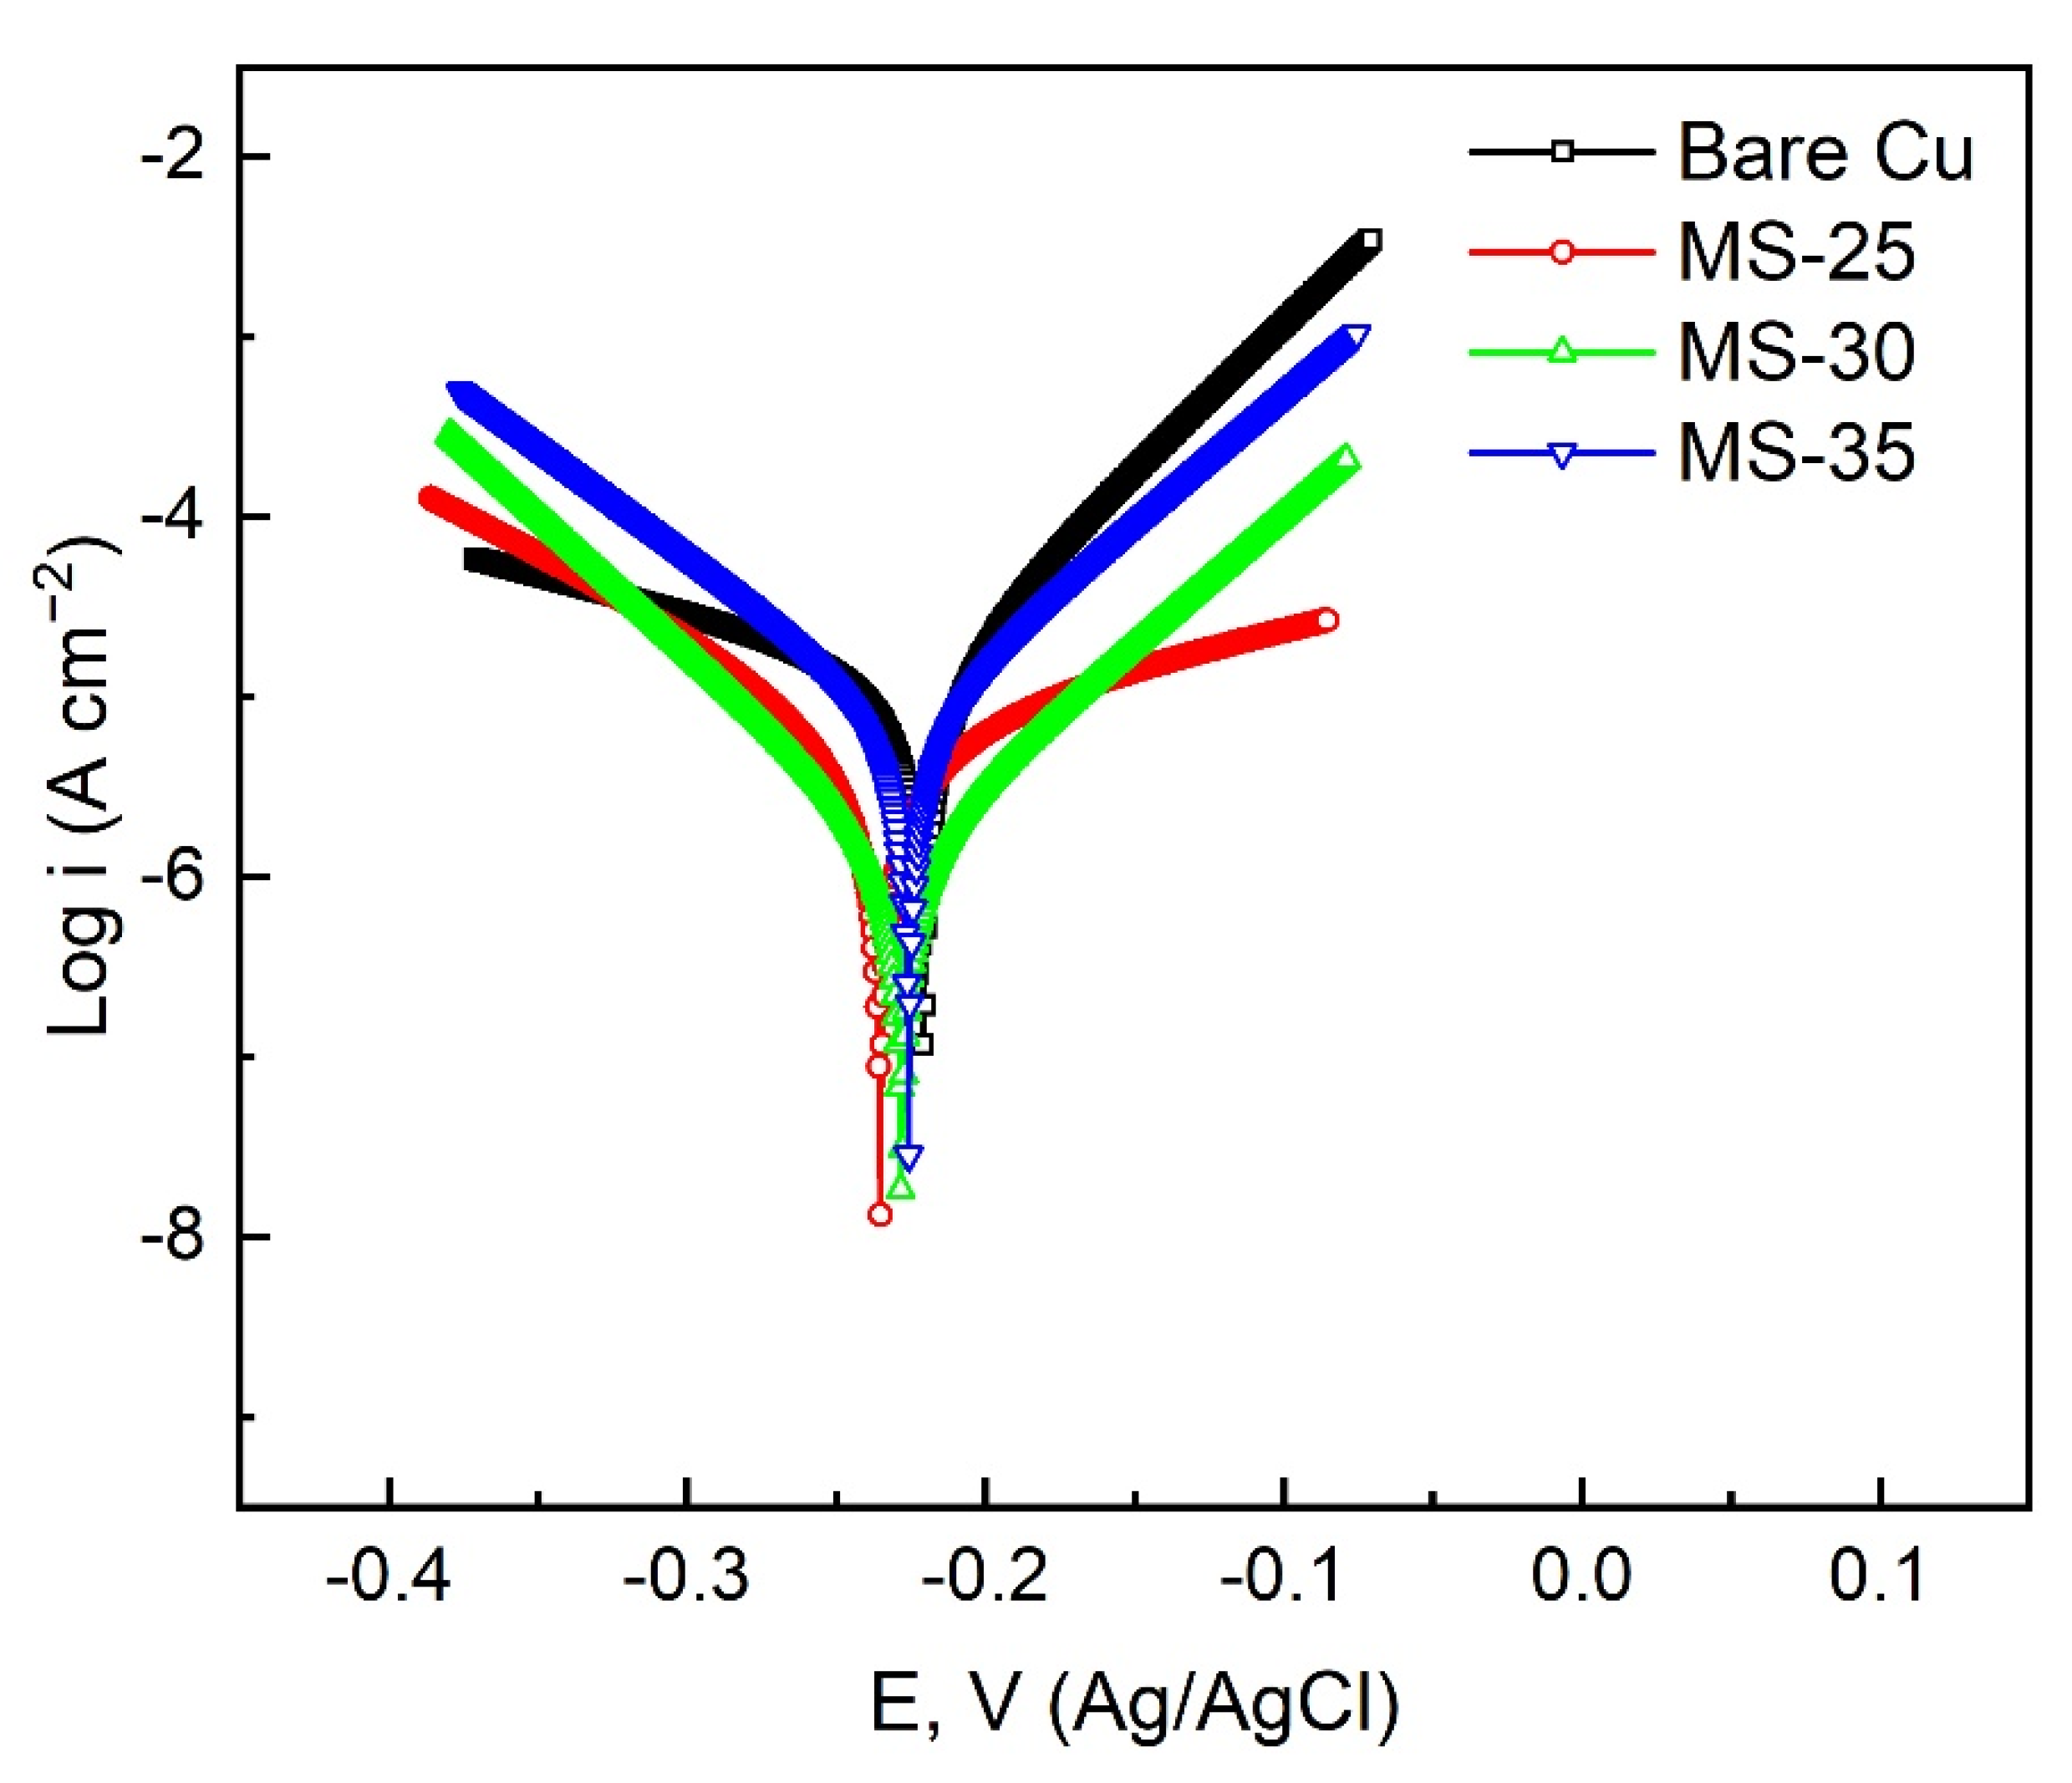
| Bare Cu | −0.2208 | 2.92 × 10⁻⁵ | –––– |
| MS-25 | −0.2353 | 7.29 × 10⁻⁶ | 75.03 |
| MS-30 | −0.2282 | 1.47 × 10⁻⁶ | 94.97 |
| MS-35 | −0.2258 | 7.51 × 10⁻⁶ | 74.28 |
| Sample | Rs(Ω cm2) | CPEf (µF/cm−2∙s(α−1)) | Rf(Ω cm2) | CPEdl (µF/cm−2∙s(α−1)) | Rct(Ω cm2) |
|---|---|---|---|---|---|
| Bare Cu | 18.02 | 18.00 | 773.5 | 10.86 | 1136 |
| MS-25 | 25.14 | 48.44 | 852.3 | 2.97 | 32,801 |
| MS-30 | 24.84 | 13.92 | 2248 | 5.44 | 24,950 |
| MS-35 | 15.92 | 164.83 | 457.8 | 36.10 | 1898 |
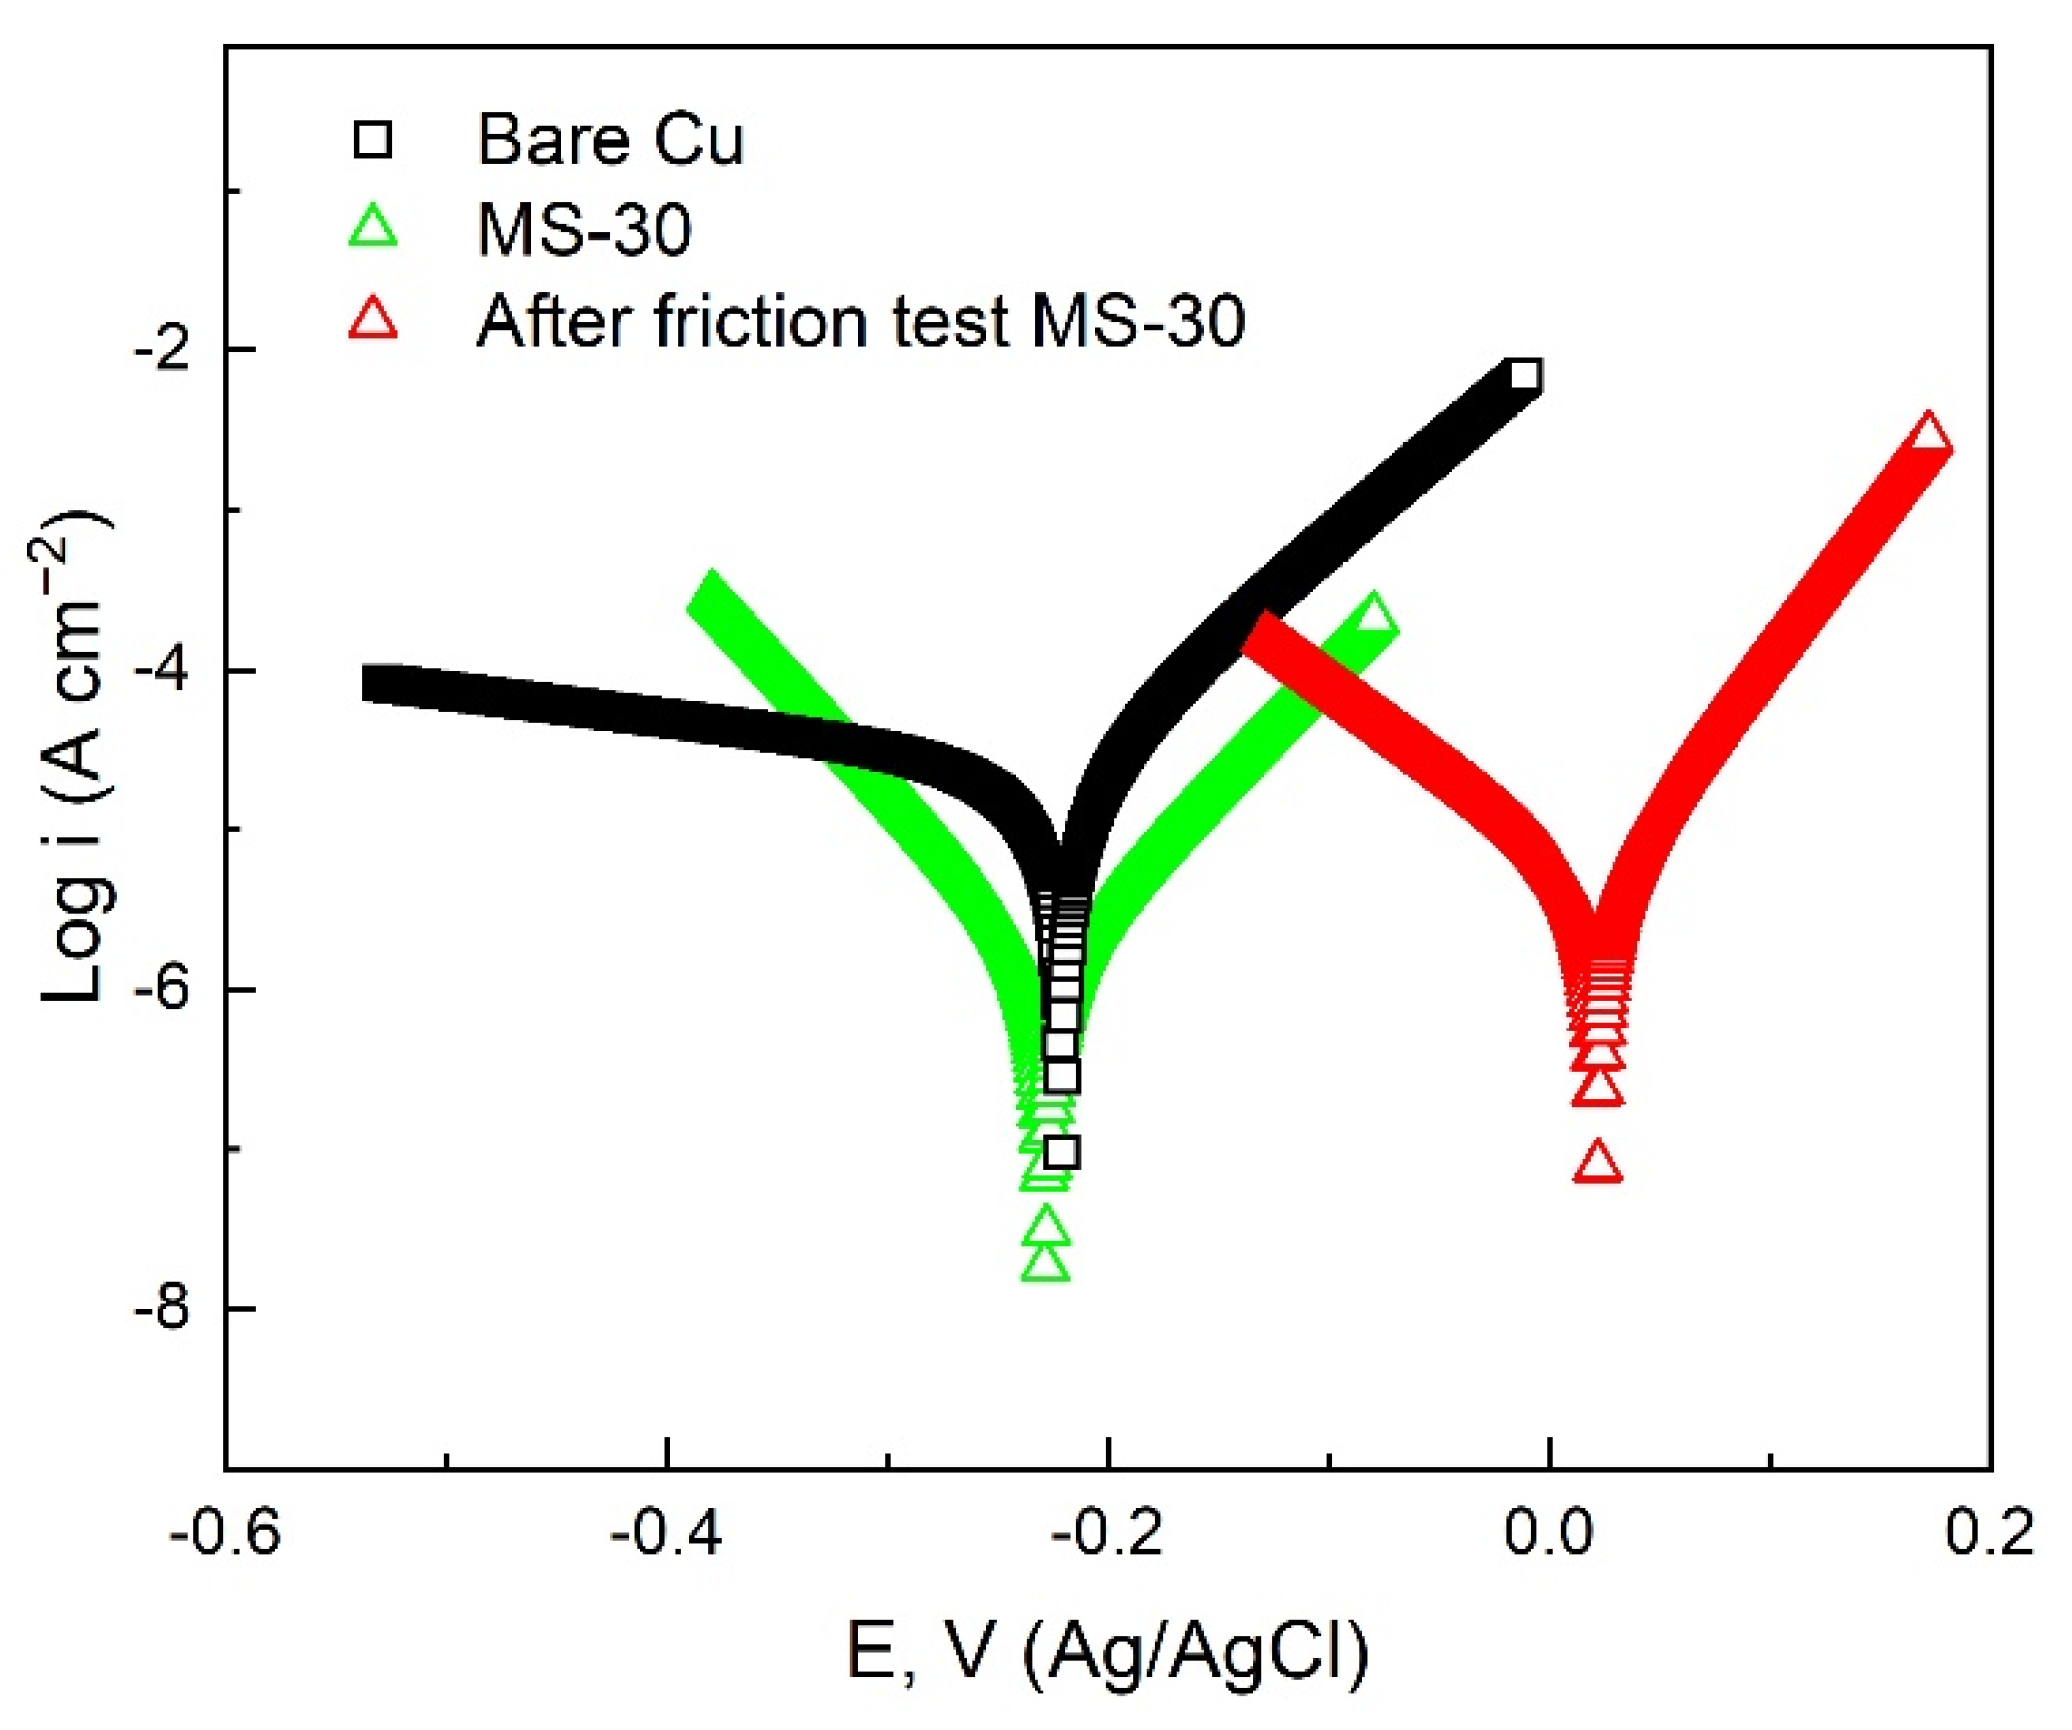
| Sample | Ecorr (V vs. Ag/AgCl) | Icorr (A cm−2) | η (%) |
|---|---|---|---|
| Bare Cu | −0.2208 | 2.92 × 10⁻⁵ | –––– |
| MS-30 | −0.2282 | 1.47 × 10⁻⁶ | 94.97 |
| After friction test MS-30 | −0.2188 | 4.70 × 10⁻⁶ | 83.90 |
Publisher’s Note: MDPI stays neutral with regard to jurisdictional claims in published maps and institutional affiliations. |
© 2022 by the authors. Licensee MDPI, Basel, Switzerland. This article is an open access article distributed under the terms and conditions of the Creative Commons Attribution (CC BY) license (https://creativecommons.org/licenses/by/4.0/).
Share and Cite
Jia, C.; Zhu, J.; Zhang, L. Study on Preparation of Superhydrophobic Copper Surface by Milling and Its Protective Performance. Materials 2022, 15, 1939. https://doi.org/10.3390/ma15051939
Jia C, Zhu J, Zhang L. Study on Preparation of Superhydrophobic Copper Surface by Milling and Its Protective Performance. Materials. 2022; 15(5):1939. https://doi.org/10.3390/ma15051939
Chicago/Turabian StyleJia, Chenxi, Jiyuan Zhu, and Langping Zhang. 2022. "Study on Preparation of Superhydrophobic Copper Surface by Milling and Its Protective Performance" Materials 15, no. 5: 1939. https://doi.org/10.3390/ma15051939