
Synthesis of Activated Carbon from Trachycarpus fortunei Seeds for the Removal of Cationic and Anionic Dyes

 , , ,
, , ,  and
and
Abstract
:1. Introduction
2. Experimental Procedure
2.1. Chemicals/Solvents
2.2. Preparation of the Adsorbent
2.2.1. Raw Biomass
2.2.2. Activated Carbon (AC)
2.3. Instrumentation
2.4. Adsorption
Preparation of Stock Solutions
2.5. Adsorption of TB and XO on Biomass and AC Treated with Acid and Base
2.5.1. Dye Concentration
2.5.2. Contact Time
2.5.3. pH
2.5.4. Temperature
2.5.5. Adsorbent Amount
2.5.6. Adsorbent Size
2.5.7. RPM: Shaker Speed
3. Results and Discussion
3.1. Characterization
3.1.1. FT-IR
3.1.2. BET Analysis
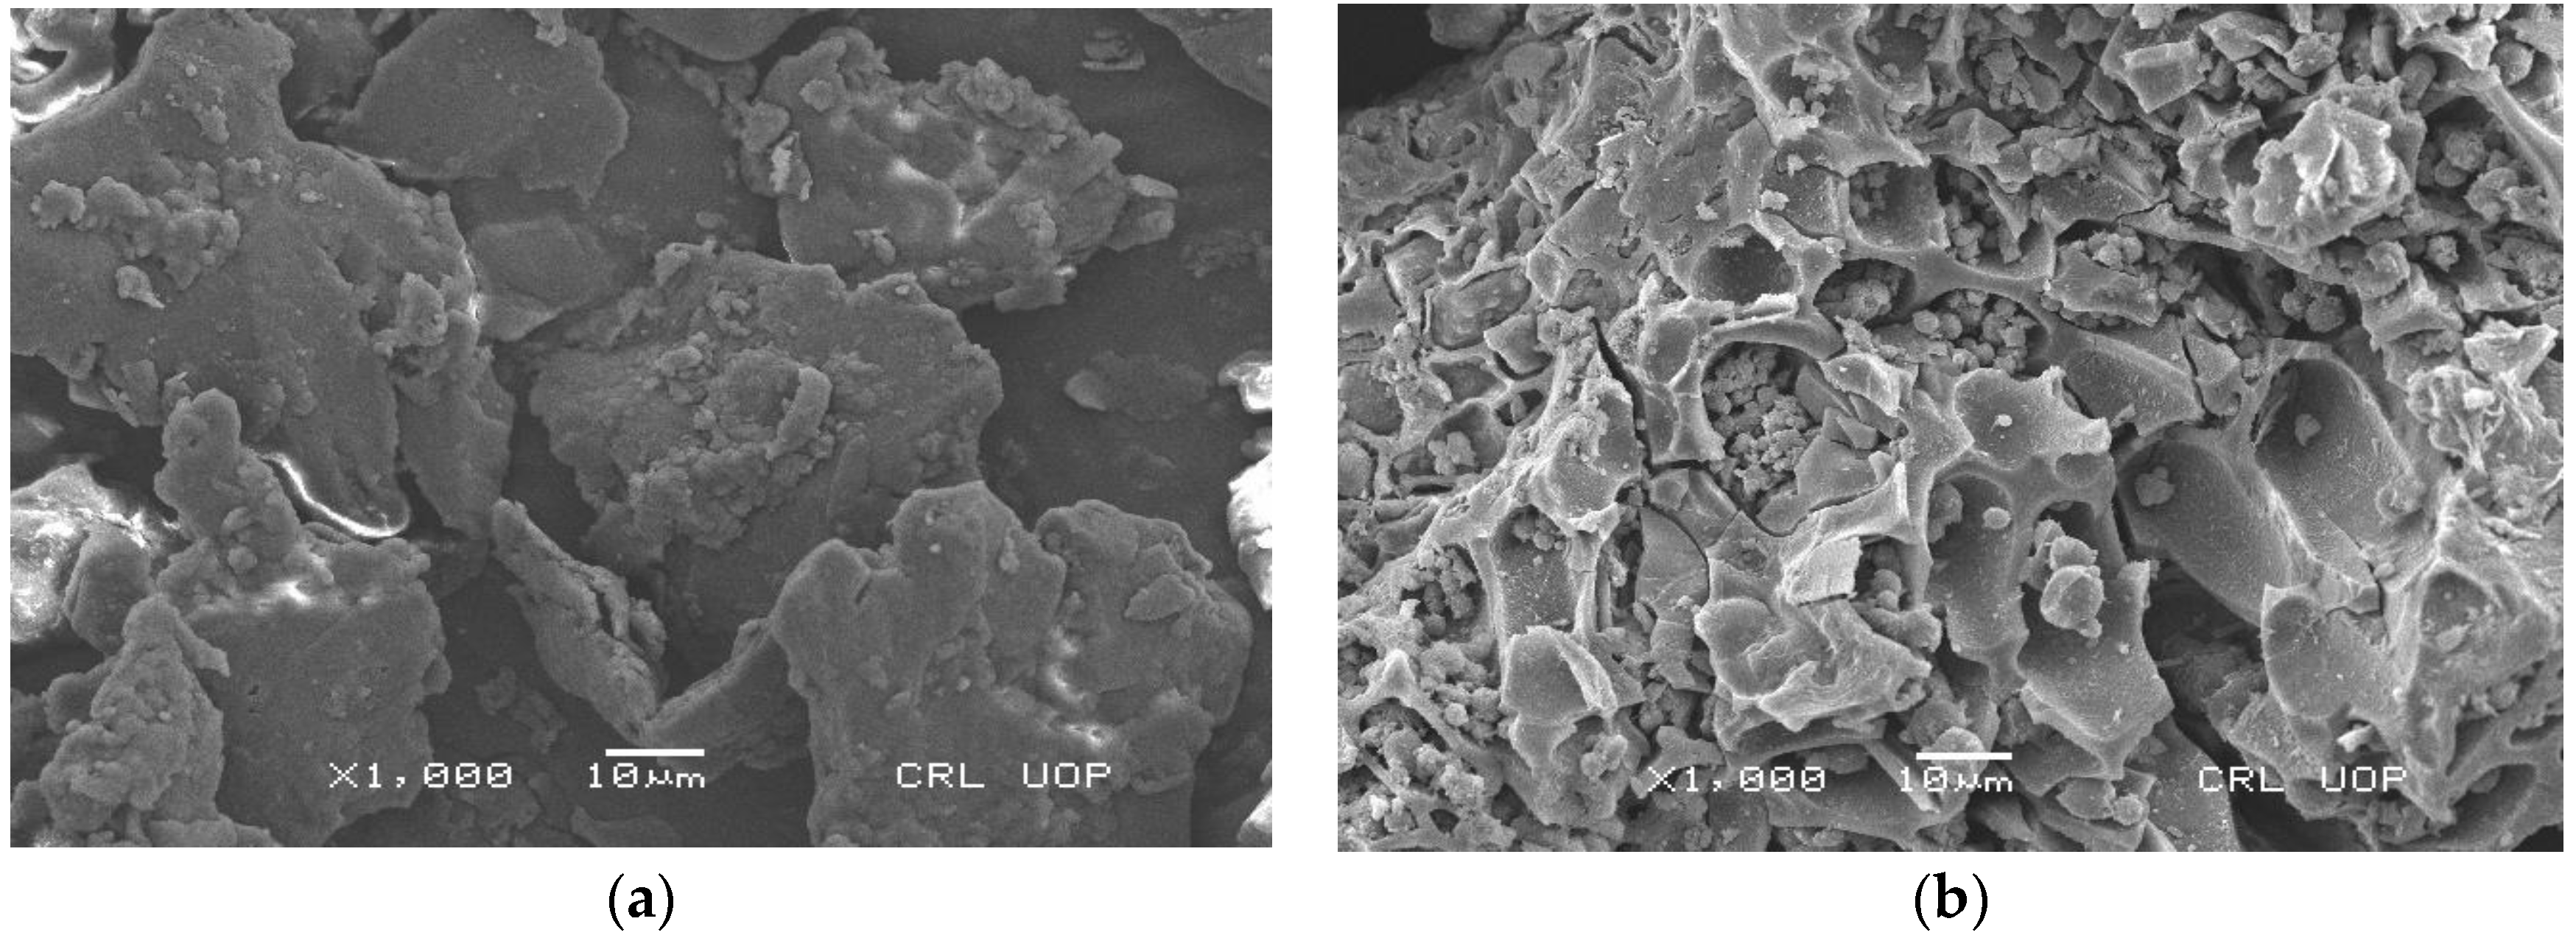
3.1.3. SEM
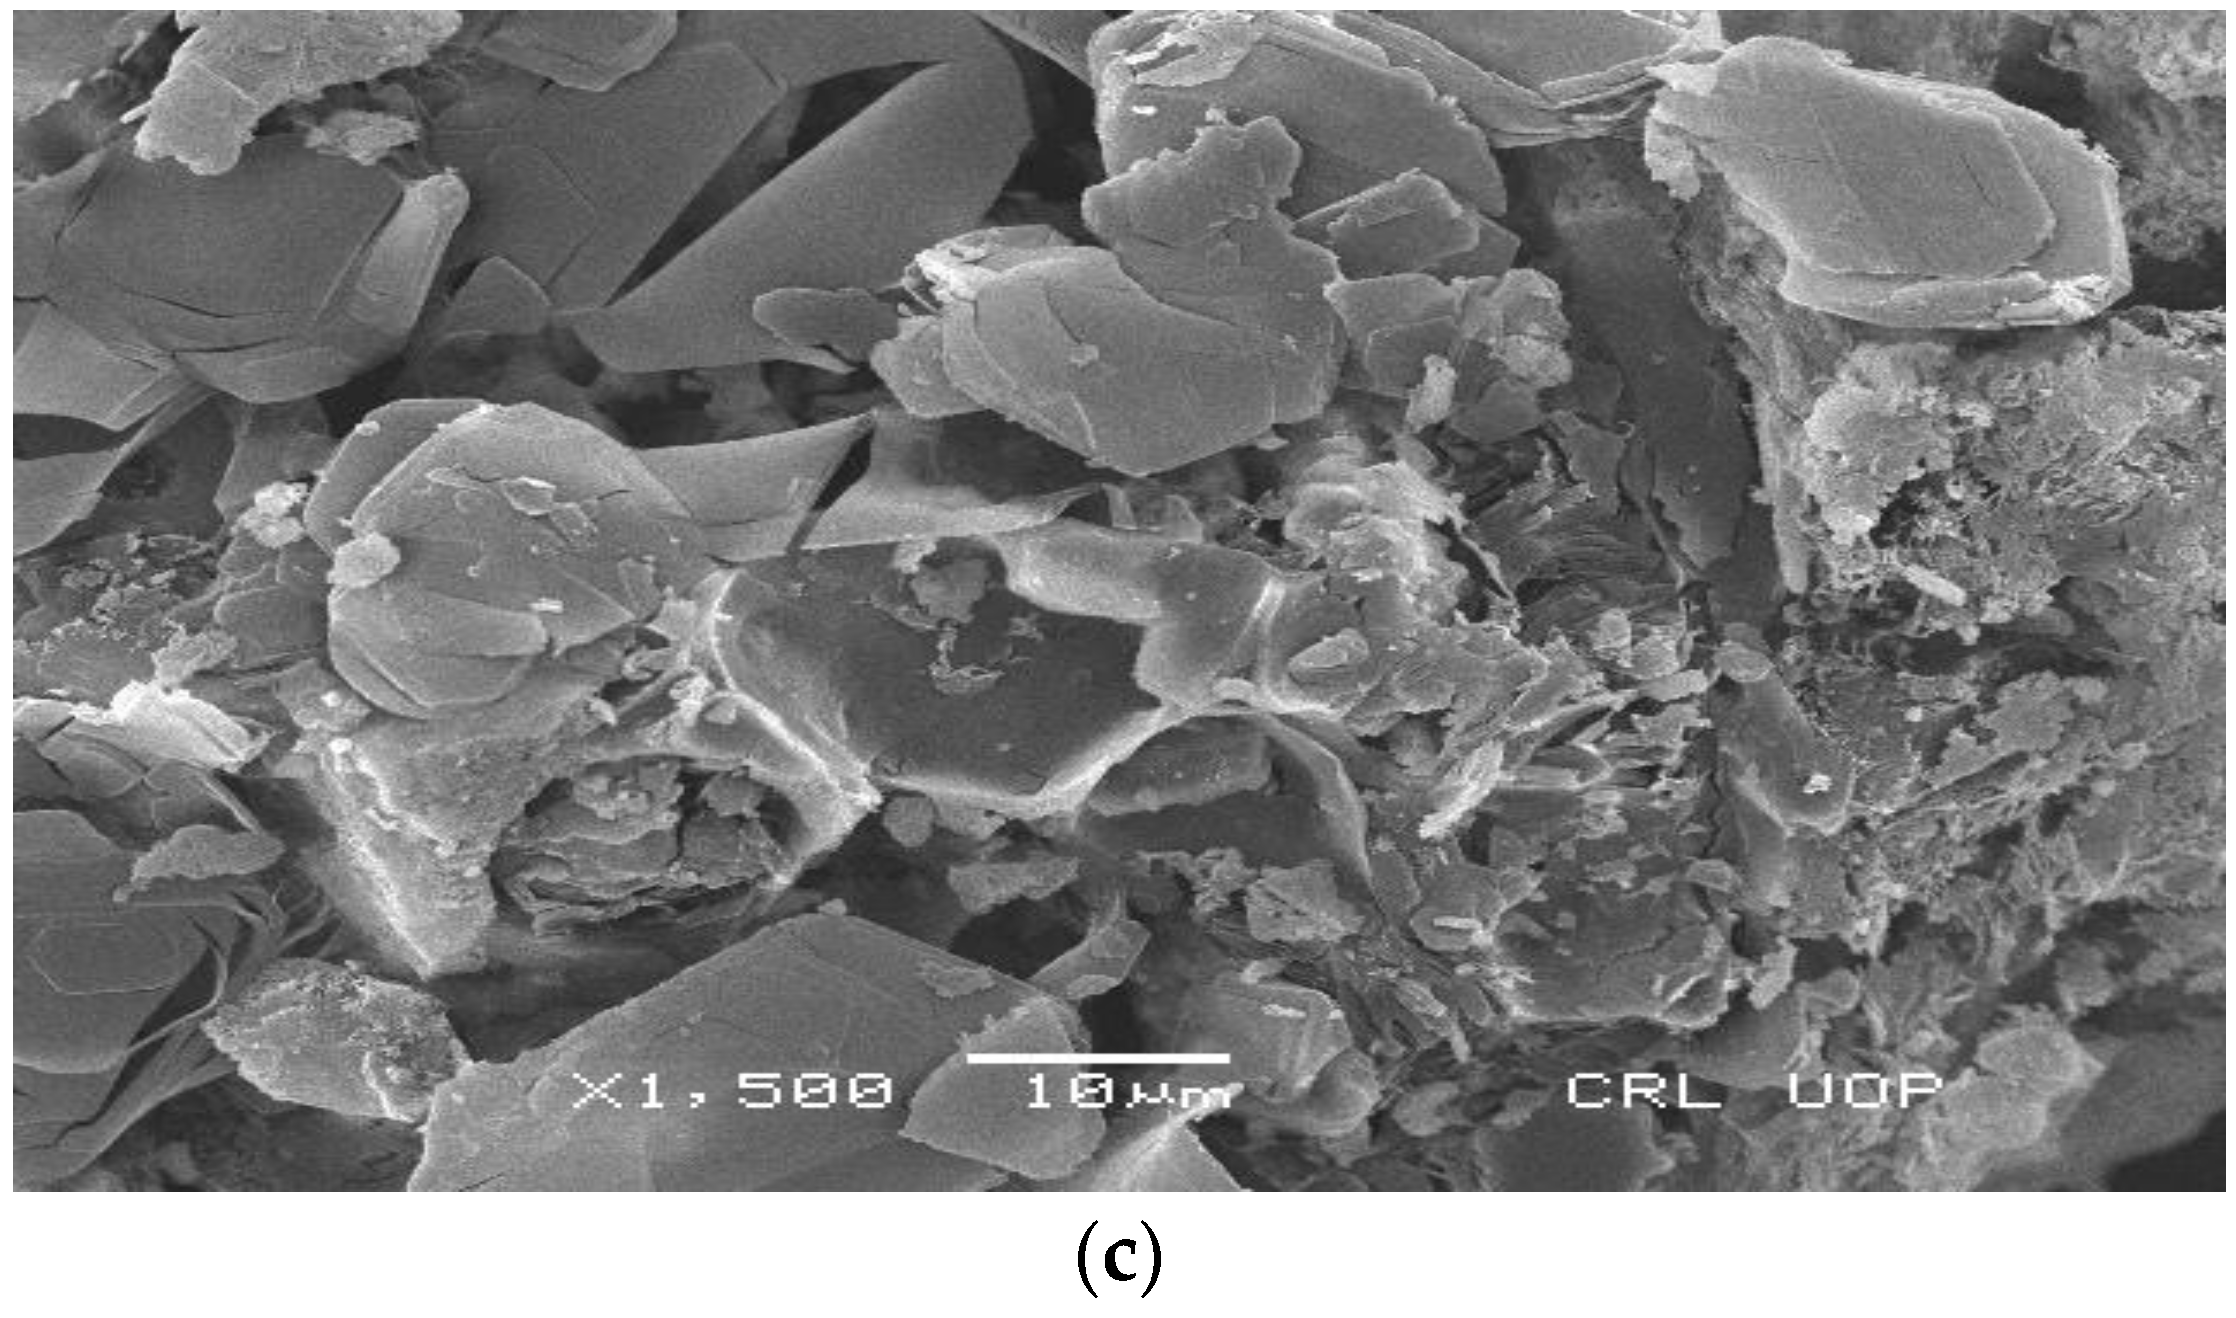
3.1.4. EDX
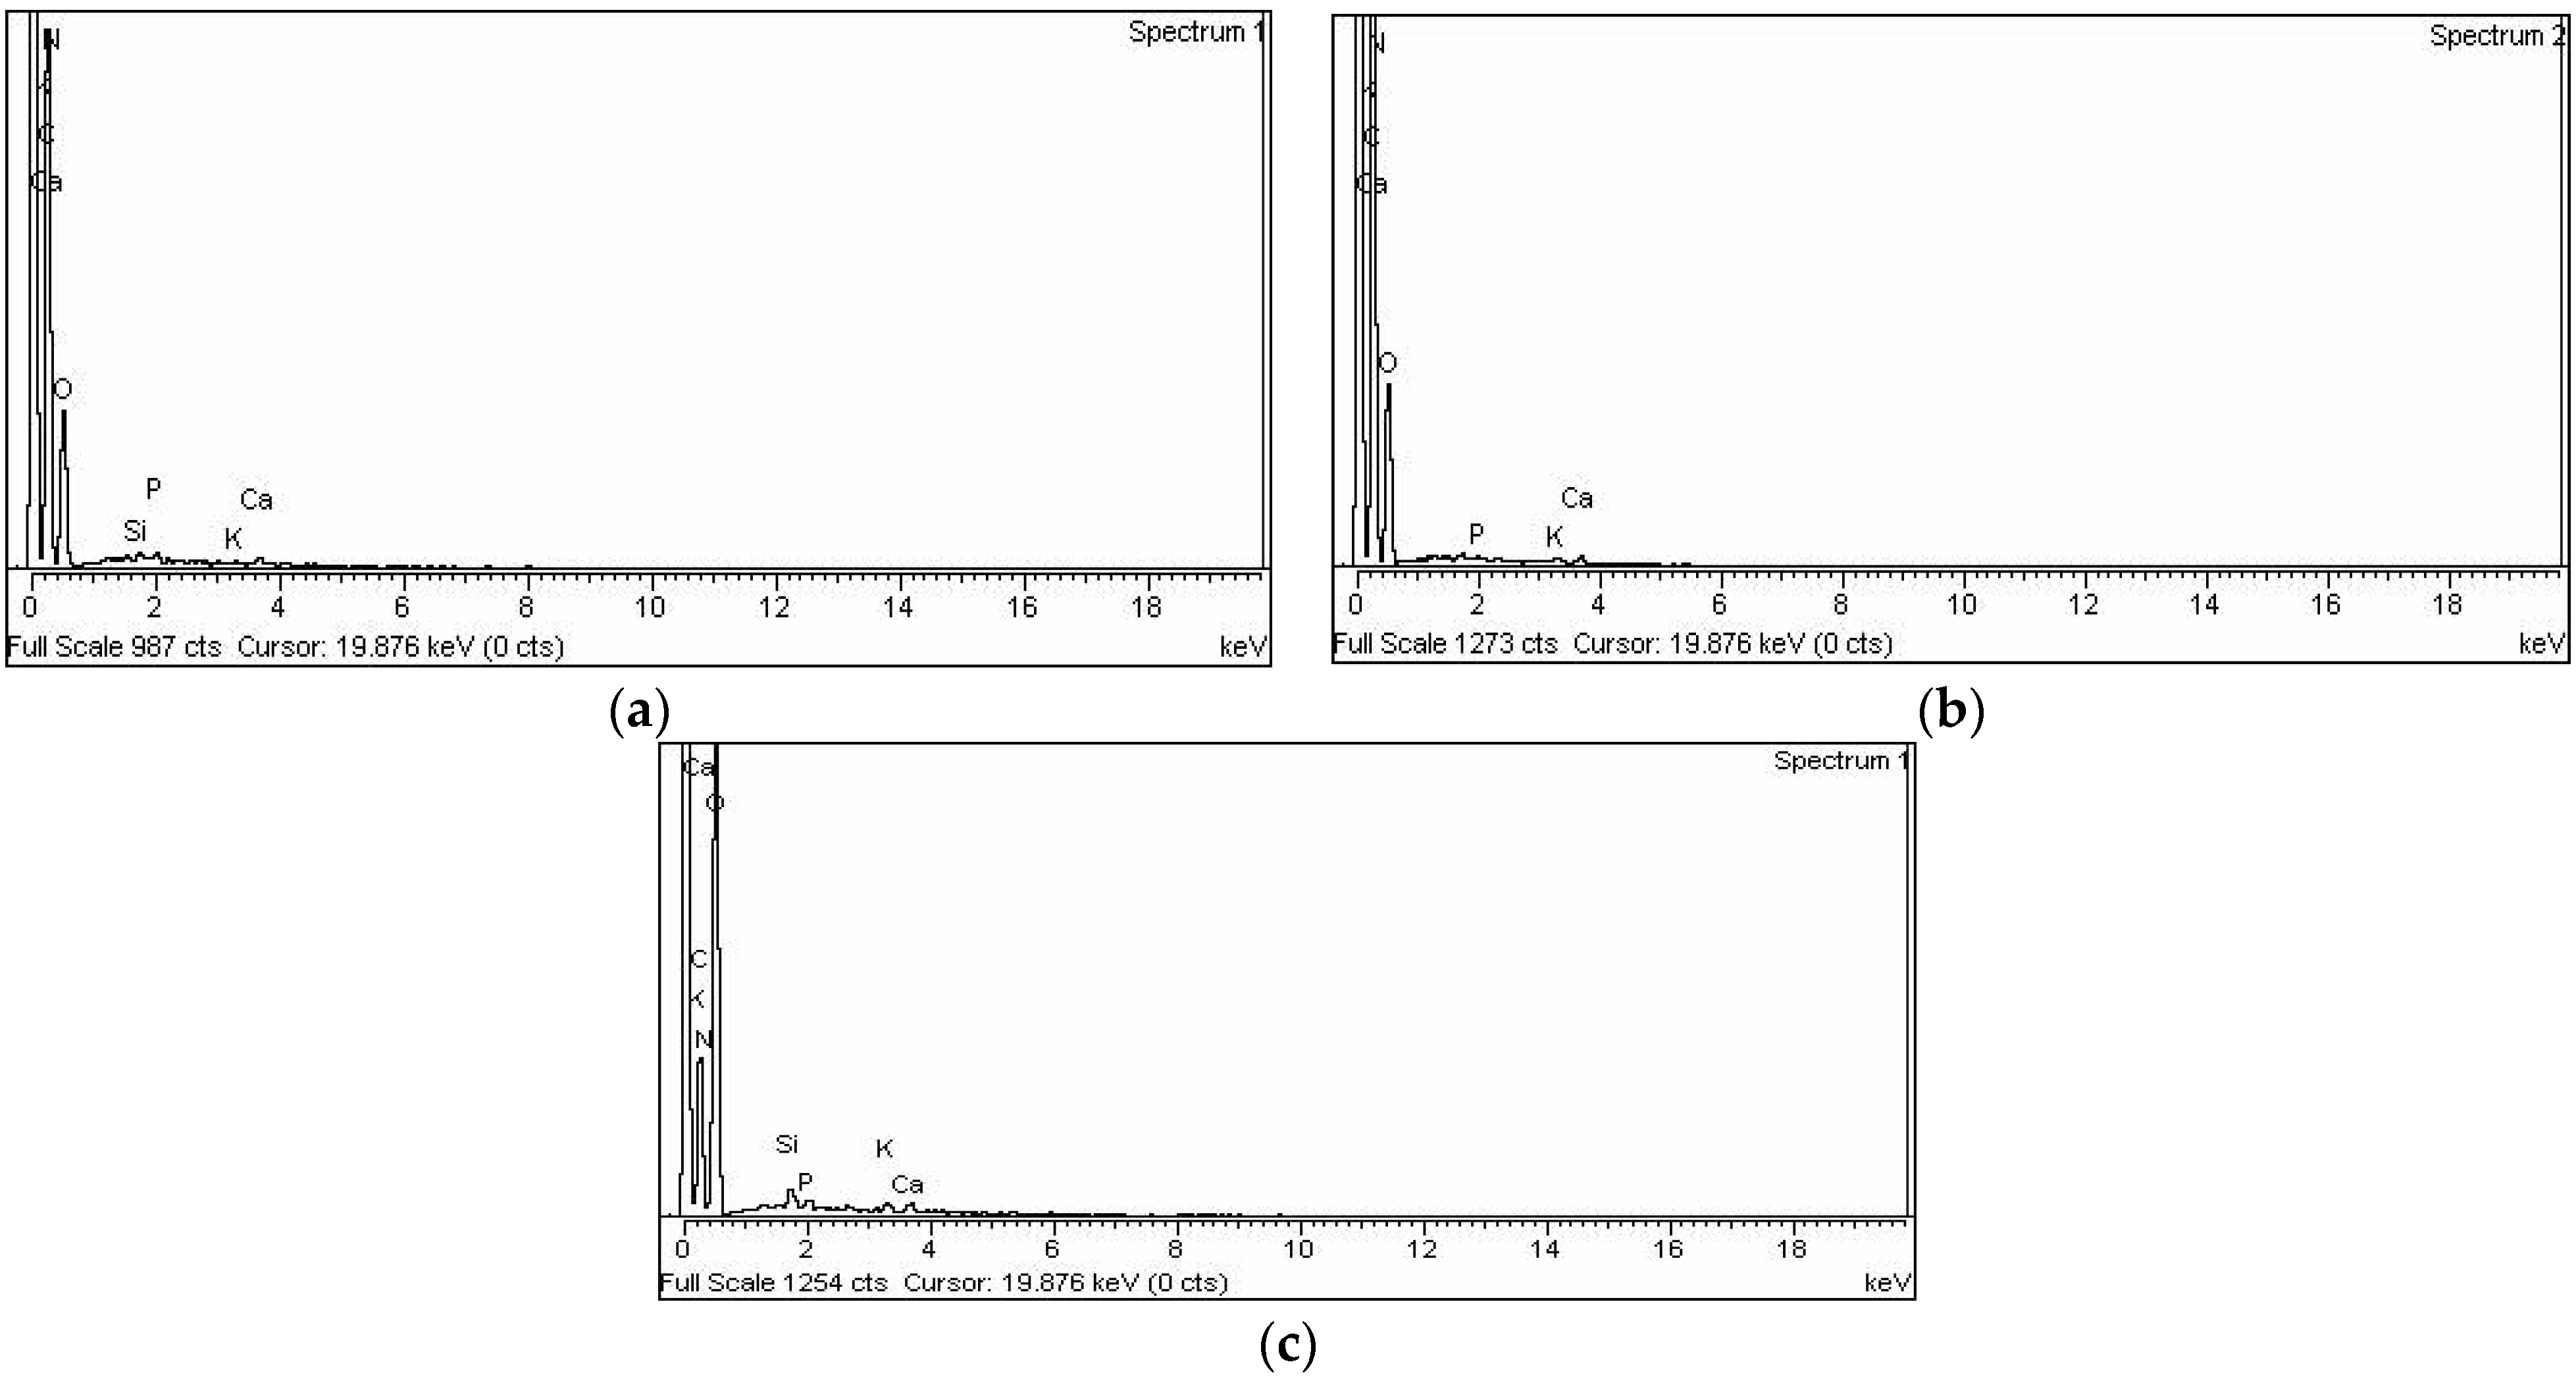
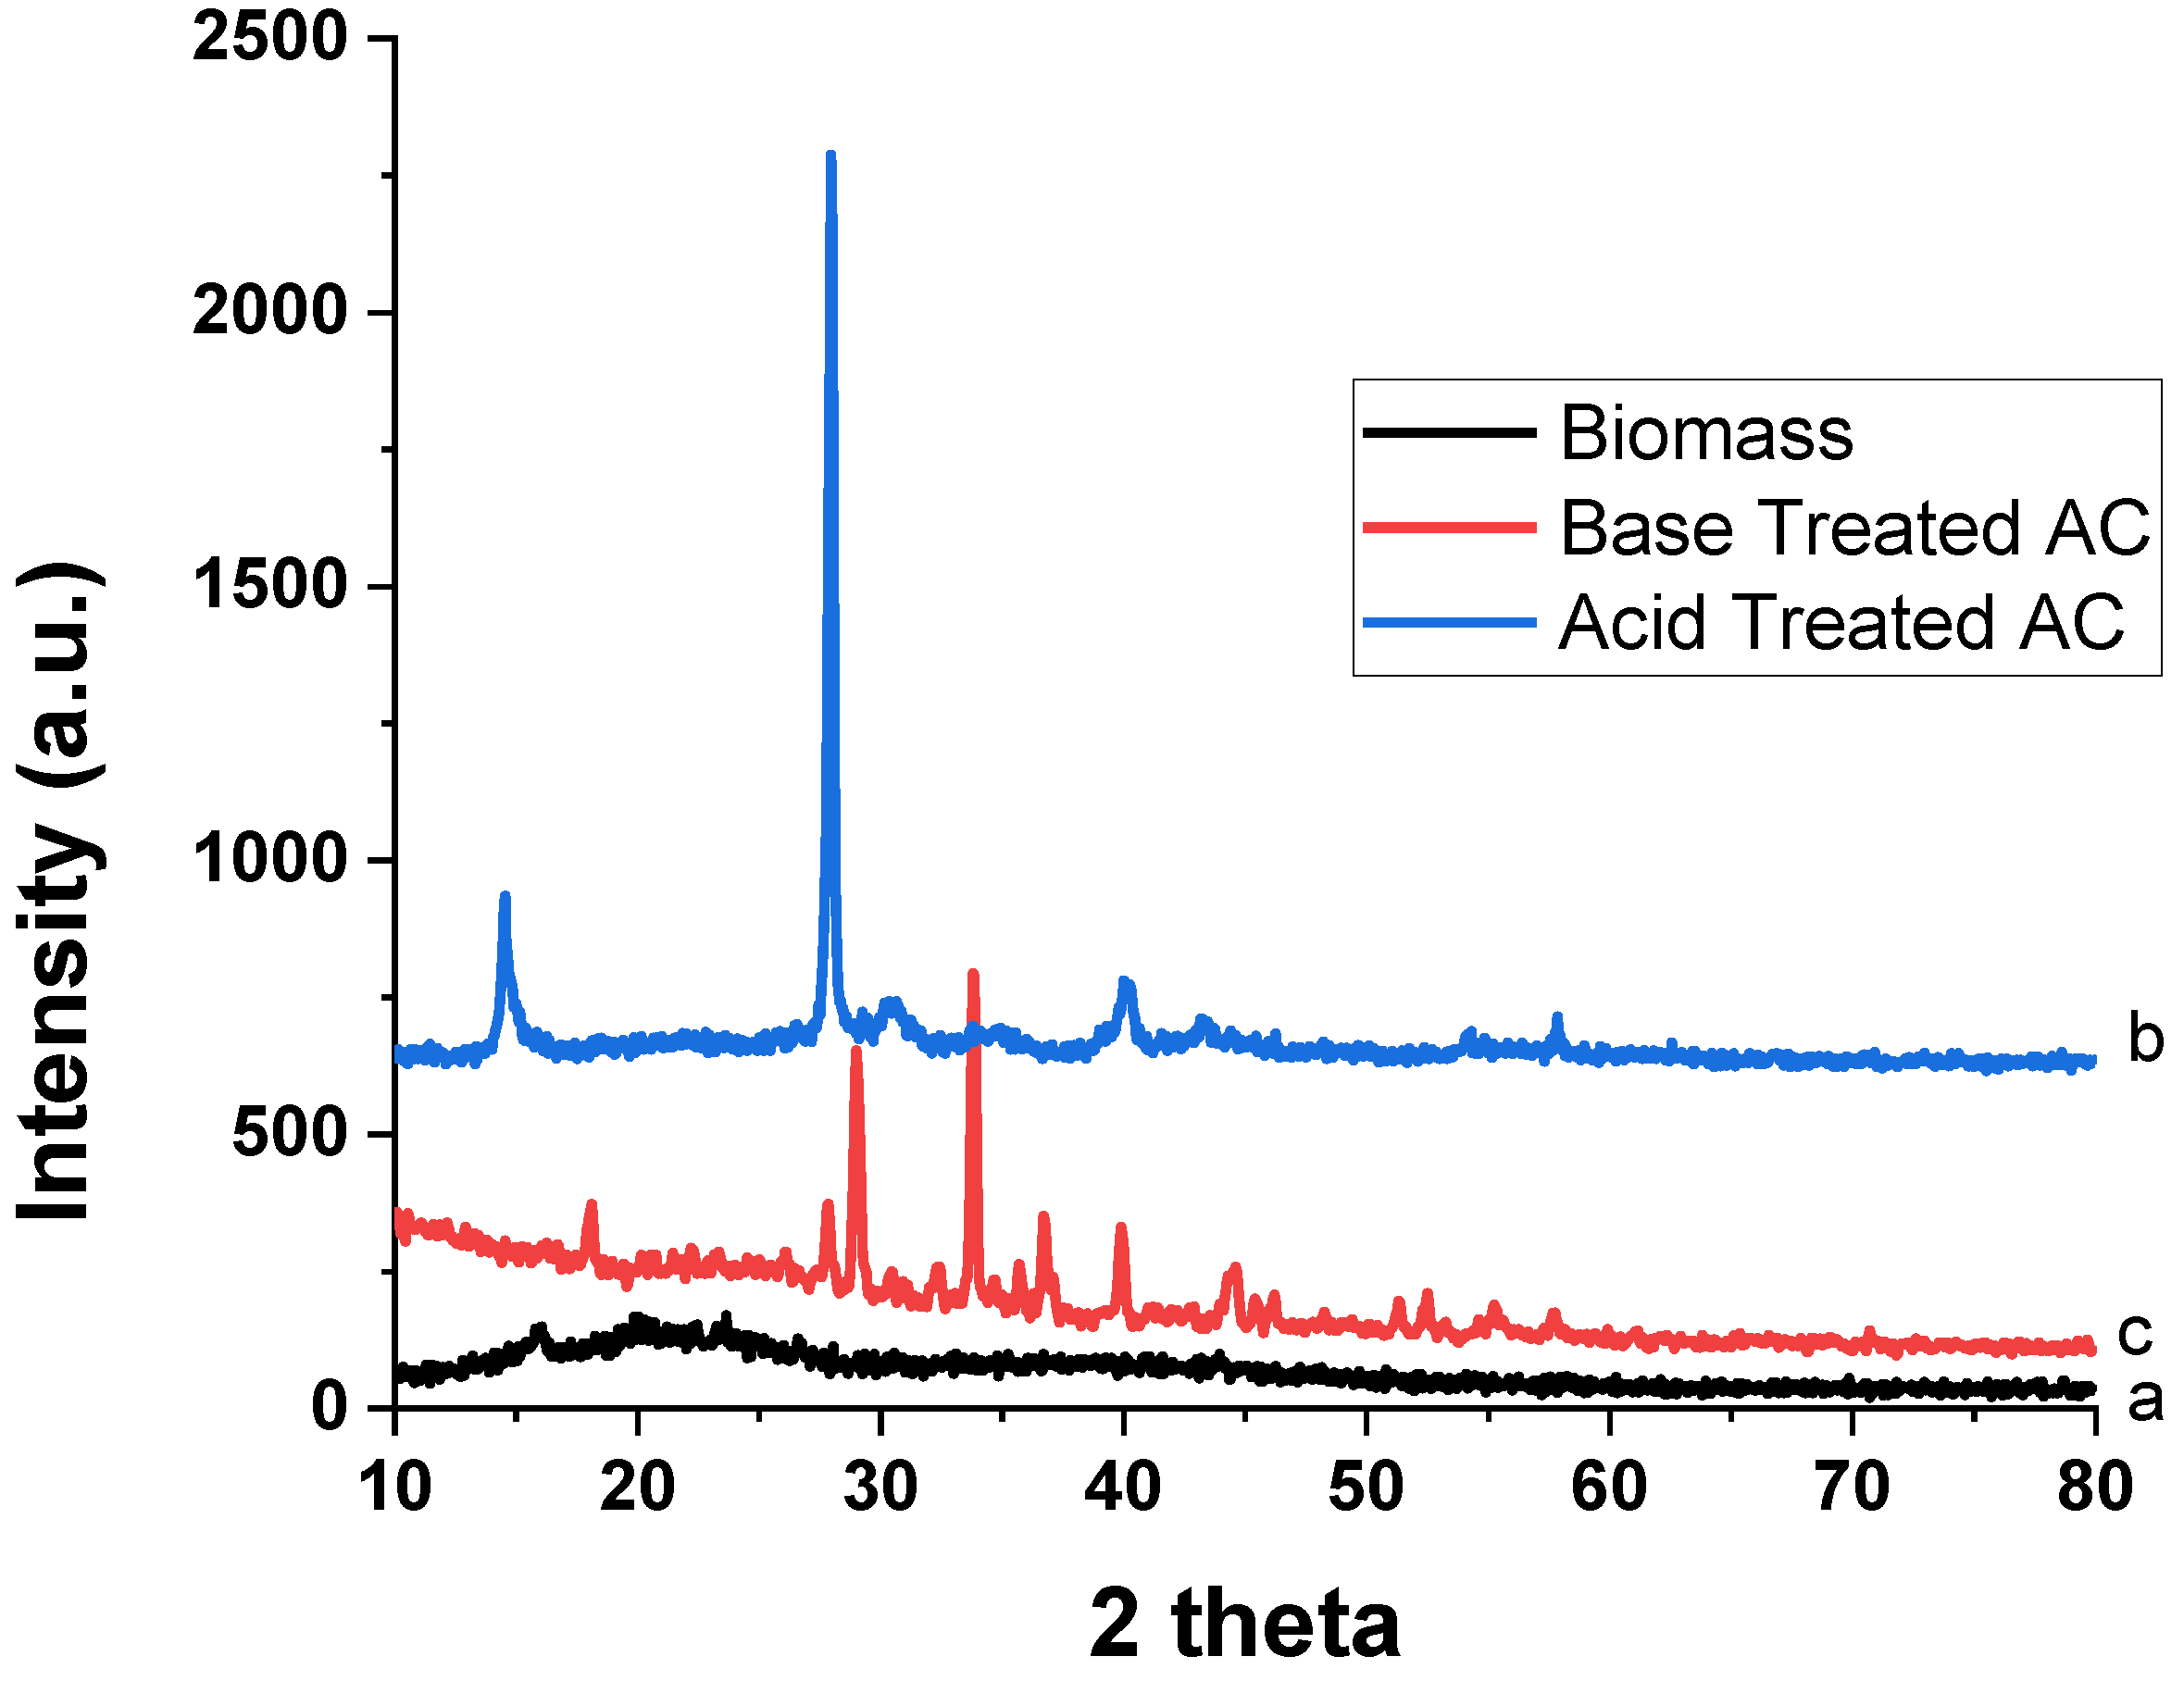
3.1.5. Powder XRD
3.2. Adsorption of XO and TB on Biomass and AC Treated with Acid and Base
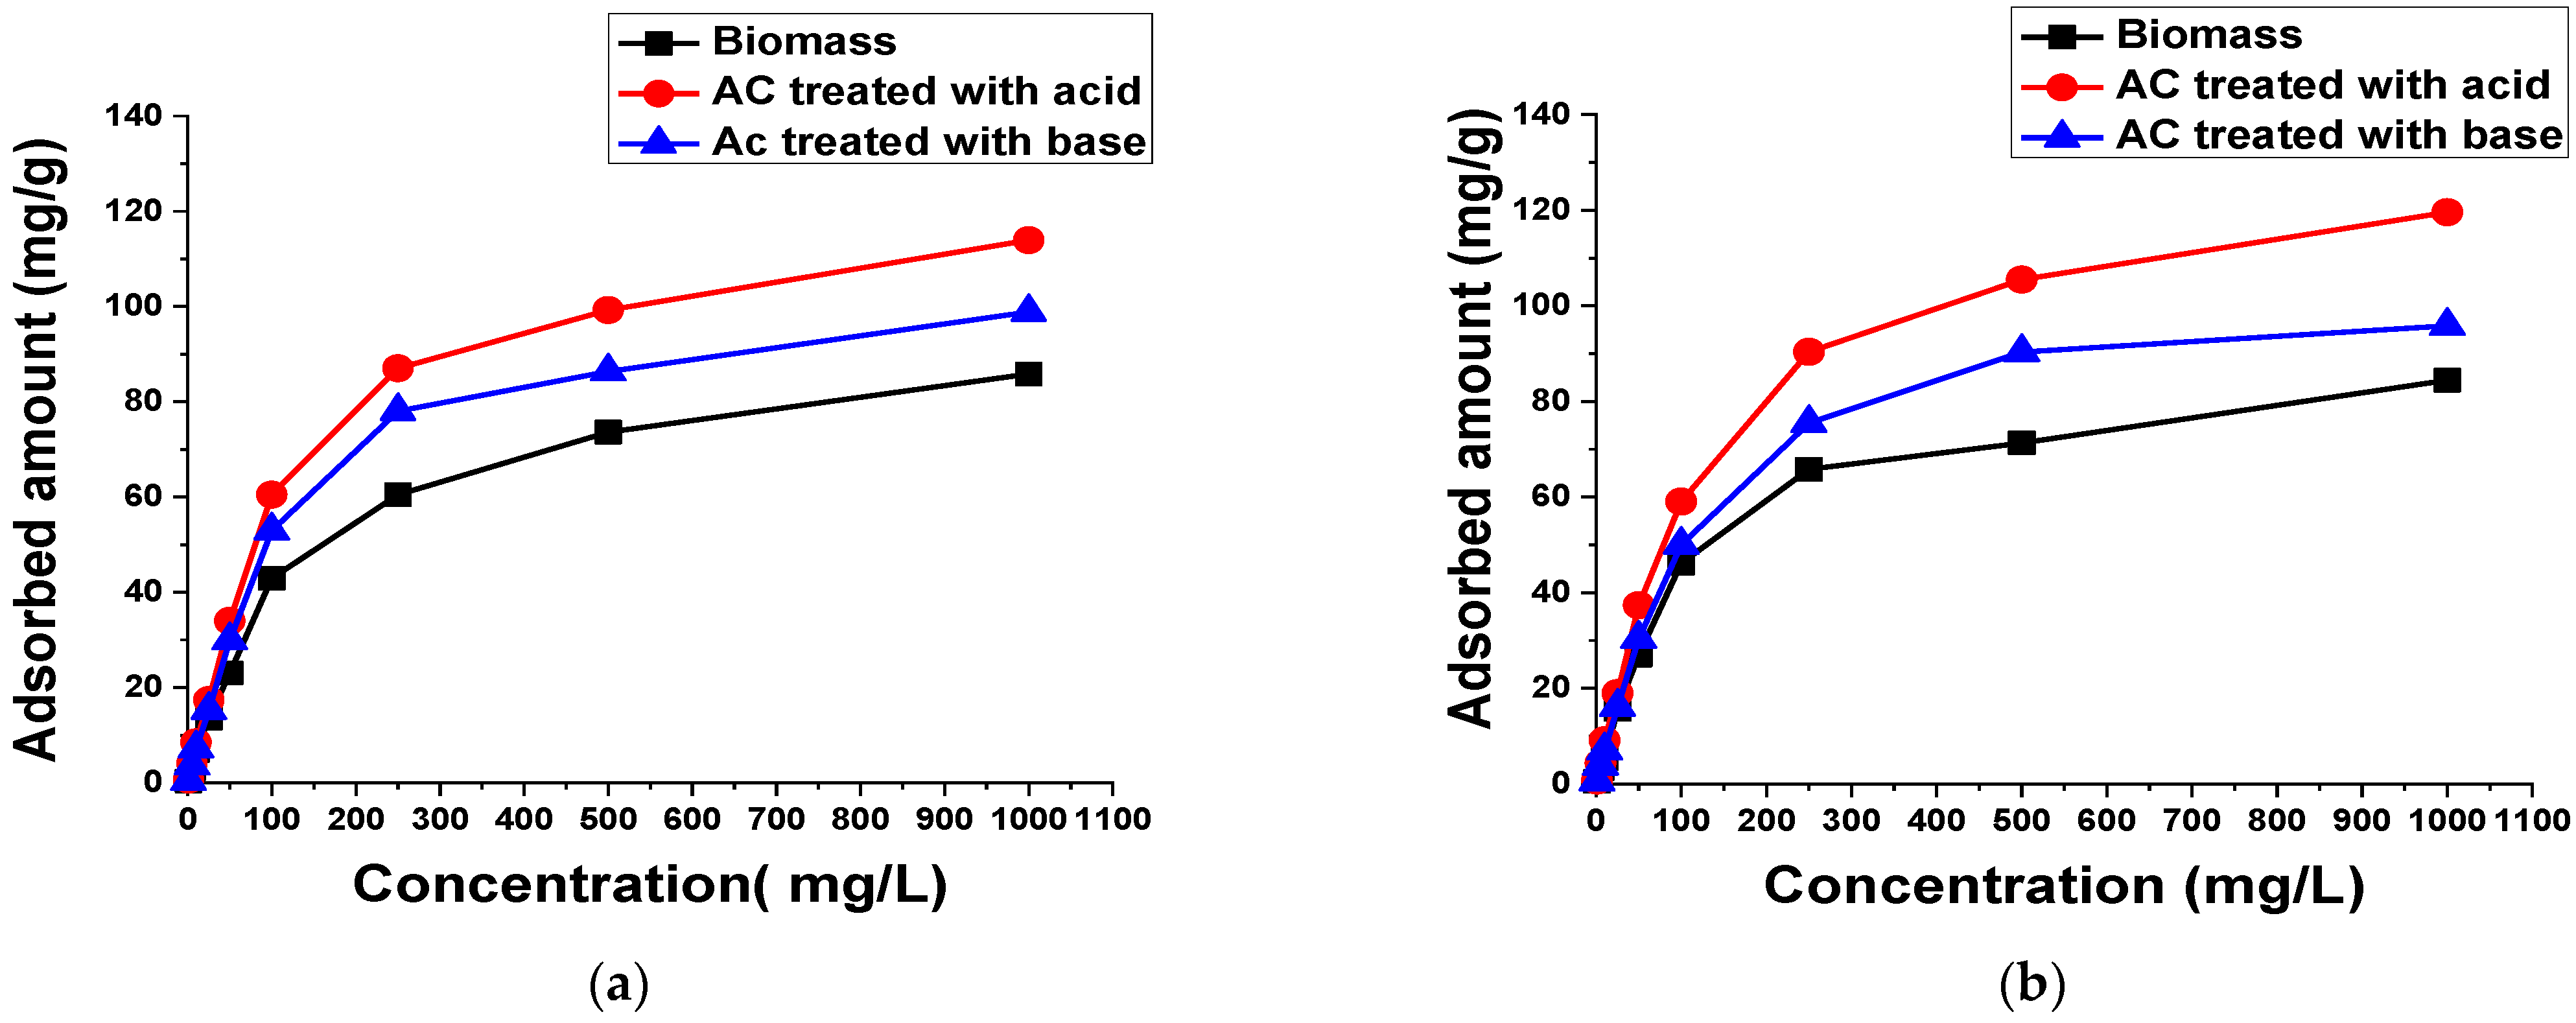
3.2.1. Dye Concentration
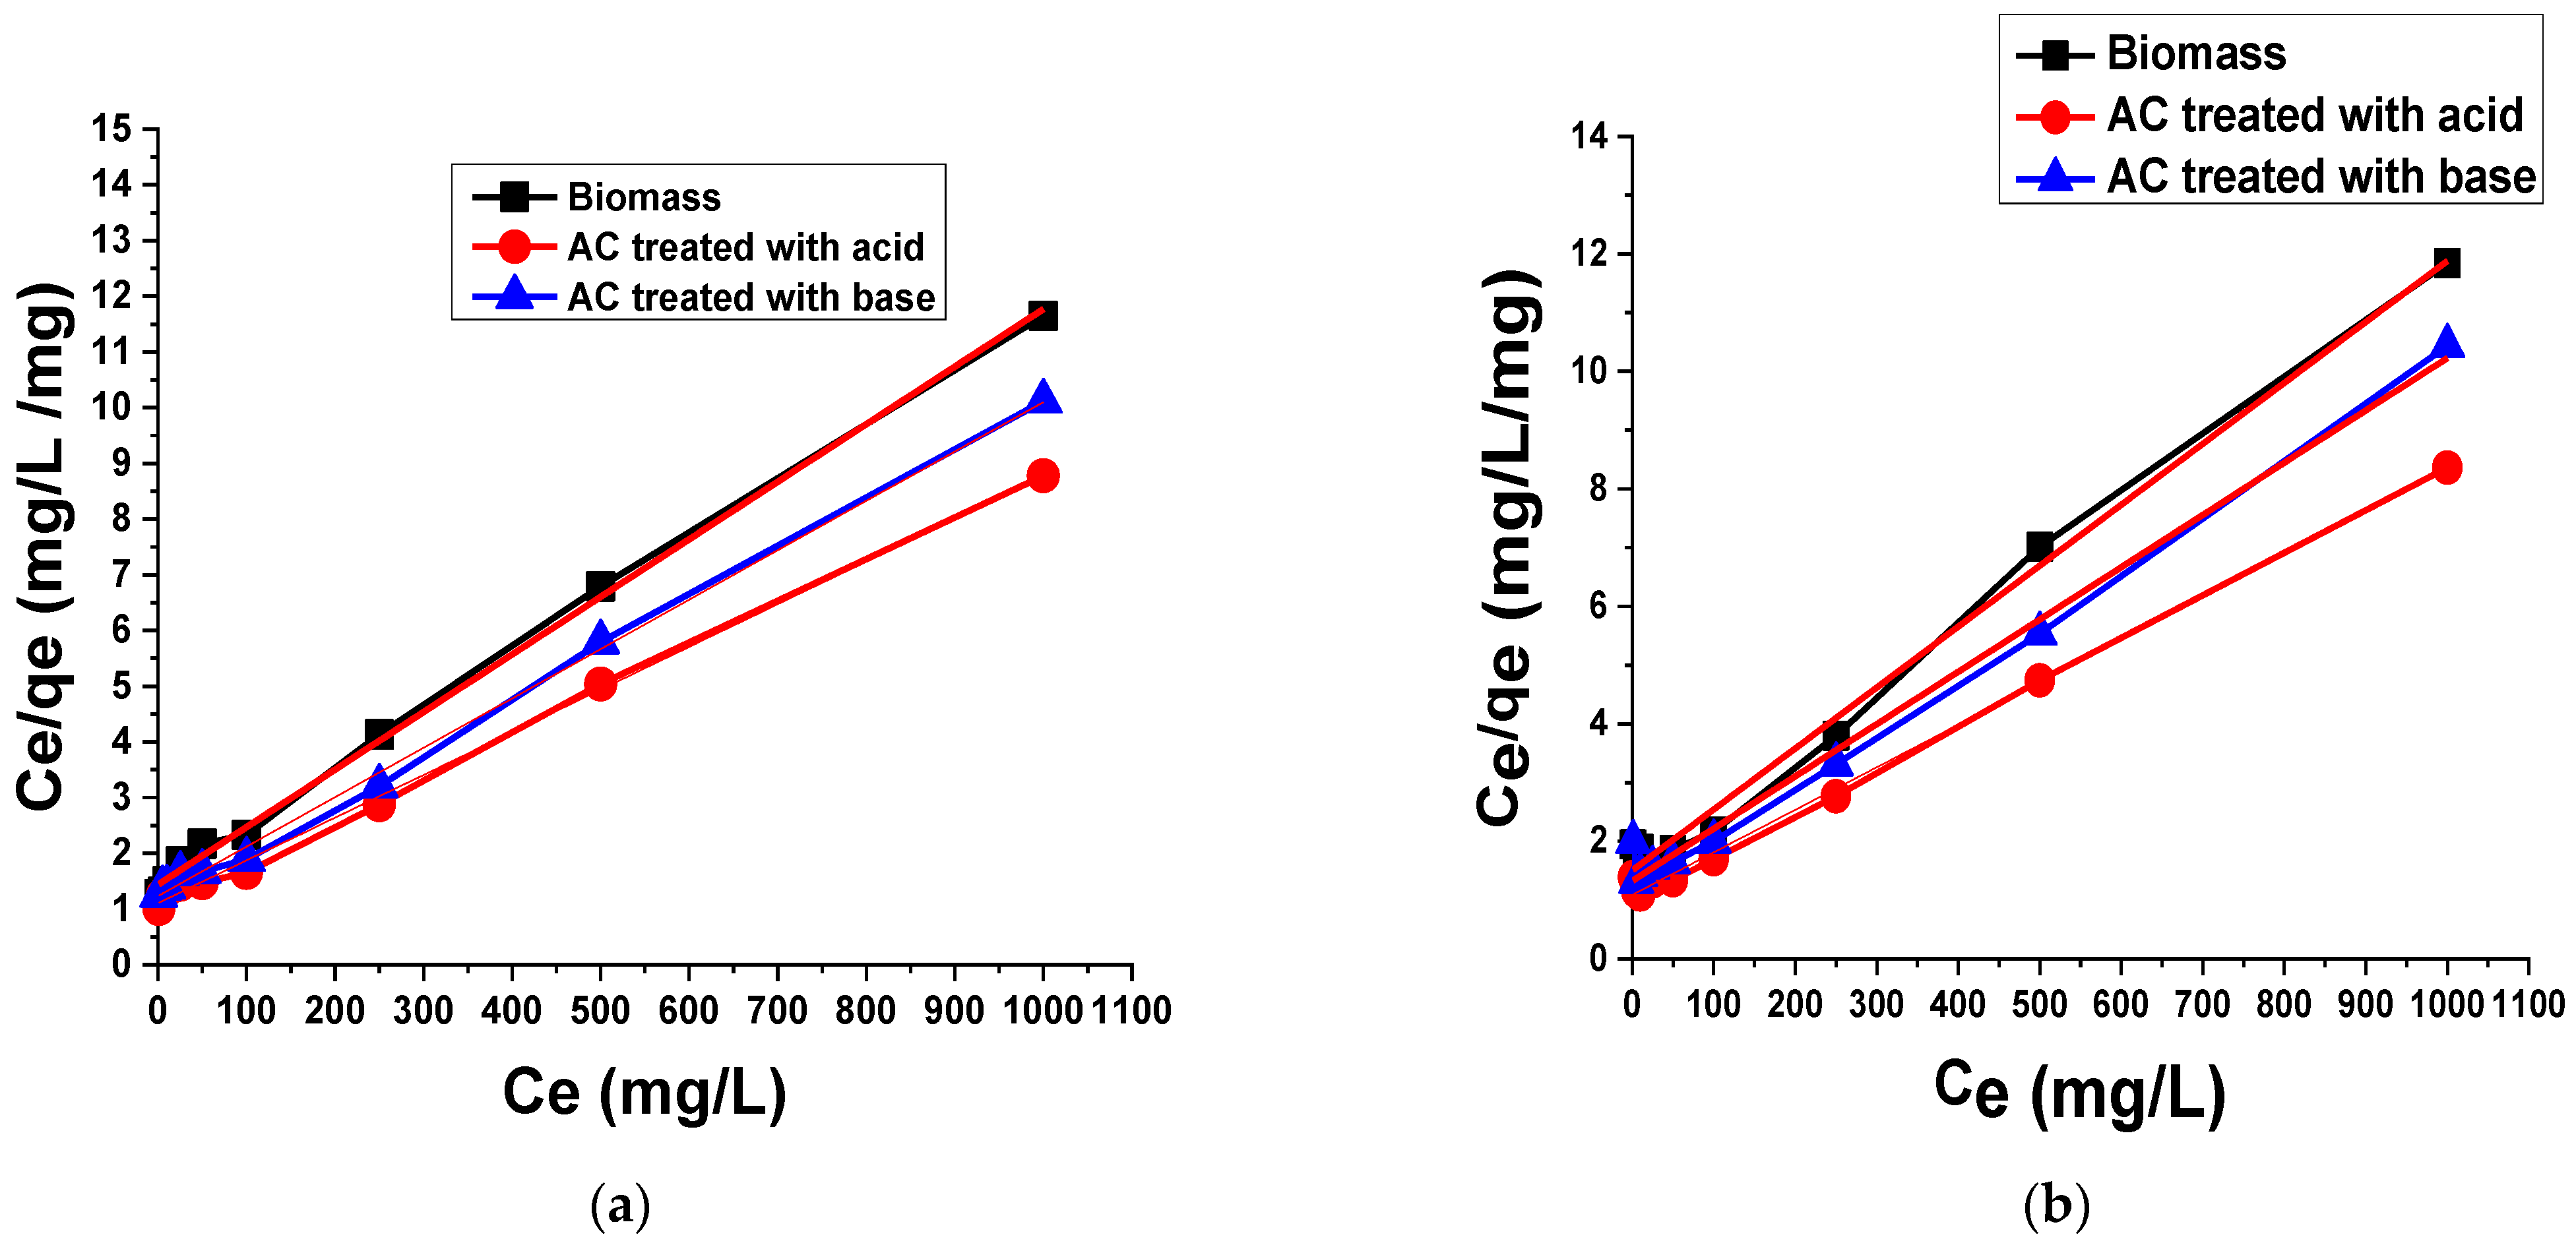
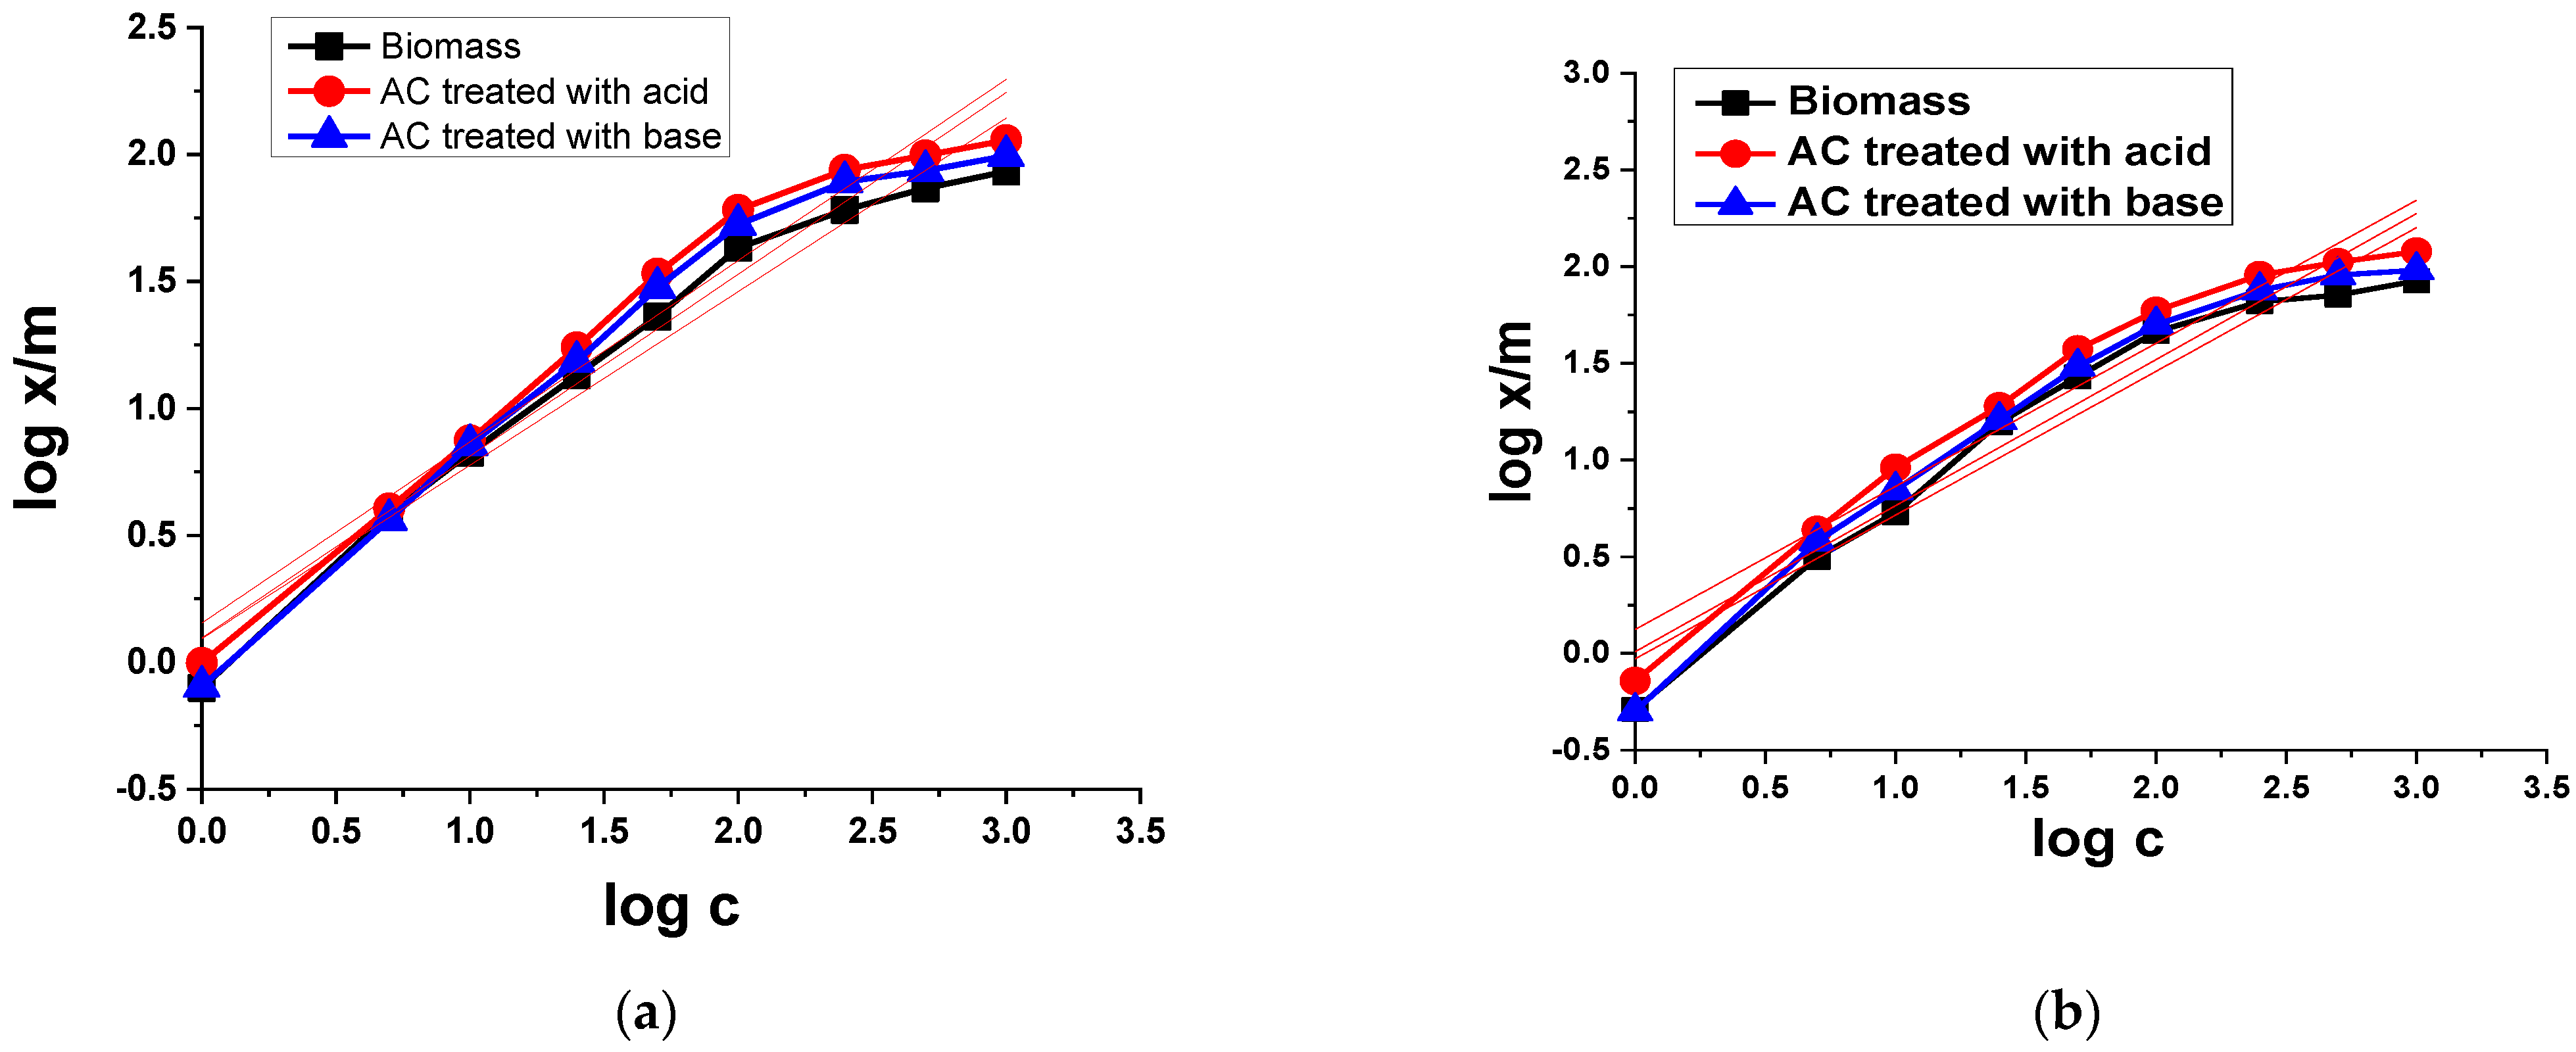
3.2.2. Adsorption Isotherms
Langmuir Isotherm Model
- Ce = Concentration of dye molecules adsorbed at equilibrium (mg/L);
- qe = Dye molecule adsorbed per unit mass of adsorbent (mg/g);
- KL = Free energy of adsorption related to Langmuir isotherm constant;
- qm = Maximum adsorption capacity.
Freundlich Isotherm Model
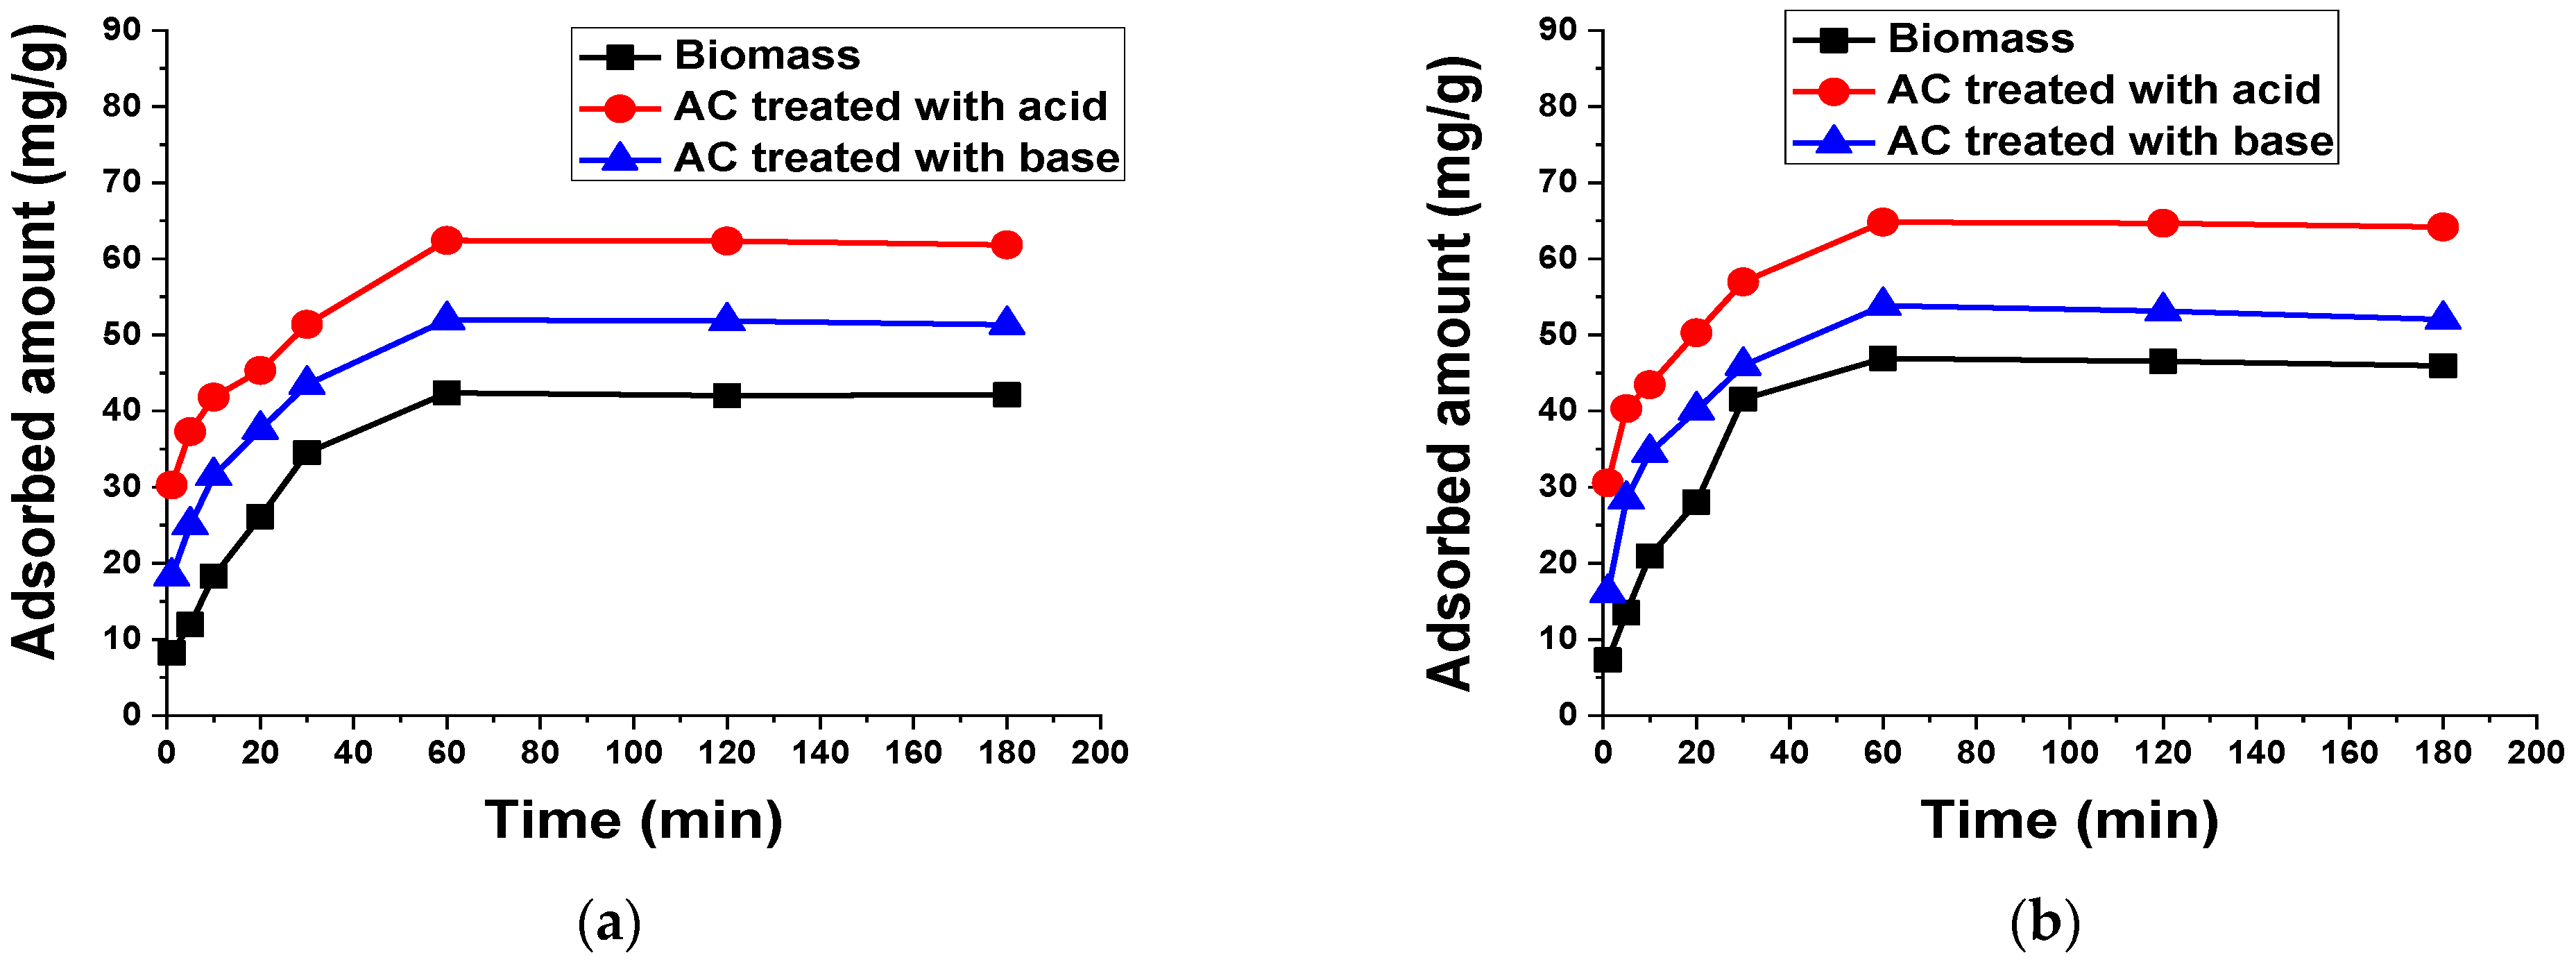
3.2.3. Contact Time
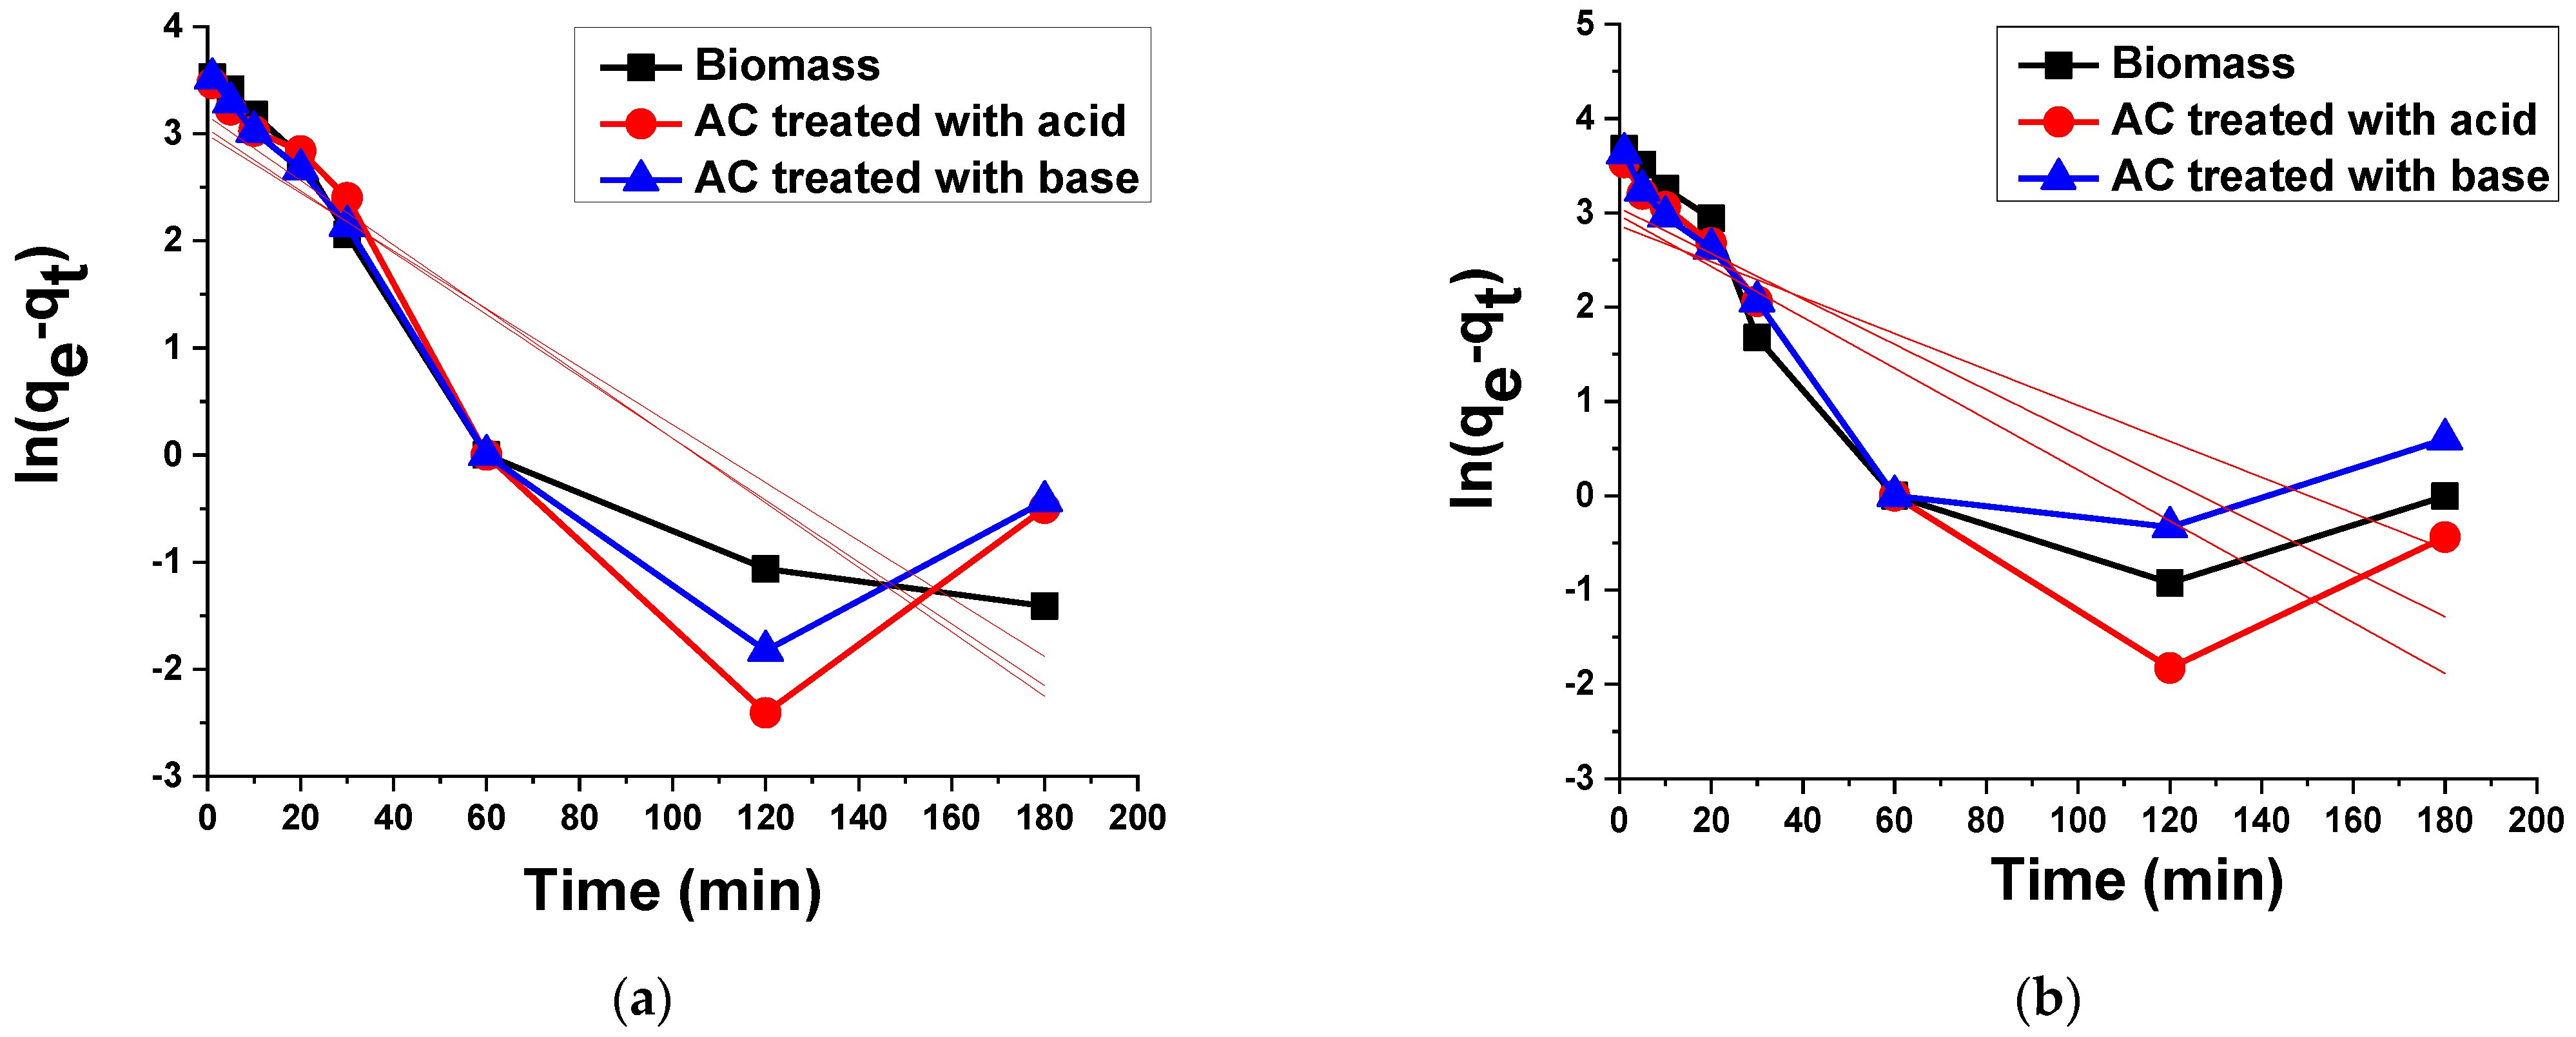
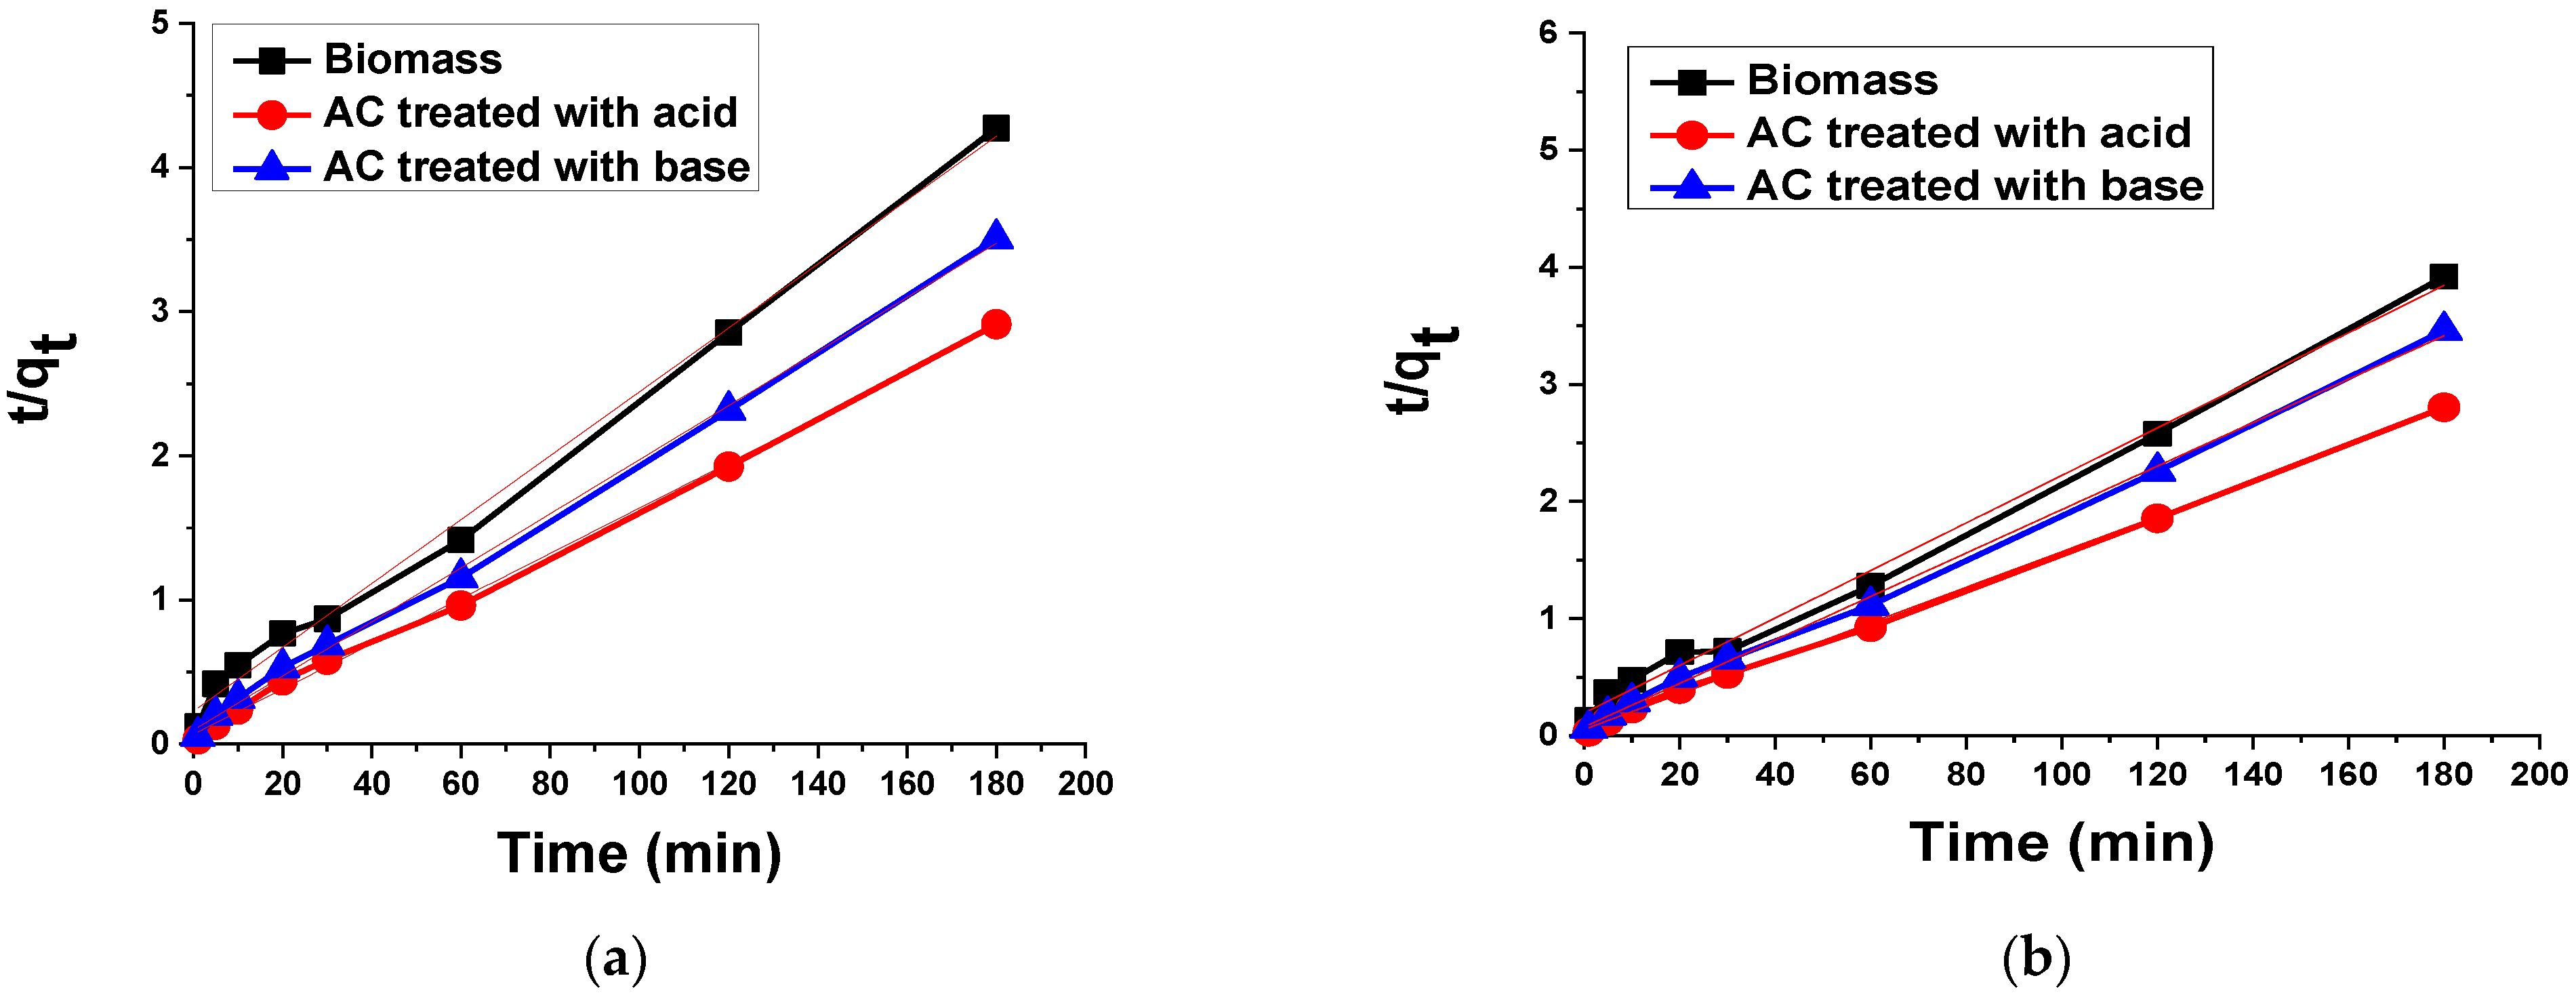
3.2.4. Kinetic Analysis
Pseudo-First Order Kinetic Model
Pseudo-Second Order Kinetic Model
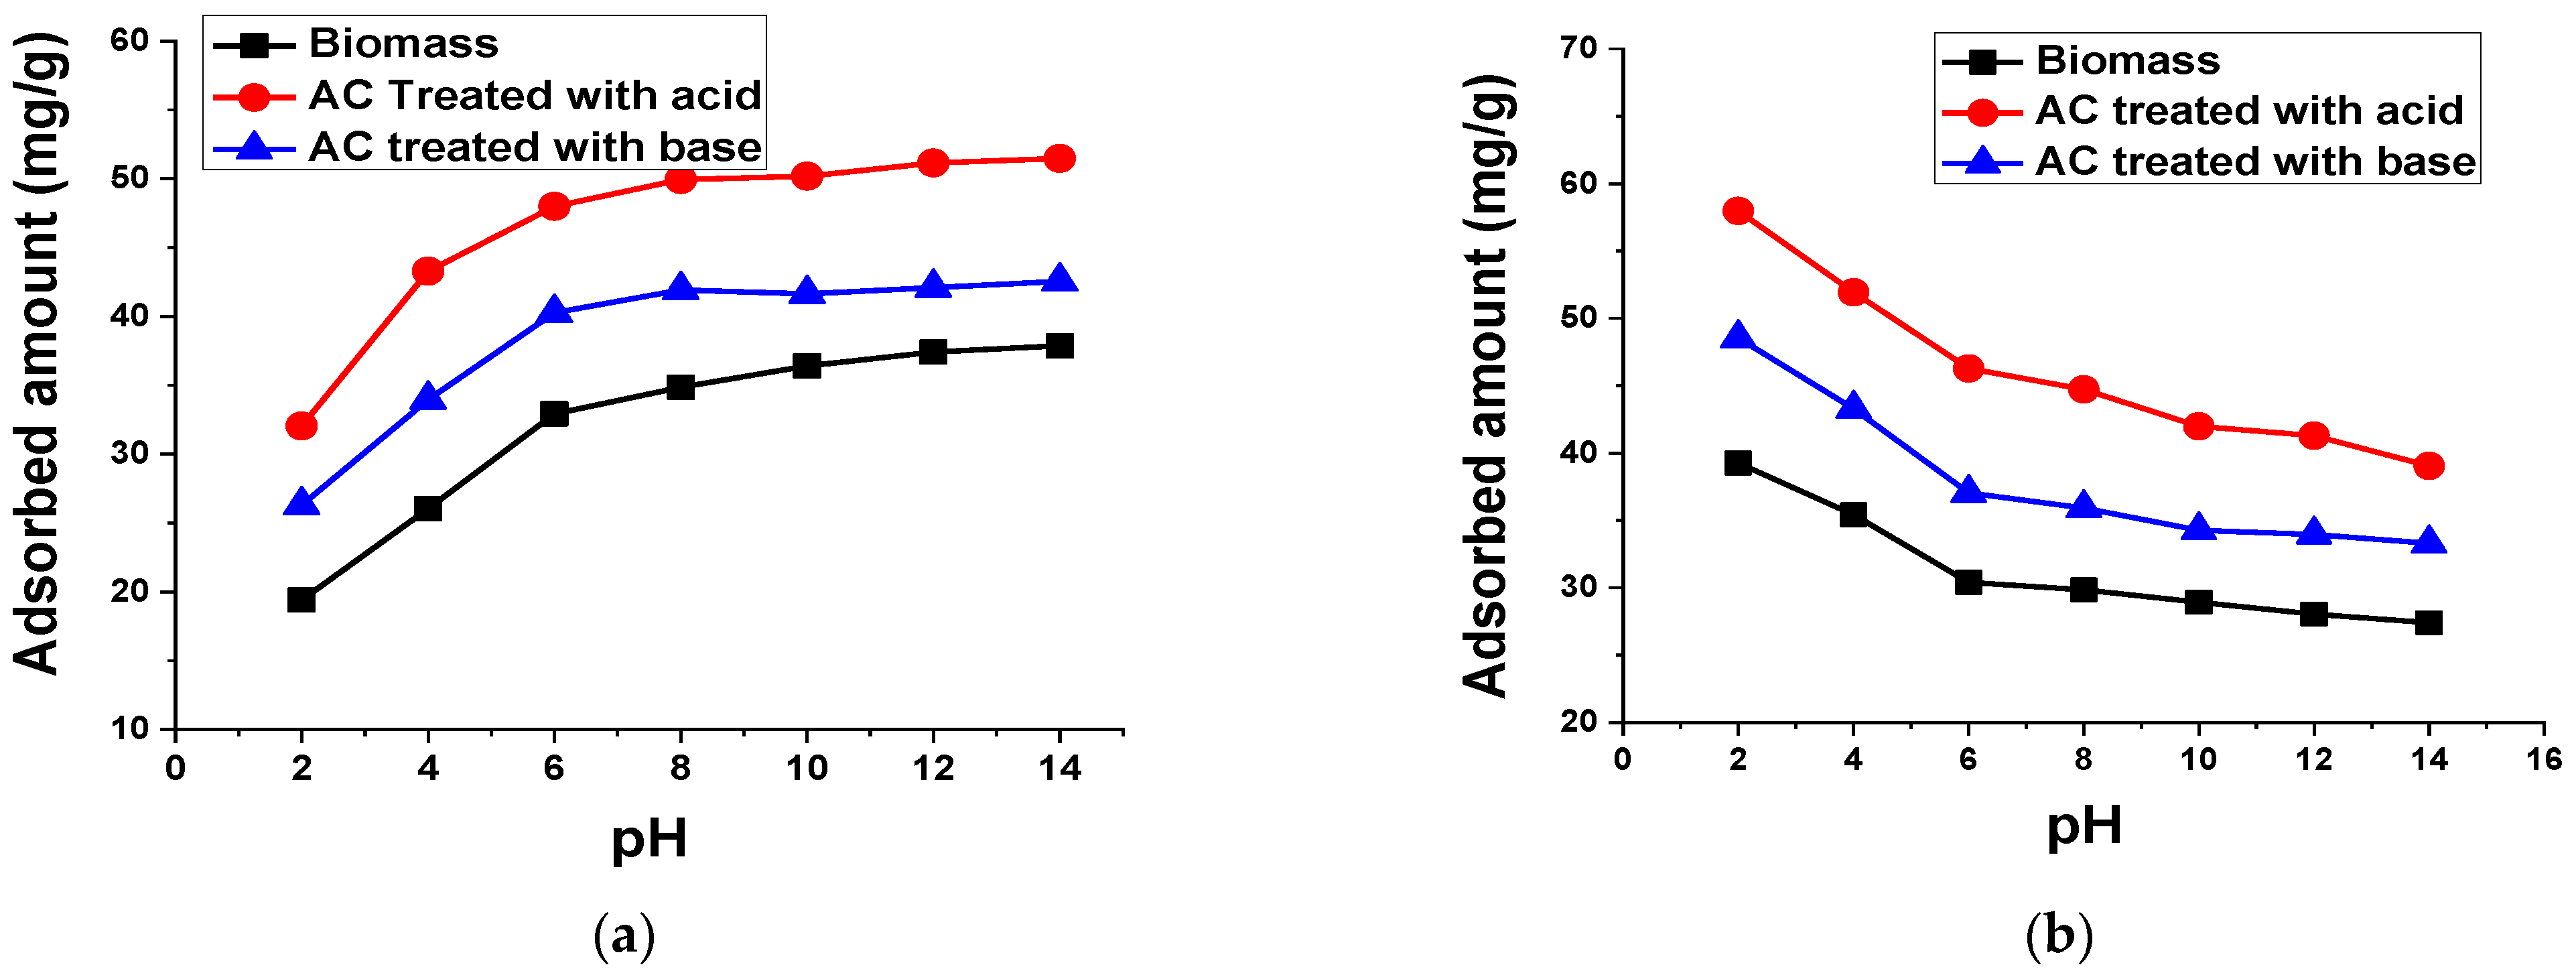
3.2.5. pH
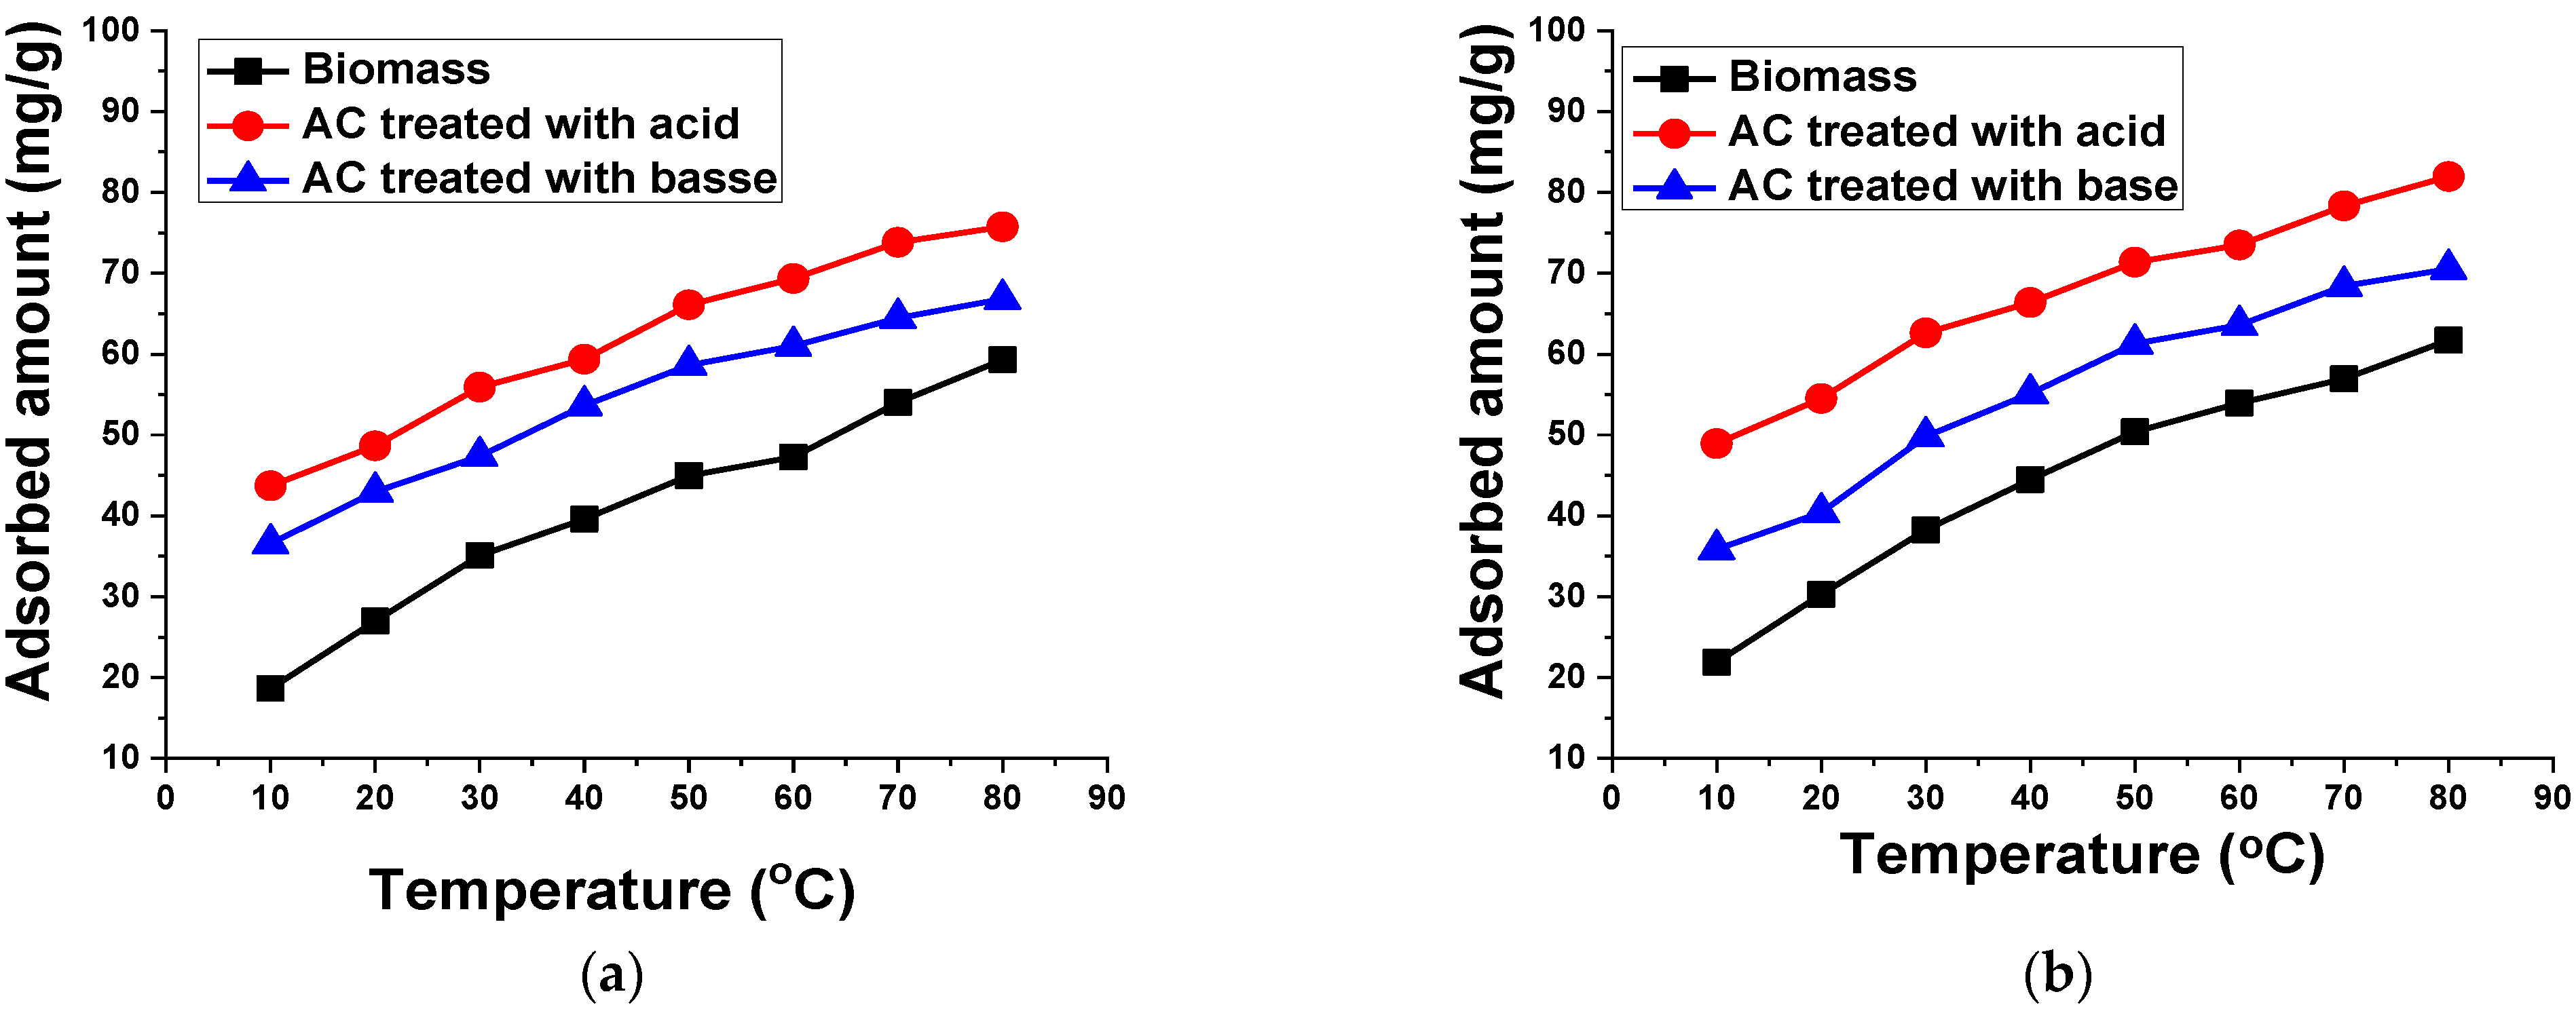
3.2.6. Temperature
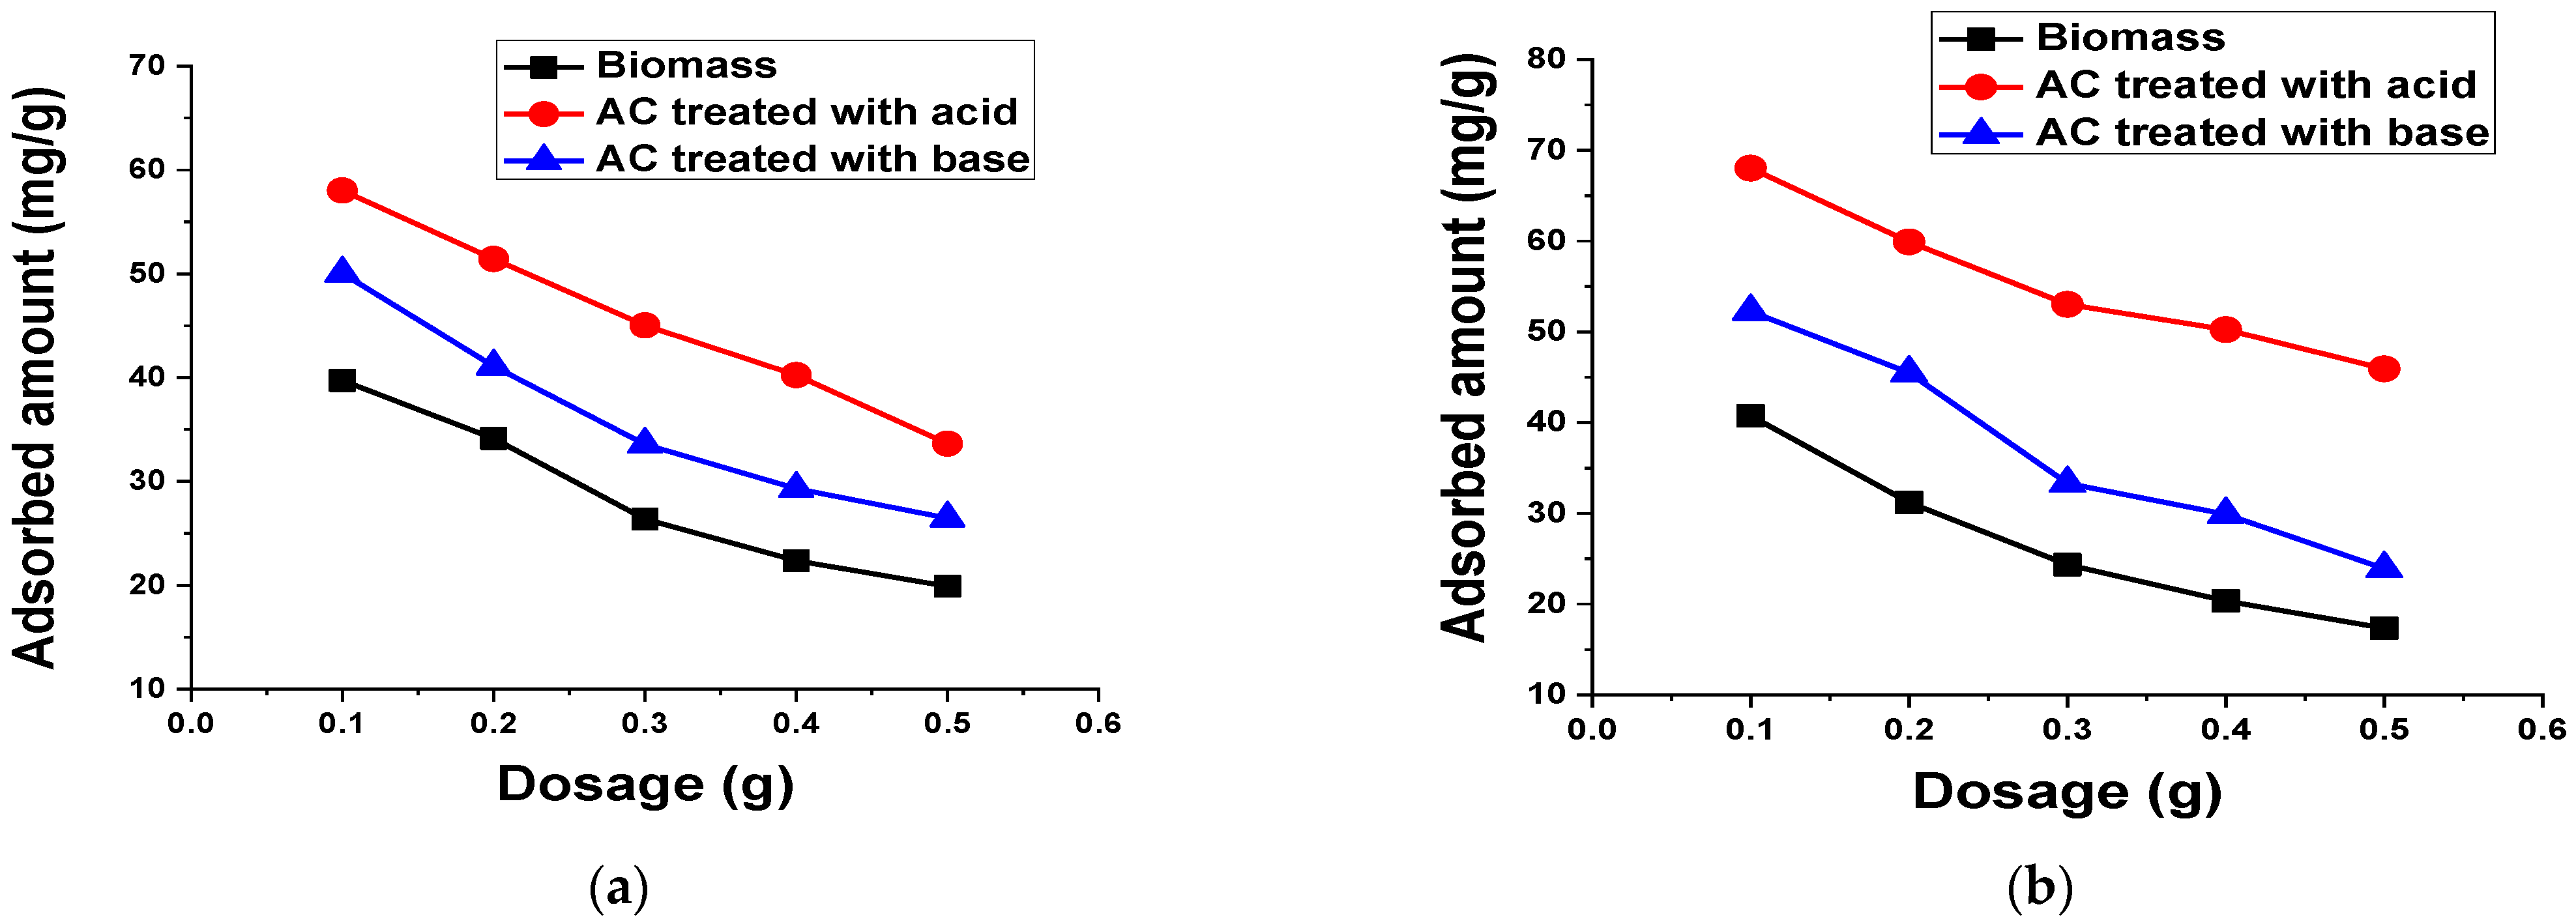
3.2.7. Adsorbent Dosage
3.2.8. Agitation Speed
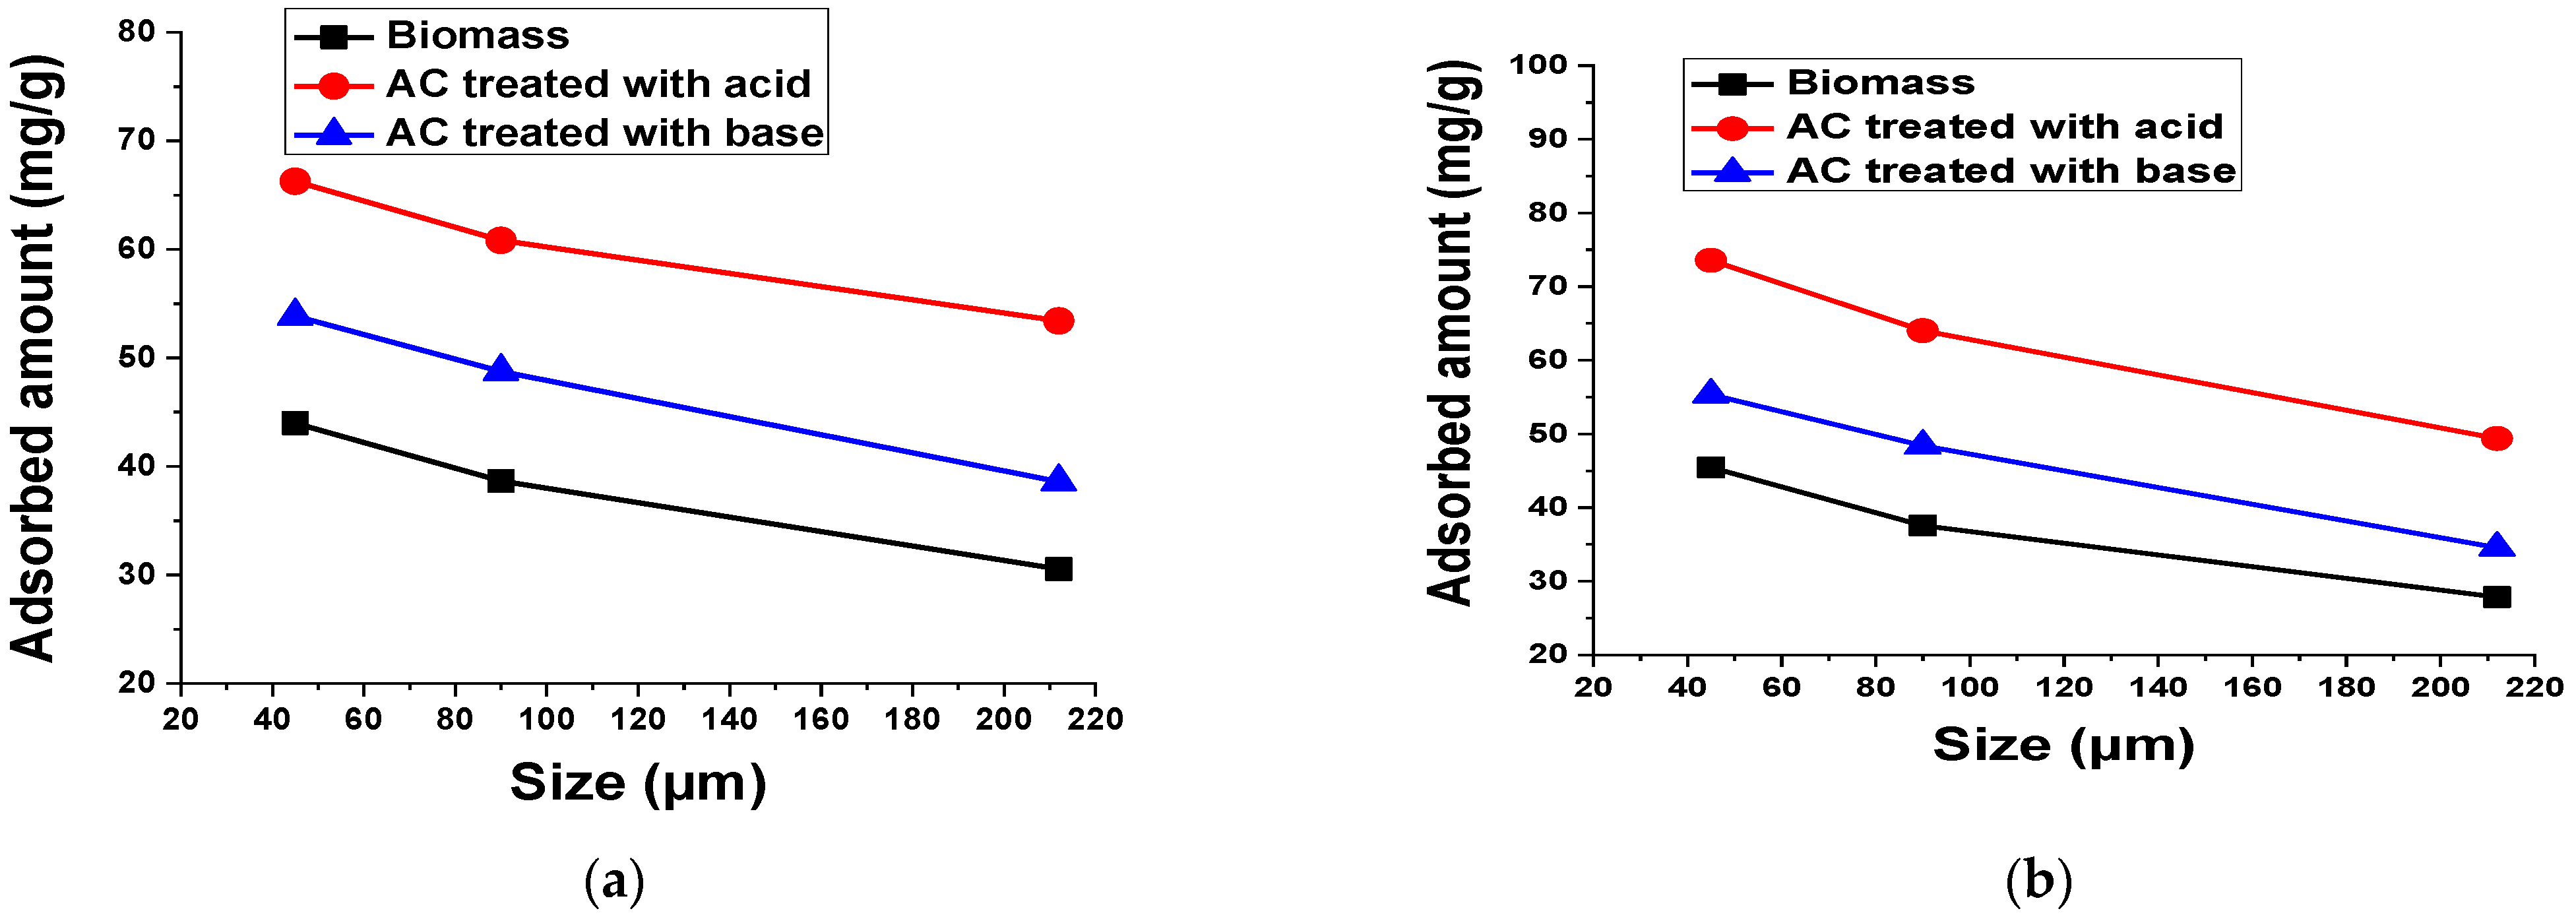
3.2.9. Adsorbent Size
4. Conclusions
Author Contributions
Funding
Institutional Review Board Statement
Informed Consent Statement
Data Availability Statement
Acknowledgments
Conflicts of Interest
References
- Adeyemo, A.A.; Adeoye, I.O.; Bello, O.S. Adsorption of dyes using different types of clay: A review. Appl. Water Sci. 2017, 7, 543–568. [Google Scholar] [CrossRef] [Green Version]
- Sathiyavimal, S.; Vasantharaj, S.; Shanmugavel, M.; Manikandan, E.; Nguyen-Tri, P.; Brindhadevi, K.; Pugazhendhi, A. Facile synthesis and characterization of hydroxyapatite from fish bones: Photocatalytic degradation of industrial dyes (crystal violet and Congo red). Prog. Org. Coat. 2020, 148, 105890. [Google Scholar] [CrossRef]
- Alhogbi, B.G.; Altayeb, S.; Bahaidarah, E.A.; Zawrah, M.F. Removal of anionic and cationic dyes from wastewater using activated carbon from palm tree fiber waste. Processes 2021, 9, 416. [Google Scholar] [CrossRef]
- Arora, J.; Agarwal, P.; Gupta, G. Rainbow of natural dyes on textiles using plants extracts: Sustainable and eco-friendly processes. Green Sustain. Chem. 2017, 7, 35–47. [Google Scholar] [CrossRef] [Green Version]
- Bagheri, S.; Aghaei, H.; Monajjemi, M.; Ghaedi, M.; Zare, K. Novel Au–Fe3O4 NPs loaded on activated carbon as a green and high efficient adsorbent for removal of dyes from aqueous solutions: Application of ultrasound wave and optimization. Eurasian J. Anal. Chem. 2018, 13, 1–10. [Google Scholar] [CrossRef] [Green Version]
- Balarak, D.; Mostafapour, F.; Azarpira, H. Adsorption kinetics and equilibrium of ciprofloxacin from aqueous solutions using corylus avellana (hazelnut) activated carbon. J. Pharm. Res. Int. 2016, 13, 1–14. [Google Scholar] [CrossRef]
- Barsukova, M.E.; Veselova, I.A.; Shekhovtsova, T.N. Main methods and approaches to the determination of markers of oxidative stress—Organic peroxide compounds and hydrogen peroxide. J. Anal. Chem. 2019, 74, 425–436. [Google Scholar] [CrossRef]
- Mahat, S.B.; Omar, R.; Idris, A.; Mustapa Kamal, S.M.; Mohd Idris, A.I. Dynamic membrane applications in anaerobic and aerobic digestion for industrial wastewater: A mini review. Food Bioprod. Process. 2018, 112, 150–168. [Google Scholar] [CrossRef]
- Chen, J.P.; Wu, S. Acid/base-treated activated carbons: Characterization of functional groups and metal adsorptive properties. Langmuir 2004, 20, 2233–2242. [Google Scholar] [CrossRef]
- Khan, S.B.; Rahman, M.M.; Marwani, H.M.; Asiri, A.M.; Alamry, K.A. An assessment of zinc oxide nanosheets as a selective adsorbent for cadmium. Nanoscale Res. Lett. 2013, 8, 377. [Google Scholar] [CrossRef] [Green Version]
- Khan, S.A.; Khan, S.B.; Asiri, A.M. Layered double hydroxide of Cd-Al/C for the mineralization and de-coloration of dyes in solar and visible light exposure. Sci. Rep. 2016, 6, 35107. [Google Scholar] [CrossRef] [PubMed] [Green Version]
- Khan, S.A.; Khan, S.B.; Asiri, A.M. Toward the design of Zn–Al and Zn–Cr LDH wrapped in activated carbon for the solar assisted de-coloration of organic dyes. RSC Adv. 2016, 6, 83196–83208. [Google Scholar] [CrossRef]
- Kamal, T.; Ahmad, I.; Khan, S.B.; Asiri, A.M. Bacterial cellulose as support for biopolymer stabilized catalytic cobalt nanoparticles. Int. J. Biol. Macromol. 2019, 135, 1162–1170. [Google Scholar] [CrossRef] [PubMed]
- Ismail, M.; Gul, S.; Khan, M.I.; Khan, M.A.; Asiri, A.M.; Khan, S.B. Green synthesis of zerovalent copper nanoparticles for efficient reduction of toxic azo dyes congo red and methyl orange. Green Process. Synth. 2019, 8, 135–143. [Google Scholar] [CrossRef]
- Lee, Y.; Kim, D.; Seo, J.; Han, H.; Khan, S.B. Preparation and characterization of poly (propylene carbonate)/exfoliated graphite nanocomposite films with improved thermal stability, mechanical properties and barrier properties. Polym. Int. 2013, 62, 1386–1394. [Google Scholar] [CrossRef]
- Kamal, T.; Ali, N.; Naseem, A.A.; Khan, S.B.; Asiri, A.M. Polymer nanocomposite membranes for antifouling nanofiltration. Recent Pat. Nanotechnol. 2016, 10, 189–201. [Google Scholar] [CrossRef]
- Danmaliki, G.I.; Saleh, T.A.; Shamsuddeen, A.A. Response surface methodology optimization of adsorptive desulfurization on nickel/activated carbon. Chem. Eng. J. 2017, 313, 993–1003. [Google Scholar] [CrossRef]
- De Falco, F.; Gullo, M.P.; Gentile, G.; Di Pace, E.; Cocca, M.; Gelabert, L.; Brouta-Agnésa, M.; Rovira, A.; Escudero, R.; Villalba, R.; et al. Evaluation of microplastic release caused by textile washing processes of synthetic fabrics. Environ. Pollut. 2018, 236, 916–925. [Google Scholar] [CrossRef]
- Dehariya, N.K.; Lal, N. Removal of Zinc from waste water by using low cost adsorbent: A comprehensive review. Int. Res. J. Eng. Technol. 2018, 5, 1021–1032. [Google Scholar]
- Ani, J.U.; Akpomie, K.G.; Okoro, U.C.; Aneke, L.E.; Onukwuli, O.D.; Ujam, O.T. Potentials of activated carbon produced from biomass materials for sequestration of dyes, heavy metals, and crude oil components from aqueous environment. Appl. Water Sci. 2020, 10, 69. [Google Scholar] [CrossRef] [Green Version]
- Dlamini, C.L.; De Kock, L.-A.; Kefeni, K.K.; Mamba, B.B.; Msagati, T.A.M. Acid mine drainage pollution remediation using hybrid chelating ion-exchange/HZrO2 nanocomposite adsorbents. SN Appl. Sci. 2019, 1, 1618. [Google Scholar] [CrossRef] [Green Version]
- Moosavi, S.; Lai, C.W.; Gan, S.; Zamiri, G.; Akbarzadeh Pivehzhani, O.; Johan, M.R. Application of efficient magnetic particles and activated carbon for dye removal from wastewater. ACS Omega 2020, 5, 20684–20697. [Google Scholar] [CrossRef] [PubMed]
- Tahir, H.; Sultan, M.; Akhtar, N.; Uzma Hameed, U. Application of natural and modified sugar cane bagasse for the removal of dye from aqueous solution. J. Saudi Chem. Soc. 2016, 20, S115–S121. [Google Scholar] [CrossRef] [Green Version]
- Siriweera, B.; Jayathilake, S. Modifications of coconut waste as an adsorbent for the removal of heavy metals and dyes from wastewater. Int. J. Environ. Eng. 2020, 10, 329–349. [Google Scholar] [CrossRef]
- Farnane, M.; Tounsadi, H.; Machrouhi, A.; Elhalil, A.; Mahjoubi, F.Z.; Sadiq, M.; Abdennouri, M.; Qourzal, S.; Barka, N. Dye removal from aqueous solution by raw maize corncob and H3PO4 activated maize corncob. J. Water Reuse Desalination 2018, 8, 214–224. [Google Scholar] [CrossRef]
- Rubio, A.J.; Silva, I.Z.; Gasparotto, F.; Paccola, E.A.S.; Silva, C.N.; Emanuelli, I.P.; Bergamasco, R.; Yamaguchi, N.U. Removal of methylene blue using cassava bark residue. Chem. Eng. Trans. 2018, 65, 751–756. [Google Scholar]
- Mohammed, R.A.; Al-Mammar, D.E. Using tobacco leaves as adsorbent for the orange-G dye removal from its aqueous solutions. J. Glob. Pharma Technol. 2019, 11, 273–280. [Google Scholar]
- Ferrero, F. Dye removal by low cost adsorbents: Hazelnut shells in comparison with wood sawdust. J. Hazard. Mater. 2007, 142, 144–152. [Google Scholar] [CrossRef]
- Sun, J.; Dai, X.; Wang, Q.; van Loosdrecht, M.C.M.; Ni, B.-J. Microplastics in wastewater treatment plants: Detection, occurrence and removal. Water Res. 2019, 152, 21–37. [Google Scholar] [CrossRef]
- Teh, C.Y.; Budiman, P.M.; Shak, K.P.Y.; Wu, T.Y. Recent advancement of coagulation–flocculation and its application in wastewater treatment. Ind. Eng. Chem. Res. 2016, 55, 4363–4389. [Google Scholar] [CrossRef]
- Chau, V.T.T.; Thanh, H.T.M.; Du, P.; Toan, T.T.T.; Tuyen, T.N.; Mau, T.X.; Khieu, D.Q. Metal-organic framework-101 (MIL-101): Synthesis, kinetics, thermodynamics, and equilibrium isotherms of remazol deep black RGB adsorption. J. Chem. 2018, 2018, 8616921. [Google Scholar]
- Vikrant, K.; Cho, M.; Khan, A.; Kim, K.-H.; Ahn, W.-S.; Kwon, E.E. Adsorption properties of advanced functional materials against gaseous formaldehyde. Environ. Res. 2019, 178, 108672. [Google Scholar] [CrossRef]
- Wang, H.; Yu, X. A review of the protection of sources of drinking water in China. Nat. Resour. Forum 2014, 38, 99–108. [Google Scholar] [CrossRef]
- Williams, T.N.; Kuenemann, M.A.; Van Den Driessche, G.A.; Williams, A.J.; Fourches, D.; Freeman, H.S. Toward the rational design of sustainable hair dyes using cheminformatics approaches: Step 1. Database development and analysis. ACS Sustain. Chem. Eng. 2018, 6, 2344–2352. [Google Scholar] [CrossRef]
- Yıldırım, F.F.; Yavas, A.; Avinc, O. Printing with sustainable natural dyes and pigments. In Sustainability in the Textile and Apparel Industries: Production Process Sustainability; Muthu, S.S., Gardetti, M.A., Eds.; Springer International Publishing: Cham, Switzerland, 2020; pp. 1–35. [Google Scholar]
- Zhou, Y.; Lu, J.; Zhou, Y.; Liu, Y. Recent advances for dyes removal using novel adsorbents: A review. Environ. Pollut. 2019, 252, 352–365. [Google Scholar] [CrossRef]
- Van, K.L.; Thu, T.L.T. Preparation of pore-size controllable activated carbon from rice husk using dual activating agent and its application in supercapacitor. J. Chem. 2019, 2019, 4329609. [Google Scholar]
- Din, M.I.; Ashraf, S.; Intisar, A. Comparative study of different activation treatments for the preparation of activated carbon: A mini-review. Sci. Prog. 2017, 100, 299–312. [Google Scholar] [CrossRef]
- Osman, A.I.; Blewitt, J.; Abu-Dahrieh, J.K.; Farrell, C.; Al-Muhtaseb, A.H.; Harrison, J.; Rooney, D.W. Production and characterisation of activated carbon and carbon nanotubes from potato peel waste and their application in heavy metal removal. Environ. Sci. Pollut. Res. 2019, 26, 37228–37241. [Google Scholar] [CrossRef] [Green Version]
- Ali, J.; Bakhsh, E.M.; Hussain, N.; Bilal, M.; Akhtar, K.; Fagieh, T.M.; Danish, E.Y.; Asiri, A.M.; Su, X.; Khan, S.B. A new biosource for synthesis of activated carbon and its potential use for removal of methylene blue and eriochrome black T from aqueous solutions. Ind. Crops Prod. 2022, 179, 114676. [Google Scholar] [CrossRef]
- Saenger, K.L.; Tsang, J.C.; Bol, A.A.; Chu, J.O.; Grill, A.; Lavoie, C. In situ X-ray diffraction study of graphitic carbon formed during heating and cooling of amorphous-C/Ni bilayers. Appl. Phys. Lett. 2010, 96, 153105. [Google Scholar] [CrossRef] [Green Version]
- Wang, S.; Zhu, Z.H. Effects of acidic treatment of activated carbons on dye adsorption. Dye. Pigment. 2007, 75, 306–314. [Google Scholar] [CrossRef]
- Mahamadi, C.; Mawere, E. Continuous flow biosorptive removal of methylene blue and crystal violet dyes using alginate—Water hyacinth beads. Cogent Environ. Sci. 2019, 5, 1594513. [Google Scholar] [CrossRef]
- Hasan, H.M.I.; Alfutisi, H.M.M. Removing of thymol blue from aqueous solutions by pomegranate peel. Int. J. Appl. Sci. 2018, 1, 111–119. [Google Scholar]
- Kuete, I.-H.T.; Tchuifon, D.R.T.; Ndifor-Angwafor, G.N.; Kamdem, A.T.; Anagho, S.G. Kinetic, isotherm and thermodynamic studies of the adsorption of thymol blue onto powdered activated carbons from garcinia cola nut shells impregnated with H3PO4 and KOH: Non-linear regression analysis. J. Encapsul. Adsorpt. Sci. 2020, 10, 1–27. [Google Scholar]
- Shehata, H.M.; Ali, D.A.; Al-Akraa, I.M.; Elazab, H.A.; Elsawy, H.A. Development of novel adsorbent for industrial waste water treatment. Int. J. Adv. Trends Comput. Sci. Eng. 2020, 9, 704–712. [Google Scholar] [CrossRef]
- Ishaq, M.; Saeed, K.; Ahmad, I.; Sultan, S. Coal ash as a low cost adsorbent for the removal of xylenol orange from aqueous solution. Iran. J. Chem. Chem. Eng. 2014, 33, 53–58. [Google Scholar]
- Al-Kazragi, M.A.; Al-Heetimi, D.T.A.; Al-Khazrajy, O.S.A. Xylenol orange removal from aqueous solution by natural bauxite (BXT) and BXT-HDTMA: Kinetic, thermodynamic and isotherm modeling. Desalination Water Treat. 2019, 145, 369–377. [Google Scholar]
- Ali, S.; Alharbi, B. Removal of xylenol orange from aqueous solution by adsorption on polyurethane foam. Alger. J. Nat. Prod. 2021, 9, 805–813. [Google Scholar]
- Pang, X.; Yang, C.; Shuxia Ren, S. Adsorption capacity of expansion graphite for xylenol orange. J. Mater. Sci. Chem. Eng. 2013, 1, 1–5. [Google Scholar]
- Zhu, L.; Guan, C.; Zhou, B.; Zhang, Z.; Yang, R.; Tang, Y.; Yang, J. Adsorption of dyes onto sodium alginate graft poly(acrylic acidco-2-acrylamide-2-methyl propane sulfonic acid)/kaolin hydrogel composite. Polym. Polym. Compos. 2017, 25, 627–634. [Google Scholar]
- Ayawei, N.; Ebelegi, A.N.; Wankasi, D. Modelling and interpretation of adsorption isotherms. J. Chem. 2017, 2017, 3039817. [Google Scholar] [CrossRef]
- Silva, T.L.; Cazetta, A.L.; Souza, P.S.C.; Zhang, T.; Asefa, T.; Almeida, V.C. Mesoporous activated carbon fibers synthesized from denim fabric waste: Efficient adsorbents for removal of textile dye from aqueous solutions. J. Clean. Prod. 2018, 171, 482–490. [Google Scholar] [CrossRef]
- Sharma, S.; Kaur, A. Various methods for removal of dyes from industrial effluents—A review. Indian J. Sci. Technol. 2018, 11, 1–21. [Google Scholar] [CrossRef]
- Revellame, E.D.; Fortela, D.L.; Sharp, W.; Hernandez, R.; Zappi, M.E. Adsorption kinetic modeling using pseudo-first order and pseudo-second order rate laws: A review. Clean. Eng. Technol. 2020, 1, 100032. [Google Scholar] [CrossRef]
- El Maguana, Y.; Elhadiri, N.; Benchanaa, M.; Chikri, R. Activated carbon for dyes removal: Modeling and understanding the adsorption process. J. Chem. 2020, 2020, 2096834. [Google Scholar] [CrossRef]
- Banerjee, S.; Chattopadhyaya, M.C. Adsorption characteristics for the removal of a toxic dye, tartrazine from aqueous solutions by a low cost agricultural by-product. Arab. J. Chem. 2017, 10, S1629–S1638. [Google Scholar] [CrossRef] [Green Version]
- Rápó, E.; Szende Tonk, S. Factors affecting synthetic dye adsorption; desorption studies: A review of results from the last five years (2017–2021). Molecules 2021, 26, 5419. [Google Scholar] [CrossRef]


| Sample | BET Surface Area (m2/g) | Pore Volume (cm3/g) | Pore Radius (Å) |
|---|---|---|---|
| Biomass | 29.10 | 0.007 | 16.90 |
| AC treated with acid | 64.28 | 0.012 | 14.51 |
| AC treated with base | 43.57 | 0.003 | 16.78 |
| Biomass | Acid-Treated AC | Base-Treated AC | ||||
|---|---|---|---|---|---|---|
| Element | Weight, % | Atomic, % | Weight, % | Atomic, % | Weight, % | Atomic, % |
| C | 58.02 | 64.33 | 76.45 | 83.24 | 61.04 | 56.21 |
| O | 30.97 | 25.78 | 17.44 | 14.26 | 24.52 | 30.08 |
| N | 9.97 | 9.48 | 0.18 | 0.08 | 12.01 | 12.64 |
| Si | 0.26 | 0.12 | 2.29 | 1.06 | 0.73 | 0.38 |
| P | 0.30 | 0.13 | 0.55 | 0.23 | 0.55 | 0.26 |
| K | 0.28 | 0.09 | 1.43 | 0.58 | 0.57 | 0.21 |
| Ca | 0.21 | 0.07 | 1.67 | 0.54 | 0.58 | 0.21 |
| Total | 100 | 100 | 100 | 100 | 100 | 100 |
| Bioadsorbent | qmax (mg/g) | References |
|---|---|---|
| Thymol Blue (TB) | ||
| Pomegranate peel | 5.28 | [44] |
| Garcinia cola nut shells | 396.04 | [45] |
| Hydroxyapatite powder | 0.21 | [46] |
| Trachycarpus fortunei | 96.81 (Biomass) 130.38 (AC treated with acid) 112.74 (AC treated with base) | Current study |
| Xylenol Orange (XO) | ||
| Coal ash | 0.74 | [47] |
| Natural bauxite | 2.74 | [48] |
| Polyurethane foam | 0.904 | [49] |
| Expansion graphite | 18.15 | [50] |
| Sodium alginate graft polyhydrogel composite | 312.4 | [51] |
| Trachycarpus fortunei | 96.43 (Biomass) 138.12 (AC treated with acid) 112.36 (AC treated with base) | Current study |
Publisher’s Note: MDPI stays neutral with regard to jurisdictional claims in published maps and institutional affiliations. |
© 2022 by the authors. Licensee MDPI, Basel, Switzerland. This article is an open access article distributed under the terms and conditions of the Creative Commons Attribution (CC BY) license (https://creativecommons.org/licenses/by/4.0/).
Share and Cite
Bakhsh, E.M.; Bilal, M.; Ali, M.; Ali, J.; Wahab, A.; Akhtar, K.; Fagieh, T.M.; Danish, E.Y.; Asiri, A.M.; Khan, S.B. Synthesis of Activated Carbon from Trachycarpus fortunei Seeds for the Removal of Cationic and Anionic Dyes. Materials 2022, 15, 1986. https://doi.org/10.3390/ma15061986
Bakhsh EM, Bilal M, Ali M, Ali J, Wahab A, Akhtar K, Fagieh TM, Danish EY, Asiri AM, Khan SB. Synthesis of Activated Carbon from Trachycarpus fortunei Seeds for the Removal of Cationic and Anionic Dyes. Materials. 2022; 15(6):1986. https://doi.org/10.3390/ma15061986
Chicago/Turabian StyleBakhsh, Esraa M., Muhammad Bilal, Maqsood Ali, Javed Ali, Abdul Wahab, Kalsoom Akhtar, Taghreed M. Fagieh, Ekram Y. Danish, Abdullah M. Asiri, and Sher Bahadar Khan. 2022. "Synthesis of Activated Carbon from Trachycarpus fortunei Seeds for the Removal of Cationic and Anionic Dyes" Materials 15, no. 6: 1986. https://doi.org/10.3390/ma15061986