3.1. XRD Analysis
After different mercerization processes, changes in crystallinity and cellulose allomorphs of each sample were investigated using XRD patterns. The FitYK 1.3.1 program was used to subtract the background and divide the diffraction peaks. In order to calculate the crystalline index (CI) of the samples, Equation (6) was used to calculate the area occupied by the diffraction peaks in each sample.
where
Ic represents the crystalline phase integrated intensity and
Ia is the amorphous phase-integrated intensity.
The values of CI for the original and mercerized samples are summarized in
Table 2. The CI values decreased from 71.52% (original) to 52.61% and 63.19% after LA and CS mercerization processes, respectively. The CI value further decreased to 51.25% and 58.73% after LA–LA and CS–CS mercerization processes. The patterns recorded from LA–CS and CS–LA-treated cotton consisted of 38.42% and 40.90% CI, respectively. The decreased CI values of the samples suggest that these mercerization processes, either individually or in combination, resulted in micro-fibril swelling, rearrangement of compact hydrogen bonds in crystalline regions leading to crystallite disruption, and the formation of new amorphous regions. Treatments with combined mercerization processes resulted in a greater degree of crystallite disruption, which exhibited an advantage with the rearrangement of hydrogen bonding to cellulose crystals and the generation of a high-volume amorphous region. These results can mainly be attributed to the collaborative mercerization effect by LA and CS.
Besides the changes in
CI, the cellulose allomorph conversion by these mercerization processes was also investigated.
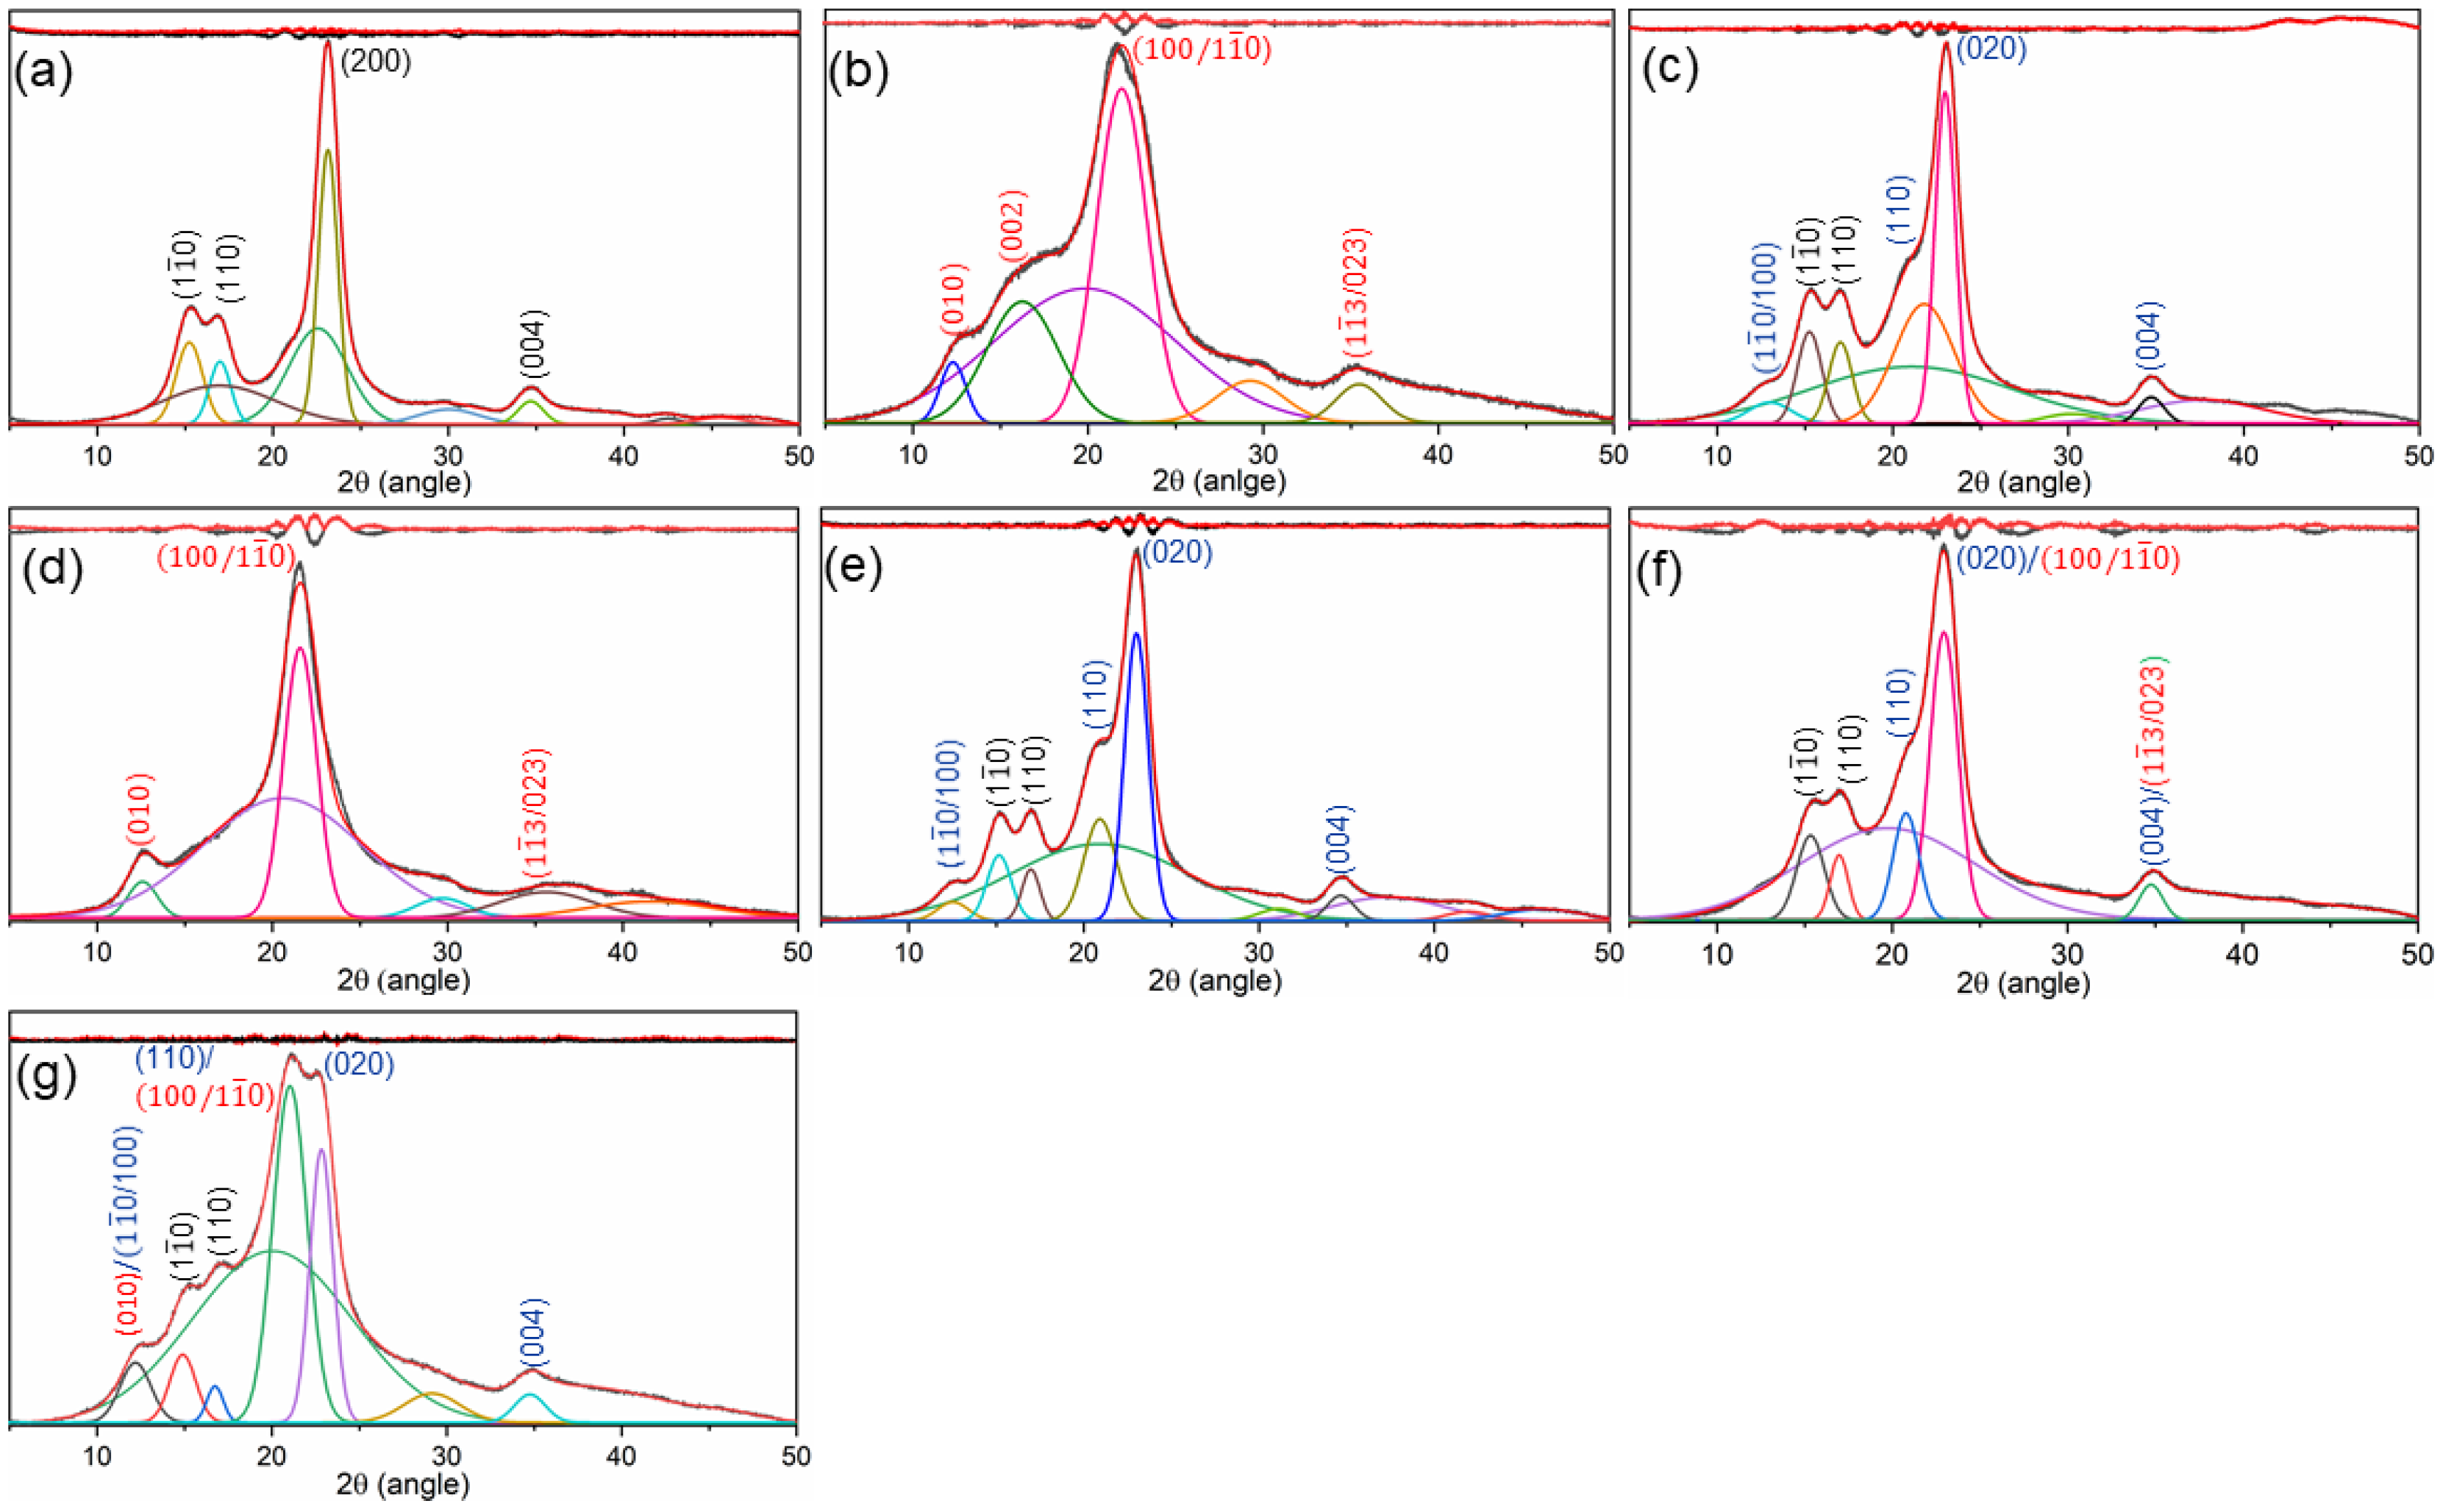
Figure 2 compares the diffraction patterns of the original and mercerized cotton fabrics. As shown in
Figure 2a, the diffraction pattern of original cotton displayed obvious characteristics of the cellulose I allomorph, consisting of peaks at 2θ values of about 14.7, 16.8, 22.6, and 34.8°, which were attributed to (1
), (110), (200), and (004) lattice planes, respectively [
21,
22,
23]. In addition, the peaks were sharper, which suggests that large crystals were present in the cellulose phase [
24]. There was also a significant shift in diffraction patterns following LA- and CS-mercerized cotton fabrics (
Figure 2b–g). The LA pre-mercerization and combined LA–LA mercerization processes led to the formation of a diffraction pattern of cellulose III allomorph consisting of (010), (011), (100/1
0), and (013/022) lattice planes at 2θ values of 11.7, 15.5, 21.0, and 35.0°, respectively [
21,
25]. Using CS pre-mercerization as well as the combined CS–CS mercerization processes, cellulose I was converted to a cellulose II allomorph, with the lattice planes of (1
0/100), (110), (020), and 004 being found at 2θ values of 12.2, 20.2, 21.8, and 34.7°, respectively [
26,
27]. Interestingly, with the combined LA–CS and CS–LA mercerization processes, the obtained diffraction pattern revealed the presence of both cellulose II and cellulose III allomorphs in the cotton.
The patterns exhibited (1
0/100), (110), (020), and (004) lattice planes of cellulose II and (010) and (100/
0) lattice planes of cellulose III. Cellulose allomorph conversion occurred as a result of the appearance of a new crystalline domain in the mercerized cotton fibers. Briefly, in cellulose microfibrils, NH
3 and NaOH systems penetrated through the amorphous and crystalline regions to result in fiber swelling and cellulose I transformation into Na–cellulose and NH
3–cellulose. The Na–cellulose I complex was converted into Na–cellulose II, while the complex NH
3–cellulose I was turned into NH
3–cellulose III. However, new hydrogen bonding networks with completely different patterns and cross-binding patterns, named cellulose II and cellulose III, were generated with the removal of NaOH and NH
3 from these cellulose complexes in the amorphous and crystalline regions [
11,
28]. Besides this, the cellulose microfibrils led to difficult recrystallization and the treated samples were mainly composed of smaller crystallites within the fibers [
29].
3.2. Thermal Performance
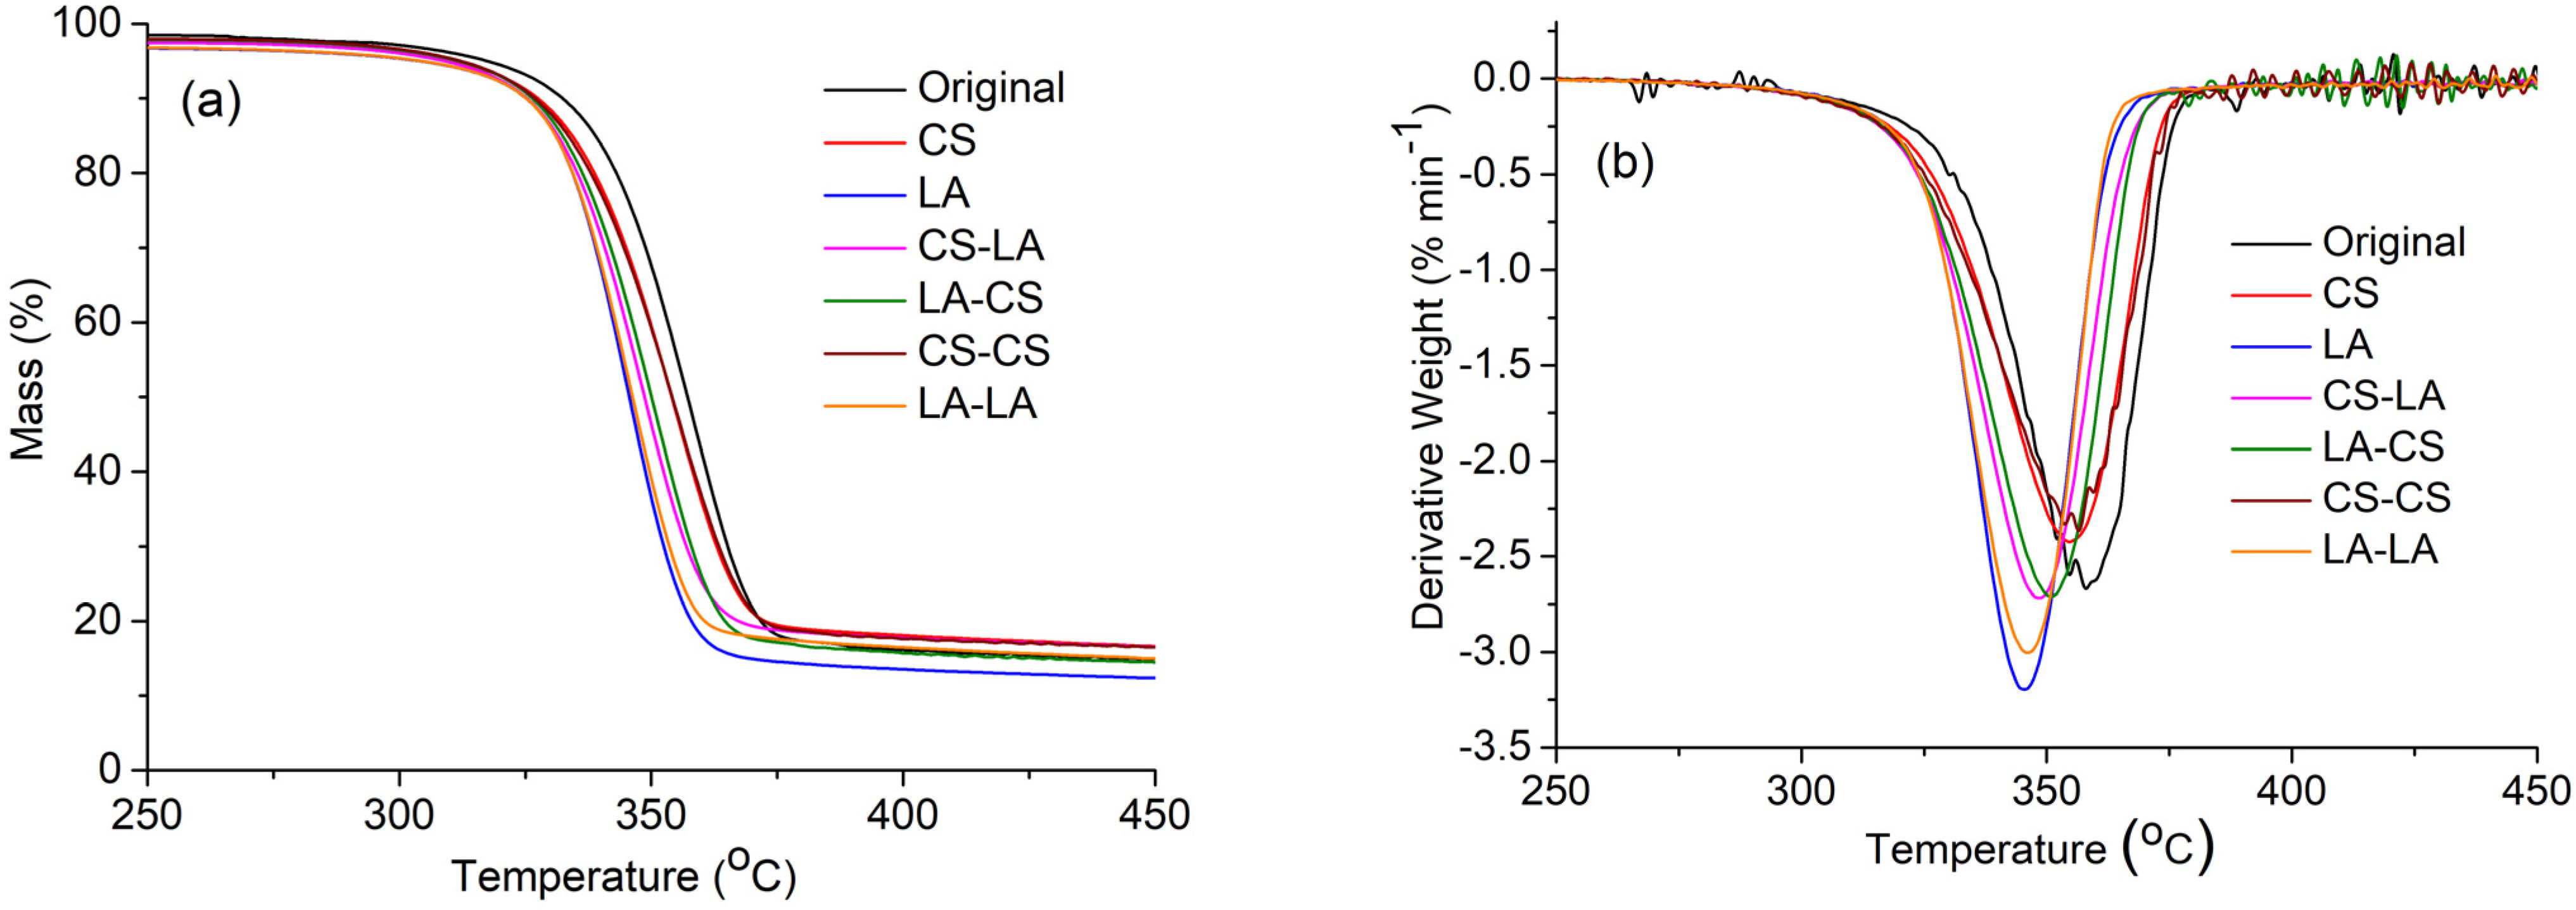
The thermal stability of a cotton fabric is an essential property with respect to its practical applications. Therefore, the thermal behaviors of original and mercerized fabrics with different conditions were thoroughly investigated using TG analysis. As shown in
Figure 3a, the TG thermogram patterns were similar for both the original and mercerized fabrics. However, slight variations were noticed with respect to the weight loss percentage for each sample at various temperatures and their char residue amounts (
Table 3). It was shown that the initial cleavage onset temperature was higher (T
onset, 321 °C) for the original fabric than the mercerized fabrics, which means that the mercerized samples decomposed much more rapidly than the original sample. The maximum weight loss began at 372 °C for the original fabric because of the depolymerization behavior mediated by trans-glycosylation [
30]. Meanwhile, the maximum weight loss temperatures (T
max) decreased to 370 and 361 °C for CS- and LA-mercerized fabrics, respectively, and for the combined mercerization processes, these values were significantly lower. These results can be explained by the higher amount of amorphous cellulose in the combined mercerization samples, meaning they underwent faster thermal decomposition than the crystalline phase [
31].
In addition, as shown the char amounts were 10.80% for the original fabric, 10.73% for CS-mercerized fabric, and 8.18% for the LA-mercerized fabric. Moreover, the highest char amount for the combination of CS–CS-mercerized fabric was 12.31%, and in the case of combined LA–LA mercerization, the char amount was less (10.01%). These phenomena were further verified from the DTG curves (
Figure 3b), which were the derivatives of the TG curves. Overall, the data suggests that LA-mercerized fabric has slightly less thermal stability than CS-mercerized fabric, in agreement with a previous report [
25].
3.3. Influence of Pre-Mercerization on Dyeing Performance of Cotton Fabric
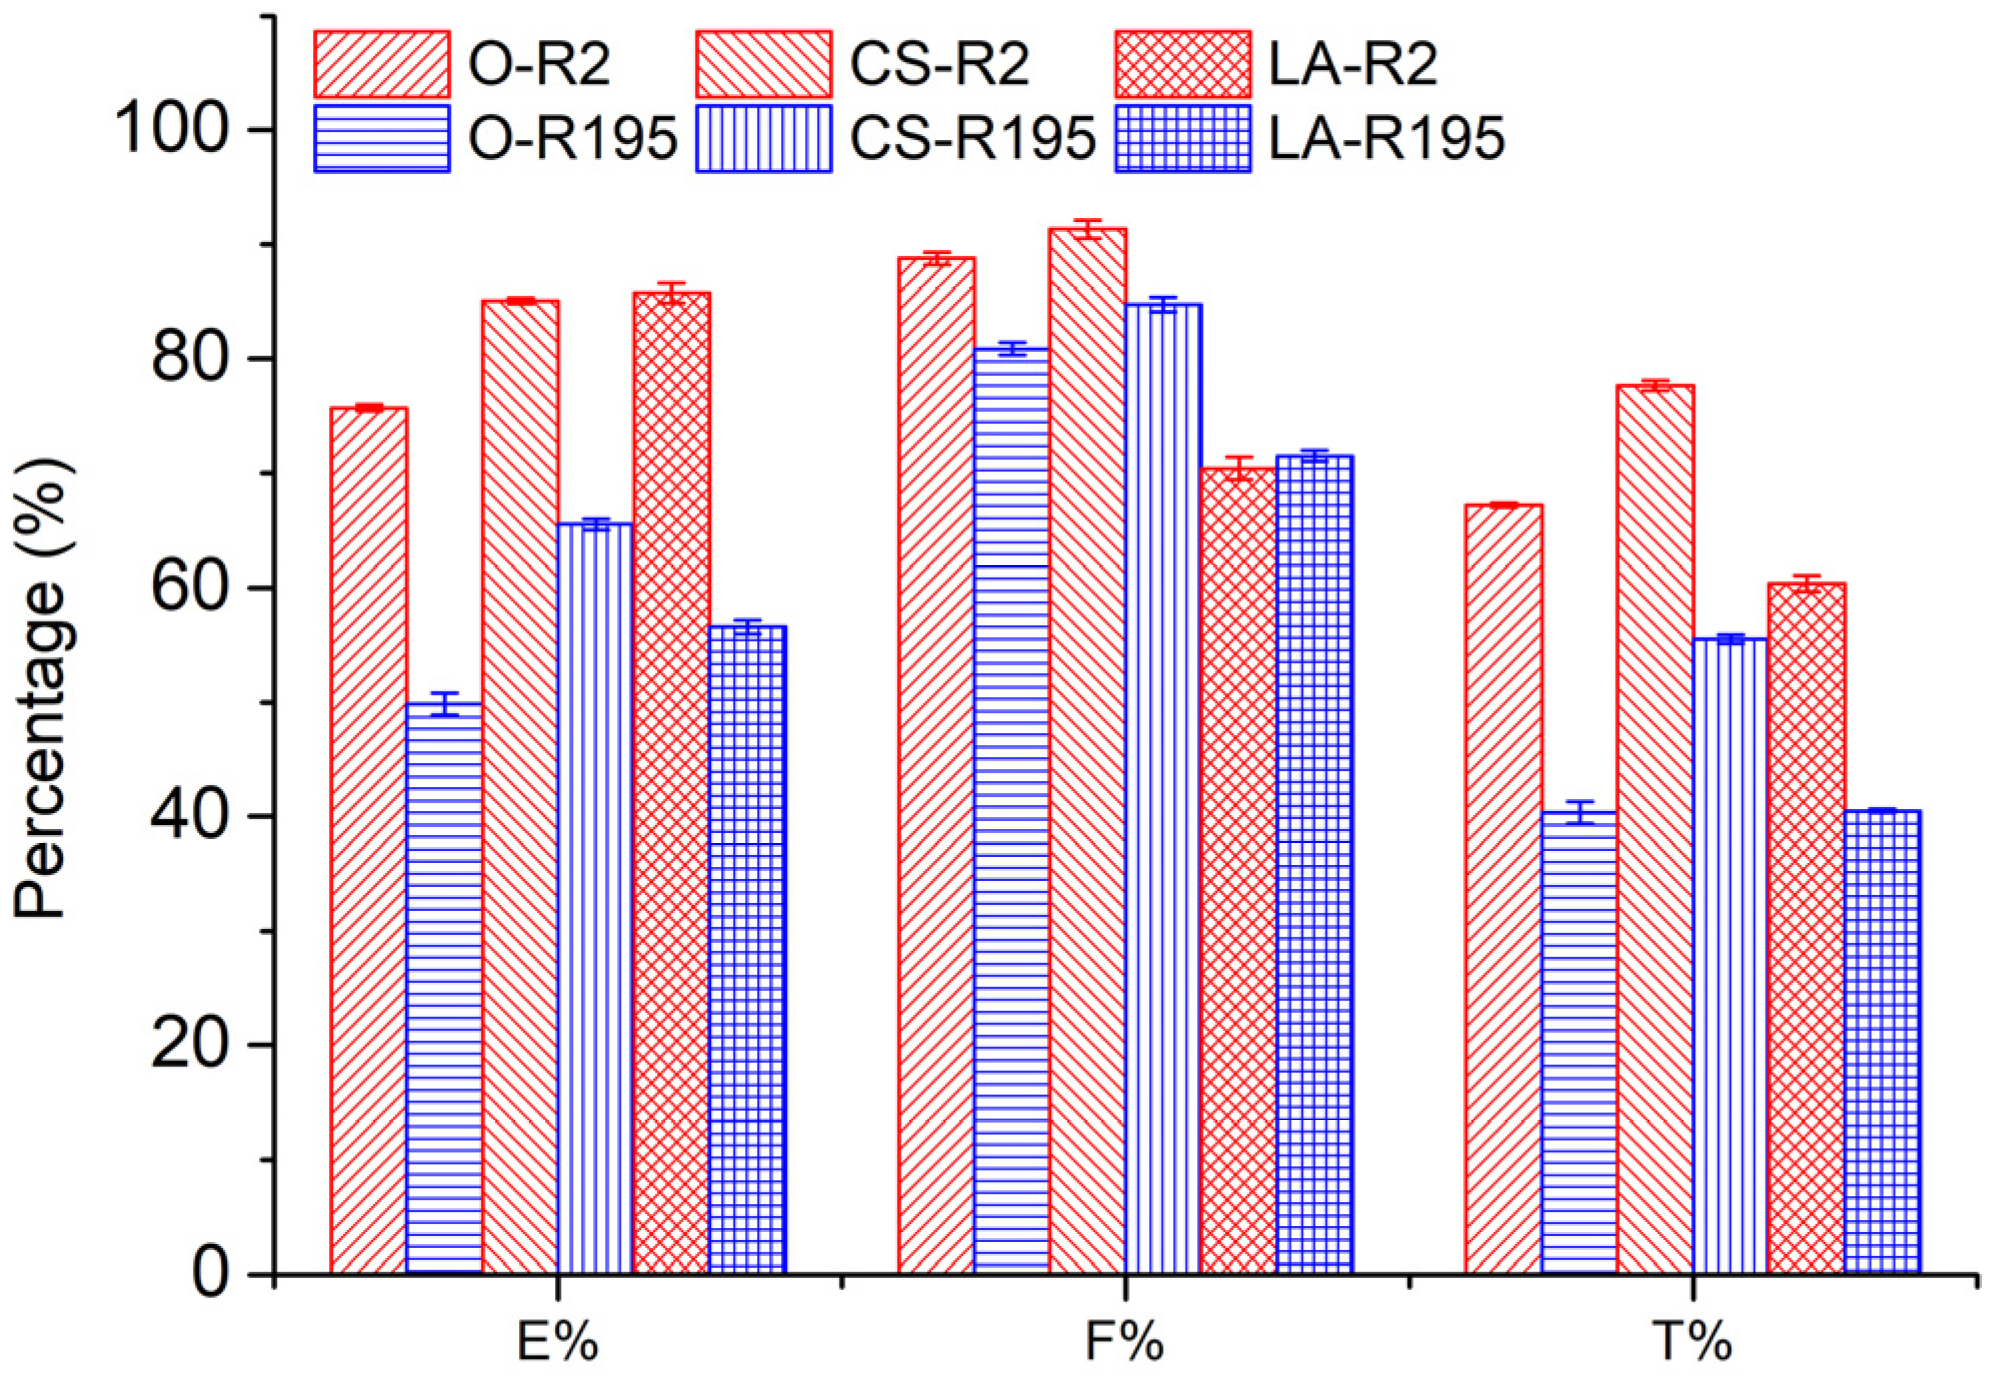
The
E%,
F%, and
T% values after dyeing original and CS and LA pre-mercerized cotton fabrics using R2 and R195 are shown in
Figure 4. It is obvious that CS and LA pre-mercerization processes enhanced the
E% values of cotton fabrics after dyeing, which is consistent with the results of a previous report [
14]. During dyeing, dye molecules are only located in the amorphous region of the cotton fiber; thus, a more crystalline cotton fiber usually exhibits lower dye exhaustion. Both CS and LA pre-mercerization processes partially damaged the crystallinity, which resulted in a decreased crystalline region and increased amorphous region. Therefore, the cotton fabrics pre-mercerized by CS or LA showed a higher
E% level.
In the dyeing of cotton fiber, dye adsorption is achieved in the amorphous area through dye migration from the surface of the fiber via pores, and a small pore size allows small-molecule transfer but impedes larger molecule migration [
25]. After both CS and LA pre-mercerization processes, the cumulative accessible pore volume of cotton fiber increased [
32], as identified by the decreased CI value; however, the former enlarged the pore size while the latter contracted it [
33]. In dyeing with R2, the CS and LA pre-mercerization processes contributed a similar increment to the
E% of cotton fabric dyeing, of which the
E% values were 85.1% and 85.7%, respectively. However, in dyeing with R195, CS pre-mercerization promoted an apparently higher
E% than with LA pre-mercerization, where the
E% values were 65.5 and 56.6% for the CS and LA pre-mercerization processes, respectively. This result indicated that the
E% was influenced by the molecular size of the dye (molecular weight) and the pore size of the cotton fiber, which can be seen by the molecular size of R2 (molecular weight: 615.32 g mol
−1,
Table 1) showing a smaller size than that of R195 (molecular weight: 1136.28 g mol
−1,
Table 1).
In dye fixing, the reactive group of the reactive dye forms a covalent bond with the hydroxyl group of the cotton fiber. In contrast with the original cotton fibers, the F% values of CS pre-mercerized cotton fabrics dyed using R2 and R195 were promoted slightly, but the F% values decreased in the dyeing of LA pre-mercerized cotton fabric using R2 and R195 dyes, although more hydroxyl groups in the cotton fiber were produced due to the crystallinity damage caused by CS and LA pre-mercerization processes. R195 has bifunctional reactive groups and R2 has a dichlorotriazinyl group, although the F% values did not show the superiority of R195 in dye fixing, which was possibly due to the more active dichlorotriazinyl group facilitating the formation of the covalent bond with the cellulosate under fixation conditions.
In the dye fixation stage, after the addition of soda ash, the dye fixing reaction is expedited, accompanied by the deterioration of the dye adsorption balance between the dye in the fiber and dye bath, resulting in further transference of the dye from the dye bath to the fiber, i.e., dye exhaustion and fixation simultaneously occurred. Therefore, dye fixation also contributed to the E% increase, which was one factor of the higher E% values for R2 dyeing compared to R195 dyeing.
T% is dependent on
E% and
F%, so the increases in
E% and
F% by CS pre-mercerization caused the
T% values of CS pre-mercerized cotton fabrics dyed using R2 and R195 to be higher than that of the original and LA pre-mercerized cotton fabrics. In LA pre-mercerized cotton fabrics, the
T% values of fabrics dyed using R2 and R195 decreased in comparison with original fabrics. However, when comparing
T% values, the R2 dyeing process exhibited a higher value than R195 dyeing, which was due to the higher
E%. In addition, the standard deviation values of
E%,
F%, and
T% (error bars in
Figure 4) were smaller, which indicated that the dyeing performance was repeatable.
3.4. Influence of Post-Mercerization on Dye Removal
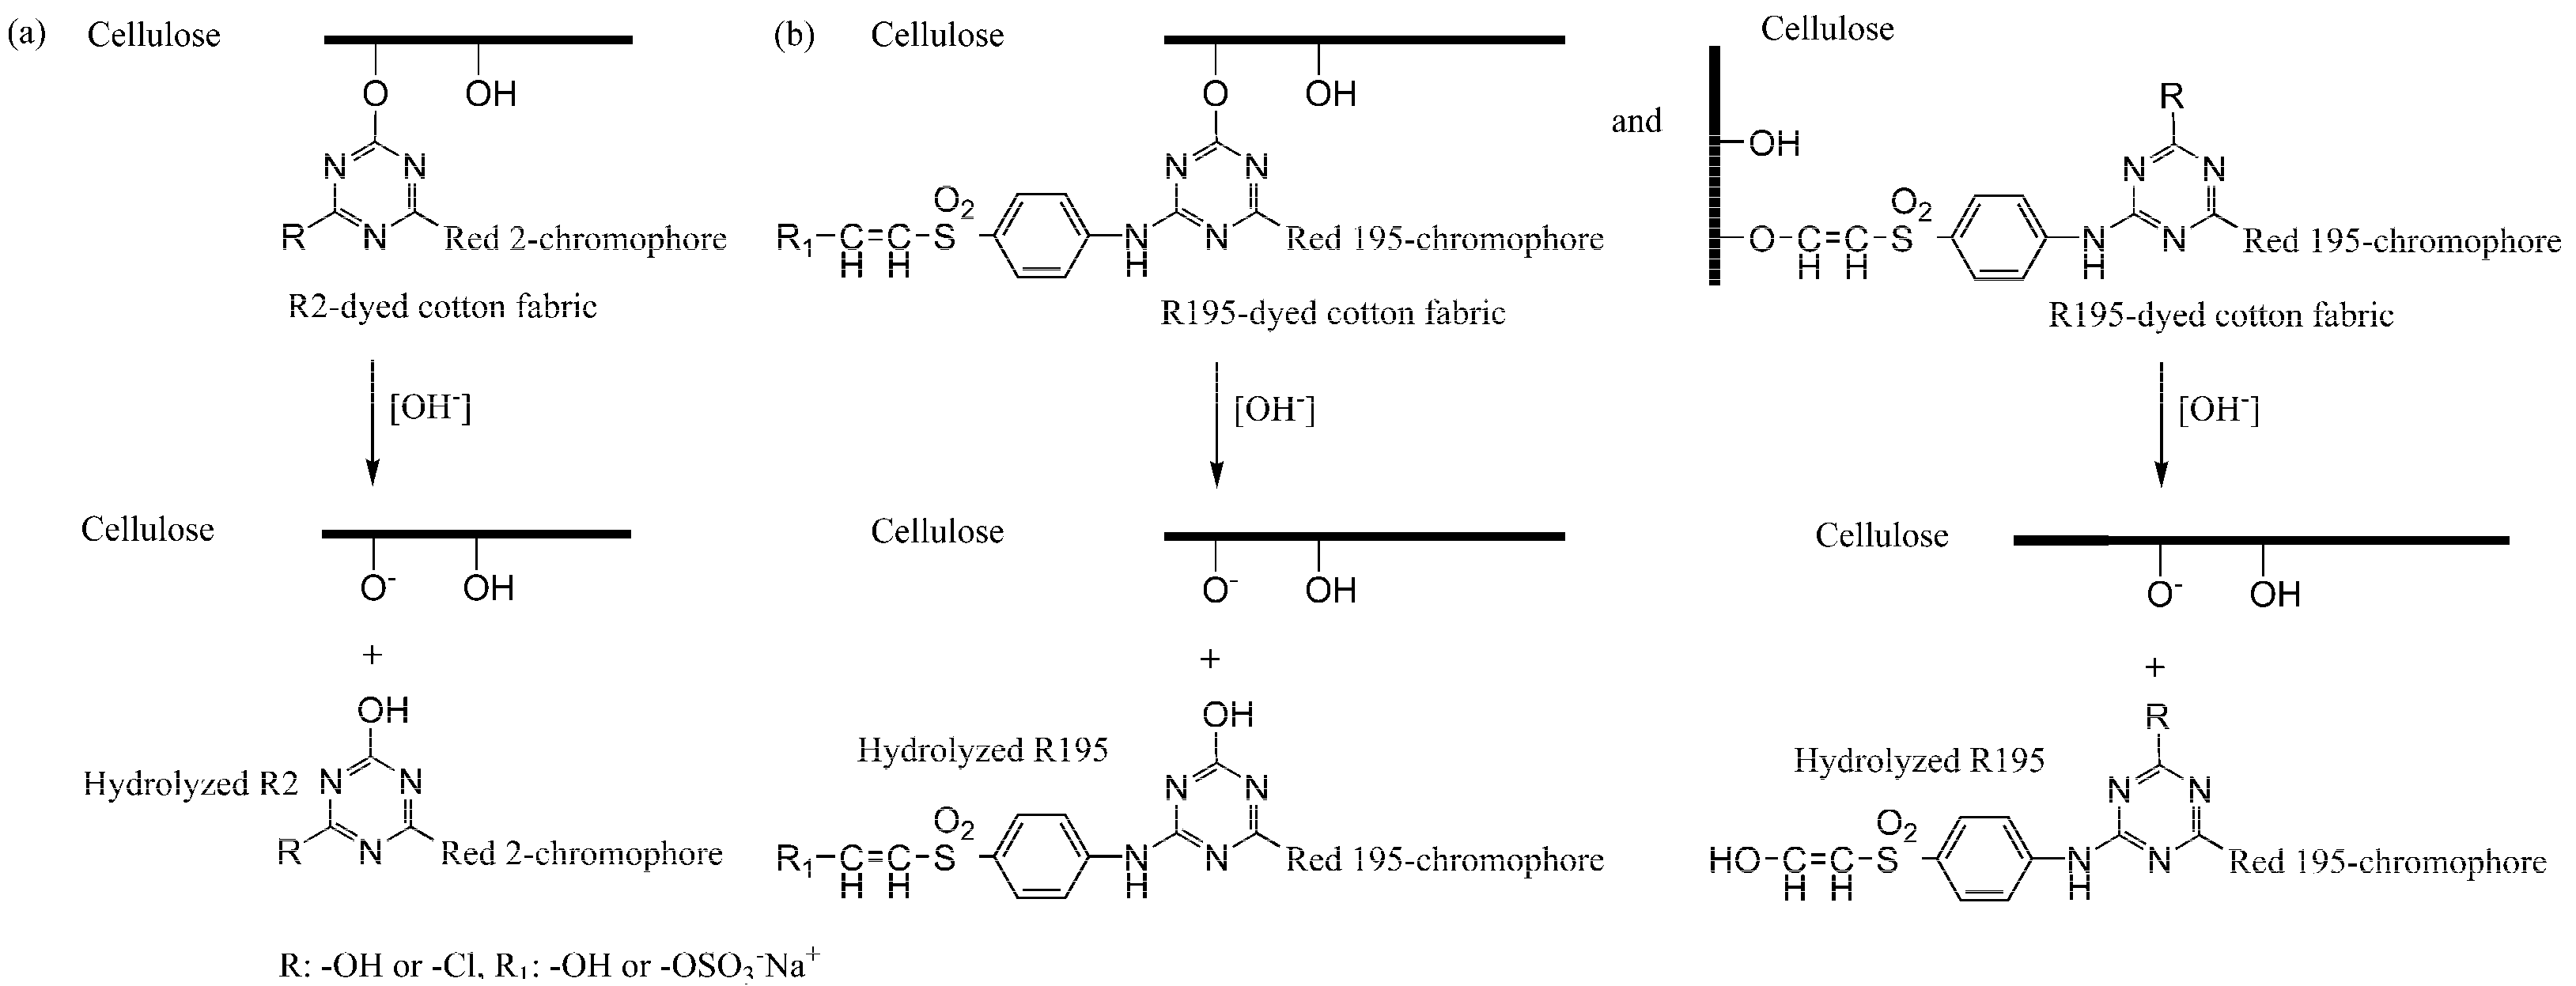
In CS and LA post-mercerization of dyed cotton fabrics, dye stability is a significant factor. The results of these processes are displayed in
Figure 5. After post-mercerization, we attempted to wash the R2 and R195 dyes from the fabrics. In contrast with CS post-mercerization, LA post-mercerization showed low hydrolysis of the ether bonds between the cellulose and reactive dyes of R2 and R195 [
34] (
Figure 6). It is worth noting that in the CS post-mercerization of woven fabrics, the dye removal percentage (
R%) of the R2 dye was obviously higher than that of R195, which was caused by the type of reactive group. R195 has one vinyl sulfone group and one monochrolotriazinyl group, while R2 has one dichlorotriazinyl group (
Table 1). The reactive groups influence the fixed strength of the dye, whereby the R195-dyed fabrics were shown to be more stable when compared to R2-dyed fabrics after CS post-mercerization.
Moreover, after the ether bond was broken, the hydrolyzed dyes inside the fiber were easily washed out, since the CS post-mercerization enlarged the pore size of the cotton fiber, which possibly contributed to the higher R% of R2-dyed fabric treated by the CS post-mercerization process because the molecular size of R2 is smaller than that of R195. In addition, the CS and LA pre-mercerization processes were shown to be beneficial to the fixed R2 dye stability, especially in CS post-mercerization. The R2 R% of Dye-CS was 4.09%, while the same values for fabrics pre-mercerized by CS (CS-Dye-CS) and LA (LA-Dye-CS) were shown to be 3.43% and 3.86%, respectively.
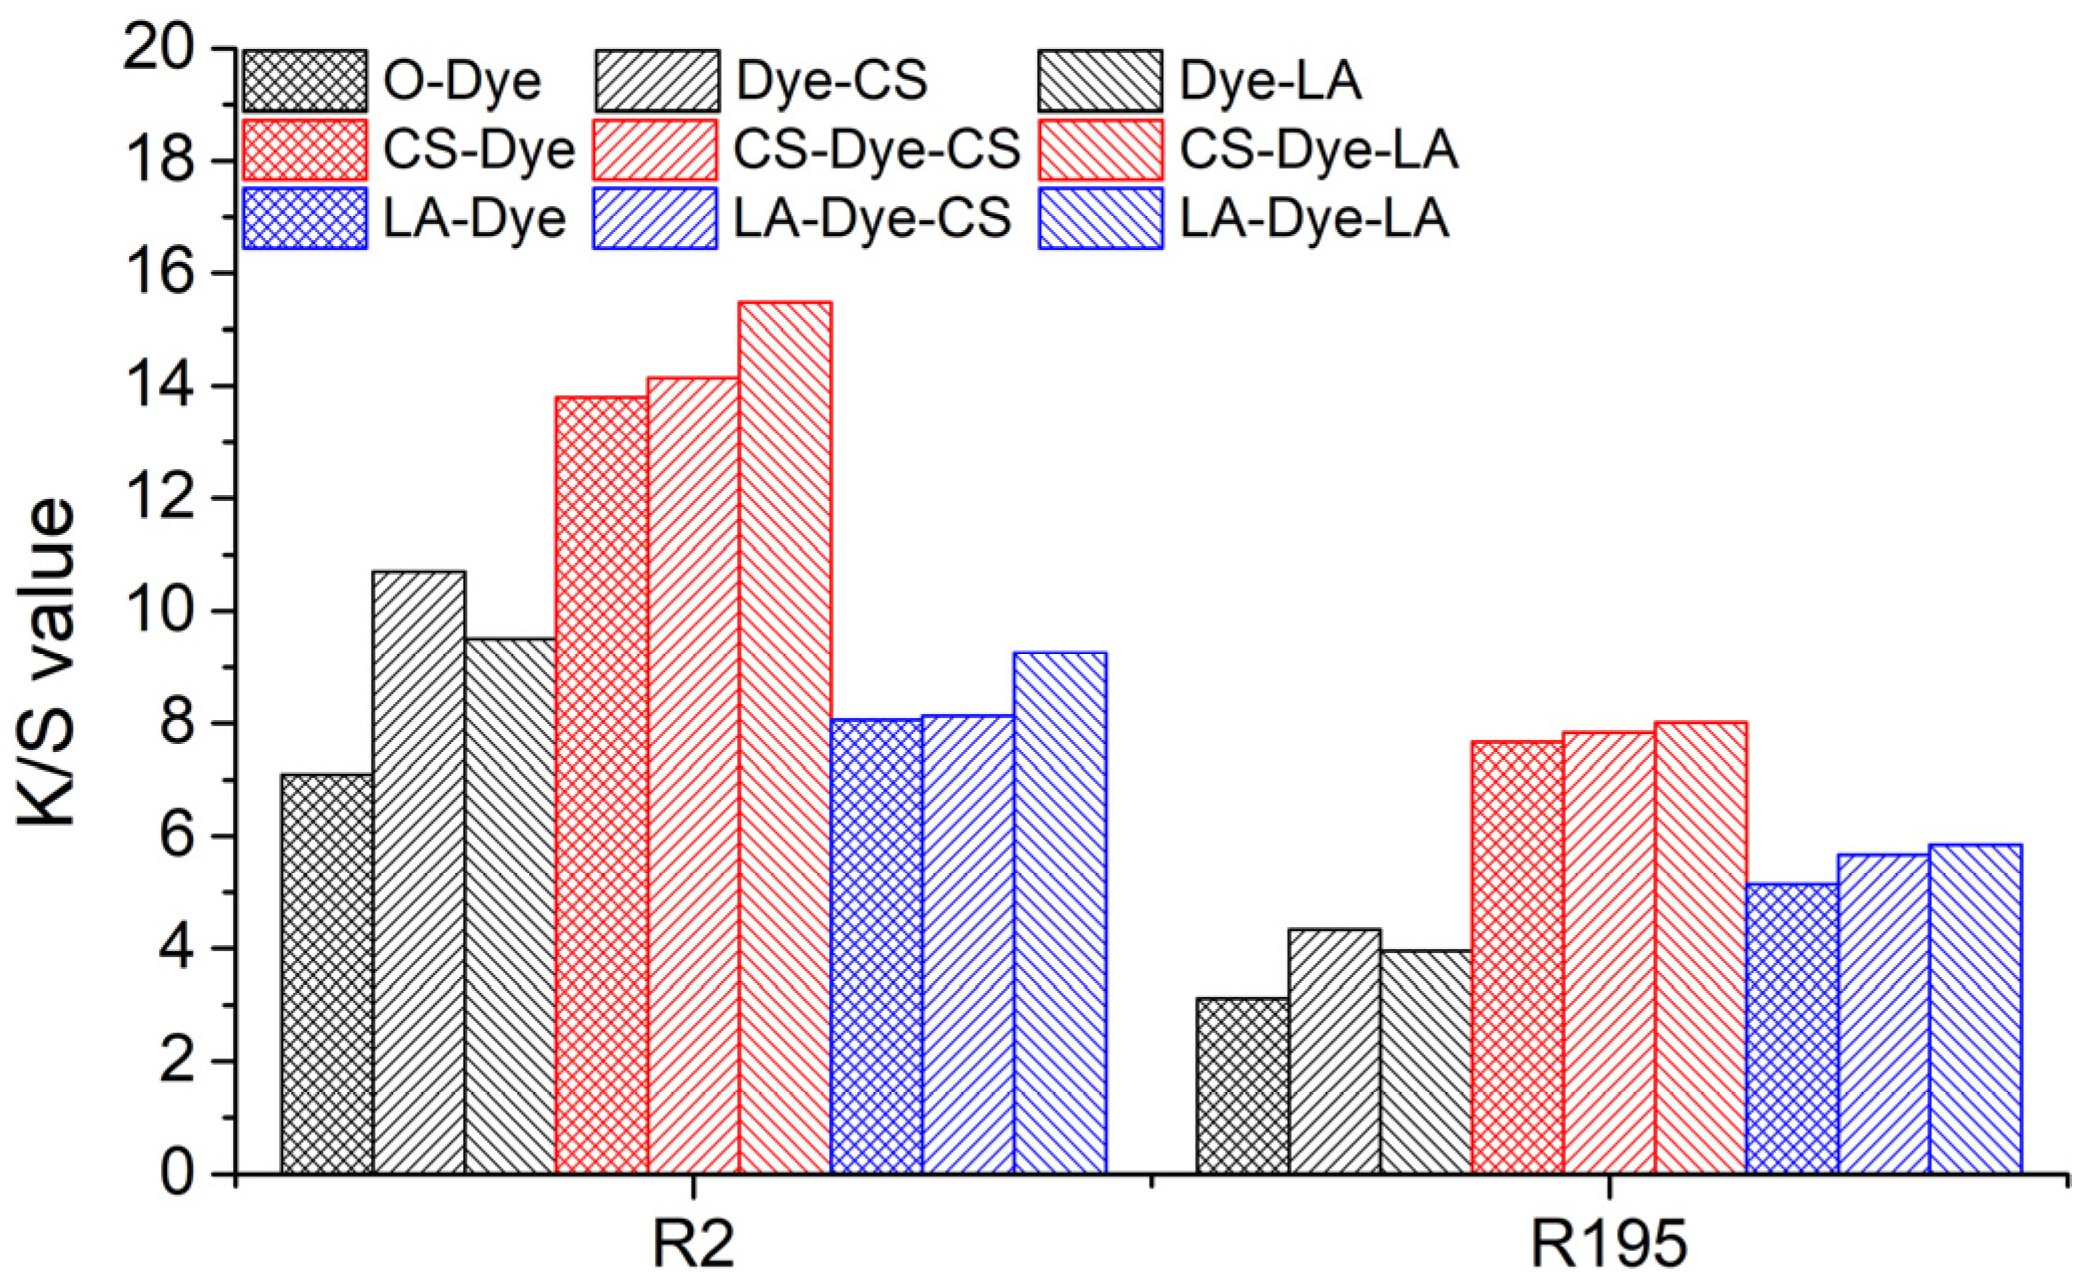
3.5. Color Strength and Color Uniformity
The
K/S values of the original, pre-mercerized, and post-mercerized samples are shown in
Figure 7. According to the Kubelka–Munk principle, the value of K/S is related to the dye concentration in the sample, i.e., the larger the value of
K/S, the greater the dye concentration in the sample [
35]. However, the
T% values of woven fabrics dyed with R2 and R195, as well as the K/S values of these respective samples (O-Dye, CS-Dye, and LA-Dye in
Table 4), indicate that this relationship is undesirable for mercerized woven cotton fabrics. The
T% values of R2-dyed samples follow a decreasing order from CS-Dye (77.7%) to O-Dye (67.2%) and LA-Dye (60.4%), while the order of their
K/S values is from CS-Dye (13.8) to LA-Dye (8.1) and O-Dye (7.1). This implies that the pre-mercerization obviously increased the color shade of the dyed woven cotton fabrics, owing to a decrease in light scattering of the mercerized fabrics. With the CS and LA pre-mercerization, the morphological structures of the fabrics and fibers, as well as the presence of voids, were changed, which possibly altered the irradiated light route in the fabrics and fibers. Additionally, the material features, such as the micropores of the cotton fiber and cell cavity, were probably reduced in size or eliminated. This resulted in reduced light scattering and increased color intensity [
10,
11].
In
Table 4, based on the Kubelka–Munk principle, the
K/S values have a linear relationship with the dye concentration in the dyed fiber. Since the
T% of the original fiber was 67.2% with a
K/S value of 7.1, if the
T% values of R2 were 77.7% and 60.4% in the original woven cotton fabric, the
K/S values for both dyed fabrics would be 8.2 (O-Dye predicted value-1) and 6.4 (O-Dye predicted value-2), respectively. However, the experimental
K/S values of the R2-dyed fabrics with CS pre-mercerization (77.7% of
T%) and LA pre-mercerization (60.4% of
T%) were 13.8 and 8.1, respectively. Thus, in the R2 dye processes, considering the dye concentration increase in the dyed fabric, the promoted K/S efficiency (Equation (4)) was 68.1% for CS pre-mercerization and 26.3% for LA pre-mercerization. Additionally, the promoted K/S efficiencies in the R195 dye processes were 77.9% and 63.7% for CS-Dye and LA-Dye, respectively. A higher color strength was found in the CS pre-mercerized fabric than the LA pre-mercerized fabric. The enhanced K coefficient in the
K/S likely accounted for the higher color strength of the CS pre-mercerized fabrics. Additionally, the light scattering was reduced by the missing cell cavity, resulting in a decrease in the S coefficient of
K/S. The CS pre-mercerization increased the swelling of cotton fibers more than the LA pre-mercerization, which reduced the cell size of the fiber of the secondary cell wall and core [
11]. Furthermore, as a result of the inner cell’s color migration to the outside cell, the color strength of the fiber was enhanced [
36]. Therefore, CS pre-mercerization to the woven cotton fabric showed a more highly promoted
K/S efficiency than the LA pre-mercerization.
As shown in
Figure 7, CS and LA post-mercerization enhanced the dyed fabric
K/S value regardless of whether the fabrics had been pre-mercerized. In the dyed fabric without pre-mercerization (O-Dye), the CS post-mercerization (Dye-CS) was more effective in promoting the
K/S value compared to the LA post-mercerization (Dye-LA). This result is consistent with the findings of the pre-mercerization contribution to the
K/S increase. In the CS and LA pre-mercerized and dyed fabrics (CS-Dye and LA-Dye), both CS and LA post-mercerization (CS-Dye-CS, CS-Dye-LA, LA-Dye-CS, or LA-Dye-LA) further increased the
K/S value of the dyed fabrics, but the increases were low compared to the increases of the original dyed fabric treated by CS and LA post-mercerization process (Dye-CS and Dye-LA). Additionally, the LA post-mercerization (CS-Dye-LA and LA-Dye-LA) provided a slight increase to the
K/S value in the CS and LA pre-mercerized and dyed fabrics compared to the CS post-mercerization process (CS-Dye-CS and LA-Dye-CS). Therefore, this indicated that the morphological structure change influenced the color shade of the cotton fabric during post-mercerization, specifically the LA post-mercerization process, which most effectively promoted an increased
K/S value in contrast with CS post-mercerization.
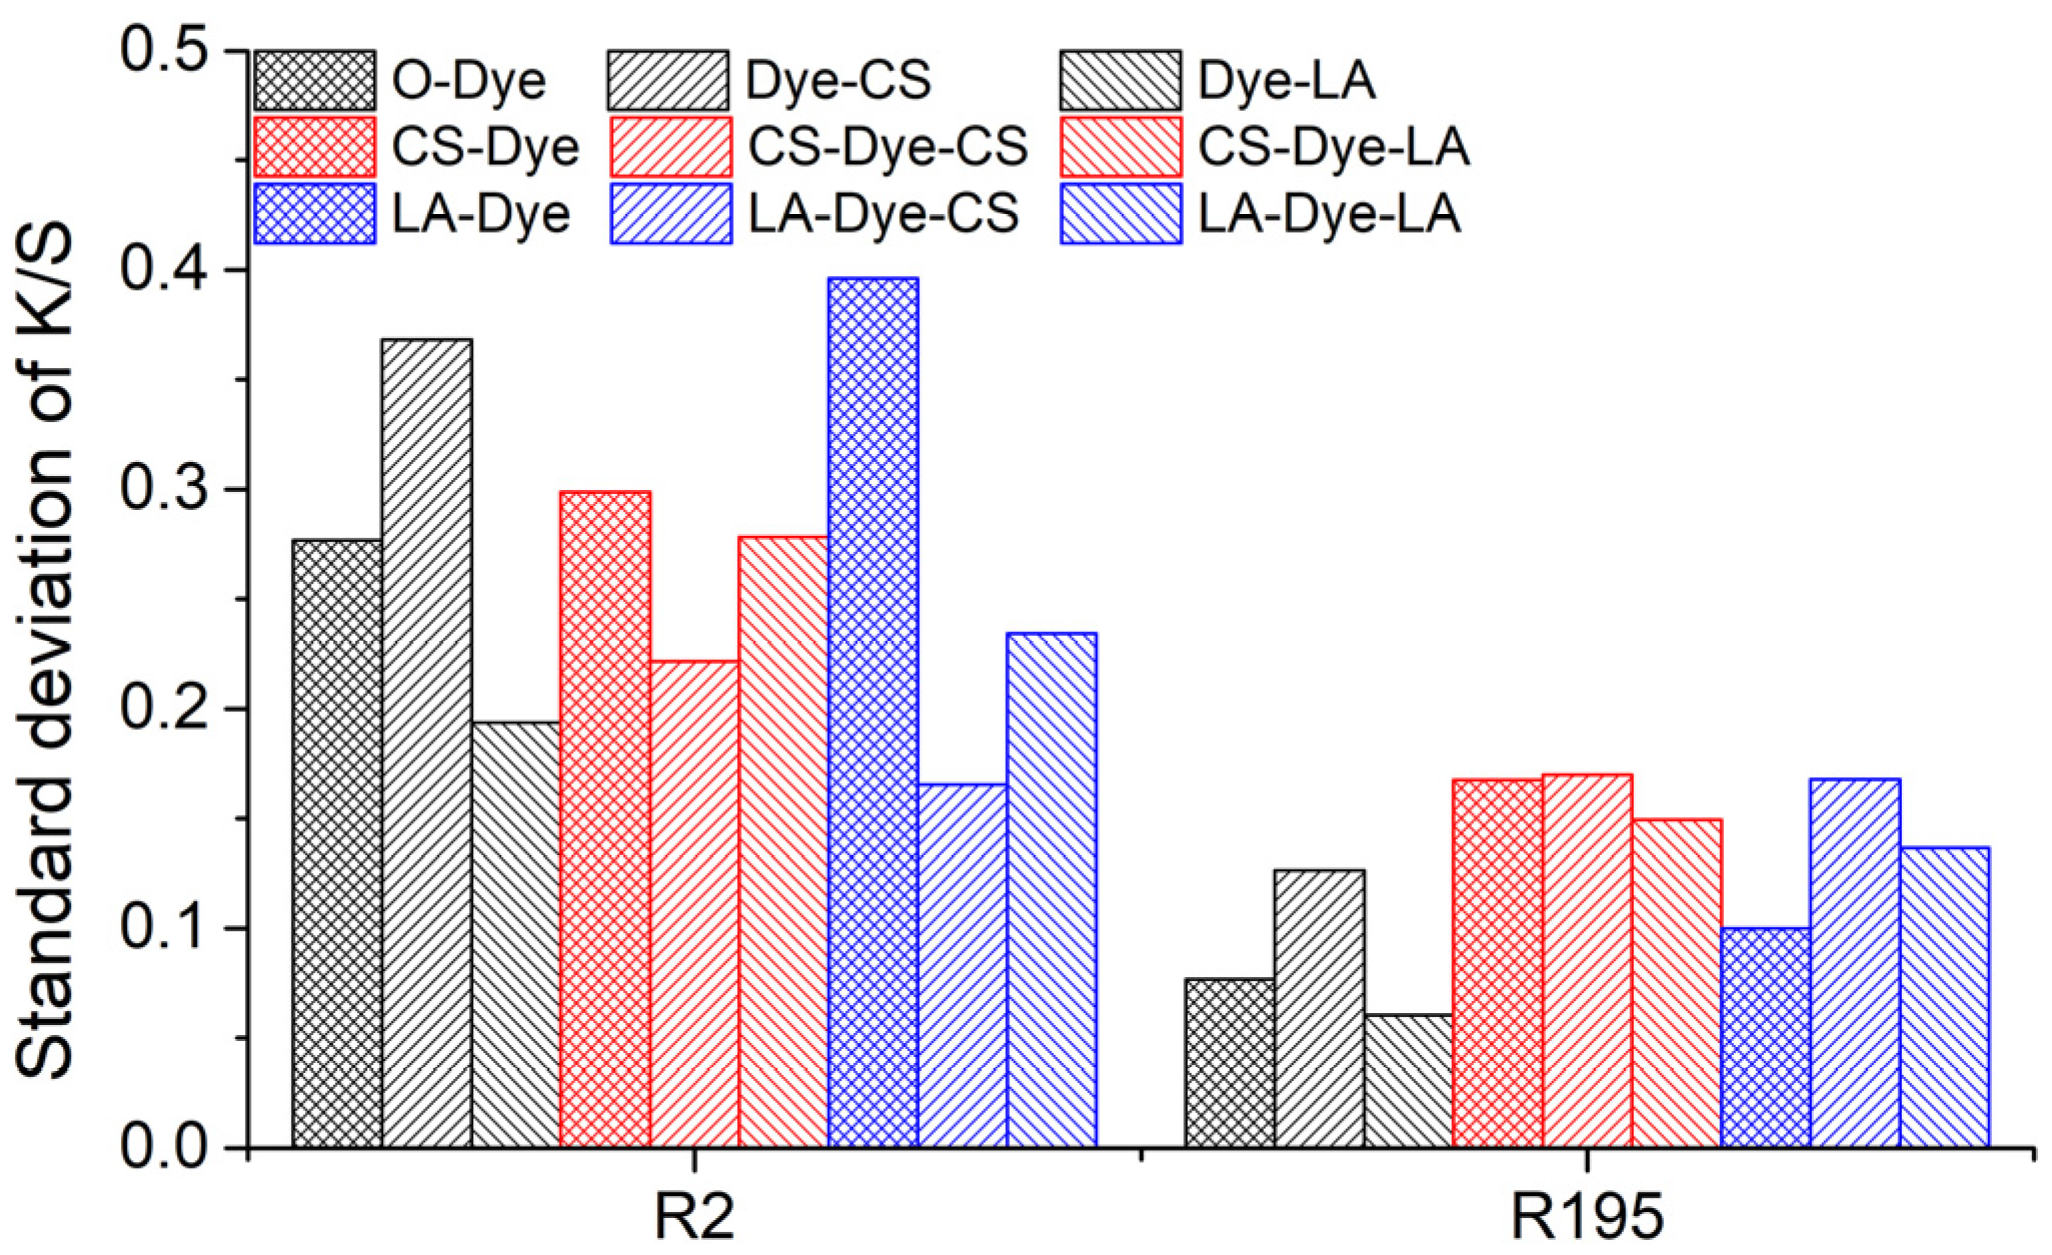
The color uniformities of all dyed fabrics were investigated and the results are shown in
Figure 8. Notably, color uniformity was expressed by measuring the standard deviation value. All of the sample’s standard deviation values were less than 0.4, meaning that the color uniformity was very good for all dyed fabrics. This also implies that the pre-mercerization, post-mercerization, and the combination of pre- and post-mercerization processes did not cause a color unevenness problem on the dyed fabric.
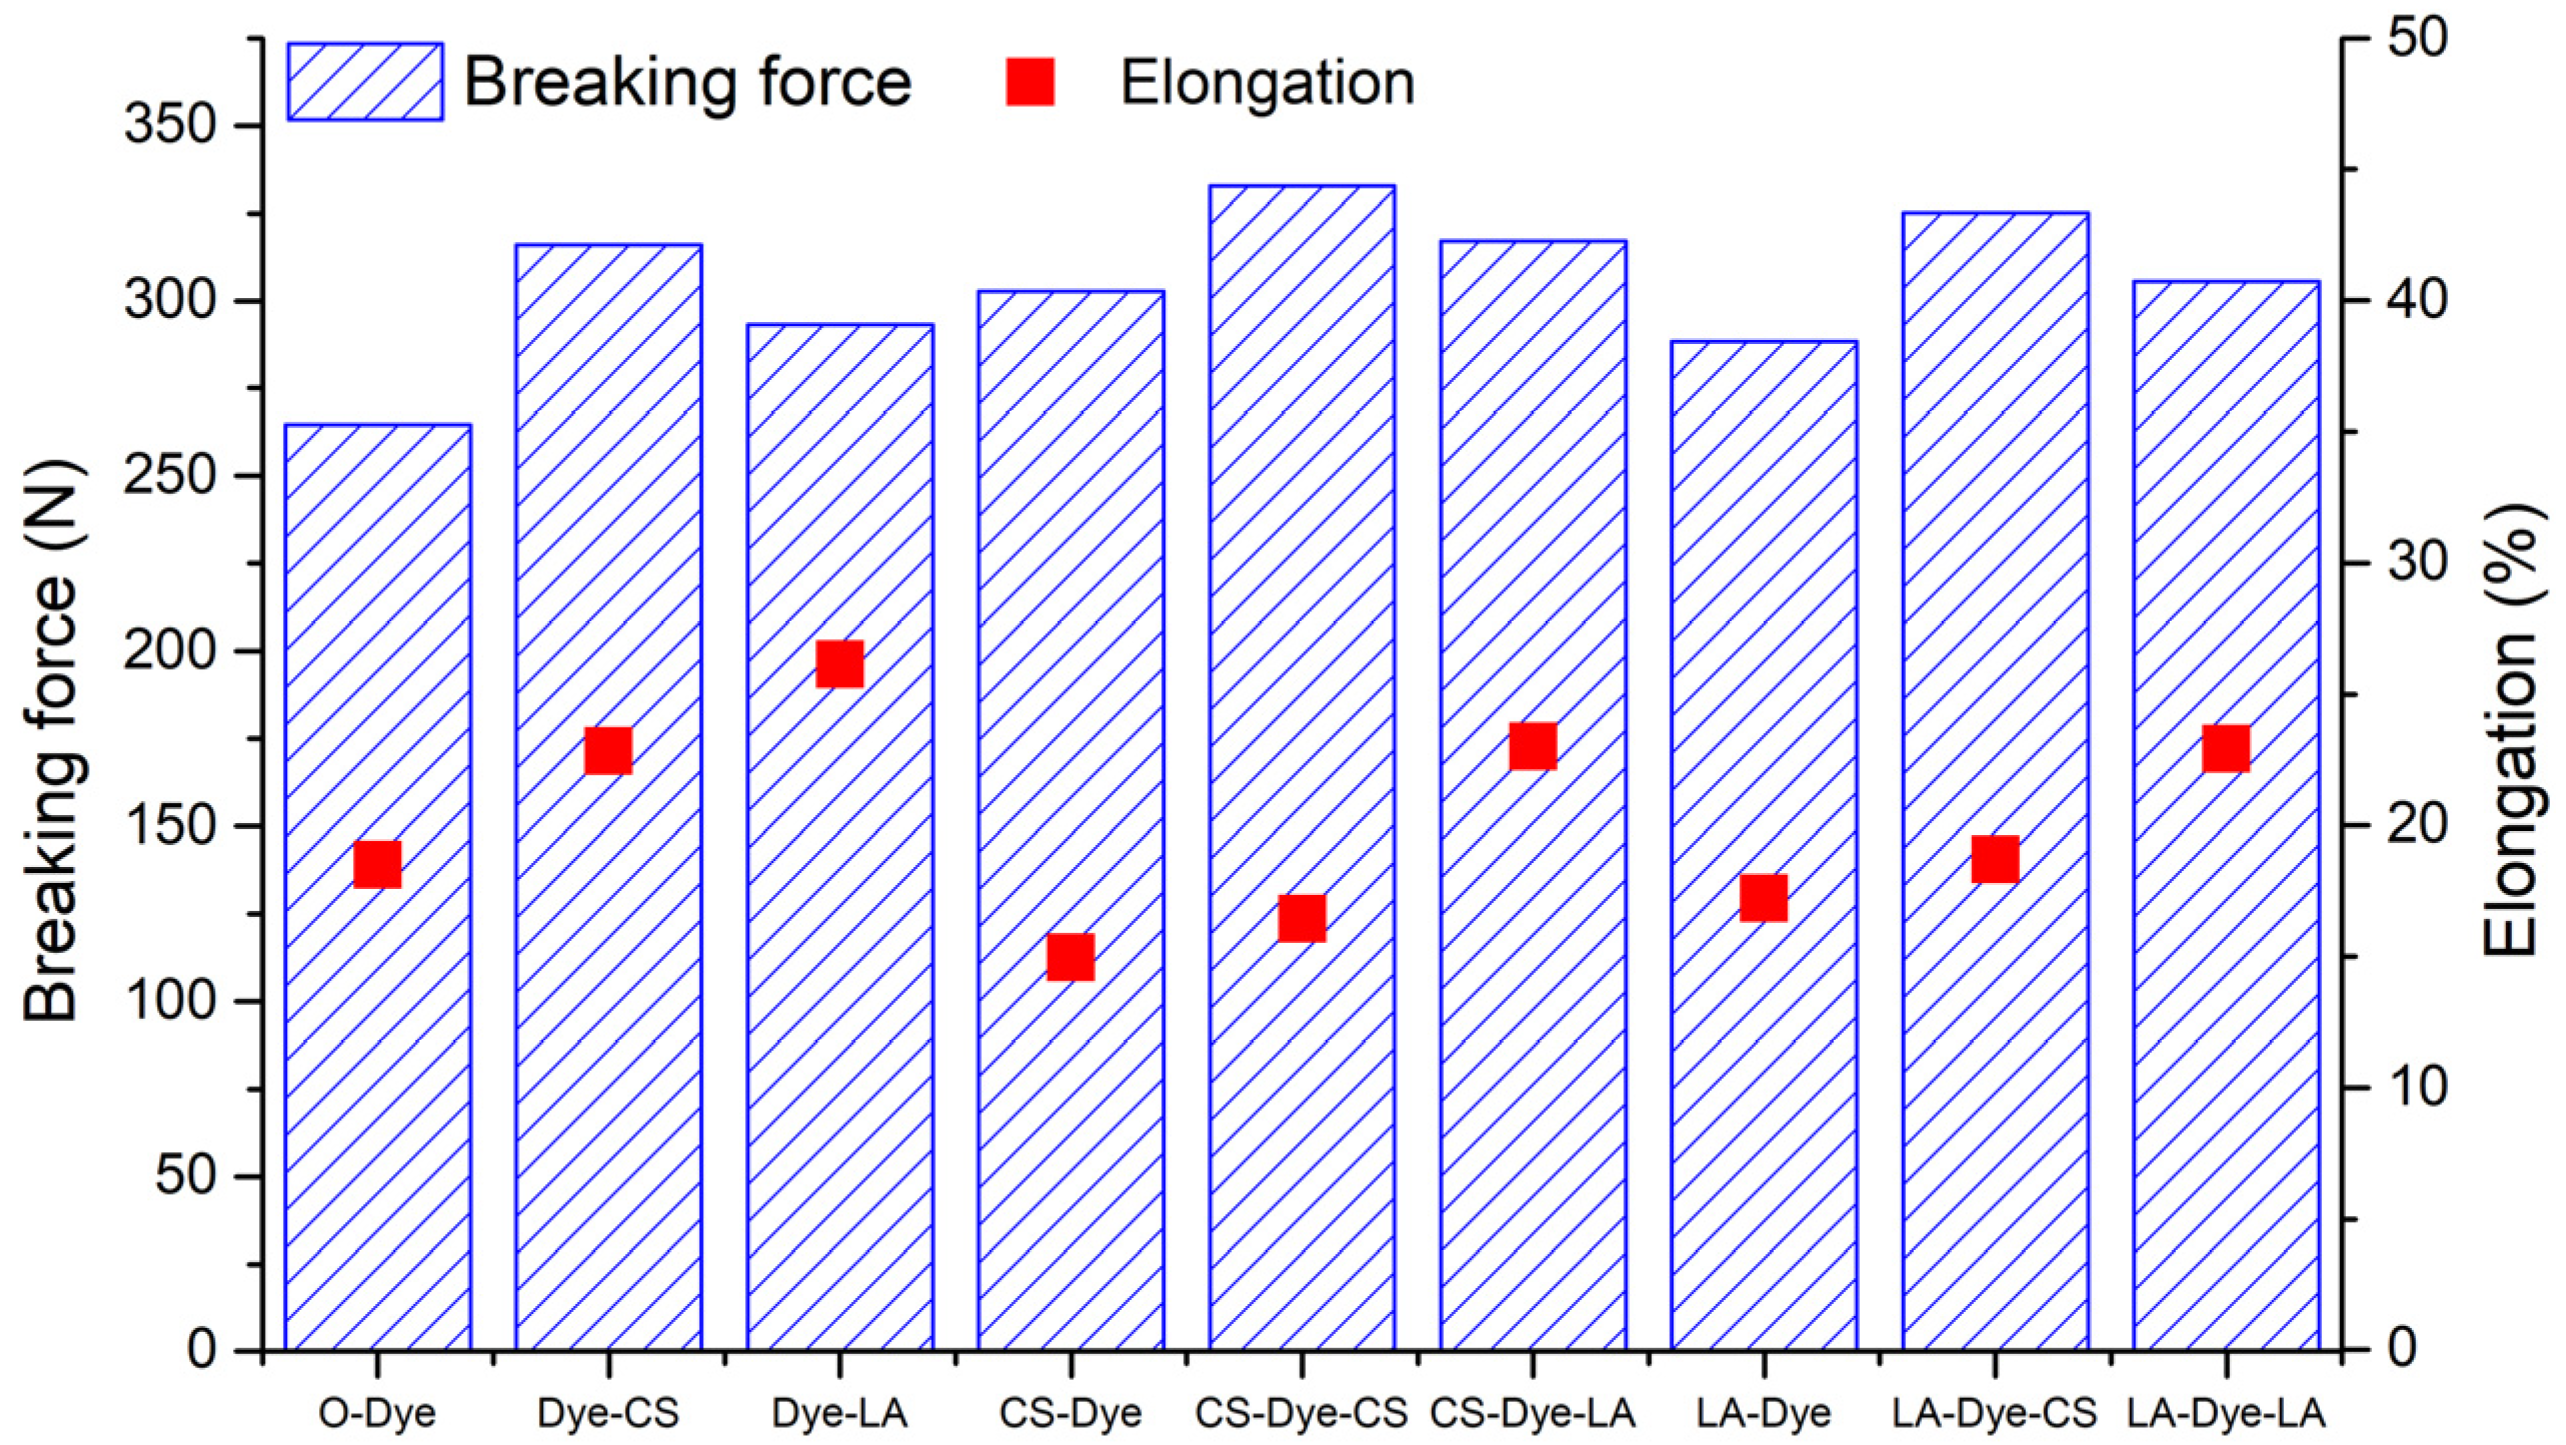
3.8. Breaking Force and Elongation
The breaking force and elongation at break of the woven cotton fabrics dyed with R2 are displayed in
Figure 9. Generally, the pre-mercerization, post-mercerization, and combination of pre- and post-mercerization improved the breaking force of the woven cotton fabric. According to the comparison of breaking forces between CS-Dye and LA-Dye, Dye-CS and Dye-LA, and LA-Dye-CS and LA-Dye-LA, respectively, the CS mercerization was slightly more effective than the LA mercerization; however, it was exceptional in the comparison of CS-Dye-LA and CS-Dye-CS. The CS and LA mercerization swelled the fiber, reduced the convolutions from the surface, and enhanced fiber binding [
27]. Additionally, the internal stresses in the yarn and fabric were released after mercerization [
26]. Therefore, the weak links from the fibers, yarns, and fabric were effectively eliminated, likely due to the improved breaking force of the fabric [
37]. In elongation testing, post-mercerization conferred a positive attribute to the woven cotton fabric, and the LA post-mercerization process afforded more positive contributions than the CS post-mercerization process. The CS and LA pre-mercerization processes decreased the elongation of the fabrics, but the reduction by LA pre-mercerization was lower than that by CS pre-mercerization process.


 ,
, 


