3.1. Machining Quality Assessment
To assess the quality of the machining process, a surface examination was done, composing this phase of visual observation, which was carried out with the aid of a microscope, evaluating the surface aspects, such as feed marks and possible surfaces imperfections. A surface roughness analysis (Ra and Rz), with the aid of a profilometer (ET200, Kosaka Laboratory Ltd., Tokyo, Japan), was carried out; with that, the surface quality the process stability were further analyzed.
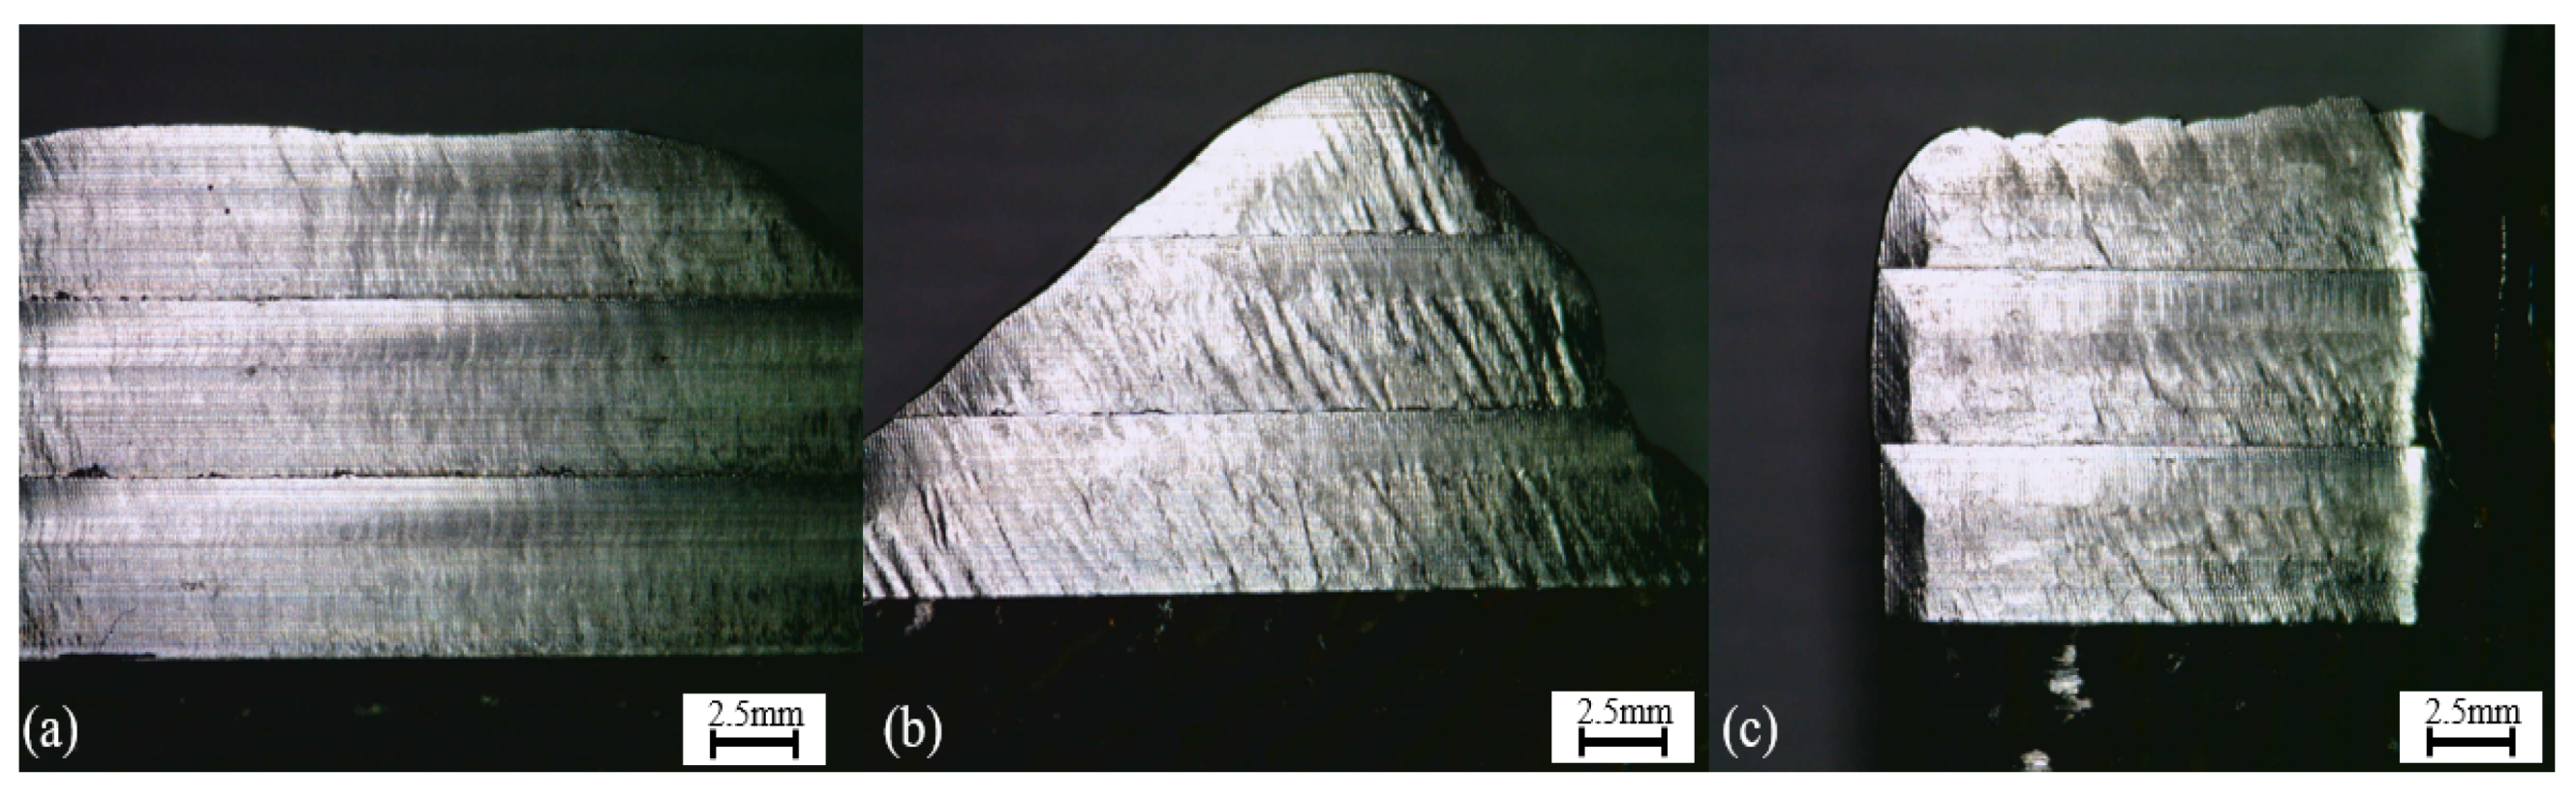
As stated previously, the first part of this assessment consists of a visual observation of the samples. One example of this analysis is present in
Figure 5, which is composed of the three pictures of the machined surfaces showing the initial results of the machining procedure.
Different aspects of the samples could be observed with the aid of the microscope. First, the feed marks are easily located in the samples and are more visible on the outer parts of the machined surfaces, especially on pictures (b) and (c). When further analyzing the feed marks, it is observed that they presented distinct characteristics for the different cases.
Case (a) had a regular and constant spacing of the marks throughout its surface, which did not occur with the other two cases. Although in some parts of the samples (b) and (c) a certain degree of regularity of the spacing between cut marks was visible, the most observed surface appearance is what seems like non-periodic marks.
The last two pictures present different irregularities not related to the cut marks, which were hypothesized as the effects of possible chatter vibrations or from plastic deformation. The reasons for these variances are further discussed in various parts of this paper as opposed to picture (a), which have a more even surface on the three different layers.
In terms of these irregularities, it is possible to rank the three workpieces, and posteriorly, these visual observations will be compared with the surface roughness results. Sample (b) presented more inconsistencies, (c) the second most irregular, and at last, (a) was the sample that presented the less uneven surface.
The different heights of the samples, however, be it for possible tool wear, different hardness, or even microstructure, do not appear to have a relation to the surface appearance, presenting about the same types of irregularities for the three analyzed cases.
After this initial step, to better evaluate the quality of the workpiece surfaces, as previously explained, the surface roughness was measured for the three different heights of each sample, according to the ISO 4288 standard for milled surfaces [
26]. The values for Ra were assembled in
Table 3, similarly to the values for Rz in
Table 4.
Different observations can be made from the results seen in
Table 3. Firstly, it is interesting to note that the values of Ra match the evaluation that was performed previously regarding the visual aspect of the samples. That is, when the perceived irregularities were ranked by the authors, the order of worse to best was (b), (c), and (a); equivalent results were found for the roughness values.
Another aspect of the experiments that could be inferred with the results from
Table 3, which was hypothesized previously, i.e., that there is no apparent correlation between sample height, machining order, and surface quality. As tool wear occurred, which will be discussed later, it did not have a major effect on the surface quality of the same sample.
As opposed to the values of Ra, which are average values of the profiles measured, the Rz data are measures of the highest peak and valleys observed in the sample, and even though the (b) and (c) values are closer than previous values, the values for the workpieces machined with 0 degrees of cutting angles continue to be lower, indicating that not only on average it had fewer irregularities, but these differences were significantly smaller in size when compared with the other two cases.
As explained previously, the experiments were composed of different machining passes, nine for the first height, eight for the second height, and seven for the last height. Considering the dimensions of the deformations present in the samples, it could be observed that around the fifth cutting pass, the surface being cut was already flat, meaning that possible vibrations and irregularities that appeared in the final surfaces were not influenced directly by the deformations present in the workpieces, with that, two hypotheses were formulated to try and explain these differences, being them further discussed on the cutting forces analysis, and conclusions parts. To further examine the irregularities present on the surfaces after machining, the tool wear was observed, and this examination is discussed in the next topic, followed by an analysis of the cutting forces.
3.2. Tool Wear
Although the amount of material removed was considered small, and keeping in mind that the Inconel 718 is a material with low machinability, and the WAAM manufacturing method could influence the different mechanical properties of it, possibly making the material removal process more difficult, it was deemed necessary to conduct this tool wear analysis.
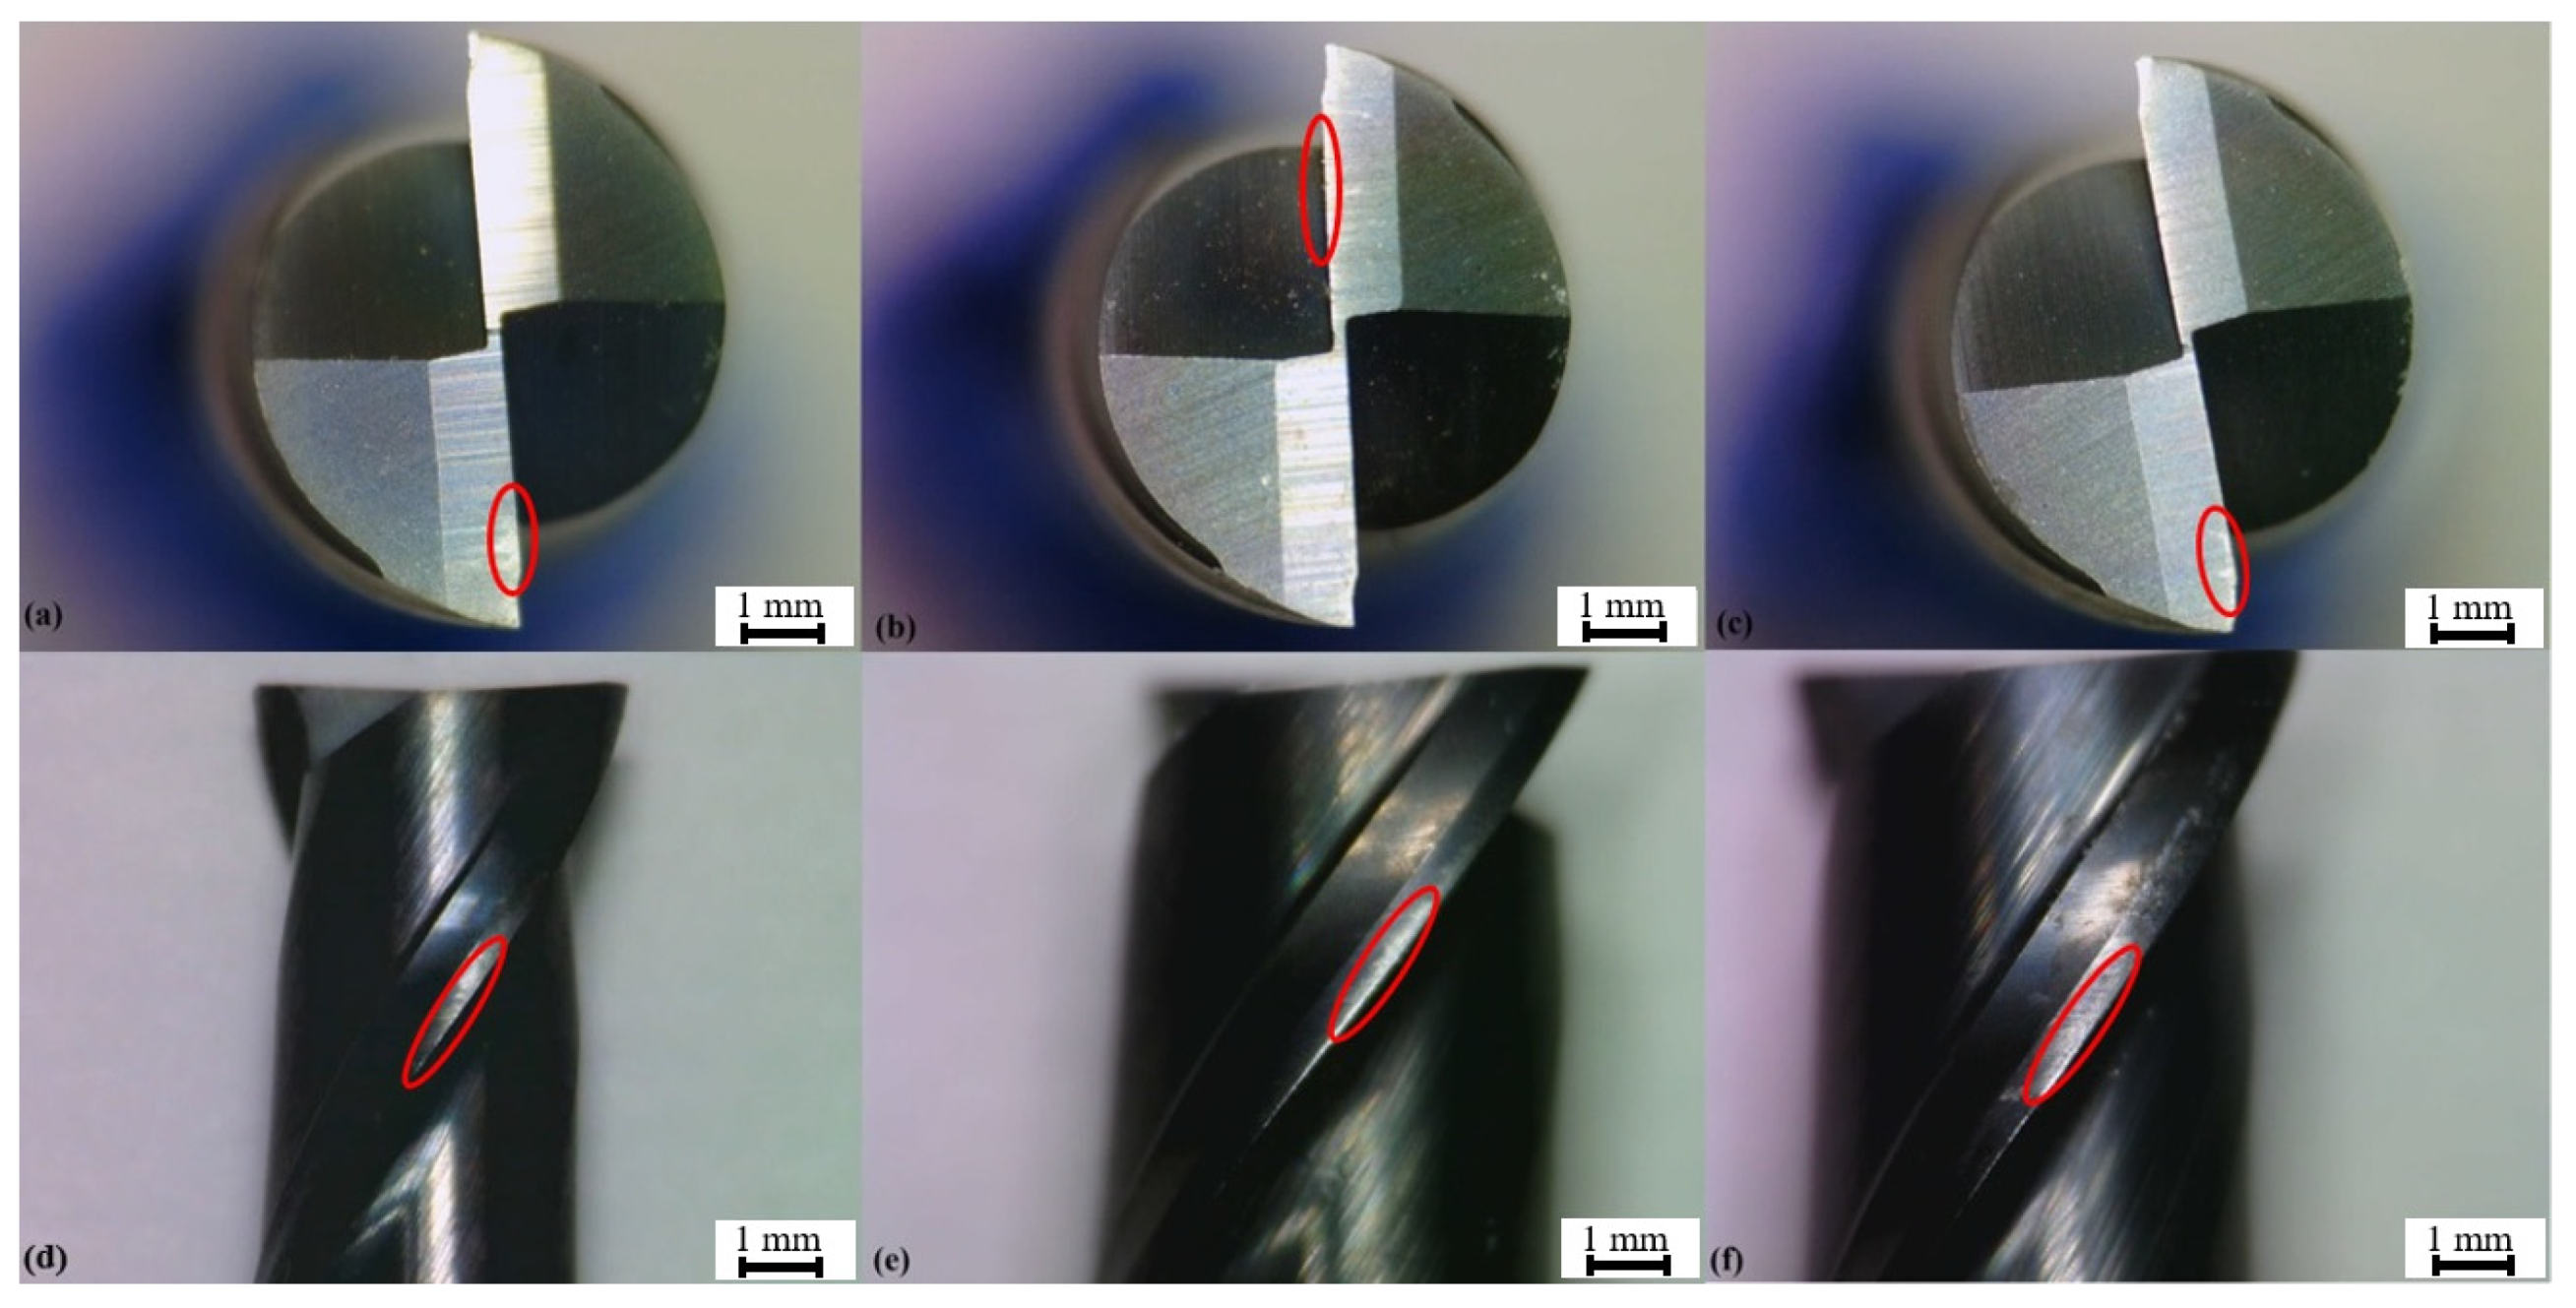
For the evaluation of the tool wear that occurred in the three cases, pictures were taken with a microscope in the same manner as the surface appearance evaluation and were analyzed regarding the different wear mechanisms. The different cases (a, b, and c) were ranked regarding the dimensions of wear;
Figure 6 contains examples of the pictures taken of the three tools.
In all examined cases, the wear is highlighted by the red circles was flank wear, which occurred primarily via abrasion. This wear was also considered minor for all samples, ranging from 0.14 mm in length for the most impacted sample (c) and 0.10 mm for the less impacted one (b).
When considering that the surface roughness and appearance had not suffered a decrease in quality when comparing the different machined layers of the same workpiece, as quoted previously, that is, the order in which the heights were cut did not correlate with the decrease in surface quality, it is possible to infer that the tool wear did not have a major influence on this aspect of the machining process.
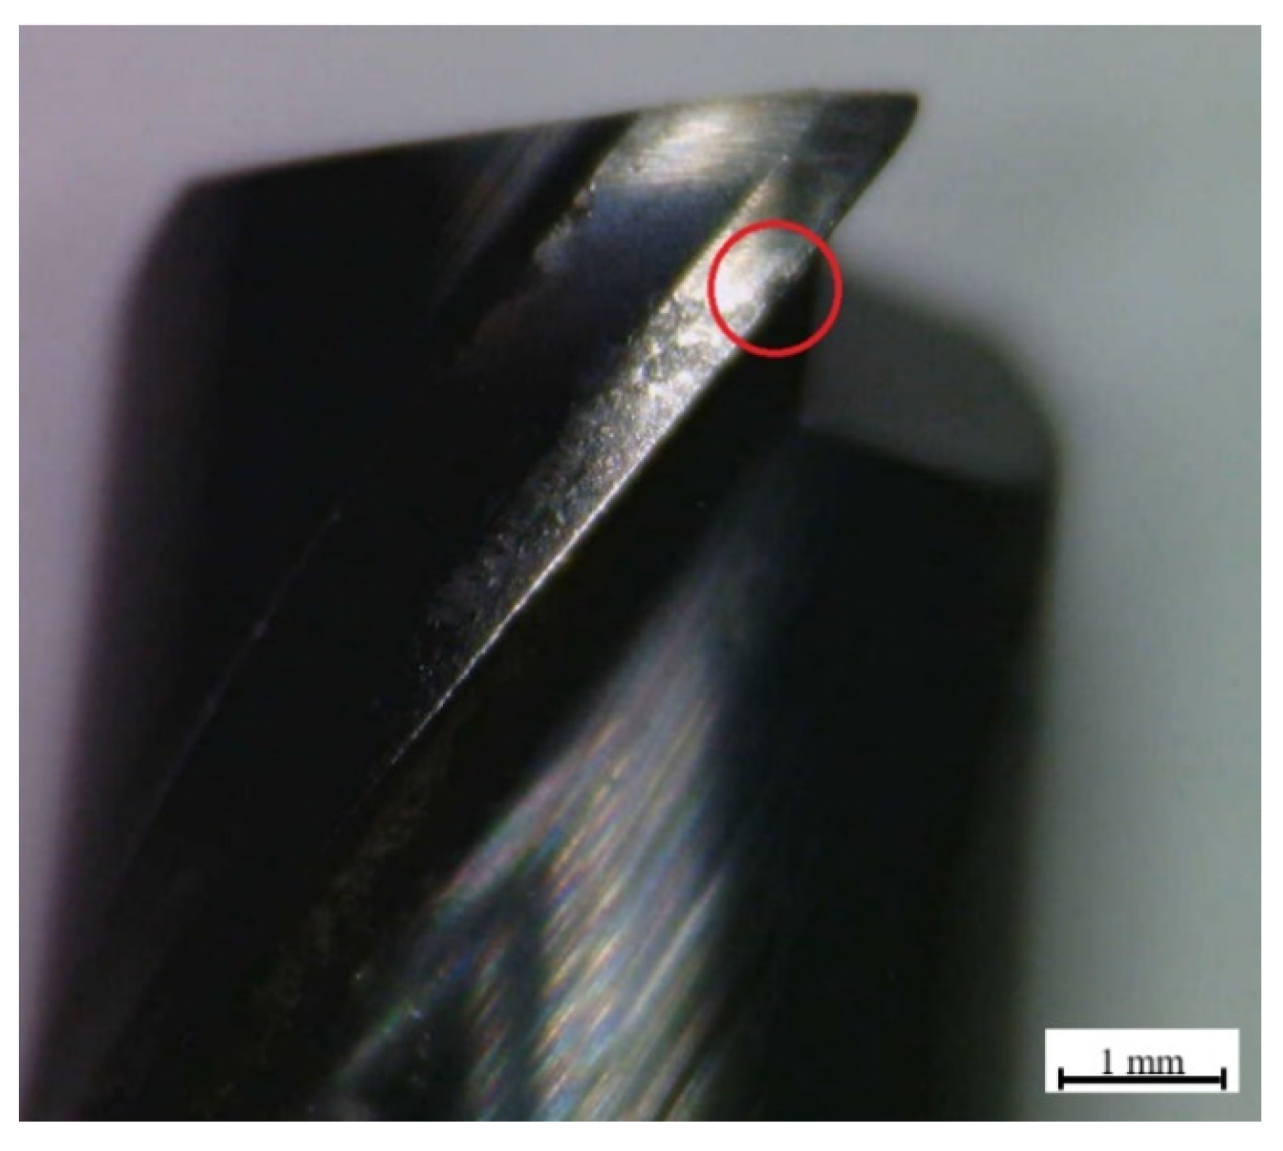
When further analyzing the tool wear mechanisms, an abrasion form of wear was observed in the cutting tools, as well as some degree of chipping was also visible on the blades, especially when it comes to the last machined sample (c). An image containing an example of the chipping, highlighted in red for the 90-degree angle case, is presented in
Figure 7.
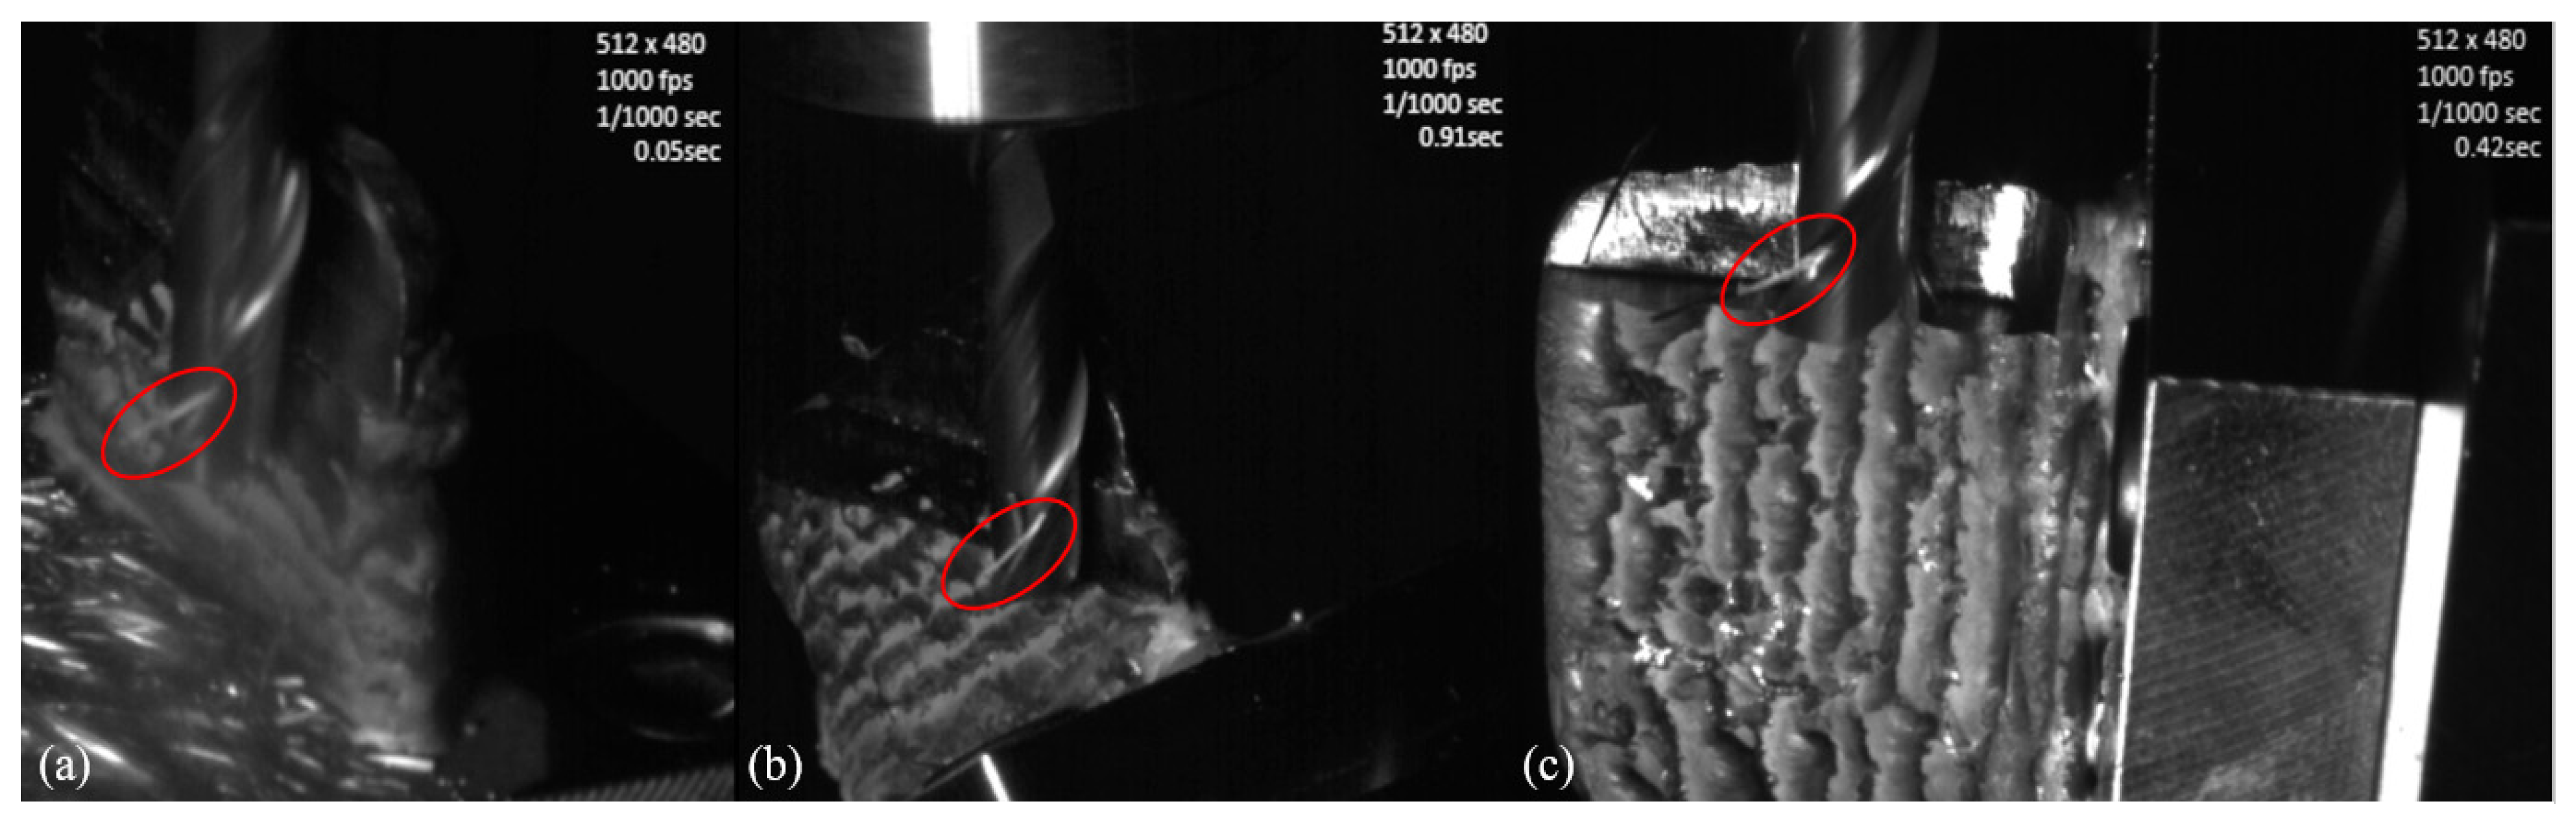
It was previously explained that when mounting the machining setup, to evaluate possible disturbances in the machining process, not only a digital camera but also a high-speed camera was installed inside the machining center chamber. Even though the digital camera did not manage to observe apparent instabilities in the machining process, the high-speed camera was able to capture some valuable data regarding the tool wear. Images representing these results for the three different cases (0, 35, and 90 degrees) are shown in
Figure 8.
The valuable information that was mentioned previously is highlighted in the red circles of
Figure 8 and happened similarly for all the cases studied. And with this additional knowledge, it is possible to comprehend some aspects of the wear present in the cutting tools.
When observing the machining procedure, it was possible to notice that some of the material that was being removed from the workpieces, the machined chips, were not expelled in a fast manner; they became welded to the cutting tools. Being removed only after a few rotations of the same, and the pictures in
Figure 8 show one of those moments for each cutting angle when one chip was still turning along with the cutting tools.
The welding of the chips to the cutting tools represents an undesired effect of the machining process, usually happening due to the high temperatures that occurred during the experiments. This kind of effect could have a direct impact on the tool life since the welded chips, when leaving the cutting tools, end up removing small amounts of the tool’s material, being called adhesion wear, and this cumulative amount could represent significant wear when considering larger cut lengths. This kind of wear and the previously discussed abrasion—known problems of the machining of Inconel 718 workpieces— are also discussed by different authors [
27,
28,
29].
In the next section of this research, the cutting forces are presented and analyzed, not only with the focus of a further evaluation of the difference of each cutting angle but also by discussing some distinct AM product characteristics.
3.3. Cutting Forces
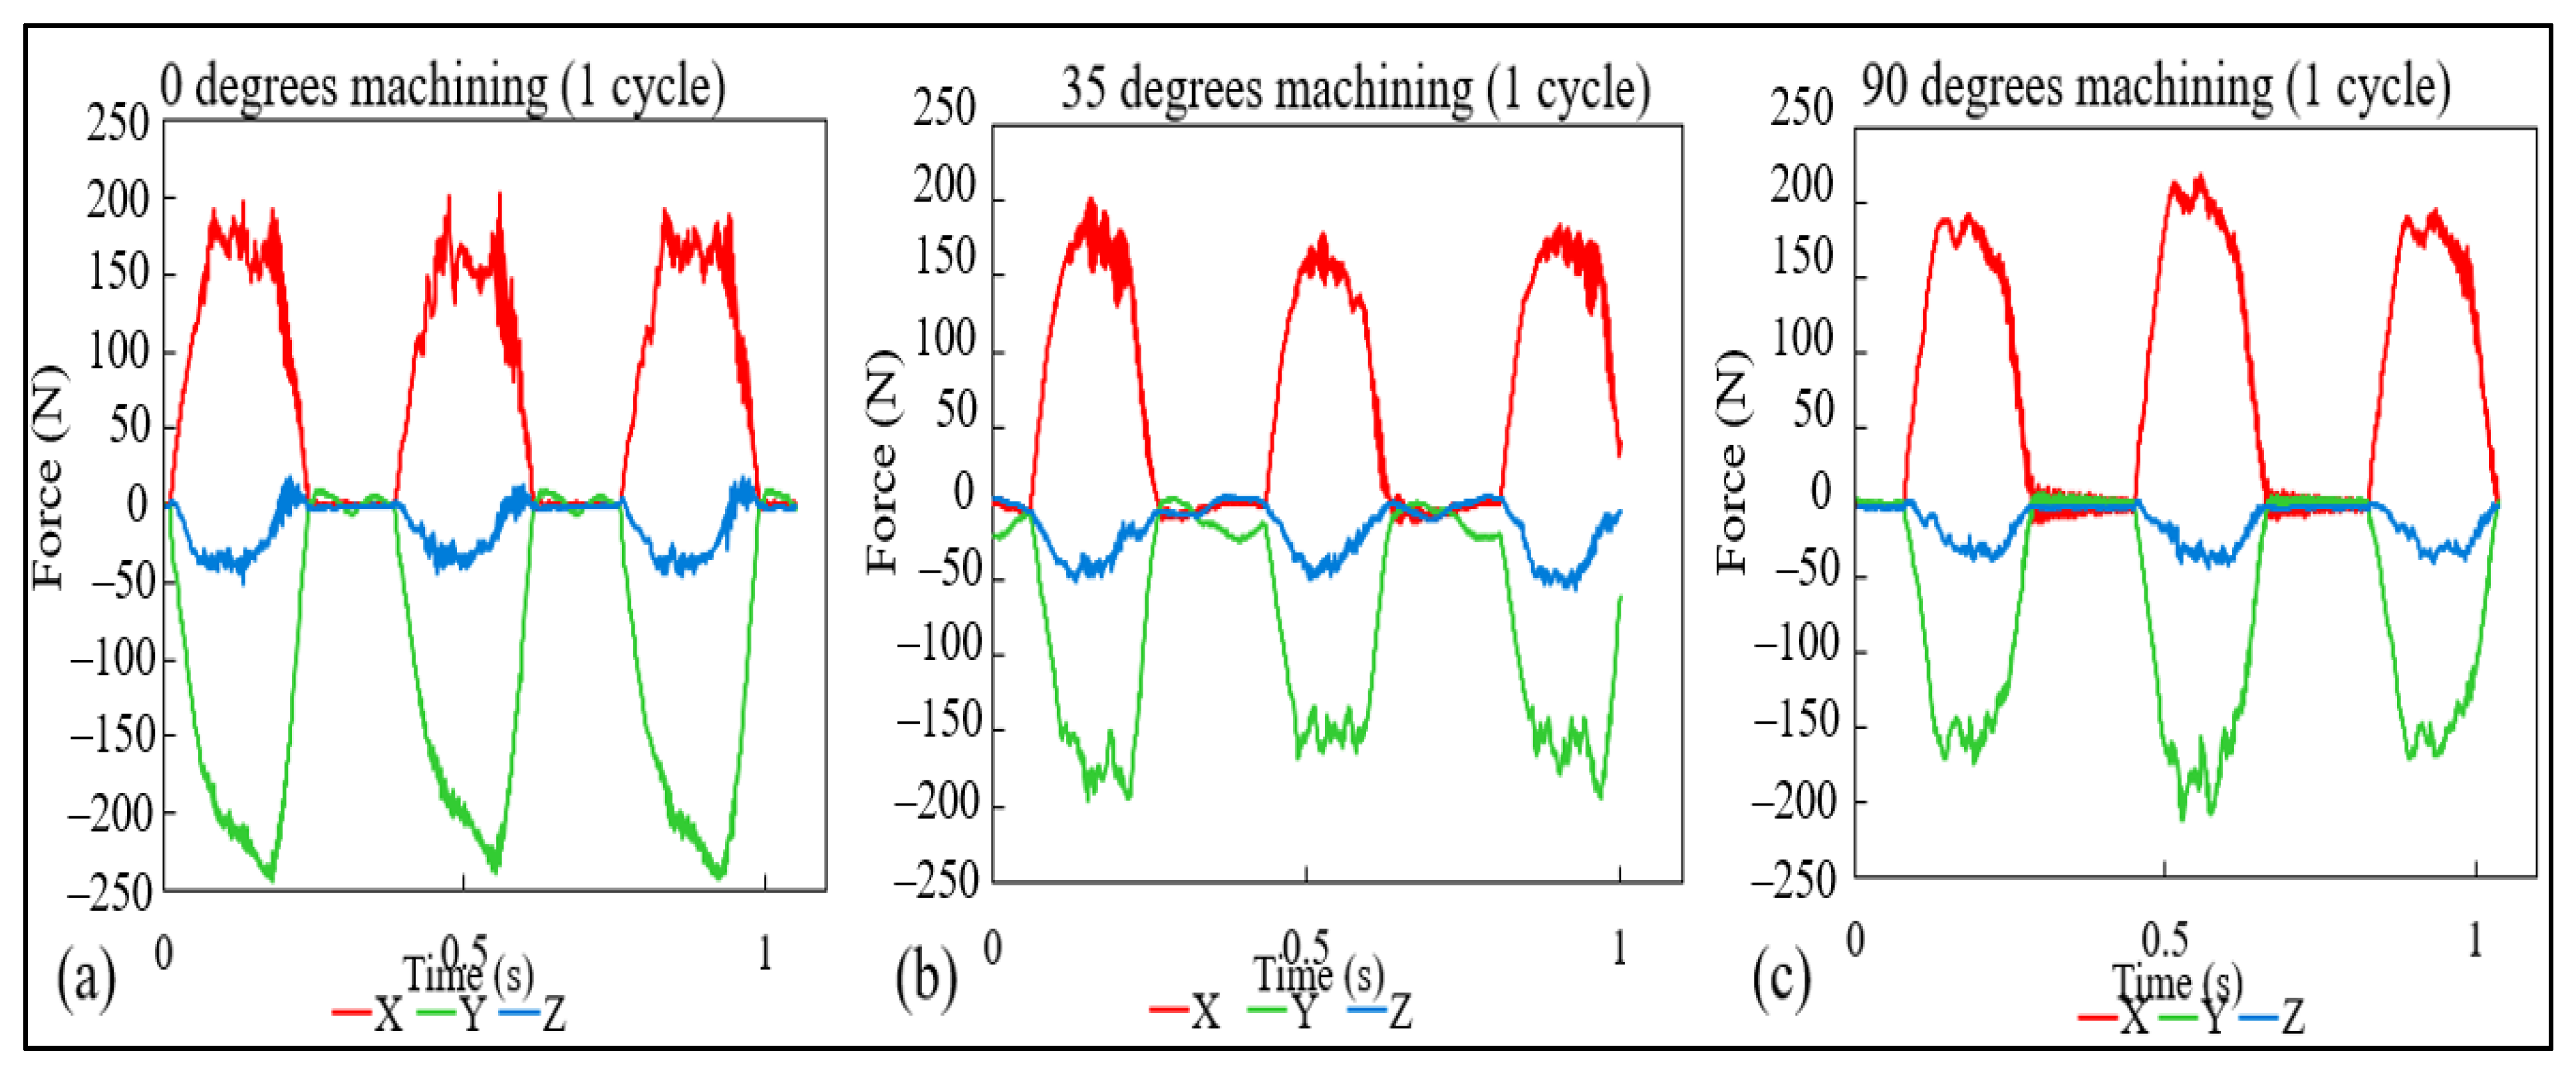
As explained in previous sections, the cutting forces were acquired throughout the different experiments, and with that, distinct results could be gathered, and in this section, three major discussions will be presented. First, with the aid of
Figure 9, which shows the data for the cutting forces for a single cutting cycle (full rotation of the cutting tool). The second, visualized in
Figure 10, with data regarding one entire cutting pass, and the last discussion, pictured in
Figure 11, the maximum forces for each cutting pass.
With the aid of
Figure 9, the observation of the process stability is possible, and even though the first case, 0 degrees, shows some level of instability at the
x-axis, as discussed in the previous discussion compared to the other two cases. The 35-degree cutting angle, in particular managed to have a more constant process.
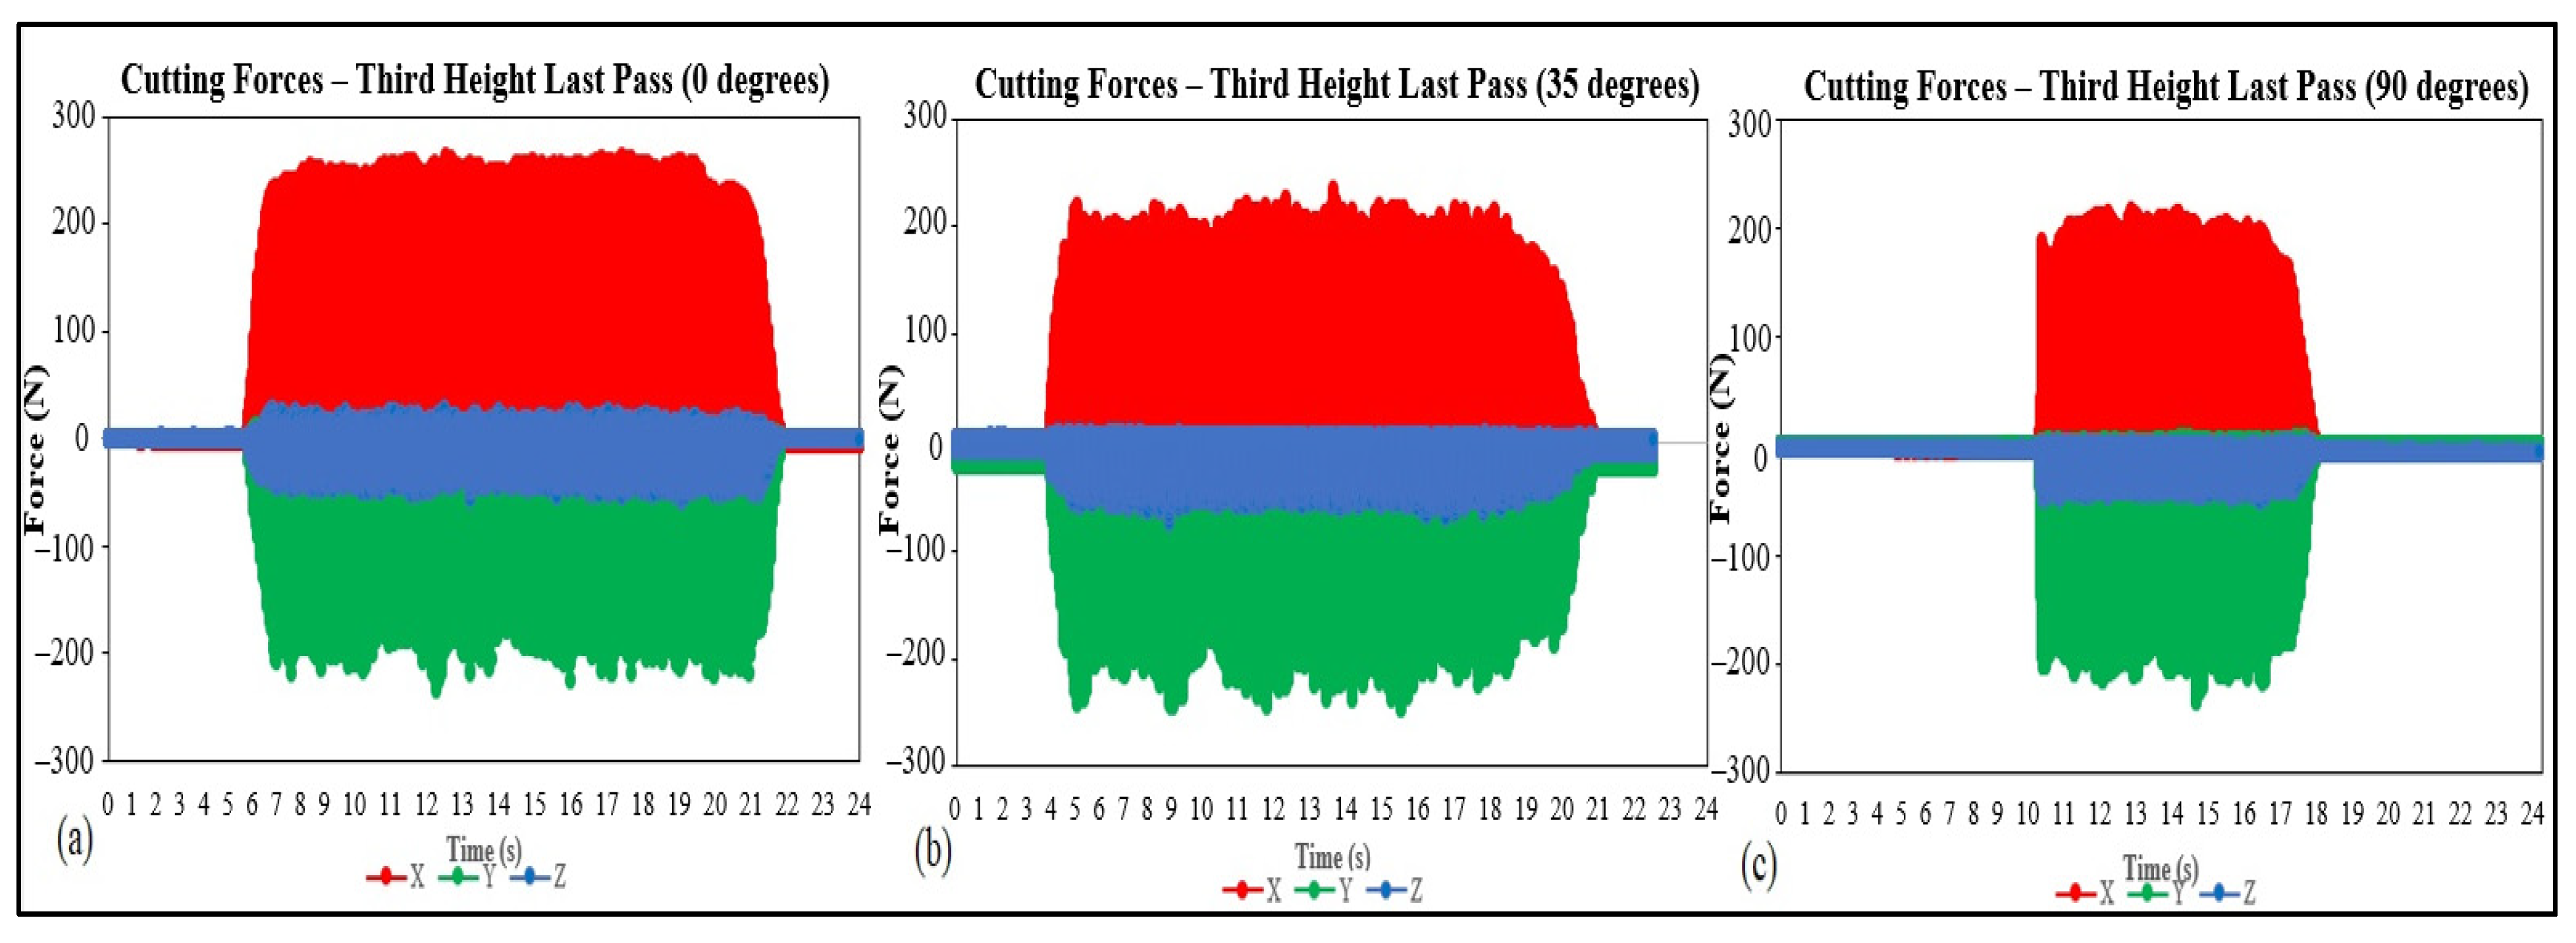
From
Figure 10, it can be seen that although the results for surface roughness and visual aspect, discussed in
Section 3.1, Machining Quality Assessment, for the 0 degrees of cutting angle are superior in quality, the values for the three cases present a varying trend. At the same time, the values for the
y-axis are slightly higher for the 35-degree angles. On the other hand, the
x-axis values showed a significant difference, as shown in case (a), with higher values on average.
When it comes to the shape of the graphs of
Figure 10, they were considered similar, and little to no conclusions could be drawn. Although some degree of variability is visible, especially for the
x-axis in the case (a) and
y-axis for (b) and (c), the instability was better visualized with
Figure 9.
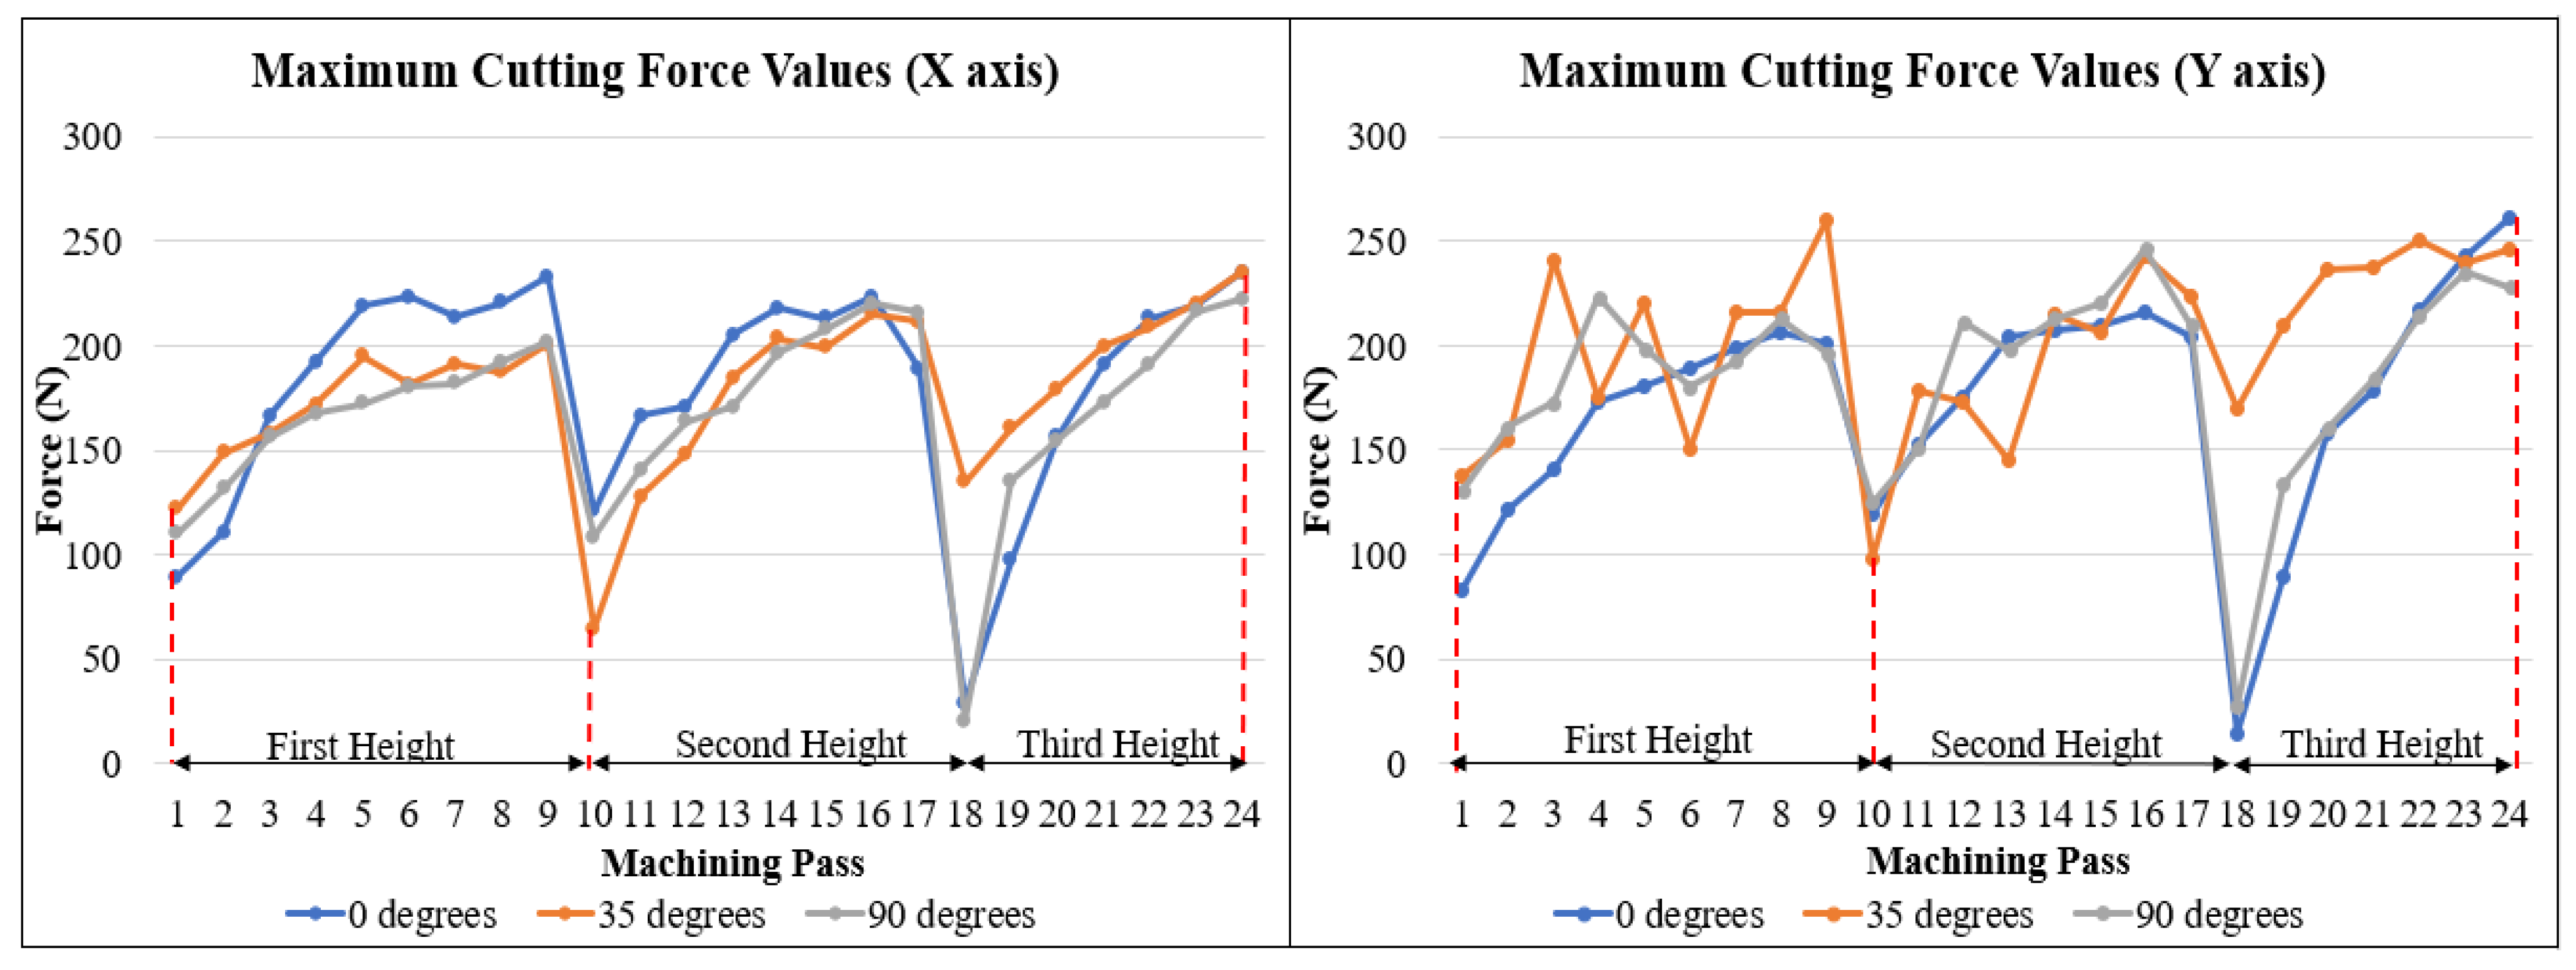
Figure 11, as explained previously, presents the maximum cutting forces obtained throughout all the different machining passes for the
x- and
y-axis for the three different angles discussed.
Figure 11 presents a few expected results; first, it is possible to observe a more even trend when it comes to the
x-axis values, having the three cases similar results on average. The different angles presented a significant increase when comparing the first machining passes to the last one for the same height, indicating the growth of the amount of material removal, directly influencing the cutting forces. Another aspect to be discussed from the
x-axis results is the fact that the maximum values, especially comparing the last machining pass for the different height, does not present a high amount of variation; this data contributes to the already discussed idea of a lack of significant tool wear, which could increase the cutting forces consecutively.
The y-axis does not present the same trends observed in the x-axis. First, the variability is higher when considering the 35- and 90-degrees cases, opposed to the upward trend observed in the previous case. Especially for the 35 degrees results, the maximum cutting forces do not seem to follow a tendency of increasing when observing the same height for these two angles.
The 0-degrees angle, on the other hand, presented a tendency like the one presented in the
x-axis, having a more seemingly stable process. The observations of
Figure 11 do not only match the results gathered previously for surface quality but also the results for cutting forces analyzed in
Figure 9 and
Figure 10, which complement the idea of a greater tendency of instability for the 35-degrees and 90-degrees angles.
When considering the stability results for this topic and the previous results, it was possible to hypothesize two possible reasons. Being the first possibility, the influence of the microstructure on the cutting procedure is discussed next.
When evaluating the material to be anisotropic, a consequence of the dendritic microstructure, although the values of cutting forces did not vary considerably, the influence of this characteristic in the cutting mechanism [
30] is thought as being one of the reasons for the results presented in the present paper.
The anisotropy of additive manufacturing samples, not only for WAAM and the specific case for Inconel 718 alloy, was proved as being a major influence in the post-processing procedure, for not only cutting forces and surface quality [
31] for different build and cut directions but also tool wear [
32].
Another point to be considered regarding the influence of the microstructure on the machining results is the difference in the microstructure itself for the studied samples. Having this kind of microstructure, the presence of dendrite and interdendritic structures that could have different values for mechanical properties, in a similar manner as the stress–strain for single-crystal nickel alloys differ [
33], possibly causing disturbances in the machining procedure.
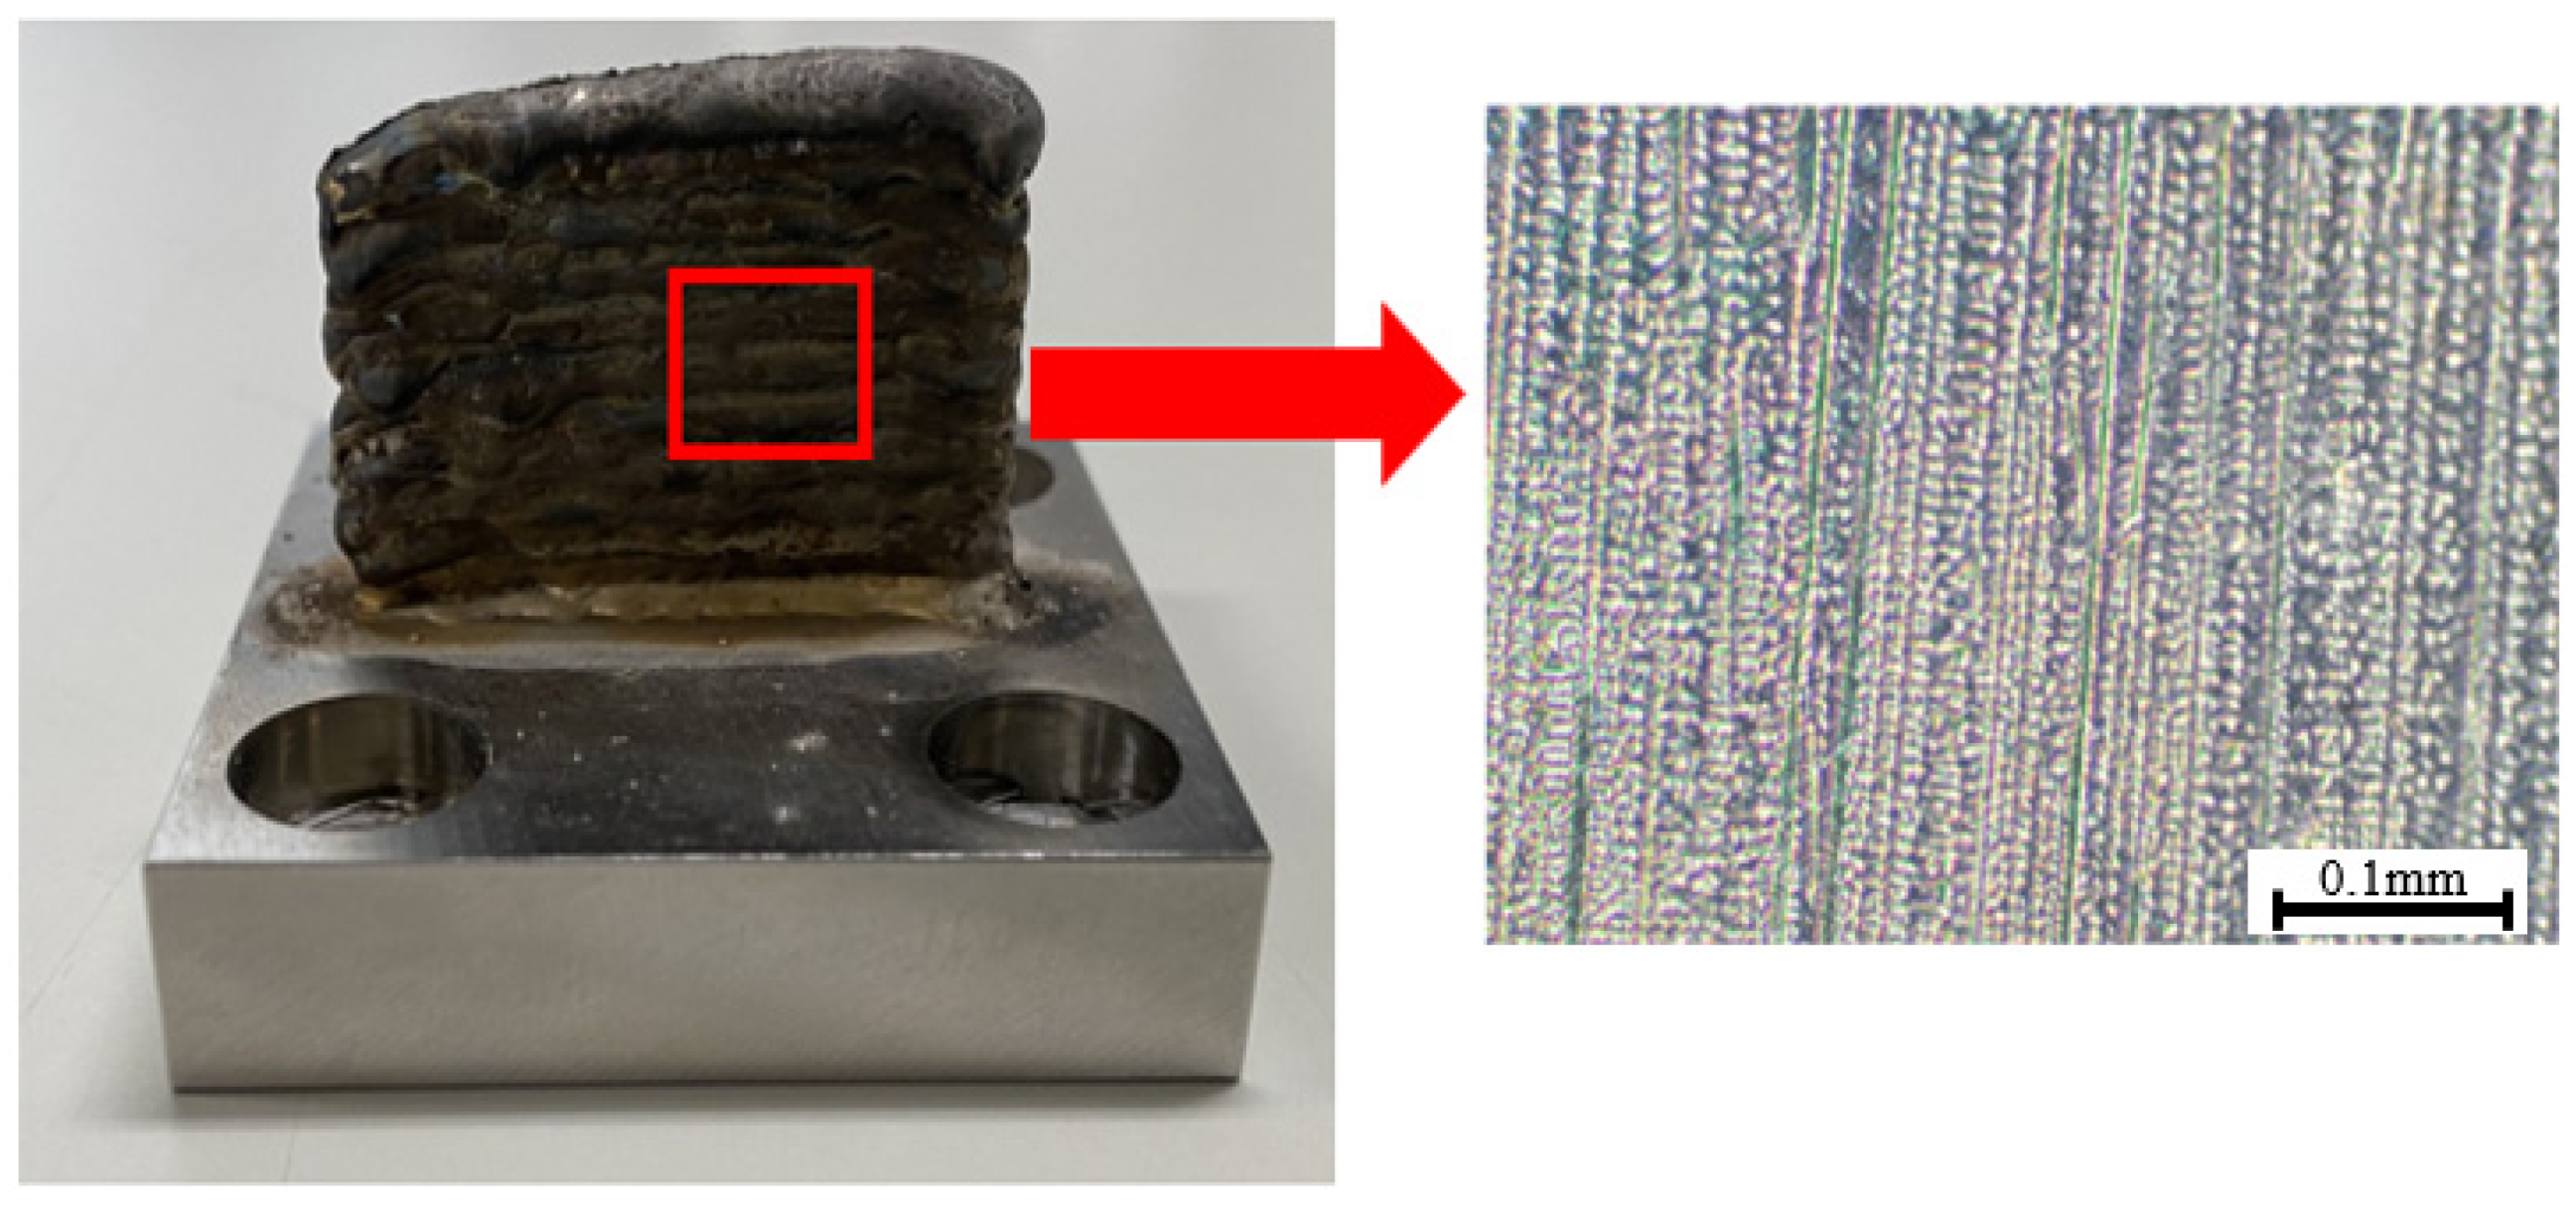
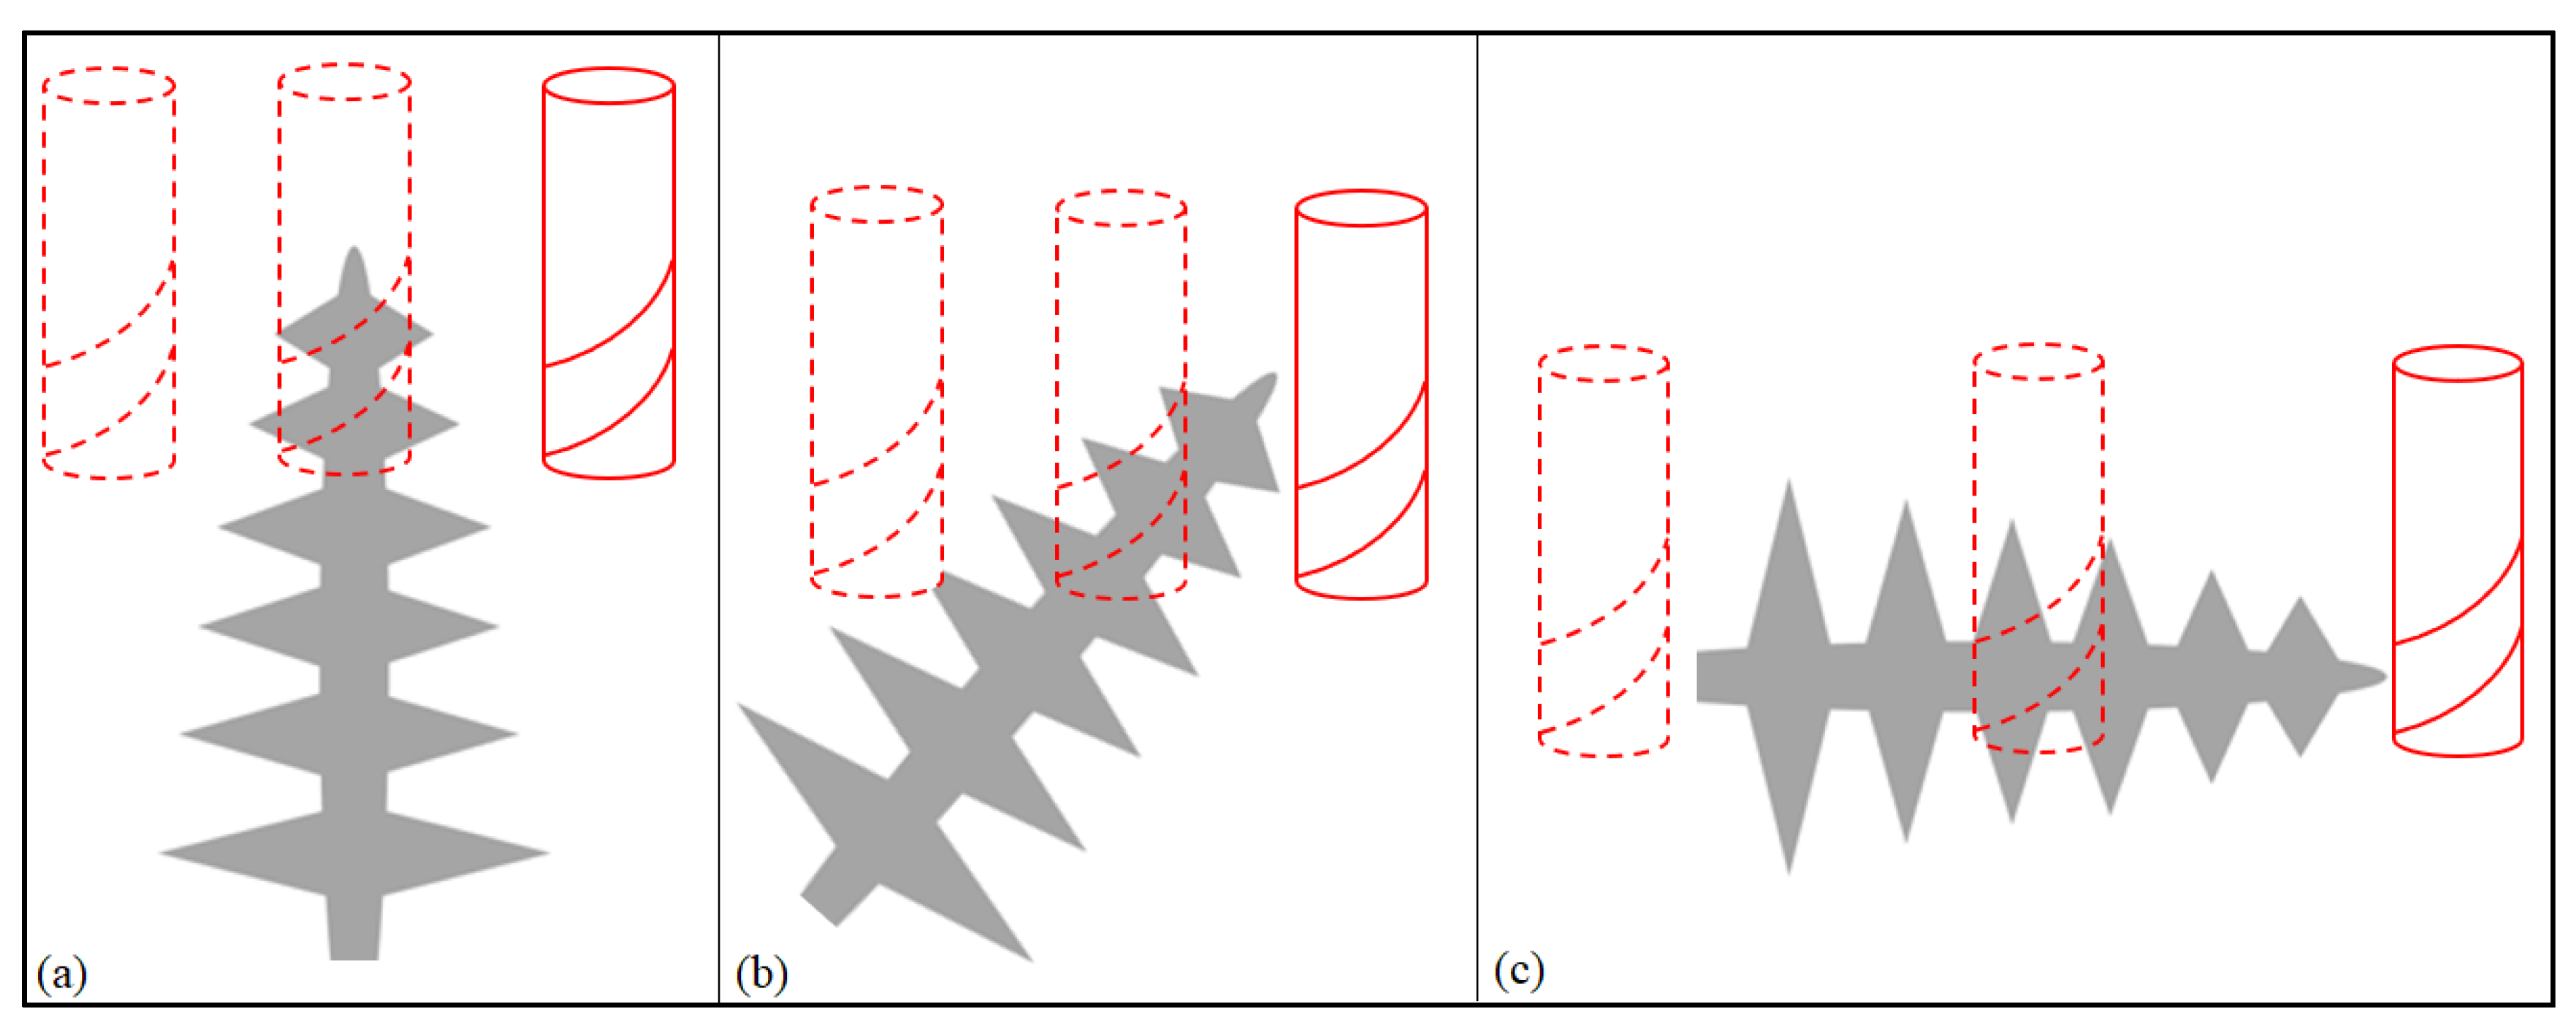
To better illustrate this hypothesis, a representation of each machining procedure at the microscopic level was drawn and is presented in
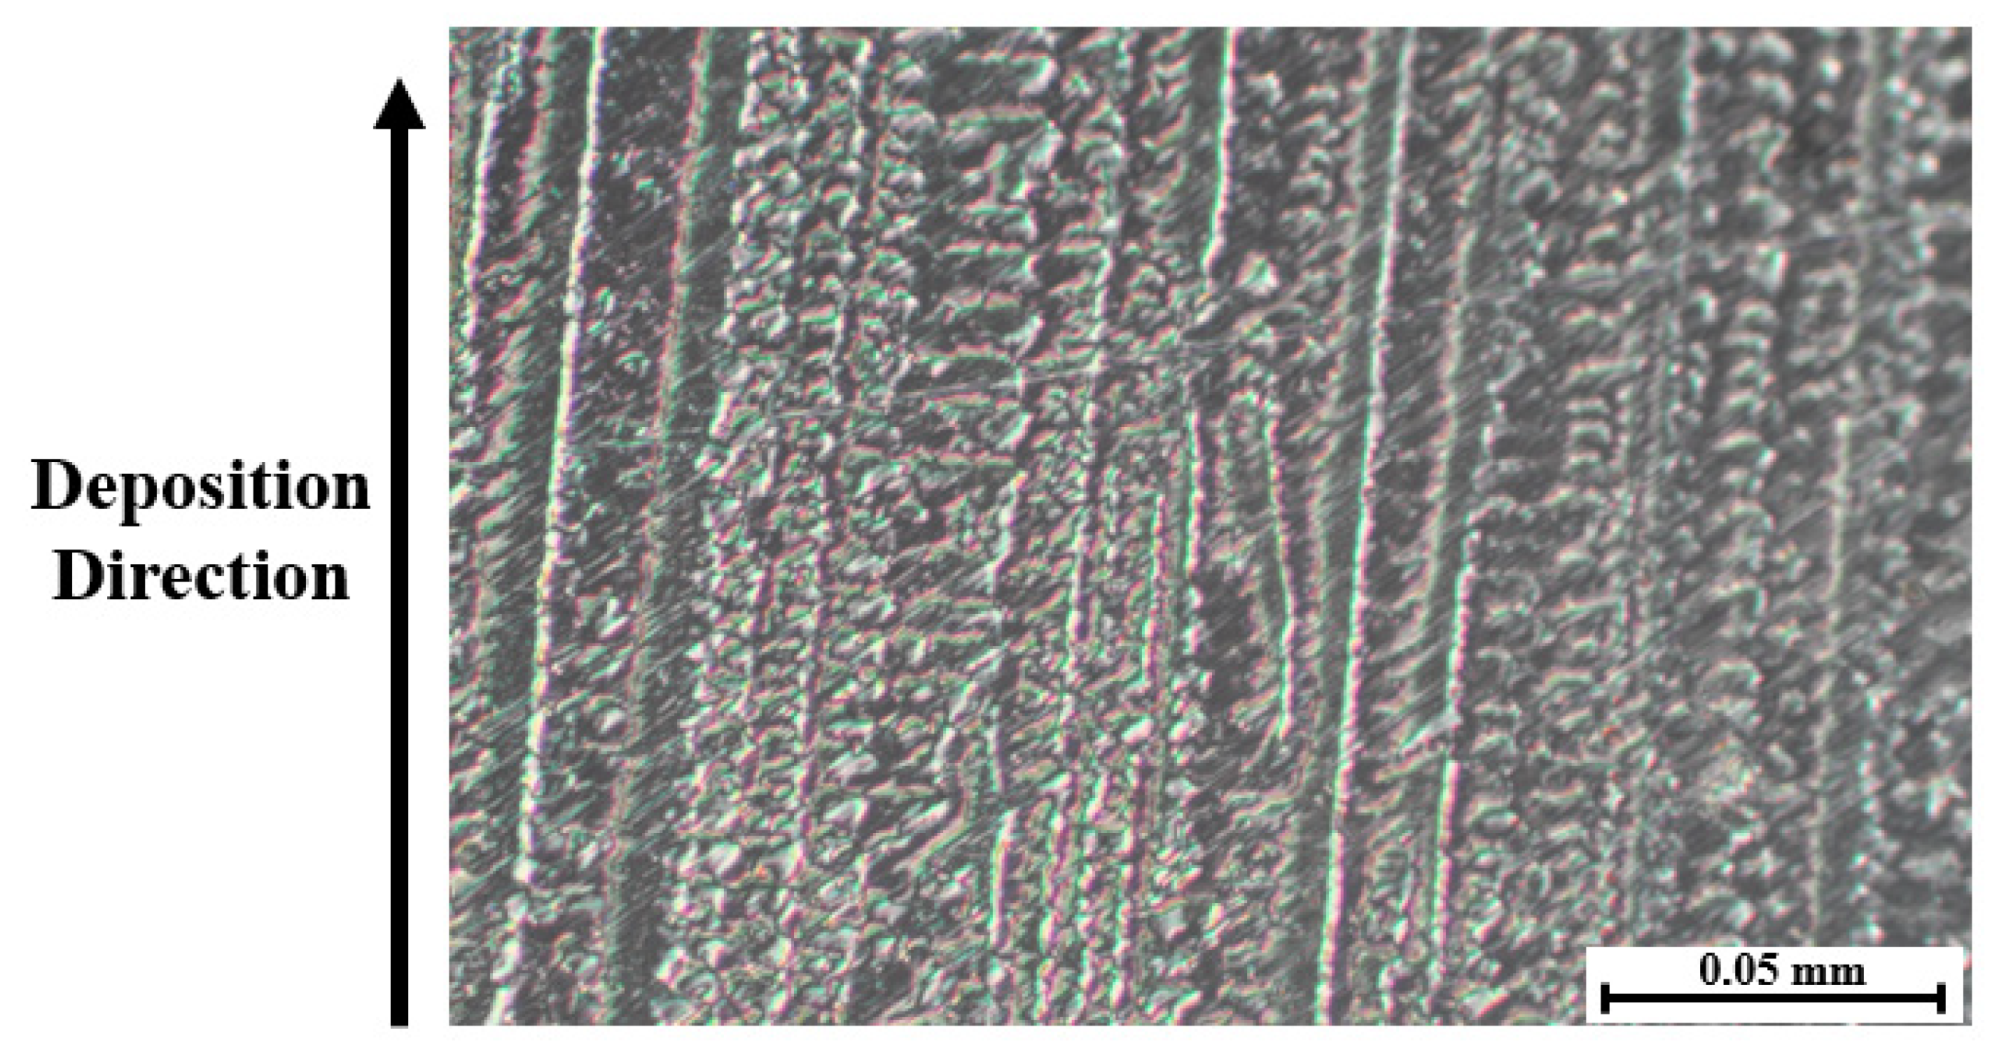
Figure 12 to show the differences for each cutting angle. For better comprehension of the microstructure of the samples in question, a microscopic picture representing the dendritic structure of the Inconel 718 WAAM as deposited at a higher magnification than the one in
Figure 4 is shown in
Figure 13.
With
Figure 12 and
Figure 13, some of the peculiarities of the dendritic microstructures can be explained more easily. First, when compared with regular grain structure, this kind of microstructure presents innate irregularities. It is possible to be observed that the surface, despite being polished, does not appear to be flat, having a clear contrast between the dendrites that appear as “peaks” and the rest of the surface.
The dendritic structures shown in
Figure 13 have a different texture when compared with regular grain structure alloys. This kind of microstructure is highly anisotropic and could influence the mechanical properties’ anisotropy as well [
34].
Another characteristic concerning this kind of structure is regarding its growth direction. The dendrites grow in the direction of the deposition, developing themselves across the deposited layers due to the remelting of the previously solidified layers [
35]. In
Figure 13, this deposition direction is shown as well as the indicator of the dendrite growth direction.
These differences in microstructure and the influence that the dendritic structures present, as explained previously, are hypothesized by the authors as being one of the possible causes for the diversity of results for the different cutting angles. Another difference regarding the microstructure that could represent a further explanation for the deviations in the cutting forces consists of the variations in diameter for the dendritic structure across the different axes. Although not observed by the authors in the present research, these differences are reported and will be further discussed in the present topic.
The second hypothesis that was formulated to explain the differences found in the results is based on the characteristics of the samples. The workpieces that were deposited and later machined were chosen to be walls of around 5 mm of width, and this characteristic could be detrimental to the manufacturing process.
It is known that thin walls are more susceptible to negative influences during the machining procedure, such as vibrations that can occur during the cutting steps and that can affect the surface finish [
36] and cause tool deflections [
37]. And even though there is a lack of study regarding the effects of the different cutting angles in this type of sample as well, one could assume that the effects of the differences in cutting forces directions could be amplified in this type of sample, being not a characteristic specific to the AM products, but of the sample’s dimensions.
Although the second hypothesis that was formulated was not completely ruled out by the authors, when considering the data gathered throughout the research, there was no evidence suggesting it was the real cause of the differences observed. When observing the cutting forces, there was no apparent sign of both chatter vibrations and tool deflections, meaning that the first hypothesis is the assumption most backed up by the data.
Even if data were indicating the first hypothesis to be a good representation of the effects of the tool postures in relation to the deposition direction, it was decided to perform further experiments that could reinforce or discard that assumption. This time, however, the samples to be machined were not AM samples but were composed of the Inconel 718 material, more specifically the AMS 5662, an alloy that went through both cold rolling and Solution heat treatment processes.
This type of Inconel 718 alloy was selected for being first, a material that was not age-hardened, presenting a hardness value that is closer to the AM samples presented in this paper, and most importantly, presenting both microstructure and mechanical properties that are isotropic. Apart from the anisotropy aspect, these two kinds of materials also present other different characteristics, and some of them will be presented next.
For instance, when it comes to the microstructure, it was already informed that the WAAM samples are composed of dendrite formations, this kind of microstructure has also been reported to have different diameters throughout the three axes, ranging from sizes as small as 53 µm to as big as 615 µm [
9]. As stated previously, this could be another influence for the differences found in the cutting force values.
The AMS 5662 alloy, on the other hand, is composed of equiaxed grains [
38], meaning the grains share about the same diameter. The requirement stated by the AMS standard, to be of around 63 µm or finer.
Regarding the microstructure, one important difference between the two kinds of samples is regarding the presence of Laves Phases. This intermetallic phase is reported as being not only brittle but is also linked with the loss of ductility for the Inconel 718 alloy [
39]. While the WAAM Inconel 718 is known for having this kind of intermetallic phase deposits among the precipitates of its microstructure [
40], the AMS 5662 does not have the presence of this phase.
While considering the previously mentioned differences, in the next topic then, different aspects regarding the machining of the AMS 5662 are presented.
3.4. Anisotropy Hypothesis Investigation
As mentioned previously, the objective of this research topic is to better analyze the causes of the differences in the machinability results among the different cutting angles obtained and discussed previously.
For that reason, by machining a sample known for having isotropic mechanical properties at different cutting angles, the data could be used to better understand the possible influence of the anisotropy of the WAAM samples on the machining process.
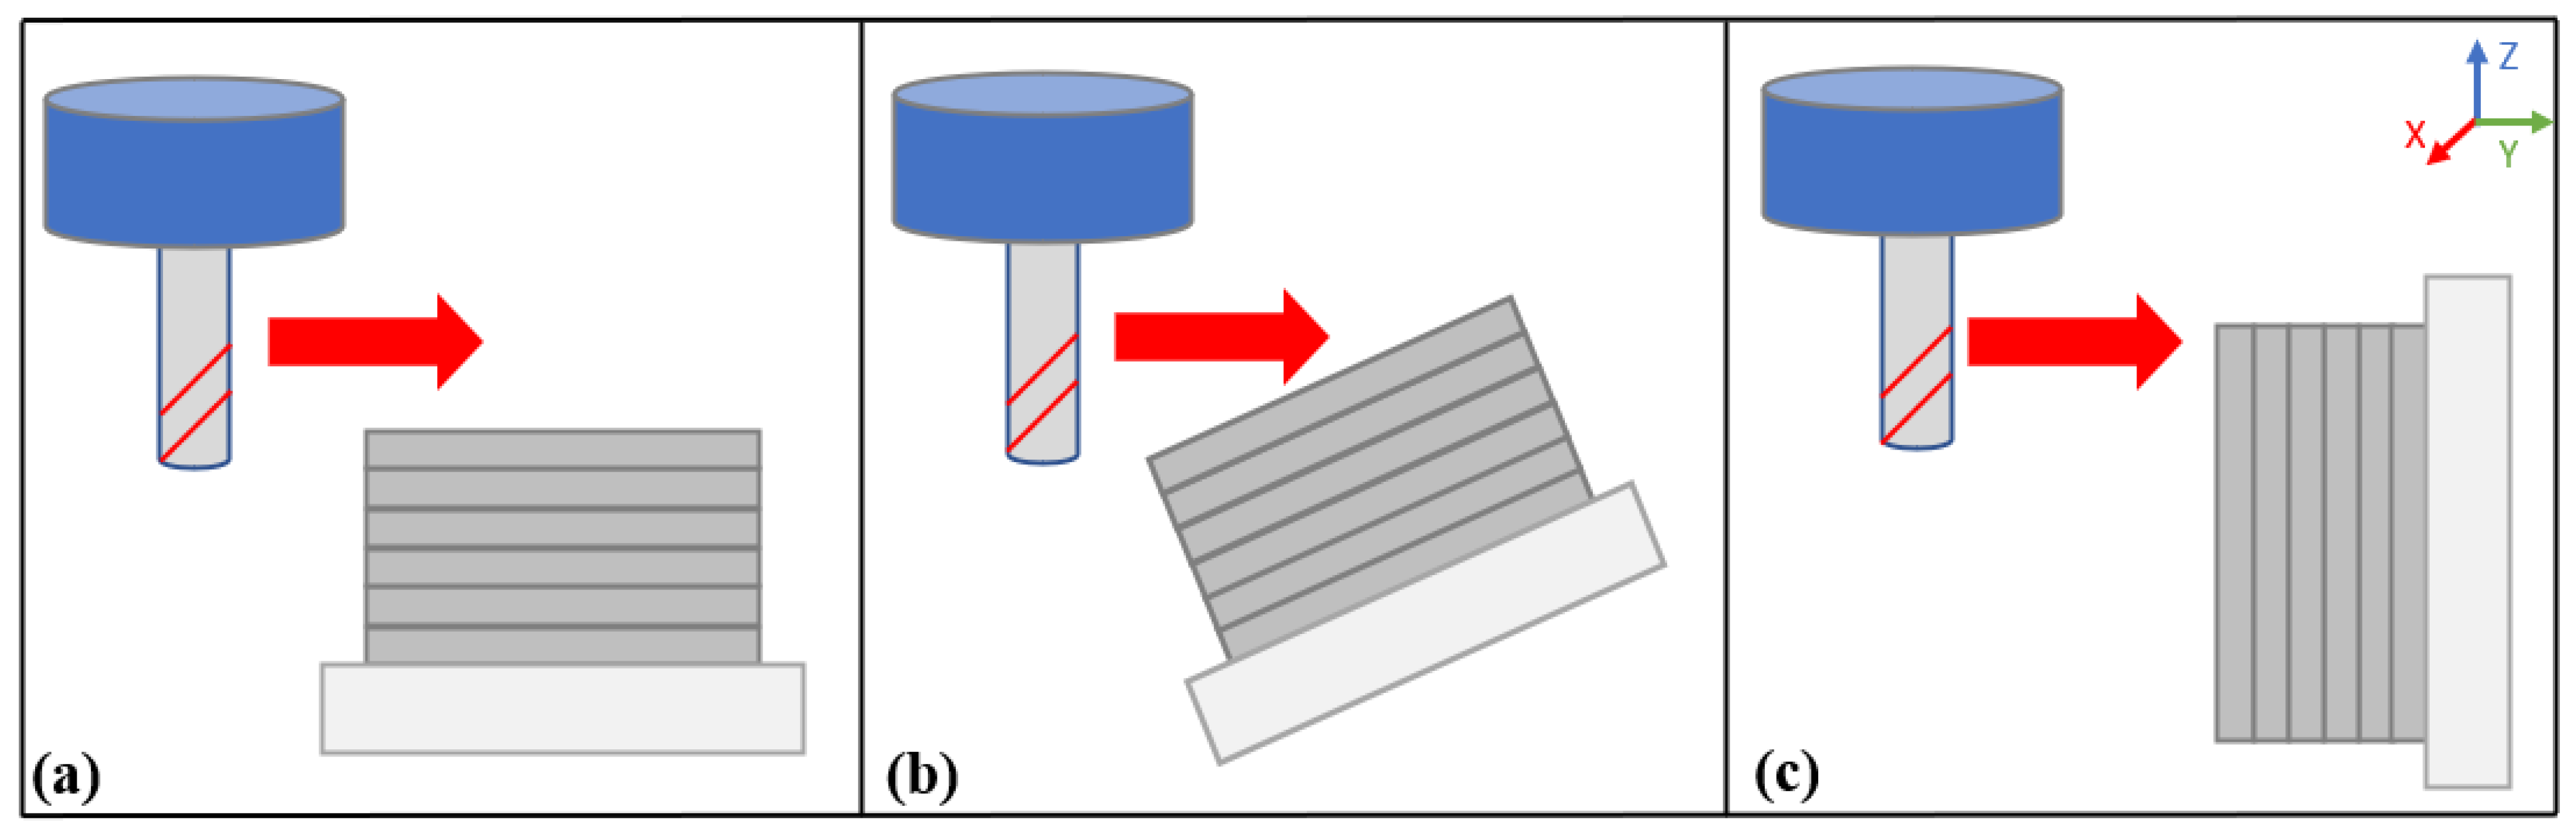
For this analysis, it was chosen to perform the milling steps following the same parameters as the other kind of sample, data that is present in the
Section 2 and summarized in
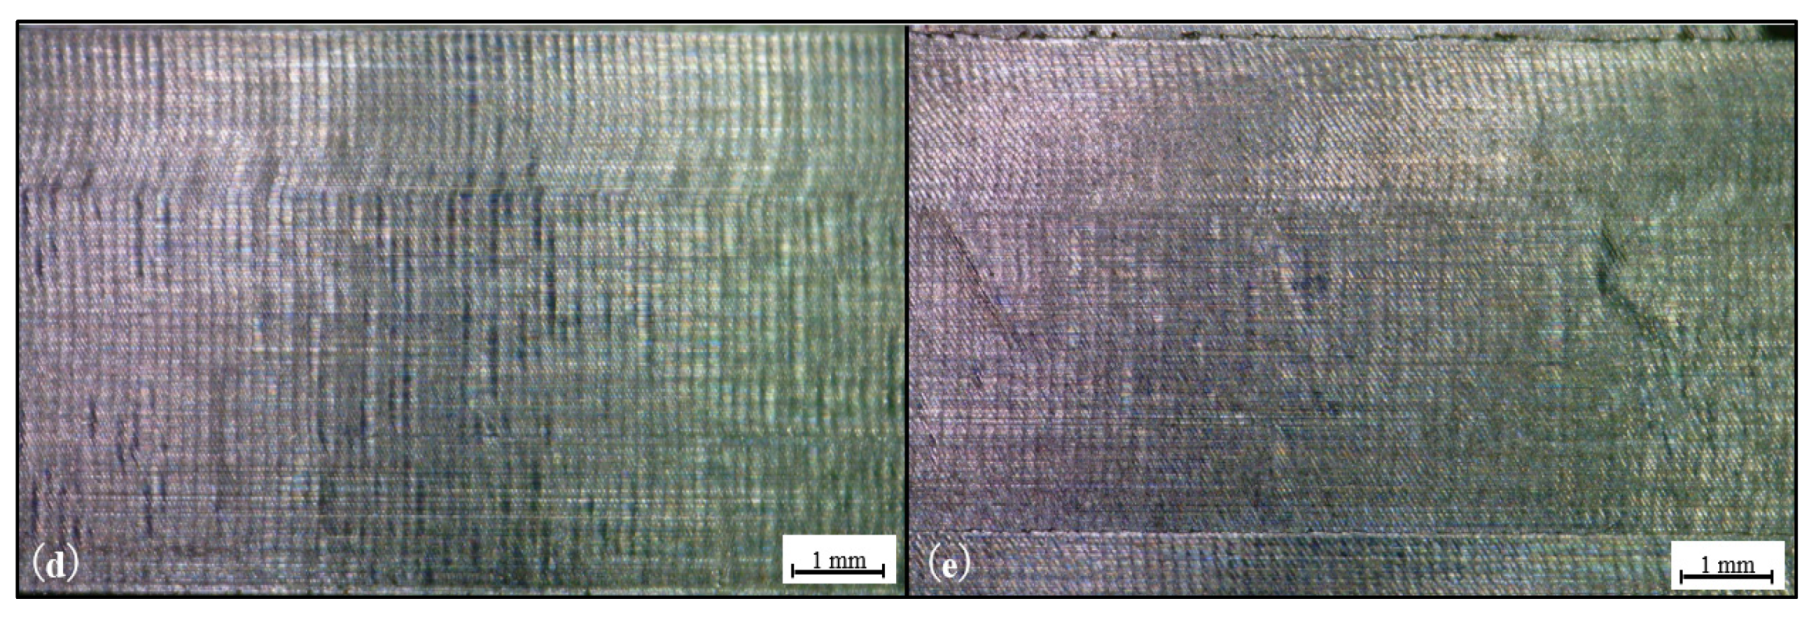
Table 2. However, in terms of the cutting angles, it was chosen that only two angles would be analyzed, the 0 and 35 degrees, to be referred to as cases (d) and (e), respectively. For the cases presented with the most differences among the three experiments, it was considered that the results concerning these two angles would be sufficient data for the objective of this paper.
In a similar manner to the discussion for the samples produced with the AM technique, evaluations regarding the surface quality and cutting forces for a single cycle will be presented in this section. The first analysis step addresses surface quality.
Figure 14 presents a comparison for both cases, showing pictures of the surfaces after the machining procedure, taken with the aid of a microscope.
As opposed to what was observed in
Figure 5, the surfaces after machining present similar appearances, with the sample (e) appearing to have minor irregularities, being possibly plastic deformations due to both high temperatures generated during machining and the effect of tool wear. Differently to what was seen in the WAAM process, with major changes for the varying cases.
Following the same protocol adopted for the analysis of the WAAM samples, the next step for the surface quality evaluation would be the surface roughness measurements. This time the surface roughness average values (Ra and Rz) for cases (d) and (e) respectively were measured and are present in
Table 5 and
Table 6.
In
Table 5 and
Table 6, what was observed in
Figure 14 becomes more evident, having the slightly more irregular appearance of the case (e) being matched with the differences in the surface roughness. Although these differences could be considered minor changes, of around 15%, especially when compared with the variances observed on
Table 3 of roughly 56%, from the 0- and 35-degrees cases.
Even though not further addressed in this paper, it was deemed important to mention that the same kind of wear process was observed for the machining of the AMS 5662 sample, having not only the abrasive wear shown, but the wear mechanism seems to be unchanged. From high-speed camera footage, the welding of the machined chips to cutting tools was also observed, not being then a particular effect of the AM products.
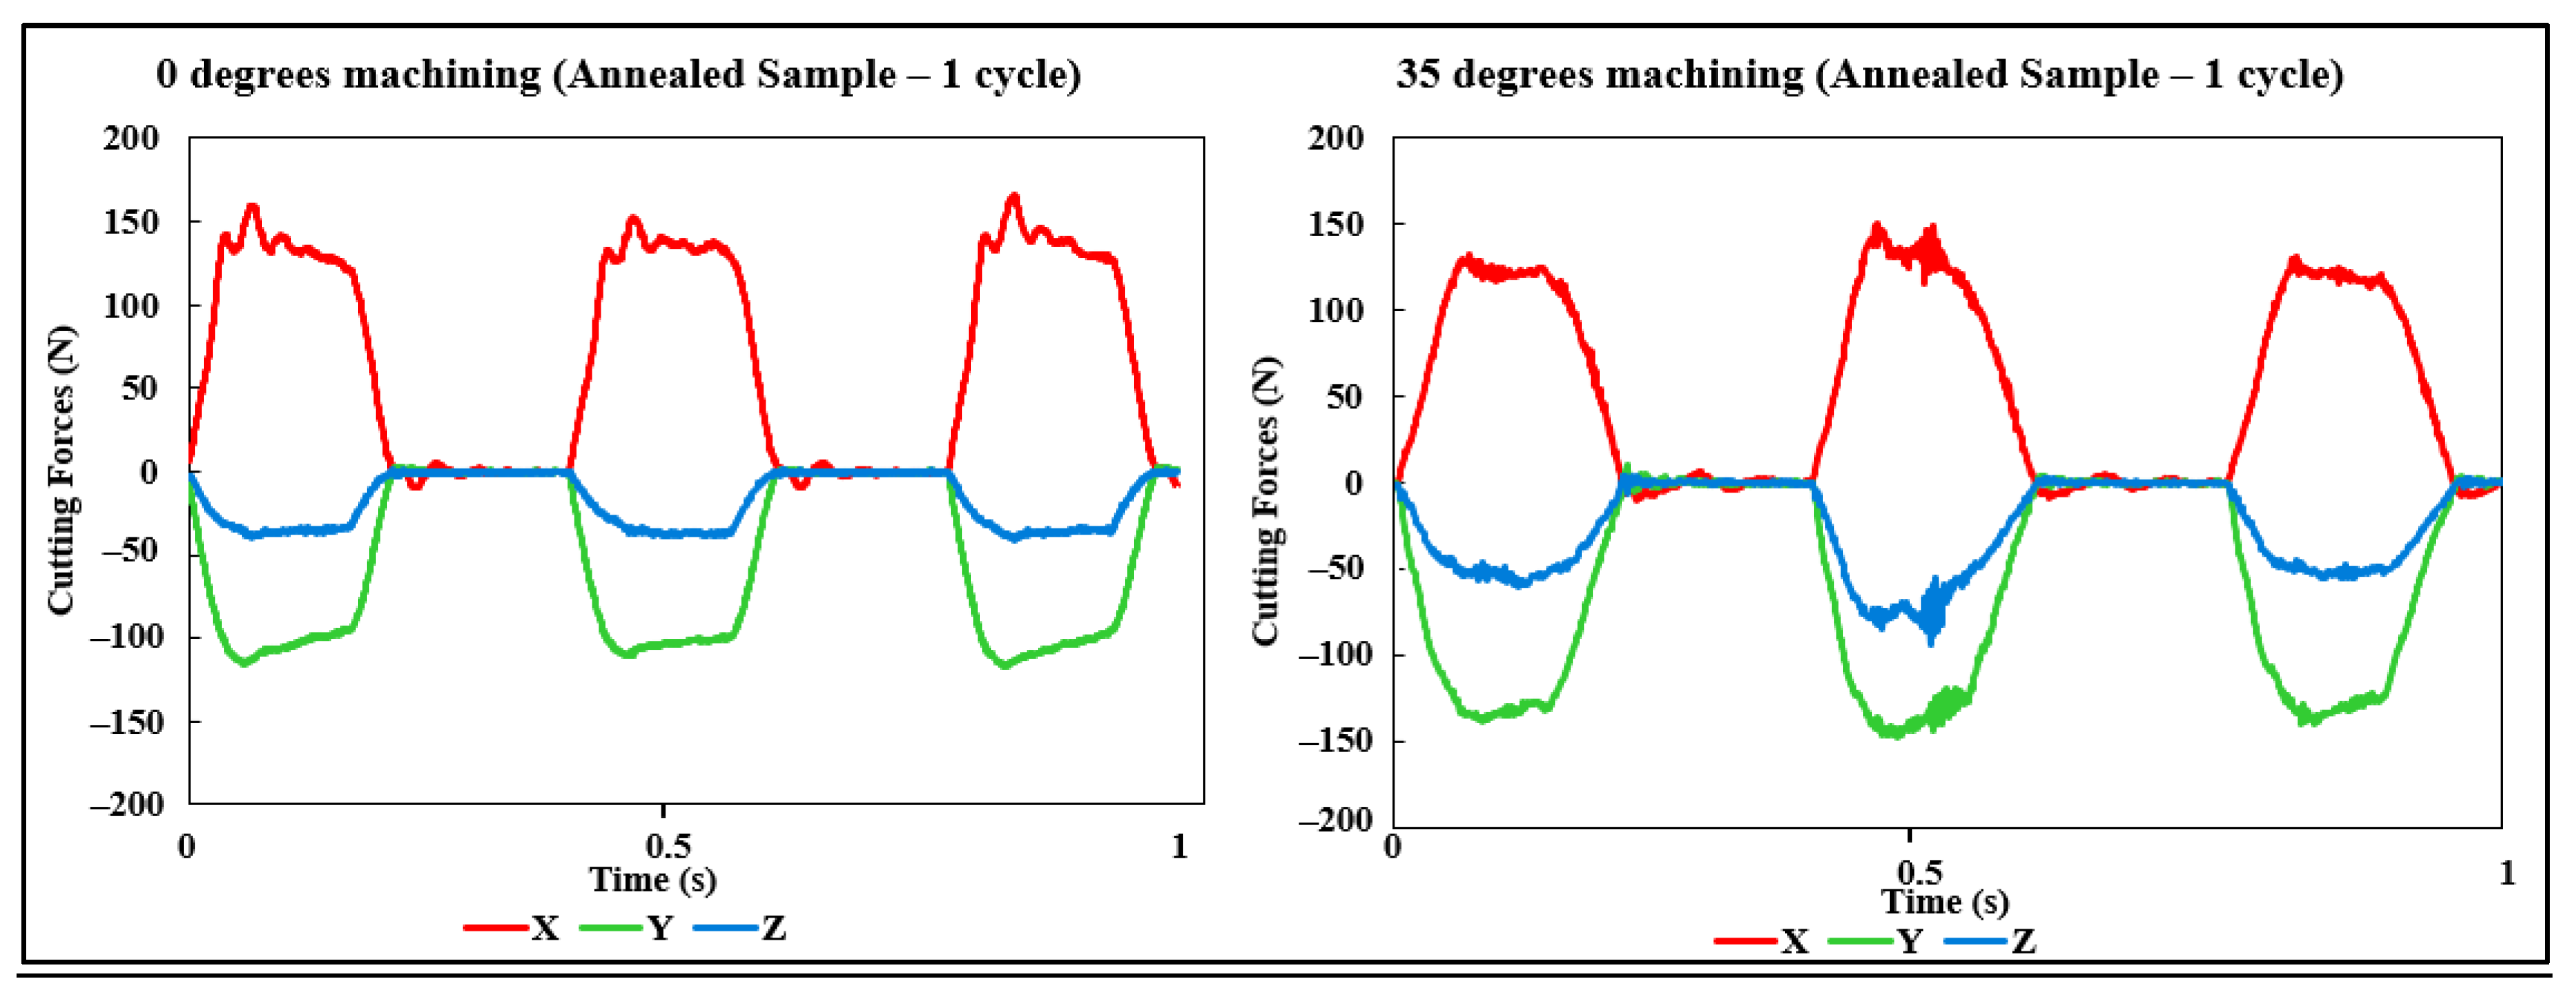
As the final step of this paper, the cutting forces for a single cycle for both cases (d) and (e) were analyzed, following the same procedure that was performed for the previous sample type. The results were plotted in graphs and are present in
Figure 15.
From
Figure 15, different analyses could be made, first, regarding the values themselves. They are similar in magnitude, especially the
x-axis and
z-axis, and have a slightly lower value for the
y-axis in the 0 degrees case.
Regarding the stability of the process, they seem to be also close, with the 35 degrees angle having seemingly more unstable values for the second turn of cutting (different blade), as opposed to a more stable process for the 0-degree case for the “three cuts.” This difference in stability was hypothesized as being a specific problem due to possibly an increase in the tool wear of the blade in question and not necessarily a trend for this type of cutting procedure.
Although the differences observed in this topic are not considered major differences, some degree of change occurred, and possibilities like instability due to the clamping system or due to the nature of the samples themselves (thin walls) are not discarded.
When comparing with the additive manufacturing samples, however, the changes in the results are at a smaller scale, indicating that even though that might not be the only cause of the different results in surface quality and cutting forces, the anisotropy of the AM samples is still the major hypothesis of the cause of differences for the machining of different angles for the wire and arc additive manufacturing Inconel 718 parts.
In the next topic, a conclusion of the results and a consideration for future works are presented.


