Article

Electric and Dielectric Properties in Low-Frequency Fields of Composites Consisting of Silicone Rubber and Al Particles for Flexible Electronic Devices

by
Alexandrina Teusdea
1,
Iosif Malaescu
1,
Paula Sfirloaga
2 and
Catalin Nicolae Marin
1,*
1
Faculty of Physics, West University of Timisoara, Bd. V. Parvan 4, 300223 Timisoara, Romania
2
National Institute for Research and Development in Electrochemistry and Condensed Matter, Str. P. Andronescu 1, 300224 Timisoara, Romania
*
Author to whom correspondence should be addressed.
Materials 2022, 15(6), 2309; https://doi.org/10.3390/ma15062309
Submission received: 15 February 2022 / Revised: 10 March 2022 / Accepted: 17 March 2022 / Published: 21 March 2022
(This article belongs to the Special Issue Advances in Electromagnetic Properties of Magnetic Materials)

Abstract

:
Understanding the electrical conduction and dielectric polarization properties of elastomer-based composites is important for the design of flexible and elastic electronic devices and circuits. Five samples were manufactured by mixing silicone rubber (RTV-530) with Al particles in different volume fractions, x equal to 0%, 0.5%, 1%, 2.5% and 5.1%. Using the complex impedance measurements, the electric modulus, M, the electrical conductivity, σ, and the dielectric permittivity, ε, over the frequency range 100 Hz–200 kHz were analyzed. The electrical conductivity spectrum, σ(f), follows the Jonscher universal law and the DC conductivity of the samples, σDC, increases from 2.637·10−8 S/m to 5.725·10−8 S/m, with increasing x from, 0 to 5.1%. The conduction process was analyzed in terms of Mott’s variable-range-hopping (VRH) model. The hopping distance of the charge carriers, Rh decreases with increasing x, from 7.30 nm (for x = 0) to 5.92 nm (for x = 5.1%). The frequency dependence of permittivity, ε(f) = ε′(f) − iε″(f), reveals a relaxation process with the maximum of ε″(f) shifting from 301 Hz to 385 Hz and values of ε′(f) increasing with the increase of x.

1. Introduction

In recent years, there has been an increasing interest in composite materials, such as nanofluids, gels or elastomers, which have been intensively studied for practical applications [1,2]. A composite material can be produced by dispersing nano-/microparticles in a liquid or solid matrix [3,4] and thus can provide improved performance compared to its components [3]. Recently, a special interest has been observed for composite materials consisting of metal oxide particles dispersed in a polymer matrix [5]. The electrical and dielectric properties of this type of composite material depend on the properties of the matrix and on the nature, size and concentration of the dispersed particles [6]. In Ref. [7], the authors show that by combining the graphite nanoplatelets and magnetite with different types of polymer, new composite materials can be developed with very good microwave properties. Moreover, other composites such as those obtained by mixing of BaTiO3 particles with a thermoplastic material [8] or using a thermoresistant polymer [9] as a matrix were found to be useful in applications with miniaturized electronic devices and sensors [10]. By mixing metal particles such as Fe or Ni with natural rubber, elastomers with improved electrical and magnetic properties are obtained [11]. Other elastomers obtained by introducing magnetite (Fe3O4) or NiZn ferrite particles in acrylonitrile butadiene rubber provide good protection against electromagnetic interference in the frequency range 1–12 GHz [12].
Silicone rubber (SR) is a dielectric elastomer [13] often constituting a matrix for obtaining composite materials. SR has low stiffness and high breakdown strength and generally can be used in sealing applications [14]. In order to be used in different applications, the silicone rubber is mixed with micro- or nanoparticles of different types (ceramic particles, conductive particles or highly polarizable polymers [15]). This contributes to the change of dielectric constant of the composite based on silicon rubber and makes it useful in applications such as elastic and flexible charge-storage devices or actuators [16]. The existing studies mostly focus on the thermal conductivity [17,18,19] or dielectric properties [17] of Al particle-reinforced silicone rubber composites [17,18], with Al2O3 particles [19] or with TiO2 particles [20]. These studies show that such composites can have potential applications in electromechanical actuators because of their high values of thermal conductivity or dielectric permittivity and their good elasticity. The determination of the electrical conductivity (σ) or dielectric permittivity (ε) of composites made of silicone rubber and Al particles, and experimental studies regarding the dependence both of (σ) and (ε) on the volume fraction of Al particles dispersed in silicone rubber are few in the literature. In this context, experimental measurements of the electrical conductivity and dielectric permittivity for composites consisting of silicone rubber and Al particles are very important and useful, in order to know whether the studied materials could be used in various applications, such as flexible electric and electronic devices.
In this paper we report the manufacture of some composite samples obtained by mixing silicone rubber with Al microparticles in different concentrations. The measurements of complex impedance (Z) over the frequency range 100 Hz–0.2 MHz allowed the determination of the electrical conductivity (σ) of composite samples and of their electrical modulus (M) and complex dielectric permittivity (ε = ε′ − iε″). The electrical conductivity was analyzed via Nyquist plots and in terms of Mott’s variable-range-hopping (VRH) theoretical model and the dielectric permittivity exhibits a low-frequency relaxation process. The results can be useful in the design of flexible and elastic electronic device and circuits.

2. Materials and Methods

For this study, we prepared a composite material using a commercial RTV-530 silicone rubber (SR) from Prochima [21] with the density ρ S R = 1.30   g / c m 3 and aluminum powder from Sigma Aldrich [22] with particles of micrometer sizes (smaller than 25 μm) and density ρ A L = 2.7   g / c m 3 . The silicone rubber (SR) is a nontoxic elastomer and is prepared with two components (A and B). These components are mixed in equal quantities and the result obtained after a polyaddition reaction is a rubber with medium elasticity and hardness.
For the preparation of the composite samples, we mixed a quantity MxAl of aluminum particles with a quantity MSR of silicone rubber (equal quantities MSR/2 of each component A and B). The obtained mixture was placed in a parallelepiped mold and pressed for 2–3 min until it took the shape of the mold, and after 24 h the composite sample was obtained. Figure 1 shows the stages of the obtaining process of samples.
The following quantities of aluminum particles, MxAl and of silicone rubber, MSR, were used to obtain the samples (SR-xAl):
-
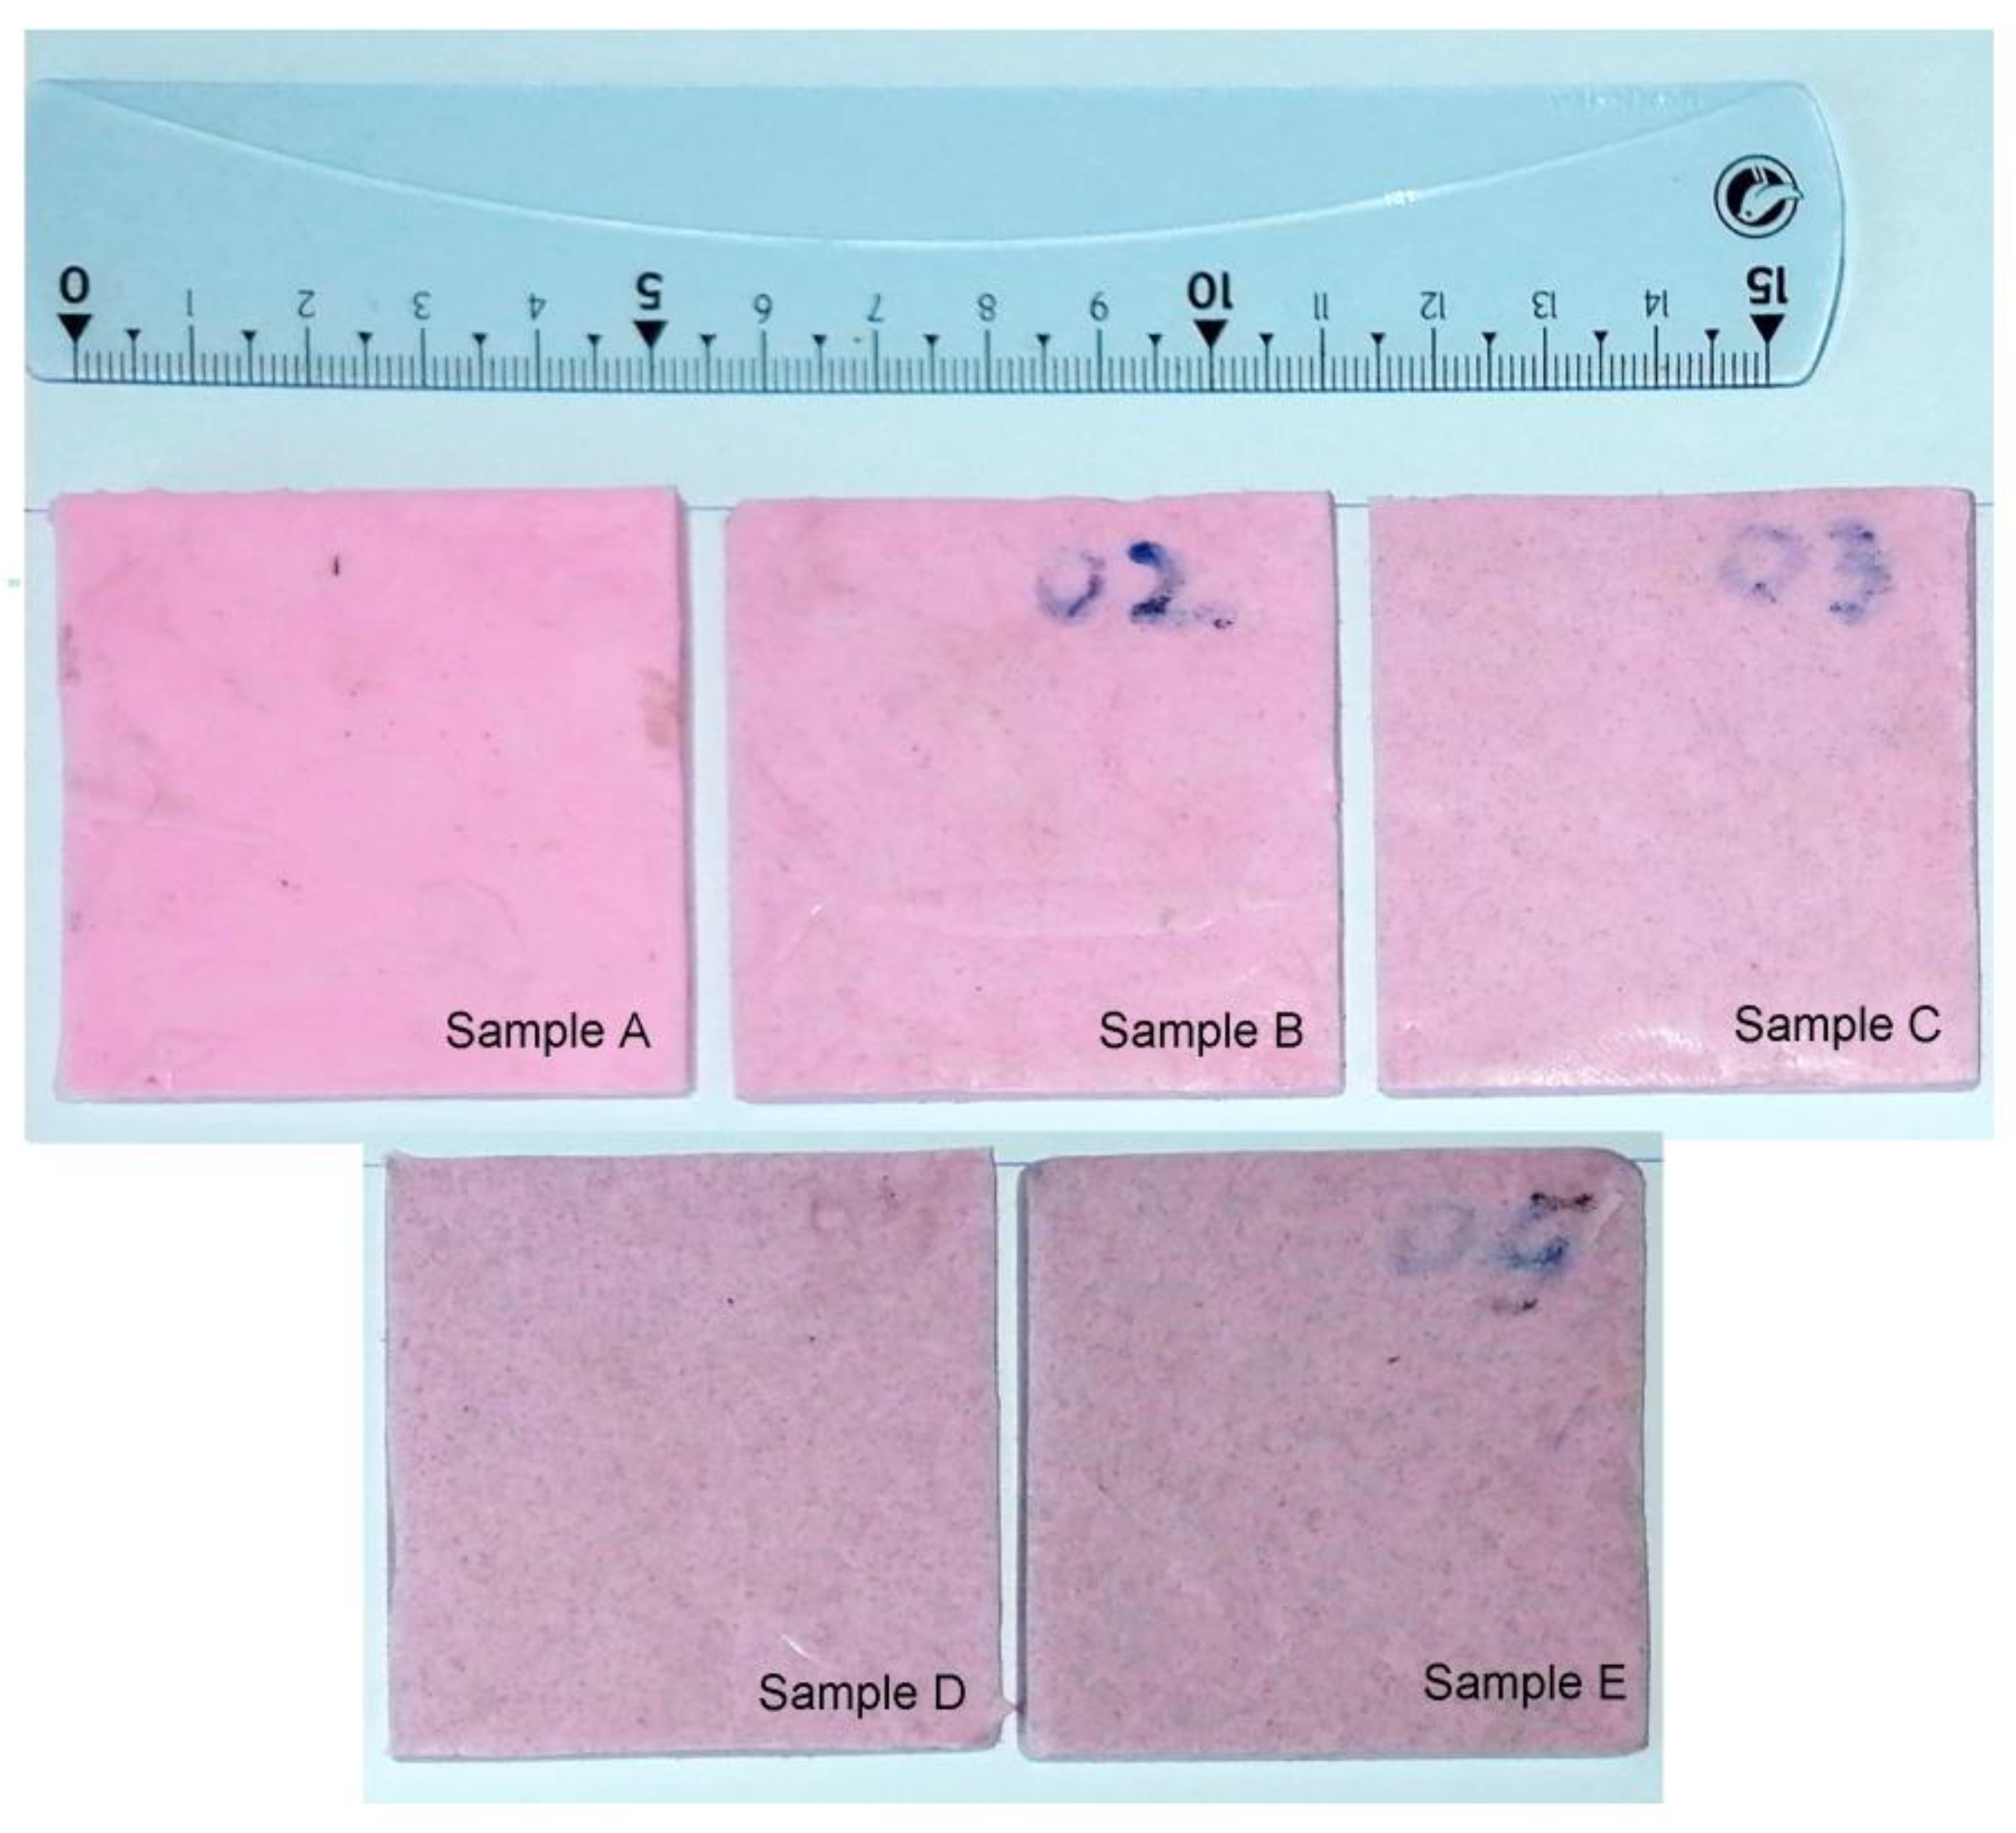
for sample A: and (10 g of each component, A and B);
-
for sample B: and (9.9 g of each component, A and B);
-
for sample C: and (9.8 g of each component, A and B);
-
for sample D: and (9.5 g of each component, A and B);
-
for sample E: and (9 g of each component, A and B).
The obtained composite samples have the shape of a square parallelepiped with a side of 5.5 cm and a thickness of 0.5 cm (Figure 2). Considering the quantities of materials used in the preparation of samples and their densities (ρAl and ρSR), we can determine the total volume of the composite in each case, Vtot = VX,Al + VSR, so that the volume fraction of Al particles dispersed in the silicone rubber is x = VX,Al/Vtot. The x values obtained for each composite sample are: x(A) = 0; x(B) = 0.5%; x(C) = 1%; x(D) = 2.5%; x(E) = 5.1%.
Morphological analysis was performed using the INSPECT S scanning electron microscope (SEM, FEI Europe B.V., Eindhoven, The Netherlands), equipped with an energy-dispersive X-ray detector (EDX).
The samples were introduced in a planar capacitor with circular plates having the diameter of 4 cm and a variable distance d, between the plates, connected to an RLC-meter [23,24]. Figure 3 shows the photograph with the measuring installation. At the room temperature, the real component Z′ and imaginary component Z″ of the complex impedance of each sample were measured. Based on the impedance measurements, the electrical modulus, the electrical conductivity and the complex dielectric permittivity of the samples were determined.

3. Results and Discussion

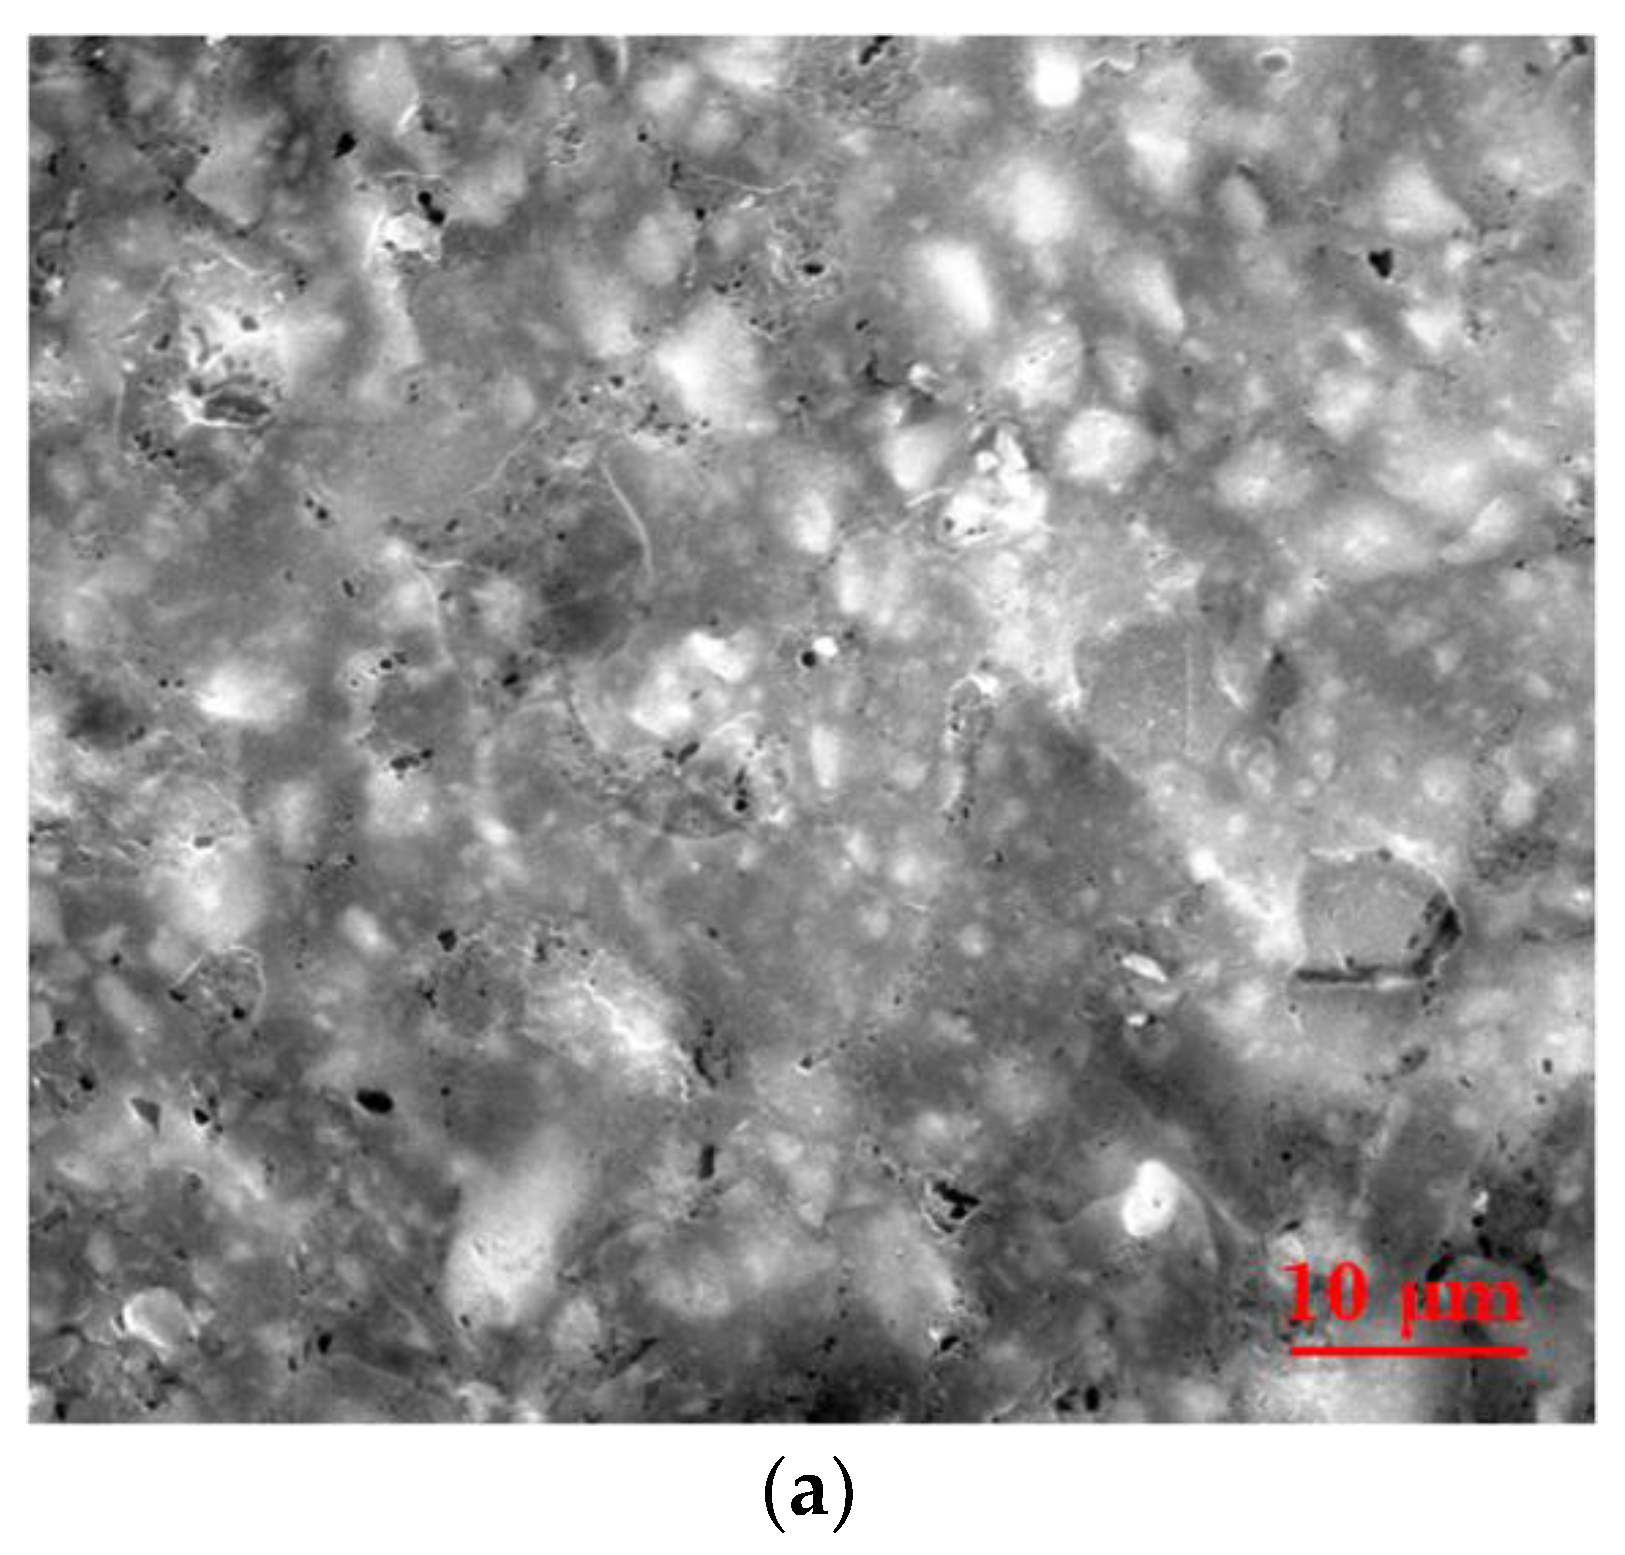
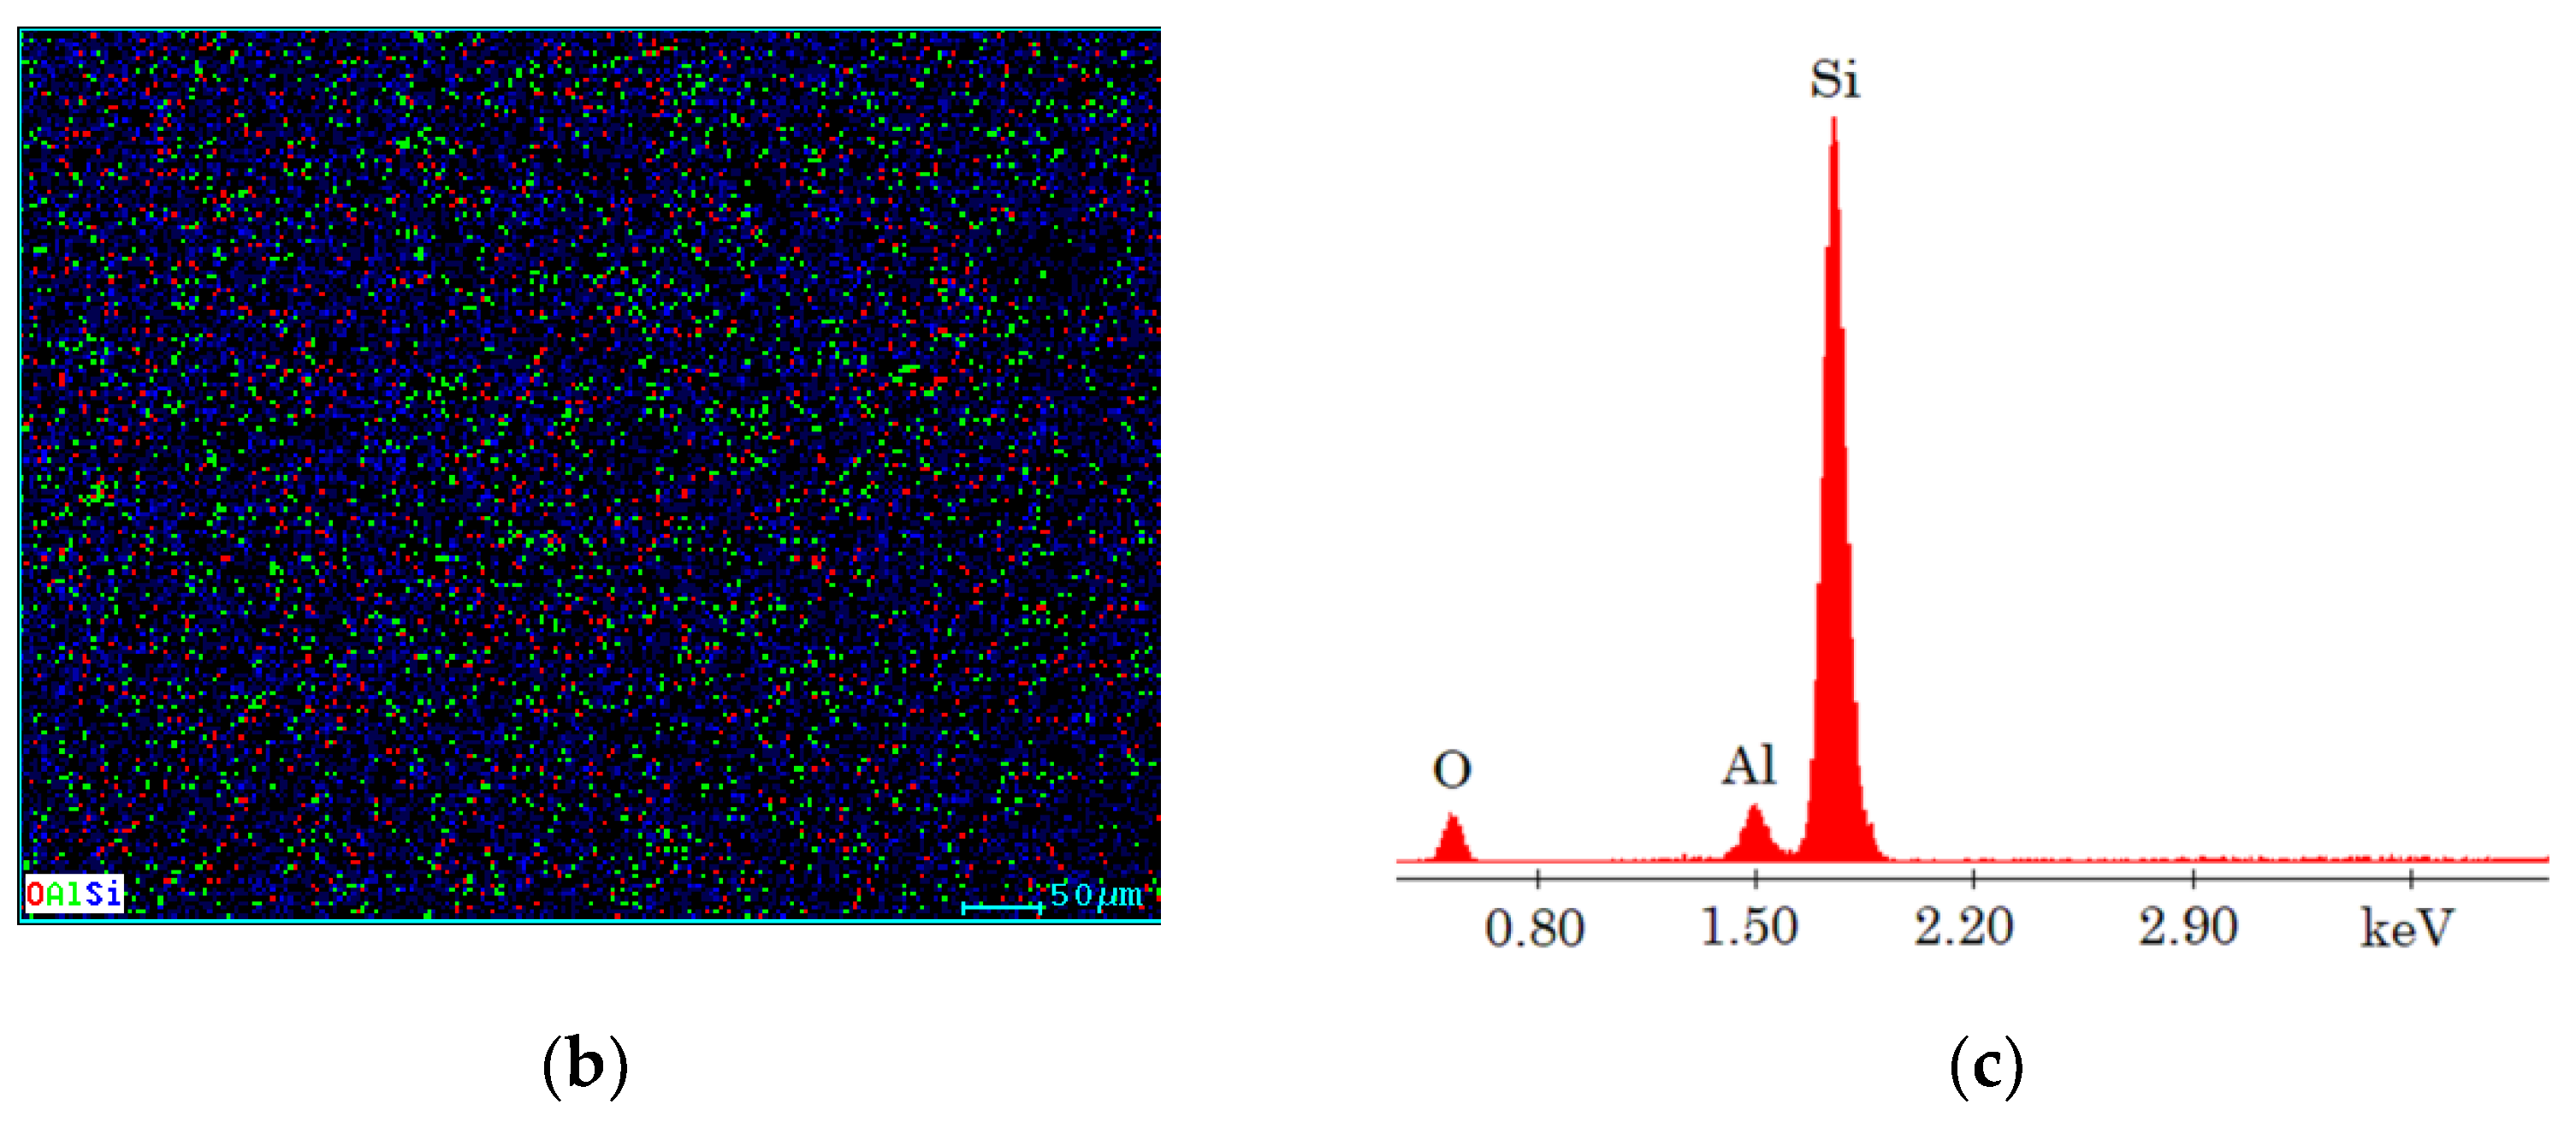
3.1. SEM–EDX Results

The SEM image of sample D, element mapping and EDX spectrum of this sample are presented in Figure 4a–c. From the SEM image (Figure 4a), the presence of Al particles and their agglomerations inside the silicone rubber is observed. Moreover, to evaluate the elemental composition of the composite sample, a semiquantitative analysis was performed by EDX and from this analysis of the EDX spectrum (Figure 4c) it can be observed that the analyzed sample contains the following elements: O, Al and Si. At the same time, from the mapping, uniform distribution of elements in the studied material can be seen (Figure 4b). The SEM investigation of the other samples (B, C and E) leads to similar results (the samples contain O, Al and Si, the Al particles are well distributed in the samples and their agglomerations inside the silicone rubber are observed).

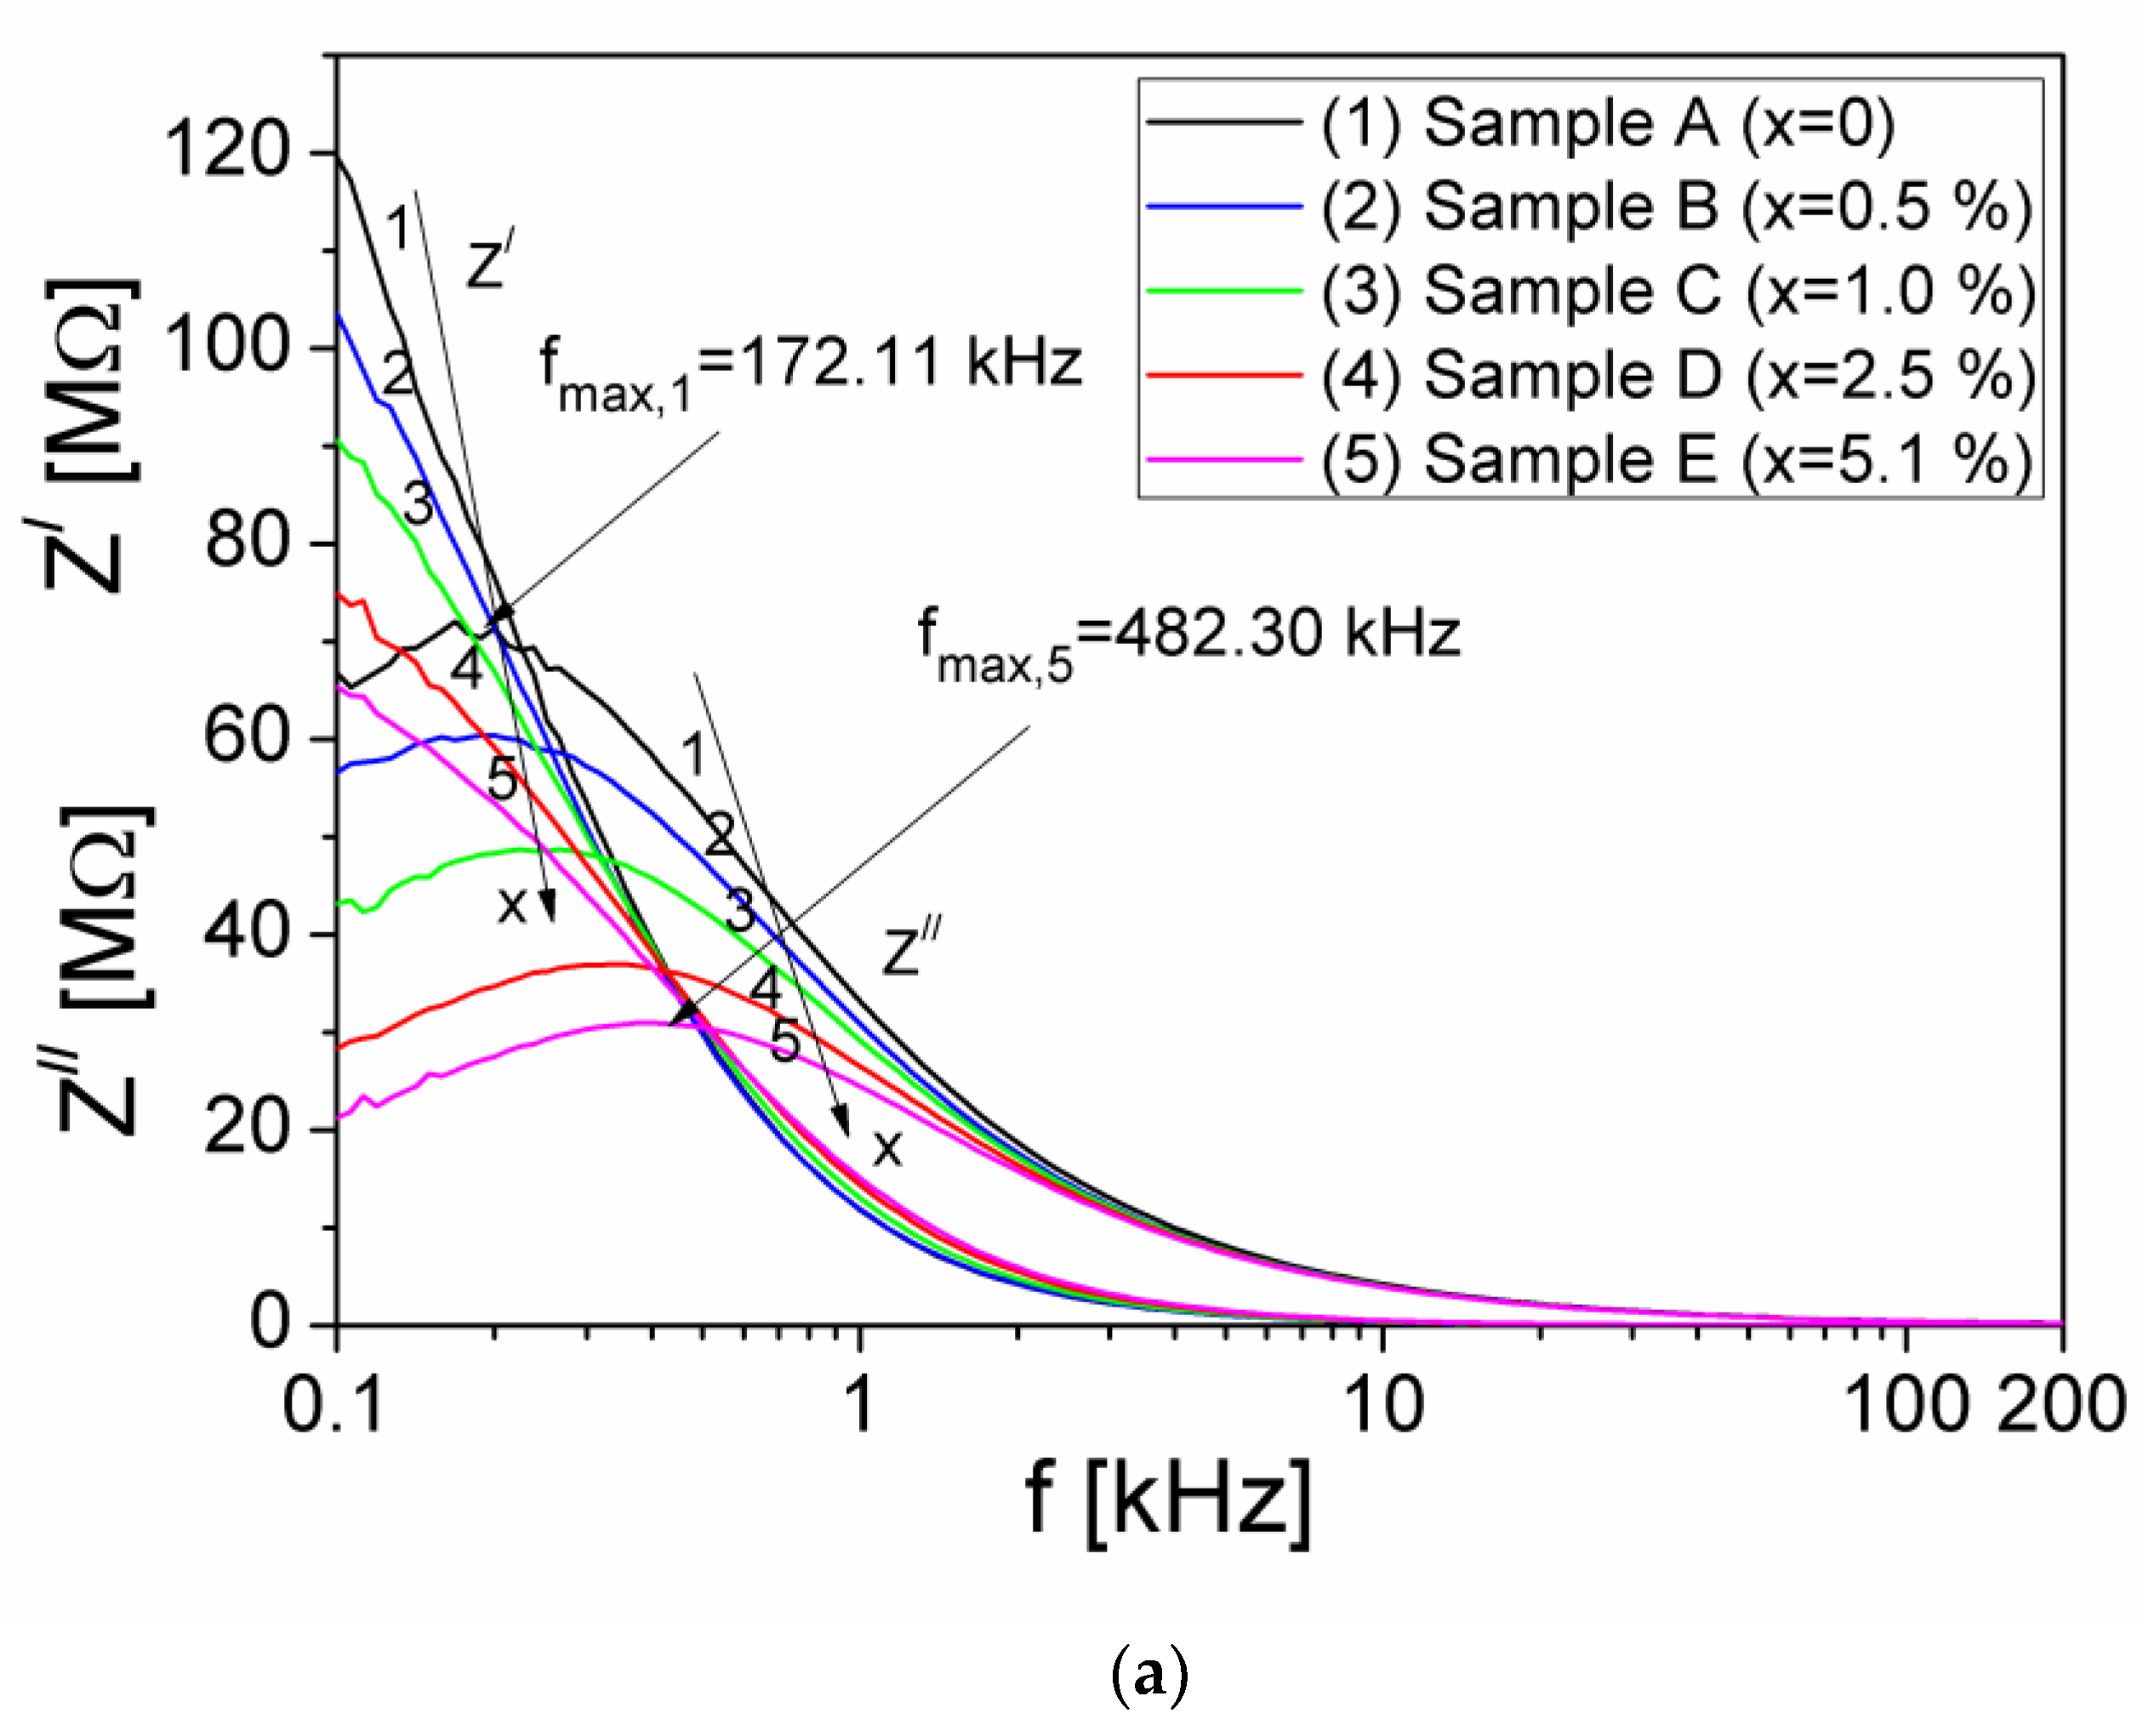
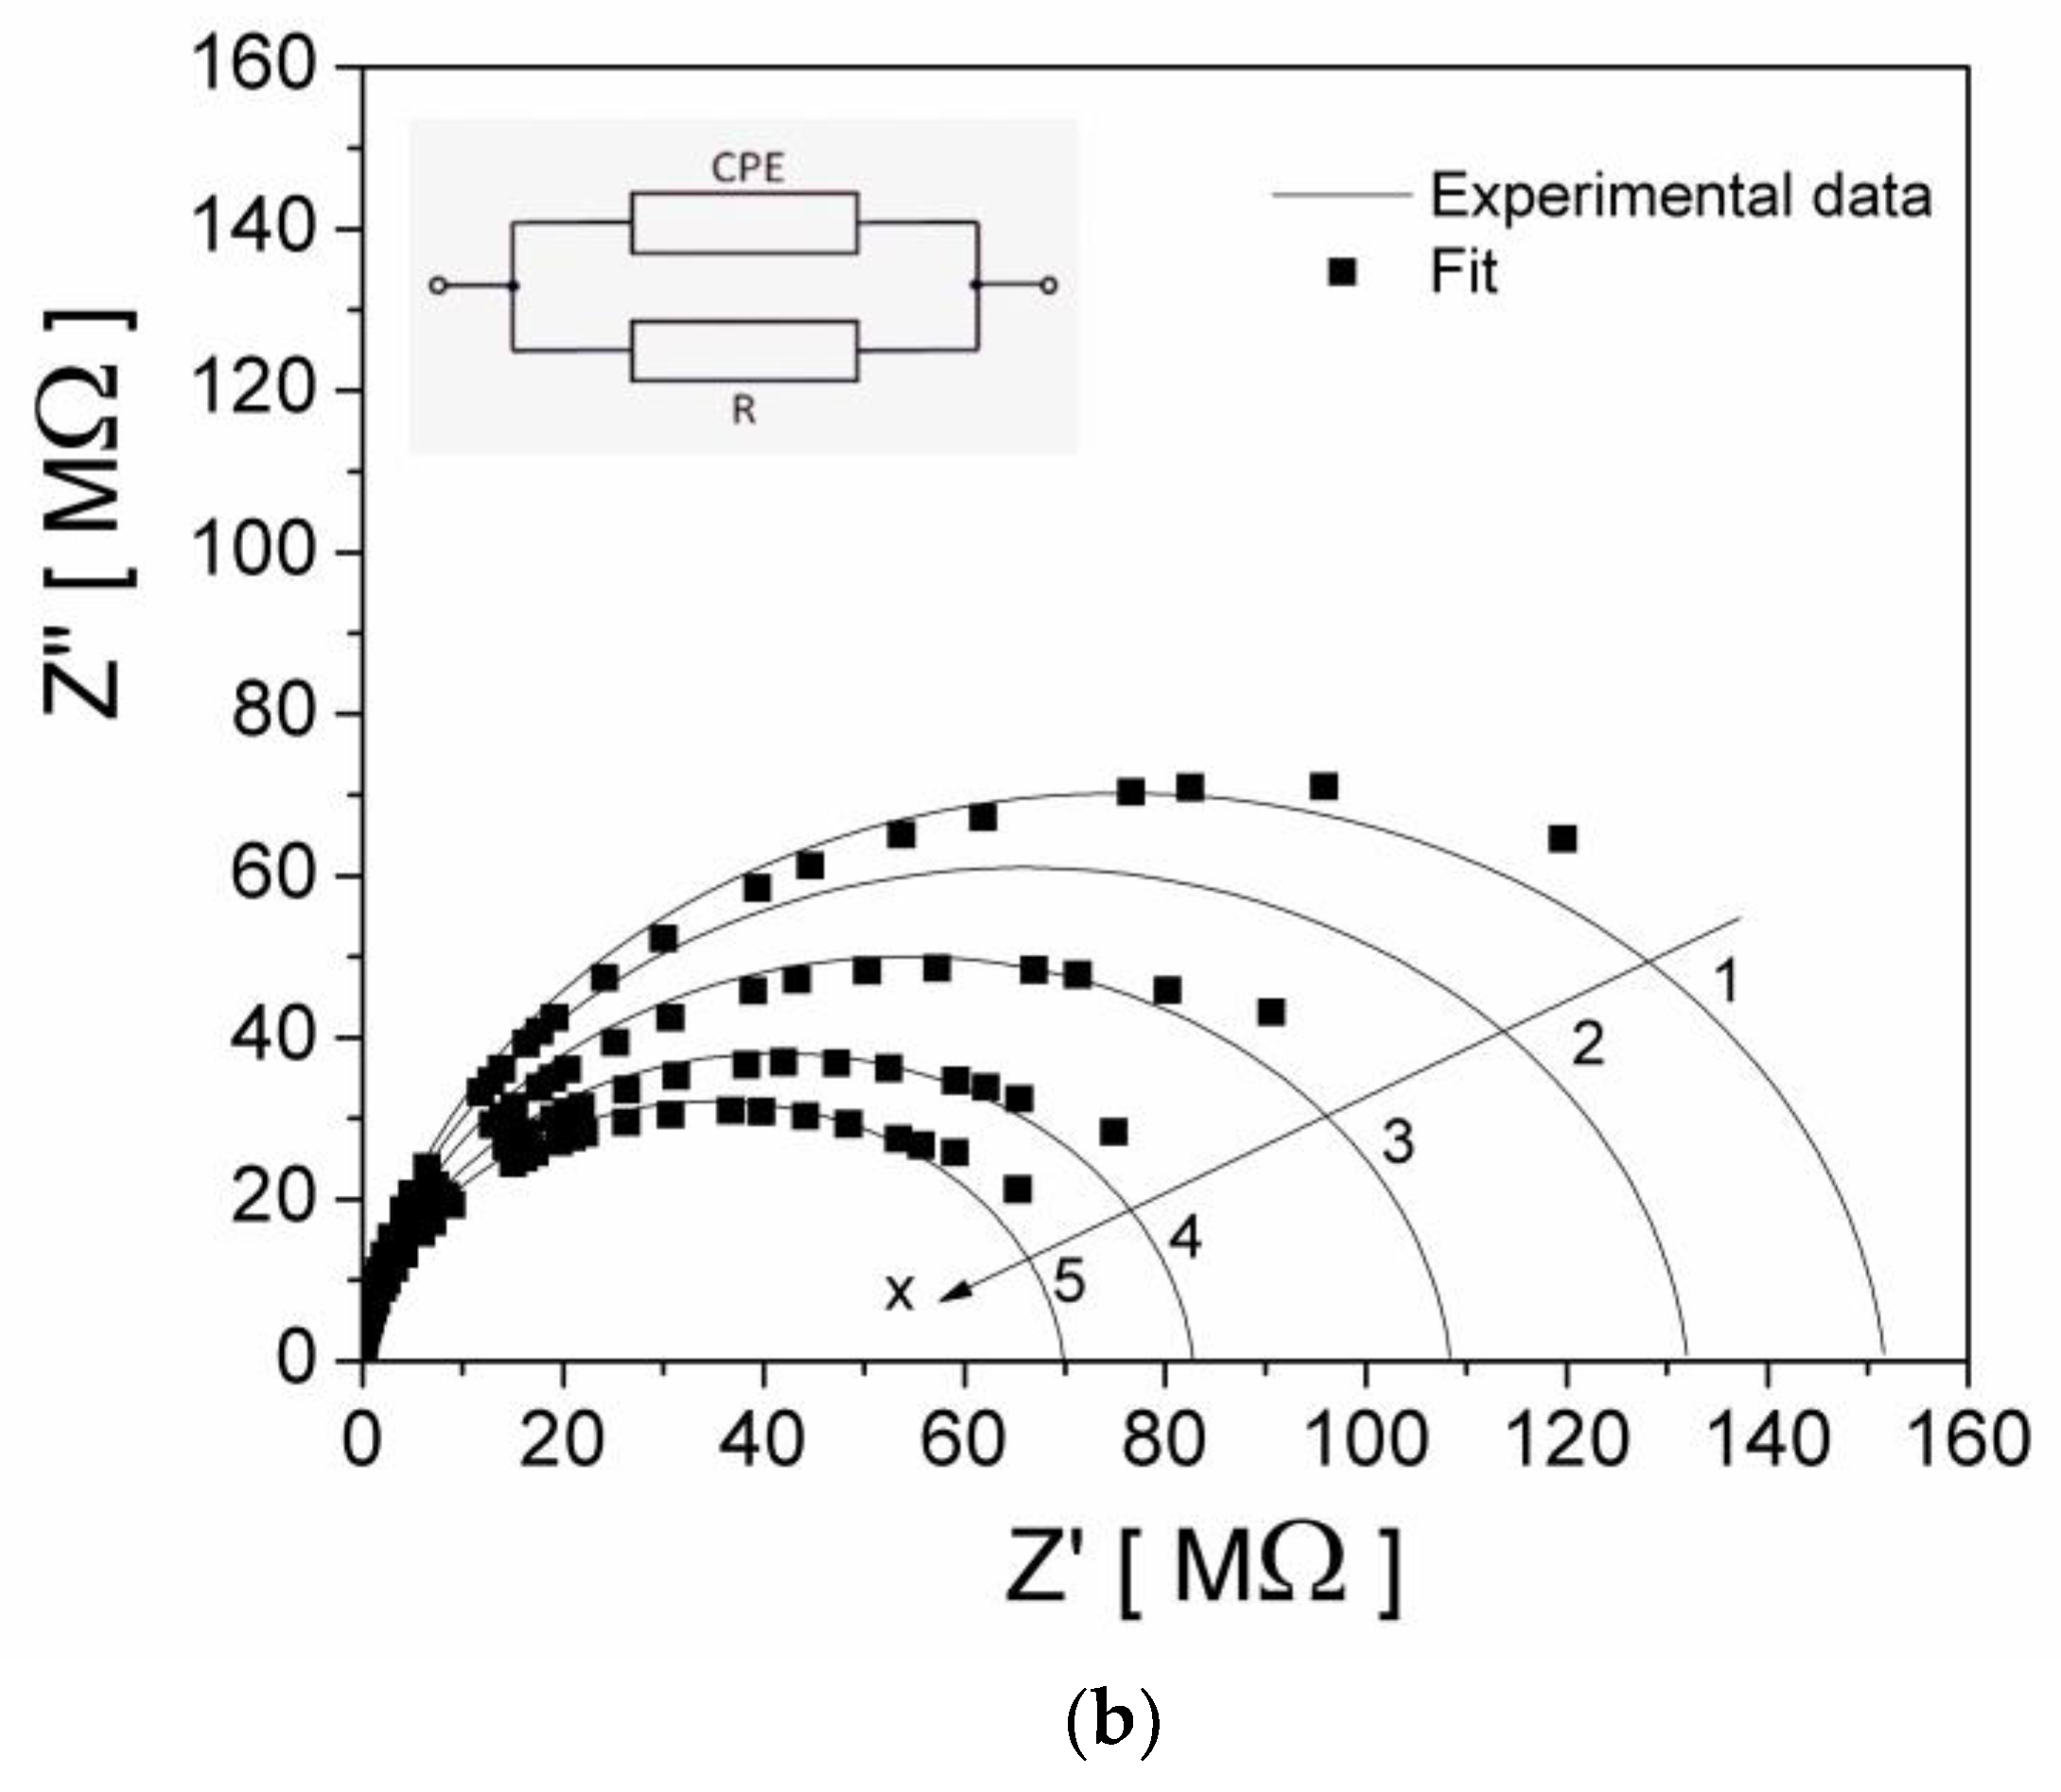
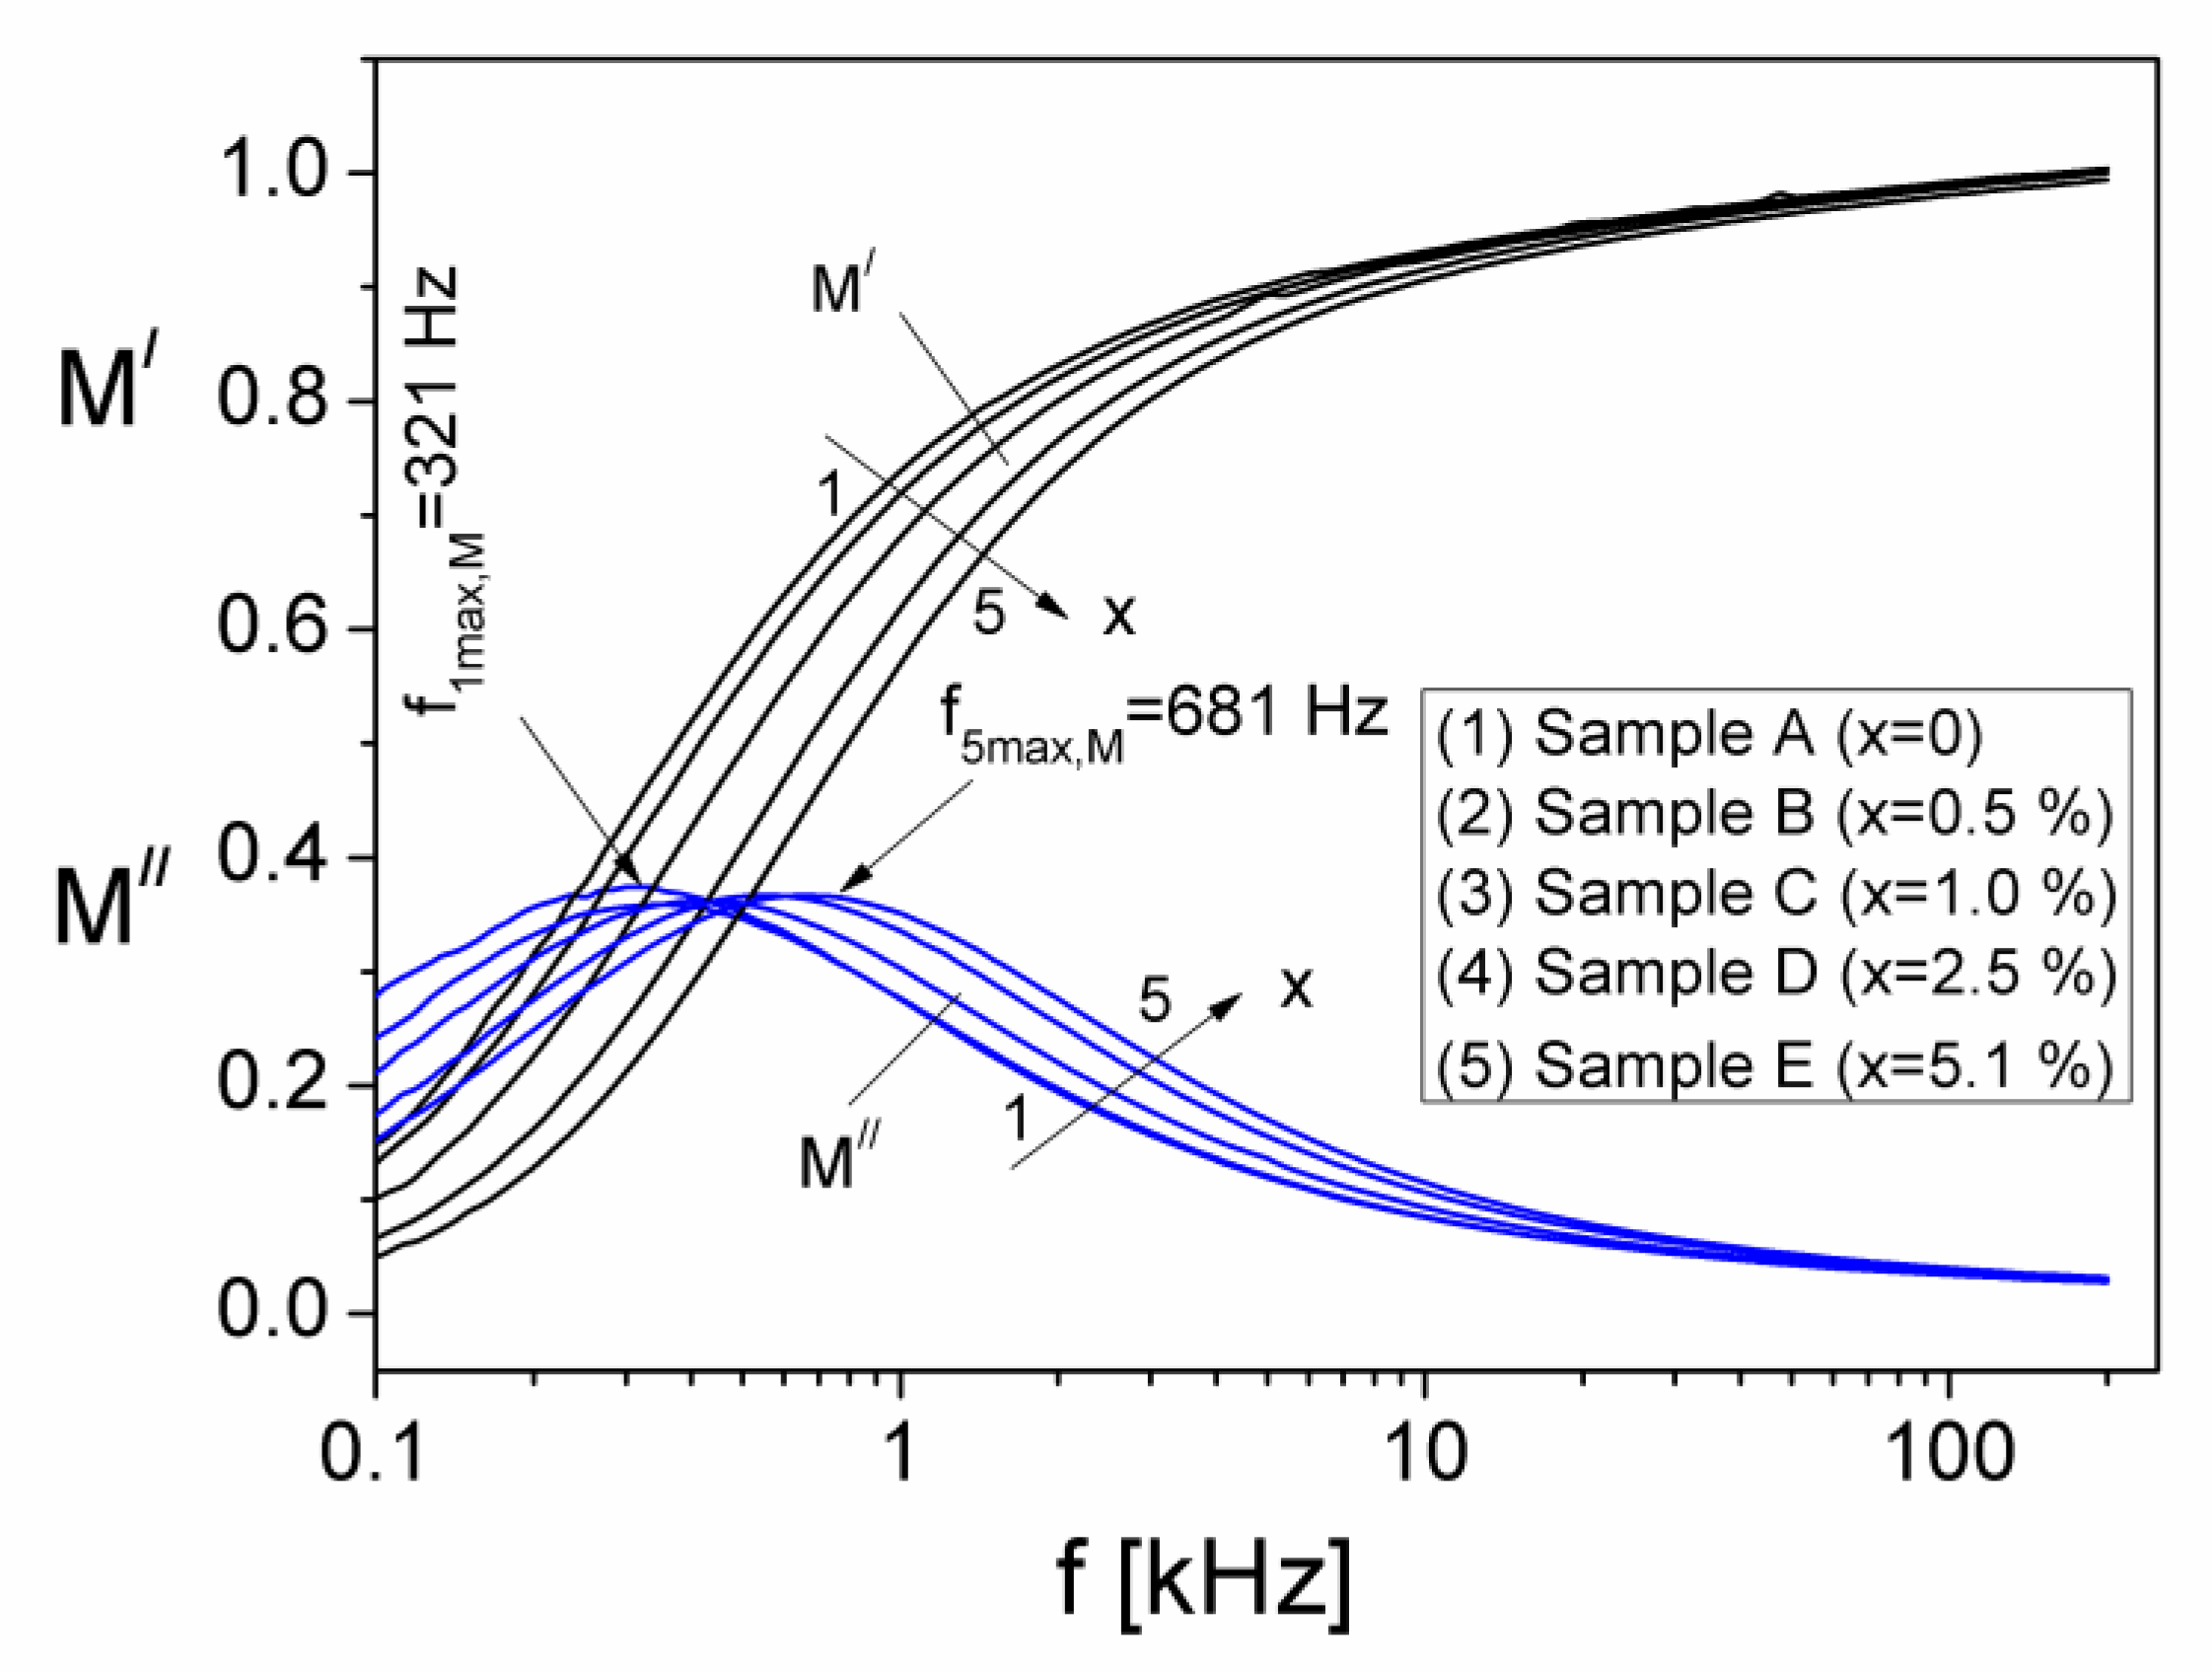
3.2. Complex Impedance and Electrical Modulus

Figure 5a shows the frequency dependence of the real (Z′) and imaginary (Z″) components, of the complex impedance of the composite samples, over the frequency range (100 Hz–200 kHz) and at different volume fractions x, of Al particles dispersed in the silicone rubber and Figure 5b shows the Nyquist representations, Z″(Z′) for each sample in the frequency range investigated.
As can be seen in Figure 5a, at low frequencies up to 1 kHz, the real component Z′ decreases with increasing of the x volume fraction of Al particles from the composite sample. Moreover, at a constant volume fraction x of Al particles and frequencies up to 1 kHz, the real component Z′ decreases rapidly with increasing the frequency, after which it decreases very little, by increasing the frequency up to 200 kHz. The rapid decrease of the Z′ component at frequencies up to 1 kHz for all composite samples (see Figure 5a), may be due to the polarization processes [25] that take place in the composites. This leads to a corresponding increase in the electrical conductivity of the composite sample by increasing the x volume fraction of the Al particles in the composite material.
By increasing the frequency, the charge carriers from samples will no longer be able to follow the rapid oscillations of the electrical field, so that their oscillation will remain behind the electrical field, which determines a slower decrease of the Z′ component [4] of the complex impedance, as can be seen in Figure 5a.
The imaginary component Z″ presents a maximum at a frequency fmax,(Z) which moves towards higher values when the volume fraction, x increases. The appearance of this maximum shows the existence of an electrical relaxation process [5,6] due to the presence of charge carriers in the investigated samples. Using the Debye equation, 2 π   f max , ( Z ) τ Z = 1 [26] and the experimental values of the f max , ( Z ) , from Figure 5a we have computed the relaxation times τ Z , corresponding to each x volume fraction of Al particles from the samples. The obtained values are listed in Table 1.
From Figure 5b, the impedance spectrum or the Nyquist plots are characterized by the appearance of semicircular arcs for all the samples. The diameter of semicircle decreases with the increase the volume fractions x of Al particles, which determines an increase of the σDC electrical conductivity. The existence of a single semicircle for all volume fractions x of Al particles shows that the electrical process in the samples is characterized by a single relaxation mechanism, being correlated with the microstructure of the sample when it is modeled in terms of equivalent electrical circuit [27,28]. The experimental data of the Nyquist plots, Z″(Z′) from Figure 5b, for the investigated samples were fitted with a theoretical dependence, Z″(Z′), and the best fit of these plots was given by an electrical model, presented in the inset of Figure 5b. This electrical model, corresponding to each sample, consists of a parallel group of R-CPE (R-CPE stands for Resistor—Constant Phase Element), being in accordance with the microstructure of samples. The parameters of the fit for each sample are shown in Table 1, where R represents the parallel resistance, whilst P and k are parameters of the impedance of CPE, corresponding to each sample, given by the equation: Z C P E = P 1 ( i 2 π f ) k , where i = 1 .
From the Table 1, it is observed a decrease of the relaxation time τZ by increasing the volume fraction of Al particles in the samples, from 0% to 5.10%.
To investigate the relaxation mechanism of electrical conduction in the samples, another important parameter that can be used is the electrical modulus, M, whose real (M′) and imaginary (M″) components can be determined based on the experimental measured values Z and Z″ of the complex impedance (see Figure 4) with the relations [27]:
M = ( ω ε 0 A d ) Z
M = ( ω ε 0 A d ) Z
Here, d and A are the dimensions of the sample in the capacitor (thickness d = 5 mm and the transversal sectional area, A = 12.56 cm2), ω is the angular frequency of the electric field and ε0 is the free space permittivity. The analysis based on the electrical modulus provides a better separation between dielectric relaxation and electrical conduction losses than the analysis based solely on dielectric permittivity [29,30].
In Figure 6 we have shown the frequency dependence of the components M′ and M″, at different volume fractions, x of Al particles, from the samples. From Figure 6 it can be observed that at low frequency, M′ is small for all x volume fractions of the Al particles dispersed in the silicone rubber, which shows that the polarization effects at interface electrode/sample are reduced [30,31]. At each volume fraction x, M′ increases continually and tends to a constant value of 0.98 by increasing the frequency of the electrical field. At the same time, by increasing the frequency, the magnitude of M′ decreases slightly with increasing x, which may be attributed to an Al concentration dependent relaxation process in the composite samples. The imaginary component M″ presents a maximum for each volume fraction, x, corresponding to a relaxation frequency, fmax,(M) which moves from 321 Hz to 681 Hz when x increases from x = 0 to x = 5.1%, which shows a shift towards frequencies greater than the frequencies corresponding of the maximum fmax,(Z) of the imaginary component Z″, of the complex impedance [32], as can be seen in Figure 7.
Using the experimental values of the fmax,(M) and Debye equation, we have computed the relaxation times, τ M corresponding to each volume fraction x, of Al particles dispersed in the samples. The obtained values are listed in Table 1.

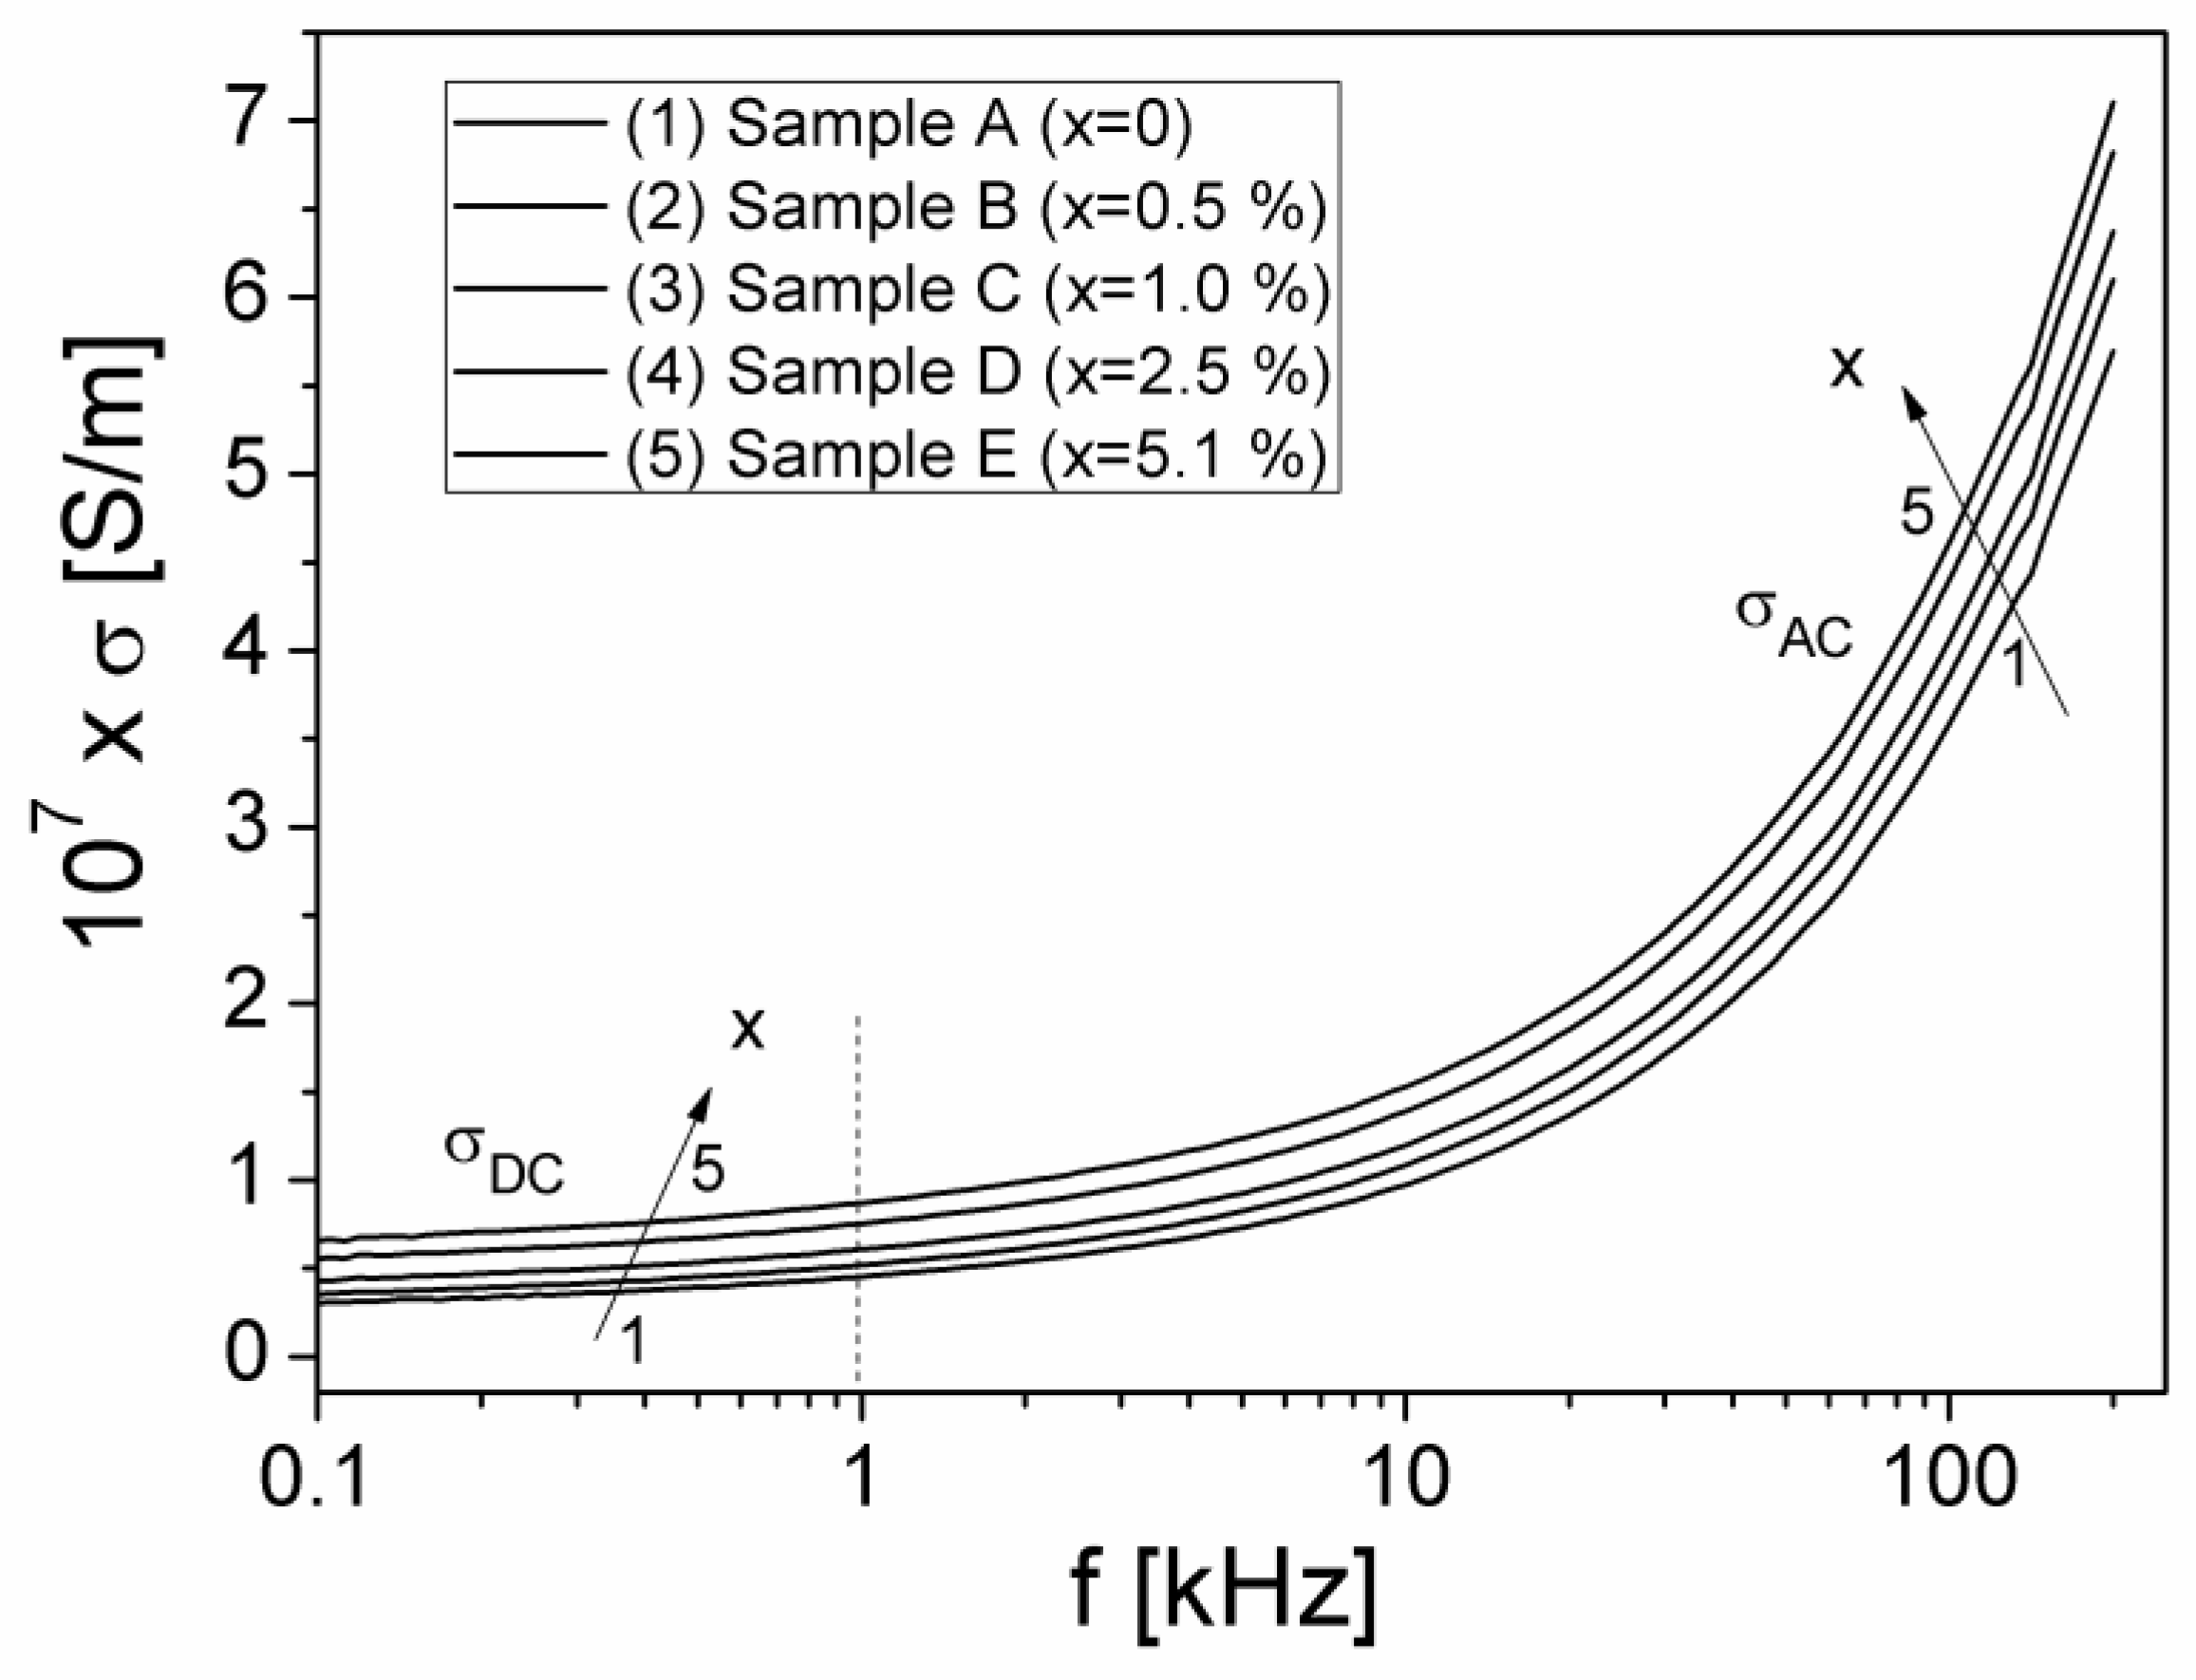
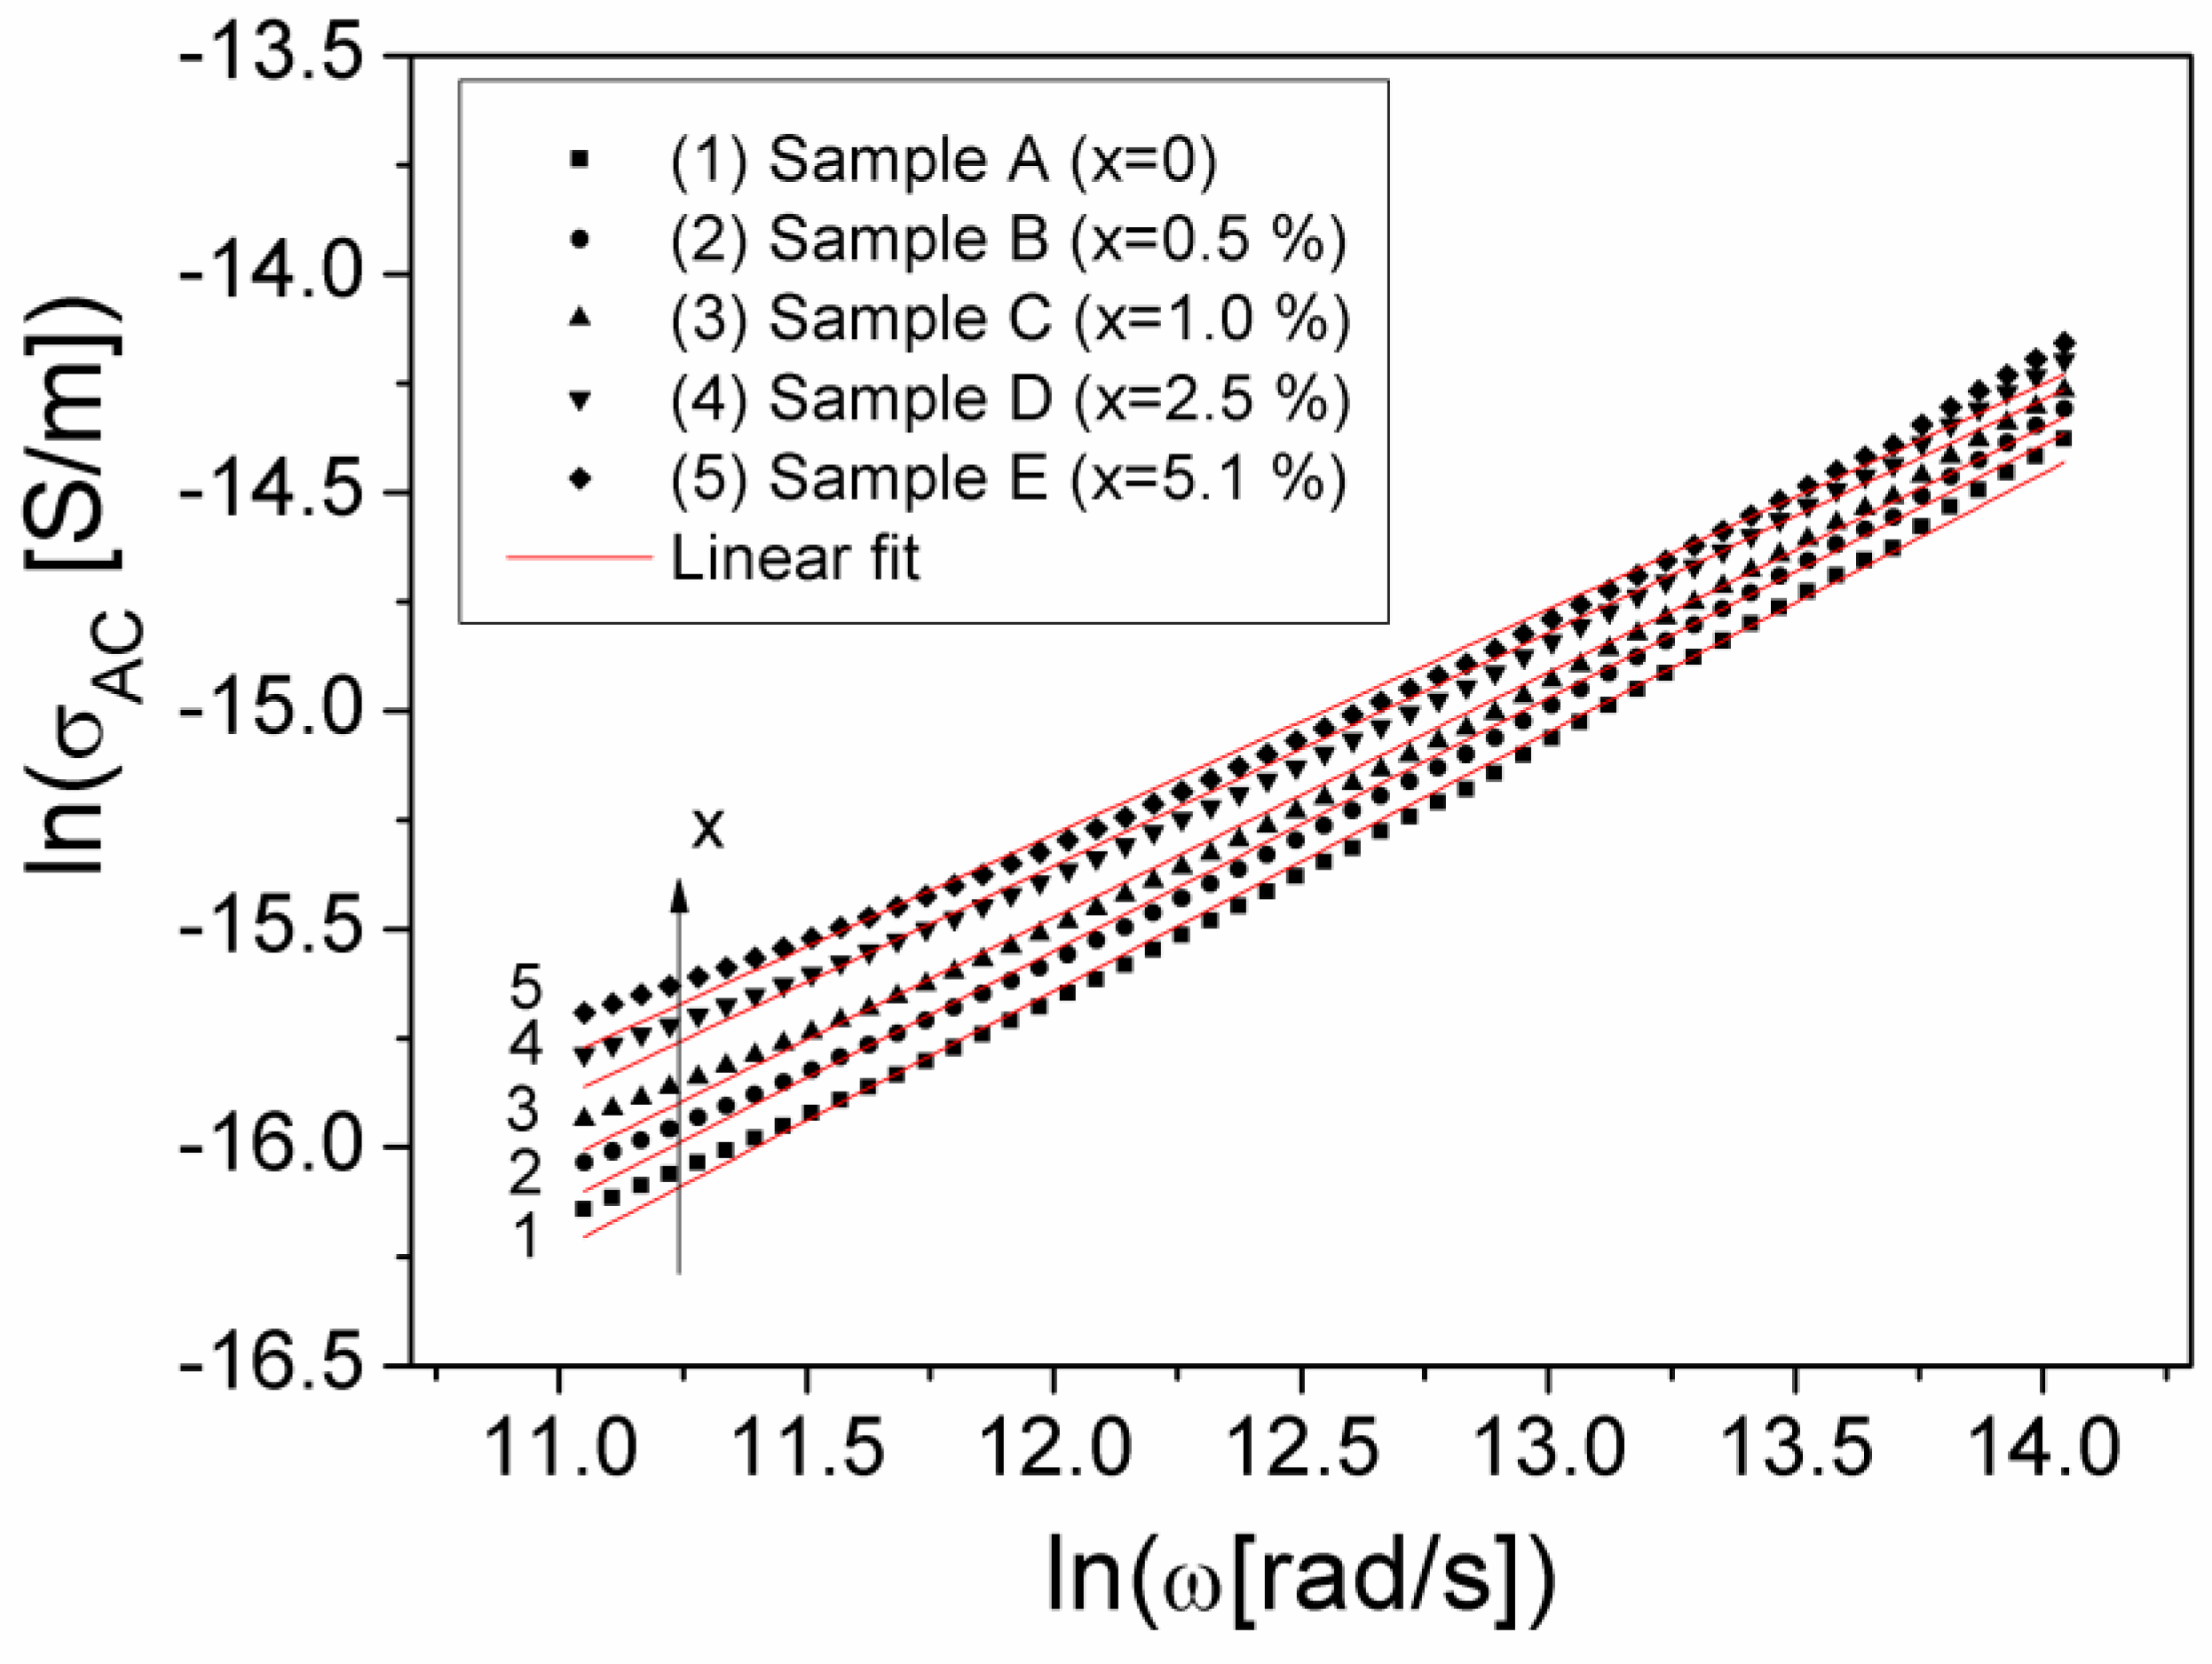
3.3. The Electrical Conductivity

Using the experimental values Z′ and Z″ of the complex impedance (Figure 5), the electrical conductivity σ, of the composite samples was computed with the relation (3), where, | Z | = Z 2 + Z 2 , is the complex impedance modulus of the sample.
σ = Z | Z | 2 d A
The frequency dependence of σ, in the frequency range 100 Hz to 200 kHz and at different volume fractions x of the Al particles dispersed in the composite material, is shown in Figure 8.
As can be seen from Figure 8, at a constant volume fraction x, the conductivity spectrum, σ(f) consists of two regions: (1) a region in which σ tends to a constant value by decreasing the frequency (at very low frequencies, σ does not depend on frequency) corresponding to DC-conductivity (σDC); (2) a dispersion region, where σ rapidly increases with frequency, corresponding to AC-conductivity (σAC). A similar frequency dependence σ(f) was also observed for other composite samples, such as Cu1+xMn1-xO2 type composite materials (with x = 0–0.10) [33], or polymers of PTB7 type [34]. This behavior is in accordance with the Jonscher universal law [35]:
σ ( ω ) = σ D C + σ A C
As seen in Figure 8, in the first region of the low frequency range, the measured conductivity decreases slowly by the decrease of frequency, tending to a constant value, which will not depend on the frequency, representing the DC component of conductivity (σDC) according with the Jonscher universal law [35]. The numerical values of the DC conductivity were determined based on the Nyquist impedance diagrams, Z″(Z′) in Figure 5b) and the fit parameters (see Table 1) corresponding to the equivalent electrical model for each sample [34,36]. As a result, the values thus obtained for σDC are listed in Table 1. It is observed that the variation of volume fraction from x = 0 to x = 5.1%, leads to an increase in the conductivity of the samples from 2.637·10−8 S/m to 5.725·10−8 S/m. The values obtained for the DC-conductivity were compared with the values obtained by other authors in the paper [17], for reinforced silicone rubber composites sampled with Al particles, being of the same order of magnitude.
The AC-conductivity component ( σ A C ) depends on frequency, being correlated with the relaxation processes determined by the localized electric charge carriers from sample [35], and is given by the relation:
σ A C = A 0 ω n
Here, n is an exponent, which is dependent on both frequency and temperature (0 < n < 1) and A0 is a pre-exponential factor [37]. Taking into account Equations (4) and (5), another form of Jonscher’s universal law can be written:
σ ( ω ) = σ D C + A 0 ω n = σ D C [ 1 + ( ω ω c ) n ]
Here, ω c represents the crossover frequency and the pre-exponential factor is A 0 = ω c n σ D C [35,37]. On the other hand, ω c represents the frequency of transition from the DC regime to the dispersive regime (from high frequencies), according to Jonscher’s universal law [35].
By the logarithm of Equation (5), a linear dependence between lnσAC and lnω results, which is presented in Figure 9 for the investigated samples.
The experimental dependence ln(σAC)(ln(ω)), from Figure 9, was fitted with a straight line, thus being able to determine both the parameter A0 and the exponent n, corresponding to each sample, the obtained values being showed in Table 1. From Table 1, it is observed that the exponent n decreases slightly, from 0.593 for sample A (x = 0) to 0.515 for sample E (x = 5.1%). This low variation of n indicates a constant dispersion of σAC conductivity with frequency by increasing the volume fraction of Al particles from samples (see Figure 8). Taking into account the values obtained for A0 and n, as well as the conductivity σDC, we determined the crossover frequency, ωc corresponding to each volume fraction of Al particles in the composite samples, the values obtained being presented in Table 1.
It is known that in the electrical conduction mechanism by hopping of charge carriers [38,39] and based on the Mott’s variable-range-hopping (VRH) model [40], the relationship between the conductivity σDC and the hopping frequency, ωc, is given by:
σ D C = ( N C e 2 R h 2 12 π k B T ) ω c
Here, e is the electric charge of the electron; NC is the effective concentration of charge carriers [40,41] from the sample; kB is the Boltzmann constant: T is the absolute temperature and Rh is the hopping distance [39]. From the VRH model, the hopping distance is given by:
R h = ( 9 8 α k B T N ( E F ) ) 1 / 4
In Equation (8), α 10 7   c m 1 represents the degree of localization [39] and N(EF) is the density of the localized states at the Fermi level EF [40,41]. Taking into account that NC and N(EF) are correlated by the relation, N C = k B T N ( E F ) [41,42] and using Equations (7) and (8) we established the following equation that allows the determination of the hopping distance based on electrical conductivity measurements:
R h = 3 4 ( e 2 ω c 6 π α k B T σ D C ) ) 1 / 2
Considering the obtained values for ω c and σ D C (see Table 1) and room temperature T = 300 K, with Equation (9) we have computed the hopping distance Rh corresponding to each sample, and the obtained values are shown in Table 1. From Table 1, it is observed that the hopping distance, Rh, decreases with the increase in Al particles’ volume fraction in the samples, from 7.30 nm (for x = 0) to 5.92 nm (for x = 5.1%). Moreover, one can observe that for all samples, the hopping distance Rh is smaller than the Al particles’ size (that are in the order of micrometers), which means that the conduction mechanism in low frequencies is realized by the hopping process between the localized states within the silicon rubber or between the localized states at the Al particles’ surfaces.

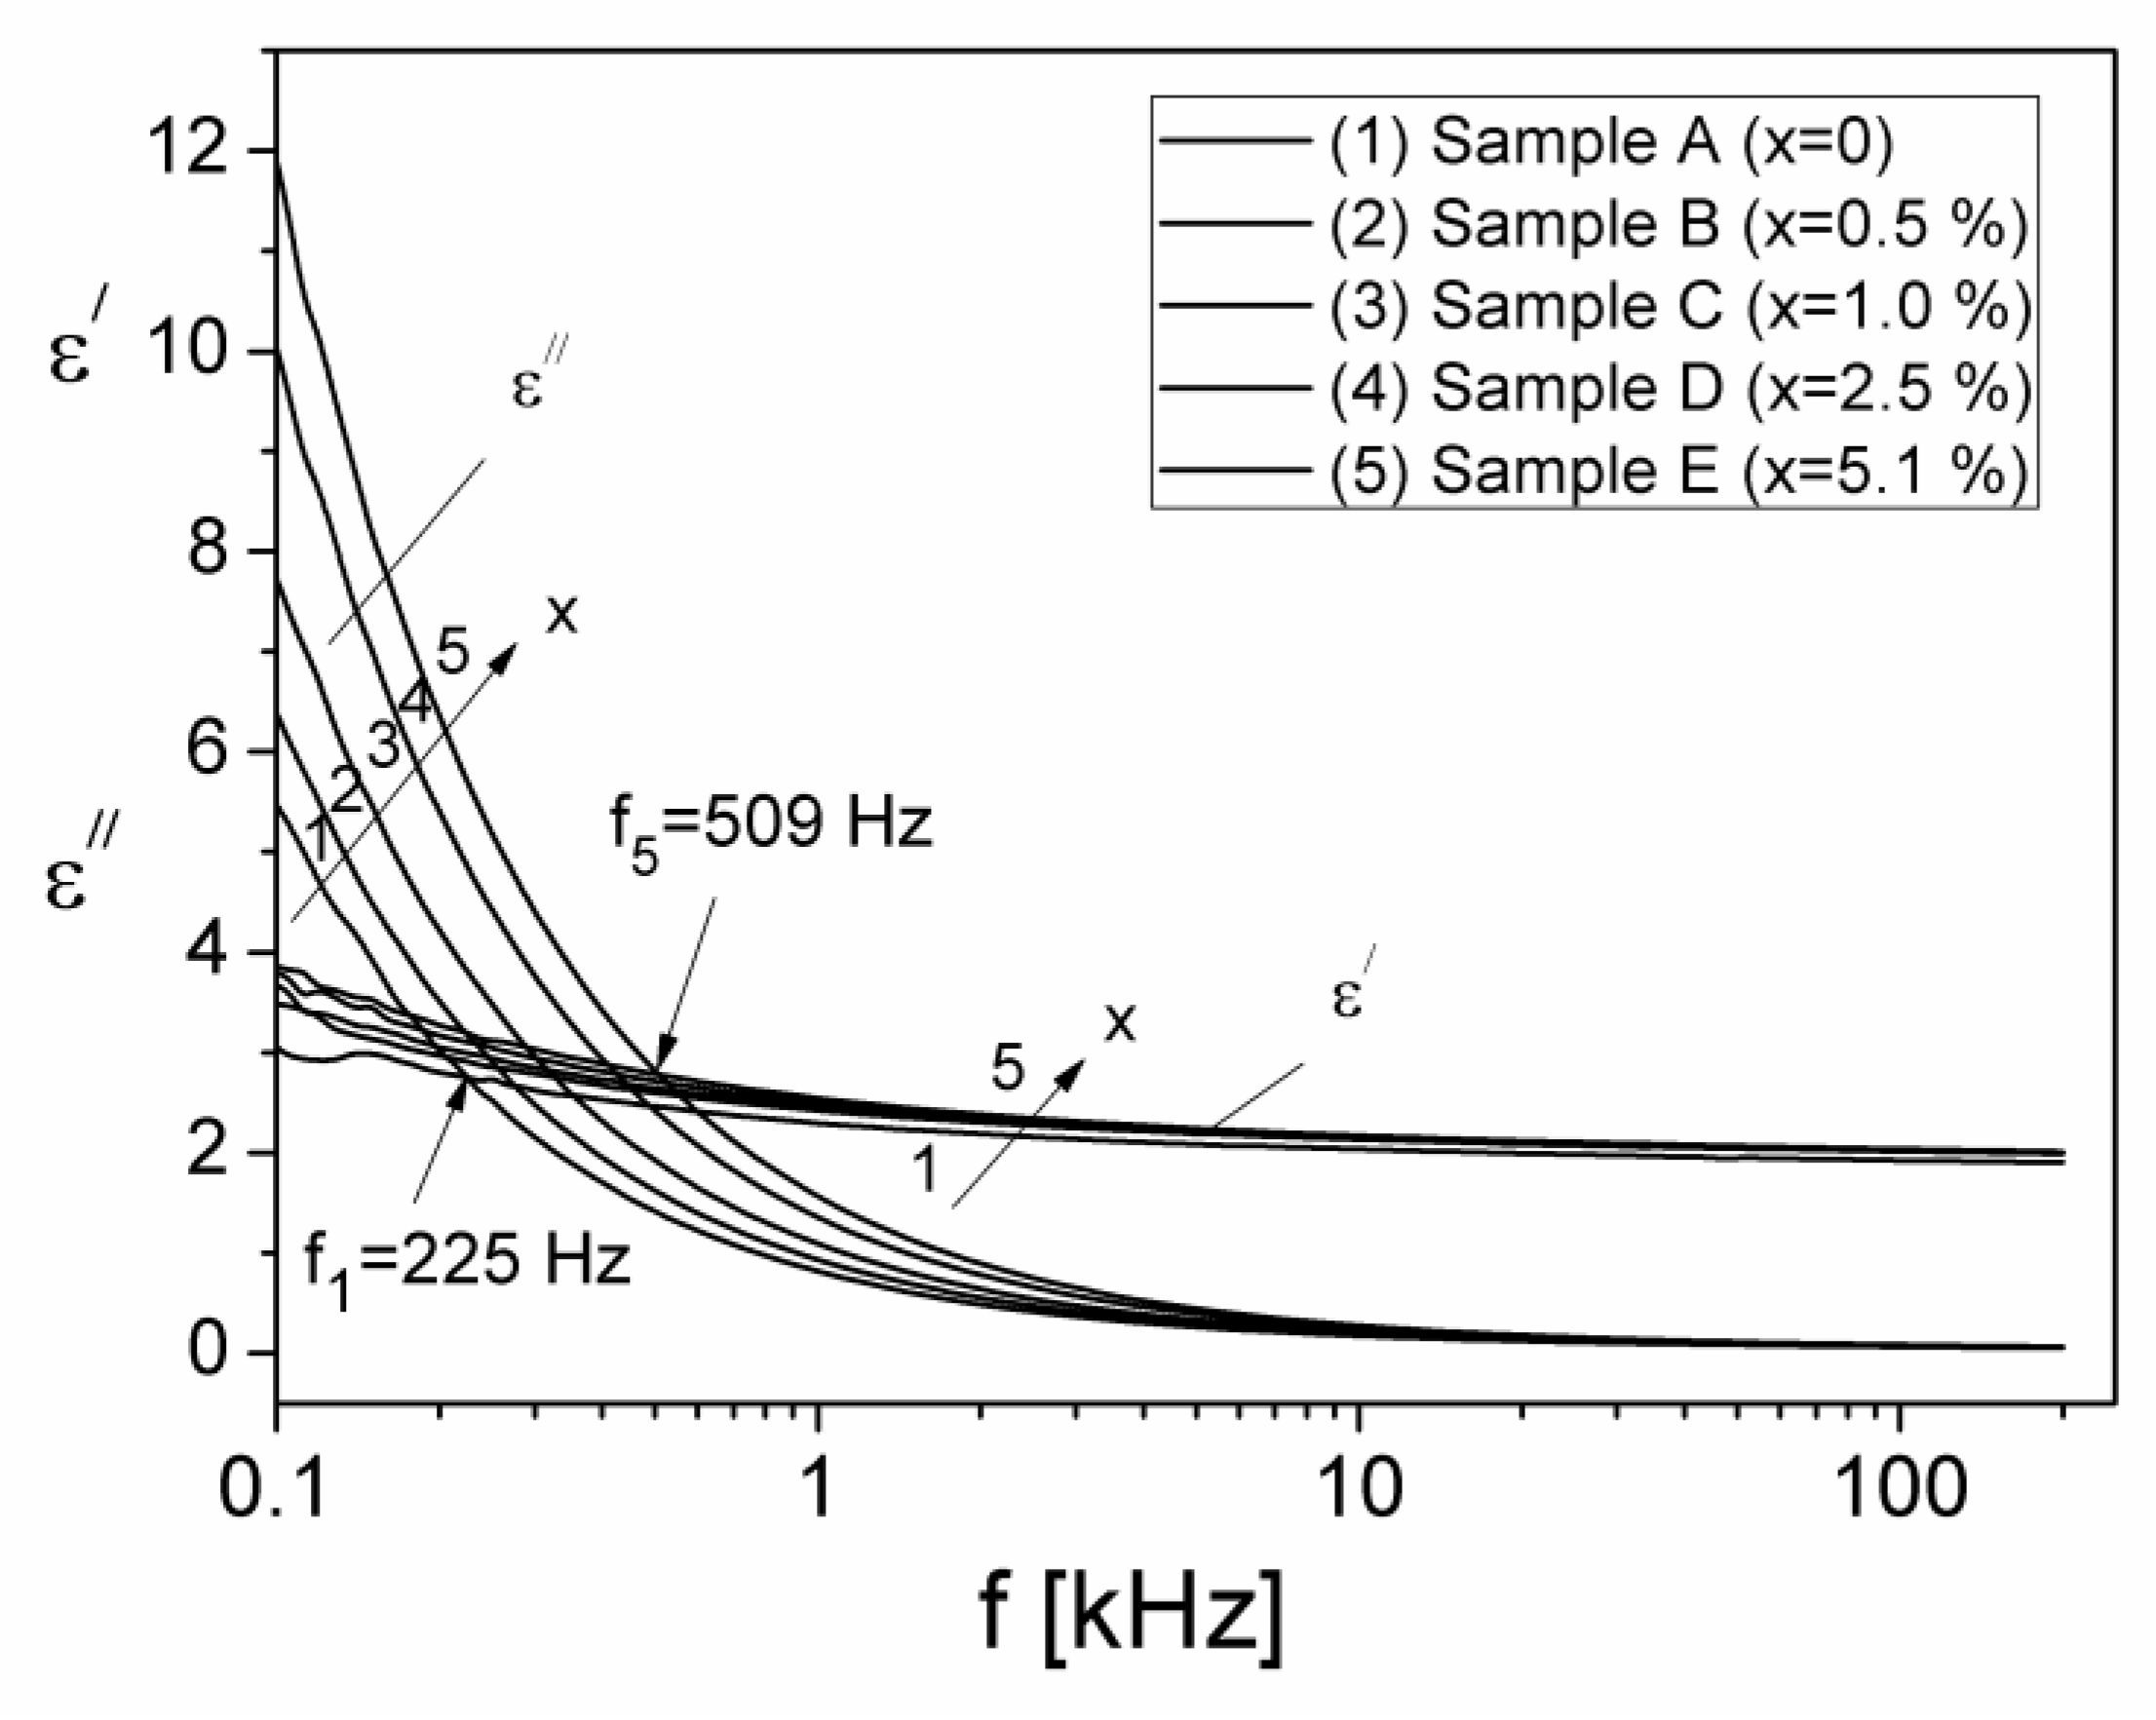
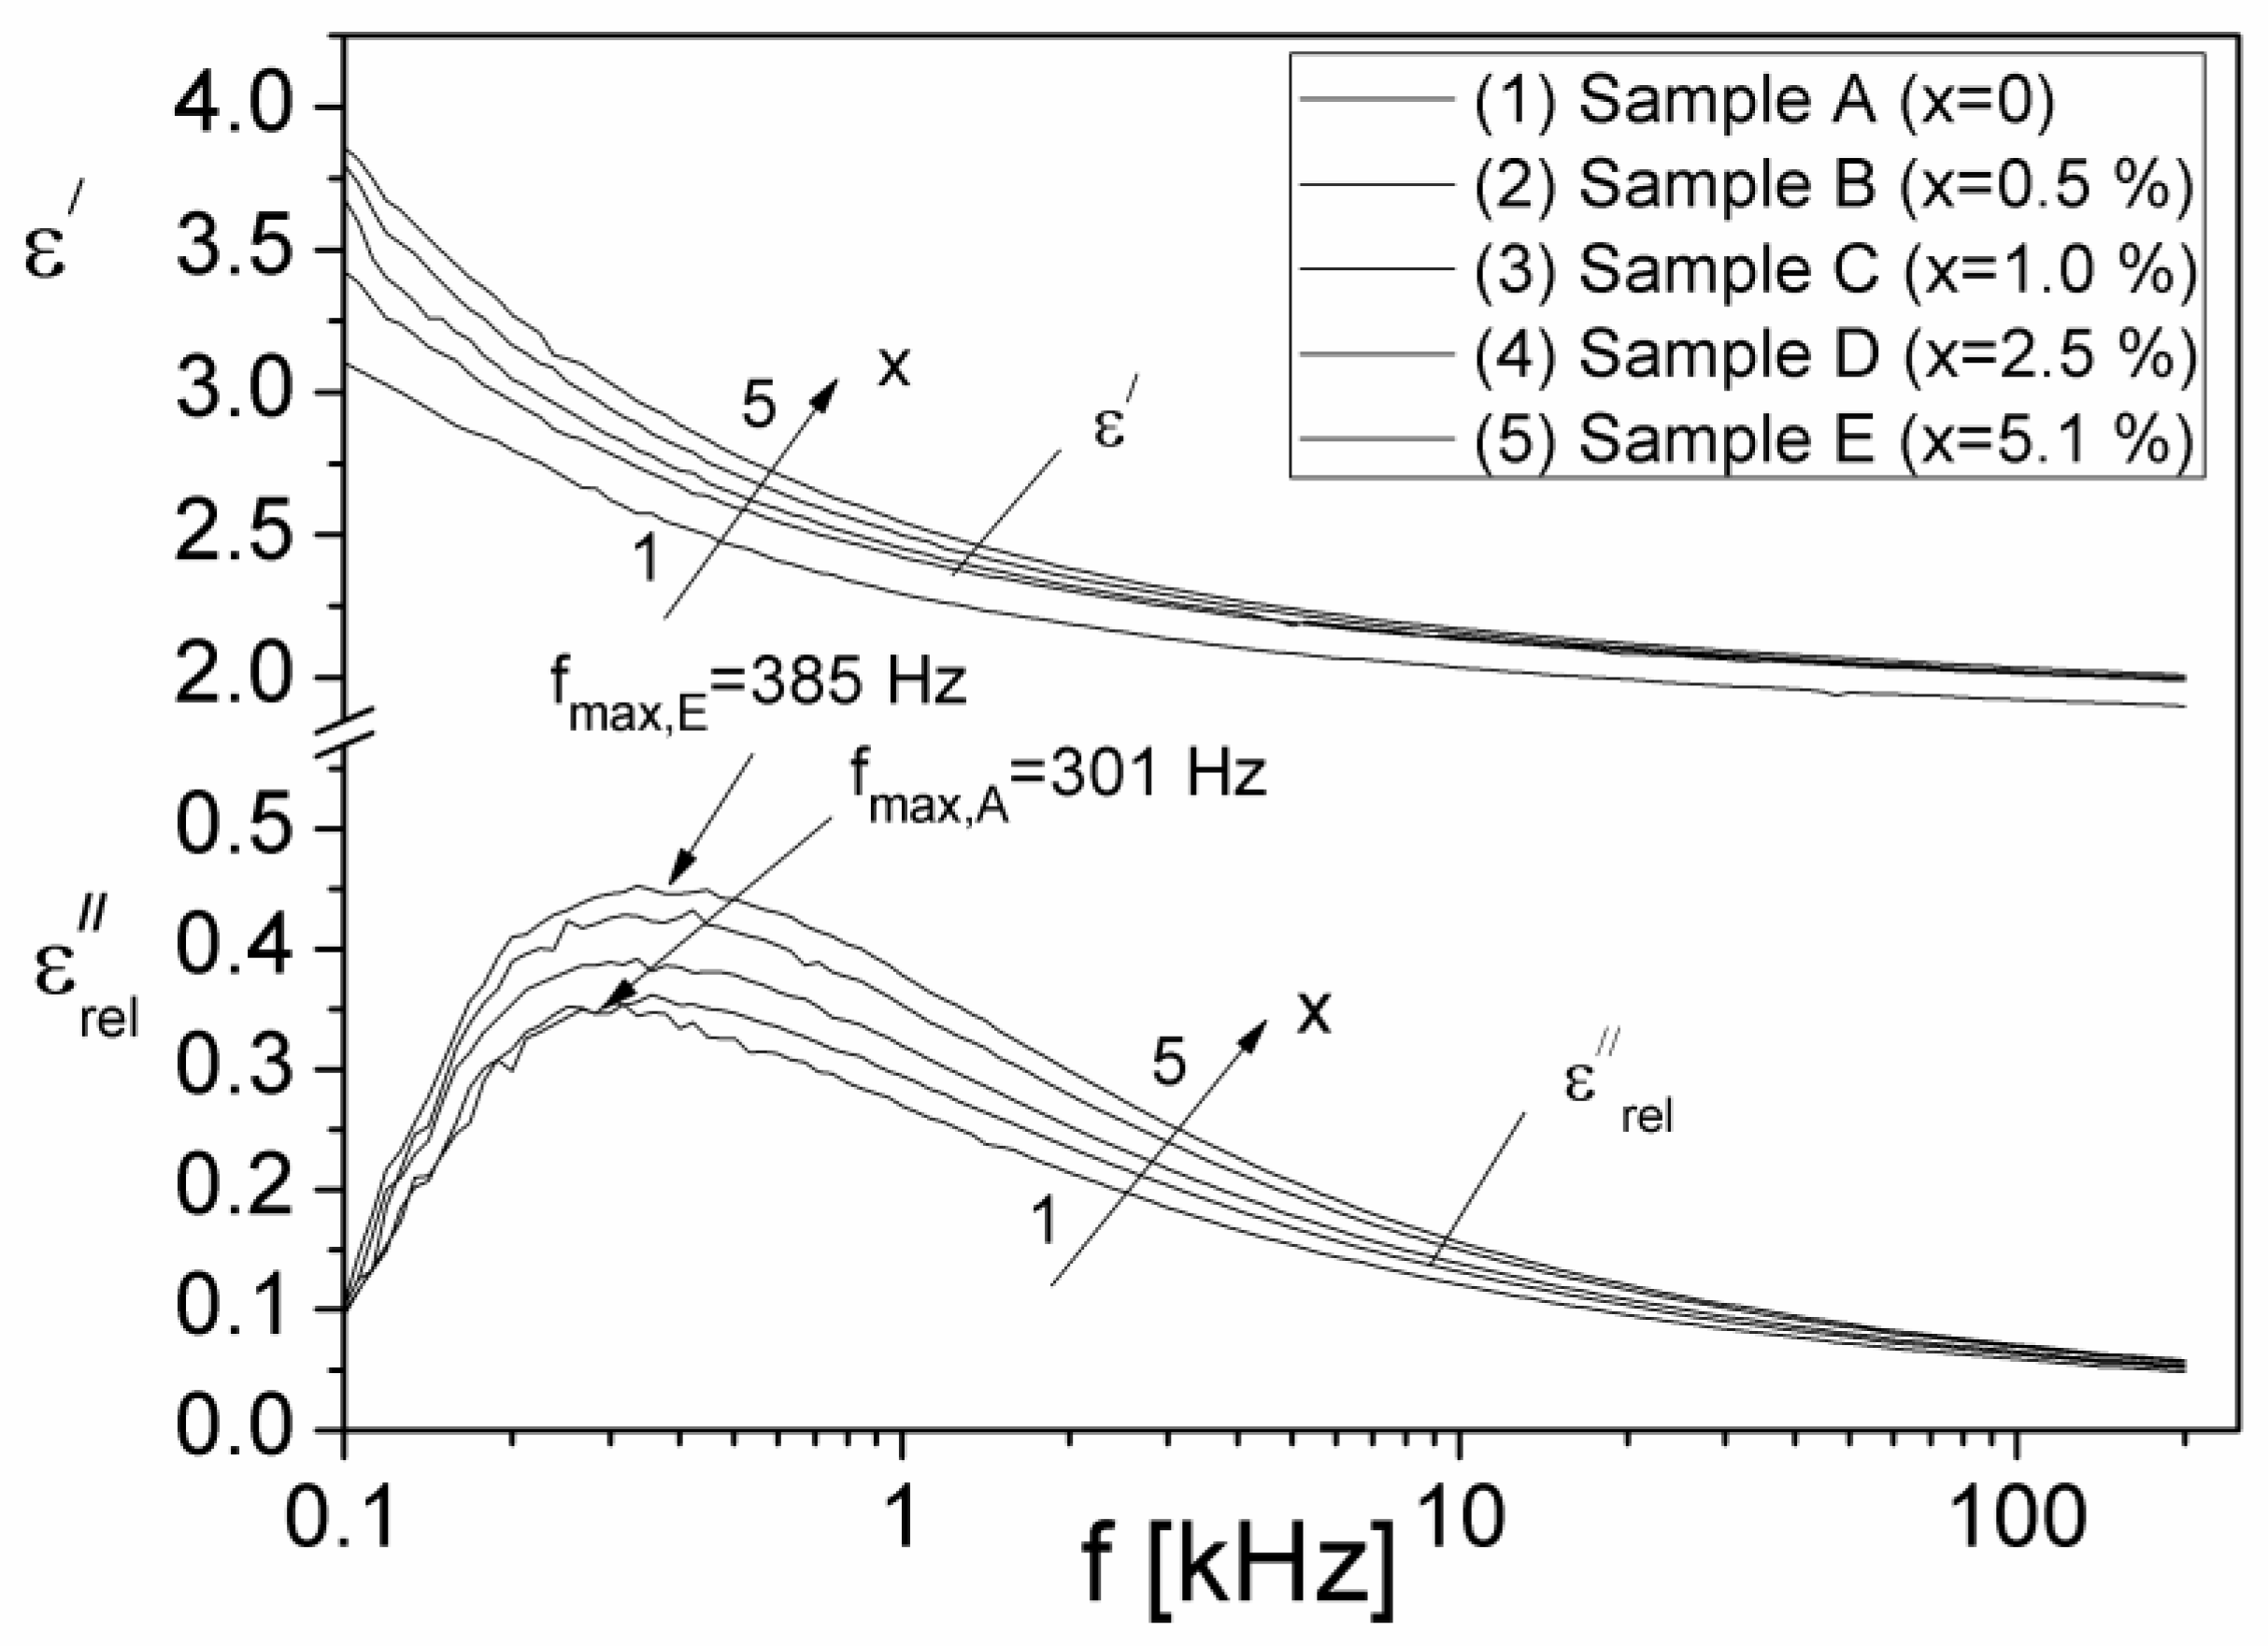
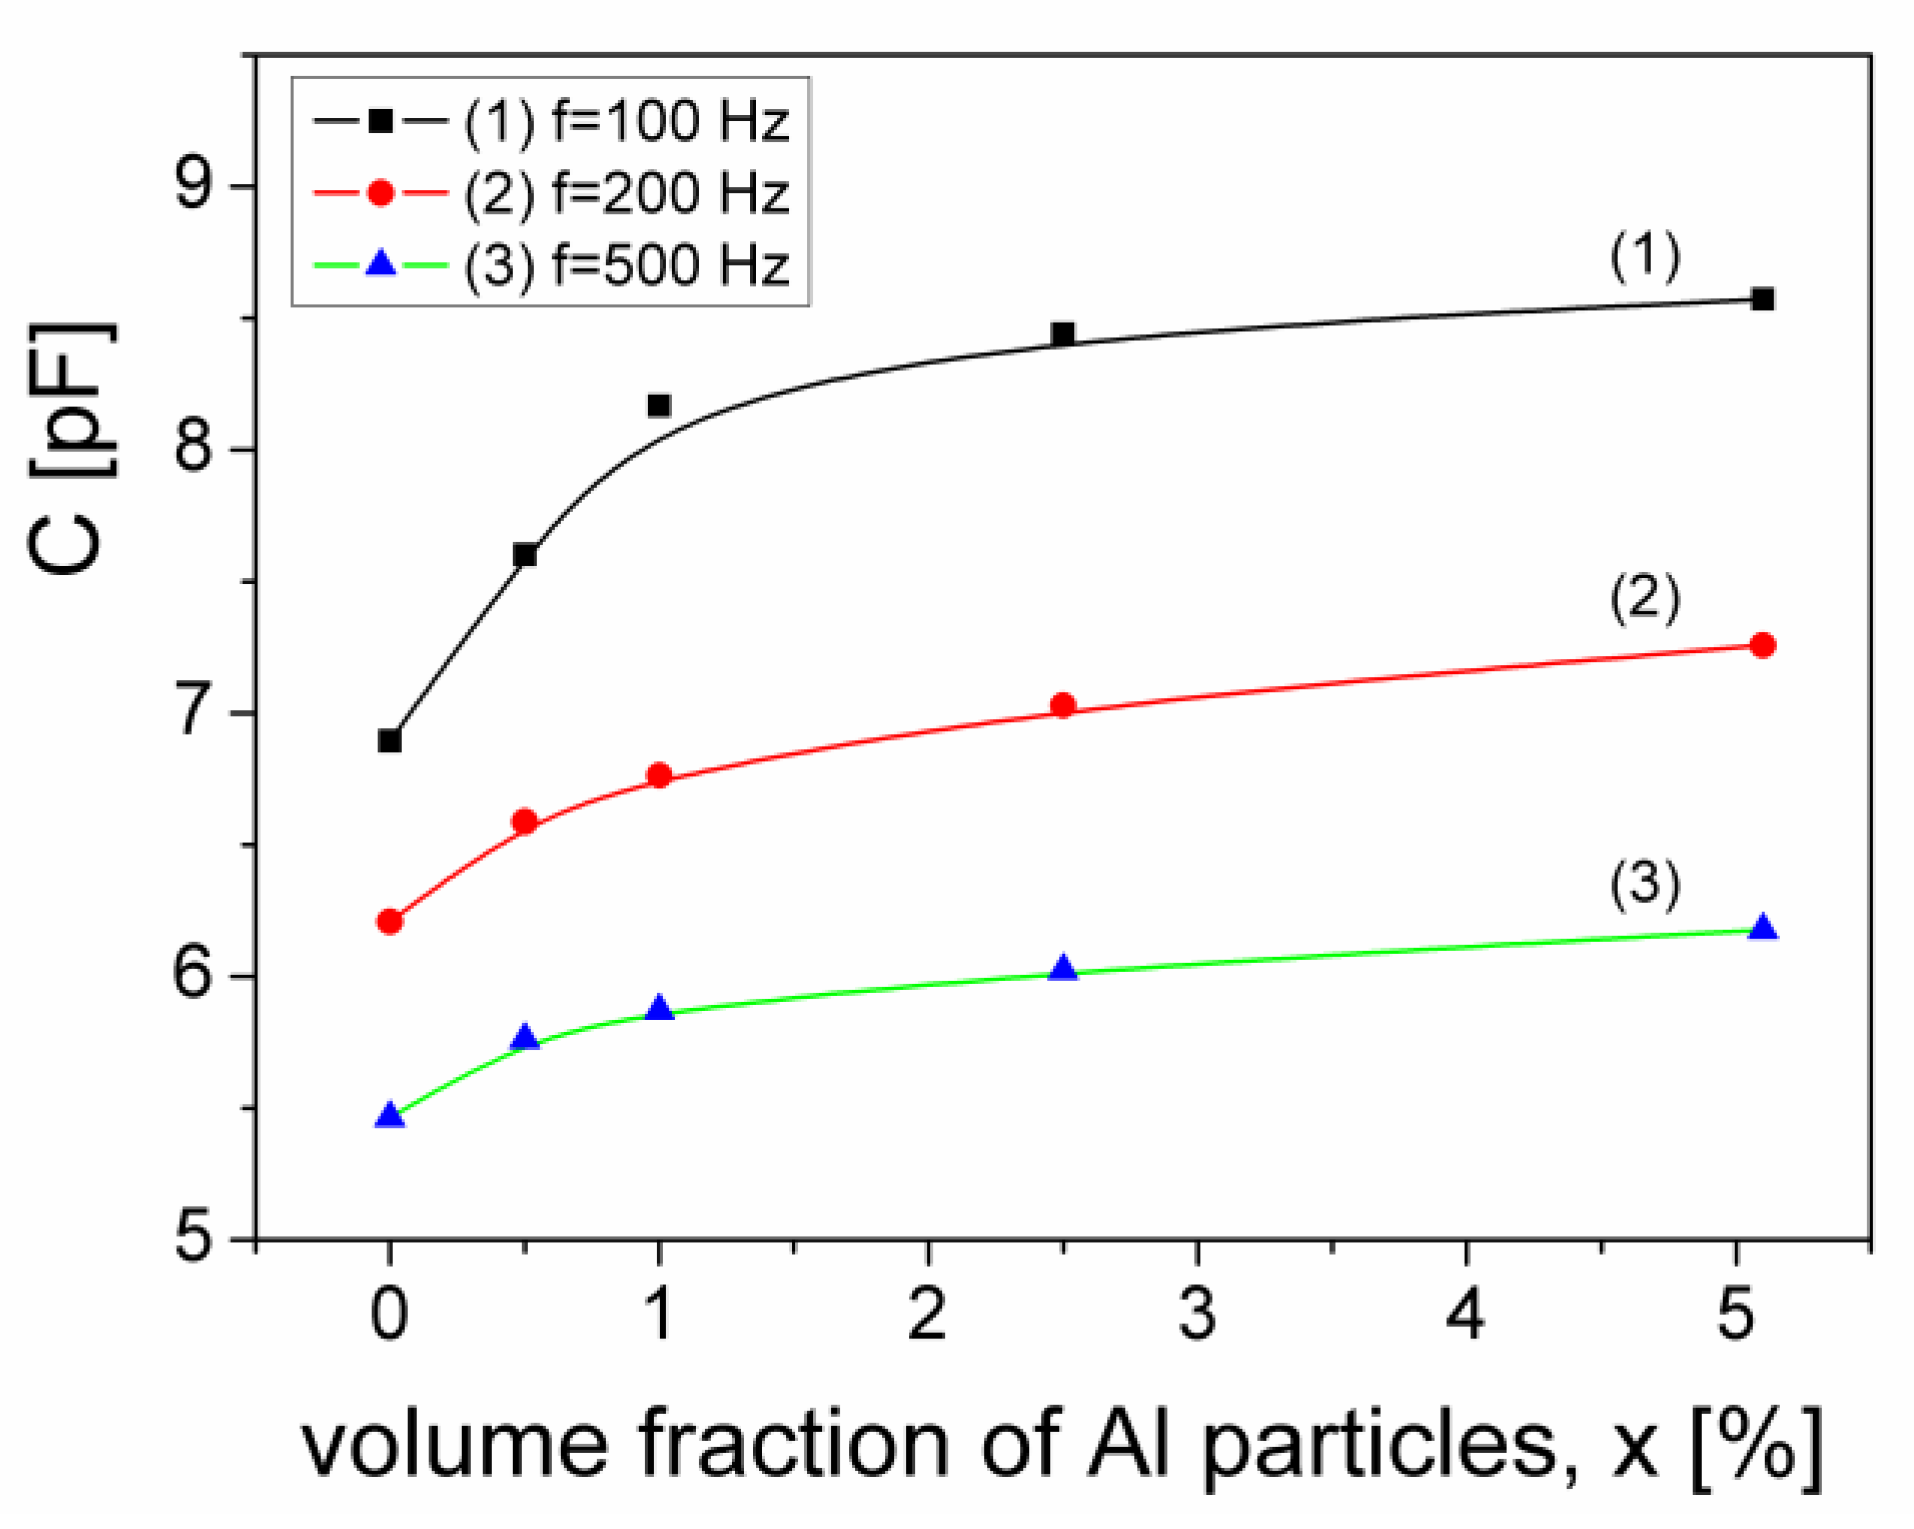
3.4. The Dielectric Permittivity

As is known, the electrical modulus, M, can be defined by Equation (10), where ε and ε represent the real and imaginary components, respectively, of the complex dielectric permittivity of the sample, ε = ε i ε [43].
M _ = 1 ε i ε = M i M
From Equation (10), the ε and ε components of the complex dielectric permittivity can be determined. The following relationships result:
ε = M M 2 + M 2
ε = M M 2 + M 2
Knowing the values M and M of the electric modulus M (Figure 6), obtained from the complex impedance measurements and using Equations (11) and (12), the frequency dependencies of ε and ε components were determined and plotted in Figure 10.
From Figure 10 it is observed that the real component, ε′, increases from 3.0 to about 3.8, at 100 Hz, by increasing the volume fraction of Al particles, whilst by increasing the frequency, ε′ decreases to the approximate value ε 2 , for all samples. For a constant volume fraction of Al particles, x, the imaginary component, ε″, decreases sharply with increasing frequency. Moreover, at the frequency of 100 Hz, ε″ increases from 5.5 to about 11.8, by increasing the volume fraction x. At the same time, from Figure 10 it is observed that at low frequencies, the values of the ε″ component are much higher than those of the real component ε′, thus indicating high conduction losses in the composite samples or electrode polarization process. At frequencies larger than 500 Hz, ε″ is smaller than ε′ for all samples, indicating that the dielectric relaxation becomes prevalent.
The total dielectric losses in a material [43] are due both to electrical conduction ( ε c ) and dielectric relaxation ( ε r e l ):
ε ( ω ) = ε c ( ω ) + ε r e l ( ω )
The component, ε c , due to conduction [43] can be expressed by the relation ε c = σ / 2 π f ε 0 , where σ is the electrical conductivity of the investigated sample. If we assume that the value of σ is equal to the value of σ D C for each composite sample (see Table 1), we can determine the component ε c , and then from Equation (13) the component ε r e l corresponding to the dielectric relaxation can also be computed. In Figure 11, the frequency dependencies of the components ε′ and ε r e l are shown.
From Figure 11, it is observed that the imaginary component ε r e l , corresponding to the dielectric relaxation processes in the samples, presents a maximum for each volume fraction x at the relaxation frequency, fmax, which moves from 301 Hz to 385 Hz, when x increases from x = 0 to x = 5.1%. Using the Debye equation and the experimental values of fmax (Figure 11) we have computed the relaxation times due to the dielectric relaxation processes, τrel, for each investigated sample. The obtained values are listed in Table 1. The values of τrel are close to those of τM, thus confirming the fact that the analysis of the frequency dependence of the electrical module, M(f) = M′(f) − iM″(f), is useful in the study of dielectric relaxation processes in the case of conductive samples, for which ε c = σ / 2 π f ε 0 has high value that covers the dielectric relaxation maximum.
Considering a planar capacitor that has between its armatures the composite samples investigated in this paper, we examined the capacitance C = ε s a m p l e C 0 , as a function of volume fraction, x of Al particles dispersed in the samples, for several frequencies from the low frequency range (0.1–1) kHz. We denoted with C0 the capacity of the planar capacitor in the absence of the sample between the armatures, whose value is C0 = 2.22 pF. In Figure 12 it is presented the variation of the capacitance, C, depending on the volume fraction of Al particles dispersed in the composite sample, for three frequencies from the low frequency range: 100 Hz, 200 Hz and 500 Hz.
From Figure 12, it results that for all three frequencies, the capacitance, C increases by increasing the volume fraction of Al particles in the composite sample, from a minimum value Cx0 (corresponding to the volume fraction, x = 0) to a maximum value Cxmax (corresponding to the volume fraction, x = 5.1%). The maximum relative change of the electrical capacitance, (Cxmax − Cx0)/Cx0, decreases by increasing the frequency from 24% (at 100 Hz) to 13% (500 Hz), as can be seen in Table 2.
Therefore, this result shows that the capacitance of a capacitor filled with composite material can be tuned by the volume fraction of aluminum particles dispersed in the composite, which is useful in flexible electronics applications.

4. Conclusions

Based on the complex impedance measurements, over the frequency range (100 Hz–200 kHz), the electrical conductivity (σ) and the dielectric permittivity (ε) of composite samples consisting of silicone rubber and aluminum particles, in different volume fractions x = (0%; 0.5%; 1%; 2.5% and 5.1%), were investigated.
The values of the DC-conductivity (σDC) were determined based on the Nyquist impedance diagrams, Z″(Z′) and of the fit parameters corresponding to the equivalent electrical model for each sample and the results show that by increasing the volume fraction x from 0 to 5.1%, the σDC increase from 2.637·10−8 S/m to 5.725·10−8 S/m.
Using the obtained values σDC and the Mott’s variable-range-hopping (VRH) model, we determined the hopping distance Rh of the charge carriers within the samples, which decreases with the increasing of volume fraction from 7.30 nm (for x = 0) to 5.92 nm (for x = 5.1%). At the same time, we evaluated the hopping frequency (ωh), from the DC regime (at low frequencies) to the dispersive regime (at high frequencies), which increases from 7.625·103 s−1 (for x = 0) to 10.890·103 s−1 (for x = 5.1%).
The frequency dependencies of dielectric permittivity show that the imaginary component ε r e l has a maximum at frequencies close to the frequencies of the maximum of M″ which indicates the existence of an interfacial relaxation process.
This study shows that the electrical conduction process and the dielectric properties of silicone rubber/Al particles’ composite samples can be significantly changed by the volume fraction of Al particles, being useful in the design of flexible electronic applications.
In our future research, we will expand the study of the electrical and dielectric properties of these composites, by using other types of metal particles or silicone rubber, following the dependence both of the volume fraction and the temperature, of the σ and of ε, based on the complex impedance measurements in different frequency and temperature ranges.

Author Contributions

Conceptualization, A.T. and I.M.; methodology, I.M and C.N.M.; measurements, A.T., I.M. and P.S.; formal analysis, C.N.M.; investigation, A.T., I.M. and P.S.; supervision, C.N.M., writing—original draft preparation, I.M. and A.T; writing—review and editing, I.M. and A.T.; funding acquisition, I.M. and C.N.M. All authors have read and agreed to the published version of the manuscript.

Funding

This research was partly funded by the research contract 02-1-1107-2011/2021 ANCSI-JINR Dubna, item 4 and the research contract 04-5-1131-2017/2021 ANCSI-JINR Dubna, item 96 of the JINR order no. 365/11.05.2021.

Institutional Review Board Statement

Not applicable.

Informed Consent Statement

Not applicable.

Data Availability Statement

The data presented in this study are available upon request from the corresponding author.

Acknowledgments

The authors acknowledge support given by West University of Timisoara.

Conflicts of Interest

The authors declare no conflict of interest.

References

  1. Parameswaranpillai, J.; Hameed, N.; Kurian, T.; Yu, Y. (Eds.) Introduction to Nanomaterials and Nanocomposites. In Nanocomposite Materials, Synthesis, Properties and Applications; Chapter 1; CRC Press Taylor & Francis Group: New York, NY, USA, 2016. [Google Scholar] [CrossRef]
  2. Bica, I.; Anitas, E.M.; Averis, L.M.E.; Bunoiu, M. Magnetodielectric effects in composite materials based on paraffin, carbonyl iron and grapheme. J. Ind. Eng. Chem. 2015, 21, 1323–1327. [Google Scholar] [CrossRef]
  3. Fornes, T.; Yoon, P.; Keskkula, H.; Paul, D. Nylon 6 nanocomposites: The effect of matrix molecular weight. Polymer 2001, 42, 09929–09940. [Google Scholar] [CrossRef]
  4. Marin, C.N.; Malaescu, I.; Sfirloaga, P.; Teusdea, A. Electric and magnetic properties of a composite consisting of silicone rubber and ferrofluid. J. Ind. Eng. Chem. 2021, 101, 405–413. [Google Scholar] [CrossRef]
  5. Ramakrishna, S.; Mayer, J.; Wintermantel, E.; Leong, K.V. Biomedical applicatons of polymer-composite materials: A review. Compos. Sci. Technol. 2001, 61, 1189–1224. [Google Scholar] [CrossRef]
  6. Hammami, H.; Arous, M.; Lagache, M.; Kallel, A. Study of the interfacial MWS relaxation by dielectric spectroscopy in unidirectional PZT fibres/epoxy resin composites. J. Alloys Compd. 2007, 430, 1–8. [Google Scholar] [CrossRef]
  7. Yakovenko, O.S.; Matzui, L.Y.; Vovchenko, L.L.; Lozitsky, O.V.; Prokopov, O.I.; Lazarenko, O.A.; Zhuravkov, A.V.; Oliynyk, V.V.; Launets, V.L.; Trukhanov, S.V.; et al. Electrophysical properties of epoxy-based composites with graphite nanoplatelets and magnetically aligned magnetite. Mol. Cryst. Liq. Cryst. 2018, 661, 68–80. [Google Scholar] [CrossRef]
  8. Gonzalez-Benito, J.; Martínez-Tarifa, J.; Sepúlveda-García, M.E.; Portillo, R.A.; Gonzalez-Gaitano, G. Composites based on HDPE filled with BaTiO3 submicrometric particles. Morphology, structure and dielectric properties. Polym. Test. 2013, 32, 1342–1349. [Google Scholar] [CrossRef]
  9. Zhang, Z.F.; Bai, X.F.; Zha, J.W.; Li, W.K.; Dang, Z.M. Preparation and dielectric of BaTiO3/epoxy nanocomposites for embedded capacitor application. Compos. Sci. Technol. 2014, 97, 100–105. [Google Scholar] [CrossRef]
  10. Baji, A.; Mai, Y.W.; Li, Q.; Liu, Y. Nanoscale investigation of ferroelectric properties in electrospun barium titanate/polyvinylidene fluoride composite fibers using piezoresponse force microscopy. Compos. Sci. Technol. 2011, 71, 1435–1440. [Google Scholar] [CrossRef]
  11. Jamal, E.M.A.; Joy, P.A.; Kurian, P.; Anantharaman, M.R. Synthesis of nickel-rubber nanocomposites and evaluation of their dielectric properties. Mater. Sci. Eng. B 2009, 156, 24–31. [Google Scholar] [CrossRef] [Green Version]
  12. Al-Ghamdi, A.A.; Al-Hartomy, O.A.; Al-Salamy, F.; El-Mossalamy, E.H.; Daiem, A.M.A.; El-Tantawy, F. Novel electromagnetic interference shielding effectiveness in the microwave band of magnetic nitrile butadiene rubber/magnetite nanocomposites. J. Appl. Polym. Sci. 2012, 125, 2604–2613. [Google Scholar] [CrossRef]
  13. Namitha, L.K.; Chameswary, J.; Ananthakumar, S.; Sebastian, M.T. Effect of micro- and nano-fillers on the properties of silicone rubber-alumina flexible microwave substrate. Ceram. Int. 2013, 39, 7077–7087. [Google Scholar] [CrossRef]
  14. Pantazi, A.; Palade, S.; Berbecaru, C.; Veca, M.; Dinescu, A.; Şchiopu, V.; Oprea, O.; Dragoman, D. Dielectric properties of composites containing silicone rubber and multiwall carbon nanotubes decorated with gold. Rom. Rep. Phys. 2016, 68, 648–657. [Google Scholar]
  15. Stiubianu, G.; Bele, A.; Cazacu, M.; Racles, C.; Vlad, S.; Ignat, M. Dielectric silicone elastomers with mixed ceramic nanoparticles. Mater. Res. Bull. 2015, 71, 67–74. [Google Scholar] [CrossRef] [Green Version]
  16. Huang, C.; Zhang, Q.M. Fully functionalized high dielectric constant nanophase polymers with high electromechanical response. Adv. Mater. 2005, 17, 1153–1158. [Google Scholar] [CrossRef]
  17. Sui, X.; Zhou, W.; Dong, L.; Wang, Z.; Liu, X.; Zhou, A.; Cai, J.; Chen, Q. A novel fiber-reinforced silicone rubber composite with Al particles for enhanced dielectric and thermal properties. Adv. Polym. Technol. 2018, 37, 1507–1516. [Google Scholar] [CrossRef]
  18. Zhou, W.Y.; Cai, J.T.; Zhou, A.N. Thermal properties of the aluminum particle reinforced silicone rubber composites. Adv. Mater. Res. 2011, 194–196, 1680–1684. [Google Scholar] [CrossRef]
  19. Gao, B.Z.; Xu, J.Z.; Peng, J.J.; Kang, F.Y.; Du, H.D.; Li, J.; Chiang, S.W.; Xu, C.J.; Hu, N.; Ning, X.S. Experimental and theoretical studies of effective thermal conductivity of composites made of silicone rubber and Al2O3 particles. Thermochim. Acta 2015, 614, 1–8. [Google Scholar] [CrossRef]
  20. Madidi, F.; Momen, G.; Farzaneh, M. Dielectric properties of TiO2/silicone rubber micro and nanocomposites. Adv. Mater. Sci. Eng. 2018, 2018, 4682076. [Google Scholar] [CrossRef] [Green Version]
  21. Available online: https://www.prochima.com/ENG/ (accessed on 29 January 2022).
  22. Available online: https://www.sigmaaldrich.com/RO/en/product/aldrich/11009?context=product (accessed on 3 February 2022).
  23. Lungu, A.; Malaescu, I.; Marin, C.N.; Vlazan, P.; Sfirloaga, P. The electrical properties of manganese ferrite powders prepared by two different methods. Phys. B Condens. Matter 2015, 462, 80–85. [Google Scholar] [CrossRef]
  24. ASTM D150-98; Standard Test Methods for AC Loss Characteristics and Permittivity (Dielectric Constant) of Solid Electrical Insulation. ASTM International: West Conshohocken, PA, USA, 2004. [CrossRef]
  25. Goswami, A.; Goswami, A.P. Dielectric and optical properties of ZnS films. Thin Solid Film 1973, 16, 175–185. [Google Scholar] [CrossRef]
  26. Debye, P. Polar Molecules; Chemical Catalog Company, Inc.: New York, NY, USA, 1929. [Google Scholar]
  27. Barsoukov, E.; Macdonald, J.R. Impedance Spectroscopy: Theory, Experiments and Applications; Wiley: New York, NY, USA, 2005. [Google Scholar]
  28. Stoia, M.; Pacurariu, C.; Mihali, C.; Malaescu, I.; Marin, C.N.; Capraru, A. Manganese ferrite-polyaniline hybrid materials: Electrical and magnetic properties. Ceram. Int. 2019, 45, 2725–2735. [Google Scholar] [CrossRef]
  29. Rajnak, M.; Kurimsky, J.; Dolnik, B.; Kopcansky, P.; Tomasovicova, N.; Taculescu-Moaca, E.A.; Timko, M. Dielectric-spectroscopy approach to ferrofluid nanoparticle clustering induced by an external electric field. Phys. Rev. E 2014, 90, 032310. [Google Scholar] [CrossRef] [PubMed]
  30. Horn, T.; Deutschlander, S.; Lowen, H.; Maret, G.; Keim, P. Fluctuations of ori-entational order and clustering in a two-dimensional colloidal system under quenched disorder. Phys. Rev. E 2013, 88, 062305. [Google Scholar] [CrossRef] [PubMed] [Green Version]
  31. Harun, M.H.; Saion, E.; Kassim, A.; Mahmud, E.; Hussain, M.Y.; Mustafa, I.S. Dielectric properties of poly (vinyl alcohol)/polypyrrole composite polymer films. J. Adv. Sci. Arts 2009, 1, 9–16. [Google Scholar]
  32. Wubbenhorst, M.; van Turnhout, J. Analysis of complex dielectric spectra. I. One-dimensional derivative techniques and three-dimensional modeling. J. Non-Cryst. Solids. 2002, 305, 40–49. [Google Scholar] [CrossRef]
  33. Malaescu, I.; Lungu, A.; Marin, C.N.; Sfirloaga, P.; Vlazan, P.; Brindusoiu, S.; Poienar, M. Temperature dependence of the dynamic electrical properties of Cu1+xMn1-xO2 (x = 0 and 0.06) crednerite materials. Ceram. Int. 2018, 44, 11610–11616. [Google Scholar] [CrossRef]
  34. Asandulesa, M.; Kostromin, S.; Tameev, A.; Aleksandrov, A.; Bronnikov, S. Molecular dynamics and conductivity of a PTB7: PC71BM photovoltaic polymer blend: A dielectric spectroscopy study. ACS Appl. Polym. Mater. 2021, 3, 4869–4878. [Google Scholar] [CrossRef]
  35. Jonscher, A.K. Universal Relaxation Law, 1st ed.; Chelsea Dielectrics Press: London, UK, 1996. [Google Scholar]
  36. Jankowska, I.A.; Pogorzelec-Glaser, K.; Lawniczak, P.; Matczak, M.; Pankiewicz, R. New liquid-free proton conductive nanocomposite based on imidazole-functionalized cellulose nanofibers. Cellulose 2021, 28, 843–854. [Google Scholar] [CrossRef]
  37. Funke, K. Jump relaxation in solid electrolytes. Prog. Solid State Chem. 1993, 22, 111–195. [Google Scholar] [CrossRef]
  38. Lalanne, M.; Demont, P.; Barnabé, A. Ac conductivity and dielectric properties of CuFe1-xCrxO2: Mg delafossite. J. Phys. D Appl. Phys. 2011, 44, 185401. [Google Scholar] [CrossRef] [Green Version]
  39. Hill, R.M. Hopping conduction in amorphous solids. Philos. Mag. 1971, 24, 1307. [Google Scholar] [CrossRef]
  40. Mott, N.F.; Davis, E.A. Electronic Processes in Non-Crystalline Materials; Clarendon: Oxford, UK, 1979. [Google Scholar]
  41. Lalanne, M.; Barnabé, A.; Mathieu, F.; Tailhades, P. Synthesis and thermostructural studies of a CuFe(1-x)Cr(x)O(2) delafossite solid solution with. Inorg. Chem. 2009, 48, 6065–6071. [Google Scholar] [CrossRef] [PubMed]
  42. Mollah, S.; Som, K.K.; Bose, K.; Chaudhuri, B.K. AC conductivity in Bi4Sr3Ca3CuyOx (y = 0–5) and Bi4Sr3Ca3-zLizCu4Ox, (z = 0.1–1.0) semiconducting oxide glasses. J. Appl. Phys. 1993, 74, 931–937. [Google Scholar] [CrossRef]
  43. Scaife, B.K.P. Principles of Dielectrics; Clarendon Press: Oxford, UK, 1998. [Google Scholar]
Figure 1. The stages of preparation process of the composite samples of silicone rubber with Al particles.
Materials 15 02309 g001
Figure 2. The images of the SR—xAl composite samples of silicone rubber with Al particles (x—volume fraction of Al particles): sample A (x = 0); sample B (x = 0.005); sample C (x = 0.01); sample D (x = 0.025); and sample E (x = 0.051).
Materials 15 02309 g002
Figure 3. The photo with the used experimental setup for measurements.
Materials 15 02309 g003
Figure 4. (a) SEM image of composite sample D; (b) element mapping; and (c) EDX spectrum for sample D.
Materials 15 02309 g004aMaterials 15 02309 g004b
Figure 5. (a) The frequency dependence of the real (Z′) and imaginary (Z″) components of the complex impedance of the investigated composite samples at different volume fractions x of Al particles; (b) the Nyquist plots of the impedance spectra of samples and their according fitting with the electrical equivalent circuit.
Materials 15 02309 g005aMaterials 15 02309 g005b
Figure 6. The frequency dependence of the real (M′) and imaginary (M″) components of the electric modulus of the samples with different volume fractions, x of Al particles.
Materials 15 02309 g006
Figure 7. The volume fraction dependence of the fmax,(Z) and fmax,(M) frequencies, corresponding to the imaginary components Z″ and M″, respectively.
Materials 15 02309 g007
Figure 8. The frequency dependence of the conductivity σ, at different volume fractions, x of the Al particles dispersed in the composite material.
Materials 15 02309 g008
Figure 9. The lnσAC(lnω) dependence at different volume fractions x of Al particles of the samples.
Materials 15 02309 g009
Figure 10. The frequency dependence of the real, ε′, and imaginary, ε″, components of the complex dielectric permittivity of the composite samples containing different volume fractions, x, of the Al particles.
Materials 15 02309 g010
Figure 11. Frequency dependence of the real component ε′ and of the imaginary component ε r e l due to the dielectric relaxation of samples.
Materials 15 02309 g011
Figure 12. The volume fraction dependence of the electrical capacitance of a capacitor with the investigated composite samples as dielectric, at three frequencies.
Materials 15 02309 g012
Table 1. Electrical parameters of composite samples, determined from measurements.
SamplesA (x = 0)B (x = 0.5%)C (x = 1%)D (x = 2.5%)E (x = 5.1%)
τ Z   [ m s ] 0.9250.7630.5580.4130.330
R[Ω]1.5166∙1081.3203∙1081.0841∙1088.2876∙1076.987∙107
P[sk/Ω]6.7444∙10−127.1842∙10−127.3427·10−127.5766∙10−127.6777∙10−12
k0.951180.949920.948410.946380.94593
τ M   [ m s ] 0.4960.4470.3700.2920.237
τ r e l   [ m s ] 0.5290.4760.4560.4460.413
σ D C   [ S / m ] 2.637·10−83.029·10−83.689·10−84.826·10−85.725·10−8
n0.5930.5790.5610.5340.515
A0 [S/msn] 1.315·10−101.687·10−102.282·10−103.566·10−104.772·10−10
ω c [ s 1 ] 7.625·1037.820·1038.647·1039.803·10310.890·103
R h   [ n m ] 7.306.896.576.115.92
Table 2. The maximum relative change of the capacitance.
f [Hz] ( C x max C x 0 ) / C x 0   [ % ]
10024.3
20016.9
50013.0
Publisher’s Note: MDPI stays neutral with regard to jurisdictional claims in published maps and institutional affiliations.

