1. Introduction
Titanium alloys are widely used in aerospace applications as they have the advantages of high strength-to-weight ratio, excellent fatigue performance and corrosion resistance [
1,
2]. Aero-engine s blades and blisks are usually subjected to variable cyclic loads up to the very high cycle fatigue (VHCF) regime (>10
7 cycles) [
3]. Therefore, fatigue performances of titanium alloys in the VHCF regime are gaining increasing importance in the design and evaluation of aero-engine components. It has been found that the conventional design standard of a fixed fatigue limit at 10
7 cycles cannot meet the actual service requirements of aero-engine components, because the materials will still fracture failure even under stresses below the fatigue limits when the service life exceeds 10
7 cycles [
4].
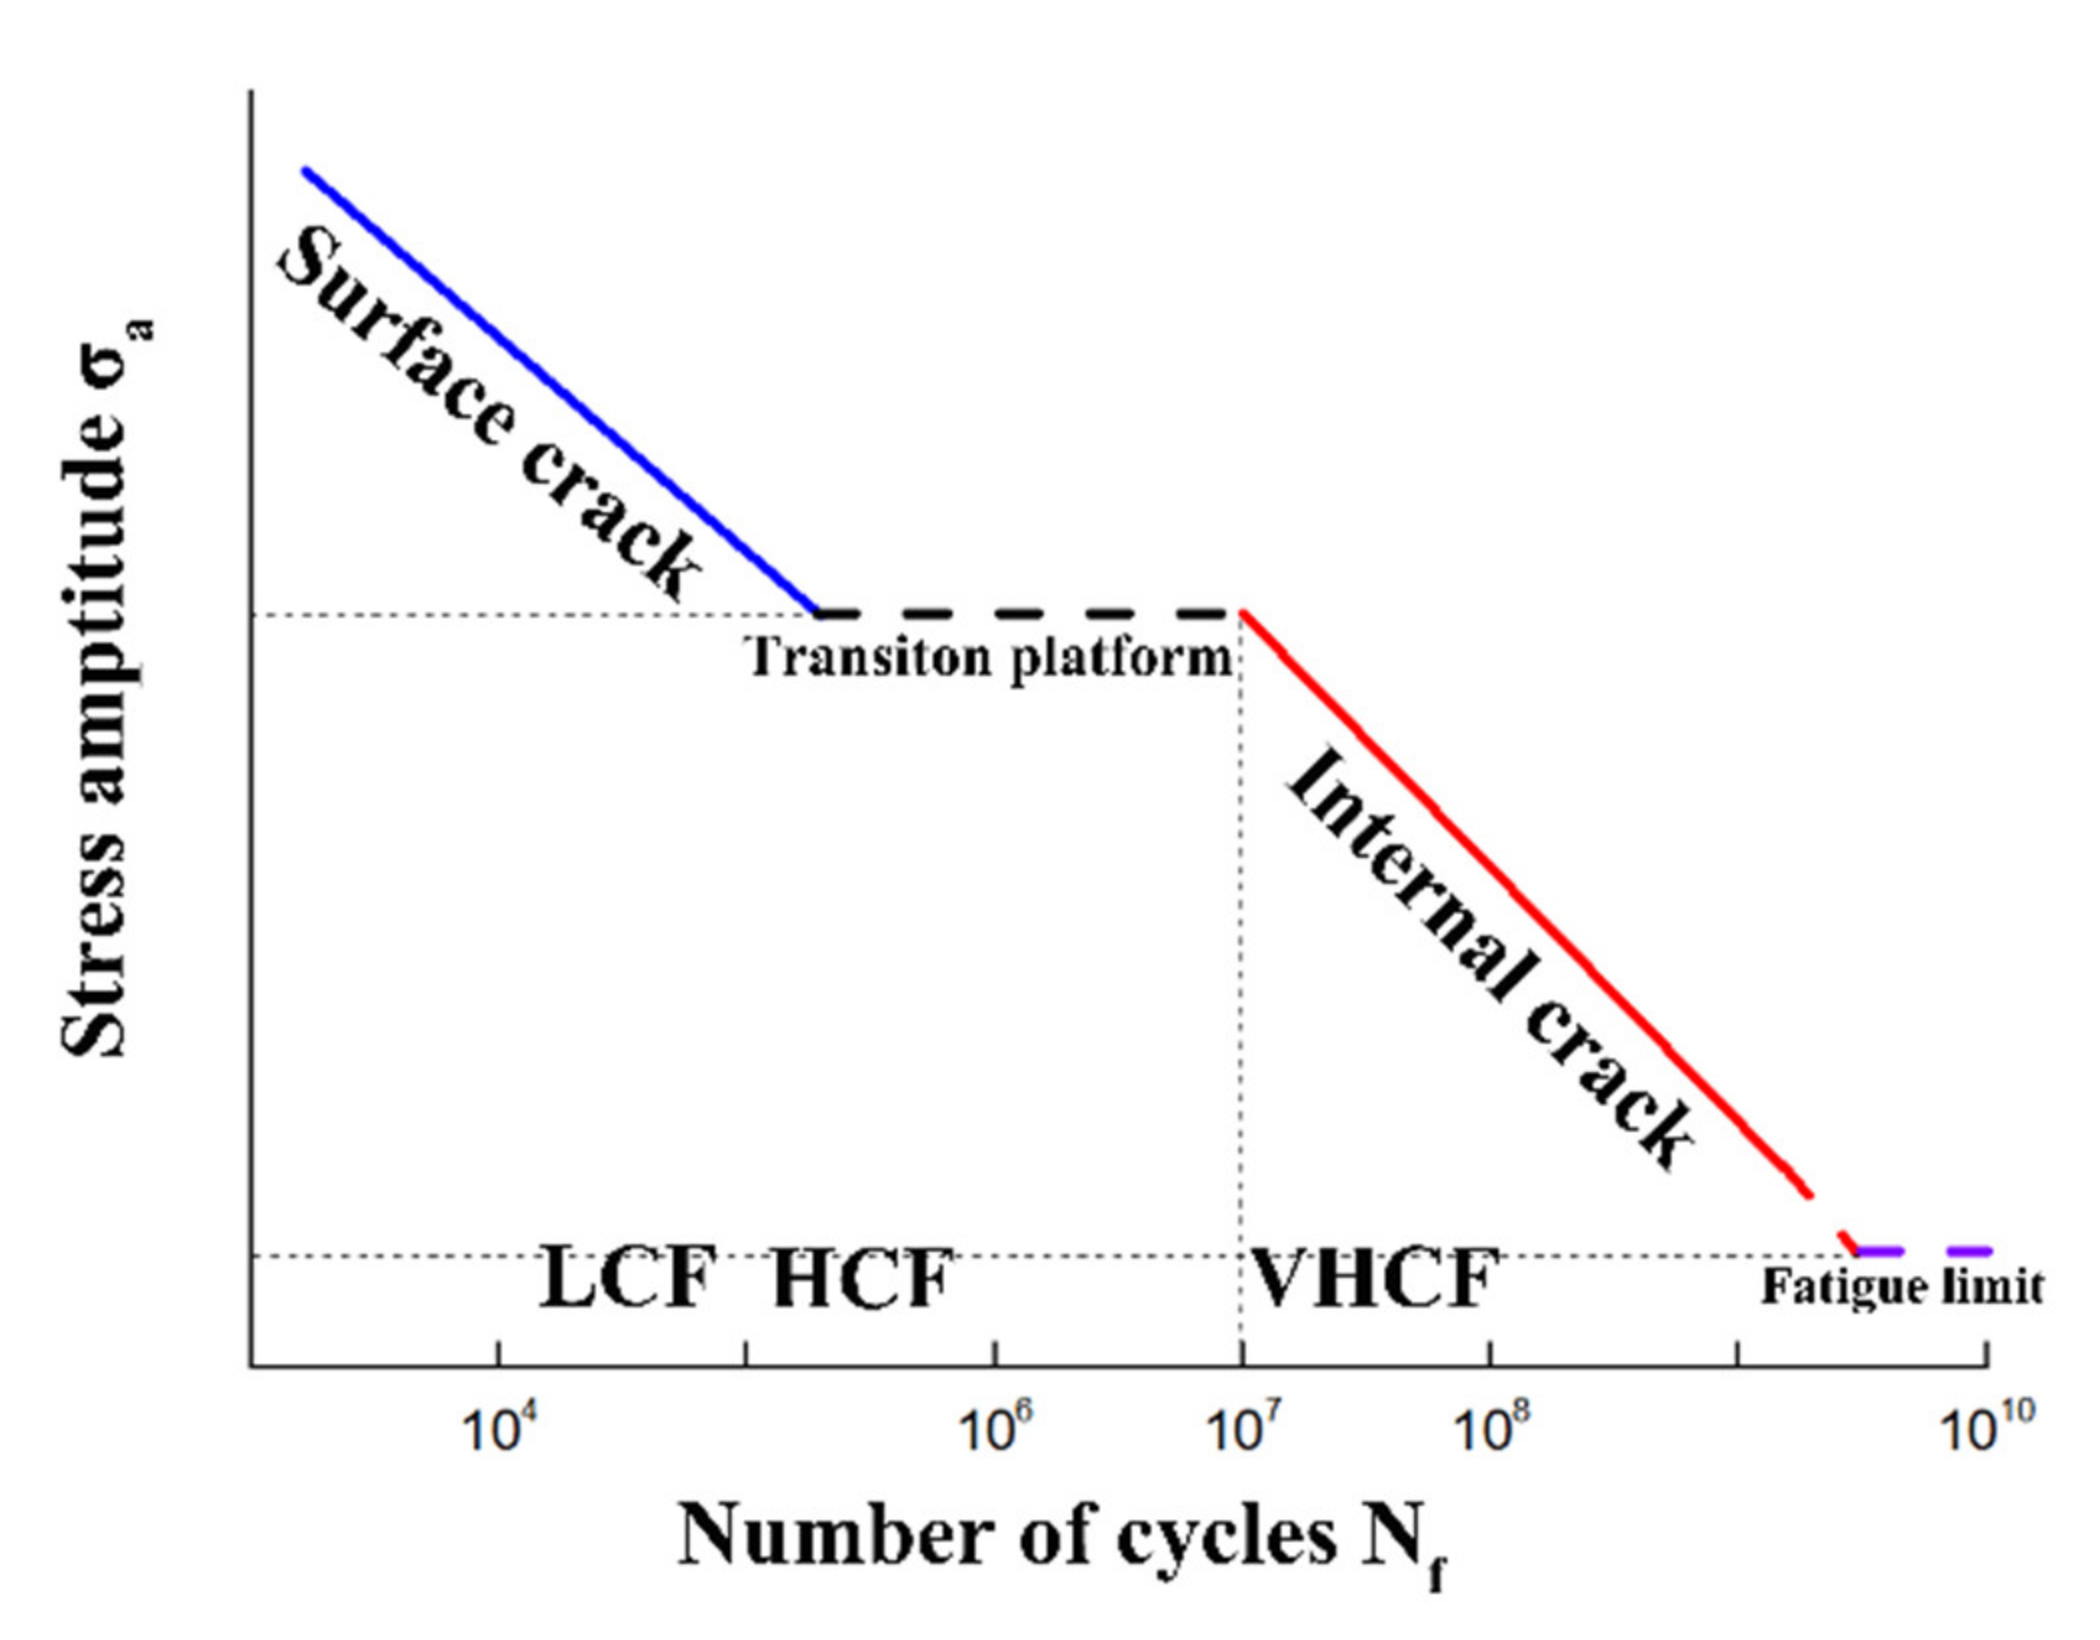
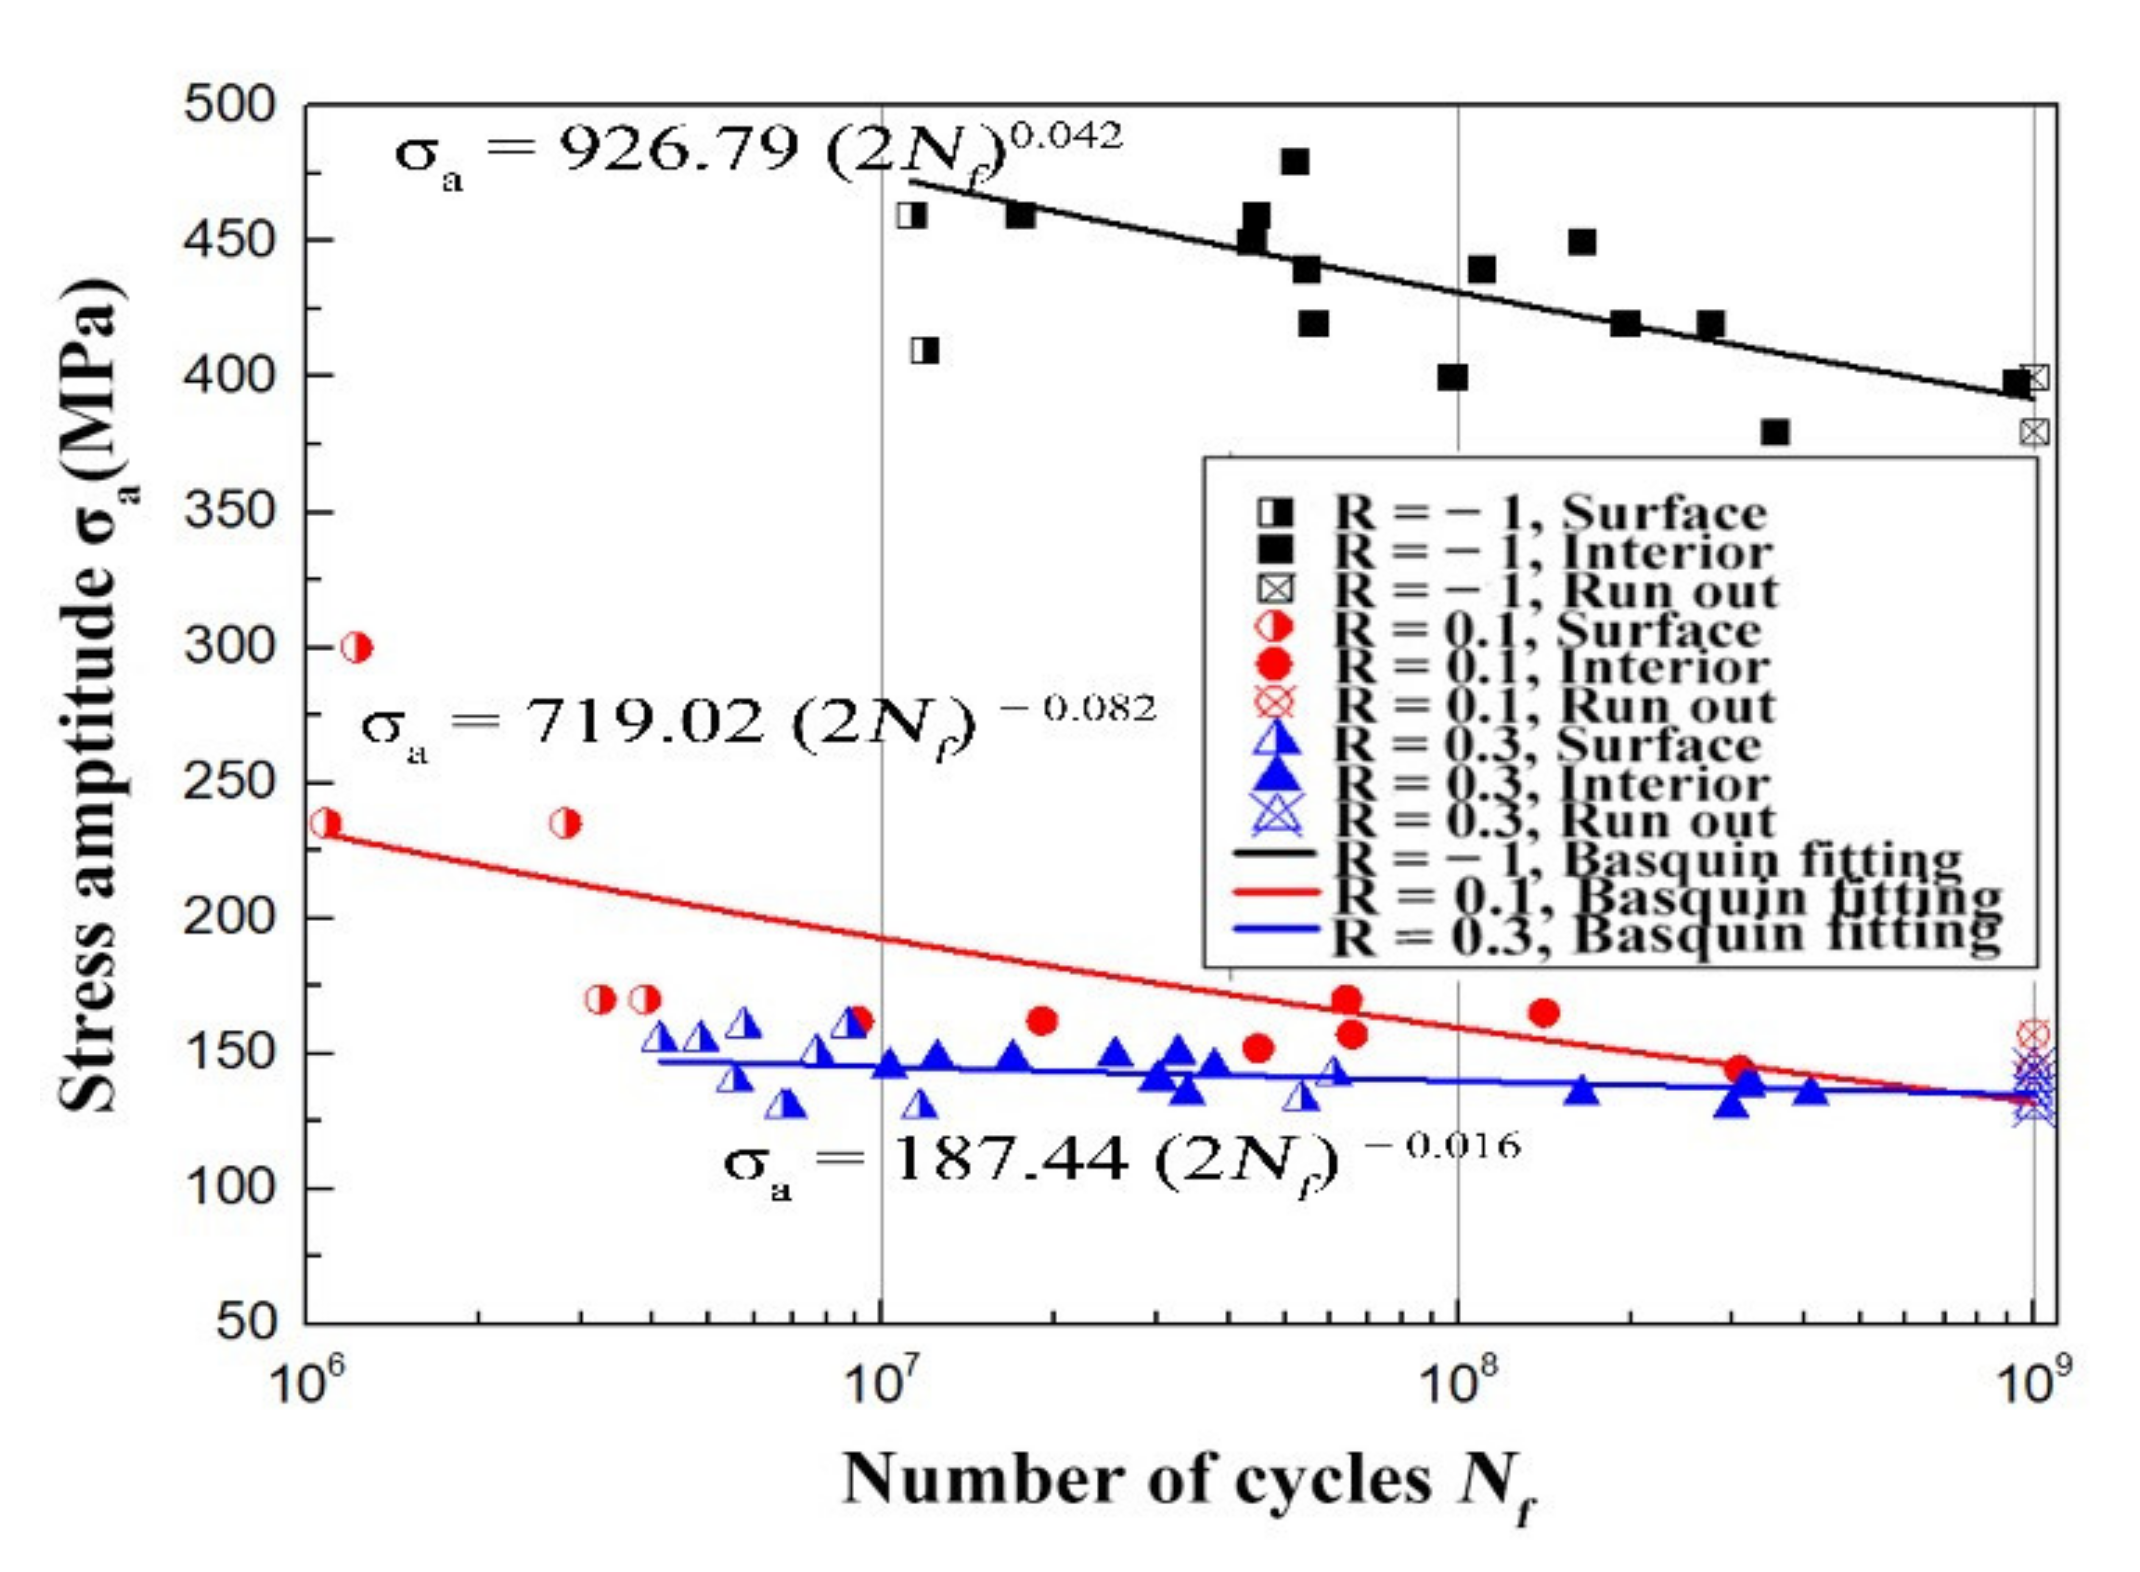
The basic research on VHCF of titanium alloys has been carried out for nearly 20 years, mainly concentrating on the characteristics of S-N curve, fracture morphology and crack initiation mechanism. It has been found that the competition of crack initiation failure mode between surface and interior in the VHCF region formed a “double line” or “two-step” S-N curve feature [
5], as shown in
Figure 1. The fatigue fracture section presents the characteristics of “fisheye”, which contains a rough area [
6], also known as a “granular bright area” (GBA) [
7], and there are a large number of small facets in the center [
8]. There are no inclusions in the titanium alloy, and the failure behavior of VHCF is attributed to “SNDFCO” (subsurface non-defect fatigue crack origin) by Chai et al. [
9], which is mainly attributed to the heterogeneity of internal microstructure [
10]. The complex crack initiation mechanism of titanium alloys often leads to high dispersion of fatigue life [
11,
12]. In addition, there are significant differences in the fatigue strengths and crack initiation mechanisms of dual-phase titanium alloys with the effect of the stress ratio [
13,
14].
Moreover, many fatigue life prediction models have been employed to estimate the fatigue crack initiation and propagation life of titanium alloys, but the results were not satisfactory [
15,
16,
17]. The main reason is that the life prediction models in the VHCF regime were developed based on the non-metallic inclusions usually found in high-strength steels [
18], while titanium alloys have no inclusions. A few researchers have developed fatigue life prediction models for titanium alloys [
19,
20]. However, the models can not well predict the fatigue life in the VHCF regime.
Ti60 titanium alloy is a near α alloy made in China [
21,
22]. It has excellent creep and fatigue properties even at elevated temperatures, which makes it an ideal candidate material for advanced aero-engines [
23,
24,
25,
26]. Most previous studies for the Ti60 alloy have mainly focused on static mechanical behaviors [
23,
27,
28,
29,
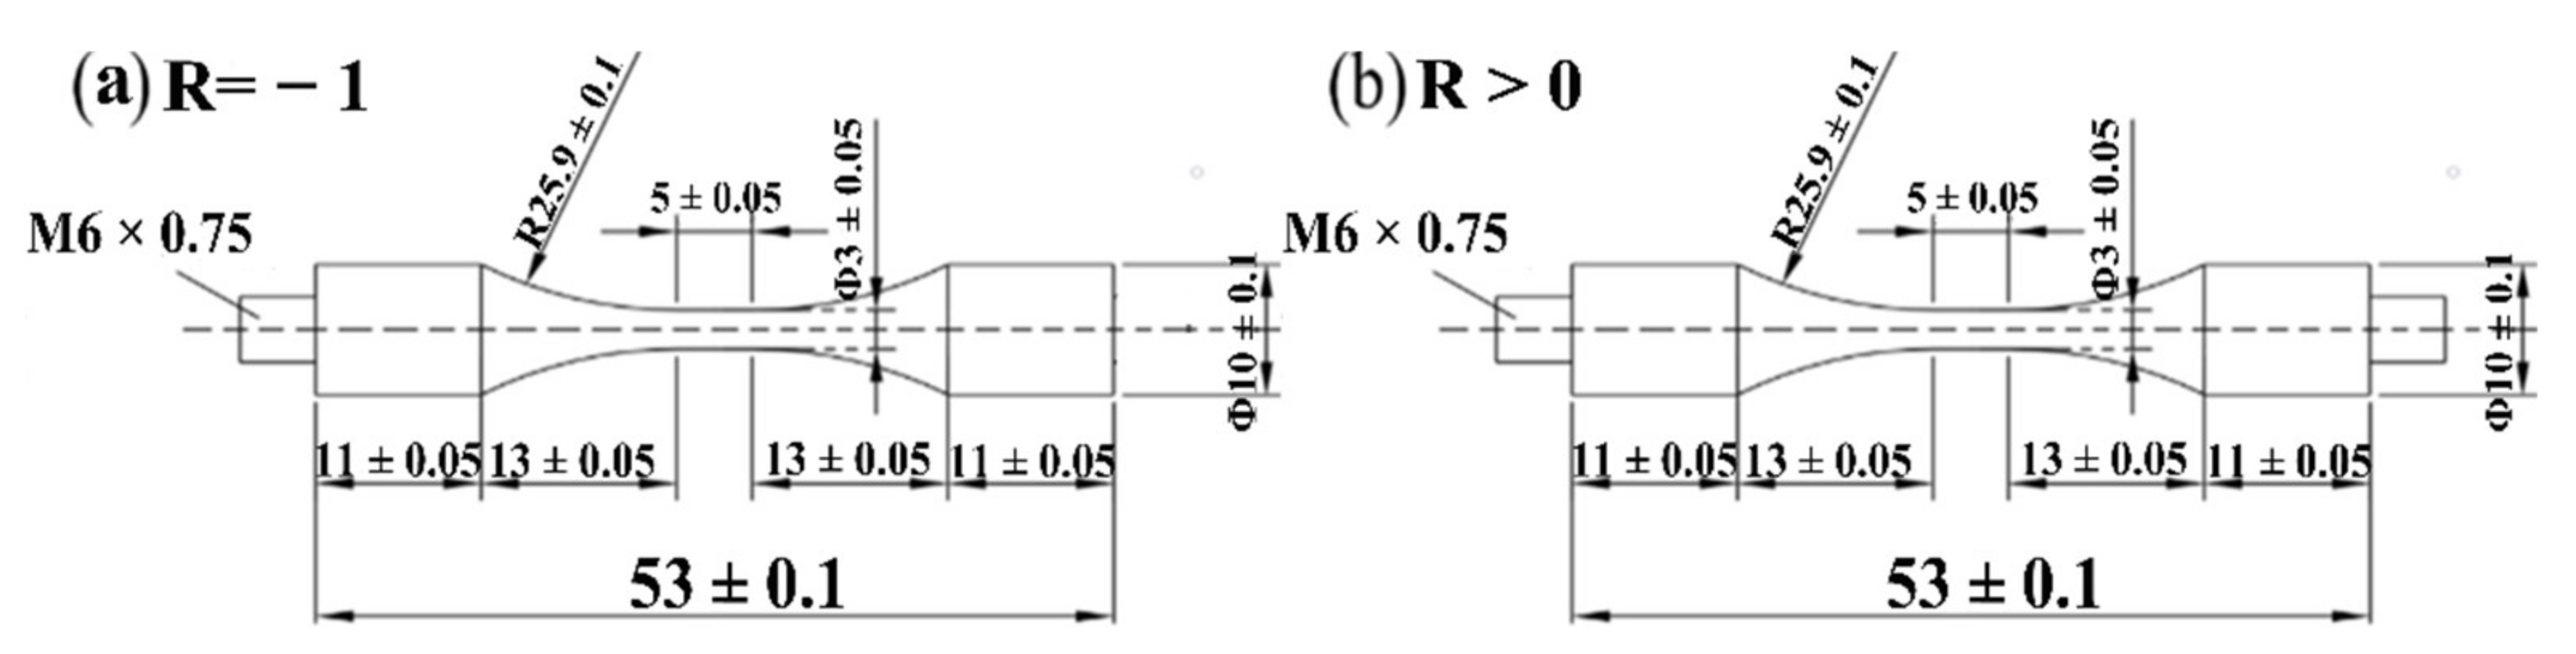
30]. There are few studies on fatigue of the alloy, and the investigation of VHCF performance has not been reported. However, it is extremely important to understand the VHCF behavior of the Ti60 alloy before it will be long term serviced in next-generation aero-engines. In this study, the VHCF behavior of the Ti60 alloy was explored by using an ultrasonic fatigue testing system with stress ratios of R = −1, 0.1, and 0.3. Fracture surfaces of failed specimens were characterized by microscopic techniques and the fatigue crack initiation and propagation mechanisms were investigated. Furthermore, the fatigue life prediction models were developed.
4. The Effect of the Stress Ratio on the Production of Fatigue Failure
Crack initiation or propagation characteristics of many steels and aluminum alloys have been studied and indicated that the estimation method combined with fractography and fracture mechanics is feasible for exploring the fatigue failure process [
9,
15,
34,
35,
36,
37]. However, the effect of stress ratio on the VHCF failure process has rarely been investigated [
19,
31].
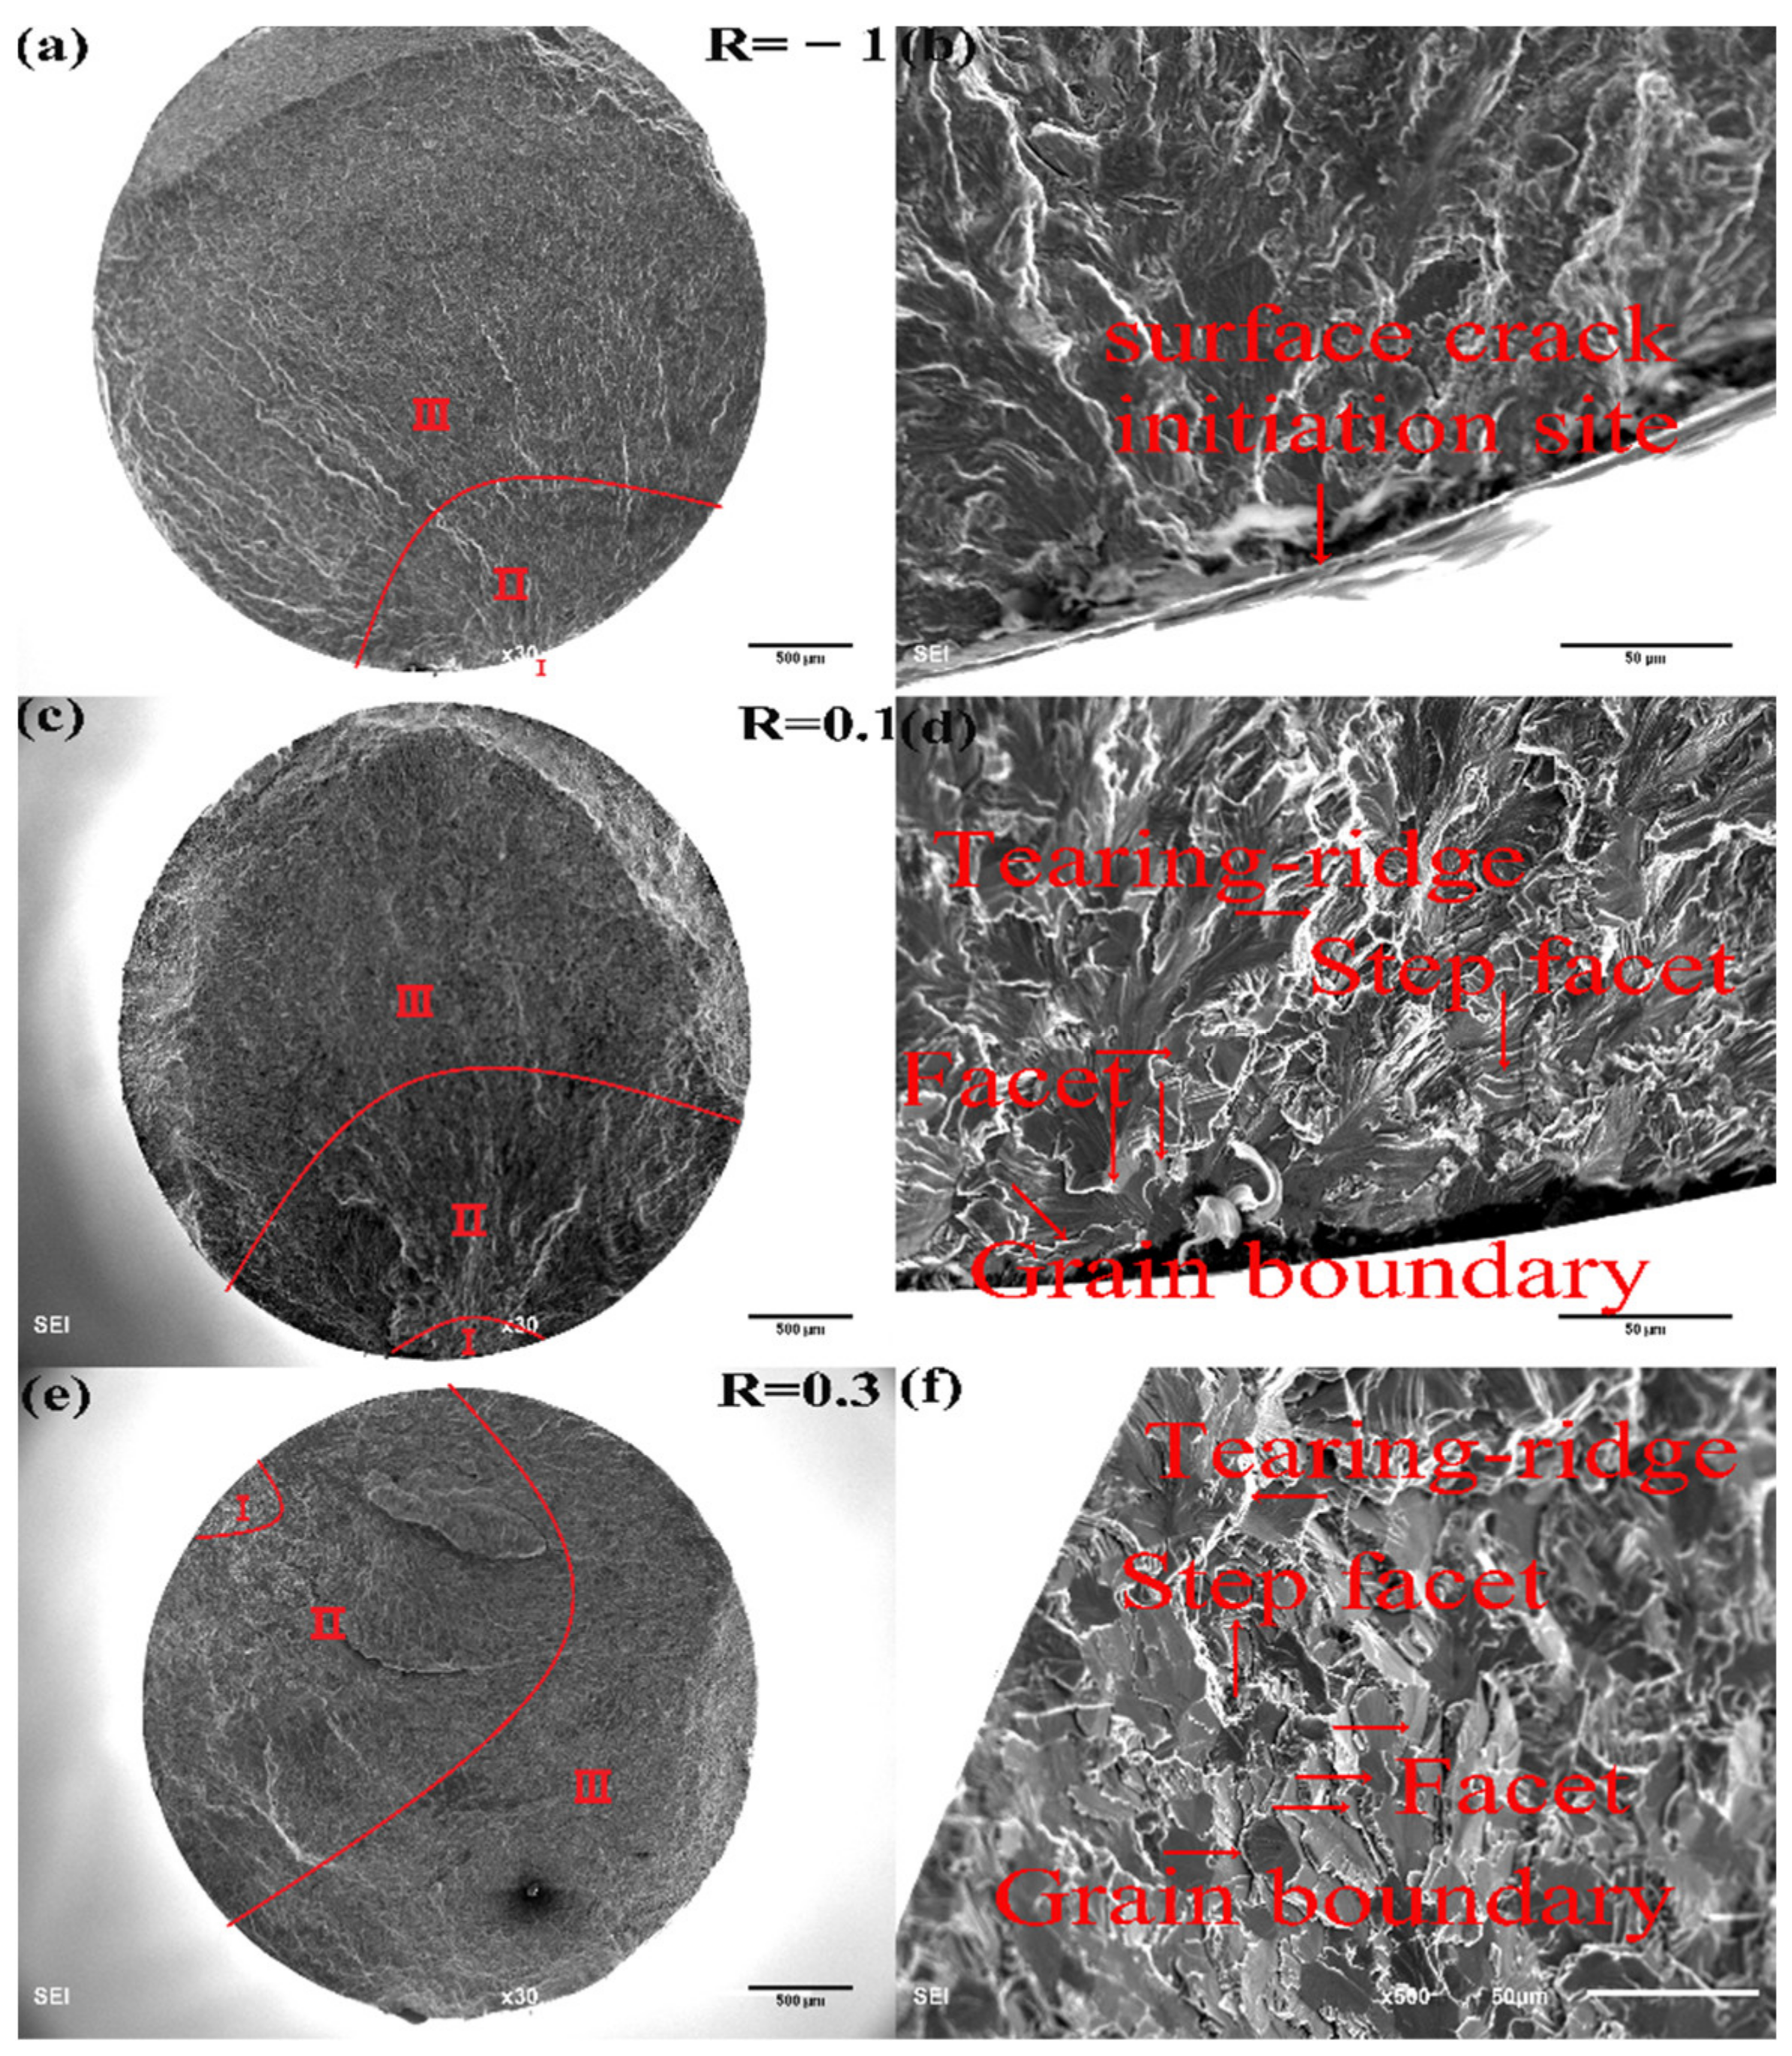
As shown in
Figure 7 and
Figure 8, the fracture surface can usually be divided into three areas. The size of regions I and II can be expressed as the equivalent size using the geometric parameter
, initially proposed by Murakami [
38]. The geometric parameter
represents the square root of the projection of the crack surface area perpendicular to the loading direction. The projected areas in all specimens were measured from fractographic morphologies in the SEM images using the procedure named Imagine J with its associative function. The relationships between the size of region I (or II) and the stress amplitude at different stress ratios are shown in
Figure 9. At the stress ratio of R = −1, Bothe the sizes of regions I and II tend to decrease with the increase of the stress amplitude. At normal stress ratios of R = 0.1 and 0.3, the values of
are very discrete in relatively small ranges of the stress amplitude. Furthermore, the stress ratio has an obvious effect on the size of the crack initiation region, that is, in the same value of
, the lower the stress ratio, the greater the corresponding stress amplitude.
The stress intensity factor (SIF) amplitude (
) of the crack tip for the region I has been calculated using the value of
based on the equation as follows [
16]:
where
n is a constant determined by the position of the crack, and
n = 0.65 for the surface crack initiation, while
n = 0.5 for subsurface crack initiation;
is the stress amplitude. The calculations of
for all specimens are shown in
Figure 10. The values of
are found to fluctuate near a constant at each stress ratio. The mean value of
is obtained to be 4.36
at R = −1, and it decreases to be 3.96
at R = 0.1. Moreover, at R = 0.3, the mean value of
is found to be 3.81
for specimens with surface crack initiation and 3.48
for those with subsurface crack initiation, respectively, which indicates the
value of surface-initiated crack is greater than that of internal initiated crack, and this may be attributed to the crack closure effect [
39]. Then, the standard error of the mean values and standard deviation of
were calculated, and the results were in
Table 4. A further conclusion can be drawn that the mean value of
decreases with the increase in stress ratio.
5. Fatigue Strength Prediction
The mathematical model to predict the fatigue strength for titanium alloys is not available in the open literature to the best of our knowledge. Murakami [
16] has developed an experiential formula to predict the fatigue strength limit using the size of defect or inclusion which is given in the equation below:
where
σw is the limit of the fatigue strength,
HV is the Vickers hardness,
M is a constant dependent on the crack initiation position, and
M = 1.45 for surface crack initiation, while
M = 1.56 for interior crack initiation.
The model physically means that critical stress exists when the area size of the defect or inclusion is equal to a special value. When applied stresses are lower than the critical stress, the crack does not propagate. Therefore, the critical stress can be considered as the fatigue limit of the special area.
The threshold of the stress intensity factor Δ
Kth has a similar meaning to critical stress. However, titanium alloys have no defects or inclusions, in this case, the area of the region I can be used to define the defect or inclusion area, and fracture facets in this area can be considered as defects. The difference is that facets are developed during fatigue tests in titanium alloys while defects or inclusions have originally existed in other alloys. Murakami’s model aims to acquire the fatigue strength limit at 10
7 cycles. The predicted cycles for VHCF will be larger than the experimental one when the fatigue life is larger than 10
7, and the formation of the facets will consume the energy to make the prediction smaller. Therefore, it is more reasonable to add a modified factor ξ to Equation (3) for predicting the fatigue strength of a titanium alloy follows:
where ξ is a modified factor considering the distinction between the defect/inclusion and facet. The value of ξ takes 1.35, 0.75 and 0.65 when the stress ratio R = −1, 0.1 and 0.3, respectively, and the fitting results are shown in
Figure 11. Especially, facets could be observed when the crack initiated from the interior at R = −1, so the predicted fatigue strength is only suitable for this case.
When R > 0, the errors of the predicted values (
σw −
σa)/
σa × 100% are between −15% and +15% as shown in
Figure 11, which indicates the fitting results are feasible. When R = −1, the results are discrete, which is associated the high discrete data of titanium alloy fatigue [
11], while the errors are between −15% and +15%, the conservative prediction results could be adopted when applying this mold at R = −1.
Therefore, the modified equation based on Murakami’s model is suitable for predicting the fatigue strength limit of metal materials without defects or inclusions. The model has great advantages because the form is simple with few parameters and the Vickers hardness of a material is easy to be obtained. However, this model lacks relationship with the fatigue life, and the prediction is inaccurate when the crack initiation area is small such as R = −1.
6. Fatigue Life Prediction of Internal Crack Initiation
Mayer et al. [
40] have deduced an equation to predict the fatigue strength in the VHCF regime, which involves the relationship between the size of the inclusion and the stress amplitude shown as follows:
where
σa is the stress amplitude,
Nf is the fatigue life,
is the size of the inclusion,
C and
m are parameters depending on the material.
Based on Equation (5), let the area of the region I replace the size of the inclusion, one can have:
where Δ
K is the stress strength factor;
n is a constant depending on the position of the crack, and
n = 0.65 when the crack is initiated from the surface, while
n = 0.5 when the crack is initiated from the interior; Δ
σ is the applied stress amplitude, and Δ
σ =
σa at R = −1, while Δ
σ =
2σa when R > 0. In this paper, only interior crack initiation issues were investigated.
Equation (7) can be obtained by plugging Equation (6) into Equation (5):
Equation (8) can be gotten by simplifying Equation (7):
Let
t = −
n/3, we can acquire:
where
C and
t are material parameters.
The parameters of
C and
t in Equation (9) are obtained by fitting the experimental fatigue data at different stress ratios as shown in
Table 5. Moreover, the predicted fatigue lives can be calculated, which are shown with experimental ones in
Figure 12.
The predicted fatigue lives are in agreement with the experimental ones shown in
Figure 12, which indicates Equation (9) applies to the life prediction of the Titanium alloy.
Furthermore, another predicted fatigue life model based on Sun [
41] (shown in Equation (10)) was used to make a comparison with the former model.
where
Ni is the fatigue life of the crack initiation,
σY is the yield strength,
aFGA is the size of the FGA,
,
a0 is the size of the inclusion,
,
l and α are the material parameters.
Some modifications have been carried out for our work based on the Sun’s model. The maximum size of the plastic zone
rp in the case of plane strain can be expressed as Equation (11) [
41],
where
σY is the yield strength.
In the Sun’s model [
41], the inclusion, FGA and crack area after
i (
i = 1, 2,…,
n) cycles are approximately treated as internal penny cracks in an infinite solid, and the value of
ai-
ai−1 (
i = 1, 2,…,
n) is defined as “equivalent crack growth rate”, where
ai is the positive square root of the crack area after
i cycles, and
a0 is the positive square root of the inclusion projection area perpendicular to the applied stress axis. Furthermore, it is assumed that the equivalent crack growth rate in the FGA region is related to the maximum size of the plastic zone at the crack tip.
In this paper, the sizes of α
p and region I are used to replace the size of inclusion and FGA, respectively [
38].
The equivalent crack length after
n cycles can be given by:
From Equation (12), the fatigue life
NI consumed in the region I can be obtained by the minimum of
n.
The Equation (14) can be approximately solved as,
where
β′ =
.
Since the fatigue life consumed in crack initiation is very long in the VHCF regime, the value of
β′ is much smaller than one. Taking ln (1 +
β′) in Equation (15) for the Taylor series expansion, we can have,
According to the analysis of Sun [
39], we can satisfy the Equation (16) and a new fatigue life prediction model for the Ti60 alloy in the VHCF regime can be derived as,
The values of
α and
l at different stress ratios can be obtained by fitting the experimental data and the results are given in
Table 6.
The predicted fatigue lives are compared with the experimental ones shown in
Figure 13. The data disperse around the line
y =
x, which means the predicted fatigue live are well in agreement with the experimental ones, while the dispersion of the former model is relatively greater. So, the fatigue life prediction for the Ti60 alloy can also be carried out by Sun’s model.
From the analysis of the two models above, we can conclude that the size of the region I which has several facets has a similar physical meaning as the size of defects or inclusions, so the region I area can be used to replace the defect or inclusion area for titanium alloys in VHCF studies.


 ,
, 


