
Aerobic Biostabilization of the Organic Fraction of Municipal Solid Waste—Monitoring Hot and Cold Spots in the Reactor as a Novel Tool for Process Optimization


Abstract
:
1. Introduction
2. Materials and Methods
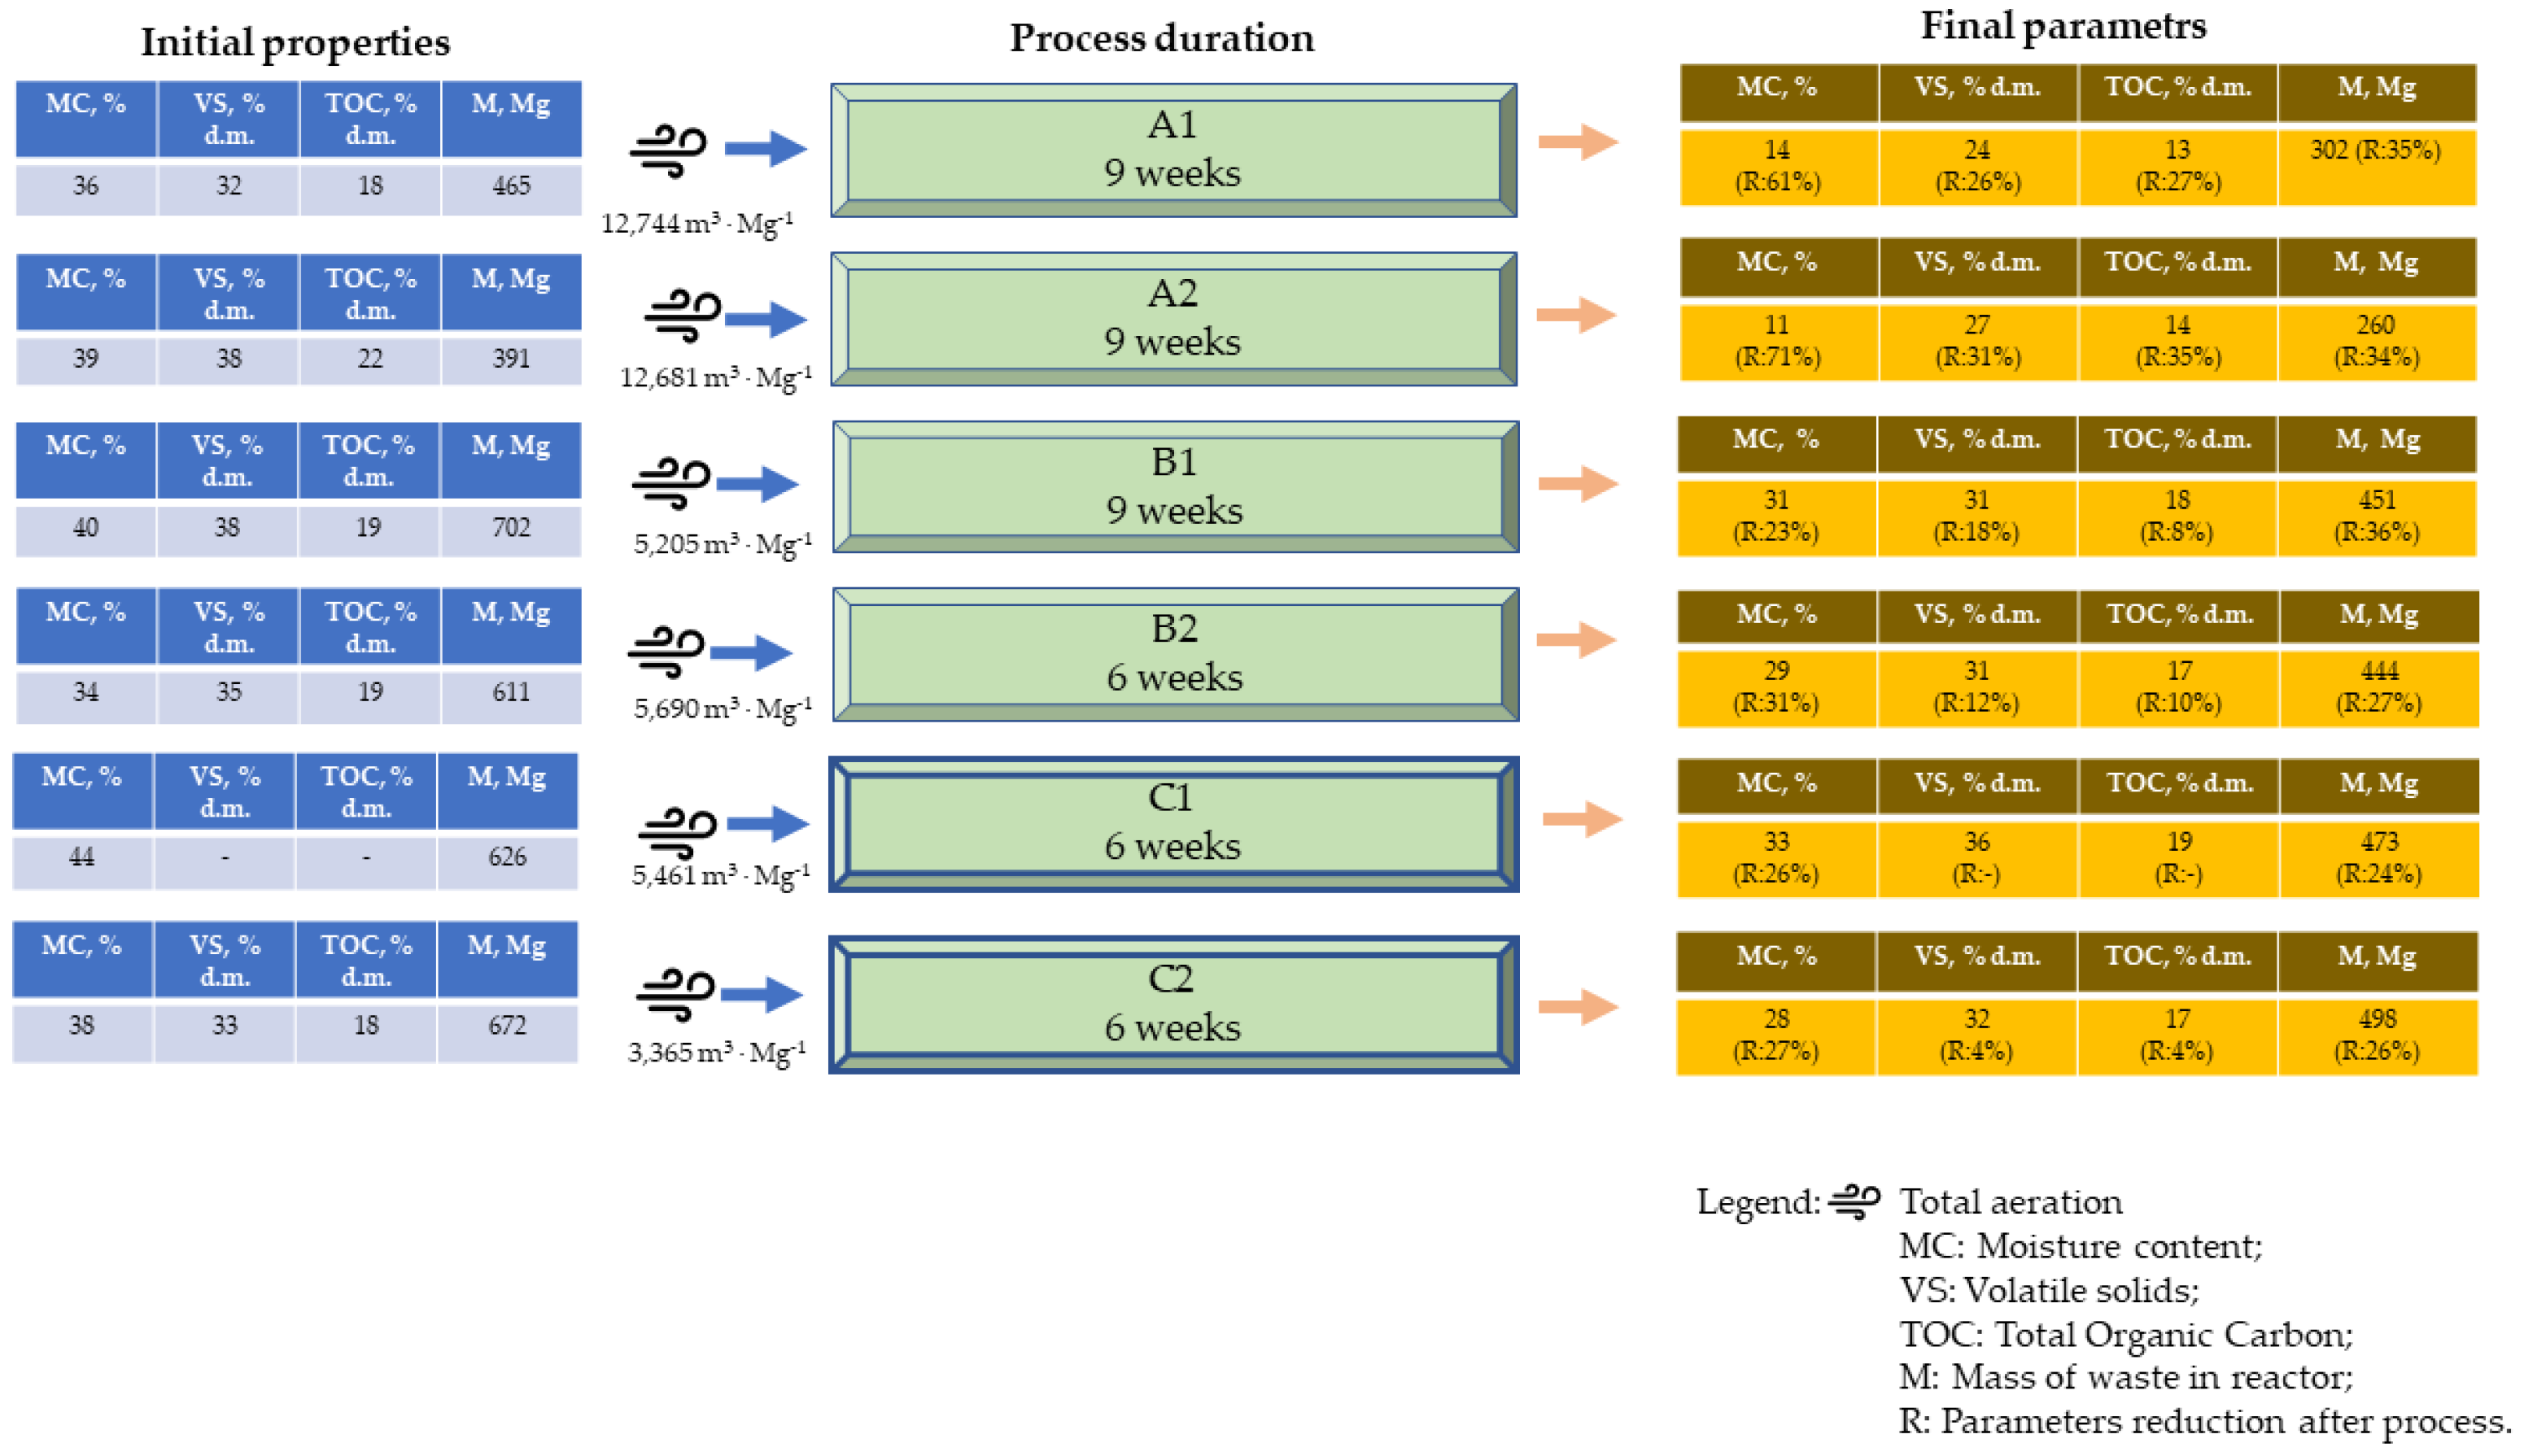
2.1. Characteristics of Organic Fraction of Municipal Solid Waste
2.2. Process Configuration
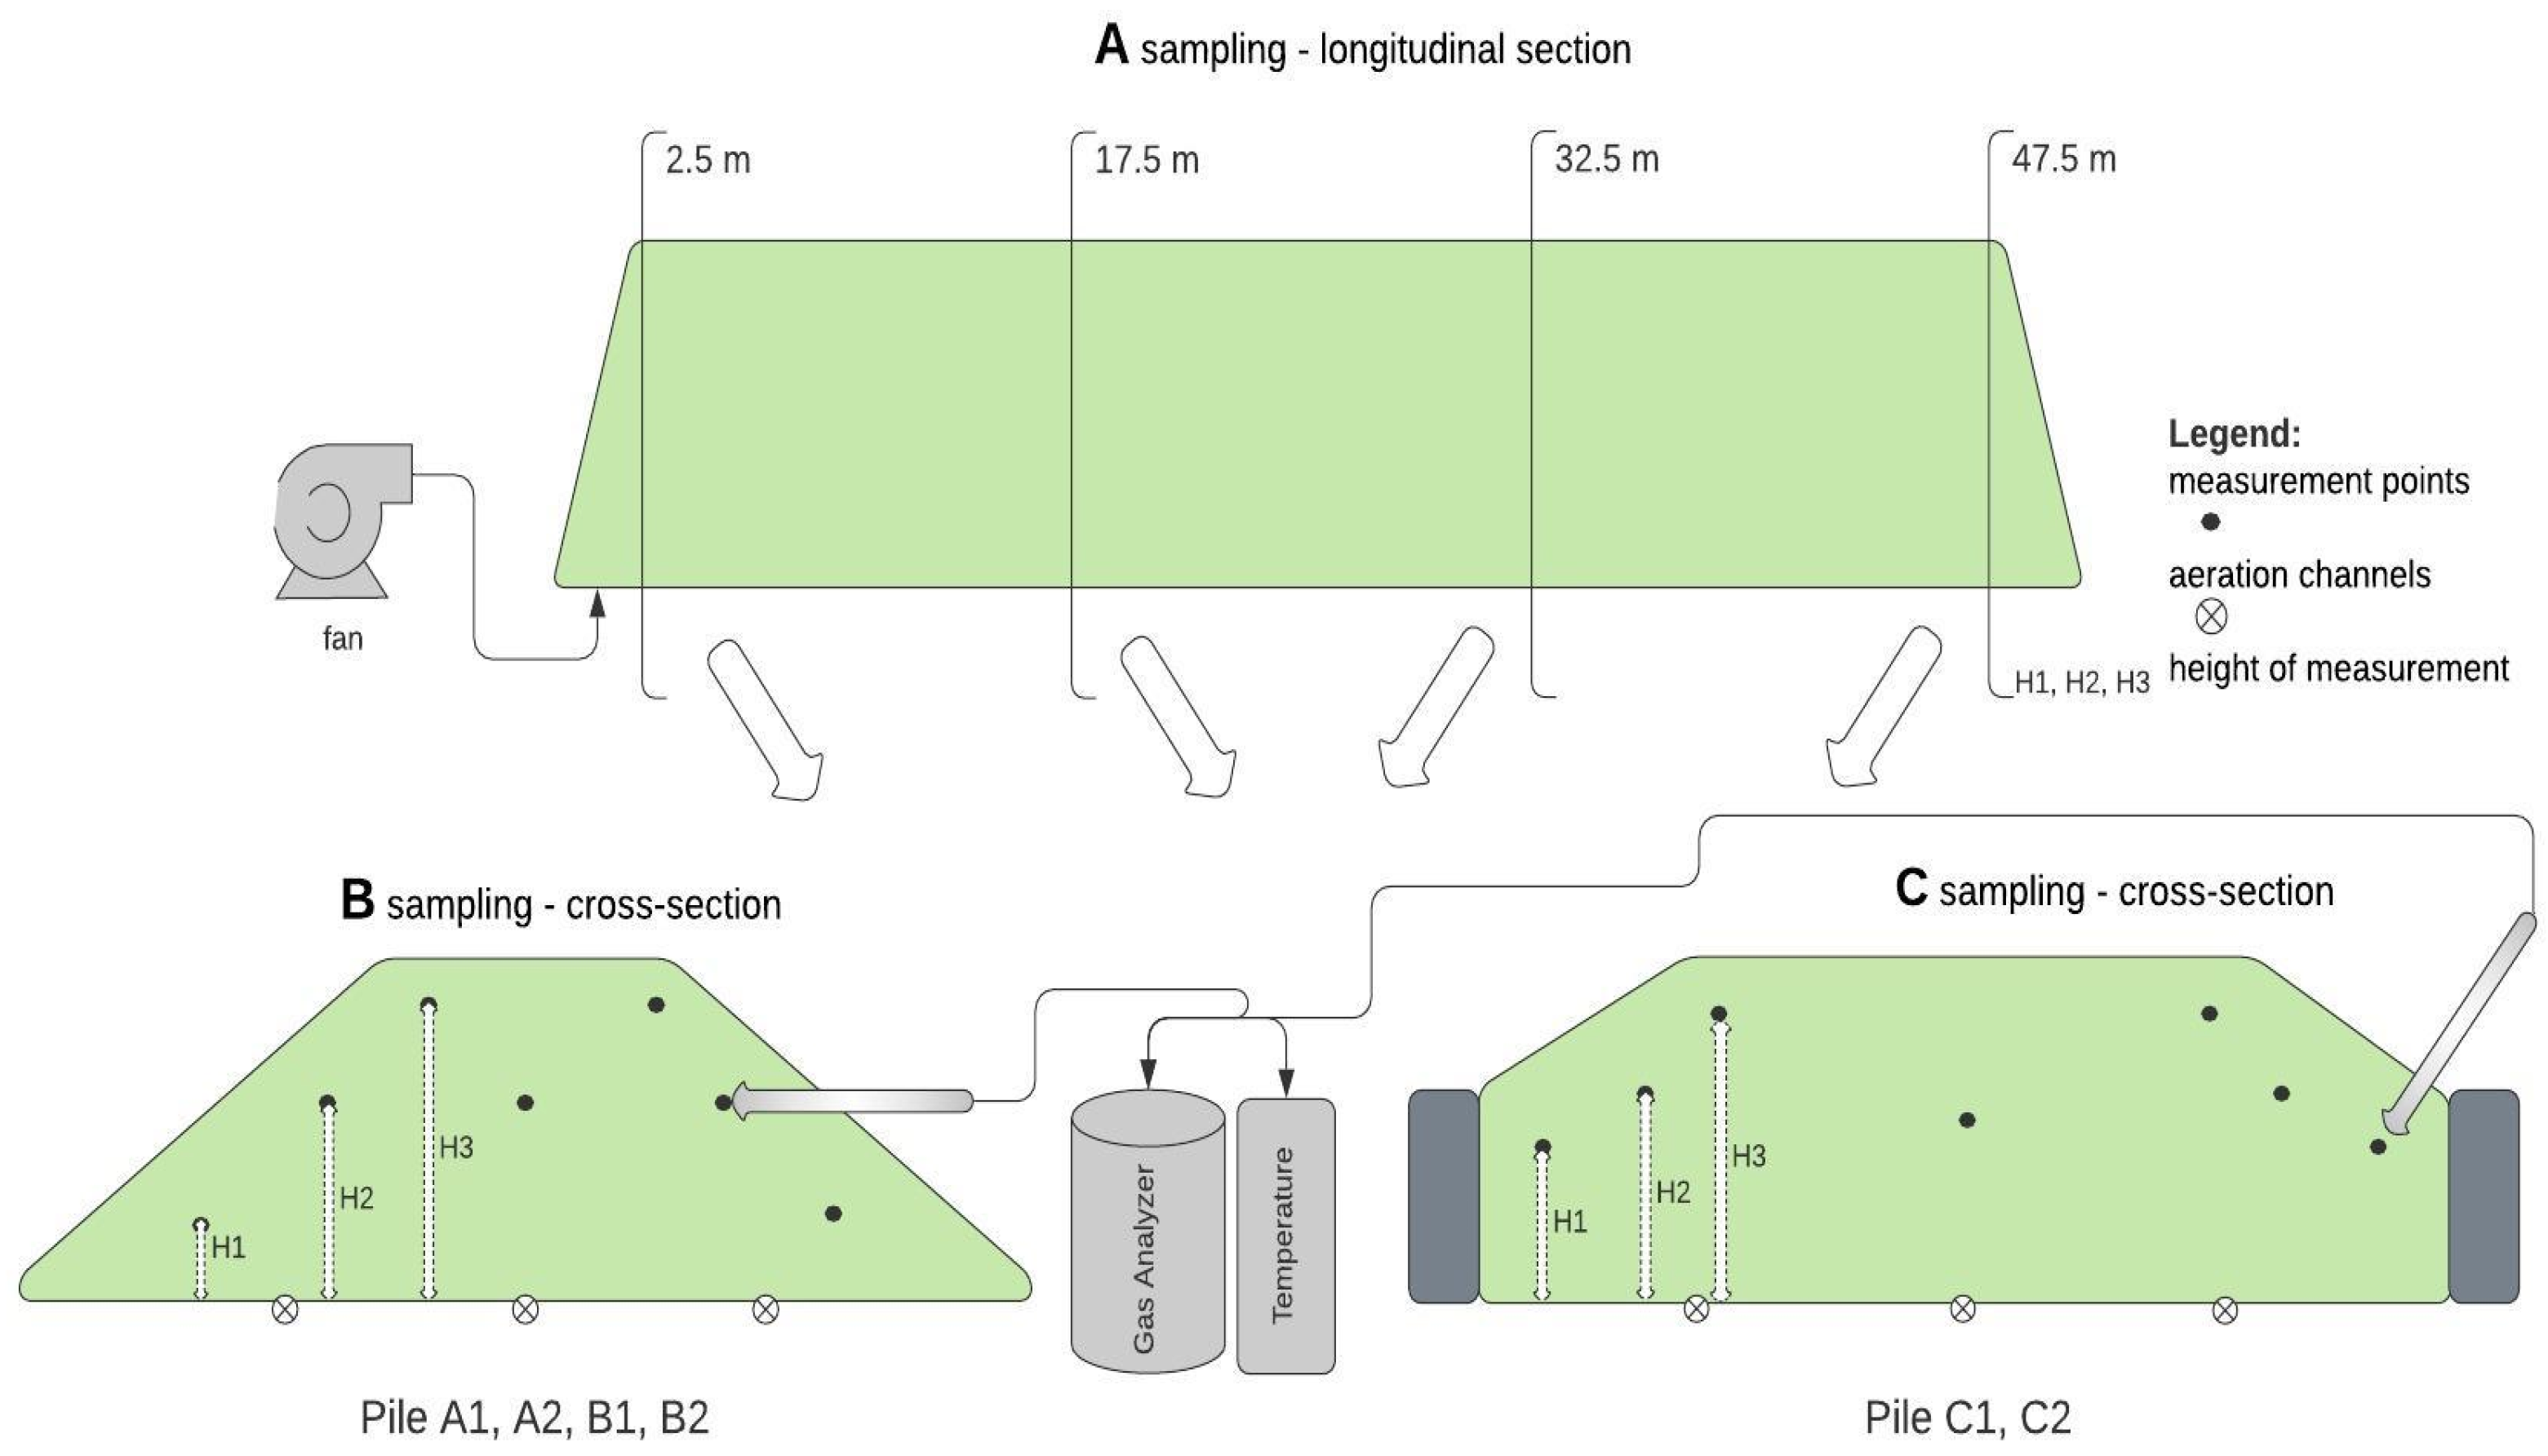
2.3. Gas Concentrations and Temperature Measurements
2.4. Spatial Distribution Modeling
3. Results and Discussion
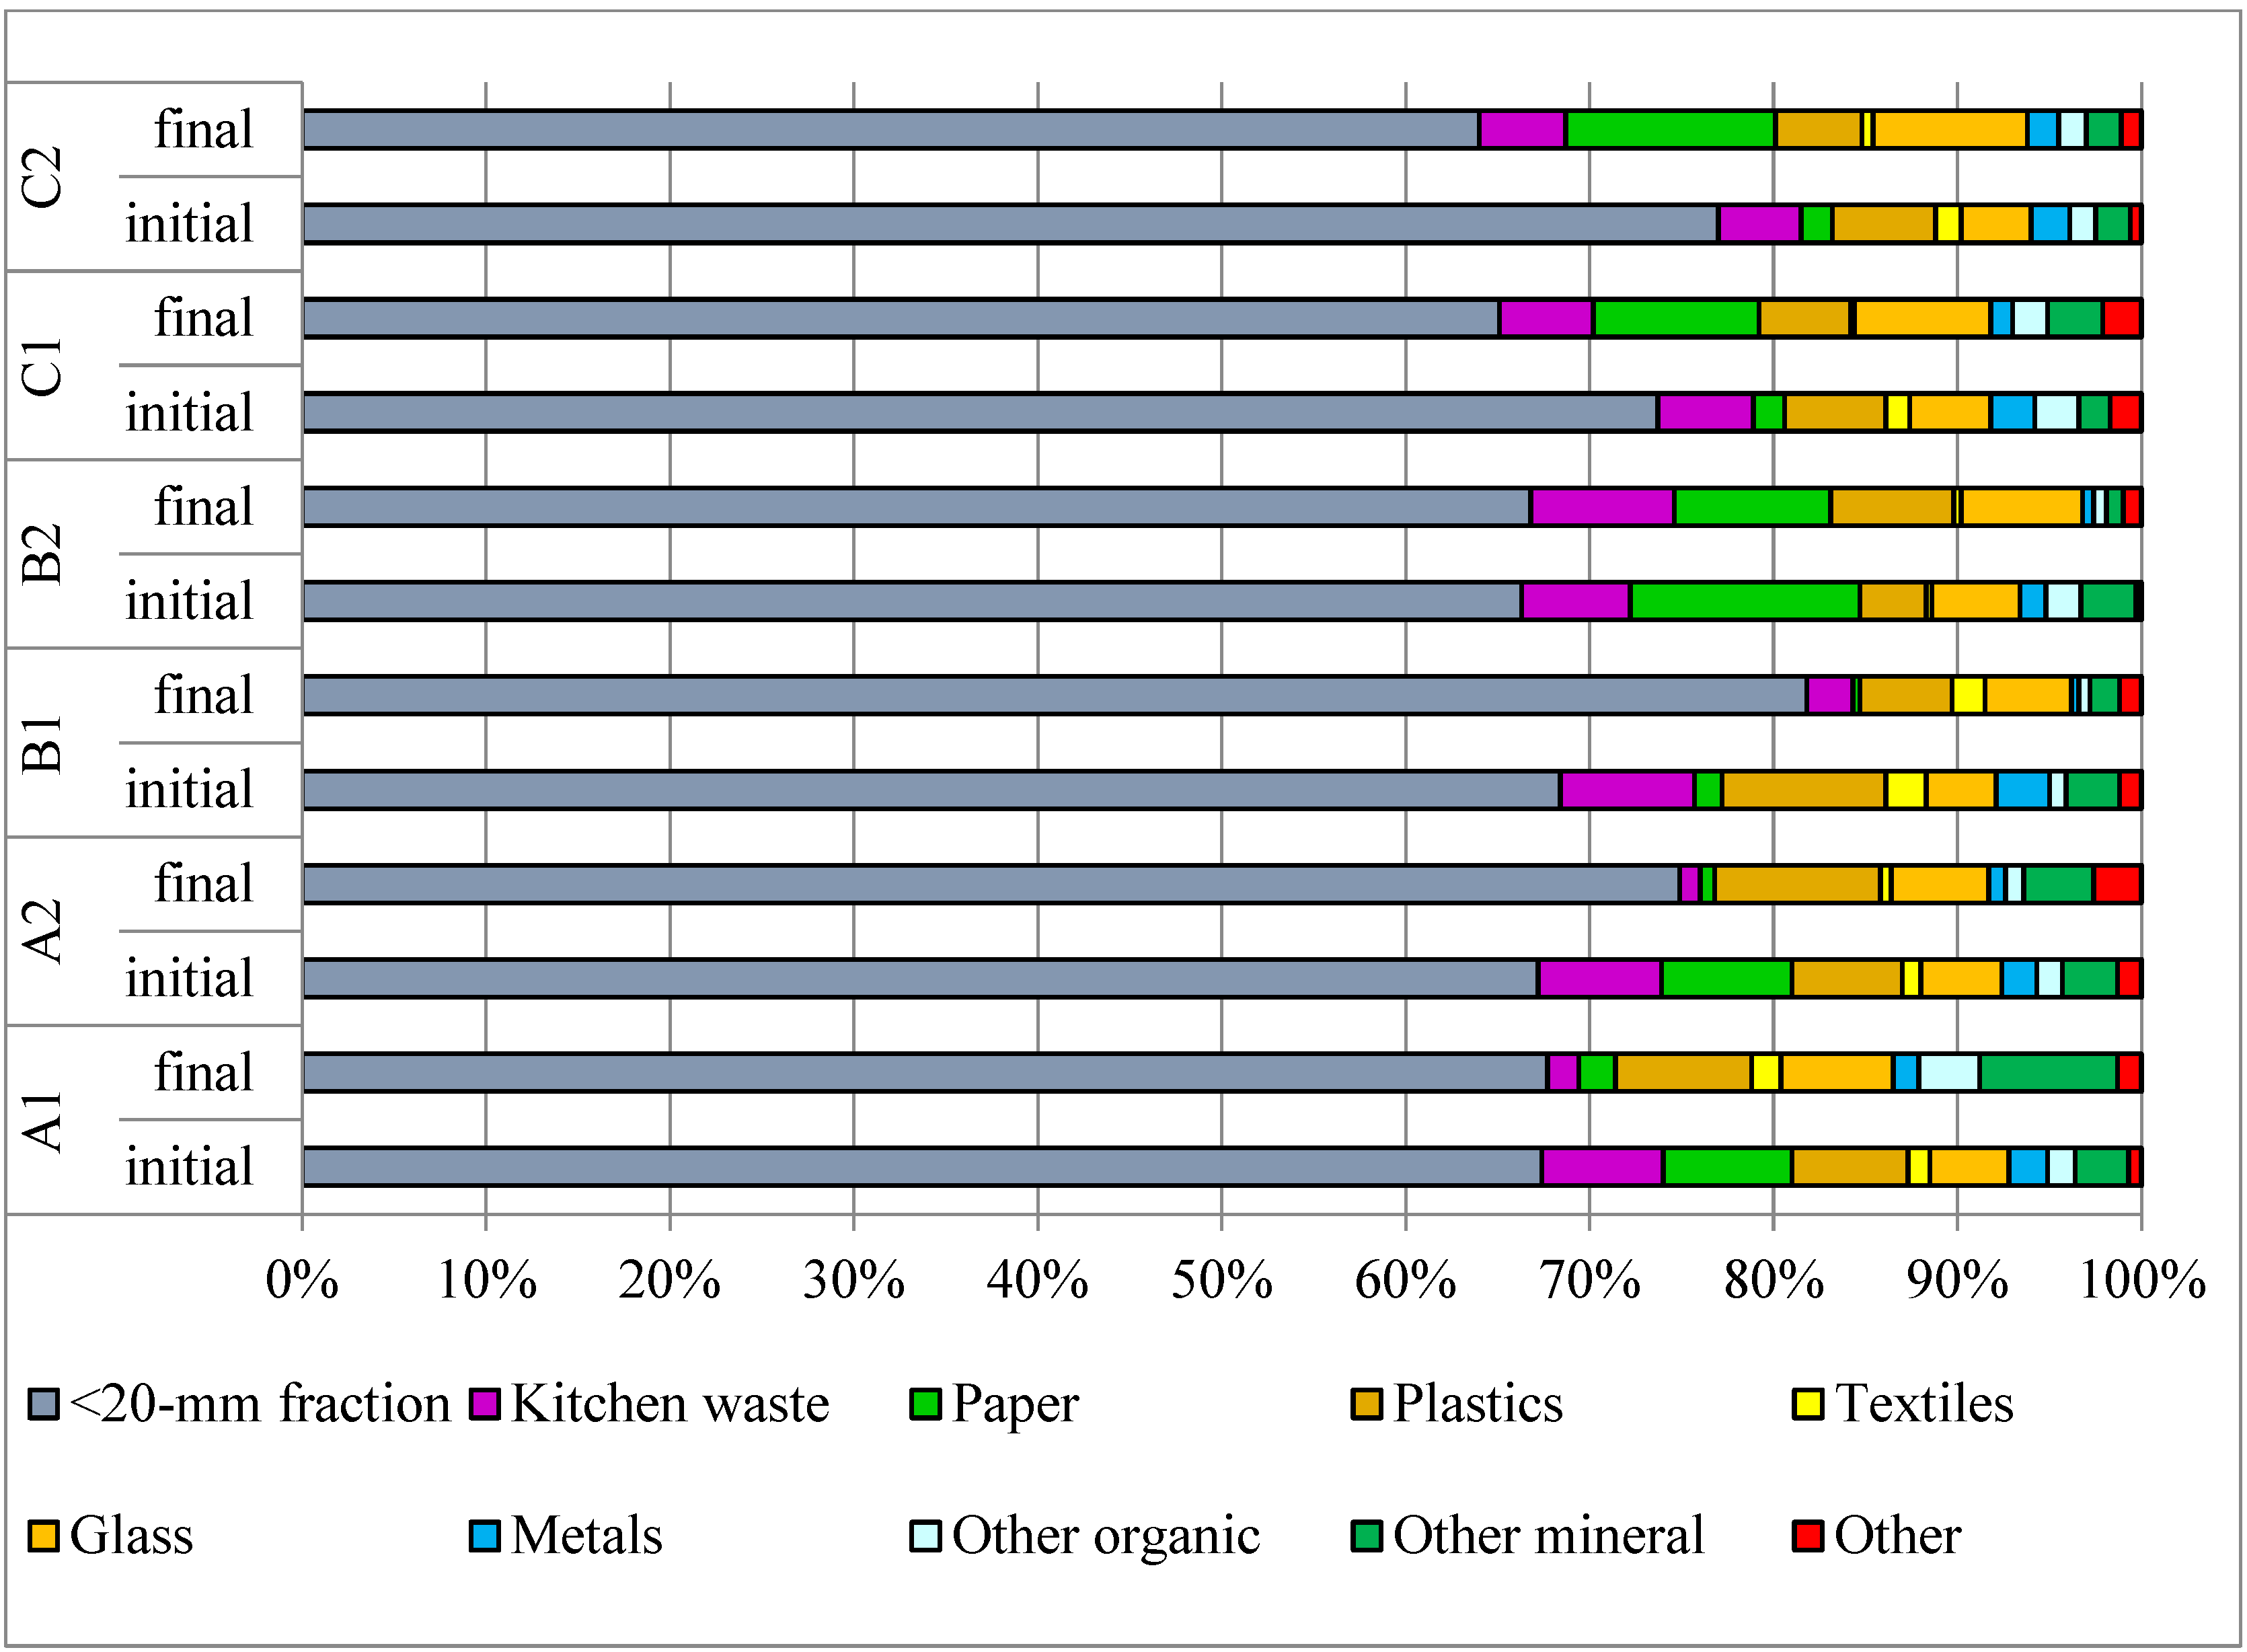
3.1. Waste Properties
3.2. Spatial and Temporal Distribution Changes
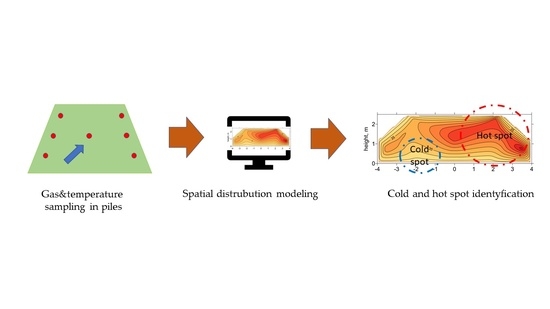
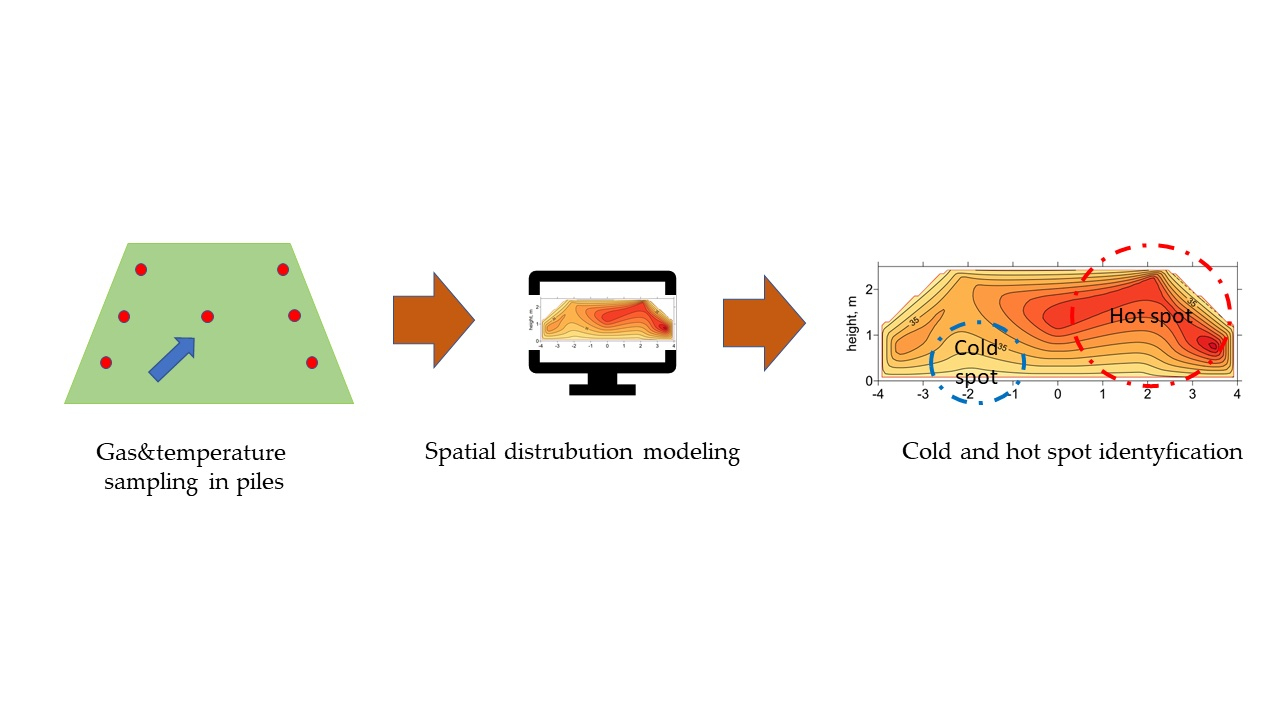
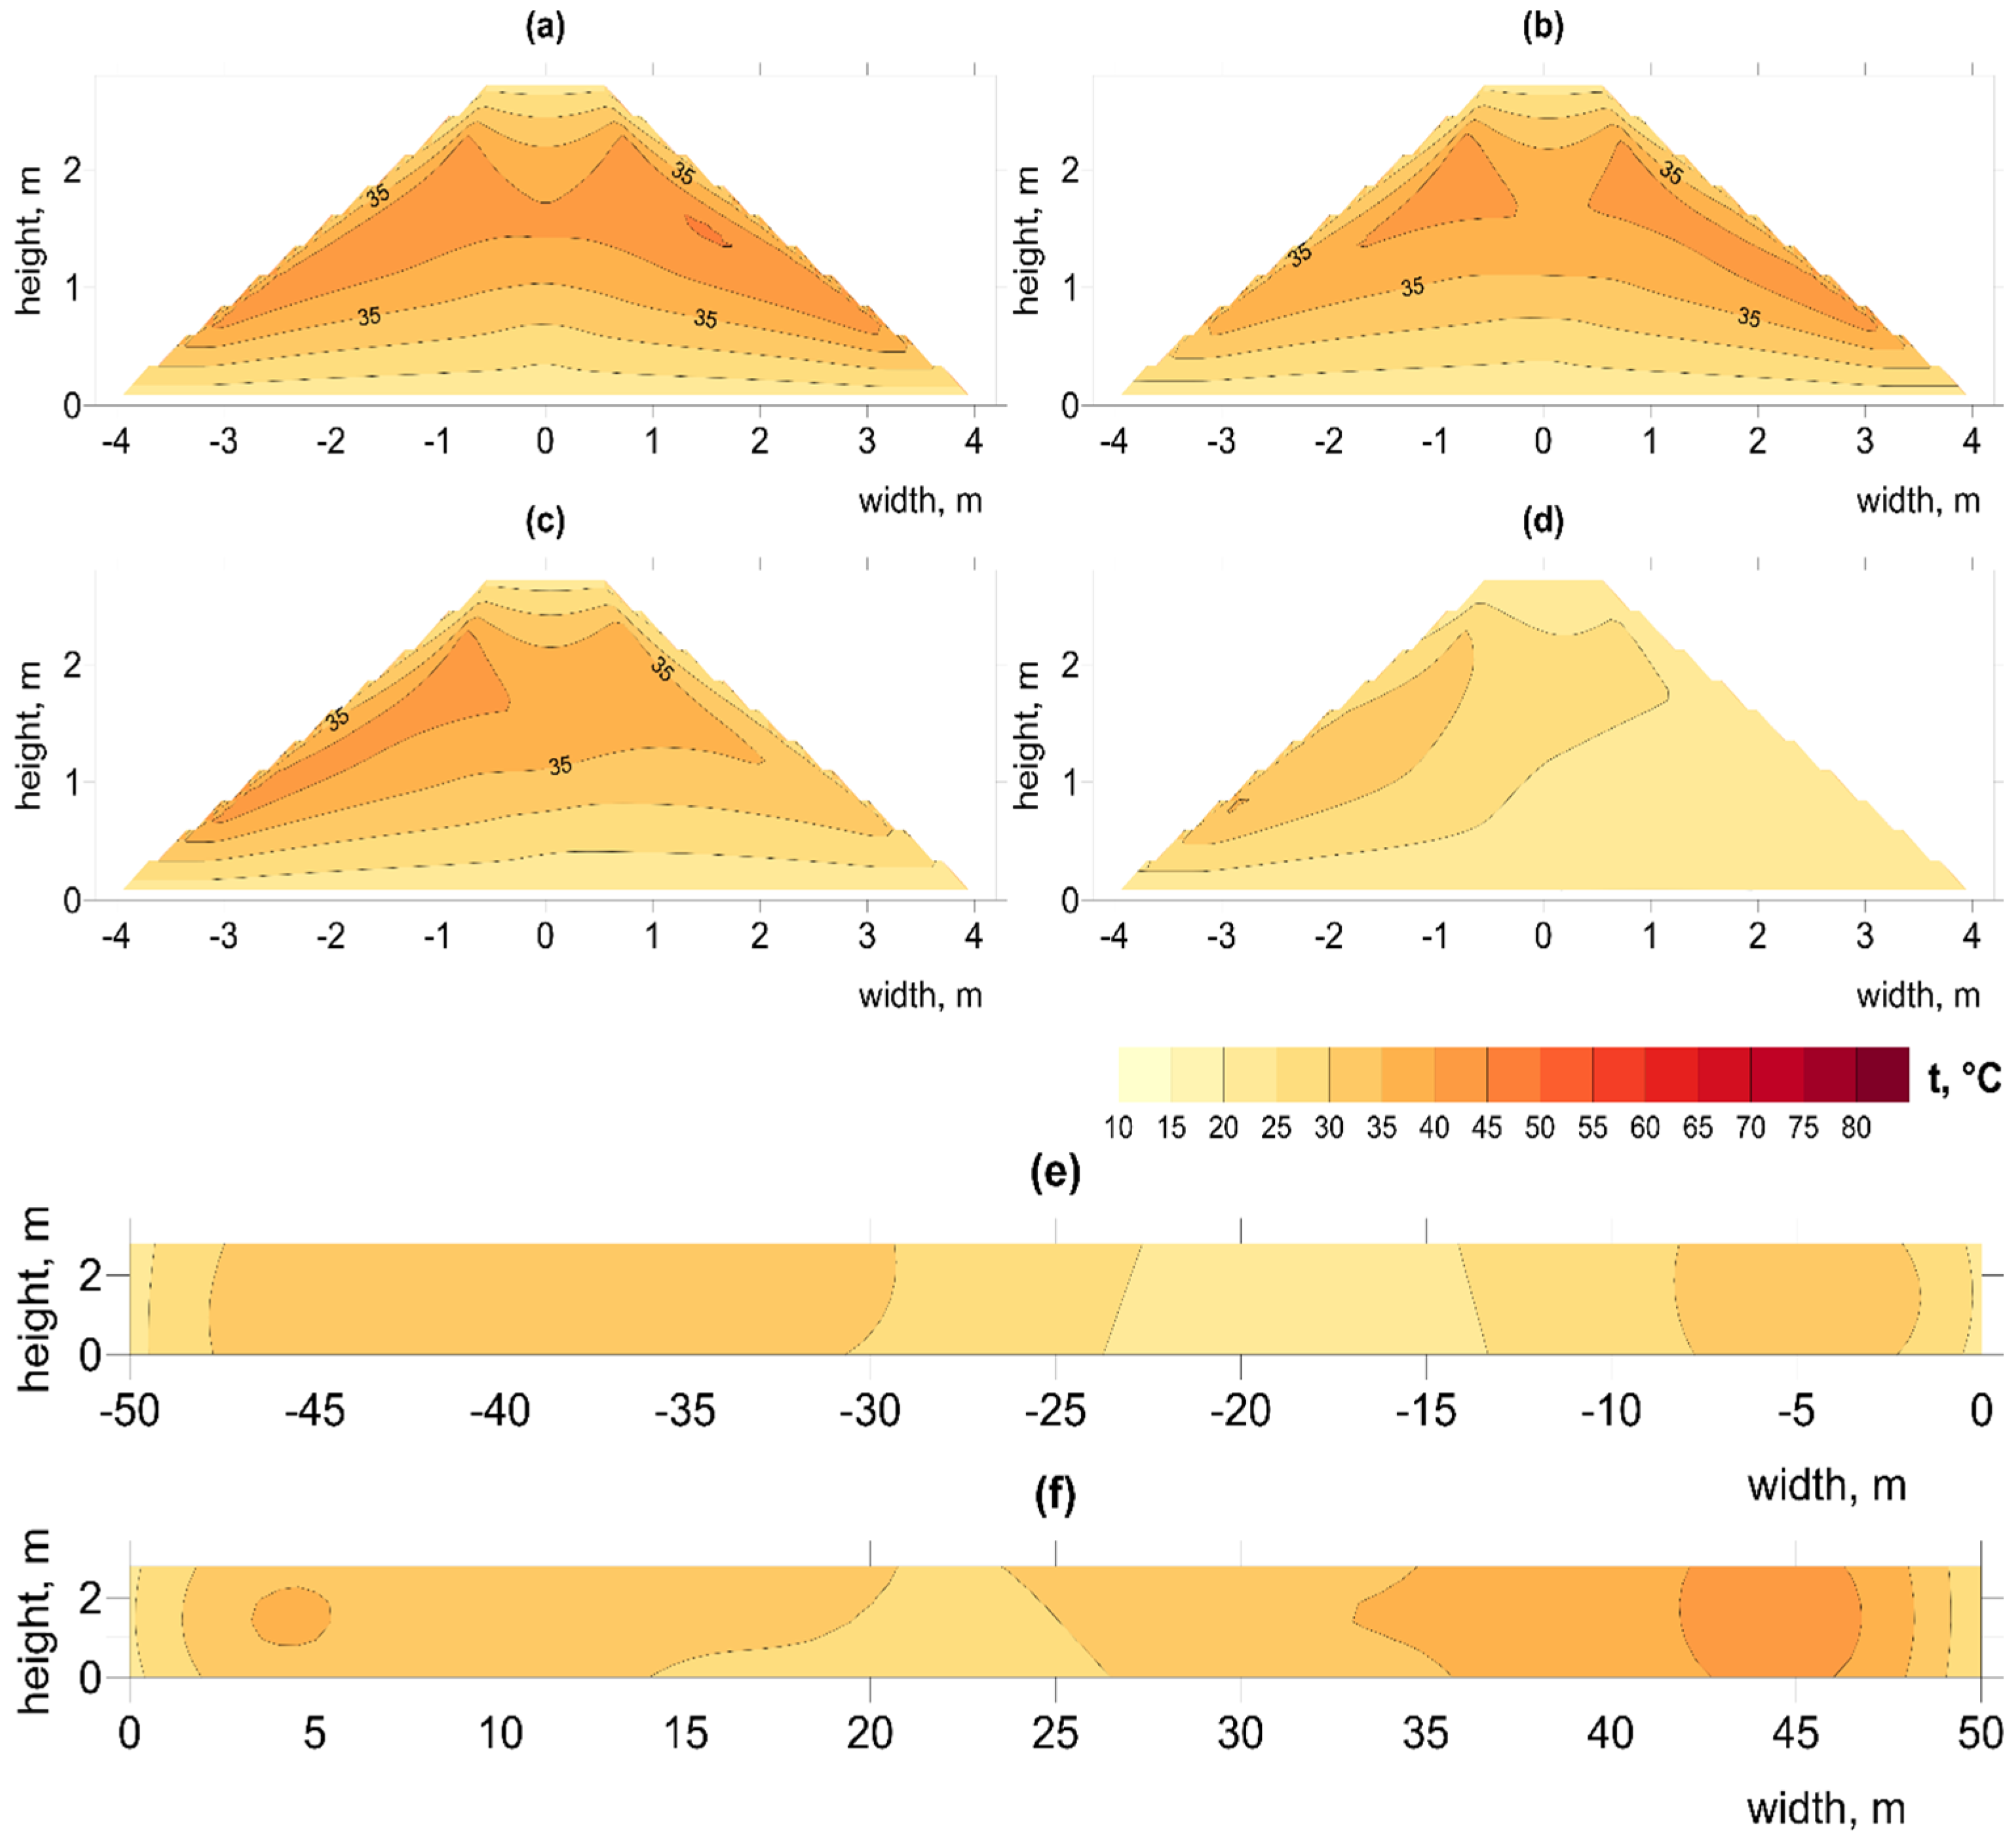
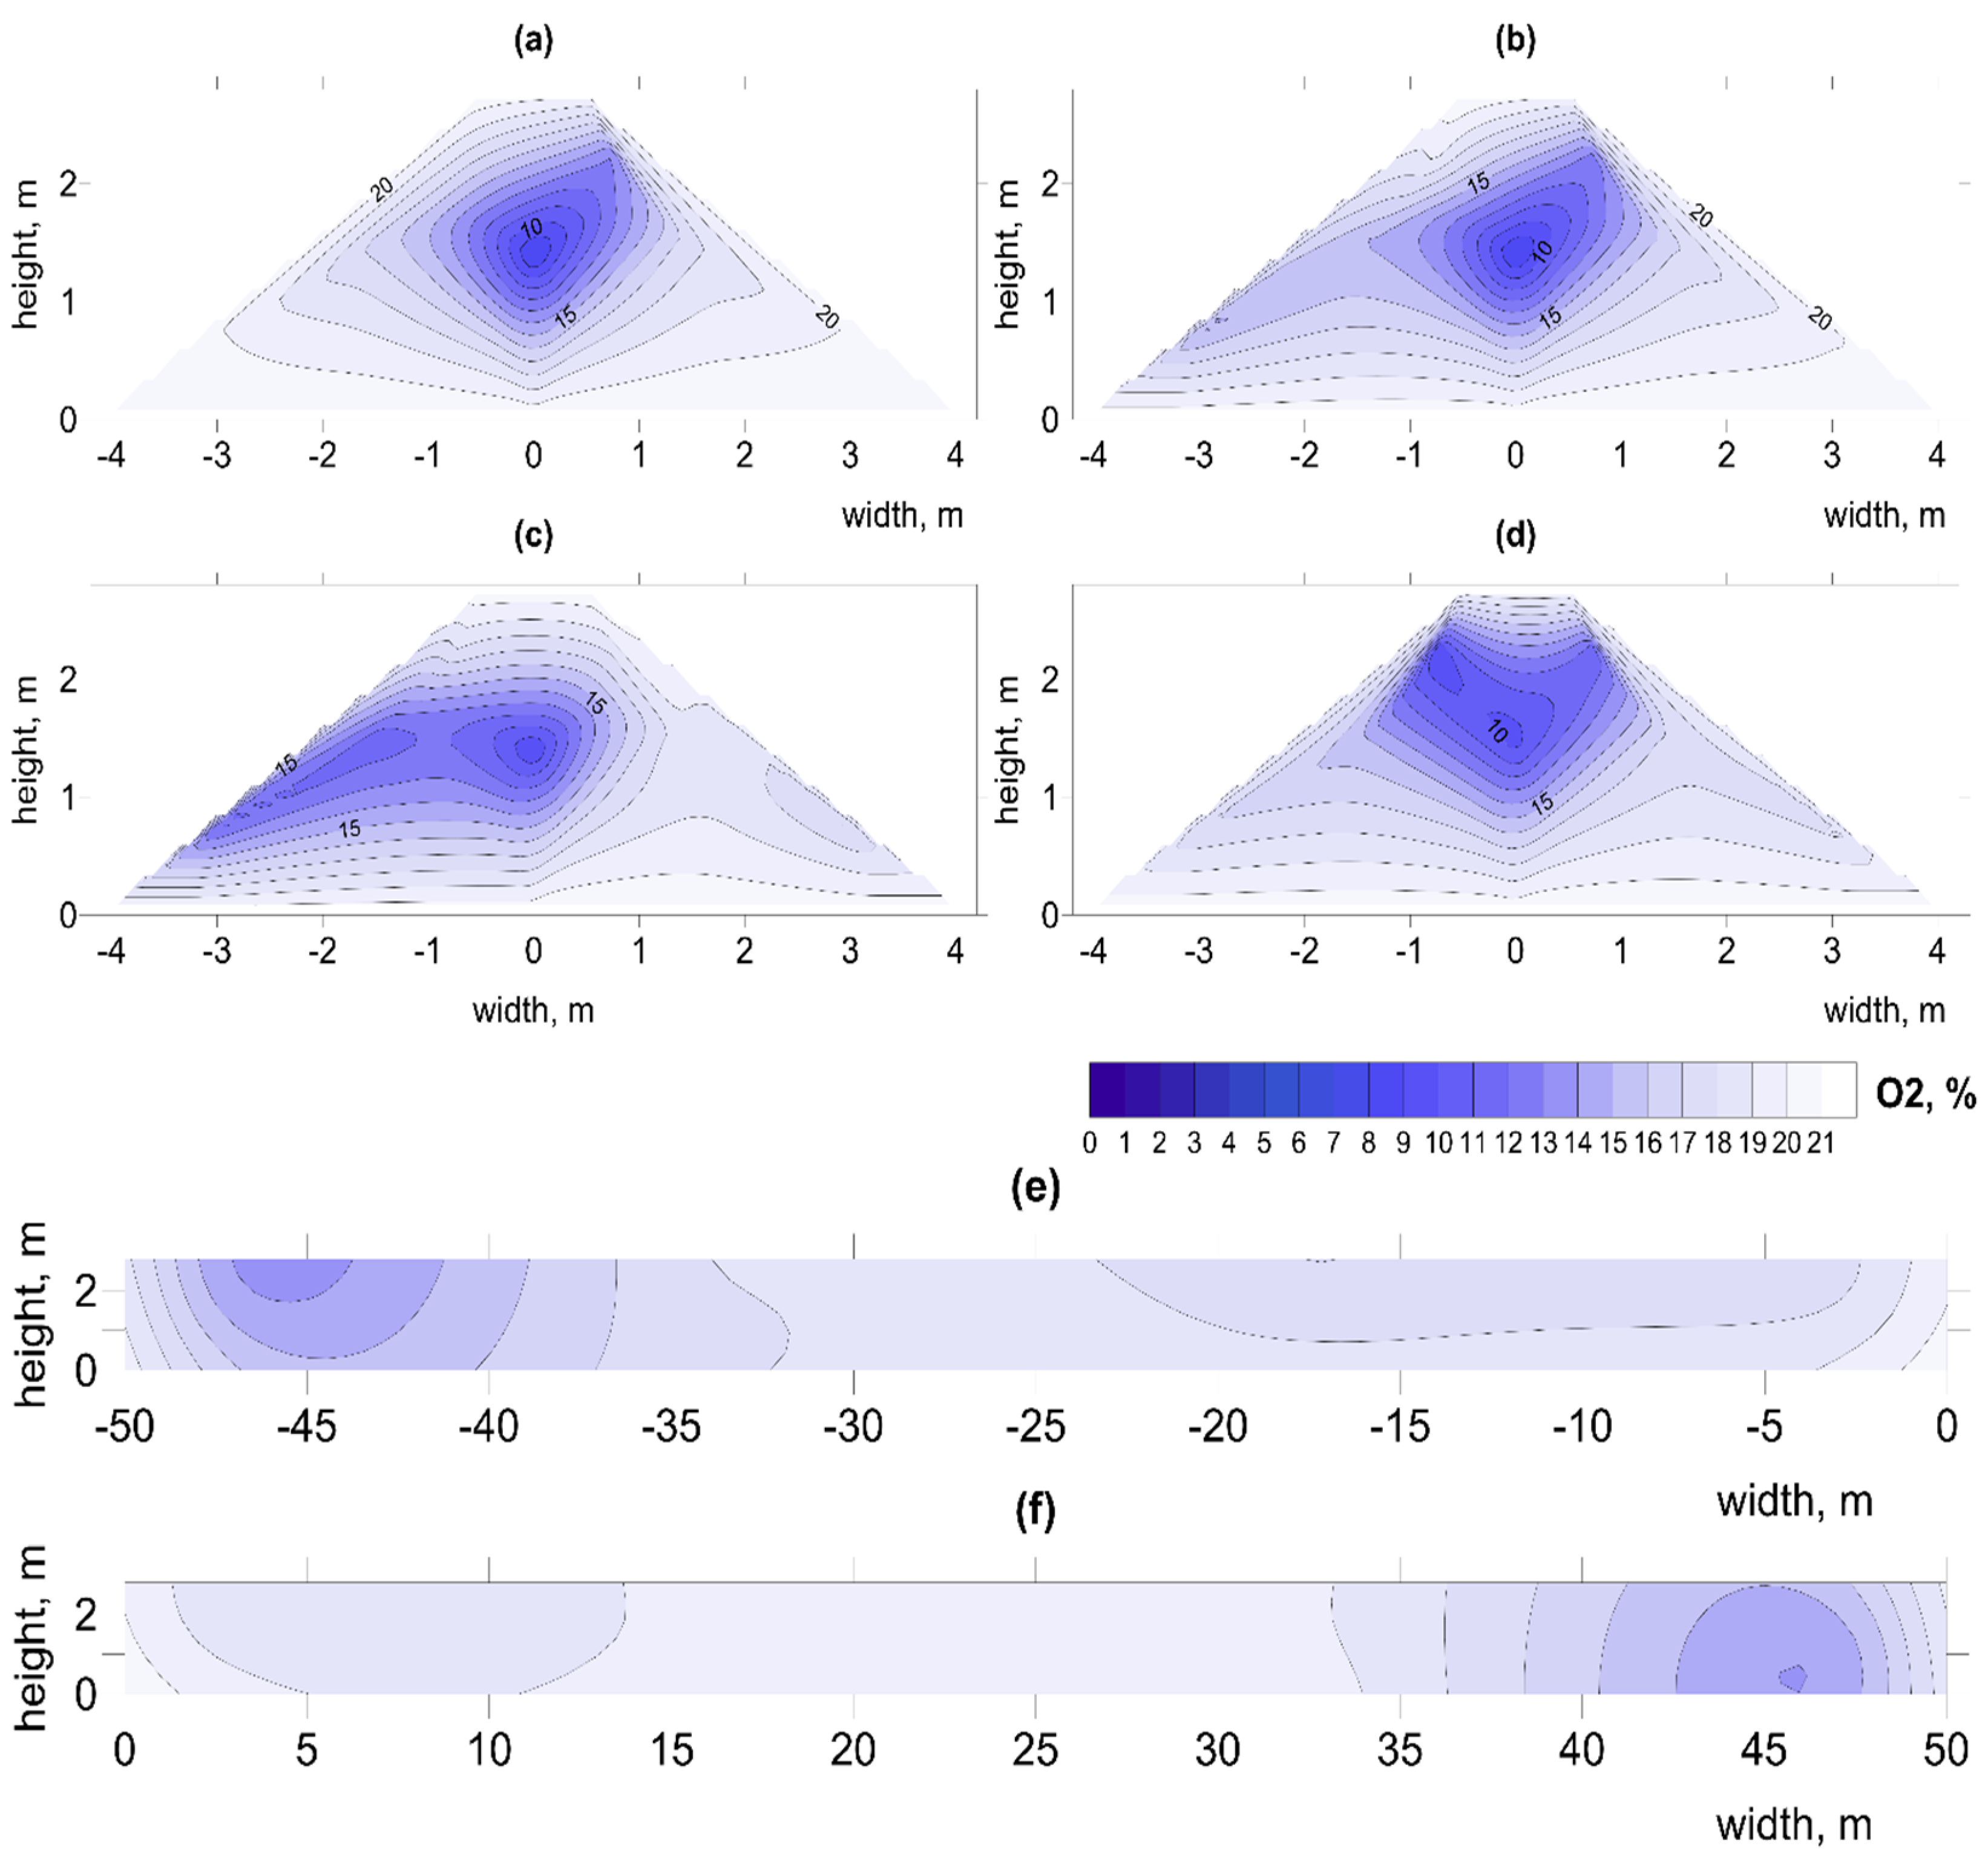
- Hot spots—areas of elevated temperature, liable to loss of stability of the biocenosis (high temperature > 60 °C with low oxygen < 15% can cause the loss of valuable microorganisms).
- Cold spots—areas where conditions for sanitizing the waste by inactivating potential pathogens and parasites cannot be maintained (low temperature < 30 °C reduce the efficiency of microorganisms or induce the switch to spore formation).
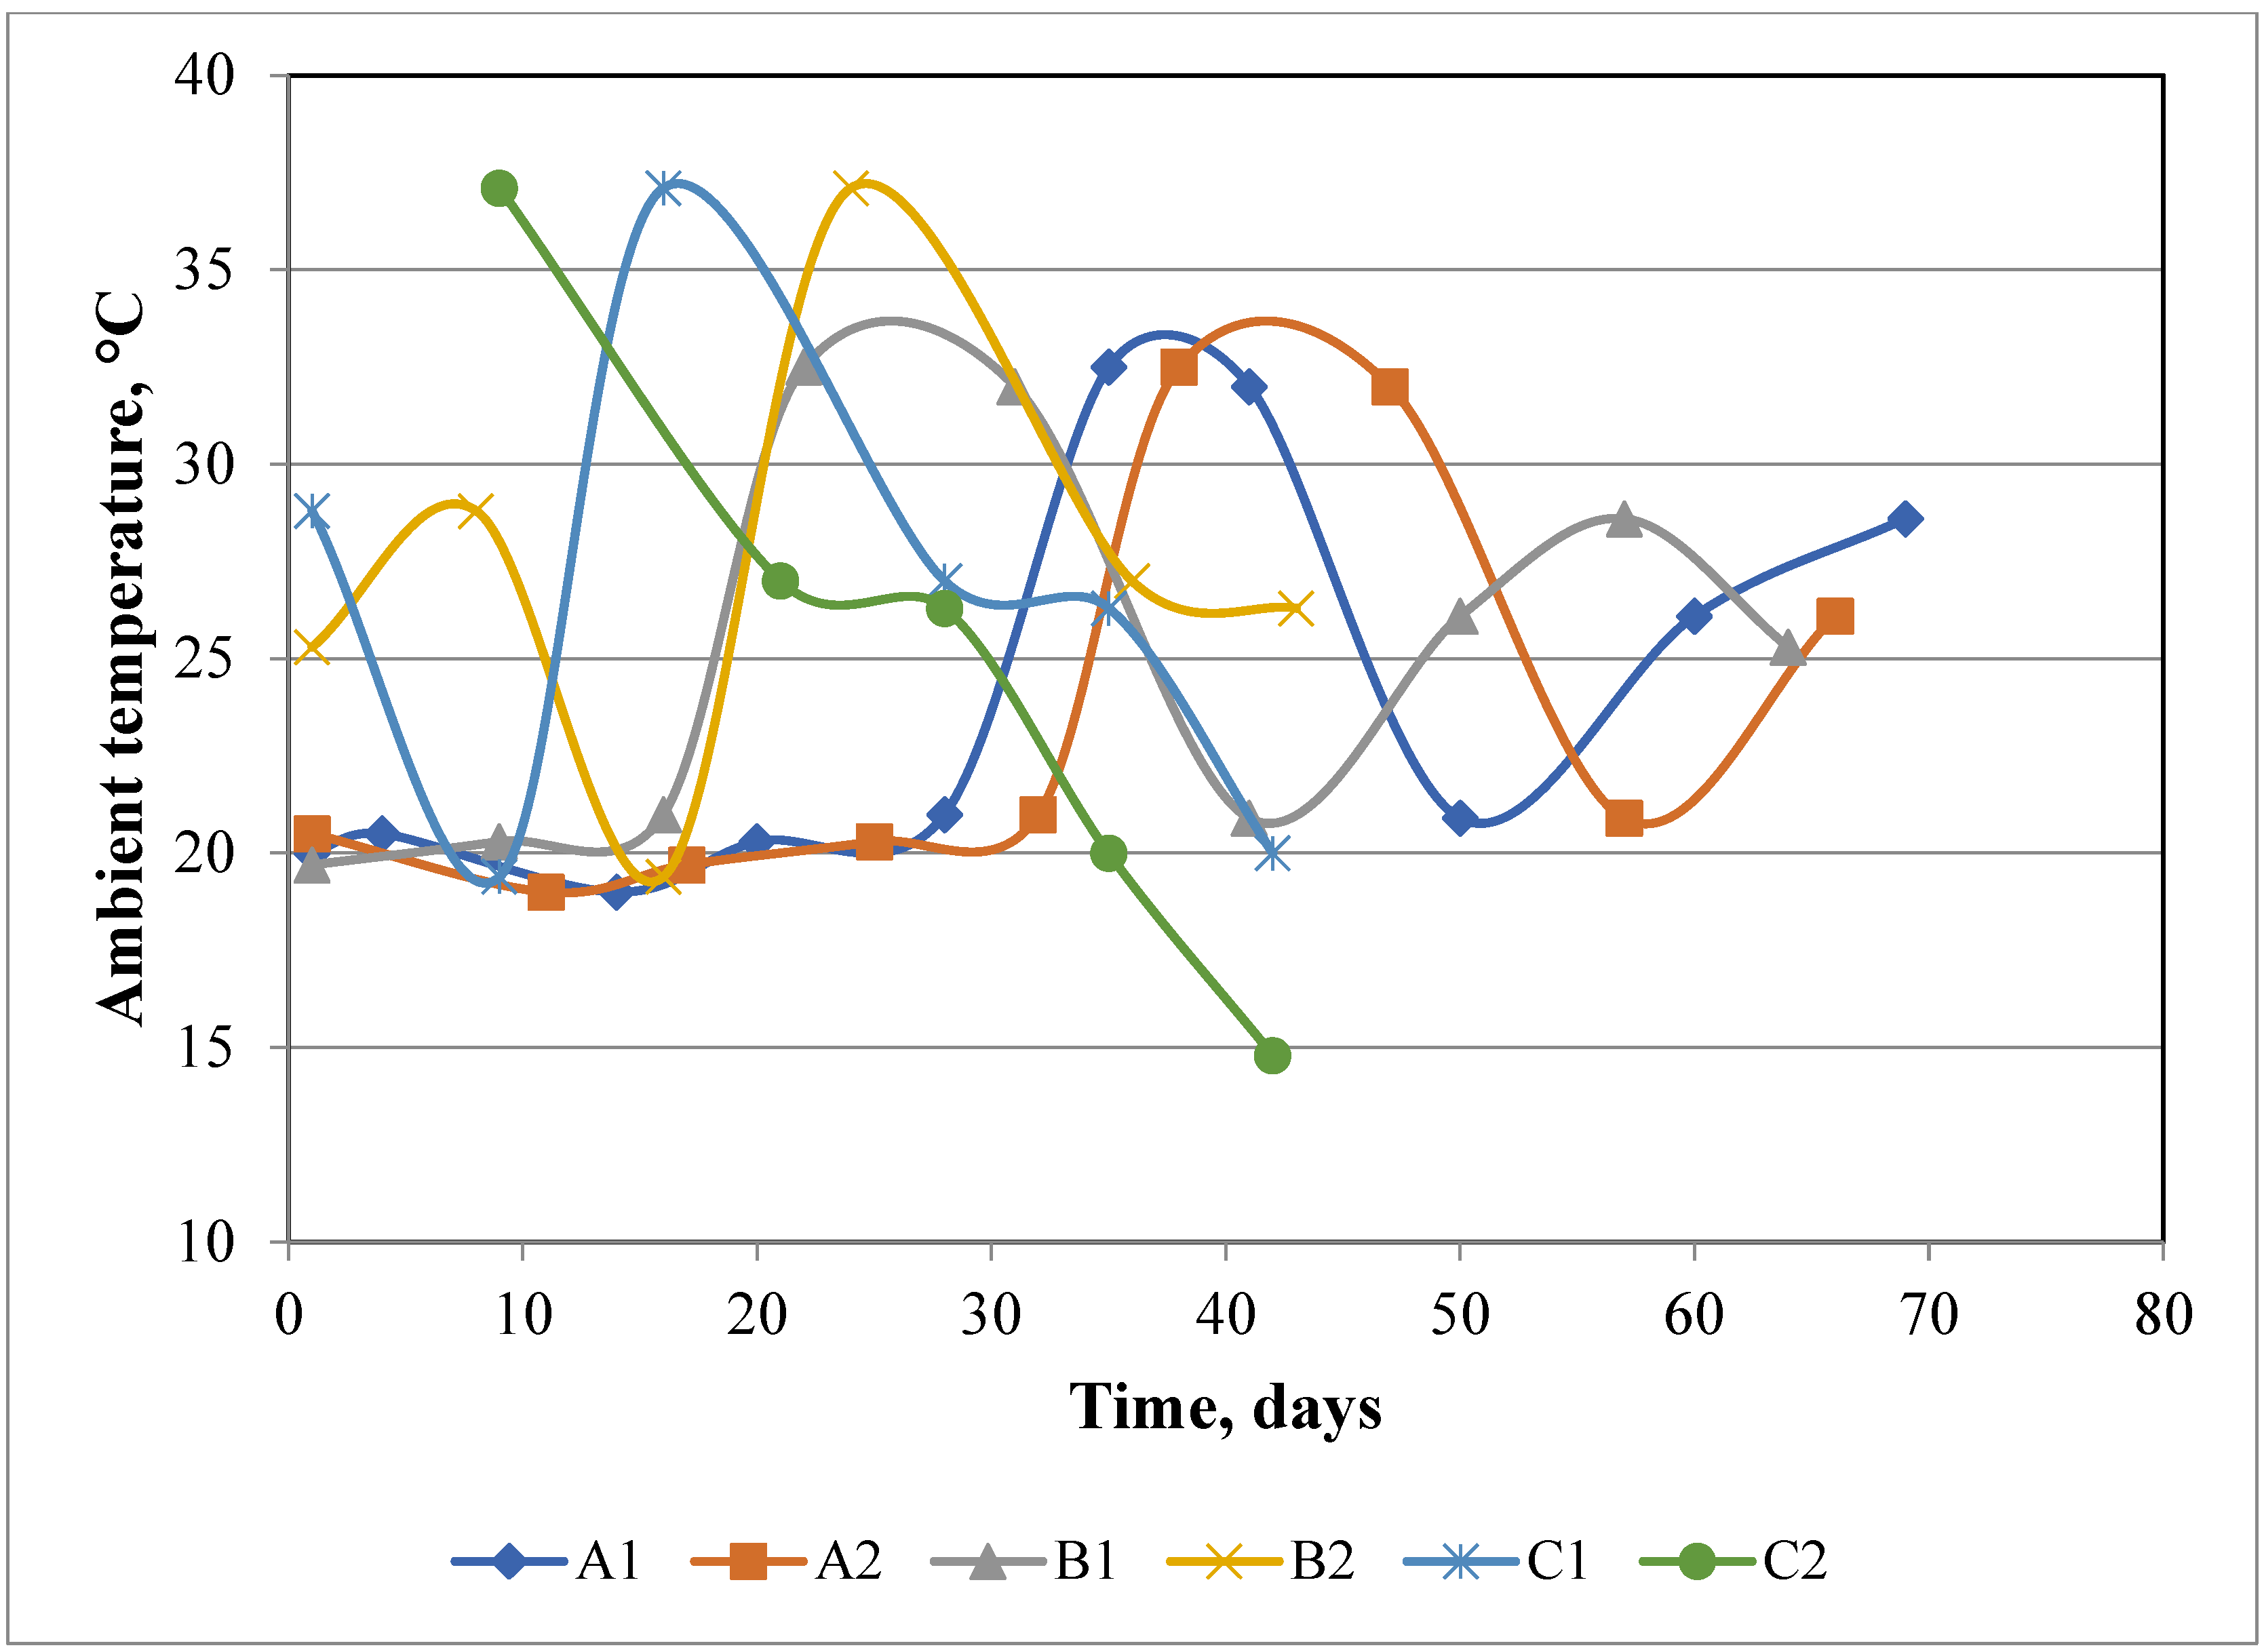
3.2.1. Spatial and Temporal Distribution of Temperature

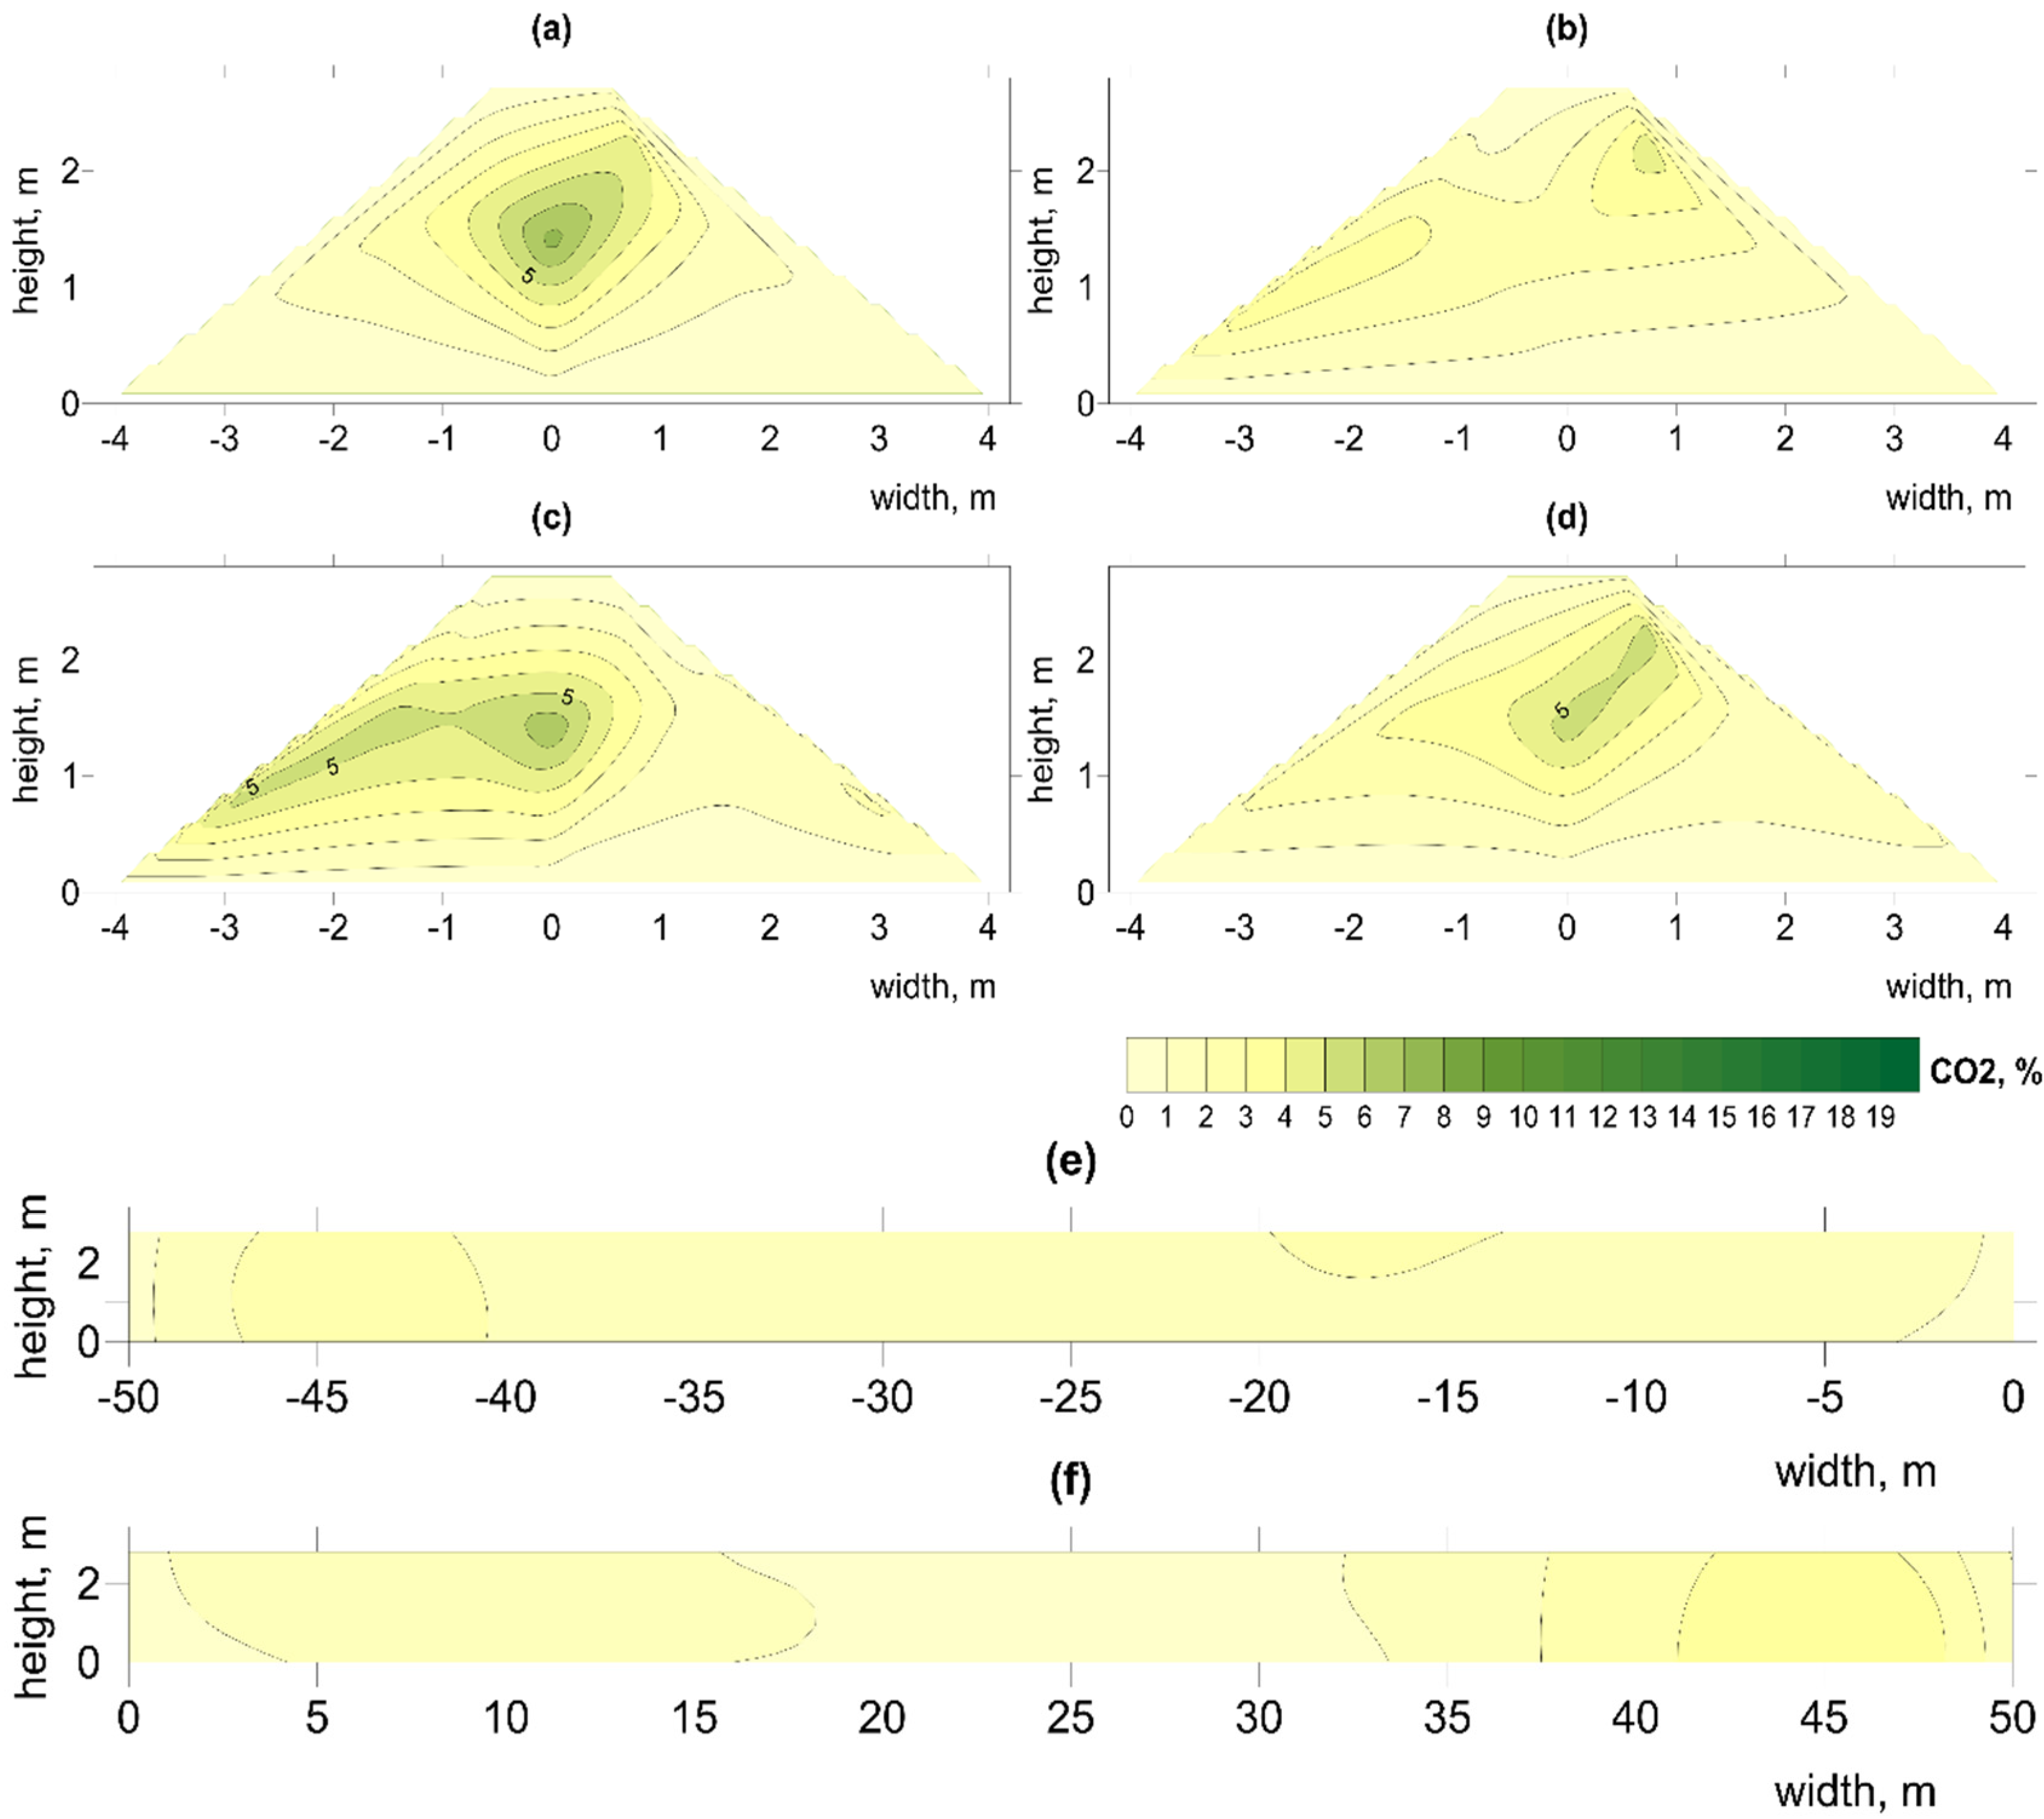
3.2.2. Spatial Distribution of O2 and CO2 Concentration

| Hot Spots | ||||
|---|---|---|---|---|
| Pile | Place (Length), m | Time, Day | Localization | Figures (Supplementary Material) |
| A1 | 2.5; 17.5, 32.5 | 20 | In the center | Figures S4, S45 and S89 |
| A1 | 2.5, 32.5 | 28 | In the center | Figures S5, S47 and S90 |
| A1 | 32.5 | 41 | In the top left corner | Figures S7, S49 and S92 |
| A2 | 2.5 | 25 | In the center of pile | Figures S13, S55, S98 |
| A2 | 2.5 | 32 | In the top left corner | Figures S14, S56 and S99 |
| A2 | 17.5 | 47 | In the top left corner | Figures S16, S58 and S101 |
| B1 | 17.5 | 9 | In the center of pile | Figures S18, S61 and S104 |
| B1 | 2.5, 17.5, 32.5, 47.5 | 16 | In the center and left side | Figures S19, S62 and S105 |
| B1 | 2.5, 17.5, 32.5, 47.5 | 22 | In the center and left side | Figures S20 and S106 |
| B1 | 2.5, 17.5, 32.5, 47.5 | 31 | In the center and left side | Figures S21, S63 and S107 |
| B1 | 2.5, 17.5, 32.5, 47.5 | 41 | In the center and left side | Figures S22, S64 and S107 |
| B1 | 17.5 | 57 | In the left bottom corner | Figures S23, S66 and S109 |
| B2 | 2.5, 32.5, 47.5 | 8 | In the center and left side | Figures S26, S69 and S112 |
| B2 | 32.5 | 16 | In the left bottom corner | Figures S27, S70 and S113 |
| B2 | 17.5, 32.5, 47.5 | 24 | In the center and right side | Figures S28, S71 and S114 |
| B2 | 32.5 | 43 | Right down corner | Figures S30, S73 and S116 |
| C1 | 32.5 | 28 | In the center | Figures S34, S77 and S120 |
| C2 | 17.5 | 9 | On the right side | Figures S38, S81 and S124 |
| C2 | 32.5 | 21 | On the left side | Figures S39, S82 and S125 |
| C2 | 17.5 | 35 | On the left and right corner | Figures S41, S84 and S127 |
| Hot Spots | ||||
|---|---|---|---|---|
| Pile | Place (Length), m | Time, day | Localization | Figures (Supplementary Material) |
| A1 | 2.5; 17.5, 32.5 | 20 | In the left side in the bottom | Figures S4, S46 and S89 |
| A1 | 2.5, 32.5 | 28 | In the bottom | Figures S5, S47 and S90 |
| A2 | 2.5, 17.5 | 17 | In the bottom | Figures S12, S54 and S97 |
| A2 | 2.5, 17.5, 32.5 | 25 | In the bottom | Figures S13, S55 and S98 |
| A2 | 2.5, 17.5 | 38 | In the bottom | Figures S15, S57 and S100 |
| A2 | 2.5, 17.5, 32.5, 47.5 | 57 | In the bottom | Figures S17, S59 and S102 |
| B1 | 32.5, 47.5 | 1 | In the bottom and in the center | Figures S60 and S103 |
| B2 | 2.5, 17.5, 32.5, 47.5 | 1 | In the bottom | Figures S25, S69 and S111 |
| B2 | 2.5 | 43 | In the bottom and in the center | Figures S30, S74 and S116 |
| C1 | 2.5, 17.5 | 28 | left side, near to sidewalls and in the bottom | Figures S34, S77 and S120 |
| C1 | 2.5, 32.5, 47.5 | 35 | left side, near to sidewalls | Figures S35, S78 and S121 |
| C1 | 2.5, 32.5, 47.5 | 42 | Left and right side, near to sidewalls | Figures S36, S79 and S122 |
| C2 | 2.5, 17.5, 32.5, 47.5 | 1 | In the bottom | Figures S37, S80 and S123 |
| C2 | 32.5, 47.5 | 28 | In the bottom | Figures S40, S83 and S126 |
| C2 | 2.5, 32.5, 47.5 | 35 | In the bottom, left side, near to sidewalls | Figures S41, S84 and S127 |
| C2 | 2.5, 32.5, 47.5 | 42 | In the bottom, left side, near to sidewalls | Figures S42, S85 and S128 |


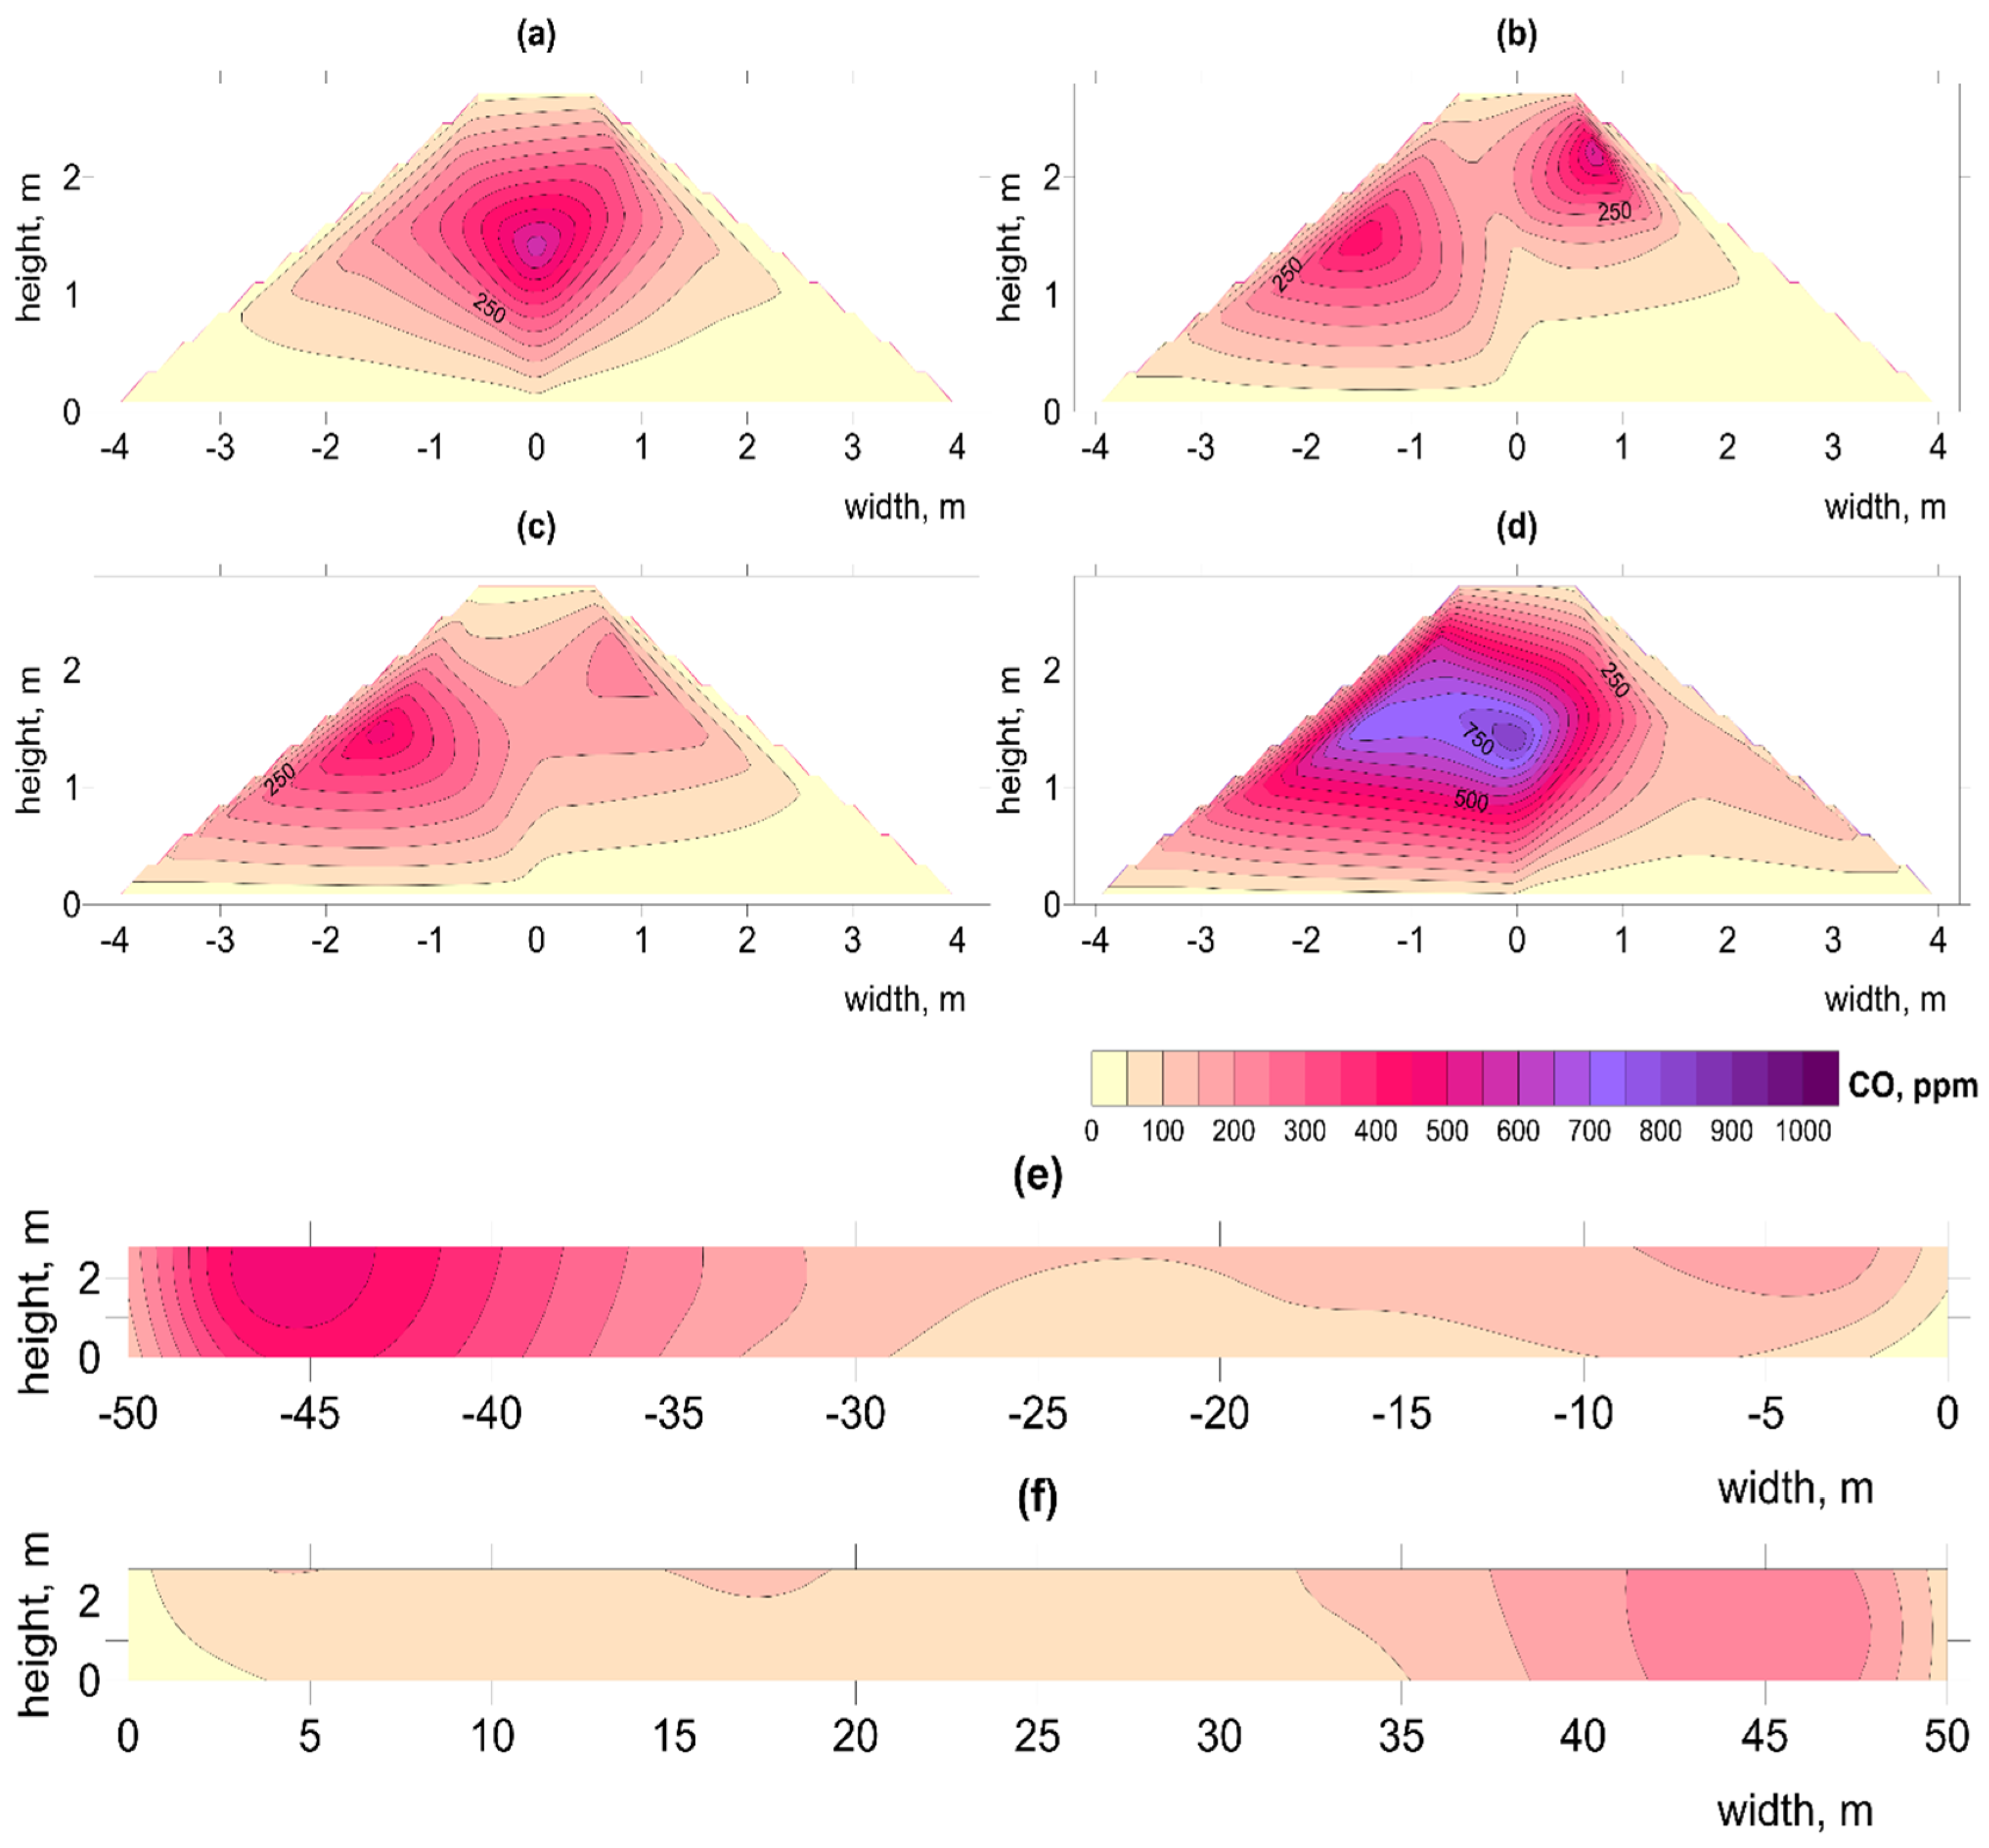
3.2.3. Spatial Distribution of CO Concentration
4. Summary
- -
- increase the mass of the stabilized waste as it provides greater stability of the process to external conditions;
- -
- increase aeration of waste to remove anaerobic zones.
Supplementary Materials
Author Contributions
Funding
Institutional Review Board Statement
Informed Consent Statement
Data Availability Statement
Acknowledgments
Conflicts of Interest
References
- European Commission Closing the Loop-An EU Action Plan for the Circular Economy. Communication from the Commission to the European Parliament, the Council, the European Economic and Social Committee and the Committee of the Regions. Available online: https://eur-lex.europa.eu/legal-content/EN/ALL/?uri=CELEX%3A52015DC0614 (accessed on 28 February 2019).
- EU Council Directive 1999/31/EC of 26 April 1999 on the Landfill of Waste. Available online: https://eur-lex.europa.eu/legal-content/EN/TXT/?uri=CELEX:31999L0031 (accessed on 28 February 2019).
- European Union. The European Parliament and the Council of the European Union Directive 2008/98/EC of the European Parliament and of the Council of 19 November 2008. Off. J. Eur. Union 2008, 51, 3–30. [Google Scholar]
- Połomka, J.; Jędrczak, A. Efficiency of Waste Processing in the MBT System. Waste Manag. 2019, 96, 9–14. [Google Scholar] [CrossRef]
- Montejo, C.; Tonini, D.; Márquez, M.; del, C.; Fruergaard Astrup, T. Mechanical-Biological Treatment: Performance and Potentials. An LCA of 8 MBT Plants Including Waste Characterization. J. Environ. Manag. 2013, 128, 661–673. [Google Scholar] [CrossRef] [PubMed] [Green Version]
- Jędrczak, A. Properties of the Organic Fraction Directed to Biostabilization in MBT Installations During the Heating Season. Civil. Environ. Eng. Rep. 2018, 28, 65–78. [Google Scholar] [CrossRef] [Green Version]
- Den Boer, E. Nowoczesne Systemy Mechaniczno-Biologicznego Przetwarzania Odpadów. In Innowacje w Gospodarce Odpadami Zagadnienia Wybrane; Wydawnictwo Uniwersytetu Przyrodniczego We Wrocławiu: Wrocław, Poland, 2018; ISBN 9788377172780. [Google Scholar]
- Henon, F.; Tremier, A.; Debenest, G.; Martel, J.L.; Quintard, M. A Method to Characterize the Influence of Air Distribution on the Composting Treatment: Monitoring of the Thermal Fields. Glob. Nest J. 2009, 11, 172–180. [Google Scholar] [CrossRef]
- Zeng, J.; Shen, X.; Han, L.; Huang, G. Dynamics of Oxygen Supply and Consumption during Mainstream Large-Scale Composting in China. Bioresour. Technol. 2016, 220, 104–109. [Google Scholar] [CrossRef] [PubMed]
- Oudart, D.; Robin, P.; Paillat, J.M.; Paul, E. Modelling Nitrogen and Carbon Interactions in Composting of Animal Manure in Naturally Aerated Piles. Waste Manag. 2015, 46, 588–598. [Google Scholar] [CrossRef] [PubMed]
- Ni, J. Mechanistic Models of Ammonia Release from Liquid Manure: A Review. J. Agric. Eng. Res. 1999, 72, 1–17. [Google Scholar] [CrossRef]
- Gao, M.; Li, B.; Yu, A.; Liang, F.; Yang, L.; Sun, Y. The Effect of Aeration Rate on Forced-Aeration Composting of Chicken Manure and Sawdust. Bioresour. Technol. 2010, 101, 1899–1903. [Google Scholar] [CrossRef]
- Haug, R.T. The Practical Handbook of Compost Engineering; Lewis Publishers: Boca Raton, FL, USA, 1993; p. 717. [Google Scholar]
- Korner, I.; Braukmeier, J.; Herrenklage, J.; Leikam, K.; Ritzkowski, M.; Schlegelmilch, M.; Stegmann, R. Investigation and Optimization of Composting Processes-Test Systems and Practical Examples. Waste Manag. 2003, 23, 17–26. [Google Scholar] [CrossRef]
- Stegenta, S.; Dębowski, M.; Bukowski, P.; Randerson, P.F.; Białowiec, A. The Influence of Perforation of Foil Reactors on Greenhouse Gas Emission Rates during Aerobic Biostabilization of the Undersize Fraction of Municipal Wastes. J. Environ. Manag. 2018, 207, 355–365. [Google Scholar] [CrossRef]
- Stegenta, S.; Sobieraj, K.; Pilarski, G.; Koziel, J.A.; Białowiec, A. Analysis of the Spatial and Temporal Distribution of Process Gases within Municipal Biowaste Compost. Sustainability 2019, 11, 2340. [Google Scholar] [CrossRef] [Green Version]
- Yang, F.; Li, Y.; Han, Y.; Qian, W.; Li, G.; Luo, W. Performance of Mature Compost to Control Gaseous Emissions in Kitchen Waste Composting. Sci. Total Environ. 2019, 657, 262–269. [Google Scholar] [CrossRef]
- De Guardia, A.; Petiot, C.; Rogeau, D.; Druilhe, C. Influence of Aeration Rate on Nitrogen Dynamics during Composting. Waste Management 2008, 28, 575–587. [Google Scholar] [CrossRef]
- Wang, K.; Li, W.; Guo, J.; Zou, J.; Li, Y.; Zhang, L. Spatial Distribution of Dynamics Characteristic in the Intermittent Aeration Static Composting of Sewage Sludge. Bioresour. Technol. 2011, 102, 5528–5532. [Google Scholar] [CrossRef]
- Mason, I.G.; Milke, M.W. Physical Modelling of the Composting Environment: A Review. Part 1: Reactor Systems. Waste Manag. 2005, 25, 481–500. [Google Scholar] [CrossRef]
- Poulsen, T.G. Oxygen and Carbon Dioxide Distribution And Movement in Passively Aerated Compost Piles. Compost. Sci. Util. 2011, 19, 25–32. [Google Scholar] [CrossRef]
- Stegenta-Dąbrowska, S.; Rogosz, J.; Bukowski, P.; Dębowski, M.; Randerson, P.F.; Bieniek, J.; Białowiec, A. The Fluctuation of Process Gasses Especially of Carbon Monoxide during Aerobic Biostabilization of an Organic Fraction of Municipal Solid Waste under Different Technological Regimes. Data 2020, 5, 40. [Google Scholar] [CrossRef] [Green Version]
- Cayuela, M.L.; Mondini, C.; Insam, H.; Sinicco, T.; Franke-Whittle, I. Plant and Animal Wastes Composting: Effects of the N Source on Process Performance. Bioresour. Technol. 2009, 100, 3097–3106. [Google Scholar] [CrossRef] [PubMed]
- Eiland, F.; Klamer, M.; Lind, A.-M.; Leth, M.; Bååth, E. Influence of Initial C/N Ratio on Chemical and Microbial Composition during Long Term Composting of Straw. Microb. Ecol. 2001, 41, 272–280. [Google Scholar] [CrossRef]
- Liang, C.; Das, K.C.; McClendon, R.W. The Influence of Temperature and Moisture Contents Regimes on the Aerobic Microbial Activity of a Biosolids Composting Blend. Bioresour. Technol. 2003, 86, 131–137. [Google Scholar] [CrossRef]
- Ermolaev, E.; Pell, M.; Smårs, S.; Sundberg, C.; Jönsson, H.; Smars, S.; Sundberg, C.; Jonsson, H. Greenhouse Gas Emission from Covered Windrow Composting with Controlled Ventilation. Waste Manag. Res. 2012, 30, 155–160. [Google Scholar] [CrossRef] [PubMed]
- Mulbry, W.; Ahn, H. Greenhouse Gas Emissions during Composting of Dairy Manure: Influence of the Timing of Pile Mixing on Total Emissions. Biosyst. Eng. 2014, 126, 117–122. [Google Scholar] [CrossRef]
- Evangelou, A.; Gerassimidou, S.; Mavrakis, N.; Komilis, D. Monitoring the Performances of a Real Scale Municipal Solid Waste Composting and a Biodrying Facility Using Respiration Activity Indices. Environ. Monit. Assess. 2016, 188, 302. [Google Scholar] [CrossRef] [PubMed]
- Komilis, D.; Evangelou, A.; Giannakis, G.; Lymperis, C. Revisiting the Elemental Composition and the Calorific Value of the Organic Fraction of Municipal Solid Wastes. Waste Manag. 2012, 32, 372–381. [Google Scholar] [CrossRef]
- Montejo, C.; Costa, C.; Márquez, M.C. Influence of Input Material and Operational Performance on the Physical and Chemical Properties of MSW Compost. J. Environ. Manag. 2015, 162, 240–249. [Google Scholar] [CrossRef]
- Hu, T.J.; Zeng, G.M.; Huang, G.H.; Xie, G.X.; Chen, Y.N.; Huang, D.L.; Liu, H.L. Main Influencing Factors of TOC Biodegradation in Aerobic Composting. In Proceedings of the Energy & environment-A World of Challenges and Opportunities, Proceedings; Science Press: Monmouth Junction, NJ, USA; Changsha, China, 2003; pp. 815–822. Available online: https://sdr.gdos.gov.pl/Documents/GO/Ekspertyzy/Ekspertyza%20MBP_III%20etap_%2022-06-2015%20+%20za%C5%82aczniki.pdf (accessed on 28 April 2019).
- Beck-Friis, B.; Smårs, S.; Jönsson, H.; Kirchmann, H. SE—Structures and Environment: Gaseous Emissions of Carbon Dioxide, Ammonia and Nitrous Oxide from Organic Household Waste in a Compost Reactor under Different Temperature Regimes. J. Agric. Eng. Res. 2001, 78, 423–430. [Google Scholar] [CrossRef]
- Den Boer, E.; Jędrczak, A.; Kowalski, Z.; Kulczycka, J.; Szpadt, R. A Review of Municipal Solid Waste Composition and Quantities in Poland. Waste Manag. 2010, 30, 369–377. [Google Scholar] [CrossRef]
- Yousefi, J.; Younesi, H.; Ghasempoury, S.M. Co-Composting of Municipal Solid Waste with Sawdust: Improving Compost Quality. Clean-Soil Air Water 2013, 41, 185–194. [Google Scholar] [CrossRef]
- Jędrczak, A.; DenBoer, E. Raport Końcowy III Etapu Ekspertyzy Mającej Na Celu Przeprowadzenie Badań Odpadów w 20 Inst; Uniwesytet Zielonogórski: Zielona Góra, Poland, 2015. [Google Scholar]
- Cooperband, L. The Art and Science of Composting A Resource for Farmers and Compost Producers; University of Wisconsin-Madison: Madison, WI, USA, 2002; pp. 1–14. [Google Scholar]
- Kowal, K.; Libudzisz, Z.; Żakowska, Z. Mikrobiologia Techniczna Tom 2-Praca Zbiorowa-Książka-Księgarnia Internetowa PWN; Wydawnictwo Naukowe PWN: Warszawa, Poland, 2017. [Google Scholar]
- Jiang, T.; Li, G.; Tang, Q.; Ma, X.; Wang, G.; Schuchardt, F. Effects of Aeration Method and Aeration Rate on Greenhouse Gas Emissions during Composting of Pig Feces in Pilot Scale. J. Environ. Sci. 2015, 31, 124–132. [Google Scholar] [CrossRef]
- Andersen, J.K.; Boldrin, A.; Christensen, T.H.; Scheutz, C. Mass Balances and Life-Cycle Inventory for a Garden Waste Windrow Composting Plant (Aarhus, Denmark). Waste Manag. Res. 2010, 28, 1010–1020. [Google Scholar] [CrossRef] [PubMed]
- Beck-Friis, B.; Pell, M.; Sonesson, U.; Jonsson, H.; Kirchmann, H. Formation and Emission of N2O and CH4 from Compost Heaps of Organic Household Waster. Environ. Monit. Assess. 2000, 62, 317–331. [Google Scholar] [CrossRef]
- Wang, J.Z.; Hu, Z.Y.; Xu, X.K.; Jiang, X.; Zheng, B.H.; Liu, X.N.; Pan, X.B.; Kardol, P. Emissions of Ammonia and Greenhouse Gases during Combined Pre-Composting and Vermicomposting of Duck Manure. Waste Manag. 2014, 34, 1546–1552. [Google Scholar] [CrossRef] [PubMed]
- Shen, Y.J.; Ren, L.M.; Li, G.X.; Chen, T.B.; Guo, R. Influence of Aeration on CH4, N2O and NH3 Emissions during Aerobic Composting of a Chicken Manure and High C/N Waste Mixture. Waste Manag. 2011, 31, 33–38. [Google Scholar] [CrossRef]
- Sołowiej, P.; Piechocki, J.; Neugebauer, M. Wpływ Napowietrzania Złoża Na Przebieg Pierwszej Fazy Procesu Kompostowania. Inżynieria Rol. 2010, 14, 193–198. [Google Scholar]
- Bongochgetsakul, N.; Ishida, T. A New Analytical Approach to Optimizing the Design of Large-Scale Composting Systems. Bioresour. Technol. 2008, 99, 1630–1641. [Google Scholar] [CrossRef]
- Stentiford, E.I. Composting Control: Principles and Practice. In The Science of Composting; Springer: Dordrecht, The Netherlands, 1996; pp. 49–59. [Google Scholar]
- Hamoda, M.F.F.; Abu Qdais, H.A.A.; Newham, J. Evaluation of Municipal Solid Waste Composting Kinetics. Resour. Conserv. Recycl. 1998, 23, 209–223. [Google Scholar] [CrossRef]
- Richard, T.L. Municipal Solid Waste Composting: Biological Processing; Cornell University: New York, NY, USA, 1996. [Google Scholar]
- Mohajer, A.; Tremier, A.; Barrington, S.; Teglia, C. Compost Mixture Influence of Interactive Physical Parameters on Microbial Kinetics and Substrate Fractionation. Waste Manag. 2010, 30, 1464–1471. [Google Scholar] [CrossRef] [PubMed] [Green Version]
- Szanto, G.L.; Hamelers, H.M.; Rulkens, W.H.; Veeken, A.H.M. NH3, N2O and CH4 Emissions during Passively Aerated Composting of Straw-Rich Pig Manure. Bioresour. Technol. 2007, 98, 2659–2670. [Google Scholar] [CrossRef]
- Martínez-Valdez, F.J.; Martínez-Ramírez, C.; Martínez-Montiel, L.; Favela-Torres, E.; Soto-Cruz, N.O.; Ramírez-Vives, F.; Saucedo-Castañeda, G. Rapid Mineralisation of the Organic Fraction of Municipal Solid Waste. Bioresour. Technol. 2015, 180, 112–118. [Google Scholar] [CrossRef]
- Su, D.; McCartney, D.; Wang, Q. Comparison of Free Air Space Test Methods. Compost. Sci. Util. 2006, 14, 103–113. [Google Scholar] [CrossRef]
- Clemens, J.; Cuhls, C. Greenhouse Gas Emissions from Mechanical and Biological Waste Treatment of Municipal Waste. Environ. Technol. 2003, 24, 745–754. [Google Scholar] [CrossRef] [PubMed]
- Petric, I.; Mustafic, N. Dynamic Modeling the Composting Process of the Mixture of Poultry Manure and Wheat Straw. J. Environ. Manag. 2015, 161, 392–401. [Google Scholar] [CrossRef]
- Zeng, J.; Shen, X.; Sun, X.; Liu, N.; Han, L.; Huang, G. Spatial and Temporal Distribution of Pore Gas Concentrations during Mainstream Large-Scale Trough Composting in China. Waste Manag. 2018, 75, 297–304. [Google Scholar] [CrossRef] [PubMed]
- Chang, C.-H.; Chen, I.C.; Yang, S.-S. Methane and Carbon Dioxide Emissions from Different Composting Periods. Terr. Atmos. Ocean. Sci. 2009, 20, 511–520. [Google Scholar] [CrossRef] [Green Version]
- Adhikari, B.K.; Tremier, A.; Barrington, S.; Martinez, J.; Daumoin, M. Gas Emissions as Influenced by Home Composting System Configuration. J. Environ. Manag. 2013, 116, 163–171. [Google Scholar] [CrossRef] [PubMed]
- Stegenta-Dąbrowska, S.; Drabczyński, G.; Sobieraj, K.; Koziel, J.A.; Białowiec, A. The Biotic and Abiotic Carbon Monoxide Formation During Aerobic Co-Digestion of Dairy Cattle Manure With Green Waste and Sawdust. Front. Bioeng. Biotechnol. 2019, 7, 283. [Google Scholar] [CrossRef]
- Stegenta, S.; Sobieraj, K.; Pilarski, G.; Koziel, J.; Białowiec, A. The Spatial and Temporal Distribution of Process Gases within the Biowaste Compost. Data 2019, 4, 37. [Google Scholar] [CrossRef] [Green Version]
- Boldrin, A.; Andersen, J.K.; Moller, J.; Christensen, T.H.; Favoino, E. Composting and Compost Utilization: Accounting of Greenhouse Gases and Global Warming Contributions. Waste Manag. Res. 2009, 27, 800–812. [Google Scholar] [CrossRef] [PubMed] [Green Version]
- Phillip, E.A.; Clark, O.G.; Londry, K.; Yu, S.; Leonard, J. Emission of Carbon Monoxide during Composting of Municipal Solid Waste. Compost. Sci. Util. 2011, 19, 170–177. [Google Scholar] [CrossRef]
- Hellebrand, H.J. Carbon Monoxide Emissions during Composting. Ber. Uber Landwirtsch. 1999, 77, 109–112. [Google Scholar]
- Hellebrand, H.J.; Kalk, W.D. Emission of Carbon Monoxide during Composting of Dung and Green Waste. Nutr. Cycl. Agroecosystems 2001, 60, 79–82. [Google Scholar] [CrossRef]
- Vaverková, M.D.; Elbl, J.; Voběrková, S.; Koda, E.; Adamcová, D.; Mariusz Gusiatin, Z.; Al Rahman, A.; Radziemska, M.; Mazur, Z. Composting versus Mechanical–Biological Treatment: Does It Really Make a Difference in the Final Product Parameters and Maturity. Waste Manag. 2020, 106, 173–183. [Google Scholar] [CrossRef] [PubMed]
- Rich, J.J.; King, G.M. Carbon Monoxide Consumption and Production by Wetland Peats. FEMS Microbiol. Ecol. 1999, 28, 215–224. [Google Scholar] [CrossRef]
- Voordouw, G. Carbon Monoxide Cycling by Desulfovibrio Vulgaris Hildenborough. J. Bacteriol. 2002, 184, 5903–5911. [Google Scholar] [CrossRef] [Green Version]
- Techtmann, S.M.; Colman, A.S.; Robb, F.T. ‘That Which Does Not Kill Us Only Makes Us Stronger’: The Role of Carbon Monoxide in Thermophilic Microbial Consortia. Environ. Microbiol. 2009, 11, 1027–1037. [Google Scholar] [CrossRef]
- Moxley, J.; Smith, K. Carbon Monoxide Production and Emission by Some Scottish Soils. Tellus Ser. B Chem. Phys. Meteorol. 1998, 50, 151–162. [Google Scholar] [CrossRef] [Green Version]


| Parameter | Value |
|---|---|
| Rotation, 1∙min−1 | 3480 |
| Back pressure, Pa | 3800 |
| Rate of delivery, m3∙min−1 | 51 |
| Power, kW | 2.64 |
| Pile | Probing Height | Reactor Height, m | Reactor Width, m | Reactor Length, m | ||
|---|---|---|---|---|---|---|
| H1, m | H2, m | H3, m | ||||
| A1 | 0.625 | 1.250 | 1.875 | 2.5 | 8.1 | 50.0 |
| A2 | 0.625 | 1.250 | 1.800 | 2.1 | 8.0 | 50.0 |
| B1 | 0.750 | 1.500 | 2.250 | 2.8 | 8.4 | 50.0 |
| B2 | 0.750 | 1.500 | 2.250 | 2.9 | 9.0 | 50.0 |
| C1 | 0.750 | 1.500 | 2.250 | 2.6 | 8.0 | 50.0 |
| C2 | 0.750 | 1.500 | 2.250 | 2.5 | 8.0 | 50.0 |
| Pile | Process Start Date | Process Time, Days | Reactor Design | Number of Temperature and Gas Sampling Cycles | Number of Sampling Cross-Sections | Number of Sampling Pointsin Each Cross-Section | Number of Temperature and Gas Samples Collected |
|---|---|---|---|---|---|---|---|
| A1 | 24 April 2015 | 69 | Membrane-covered pile | 10 | 4 | 7 | 280 |
| A2 | 27 April 2015 | 66 | Membrane-covered pile | 9 | 4 | 7 | 252 |
| B1 | 13 May 2015 | 62 | Membrane-covered pile | 9 | 4 | 7 | 252 |
| B2 | 15 July 2015 | 44 | Membrane-covered pile | 6 | 4 | 7 | 168 |
| C1 | 22 July 2015 | 44 | Membrane-covered pile with sidewalls | 6 | 4 | 7 | 168 |
| C2 | 30 July 2015 | 42 | Membrane-covered pile with sidewalls | 6 | 4 | 7 | 168 |
| Total | - | 327 | - | 46 | 24 | 42 | 1288 |
| Type of Spot | Parameter | ||
|---|---|---|---|
| Temperature, °C | O2, % | CO2, % | |
| hot spot | >60 | <15 | >5 |
| cold spot | <30 | >15 | <5 |
Publisher’s Note: MDPI stays neutral with regard to jurisdictional claims in published maps and institutional affiliations. |
© 2022 by the authors. Licensee MDPI, Basel, Switzerland. This article is an open access article distributed under the terms and conditions of the Creative Commons Attribution (CC BY) license (https://creativecommons.org/licenses/by/4.0/).
Share and Cite
Stegenta-Dąbrowska, S.; Randerson, P.F.; Białowiec, A. Aerobic Biostabilization of the Organic Fraction of Municipal Solid Waste—Monitoring Hot and Cold Spots in the Reactor as a Novel Tool for Process Optimization. Materials 2022, 15, 3300. https://doi.org/10.3390/ma15093300
Stegenta-Dąbrowska S, Randerson PF, Białowiec A. Aerobic Biostabilization of the Organic Fraction of Municipal Solid Waste—Monitoring Hot and Cold Spots in the Reactor as a Novel Tool for Process Optimization. Materials. 2022; 15(9):3300. https://doi.org/10.3390/ma15093300
Chicago/Turabian StyleStegenta-Dąbrowska, Sylwia, Peter F. Randerson, and Andrzej Białowiec. 2022. "Aerobic Biostabilization of the Organic Fraction of Municipal Solid Waste—Monitoring Hot and Cold Spots in the Reactor as a Novel Tool for Process Optimization" Materials 15, no. 9: 3300. https://doi.org/10.3390/ma15093300
APA StyleStegenta-Dąbrowska, S., Randerson, P. F., & Białowiec, A. (2022). Aerobic Biostabilization of the Organic Fraction of Municipal Solid Waste—Monitoring Hot and Cold Spots in the Reactor as a Novel Tool for Process Optimization. Materials, 15(9), 3300. https://doi.org/10.3390/ma15093300