
Bending Stiffness of Honeycomb Paperboard


Abstract
:1. Introduction
- -
- -
- Good energy absorption, thermal, and acoustic insulation properties [8];
- -
- Low cost of production via eco-friendly, renewable materials.
2. Materials and Methods
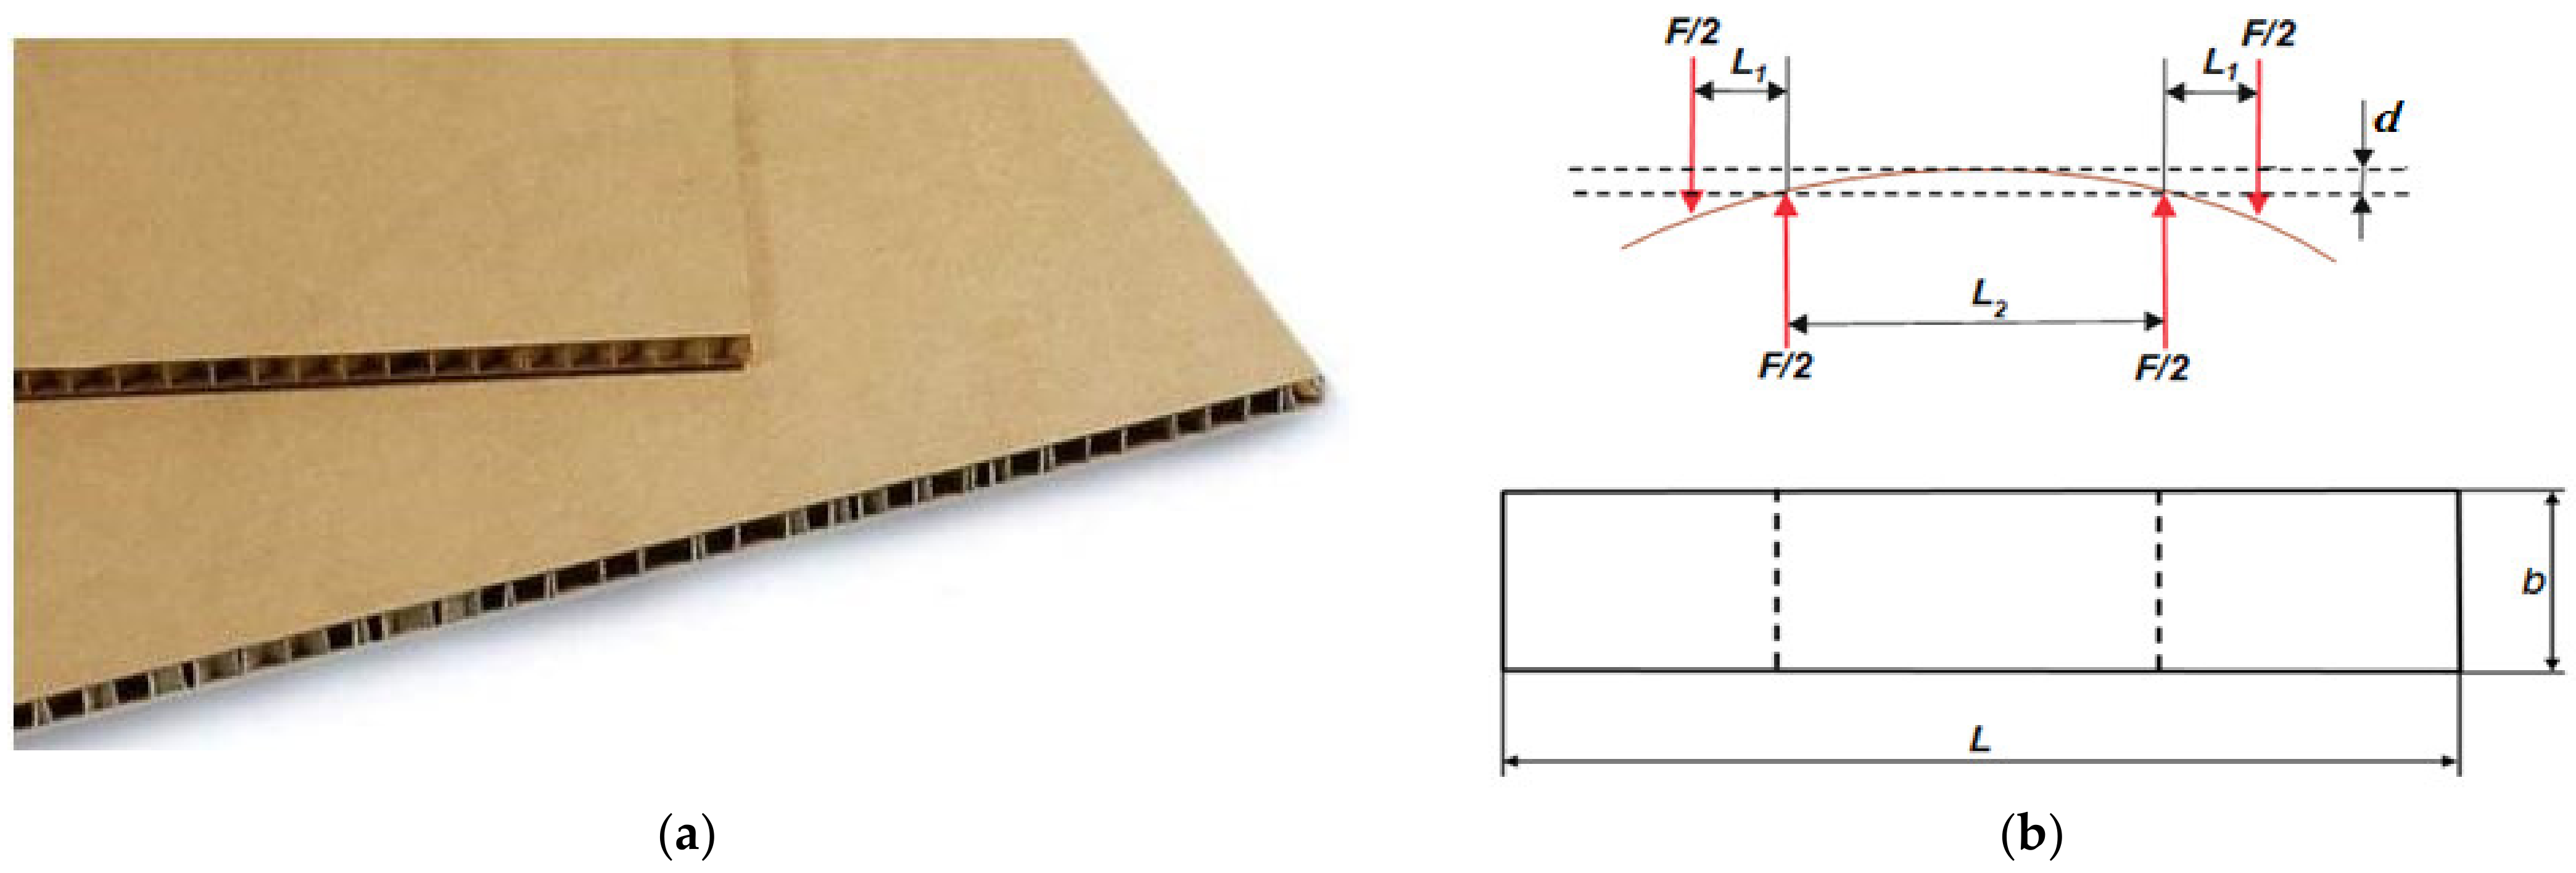
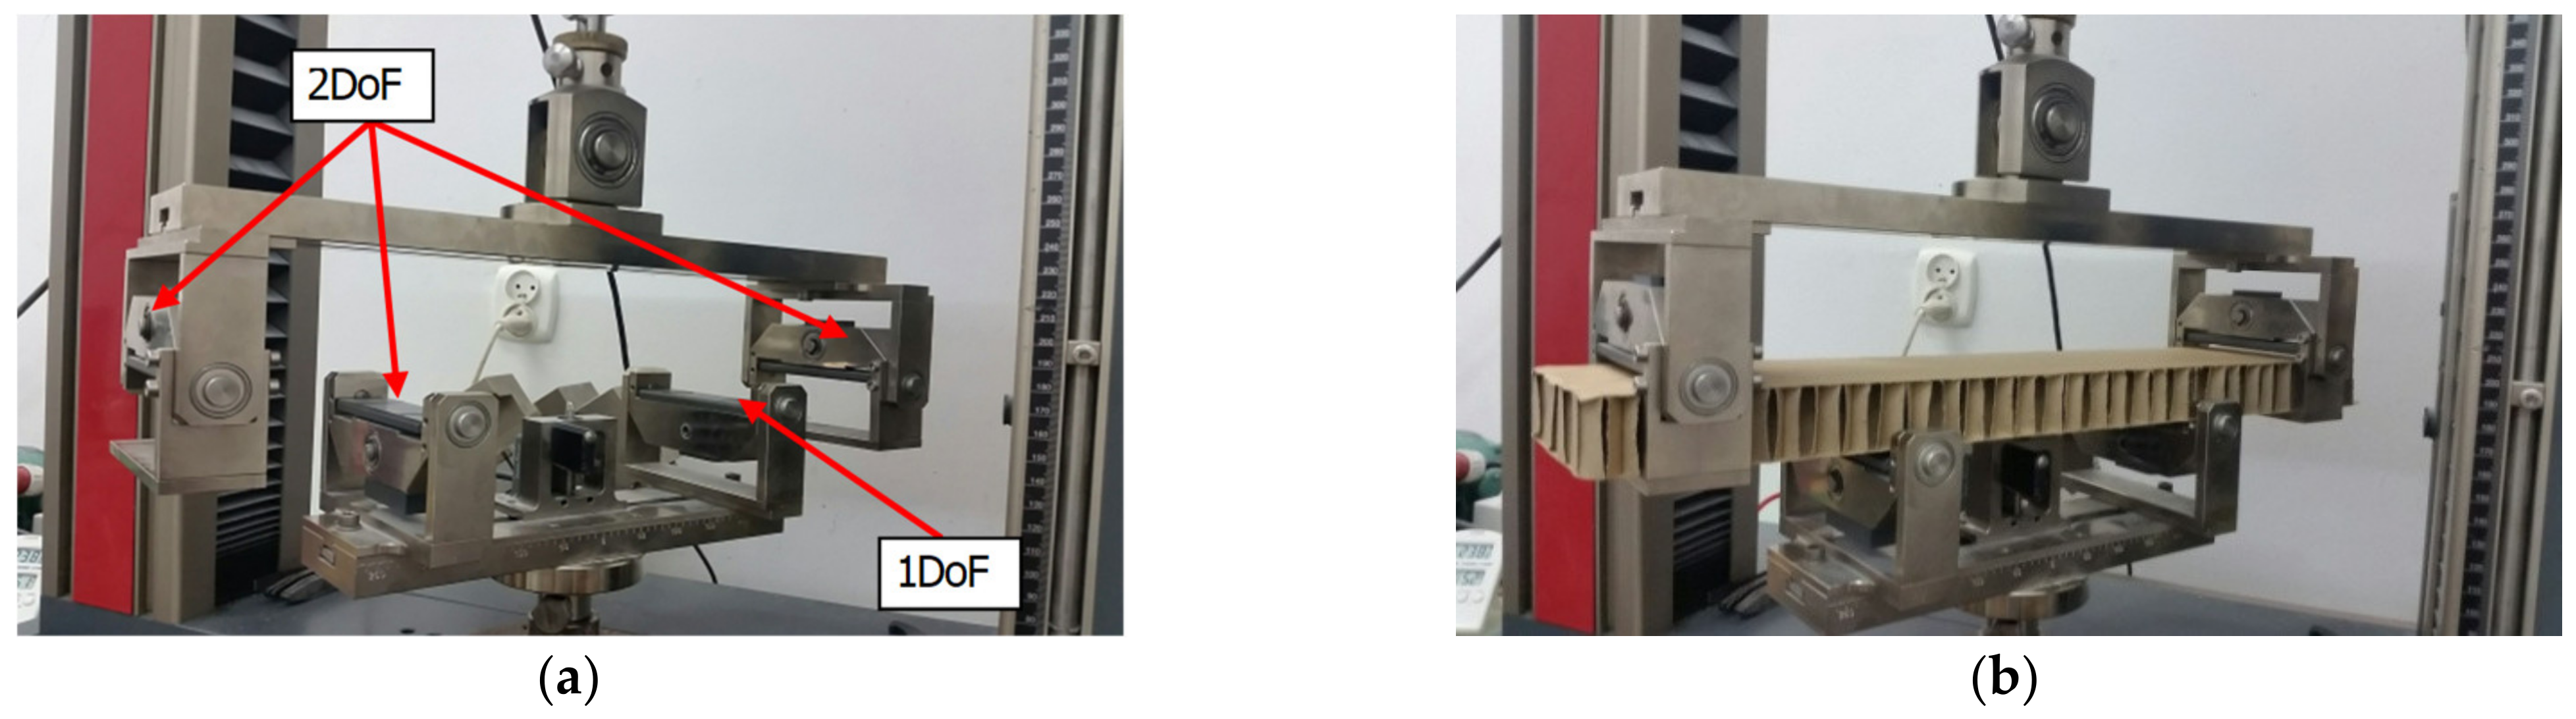
2.1. Experimental Research
- where
- F—acting force, N;
- L1, L2—distances between supports, m;
- d—deflection, m;
- b—sample width, m.
2.2. The Method for Calculation BS of the Honeycomb Paperboard Based on the Mechanical Properties of Raw Materials (Method I)
- where
- i—layer number;
- BSi—bending stiffness of the ith layer in relation to the neutral axis of the paperboard.
- where
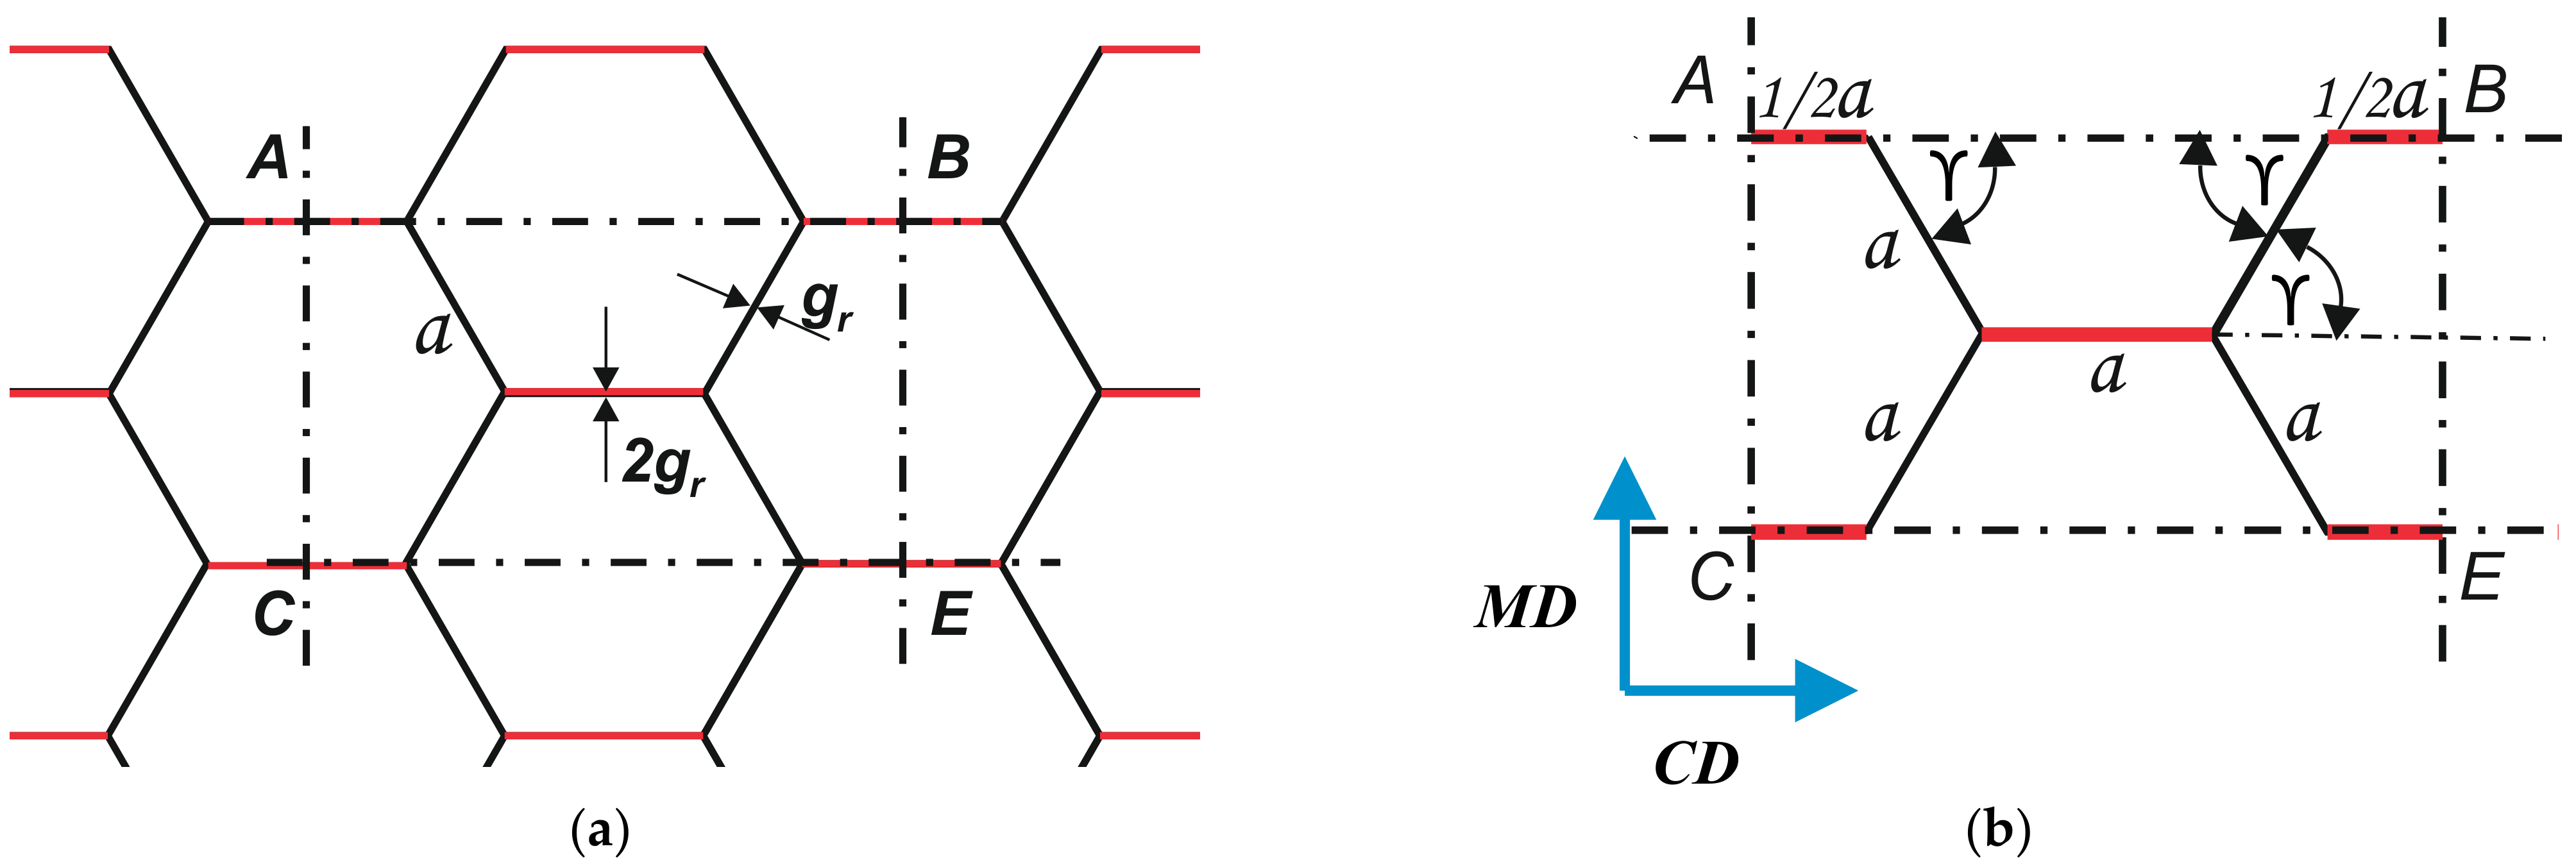
- EMDi—Young’s modulus of the ith layer in the machine direction of the honeycomb paperboard;
- νMDCDi, νCDMDi—Poisson’s ratio of the ith layer;
- JMDi—moment of inertia of the section perpendicular to the MD of the ith layer with respect to the neutral axis of the paperboard’s bending section.
- where
- ECDi—Young’s modulus of ith layer in the cross direction of the paperboard;
- JCDi—moment of inertia of the section perpendicular to the CD of the ith layer in relation to the neutral axis of the bending section of the paperboard.
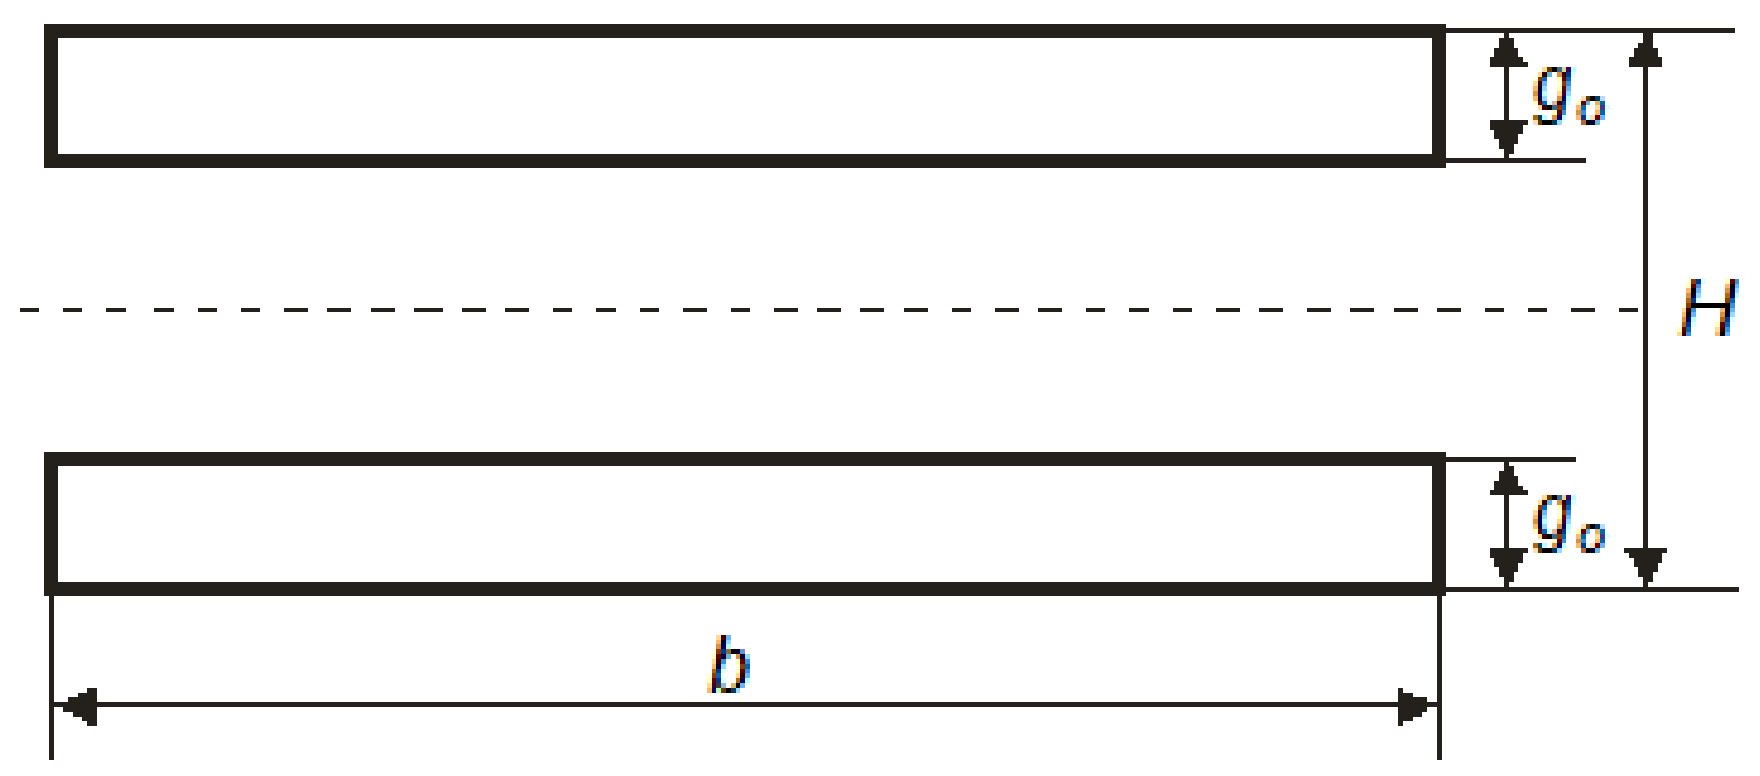
- where
- H—honeycomb paperboard’s thickness;
- b—sample width;
- go—thickness of paperboard’s flat layer.
- where
- EoCD—Young’s modulus of paper used to produce flat layers of cellular paperboard in cross direction;
- EoMD—Young’s modulus of paper used to produce flat layers of cellular paperboard in machine direction;
- ErCD—Young’s modulus of paper used to produce core of paperboard in cross direction.
2.3. The Method of Calculating the BS of Cellular Paperboard Based on the Results of Bending Tests (Method II)
- where
- α = MD or CD;
- aα, bα, cα, dα—constants described by the properties of the material used for the flat layers.
3. Results and Discussion
4. Conclusions
Author Contributions
Funding
Institutional Review Board Statement
Informed Consent Statement
Data Availability Statement
Conflicts of Interest
References
- Bitzer, T.N. Honeycomb Technology: Materials, Design, Manufacturing, Aplications and Testing; Springer: Dordrecht, The Netherlands, 1997; ISBN 978-94-011-5856-5. [Google Scholar]
- Fell, D. Trend Spotting: Doors. Woodworking 2008, volume 22. Available online: www.woodworkingcanada.com (accessed on 4 August 2015).
- Paul, R.; Klusmeier, W. Structhan®—A Composite with a Future; Status Report; Bayer AG: Leverkusen, Germany, 1997. [Google Scholar]
- Davies, J.M. Lightweight Sandwich Construction; Published on Behalf of CIB Working Commission; W056 Sandwich Panels (Joint CIB-ECCS Commission); Blackwell Science: Hoboken, NJ, USA, 2001; p. 370. [Google Scholar]
- Wernuld, G. Wood Goes “High Tech” Finally: Honeycomb Panels Offer Performance, Design Flexibility and, Most Importantly, Much Lighter Weight. Wood & Wood Products; Vance Publishing Corporation: Lincolnshire, IL, USA, 2004. [Google Scholar]
- Sam-Brew, S.; Semple, K.; Smith, G.D. Preliminary Experiments on the Manufacture of Hollow Core Composite Panels. For. Prod. J. 2011, 61, 381–389. [Google Scholar] [CrossRef]
- Barboutis, I.; Vassiliou, V. Strength Properties of Lightweight Paper Honeycomb Panels for the Furniture; Faculty of Forestry and Natural Environment, Aristotle University of Thessaloniki: Thessaloniki, Greece, 2005; pp. 1–6. [Google Scholar]
- Kmita-Fudalej, G.; Szewczyk, W. Board products with the honeycomb structure Part 1. Application and manufacture. Przegląd Pap. 2015, 71, 443–449. [Google Scholar]
- Kopecki, T.; Mazurek, P.; Lis, T. Experimental and Numerical Analysis of a Composite Thin-Walled Cylindrical Structures with Different Variants of Stiffeners, Subjected to Torsion. Materials 2019, 12, 3230. [Google Scholar] [CrossRef] [PubMed] [Green Version]
- Debski, H.; Jonak, J. Failure analysis of thin-walled composite channel section columns. Compos. Struct. 2015, 132, 567–574. [Google Scholar] [CrossRef]
- Urbaniak, M.; Teter, A.; Kubiak, T. Influence of boundary conditions on the critical and failure load in the GFPR channel cross-section columns subjected to compression. Compos. Struct. 2015, 134, 199–208. [Google Scholar] [CrossRef]
- Zhu, X.; Xiong, C.; Yin, J.; Yin, D.; Deng, H. Bending Experiment and Mechanical Properties Analysis of Composite Sandwich Laminated Box Beams. Materials 2019, 12, 2959. [Google Scholar] [CrossRef] [Green Version]
- Zhang, G.; Mao, C.; Wang, J.; Fan, N.; Guo, T. Numerical Analysis and Experimental Studies on the Residual Stress of W/2024Al Composites. Materials 2019, 12, 2746. [Google Scholar] [CrossRef] [Green Version]
- Kubiak, T.; Kolakowski, Z.; Swiniarski, J.; Urbaniak, M.; Gliszczynski, A. Local buckling and post-buckling of composite channel-section beams—Numerical and experimental investigations. Compos. Part B Eng. 2016, 91, 176–188. [Google Scholar] [CrossRef]
- Nunes, F.; Correia, M.; Correia, J.R.; Silvestre, N.; Moreira, A. Experimental and numerical study on the structural behaviour of eccentrically loaded GFRP columns. Thin-Walled Struct. 2013, 72, 175–187. [Google Scholar] [CrossRef]
- Kubiak, T.; Borkowski, Ł.; Wiacek, N. Experimental Investigations of Impact Damage Influence on Behavior of Thin-Walled Composite Beam Subjected to Pure Bending. Materials 2019, 12, 1127. [Google Scholar] [CrossRef] [Green Version]
- Gliszczynski, A.; Kubiak, T. Progressive failure analysis of thin-walled composite columns subjected to uniaxial compression. Compos. Struct. 2017, 169, 52–61. [Google Scholar] [CrossRef]
- Chen, J.; Morozov, E.; Shankar, K. A combined elastoplastic damage model for progressive failure analysis of composite materials and structures. Compos. Struct. 2012, 94, 3478–3489. [Google Scholar] [CrossRef]
- Muc, A.; Barski, M. Design of Particulate-Reinforced Composite Materials. Materials 2018, 11, 234. [Google Scholar] [CrossRef] [PubMed] [Green Version]
- Koławski, Z.; Mania, J.R. Semi-analytical method versus the FEM for analysis of the local post-buckling. Compos. Struct. 2013, 97, 99–106. [Google Scholar] [CrossRef]
- Zaczynska, M.; Kołakowski, Z. The influence of the internal forces of the buckling modes on the load-carrying capacity of composite medium-length beams under bending. Materials 2020, 13, 455. [Google Scholar] [CrossRef] [PubMed] [Green Version]
- Tornabene, F.; Fantuzzi, N.; Bacciocchi, M. Linear Static Behavior of Damaged Laminated Composite Plates and Shells. Materials 2017, 10, 811. [Google Scholar] [CrossRef] [Green Version]
- Fadiji, T.; Ambaw, A.; Coetzee, C.J.; Berry, T.M.; Opara, U.L. Application of finite element analysis to predict the mechanical strength of ventilated corrugated paperboard packaging for handling fresh produce. Biosyst. Eng. 2018, 174, 260–281. [Google Scholar] [CrossRef]
- Fadiji, T.; Coetzeea, C.J.; Berry, T.M.; Opara, U.L. Investigating the role of geometrical configurations of ventilated fresh produce packaging to improve the mechanical strength—Experimental and numerical approaches. Food Packag. Shelf Life 2019, 20, 100312. [Google Scholar] [CrossRef]
- Zaheer, M.; Awais, M.; Rautkari, L.; Sorvari, J. Finite element analysis of paperboard package under compressional load. Procedia Manuf. 2018, 17, 1162–1170. [Google Scholar] [CrossRef]
- Fadiji, T.; Coetzee, C.J.; Oparab, U.L. Analysis of the creep behaviour of ventilated corrugated paperboard packaging for handling fresh produce—An experimental study. Food Bioprod. Process. 2019, 117, 126–137. [Google Scholar] [CrossRef]
- Fadiji, T.; Coetzee, C.; Opara, U.L. Compression strength of ventilated corrugated paperboard packages: Numerical modelling, experimental validation and effects of vent geometric design. Biosyst. Eng. 2016, 151, 231–247. [Google Scholar] [CrossRef]
- Mrówczyński, D.; Garbowski, T.; Knitter-Piątkowska, A. Estimation of the compressive strength of corrugated board boxes with shifted creases on the flaps. Materials 2021, 14, 5181. [Google Scholar] [CrossRef] [PubMed]
- Allansson, A.; Svard, B. Stability and Collapse of Corrugated Board; Division of Structural Mechanics, LTH, Lund University: Lund, Sweden, 2001; ISSN 0281-6679. [Google Scholar]
- Patel, P.; Nordstrand, T.; Carlsson, L.A. Local buckling and collapse of corrugated board under biaxial stress. Compos. Struct. 1997, 39, 93–110. [Google Scholar] [CrossRef]
- Bai, J.; Wang, J.; Pan, L.; Lu, L.; Lu, G. Quasi-static axial crushing of single wall corrugated paperboard. Compos. Struct. 2019, 226, 111237. [Google Scholar] [CrossRef]
- Bolzon, G.; Talassi, M. A combined experimental and numerical study of the behaviour of paperboard composites up to failure. Compos. Part B 2014, 66, 358–367. [Google Scholar] [CrossRef]
- Mentrasti, L.; Cannella, F.; Pupilli, M.; Dai, J.S. Large bending behavior of creases paperboard. I. Experimental investigations. Int. J. Solid Struct. 2013, 50, 3089–3096. [Google Scholar] [CrossRef] [Green Version]
- Mentrasti, L.; Cannella, F.; Pupilli, M.; Dai, J.S. Large bending behavior of creases paperboard. II. Structural analysis. Int. J. Solid Struct. 2013, 50, 3097–3105. [Google Scholar] [CrossRef] [Green Version]
- Borgqvist, E.; Wallin, M.; Ristinmaa, M.; Tryding, J. An anisotropic in-plane and out-of-plane elasto-plastic continuum model for paperboard. Compos. Struct. 2015, 126, 184–195. [Google Scholar] [CrossRef]
- Hua, G.J.; Shen, Y.; Zhao, D.; Xie, Y. Experimental and Numerical Analysis of the Edge Effect for Corrugated and Honeycomb Fiberboard. Strength Mater. 2017, 49, 188–197. [Google Scholar] [CrossRef]
- Hua, G.J.; Xie, Y. Finite element analysis of honeycomb and corrugated fiberboard side compression strength. Packag. Eng. 2009, 30, 1–2. [Google Scholar]
- Chen, Z.; Yan, N. Investigation of elastic moduli of Kraft paper honeycomb core sandwich panels. Compos. Part B Eng. 2012, 43, 2107–2114. [Google Scholar] [CrossRef]
- Wang, D. Impact behavior and energy absorption of paper honeycomb sandwich panels. Int. J. Impact Eng. 2009, 36, 110–114. [Google Scholar] [CrossRef]
- Gu, X.; Wang, J.; Lu, G.; Pan, L.; Lu, L. Modeling for the in-plane plateau stress of honeycomb paperboard based on the induce effect of face paper with honeycomb core. Int. J. Mech. Sci. 2020, 168, 105289. [Google Scholar] [CrossRef]
- Wang, D.; Liang, N.; Guo, Y. Finite element analysis on the out-of-plane compression for paper honeycomb. J. Strain Anal. Eng. Des. 2018, 54, 36–43. [Google Scholar] [CrossRef]
- Utassy, V.; Denes, L. Modeling the elastic properties of paper honeycomb panels using the finite element method. In Proceedings of the XXVIth International Conference Research for Furniture Industry, Poznan, Poland, 23–28 September 2013. [Google Scholar]
- Czechowski, L.; Śmiechowicz, W.; Kmita-Fudalej, G.; Szewczyk, W. Flexural Damage of Honeycomb Paperboard—A Numerical and Experimental Study. Materials 2020, 13, 2601. [Google Scholar] [CrossRef]
- Wang, Z.W.; Yao, Z. Experimental investigation and finite element analysis for impact compression of honeycomb paperboards. J. Mech. Eng. 2012, 48, 49–55. [Google Scholar] [CrossRef]
- Gao, S.; Wang, B.Z. Finite element analysis of double deck honeycomb board based on ANSYS. Mech. Eng. Autom. 2012, 6, 69–71. [Google Scholar]
- Yazdanparast, R.; Rafiee, R. Determining in-plane material properties of square core cellular materials using computational homogenization technique. Eng. Comput. 2022, 1–14. [Google Scholar] [CrossRef]
- Yazdanparast, R.; Rafiee, R. Developing a homogenization approach for estimation of in-plane effective elastic moduli of hexagonal honeycombs. Eng. Anal. Bound. Elem. 2020, 117, 202–211. [Google Scholar] [CrossRef]
- Jones, R.M. Mechanics of Composite Materials, 2nd ed.; Taylor & Francis: London, UK, 1999. [Google Scholar]
- PN-ISO 5628:1995; Paper and Board—Determination of Bending Stiffness by Static Methods—General Principles. Polish Committee for Standardization: Warsaw, Poland, 2013.
- PN-EN 20187:2000; Paper, Board and Pulps—Standard Atmosphere for Conditioning and Testing and Procedure for Monitoring the Atmosphere and Conditioning of Samples. Polish Committee for Standardization: Warsaw, Poland, 2000.
- Baum, G.A.; Brennan, D.C.; Haberger, C.C. Orthotropic elastic constants of paper. TAPPI J. 1981, 64, 97–101. [Google Scholar]
- Kmita-Fudalej, G.; Szewczyk, W. The bending stiffness of honeycomb boards. Przegląd Pap. 2016, 3, 173–177. [Google Scholar]


| Designation | D [mm] | H1 (Given by the Manufacturer) [mm] | H (Measured) [mm] | Raw Material of Flat Layers | Weight [g/m2] | Core Raw Material | Weight [g/m2] |
|---|---|---|---|---|---|---|---|
| TL200/FL140/TL200 | 15 | 10 | 9.87 | Testliner | 200 | Fluting | 140 |
| 15 | 20 | 19.85 | |||||
| 15 | 30 | 29.50 | |||||
| 15 | 40 | 39.80 | |||||
| 21 | 20 | 19.69 | |||||
| 25 | 30 | 28.81 | |||||
| 25 | 40 | 39.64 | |||||
| TL135/TL135/TL135 | 15 | 8 | 8.07 | Testliner | 135 | Testliner | 135 |
| 15 | 10 | 10.19 | |||||
| 15 | 11 | 11.31 | |||||
| 15 | 15 | 15.37 | |||||
| 15 | 16 | 16.22 | |||||
| 15 | 18 | 18.27 | |||||
| 15 | 20 | 20.20 | |||||
| 15 | 22 | 22.03 | |||||
| 15 | 28 | 28.05 | |||||
| 15 | 33 | 32.62 | |||||
| 15 | 44 | 43.87 | |||||
| 15 | 45 | 44.54 |
| Designation | Material | Weight [g/m2] | Paper Thickness [mm] | Young’s Modulus of Paper in Machine Direction [GPa] | Young’s Modulus of Paper in Cross Direction [GPa] |
|---|---|---|---|---|---|
| TL200 | Testliner | 200 | 0.264 | 5.70 | 2.37 |
| FL140 | Fluting | 140 | 0.203 | 5.50 | 2.18 |
| TL135 | Testliner | 135 | 0.204 | 3.55 | 1.11 |
| Designation | D [mm] | H [mm] | Measurement BSMD [Nm] | Calculation BSMD [Nm] | Calculation Error BSMD [%] | Calculation BSMD Core [Nm] | Measurement BSCD [Nm] | Calculation BSCD [Nm] | Calculation Error BSCD [%] | Calculation BSCD Core [Nm] |
|---|---|---|---|---|---|---|---|---|---|---|
| TL200/FL140/TL200 | 15 | 9.87 | 64.97 | 83.40 | 28 | 2.68 | 28.35 | 37.58 | 33 | 4.02 |
| 15 | 19.85 | 290.88 | 359.02 | 23 | 23.66 | 119.21 | 174.93 | 47 | 35.49 | |
| 15 | 29.50 | 583.81 | 826.61 | 42 | 79.72 | 280.11 | 430.12 | 54 | 119.57 | |
| 15 | 39.80 | 1241.35 | 1564.07 | 26 | 198.48 | 610.52 | 865.50 | 42 | 297.72 | |
| 21 | 19.69 | 232.02 | 346.32 | 49 | 16.48 | 112.00 | 161.86 | 45 | 24.72 | |
| 25 | 28.81 | 475.22 | 756.69 | 59 | 44.50 | 245.42 | 362.87 | 48 | 66.76 | |
| 25 | 39.64 | 986.81 | 1472.09 | 49 | 117.63 | 525.81 | 739.60 | 41 | 176.44 | |
| TL135/TL135/TL135 | 15 | 8.07 | 15.95 | 26.85 | 68 | 0.75 | 8.08 | 9.26 | 15 | 1.13 |
| 15 | 10.19 | 28.61 | 43.62 | 52 | 1.57 | 13.90 | 15.45 | 11 | 2.35 | |
| 15 | 11.31 | 30.36 | 54.21 | 79 | 2.17 | 19.05 | 19.47 | 2 | 3.25 | |
| 15 | 15.37 | 62.37 | 102.68 | 65 | 5.61 | 30.41 | 38.65 | 27 | 8.42 | |
| 15 | 16.22 | 65.17 | 114.78 | 76 | 6.61 | 38.90 | 43.62 | 12 | 9.92 | |
| 15 | 18.27 | 91.18 | 147.22 | 61 | 9.54 | 50.24 | 57.20 | 14 | 14.31 | |
| 15 | 20.20 | 114.29 | 181.58 | 59 | 12.97 | 65.69 | 71.98 | 10 | 19.46 | |
| 15 | 22.03 | 117.88 | 217.84 | 85 | 16.92 | 64.93 | 87.96 | 35 | 25.38 | |
| 15 | 28.05 | 187.97 | 362.49 | 93 | 35.36 | 116.35 | 154.94 | 33 | 53.04 | |
| 15 | 32.62 | 257.95 | 499.11 | 93 | 55.94 | 181.21 | 221.95 | 22 | 83.90 | |
| 15 | 43.87 | 445.89 | 942.05 | 111 | 137.49 | 318.92 | 456.86 | 43 | 206.24 | |
| 15 | 44.54 | 450.94 | 973.10 | 116 | 143.89 | 319.30 | 474.14 | 48 | 215.84 |
| H (mm) of the Paperboard from Which the BS Was Calculated | H [mm] | ||||||||||||
|---|---|---|---|---|---|---|---|---|---|---|---|---|---|
| 8 | 10 | 11 | 15 | 16 | 18 | 20 | 22 | 28 | 33 | 44 | 45 | ||
| 8, 15, 45 | BSMD/BSCD [Nm] | 16/8 | 26/13 | 33/16 | 62/30 | 71/35 | 90/45 | 110/56 | 132/68 | 207/114 | 275/163 | 437/304 | 451/319 |
| Calculation error BSMD/BSCD [%] | 0/0 | 8/7 | 7/17 | 0/0 | 9/10 | 1/11 | 3/15 | 12/5 | 10/2 | 7/10 | 2/5 | 0/0 | |
| 10, 18, 45 | BSMD/BSCD [Nm] | - | 29/14 | 35/17 | 64/34 | 73/39 | 91/50 | 111/63 | 133/76 | 206/125 | 274/174 | 436/306 | 451/319 |
| Calculation error BSMD/BSCD [%] | - | 0/0 | 14/9 | 3/12 | 12/1 | 0/0 | 3/5 | 13/18 | 9/7 | 6/4 | 2/4 | 0/0 | |
| 11, 33, 45 | BSMD/BSCD [Nm] | - | - | 30/19 | 57/37 | 64/43 | 81/55 | 100/68 | 120/82 | 190/133 | 258/181 | 433/307 | 451/320 |
| Calculation error BSMD/BSCD [%] | - | - | 0/0 | 9/23 | 1/10 | 11/9 | 13/4 | 2/27 | 1/14 | 0/0 | 3/4 | 0/0 | |
| 15, 20, 45 | BSMD/BSCD [Nm] | - | - | - | 62/30 | 72/37 | 92/50 | 114/66 | 138/82 | 216/139 | 286/191 | 439/309 | 451/319 |
| Calculation error BSMD/BSCD [%] | - | - | - | 0/0 | 10/6 | 1/0 | 0/0 | 17/27 | 15/19 | 11/5 | 2/3 | 0/0 | |
| 28, 33, 45 | BSMD/BSCD [Nm] | - | - | - | - | - | - | - | - | 188/116 | 258/181 | 434/310 | 451/320 |
| Calculation error BSMD/BSCD [%] | - | - | - | - | - | - | - | - | 0/0 | 0/0 | 3/3 | 0/0 | |
| H [mm] of the Paperboard from Which the BS Was Calculated | H [mm] | ||||
|---|---|---|---|---|---|
| 10 | 20 | 30 | 40 | ||
| 10, 20, 40 | BSMD/BSCD [Nm] | 65/28 | 291/118 | 682/301 | 1241/605 |
| Calculation error BSMD/BSCD [%] | 0/0 | 0/1 | 17/7 | 0/1 | |
| 10, 30, 40 | BSMD/BSCD [Nm] | 65/27 | 226/97 | 584/256 | 1241/553 |
| Calculation error BSMD/BSCD [%] | 0/3 | 22/19 | 0/9 | 0/9 | |
| 20, 30, 40 | BSMD/BSCD [Nm] | - | 291/114 | 584/261 | 1241/564 |
| Calculation error BSMD/BSCD [%] | - | 0/5 | 0/7 | 0/8 | |
| Designation of the Formula Used for the Calculation | Board Designation | Direction in Plane of the Board | Maximum Calculation Error [%] | Average Calculation Error [%] |
|---|---|---|---|---|
| Equations (15) and (16) | TL135/TL135/TL135 | MD | 116 | 80 |
| CD | 48 | 23 | ||
| TL200/FL140/TL200 | MD | 59 | 39 | |
| CD | 54 | 44 | ||
| Equation (18) | TL135/TL135/TL135 | MD | 17 | 7 |
| CD | 27 | 9 | ||
| TL200/FL140/TL200 | MD | 22 | 6 | |
| CD | 19 | 10 | ||
| The equation in Figure 10 | TL135/TL135/TL135 | MD | 22 | 6 |
| The equation in Figure 11 | TL135/TL135/TL135 | CD | 15 | 7 |
| The equation in Figure 12 | TL200/FL140/TL200 | MD | 36 | 14 |
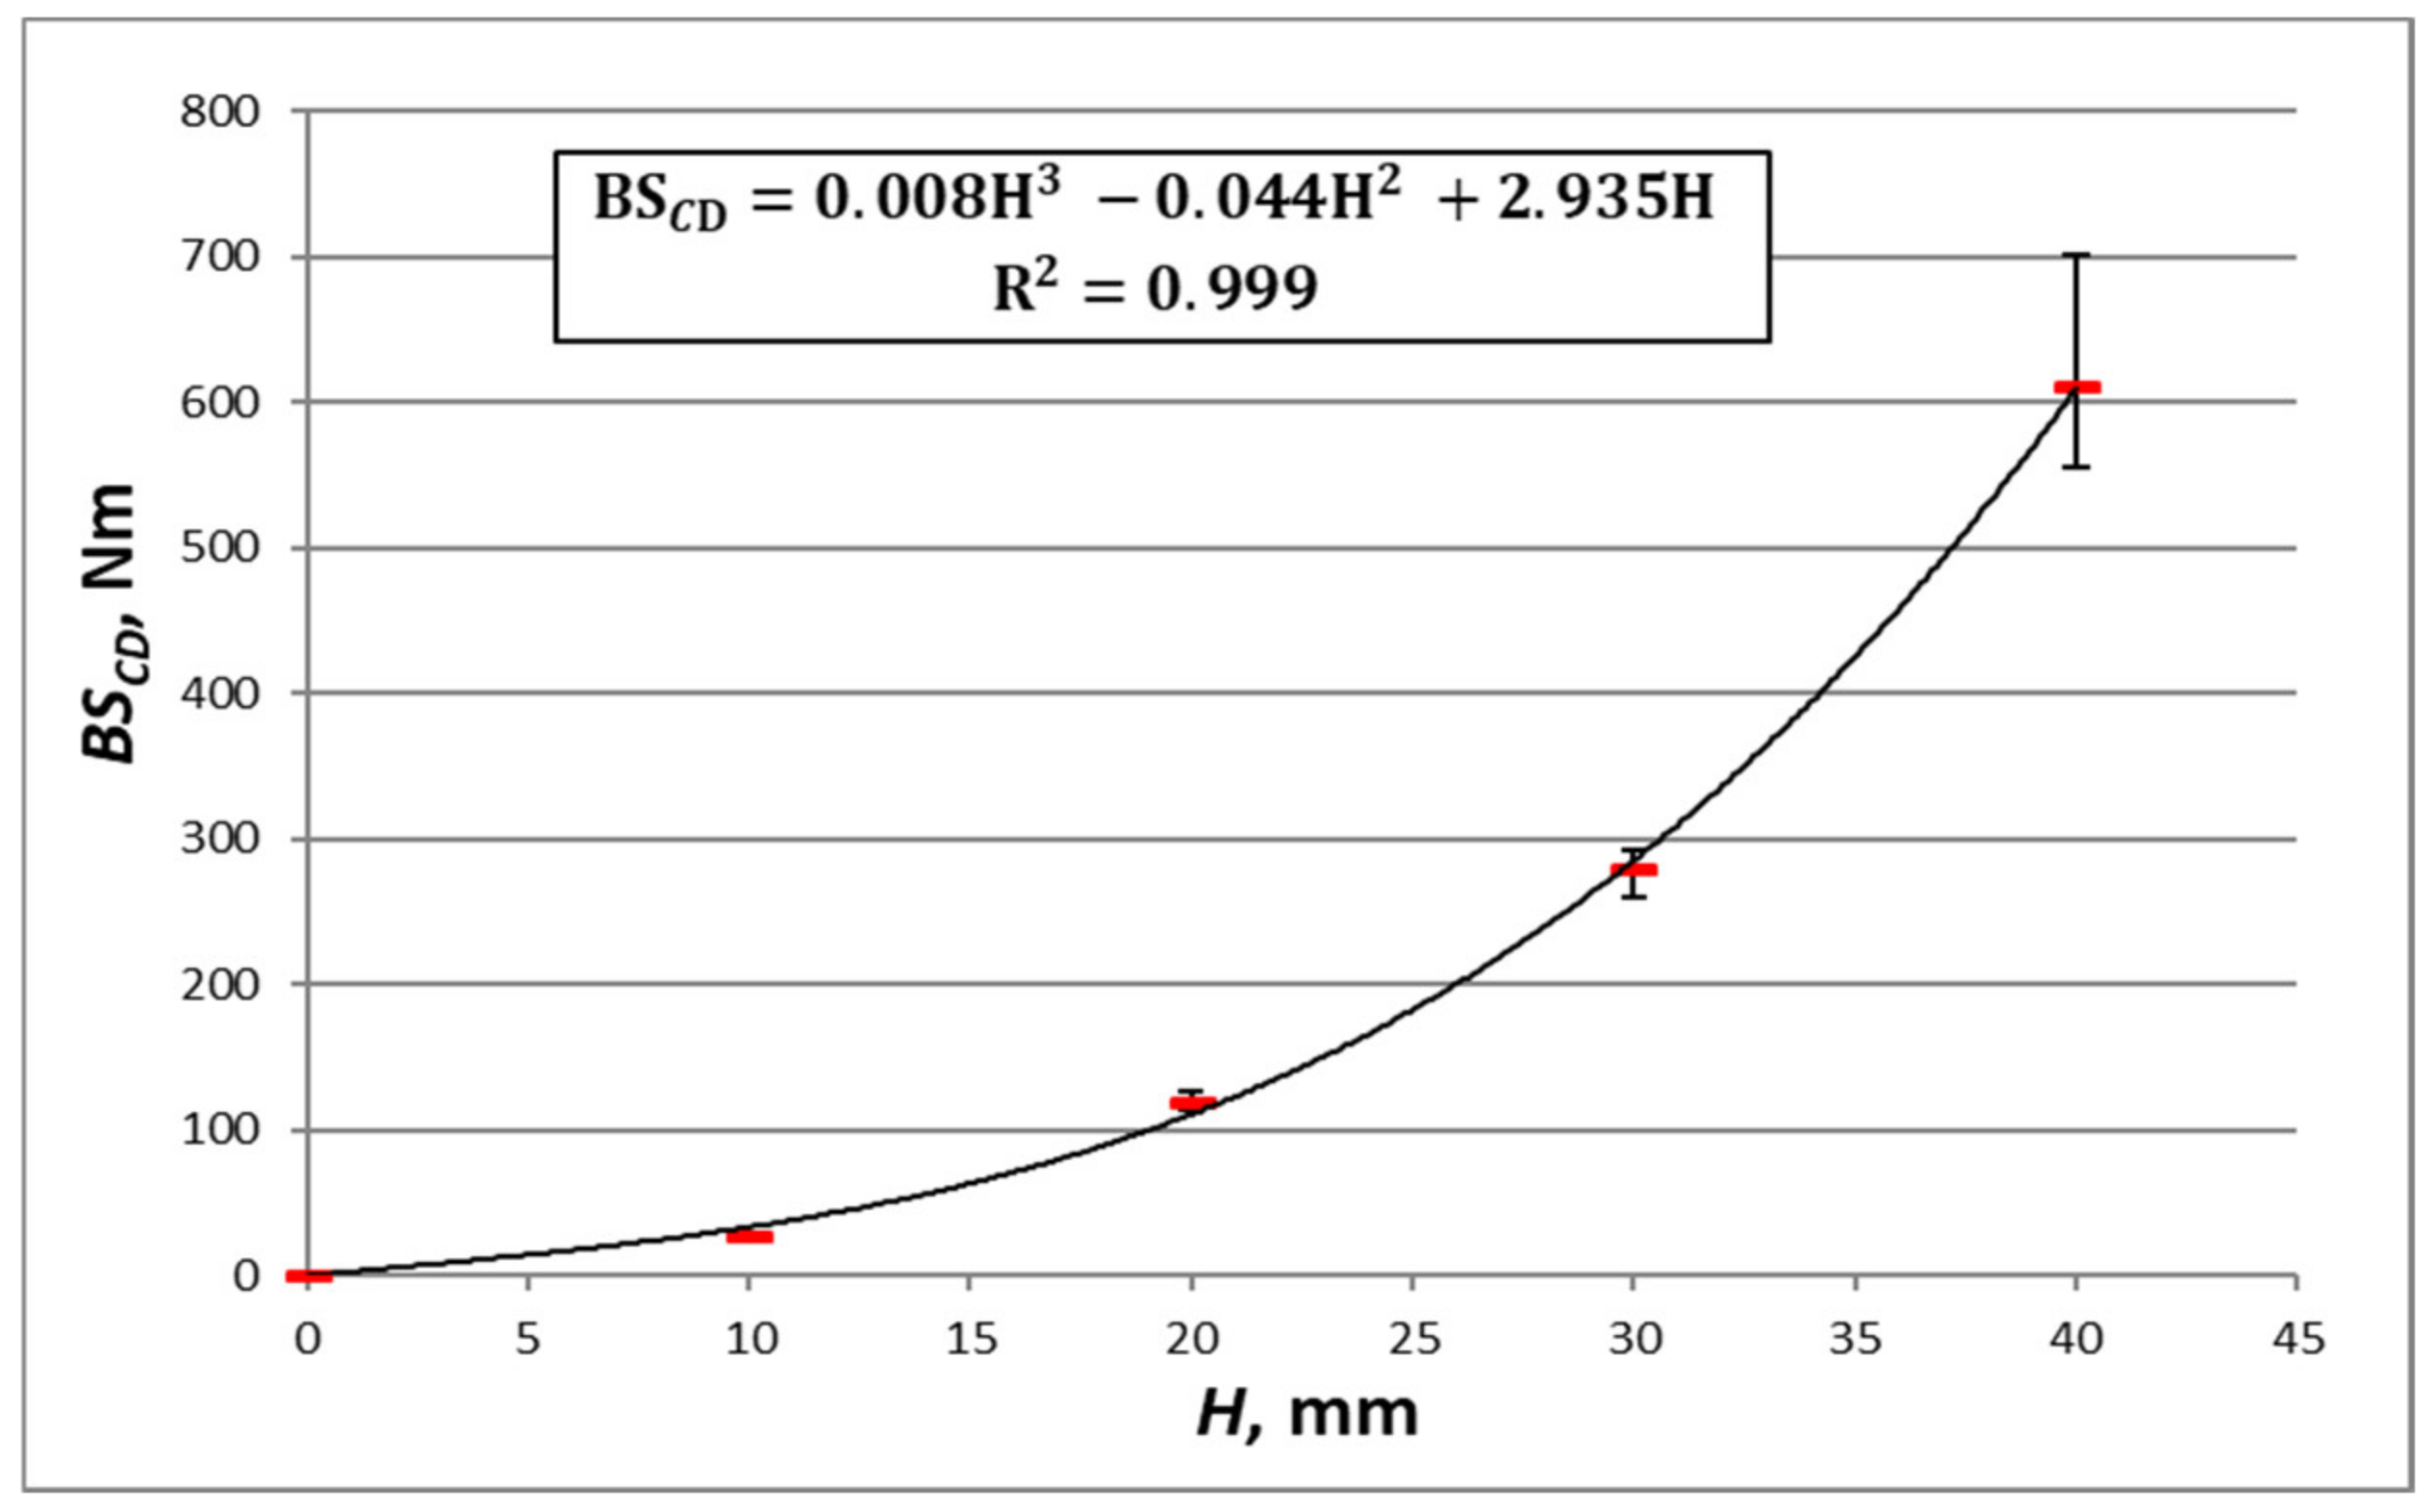
| The equation in Figure 13 | TL200/FL140/TL200 | CD | 16 | 11 |
Disclaimer/Publisher’s Note: The statements, opinions and data contained in all publications are solely those of the individual author(s) and contributor(s) and not of MDPI and/or the editor(s). MDPI and/or the editor(s) disclaim responsibility for any injury to people or property resulting from any ideas, methods, instructions or products referred to in the content. |
© 2022 by the authors. Licensee MDPI, Basel, Switzerland. This article is an open access article distributed under the terms and conditions of the Creative Commons Attribution (CC BY) license (https://creativecommons.org/licenses/by/4.0/).
Share and Cite
Kmita-Fudalej, G.; Szewczyk, W.; Kołakowski, Z. Bending Stiffness of Honeycomb Paperboard. Materials 2023, 16, 156. https://doi.org/10.3390/ma16010156
Kmita-Fudalej G, Szewczyk W, Kołakowski Z. Bending Stiffness of Honeycomb Paperboard. Materials. 2023; 16(1):156. https://doi.org/10.3390/ma16010156
Chicago/Turabian StyleKmita-Fudalej, Gabriela, Włodzimierz Szewczyk, and Zbigniew Kołakowski. 2023. "Bending Stiffness of Honeycomb Paperboard" Materials 16, no. 1: 156. https://doi.org/10.3390/ma16010156
APA StyleKmita-Fudalej, G., Szewczyk, W., & Kołakowski, Z. (2023). Bending Stiffness of Honeycomb Paperboard. Materials, 16(1), 156. https://doi.org/10.3390/ma16010156