
Assessment of Turning Polytetrafluoroethylene External Cylindrical Groove with Curvilinear Profile Tool


Abstract
:1. Introduction
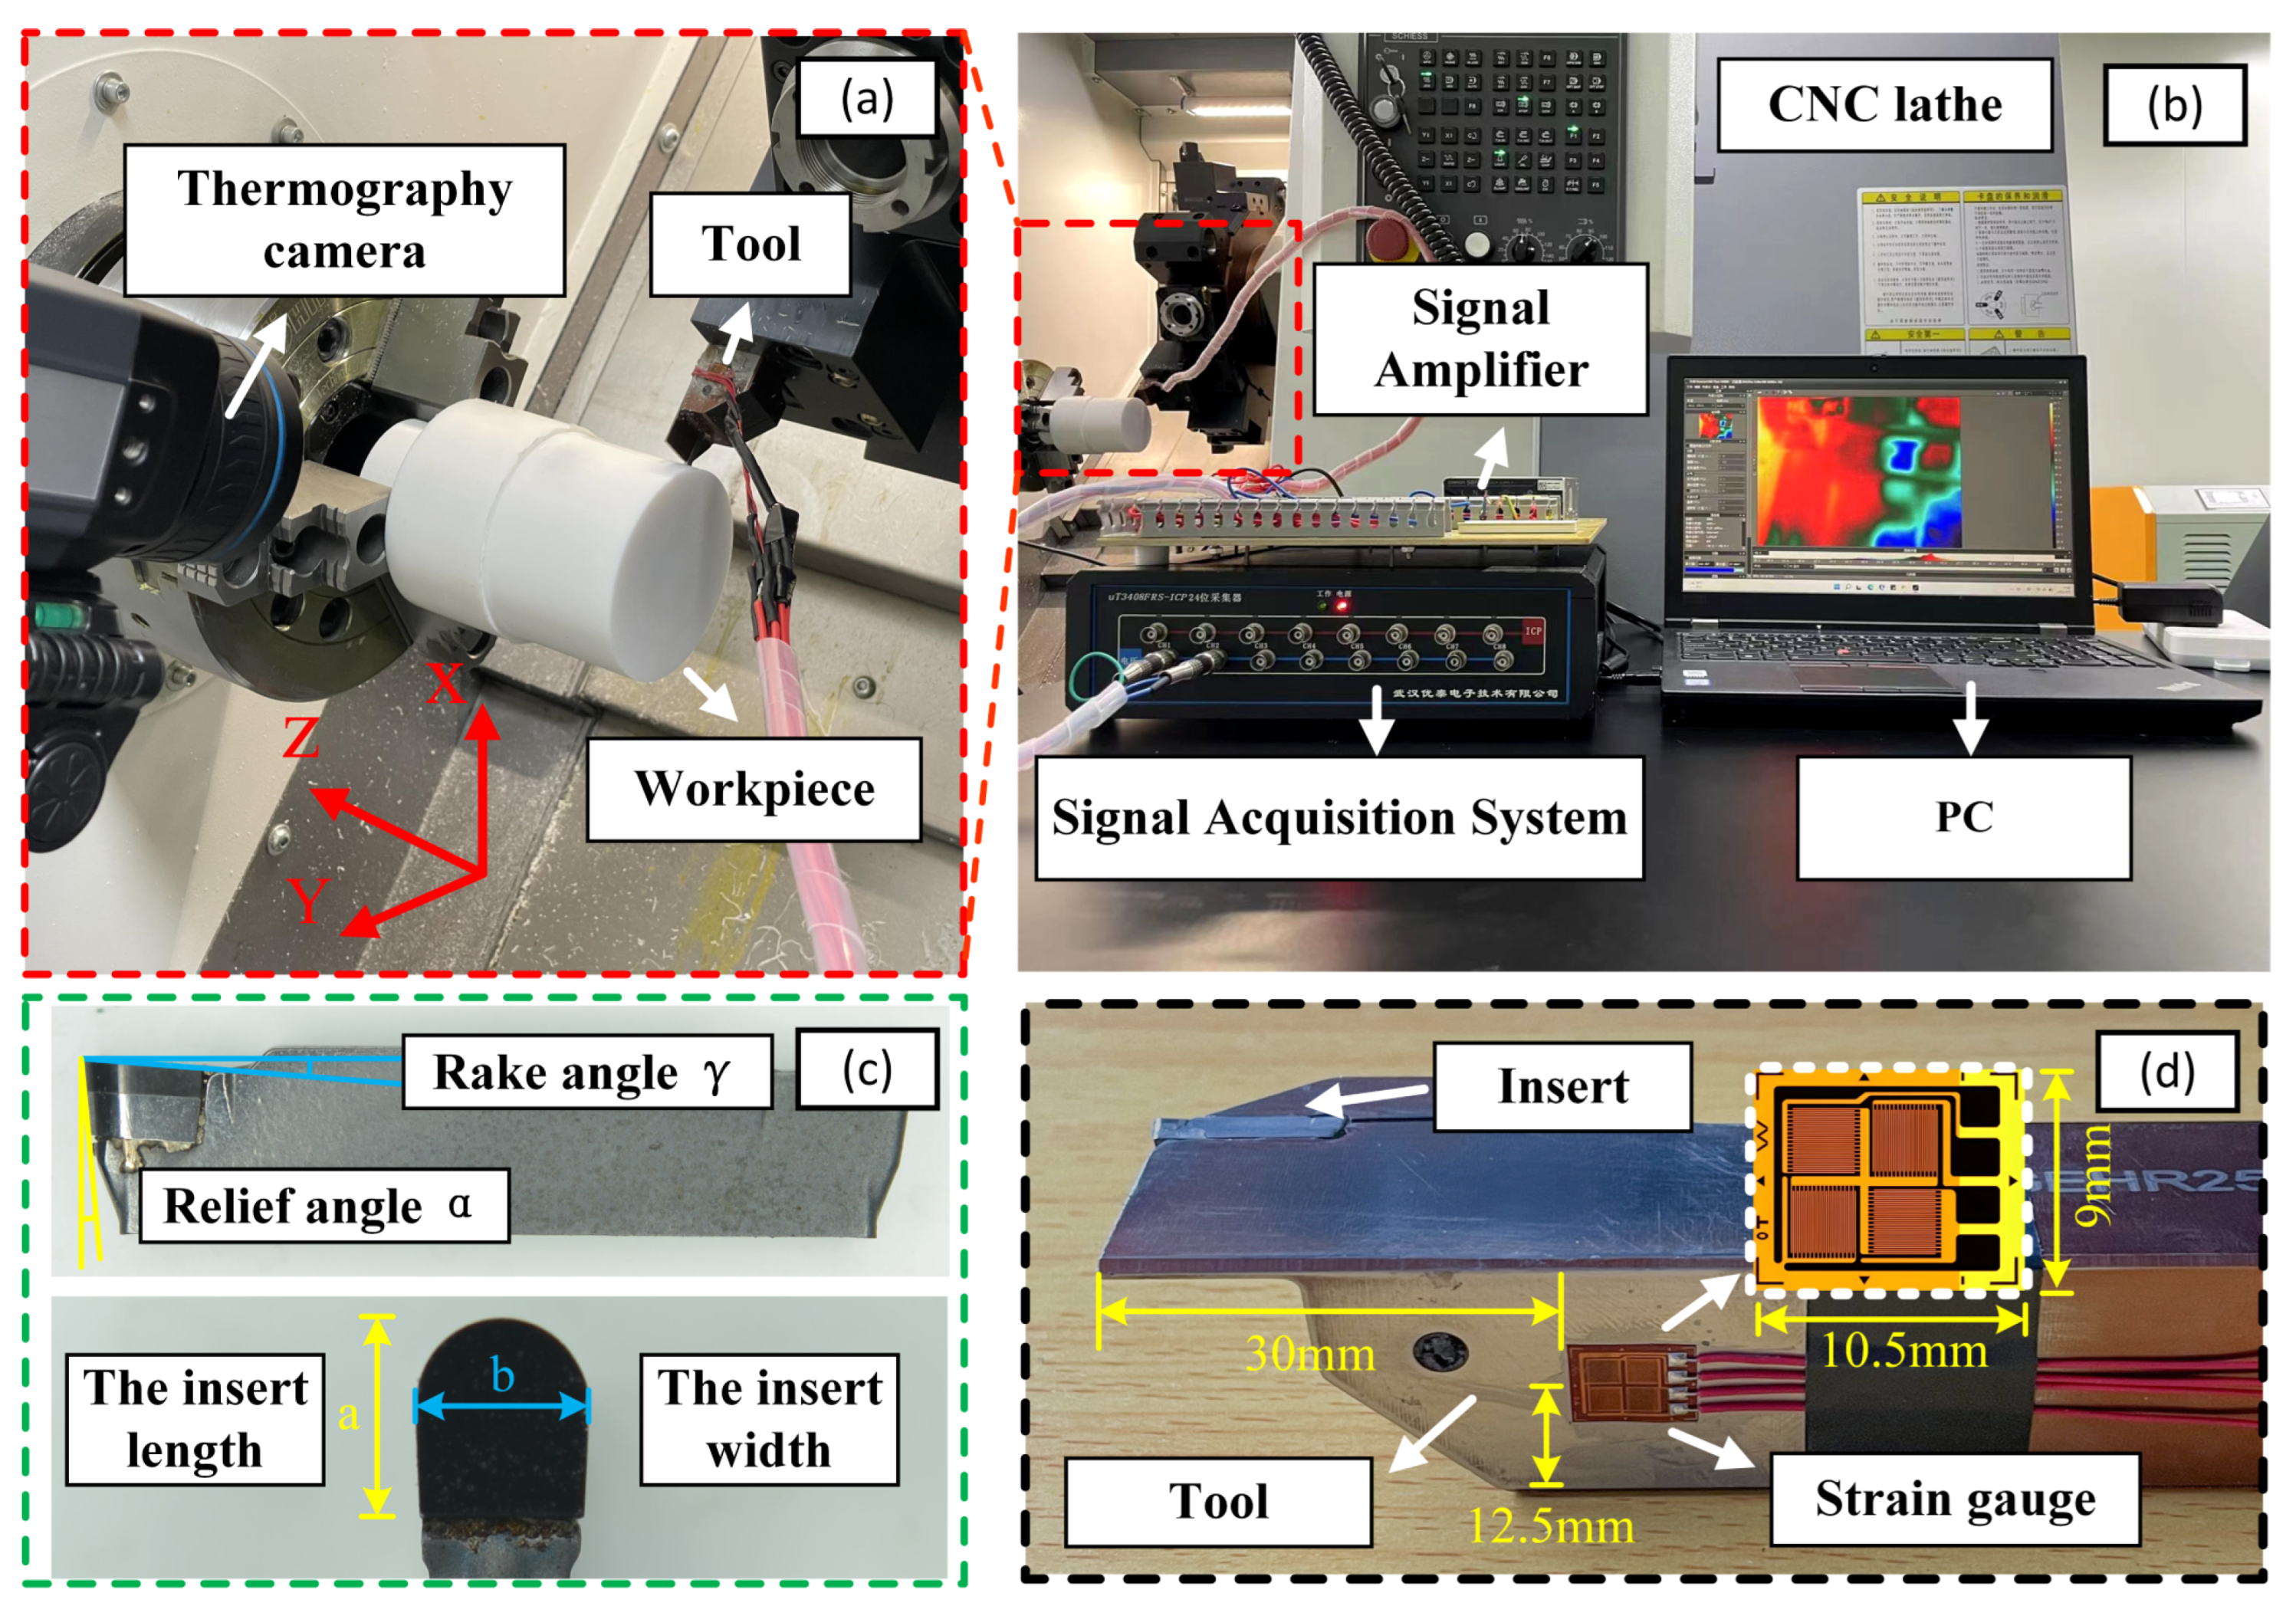
2. Experiment
3. Results and Discussion
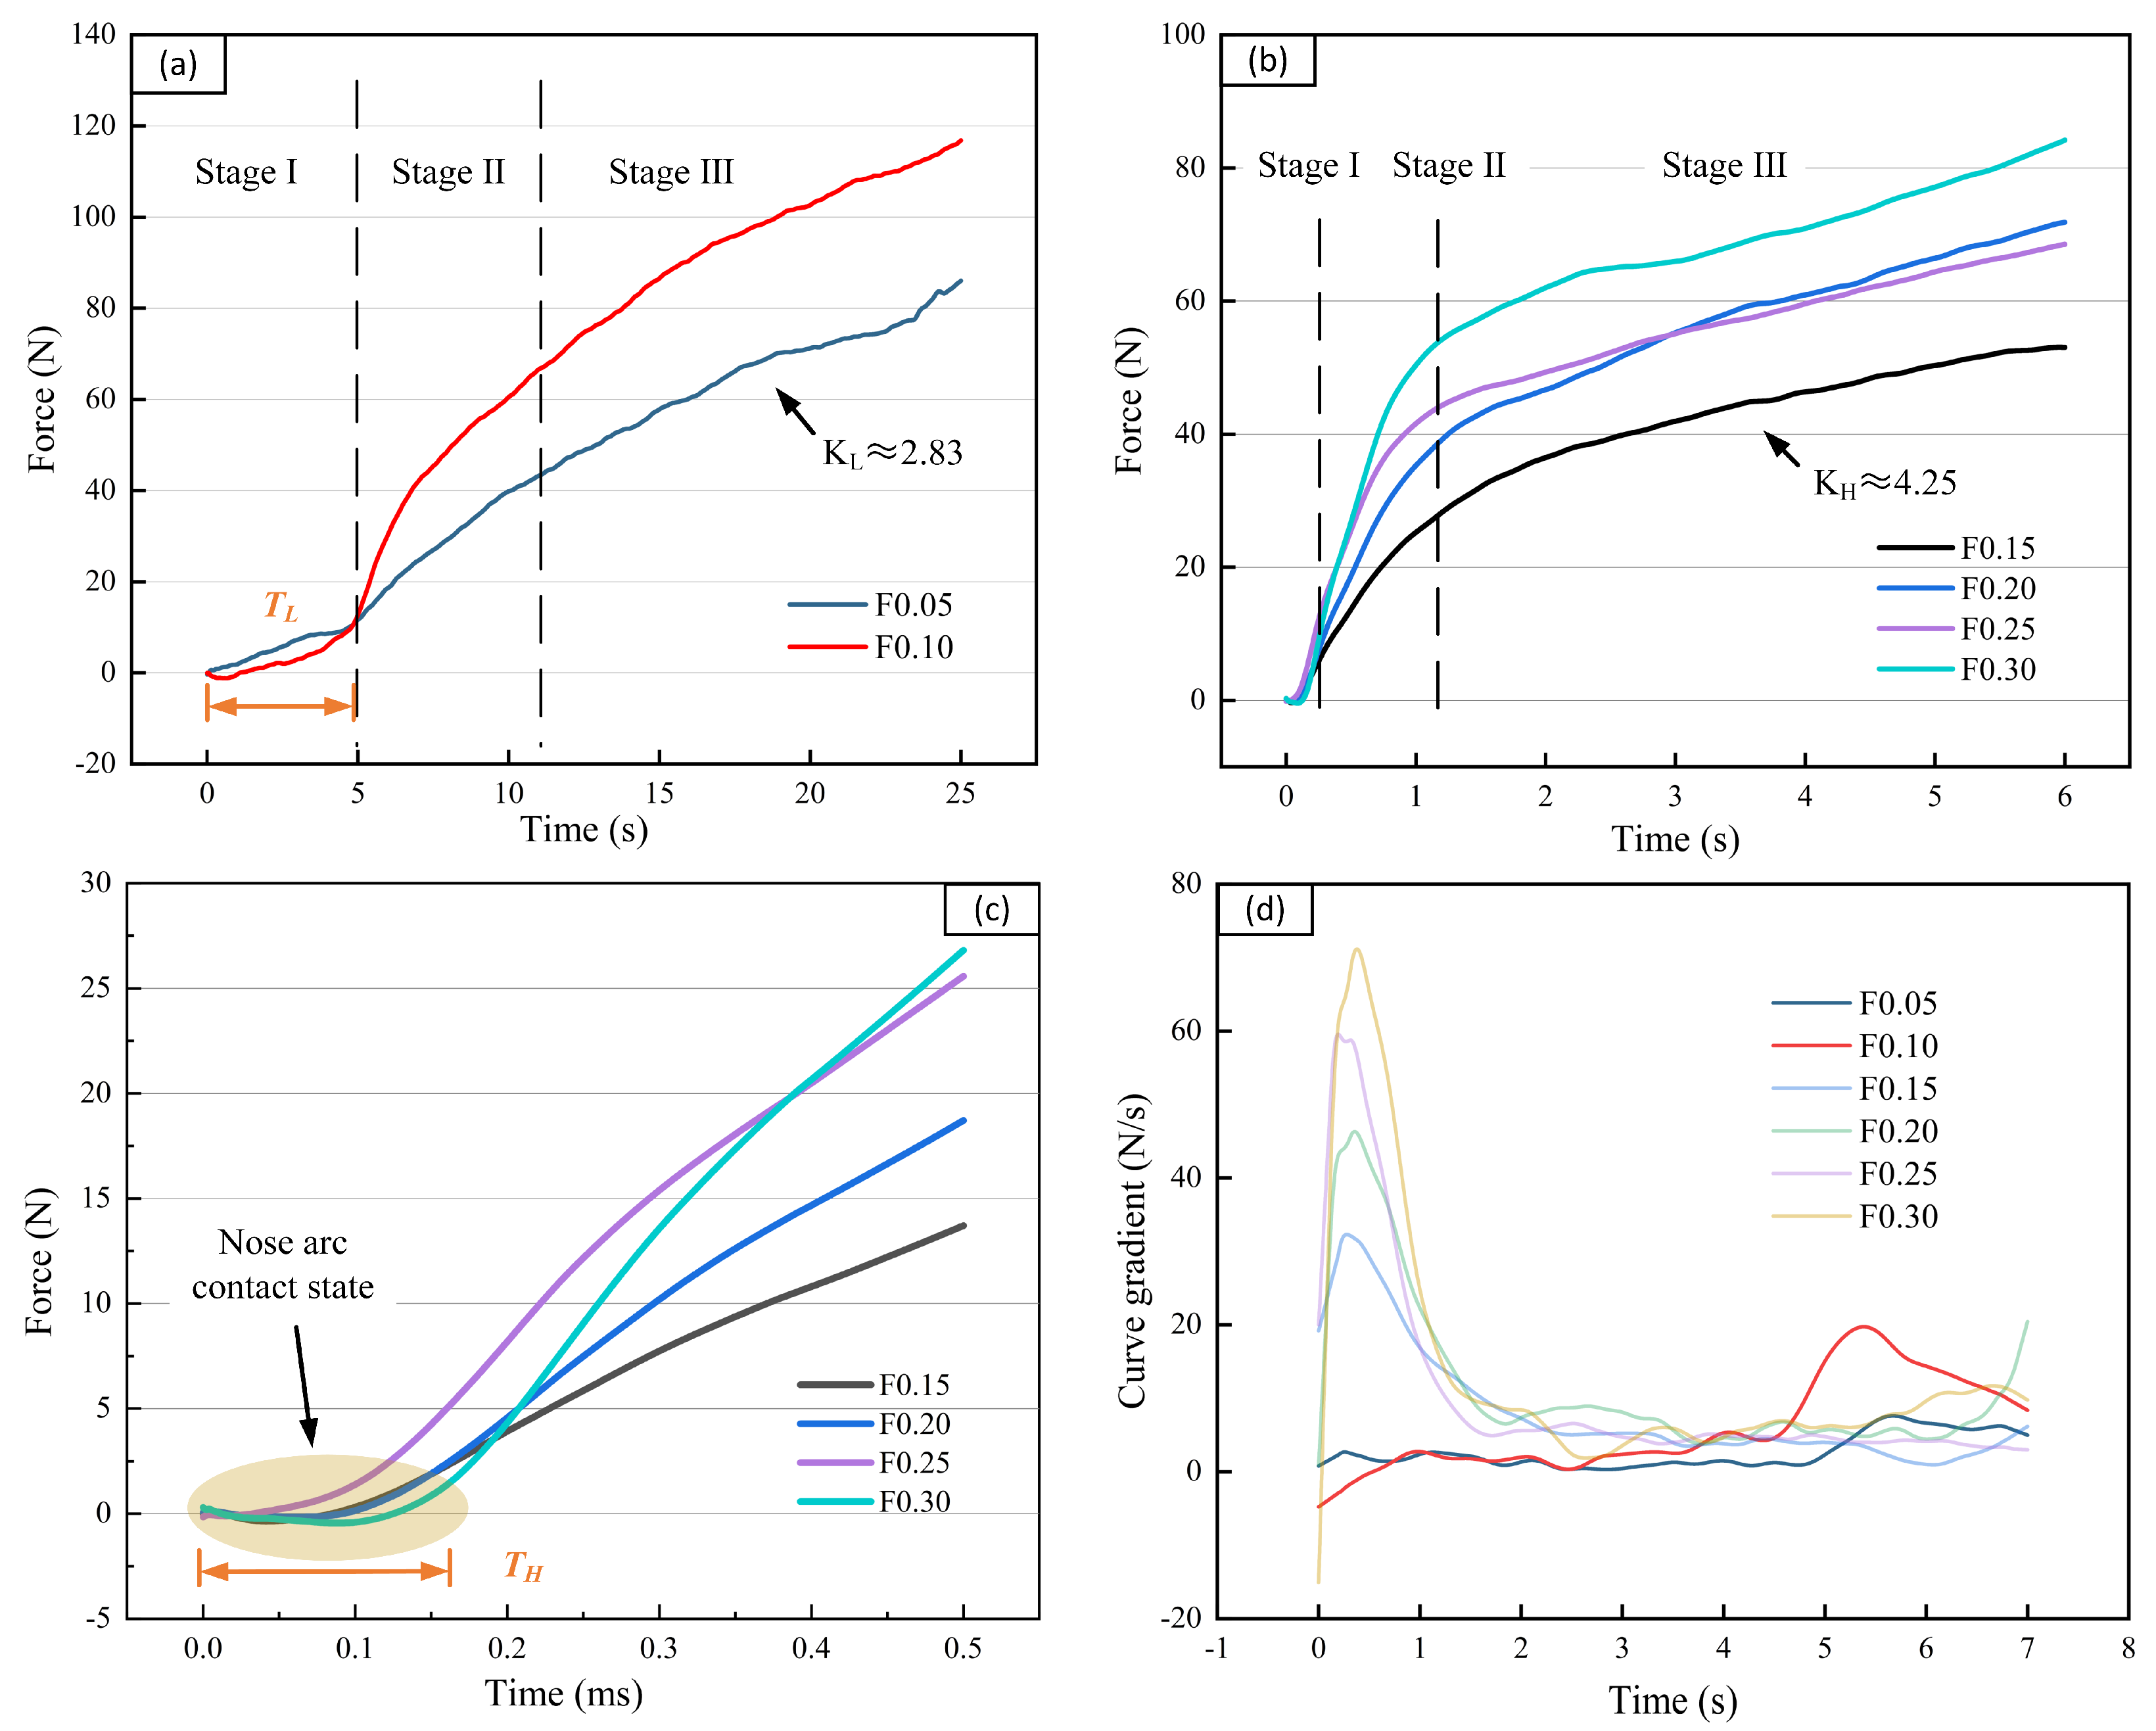
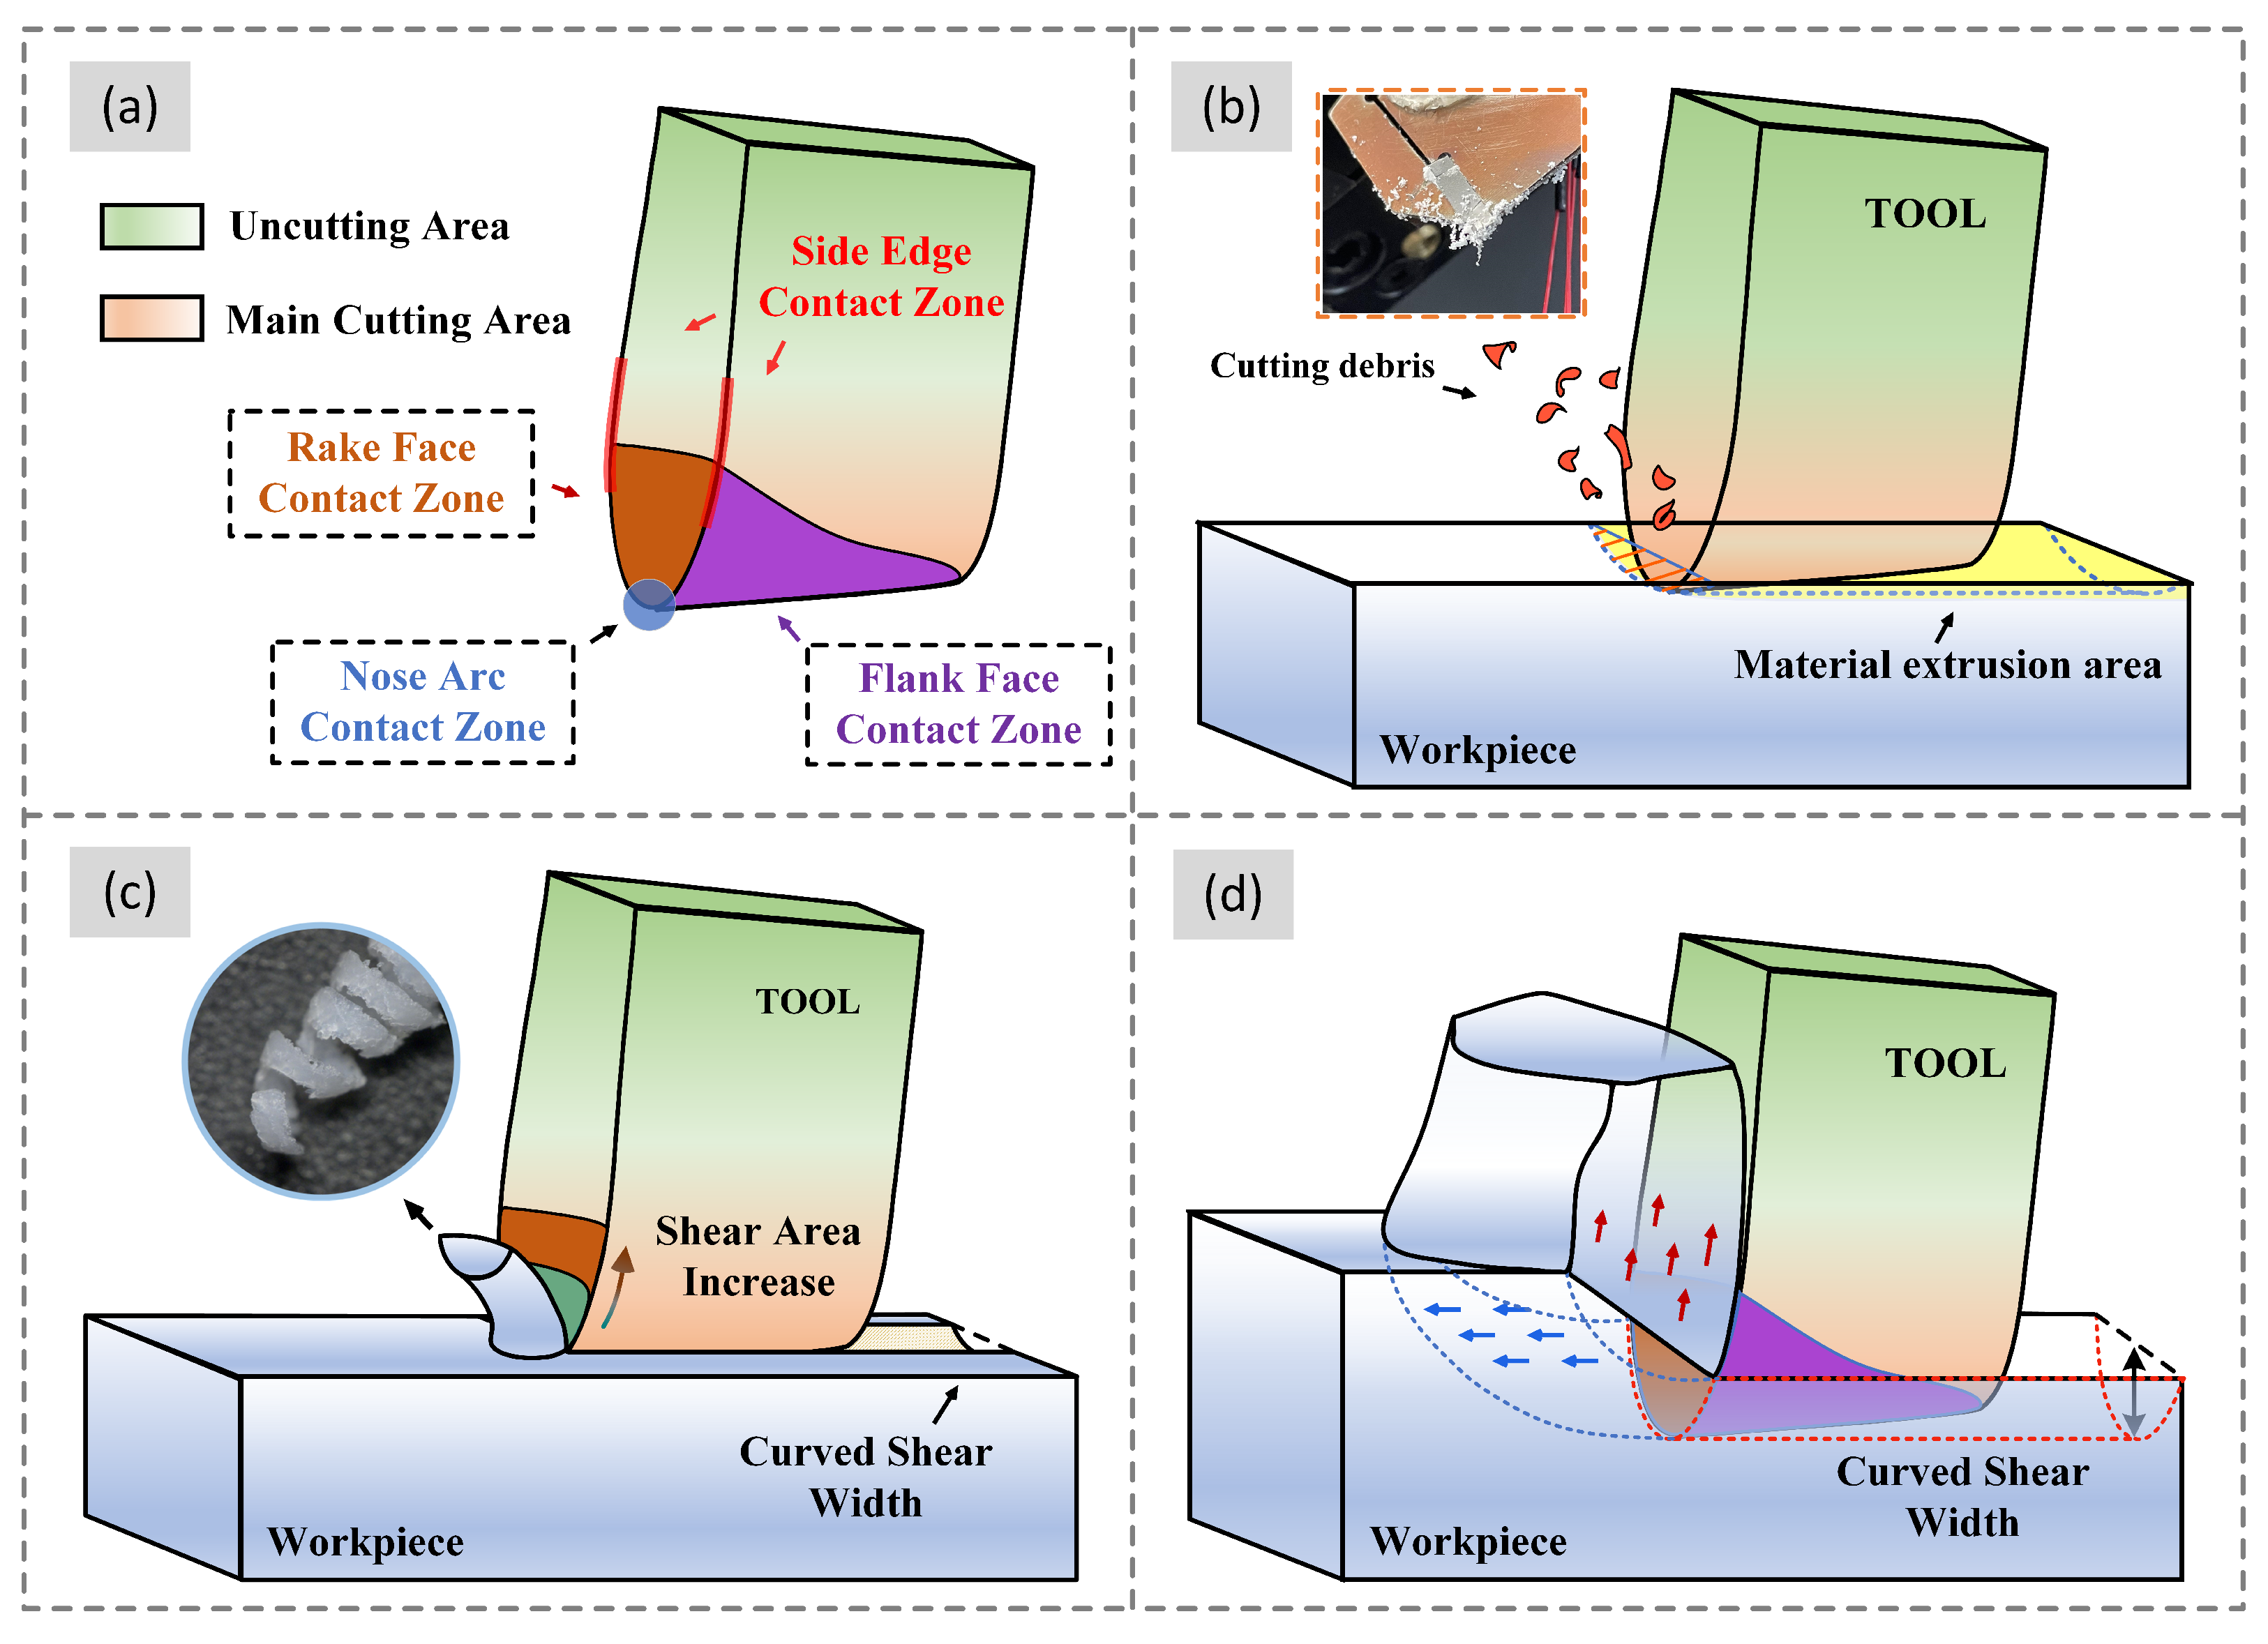
3.1. Analysis of Cutting Force
3.2. Analysis of Groove Width
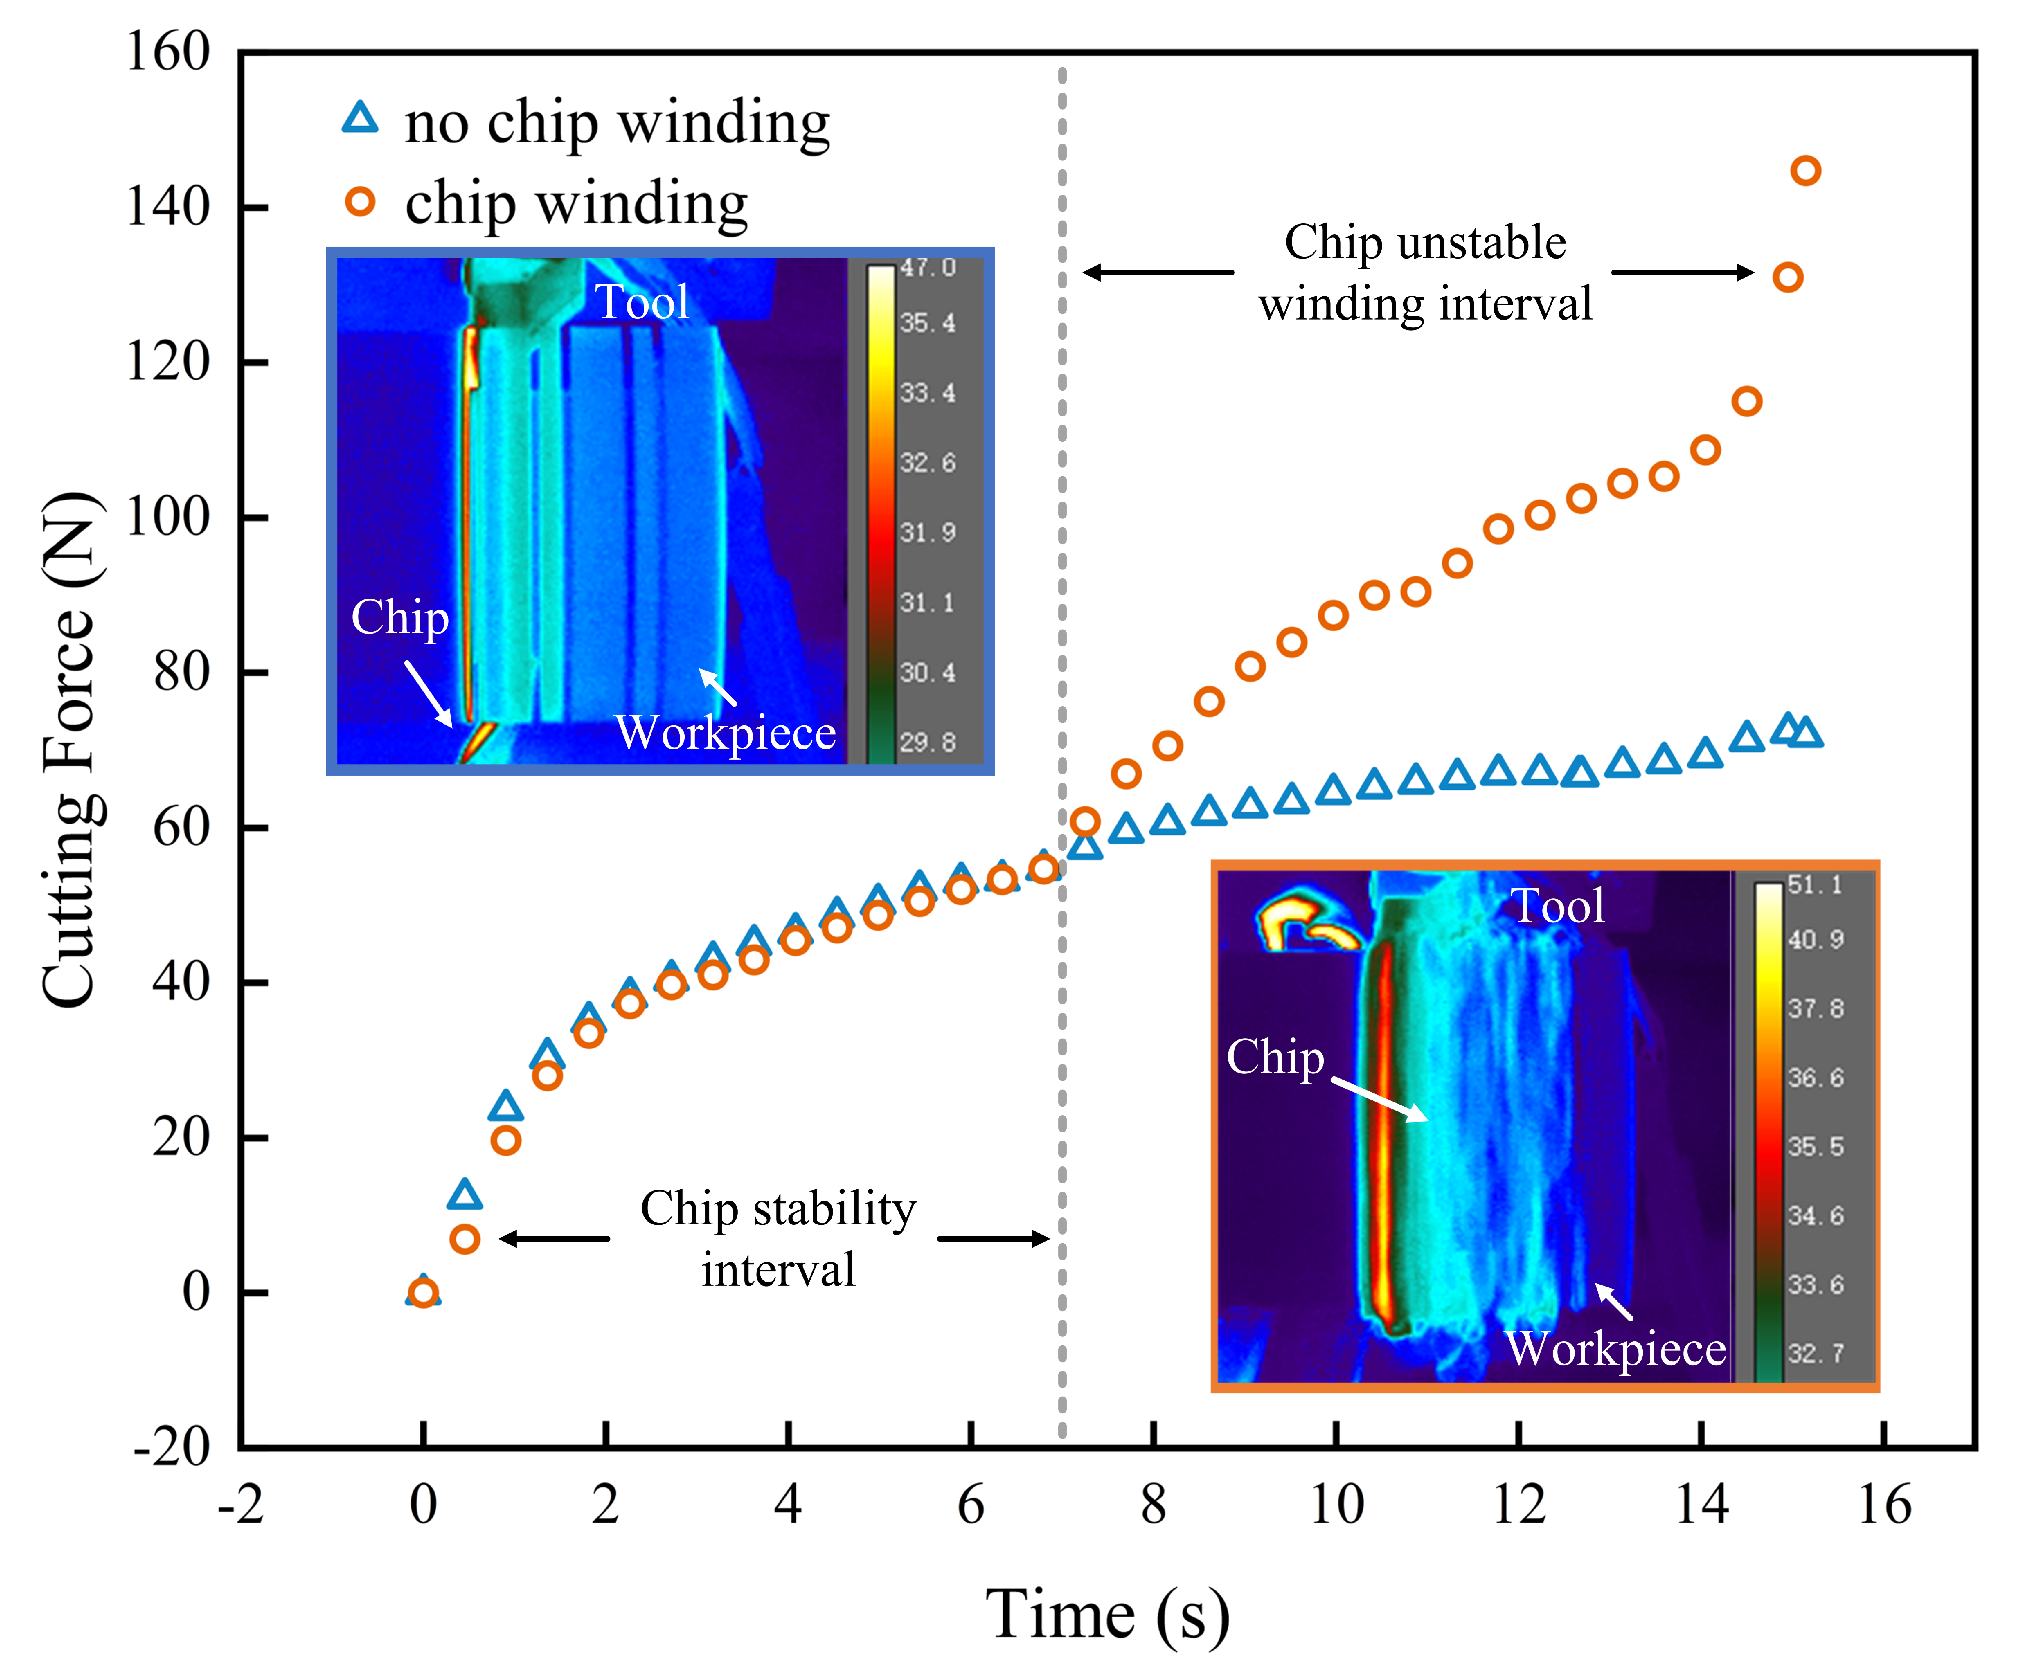
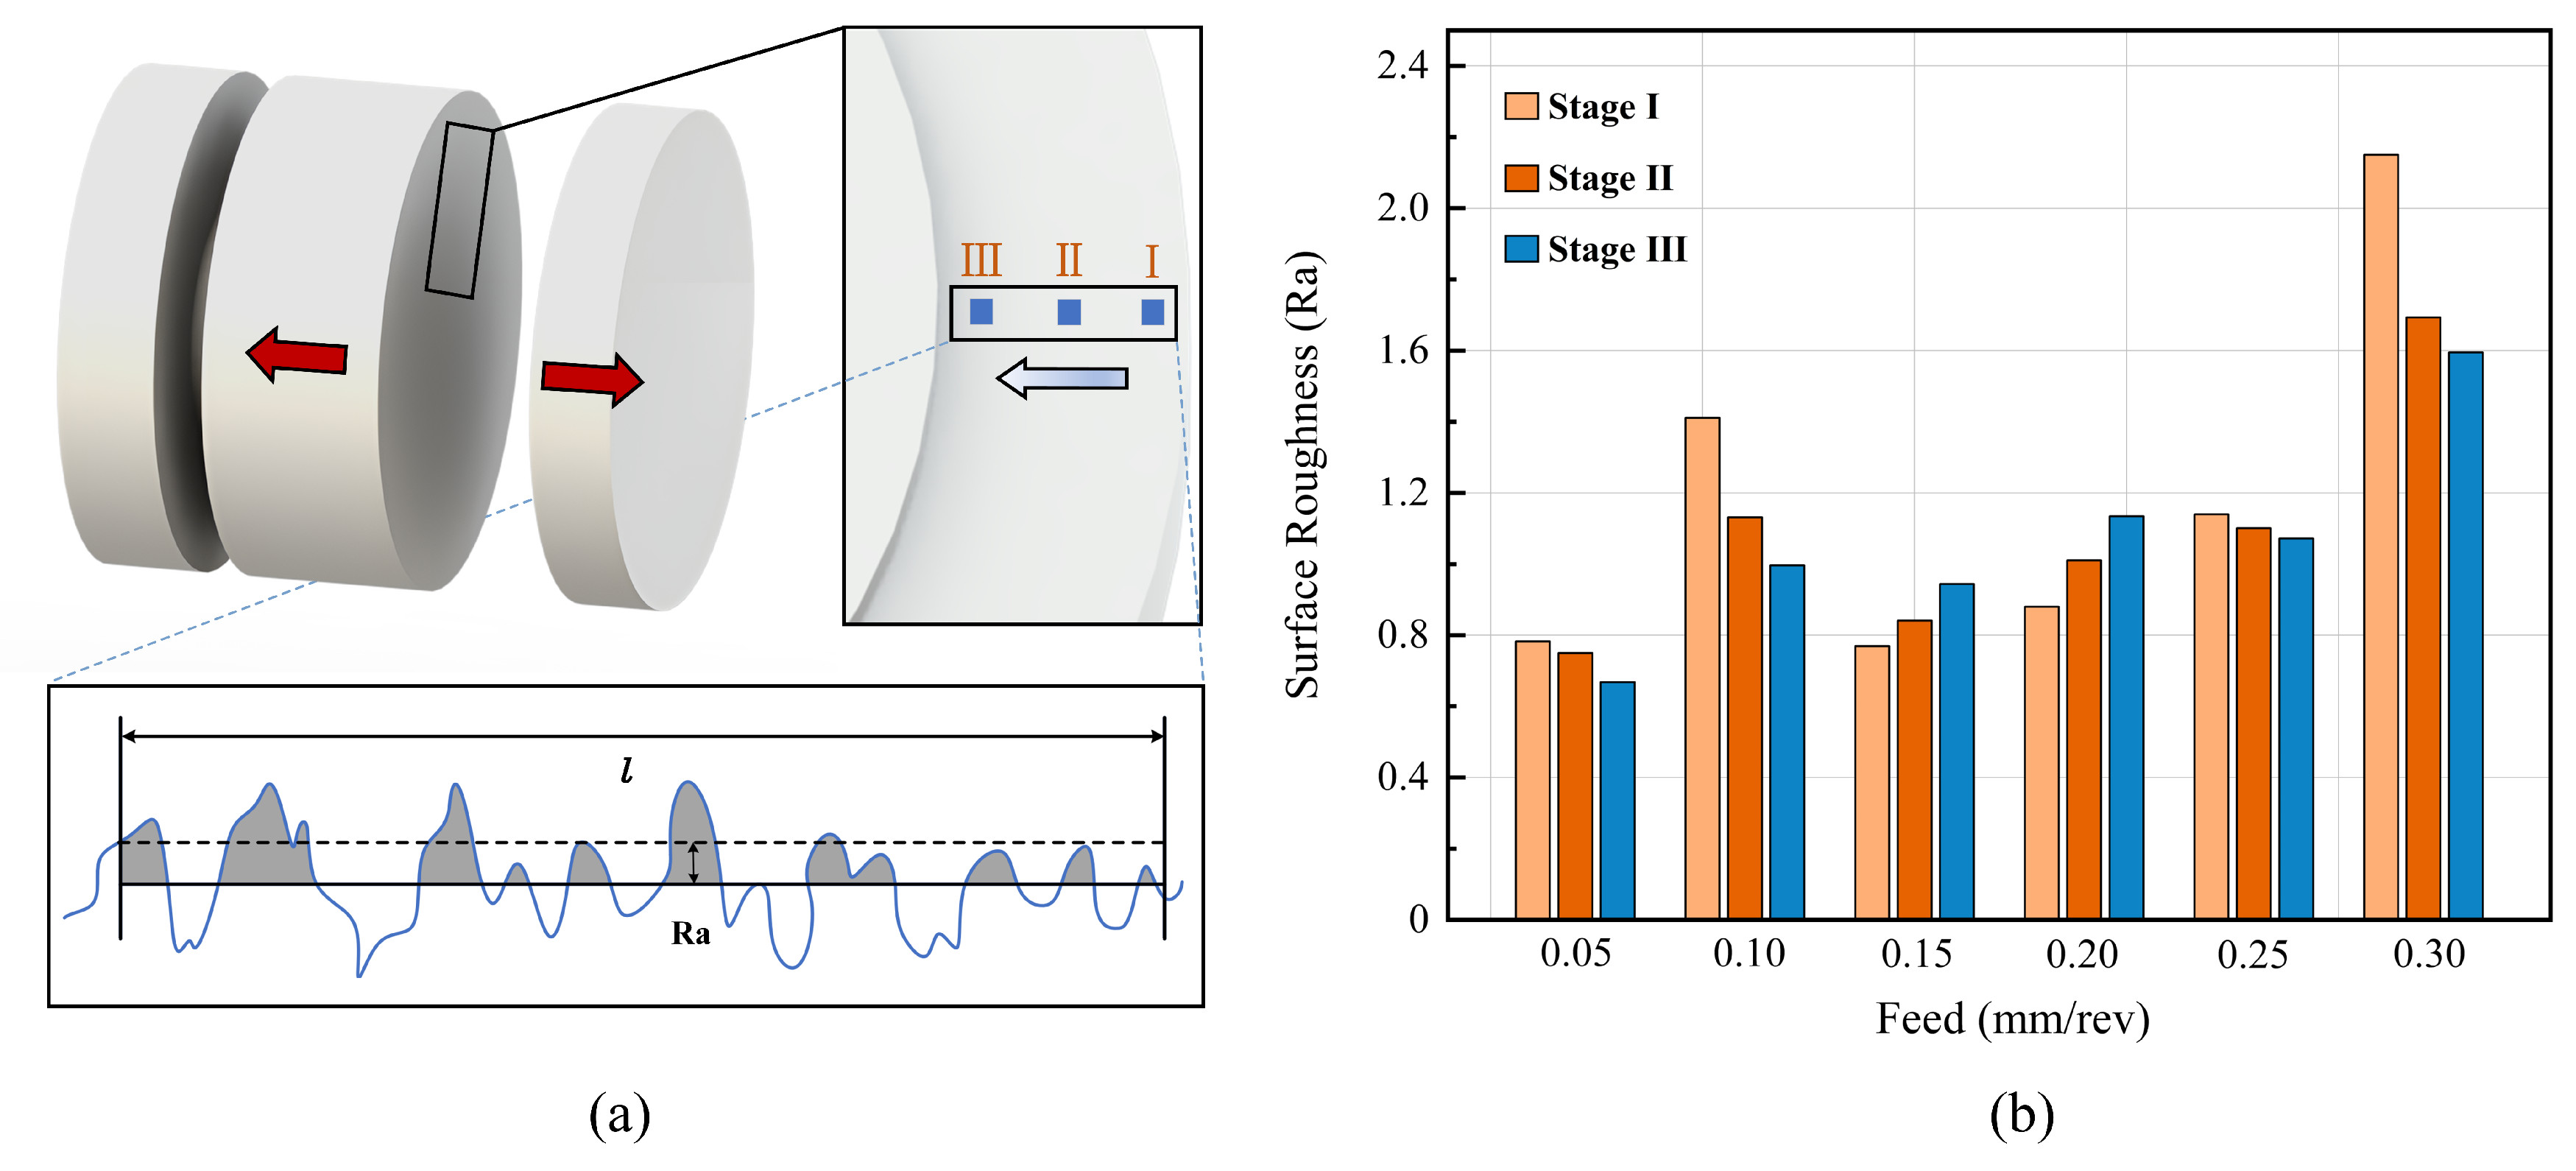
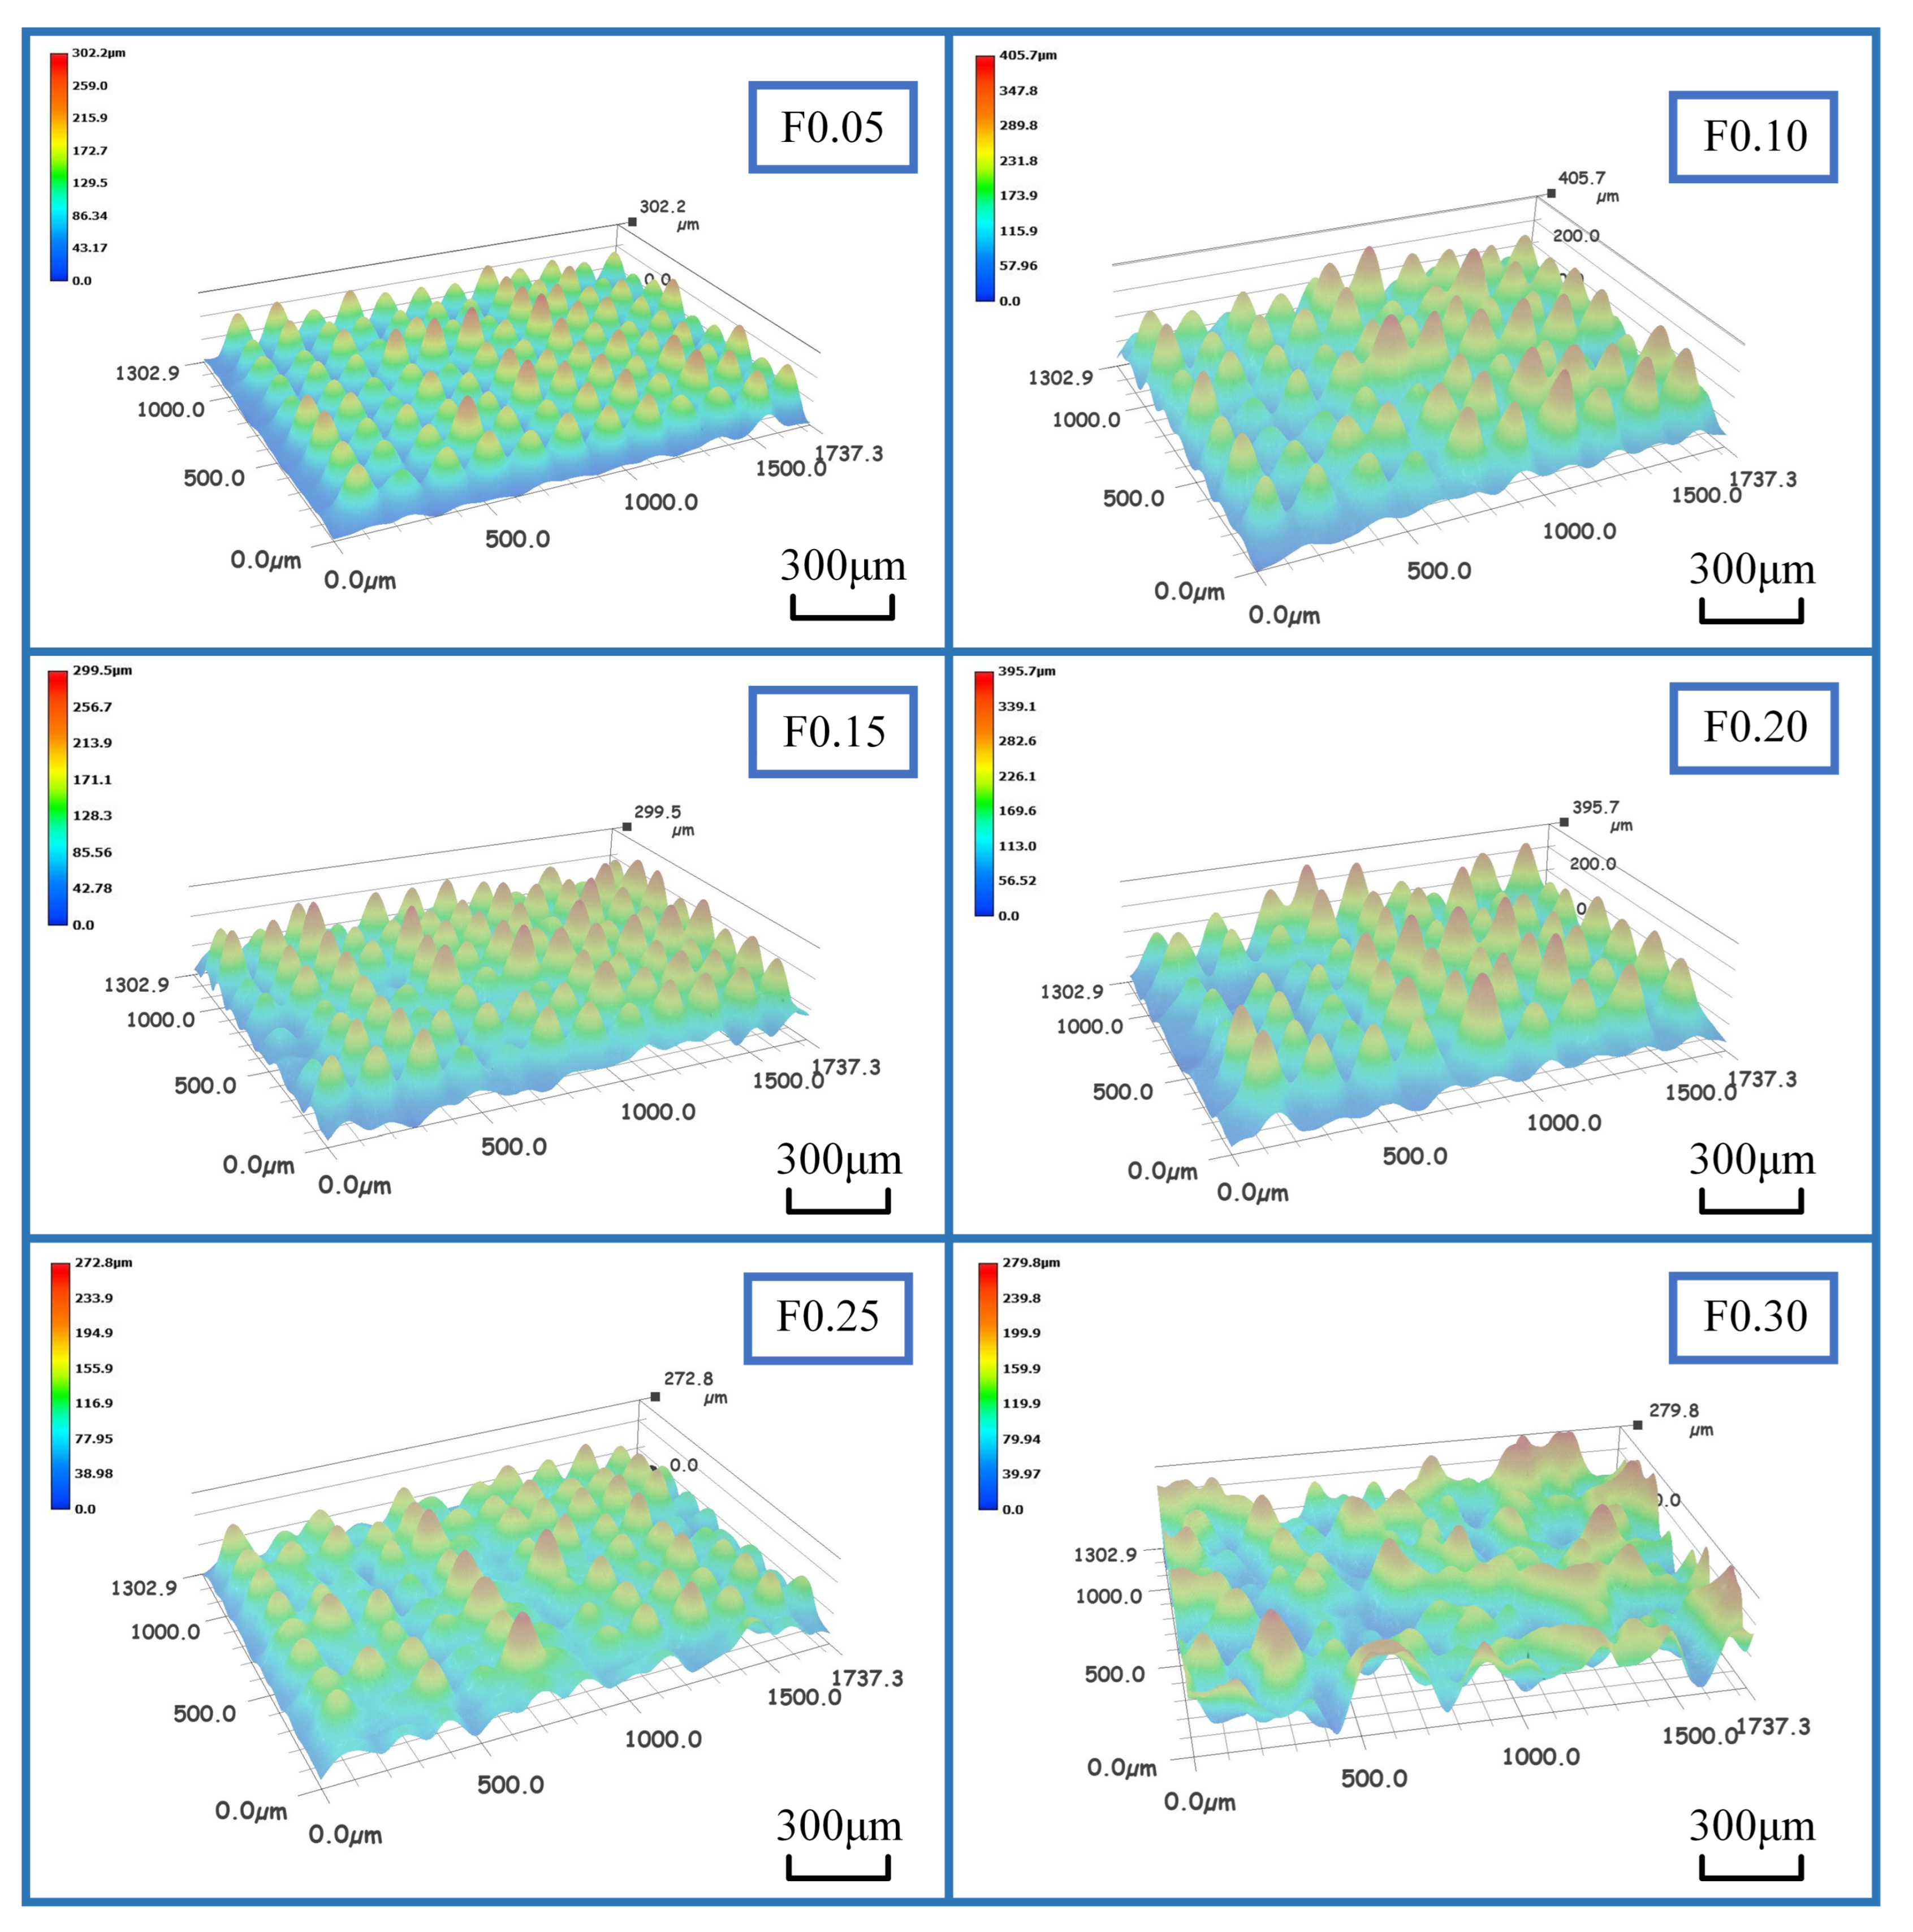
3.3. Chip Morphology and Surface Roughness
4. Conclusions
- The trends in the cutting force curves at different feed rates are different because of the different contact modes used in each stage. The rapid increase in cutting force in Stage II was affected by the increase in the area of the undeformed zone.
- Tubular type chips are generated during grooving, and the chip curl radius was the largest at 5 mm when the feed rate was 0.30 mm/rev. However, the large vibrations observed at the initial stage of cutting caused chip curling and affected the stability of the cutting force curve.
- When the feed rate was 0.05 mm/rev, the groove surface roughness was optimal. The surface of the material processed at a small feed rate exhibited high density and good uniformity.
- The groove width changed over time because of the time—dependent springback. The groove width error rate increased with the increase in the feed rate. The analysis in this study revealed that 0.05 mm/rev is the most suitable feed rate for grooving.
Author Contributions
Funding
Institutional Review Board Statement
Informed Consent Statement
Data Availability Statement
Conflicts of Interest
Nomenclature
| PTFE | Polytetrafluoroethylene |
| PCD | Polycrystalline diamond |
| Duration of Stage I of low feed (s) | |
| Duration of Stage I of high feed (s) | |
| The cutting force slopes of Stage III at low feed rates (N/s) | |
| The cutting force slopes of Stage III at high feed rates (N/s) | |
| a | The insert length (mm) |
| b | The insert width (mm) |
| Tool rake angle | |
| Tool relief angle | |
| H | The ideal groove depth (mm) |
| The ideal groove width (mm) | |
| The groove width after processing (mm) | |
| The groove width after standing (mm) | |
| The decrease rate of the groove width | |
| The error rate of the groove width |
References
- Dhanumalayan, E.; Joshi, G.M. Performance Properties and Applications of Polytetrafluoroethylene (PTFE)—A Review. Adv. Compos. Hybrid. Mater. 2018, 1, 247–268. [Google Scholar] [CrossRef]
- Rae, P.J.; Dattelbaum, D.M. The Properties of Poly(Tetrafluoroethylene) (PTFE) in Compression. Polymer 2004, 45, 7615–7625. [Google Scholar] [CrossRef]
- Rae, P.J.; Brown, E.N. The Properties of Poly(Tetrafluoroethylene) (PTFE) in Tension. Polymer 2005, 46, 8128–8140. [Google Scholar] [CrossRef]
- Cui, Z.; Ni, J.; He, L.; Guan, L.; Han, L.; Sun, J. Investigation of Chip Formation, Cutting Force and Surface Roughness during Orthogonal Cutting of Polytetrafluoroethylene. J. Manuf. Process. 2022, 77, 485–494. [Google Scholar] [CrossRef]
- Natarajan, E.; Kaviarasan, V.; Lim, W.H.; Tiang, S.S.; Parasuraman, S.; Elango, S. Non-Dominated Sorting Modified Teaching–Learning-Based Optimization for Multi-Objective Machining of Polytetrafluoroethylene (PTFE). J. Intell. Manuf. 2020, 31, 911–935. [Google Scholar] [CrossRef]
- Fetecau, C.; Stan, F. Study of Cutting Force and Surface Roughness in the Turning of Polytetrafluoroethylene Composites with a Polycrystalline Diamond Tool. Measurement 2012, 45, 1367–1379. [Google Scholar] [CrossRef]
- Ni, J.; Han, L.; Wu, S.; Cui, Z.; Zeng, X. Modeling of Thrust and Torque for Drilling PTFE Materials. Int. J. Adv. Manuf. Technol. 2022, 120, 215–226. [Google Scholar] [CrossRef]
- Gan, Y.; Wang, Y.; Liu, K.; Han, L.; Luo, Q.; Liu, H. A Novel and Effective Method for Cryogenic Milling of Polytetrafluoroethylene. Int. J. Adv. Manuf. Technol. 2021, 112, 969–976. [Google Scholar] [CrossRef]
- Petropoulos, G.; Mata, F.; Davim, J.P. Statistical Study of Surface Roughness in Turning of Peek Composites. Mater. Des. 2008, 29, 218–223. [Google Scholar] [CrossRef]
- Ji, S.; Sun, C.; Zhao, J.; Liang, F. Comparison and Analysis on Mechanical Property and Machinability about Polyetheretherketone and Carbon-Fibers Reinforced Polyetheretherketone. Materials 2015, 8, 4118–4130. [Google Scholar] [CrossRef] [Green Version]
- Jogi, B.F.; Tarekar, M.; Dhajekar, R.M.; Pawade, R. Multi Objective Optimization Using Taguchi Grey Relational Analysis (Gra) for Cnc Turning of Poly-Ether-Ether-Ketone (Peek) Polymer. Polym. Polym. Compos. 2016, 24, 523–528. [Google Scholar] [CrossRef]
- Goel, B.; Singh, S.; Sarepaka, R.G.V. Precision Deterministic Machining of Polymethyl Methacrylate by Single-Point Diamond Turning. Mater. Manuf. Process. 2016, 31, 1917–1926. [Google Scholar] [CrossRef]
- Trifunović, M.; Madić, M.; Janković, P.; Rodić, D.; Gostimirović, M. Investigation of Cutting and Specific Cutting Energy in Turning of POM-C Using a PCD Tool: Analysis and Some Optimization Aspects. J. Clean. Prod. 2021, 303, 127043. [Google Scholar] [CrossRef]
- Gupta, A.K.; Guntuku, S.C.; Desu, R.K.; Balu, A. Optimisation of Turning Parameters by Integrating Genetic Algorithm with Support Vector Regression and Artificial Neural Networks. Int. J. Adv. Manuf. Technol. 2015, 77, 331–339. [Google Scholar] [CrossRef]
- Chabbi, A.; Yallese, M.A.; Nouioua, M.; Meddour, I.; Mabrouki, T.; Girardin, F. Modeling and Optimization of Turning Process Parameters during the Cutting of Polymer (POM C) Based on RSM, ANN, and DF Methods. Int. J. Adv. Manuf. Technol. 2017, 91, 2267–2290. [Google Scholar] [CrossRef]
- Ni, J.; Tong, K.; Meng, Z.; Feng, K. Force Model for Complex Profile Tool in Broaching Inconel 718. Int. J. Adv. Manuf. Technol. 2022, 119, 1153–1165. [Google Scholar] [CrossRef]
- Weng, J.; Zhuang, K.; Chen, D.; Guo, S.; Ding, H. An Analytical Force Prediction Model for Turning Operation by Round Insert Considering Edge Effect. Int. J. Mech. Sci. 2017, 128, 168–180. [Google Scholar] [CrossRef]
- Weng, J.; Zhuang, K.; Zhu, D.; Guo, S.; Ding, H. An Analytical Model for the Prediction of Force Distribution of Round Insert Considering Edge Effect and Size Effect. Int. J. Mech. Sci. 2018, 138–139, 86–98. [Google Scholar] [CrossRef]
- Lu, L.; Tang, Y.; Yuan, D.; Deng, D. Groove Deformation Analysis of a Single Plough on Inner Copper Tube. J. Mater. Process. Technol. 2011, 211, 1669–1677. [Google Scholar] [CrossRef]
- Li, B.; Zhang, S.; Yan, Z.; Zhang, J. Effect of Edge Hone Radius on Chip Formation and Its Microstructural Characterization in Hard Milling of AISI H13 Steel. Int. J. Adv. Manuf. Technol. 2018, 97, 305–318. [Google Scholar] [CrossRef]
- Xu, J.; Wang, F.; Jiang, F.; Chen, J.; Wu, X.; Xie, H.; Wang, J.; Lin, W. Experimental Study on the Low-Feed Grooving Process with Different Grooving Tools. Int. J. Adv. Manuf. Technol. 2020, 107, 4755–4766. [Google Scholar] [CrossRef]
- Hocheng, H.; Hsieh, M.L. Signal Analysis of Surface Roughness in Diamond Turning of Lens Molds. Int. J. Mach. Tools Manuf. 2004, 44, 1607–1618. [Google Scholar] [CrossRef]
- Tian, F.; Yin, Z.; Li, S. Fast Tool Servo Diamond Turning of Optical Freeform Surfaces for Rear-View Mirrors. Int. J. Adv. Manuf. Technol. 2015, 80, 1759–1765. [Google Scholar] [CrossRef]
- Zhi-jian, G.; Liang, H.; Xiao-dong, R.; Rui, S.; Xin, F. The optimization of bellows convolutions in bellows pump for better stress distribution. J. Mech. Eng. Sci. 2022, 236, 6141–6151. [Google Scholar] [CrossRef]
- DuPont Fluoroproducts. Teflon PTFE Fluoropolymer Resin: Properties Handbook; DuPont Fluoroproducts: Wilmington, NC, USA, 1996. [Google Scholar]
- Ferreira, J.R.; Coppini, N.L.; Miranda, G.W.A. Machining Optimisation in Carbon ®bre Reinforced Composite Materials. J. Mater. Process. Technol. 1999, 6, 135–140. [Google Scholar] [CrossRef]
- Liu, K.; Melkote, S.N. Effect of Plastic Side Flow on Surface Roughness in Micro-Turning Process. Int. J. Mach. Tools Manuf. 2006, 46, 1778–1785. [Google Scholar] [CrossRef]
- Tan, B.; Stephens, L.S. Evaluation of Viscoelastic Characteristics of PTFE-Based Materials. Tribol. Int. 2019, 140, 105870. [Google Scholar] [CrossRef]
- Wang, J.F.; Wagoner, R.H.; Carden, W.D.; Matlock, D.K.; Barlat, F. Creep and Anelasticity in the Springback of Aluminum. Int. J. Plast. 2004, 20, 2209–2232. [Google Scholar] [CrossRef]
- Zawada-Tomkiewicz, A.; Tomkiewicz, D.; Pela, M. Identification of a Workpiece Temperature Compensation Model for Automatic Correction of the Cutting Process. Materials 2022, 15, 8372. [Google Scholar] [CrossRef]
- Portman, V.T.; Weill, R.D.; Shuster, V.G.; Rubenchik, Y.L. Linear-Programming-Based Assessments of Geometrical Accuracy: Standard Presentation and Application Area. Int. J. Mach. Tools Manuf. 2003, 43, 1023–1033. [Google Scholar] [CrossRef]
- Cui, Z.; Ni, J.; He, L.; Su, R.; Wu, C.; Xue, F.; Sun, J. Assessment of Cutting Performance and Surface Quality on Turning Pure Polytetrafluoroethylene. J. Mater. Res. Technol. 2022, 20, 2990–2998. [Google Scholar] [CrossRef]


| Properties | Values |
|---|---|
| Young’s modulus [4] | 0.5 GPa |
| Thermal conductivity [4] | 0.25 W/mK |
| Yield strength [4] | 27.4 MPa |
| Density [4] | 2.2 kg/m3 |
| Hardness [25] | 55 (HS) |
| Poisson’s ratio [25] | 0.46 |
| Feed Rate | Decrease Rate | Error Rate | ||
|---|---|---|---|---|
| 0.05 | 2.0084 | 1.981 | 2.32% | 0.95% |
| 0.10 | 2.0074 | 1.972 | 1.74% | 1.40% |
| 0.15 | 2.0257 | 1.927 | 11.97% | 3.65% |
| 0.20 | 1.9940 | 1.903 | 4.56% | 4.85% |
| 0.25 | 2.0268 | 1.882 | 7.15% | 5.90% |
| 0.30 | 2.0191 | 1.892 | 6.29% | 5.80% |
Disclaimer/Publisher’s Note: The statements, opinions and data contained in all publications are solely those of the individual author(s) and contributor(s) and not of MDPI and/or the editor(s). MDPI and/or the editor(s) disclaim responsibility for any injury to people or property resulting from any ideas, methods, instructions or products referred to in the content. |
© 2022 by the authors. Licensee MDPI, Basel, Switzerland. This article is an open access article distributed under the terms and conditions of the Creative Commons Attribution (CC BY) license (https://creativecommons.org/licenses/by/4.0/).
Share and Cite
Ni, J.; Lou, B.; Cui, Z.; He, L.; Zhu, Z. Assessment of Turning Polytetrafluoroethylene External Cylindrical Groove with Curvilinear Profile Tool. Materials 2023, 16, 372. https://doi.org/10.3390/ma16010372
Ni J, Lou B, Cui Z, He L, Zhu Z. Assessment of Turning Polytetrafluoroethylene External Cylindrical Groove with Curvilinear Profile Tool. Materials. 2023; 16(1):372. https://doi.org/10.3390/ma16010372
Chicago/Turabian StyleNi, Jing, Bokai Lou, Zhi Cui, Lihua He, and Zefei Zhu. 2023. "Assessment of Turning Polytetrafluoroethylene External Cylindrical Groove with Curvilinear Profile Tool" Materials 16, no. 1: 372. https://doi.org/10.3390/ma16010372