Article

Influence of Repair Welding on the Fatigue Behavior of S355J2 T-Joints

1
School of Ocean Engineering, Harbin Institute of Technology, Weihai 264209, China
2
State Key Laboratory of Advanced Welding and Joining, Harbin Institute of Technology, Harbin 150001, China
3
Shandong Institute of Shipbuilding Technology, Weihai 264209, China
*
Authors to whom correspondence should be addressed.
Materials 2023, 16(10), 3682; https://doi.org/10.3390/ma16103682
Submission received: 31 March 2023 / Revised: 30 April 2023 / Accepted: 9 May 2023 / Published: 11 May 2023

Abstract

:
This paper investigated the effect of repair welding on the microstructure, mechanical properties, and high cycle fatigue properties of S355J2 steel T-joints in orthotropic bridge decks. The test results found that the increase in grain size of the coarse, heat-affected zone decreased the hardness of the welded joint by about 30 HV. The tensile strength of the repair-welded joints was reduced by 20 MPa compared to the welded joints. For the high cycle fatigue behavior, the fatigue life of repair-welded joints is lower than that of the welded joints under the same dynamic load. The fracture positions of toe repair-welded joints were all at the weld root, while the fracture positions of the deck repair-welded joints were at the weld toe and weld root, with the same proportion. The fatigue life of toe repair-welded joints is reduced more than that of deck repair-welded joints. The traction structural stress method was used to analyze fatigue data of the welded and repair-welded joints, and the influence of angular misalignment on was considered. The fatigue data with and without AM are all within the ±95% confidence interval of the master S-N curve.

1. Introduction

Orthotropic steel deck (OSD) is widely used in the construction of various bridges with the advantages of lightweight, low cost, and large bearing capacity [1,2]. However, fatigue cracks often appear on OSD due to welding residual stress and complex traffic load [3,4]. The cracks of the T-joints between the U-rib and deck have the greatest impact on OSD performance. Xiao et al. [5] conducted stress analysis and fatigue evaluation to understand key factors contributing to the cracks of rib-deck T-joints. The test results found that the fatigue cracks were mainly located at the weld toe and weld root. These fatigue cracks can be categorized into four types according to different growth paths, as illustrated in Figure 1, namely toe-deck crack (crack Ⅰ), root-deck crack (crack Ⅱ), root-weld crack (crack Ⅲ) and toe-rib crack (crack Ⅳ) [5]. Cracks I and II can penetrate the bridge panel and cause pavement damage [6,7]. Sim et al. [8] conducted a full-scale fatigue test on OSD. The test results found that the fatigue cracking of rib-deck T-joints was more serious at the deck side than at the rib side, and the cracking probability of the weld toe was higher than that of the weld root. Therefore, the research should focus on the fatigue cracks at the deck side.
At present, most of the bridges in service worldwide have used OSD structures [9], which are easily affected by fatigue cracks. In order to prolong the service life of the bridge, it is necessary to repair the fatigue crack in time. Among the many ways to repair cracks, repair welding is the most widely used with the advantages of good economy and high efficiency [10,11]. Numerous studies have been carried out to explore the influence of repair welding on the microstructure and mechanical properties of materials. Aman et al. [12] discovered a decrease in the hardness of the heat-affected zone (HAZ) after repair welding on 316 L stainless steel. The decrease in hardness was attributed to the reduction of δ-ferrite in HAZ, and the hardness will decrease with the increase of the number of repair welding. Luo et al. [13] investigated the effect of repair welding heat input on the microstructure of 304 stainless steel. It was found that with the increase of heat input, the δ-ferrite in the weld metal decreased slightly, while the austenite grain size in the HAZ was slightly increased. Katsas et al. [14] conducted tensile and bending tests on both welded joints and repair-welded joints. The results found that a single repair welding had no effect on the ultimate tensile strength of the welded joints. And in the absence of “non-fusion”, the repair-welded joints passed the bending test as successfully as the welded joints. Shojaati et al. [15] pointed out that multiple repair welding had no adverse effect on the microstructure and mechanical properties of X20Cr13 stainless steel. It can refine austenite grains in the HAZ and increase impact toughness. Dong [16] proposed that a major detrimental effect of repair welding on structural integrity is the increase of crack driving force caused by the elevation of membrane stress level, and the adjustment of welding size can effectively reduce the membrane stress.
Contrary to the research on microstructure and mechanical properties, there are few studies on the fatigue properties of repair-welded joints. Wang et al. [17] found that the fatigue life of the repair-welded specimen is 7.1 times that of the specimen using the drilling stop-hole method, and 3.3 times that of the specimen reinforced by carbon fiber-reinforced polymer (CFRP). Seo et al. [18] studied the fatigue property of the bogie structure after repair welding. The results found that the fatigue life of repair-welded joints was lower than that of welded joints. When the repair welding width decreased, the fatigue life increased.
Due to the structural complexity, current fatigue design/evaluation guidelines for welded structures are mostly stress range based, likely hot spot stress method [19,20] and nominal stress method [21,22]. A traction-based structural stress definition was introduced by imposing equilibrium conditions [23]. In addition to its demonstrated mesh-insensitivity and convenience when applied to large and complex assemblies, the method has led to the development of the Master S–N curve adopted by ASME Div 2 [24] since 2007.
In this study, the repair welding was carried out on S355J2 steel T-joints, and positions were selected at the weld toe and deck to fit actual working conditions. The microstructure and mechanical properties of the repair-welded joints were studied. In addition, the high cycle fatigue (HCF) properties of the joints are analyzed by the traction structural stress method considering the influence of angular misalignment (AM).

2. Experimental Procedure

2.1. Materials and Test Specimen Preparation

The material of base metal and filler metal used in this study are S355J2 steel and E500T-1 wire, respectively. Table 1 provides their chemical compositions. Metal active gas (MAG) arc welding is adopted in this study with the advantages of convenience on construction.
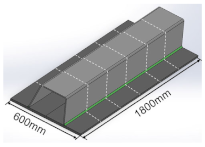
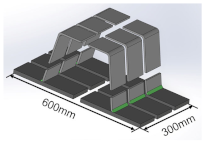
The manufacturing process and dimensions of test specimens are shown in Table 2. The size of the deck plate used in this study is 1800 mm × 600 mm × 18 mm (length × width × thickness), and the thickness of the U-rib is 8 mm. The blunt edge of the welding groove is 0–1 mm, and the groove Angle is 50°. The length of the weld is equal to the length of the deck plate, and the size of the weld leg is 8–10 mm. The OSD is cut by wire-cutting equipment to fabricate the T-joints. As shown in Table 2, the T-joint has a length of 300 mm and a width of 100 mm.
The welded joints, toe repair-welded joints, and root repair-welded joints are prepared in this study. The length of the repair weld is the same as the width of the deck plate. The width and depth of repair welds are 8 mm and 4.5 mm, respectively. Figure 2 shows the schematic diagrams of repair-welded joints.

2.2. Experiments

2.2.1. Microstructure and Mechanical Properties Test

The T-joints were cut into metallographic samples by using a wire-cutting machine. The metallographic samples are corroded with 4% nitrate alcohol for about 10 s after grinding and polishing. The microstructure of the welded and repair-welded joints is observed by the Olympus-DSX510 optical microscope. The tensile specimens were produced in compliance with ISO 6892-1: 2009 [25], and the dimensions are presented in Figure 3. The 100 kN universal material testing machine was employed for the tensile test, and the rate of strain is 0.03/s. The hardness test was carried out on the ARTCAN-300SSI-C microhardness machine. The interval of adjacent test points is 0.5 mm, the load is 0.98 N, and the hold time is 15 s.

2.2.2. High Cycle Fatigue Test

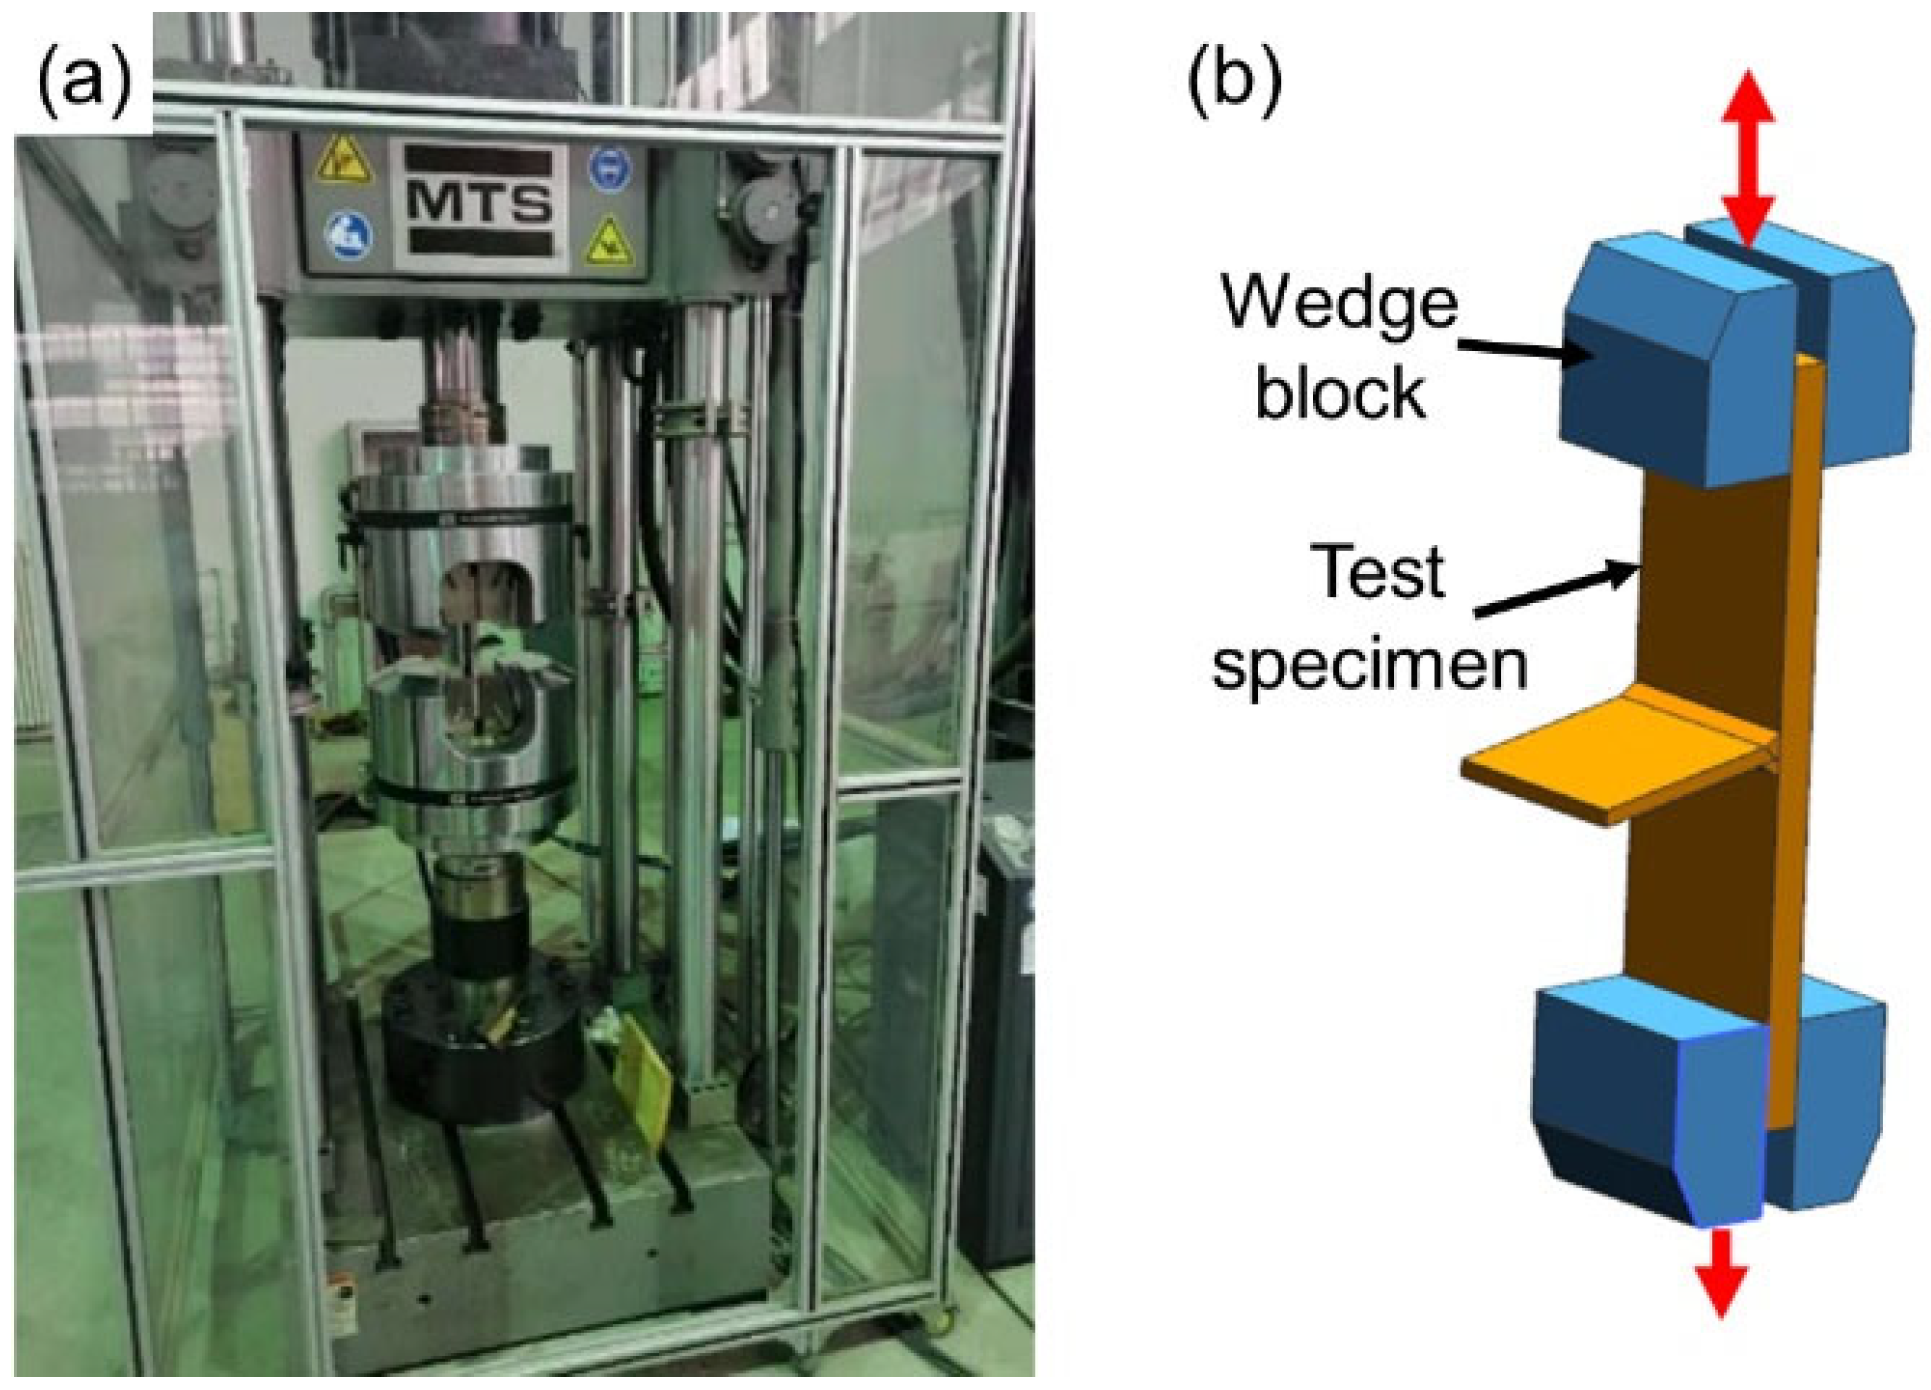
To explore the fatigue property of welded and repair-welded joints, the HCF test was conducted by the MTS high-frequency fatigue testing machine shown in Figure 4a. T-joints are fixed by the hydraulic wedge, and clamping length is 80 mm, see Figure 4b.
Table 3 lists the parameters of the HCF test. The welded joints are denoted and referred to in this study as A, while the toe repair-welded joints and deck repair-welded joints are marked as B-DZ and B-D, respectively. Each group contains four specimens, which are subjected to fatigue loads of 36/360 kN, 40/400 kN, 44/440 kN and 46/460 kN, respectively.

2.3. Traction Structural Stress Method

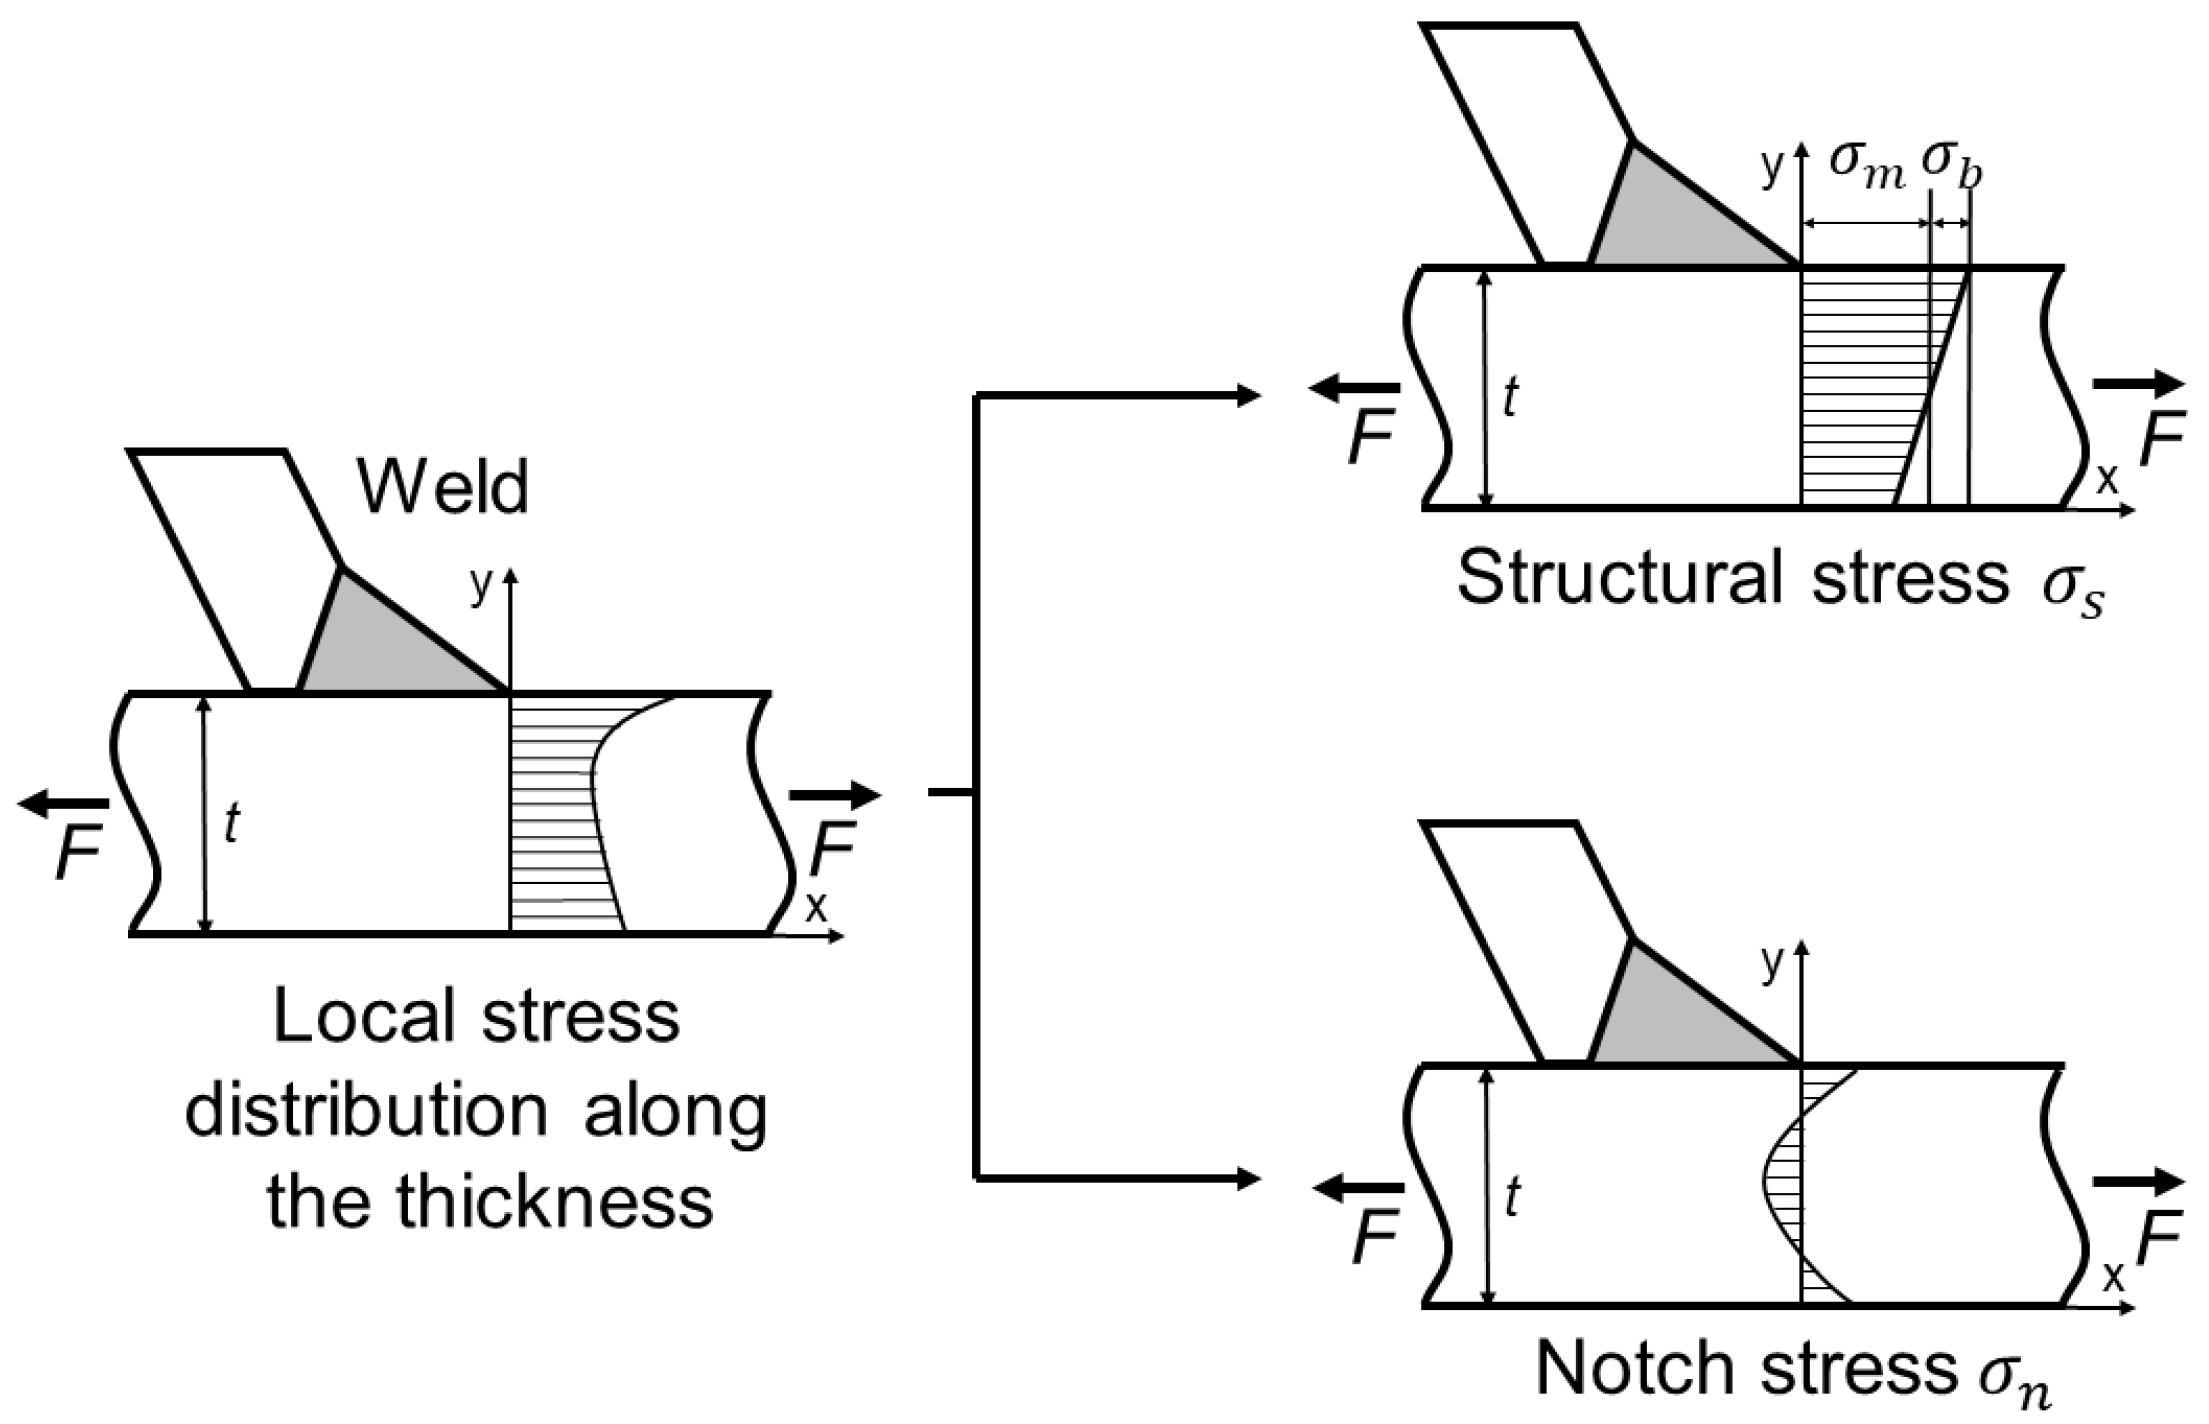
When both ends of the specimen are strained, the stress distribution around the weld is highly nonlinear in the direction of the thickness of the deck and difficult to be calculated directly. Dong [23] proposed that the stress in the direction of the thickness of the deck can be decomposed into two parts based on stress linearization. The first part is the sum of membrane stress σ m and bending stress σ b , which is called traction structural stress σ s , and it is balanced with external load [26,27]. The other part is notch stress σ n generated by local notch effect, which is highly nonlinear and in self-equilibrium state. The stress distribution diagram in the direction of the thickness of deck is shown in Figure 5. At present, the traction structural stress method has been proven to be suitable for describing the four categories of cracks on rib-deck T-joints. This method converts the joint force/bending moment obtained by finite element analysis (FEA) into membrane stress and bending stress to calculate the traction structural stress of the potential failure interface.
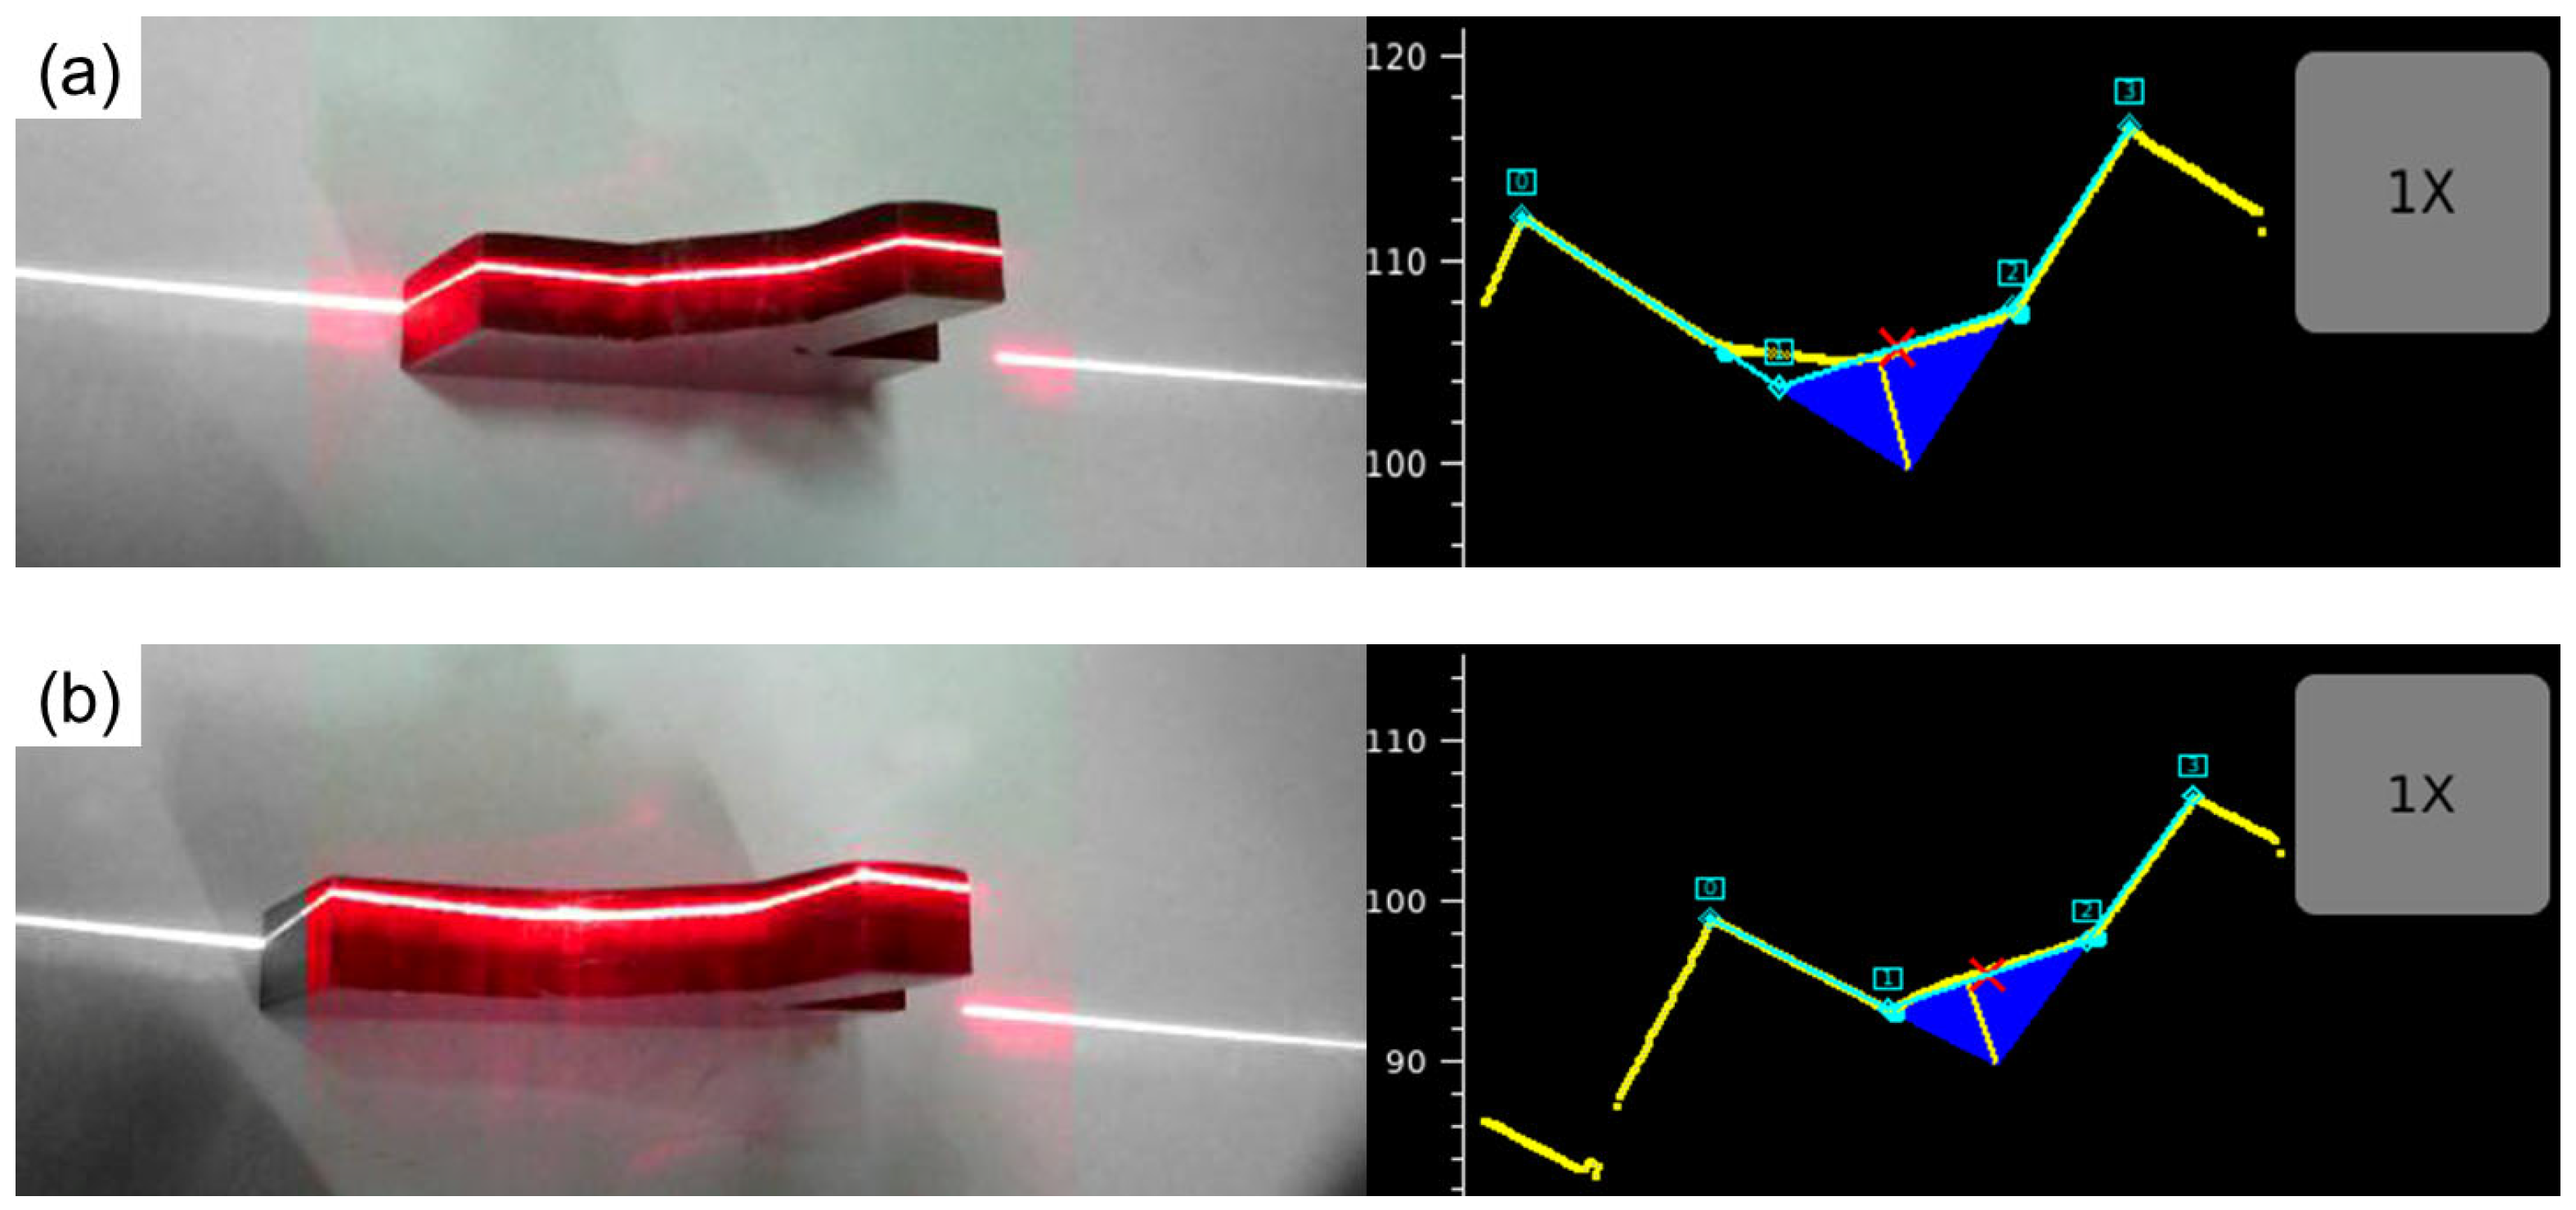
In this paper, the FEA based on ABAQUS 6.14 software is used to calculate the traction structural stress of the potential failure surface. To establish the finite element model (FEM) of joints accurately, WiKi-SCAN 2.0 is used to measure the dimensional parameters of joints, see Figure 6. The dimensional parameters of welded and repair-welded joints are listed in Table 4.
The FEM of welded and repair-welded joints are established based on the dimensional parameters, see Figure 7. Because the excess welds on the surface of the deck will be removed after repair welding, the FEM of deck repair-welded joints is the same as that of the welded joints. The boundary condition and loading mode of the welded and repair-weld joints model are the same. The degree of freedom in the Y direction of the fixture position of the FEM is constrained, that is, the surface area which is 80 mm away from both ends of the FEM. The movement at the left end of the FEM is restricted in the X and Z directions. At the same time, 1 MPa tensile stress is applied to the right end face of the FEM. It can be seen that the mesh division of the FEM is not uniform. This arrangement can not only improve the calculation efficiency but also ensure the accuracy of the calculation results because of the mesh insensitivity of the traction structural stress method.
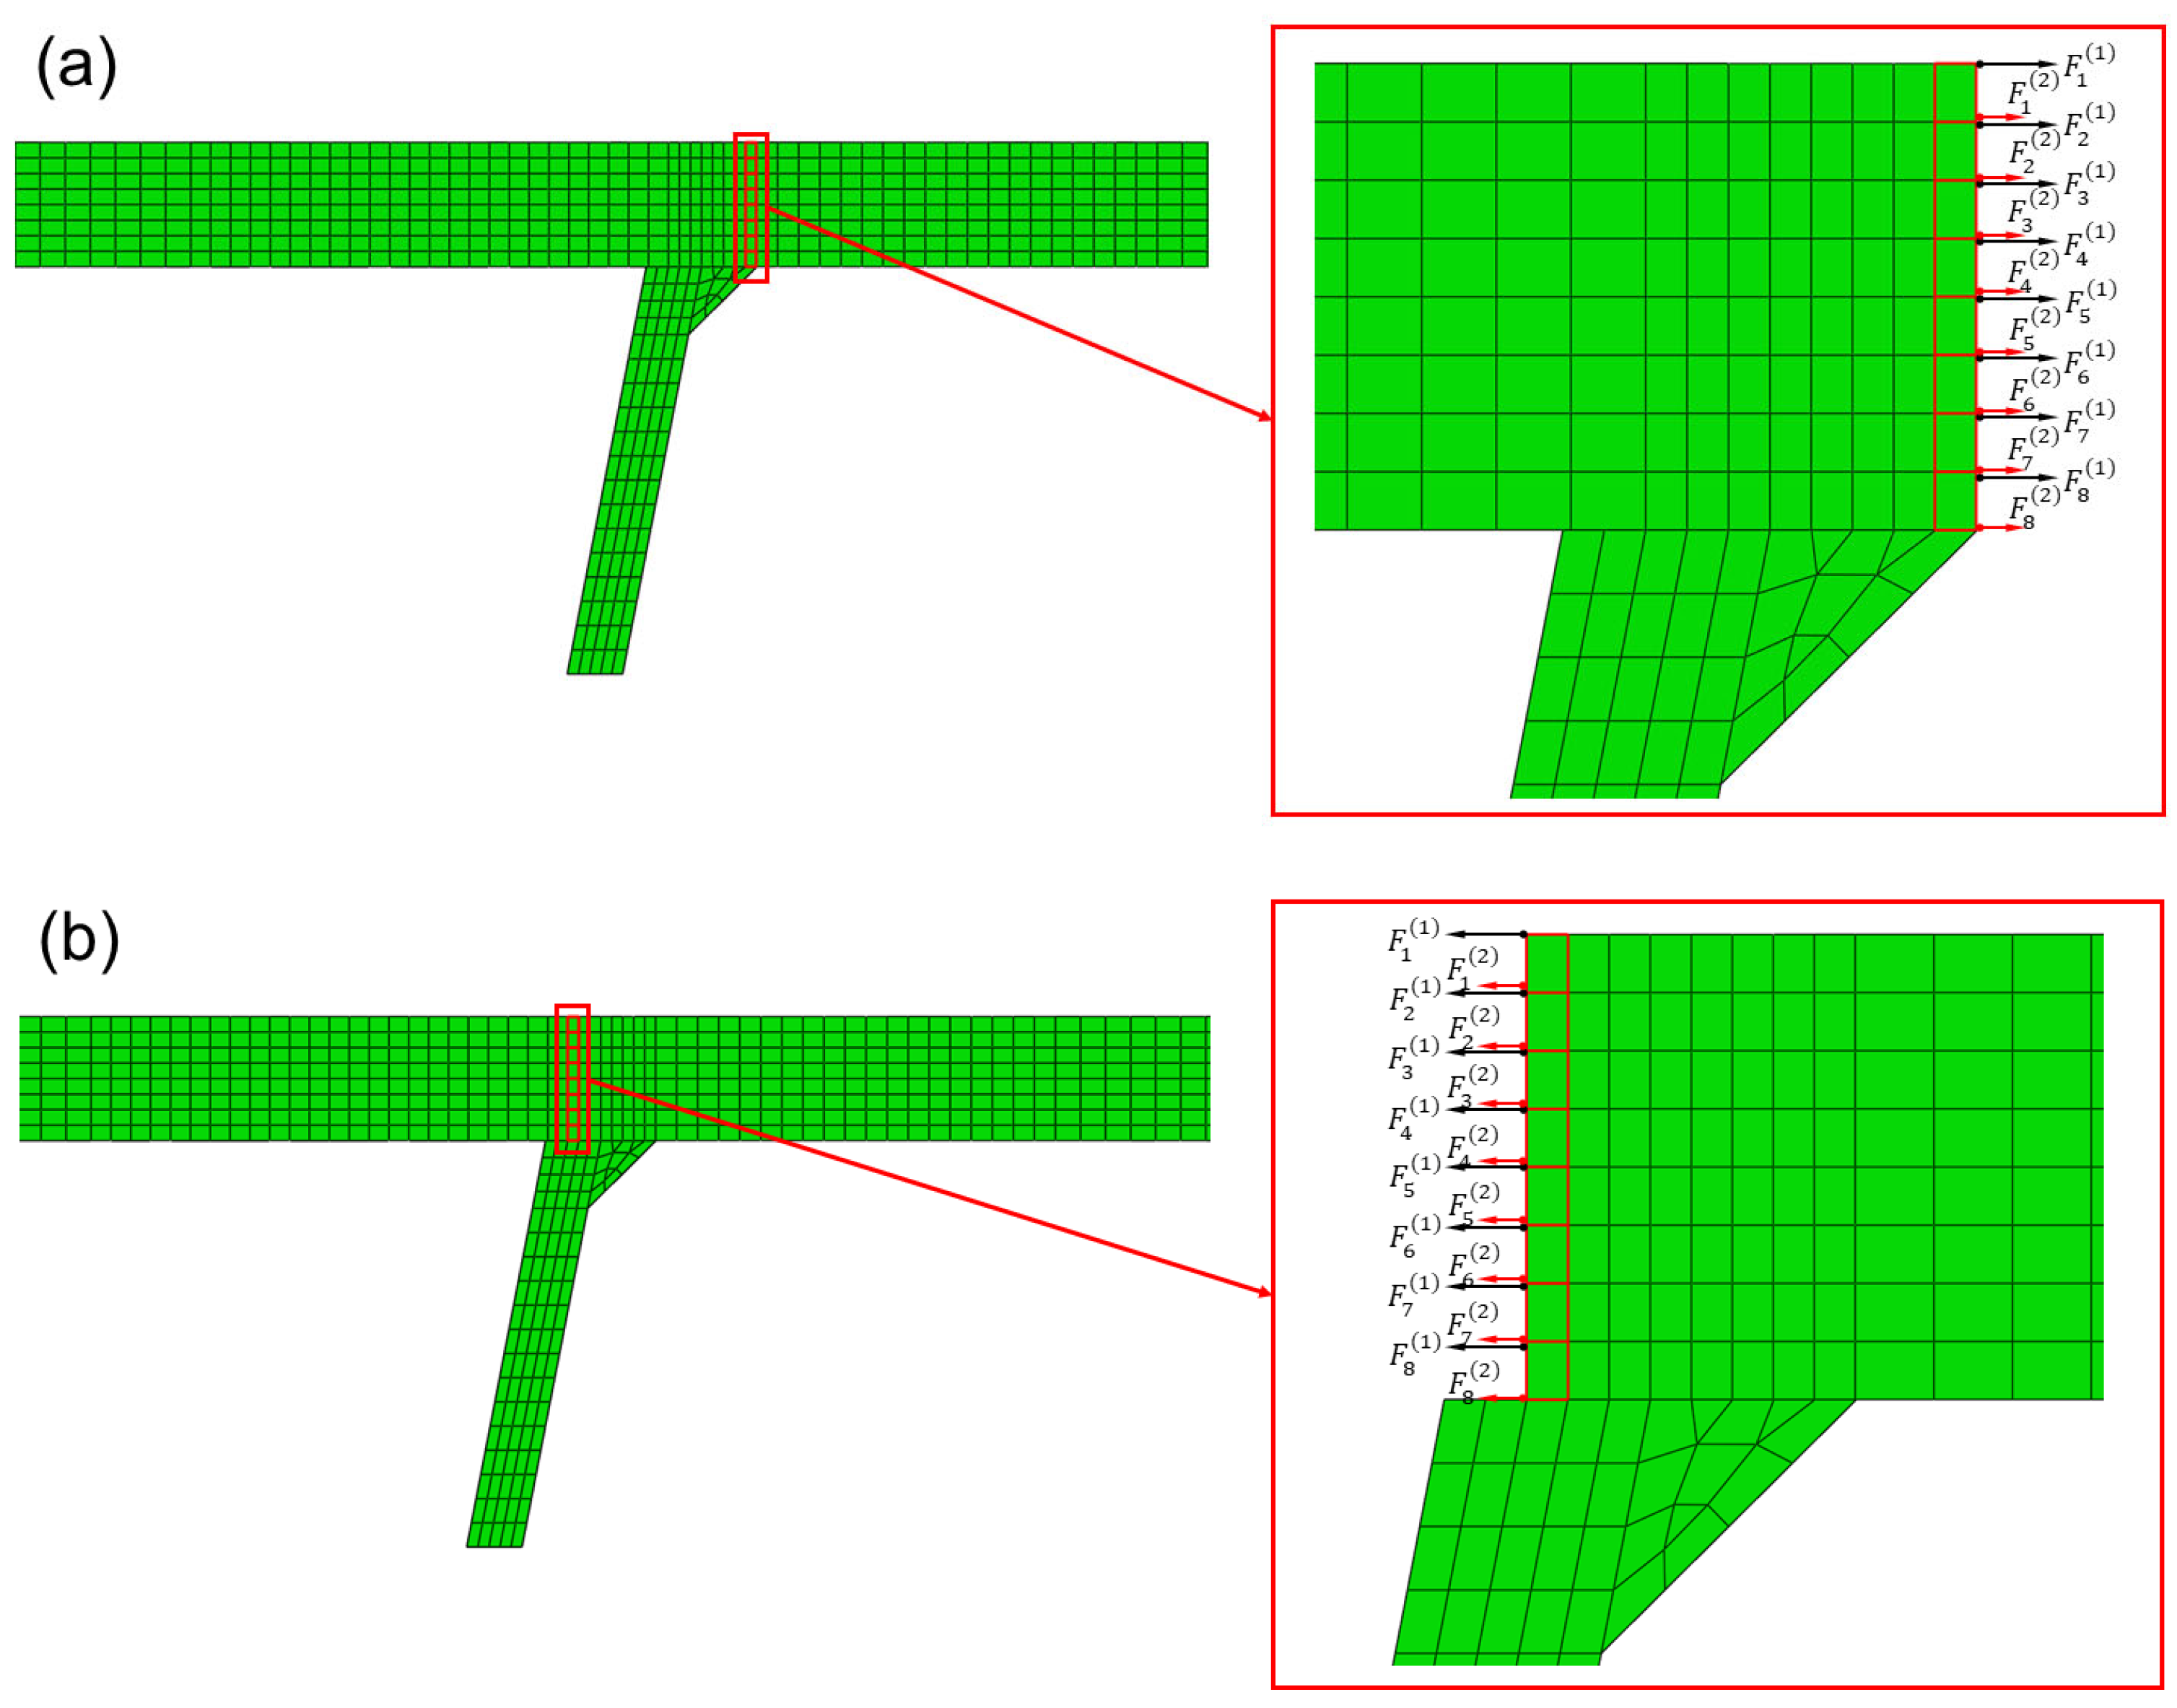
Nodal forces calculation at the potential failure surface is shown in Figure 8. The surface of interest is defined in FEM, namely toe failure surface (Figure 8a) and root failure surface (Figure 8b). All elements connected to one side of the potential failure surface are identified to extract nodal forces, which are highlighted in Figure 8. Then the traction structural stress σ s can be calculated using Equations (1)–(3).
σ m = 1 t i N F i
σ b = 1 t 2 i N F i y i t 2
σ s = σ b + σ m
Once the traction structural stresses have been determined using the procedures described through the above process, the equivalent traction structural stress commonly used to evaluate the fatigue life of welded joints in engineering can be obtained through Equations (4)–(7) [26].
Δ S S = Δ σ s t 2 m / 2 m I r 1 / m
where:
I ( r ) 1 m = 0.0011 r 6 + 0.0767 r 5 0.0988 r 4 + 0.0946 r 3 + 0.0221 r 2 + 0.014 r + 1.2223
m = 3.6
r = σ b σ b + σ m

3. Microstructure and Mechanical Properties

3.1. Microstructure

Figure 9 illustrates the variation in the microstructure of the S355J2 steel-welded joint. It can be seen that the welded joint of fusion welding is mainly composed of weld metal (WM), heat-affected zone (HAZ), and base metal. HAZ can be divided into three distinct zones, namely, coarse grain HAZ (CGHAZ), fine grain HAZ (FGHAZ), and inter-critical region (ICHAZ-lying between the base metal and FGHAZ) [28]. The WM (Figure 9a) is mainly composed of the pro-eutectoid ferrite precipitated along the grain boundary of the columnar crystal and the inner acicular ferrite. The CGHAZ (Figure 9b) consists of lath martensite and a little granular bainite. The grains continue to grow after reaching austenitizing temperature, and the overheated structure with coarse grains is obtained. The microstructure of FGHAZ (Figure 9c) contains ferrite, pearlite, and a small amount of granular bainite. Compared with the base metal, the grain size of FGHAZ is small. In ICHAZ (Figure 9d), pearlite is first austenitized and then forms finer ferrite and pearlite after cooling. Ferrite fails to austenitize but continues to grow. Therefore, the microstructure structure of ICHAZ is similar to that of the base metal, and the size of grains varies in this zone.
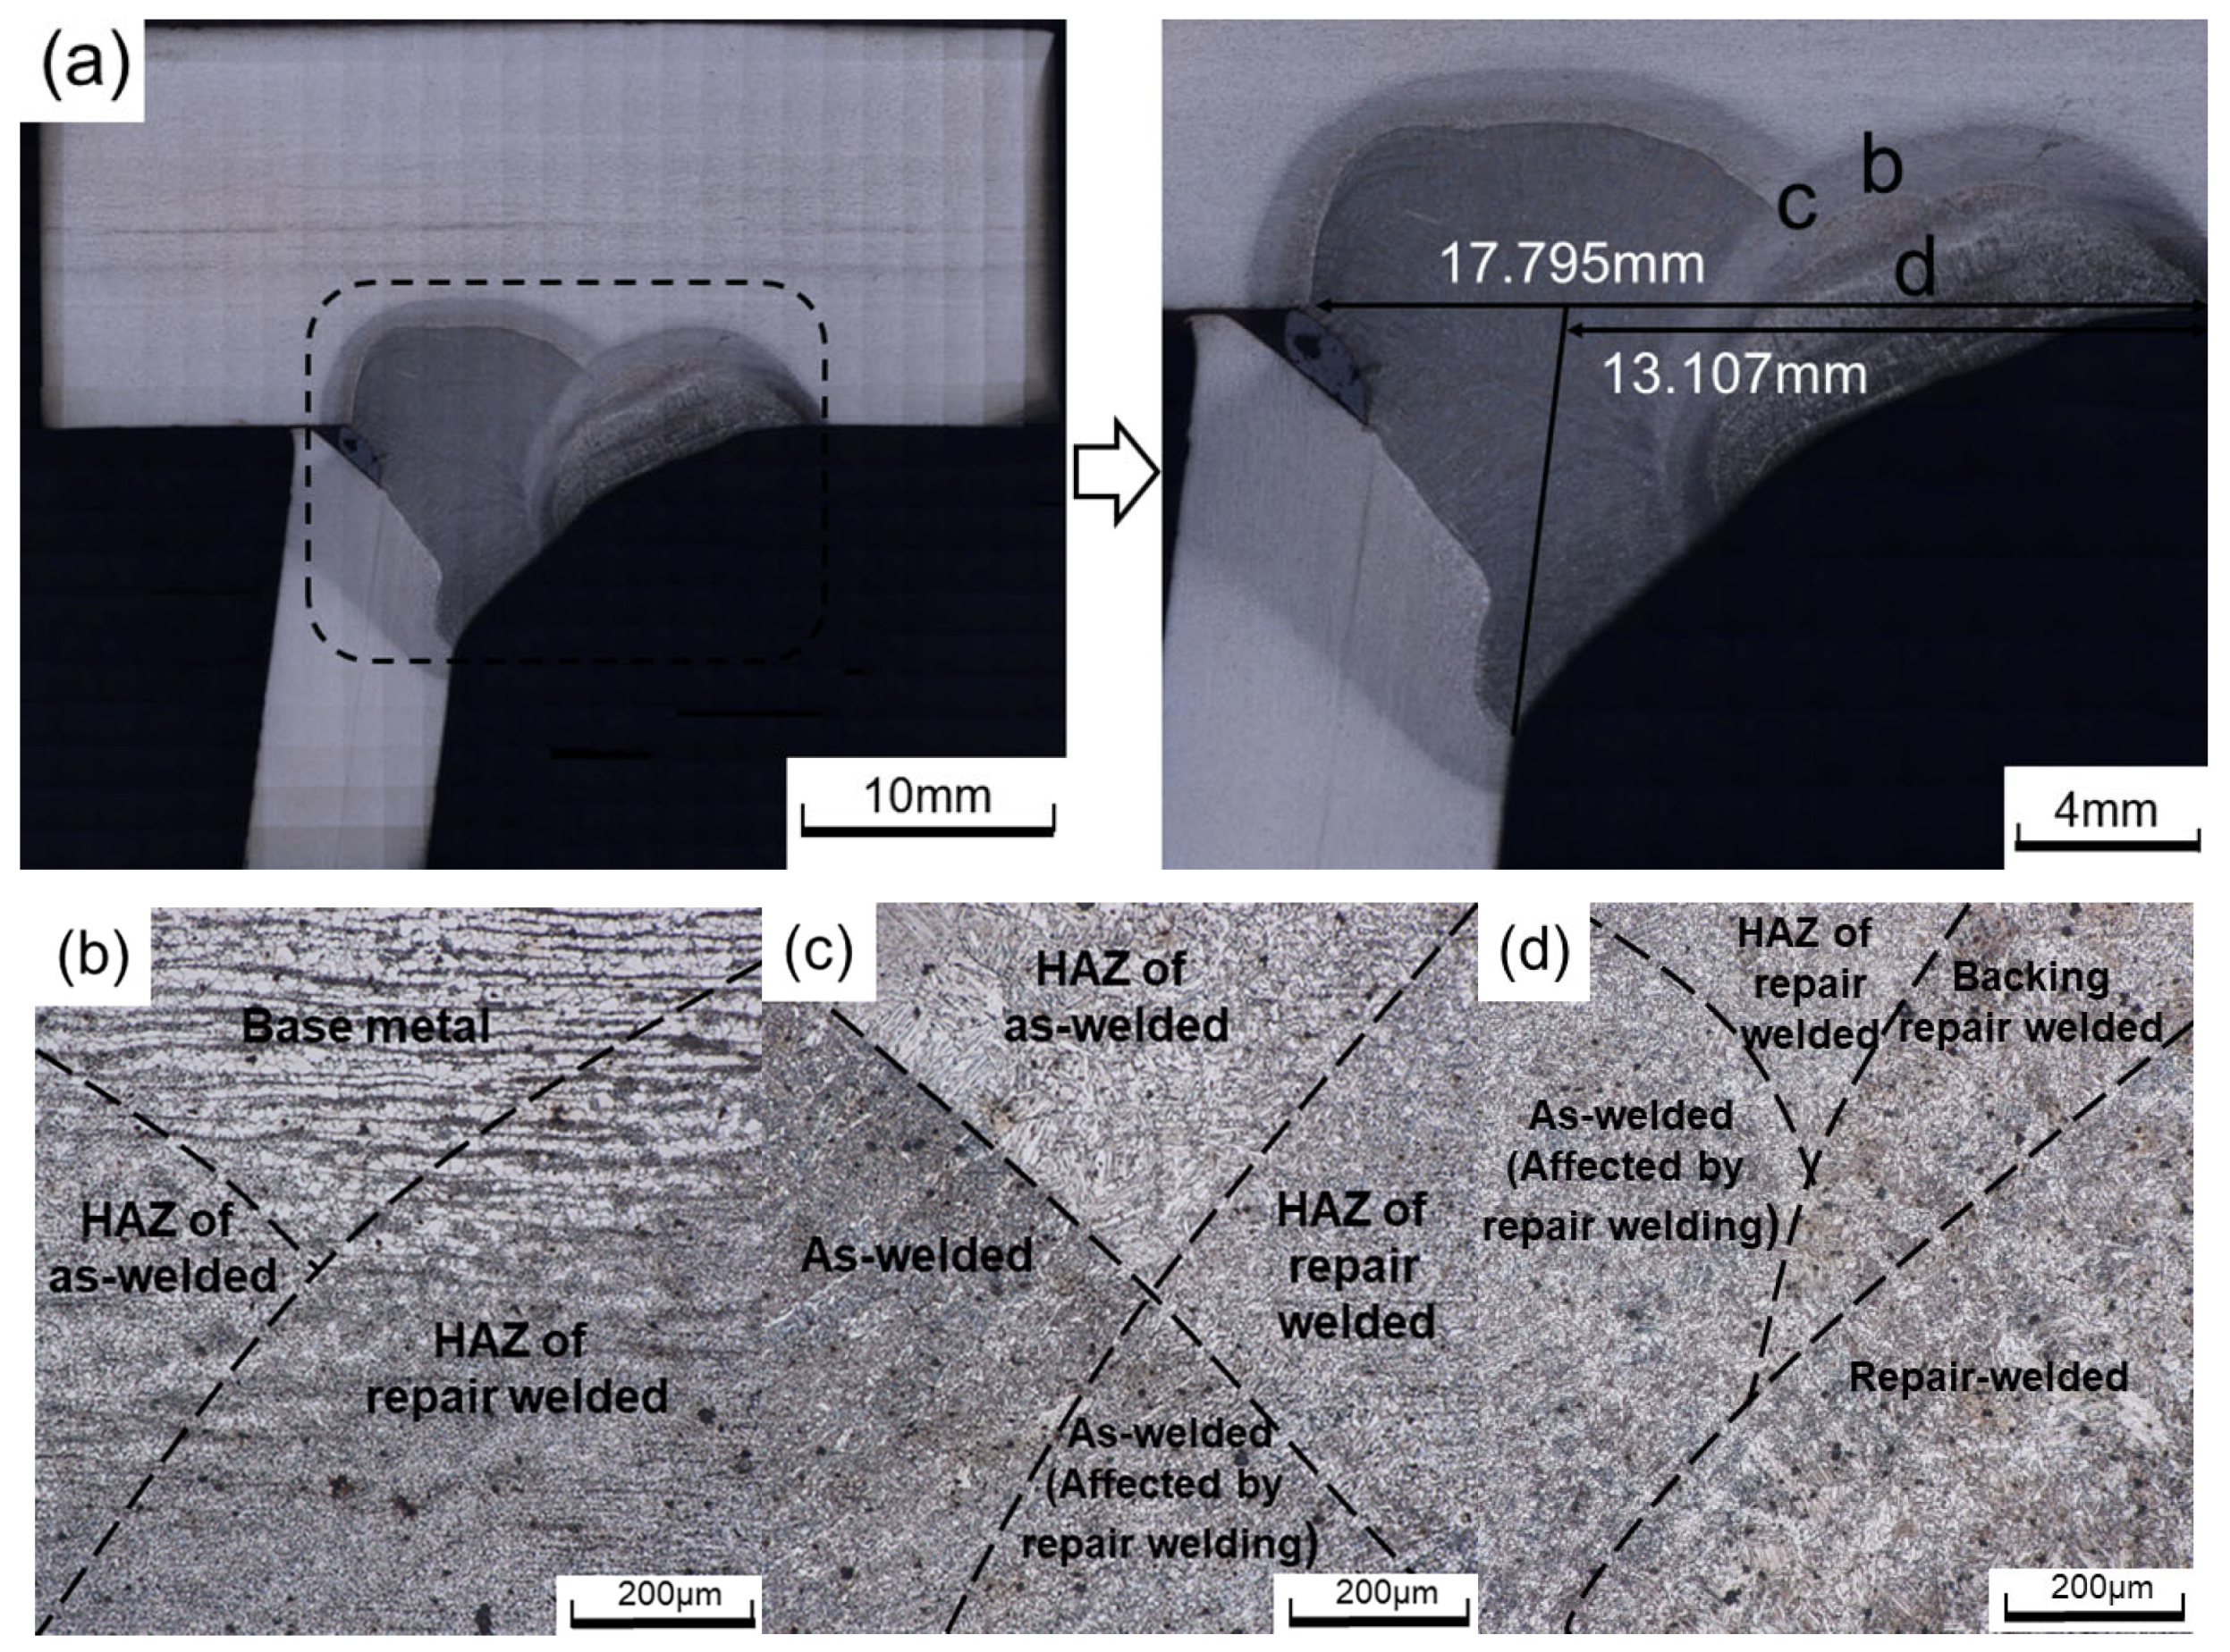
Figure 10 shows the microstructure of the toe repair-welded joint. The grain distribution and morphology in the repair-welded joint are similar to that in the welded joint, which can be divided into WM, HAZ, and base metal.
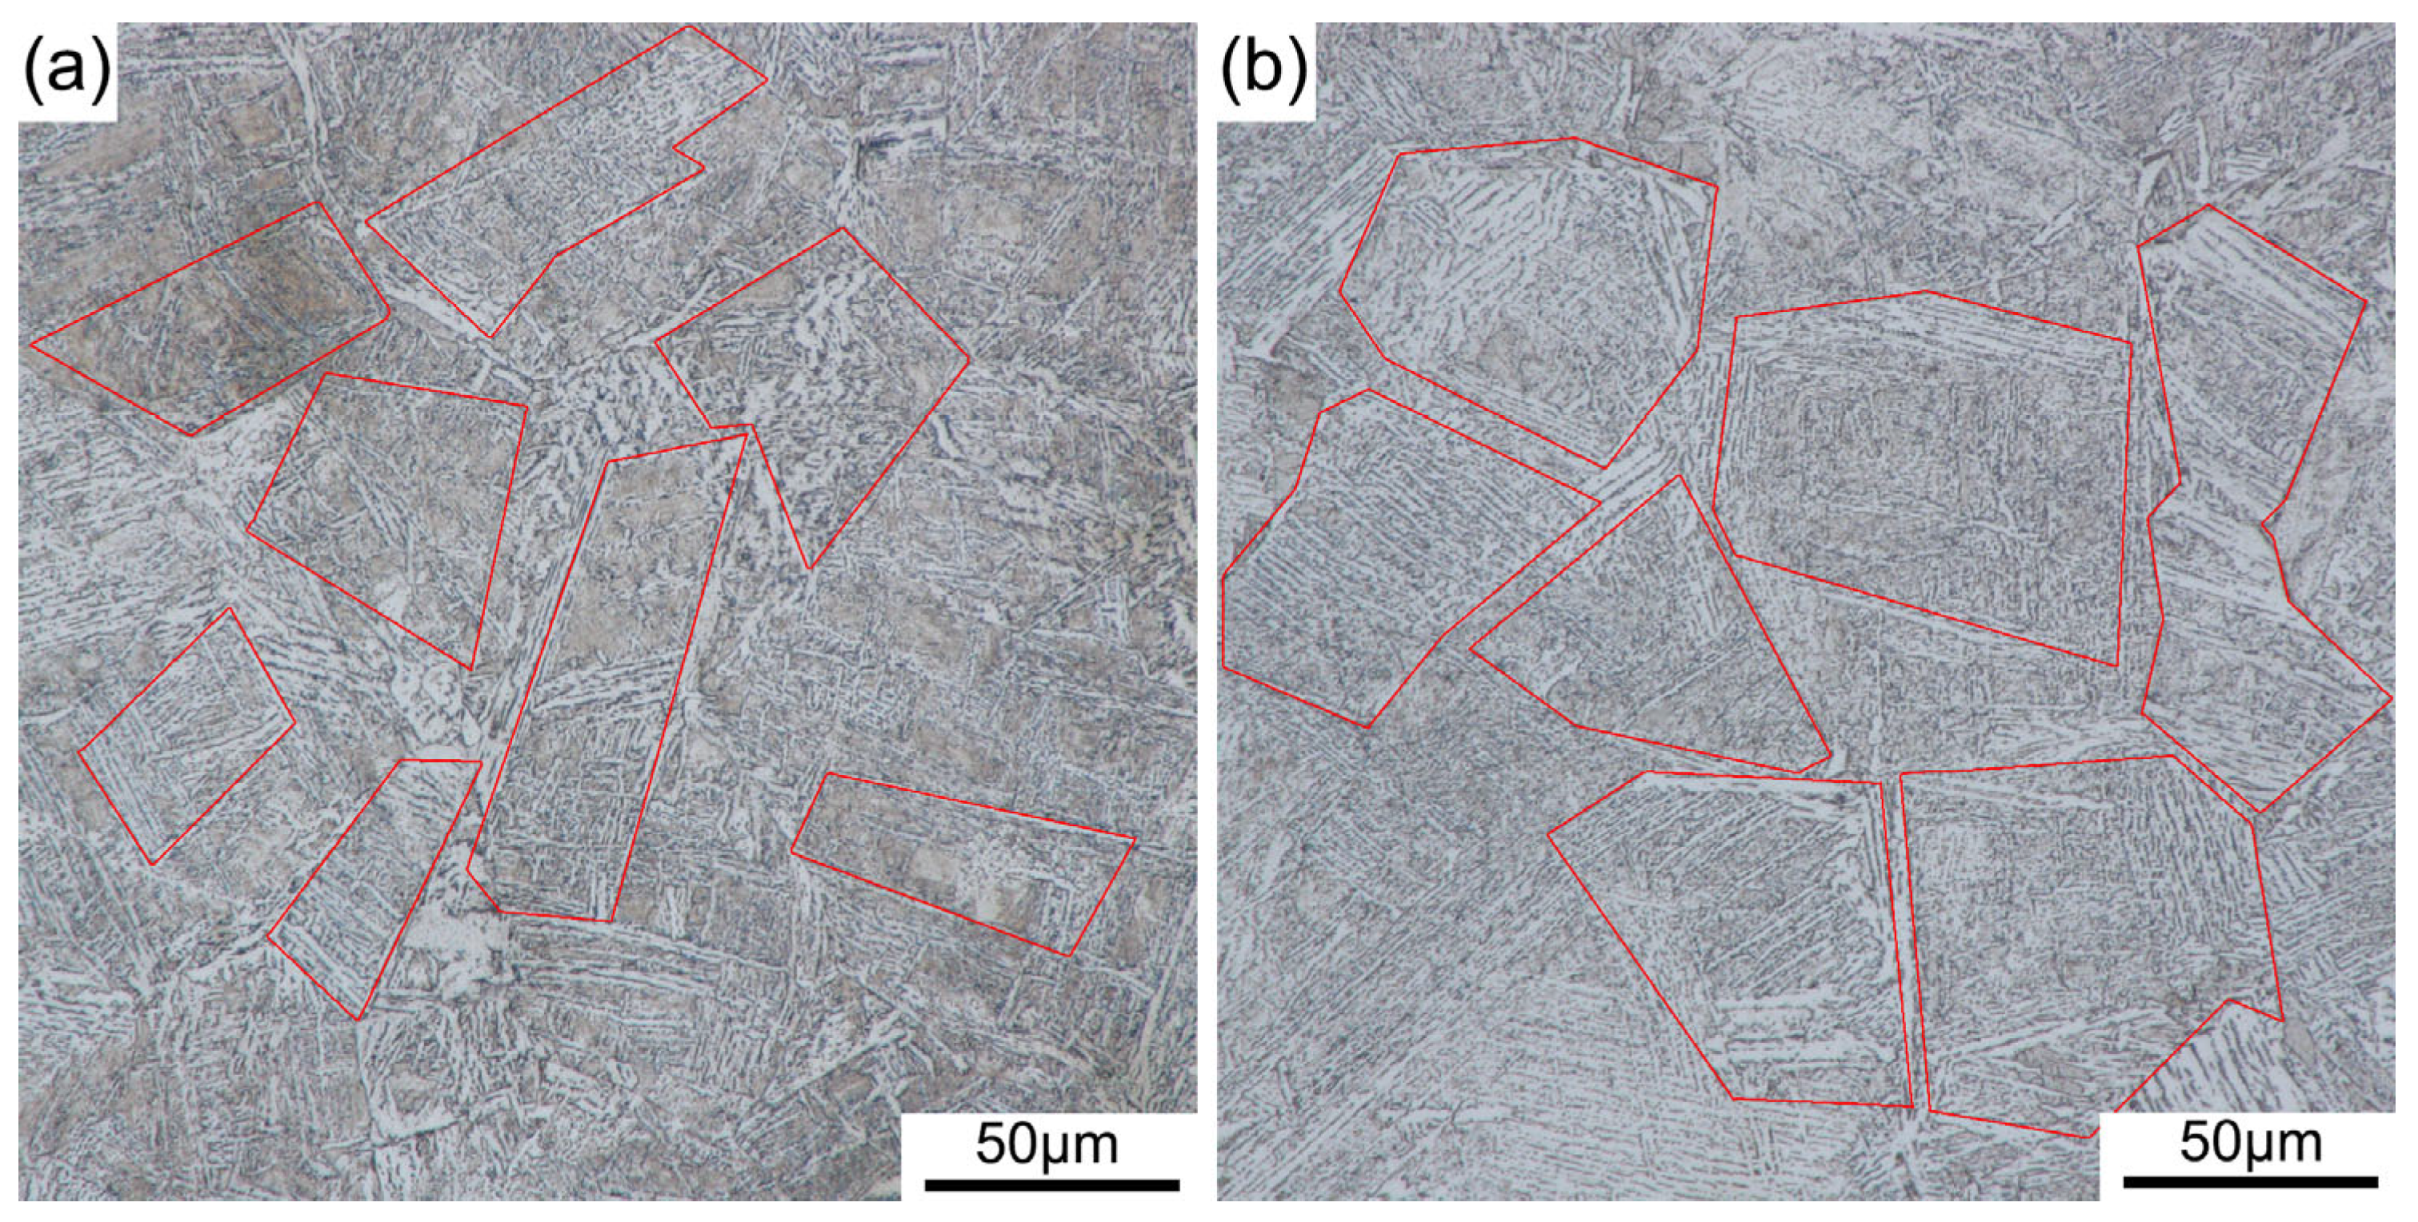
The Image Pro Plus 6.0 software is used to analyze the microstructure of the welded and repair-welded joints. Figure 11 compares the image of the grains in the CGHAZ, and it is found that the austenite grains further grow. The content of lamellar martensite decreases, and the content of lath martensite increases. The average austenite grain area of the weld joint is calculated to be 1645.23 μm2, and that of the repair-welded joint is 3368.39 μm2, increased by 2.05 times. The coarse grains can decrease the mechanical properties of the welded joints, which may become a weak point in the HCF test.

3.2. Microhardness

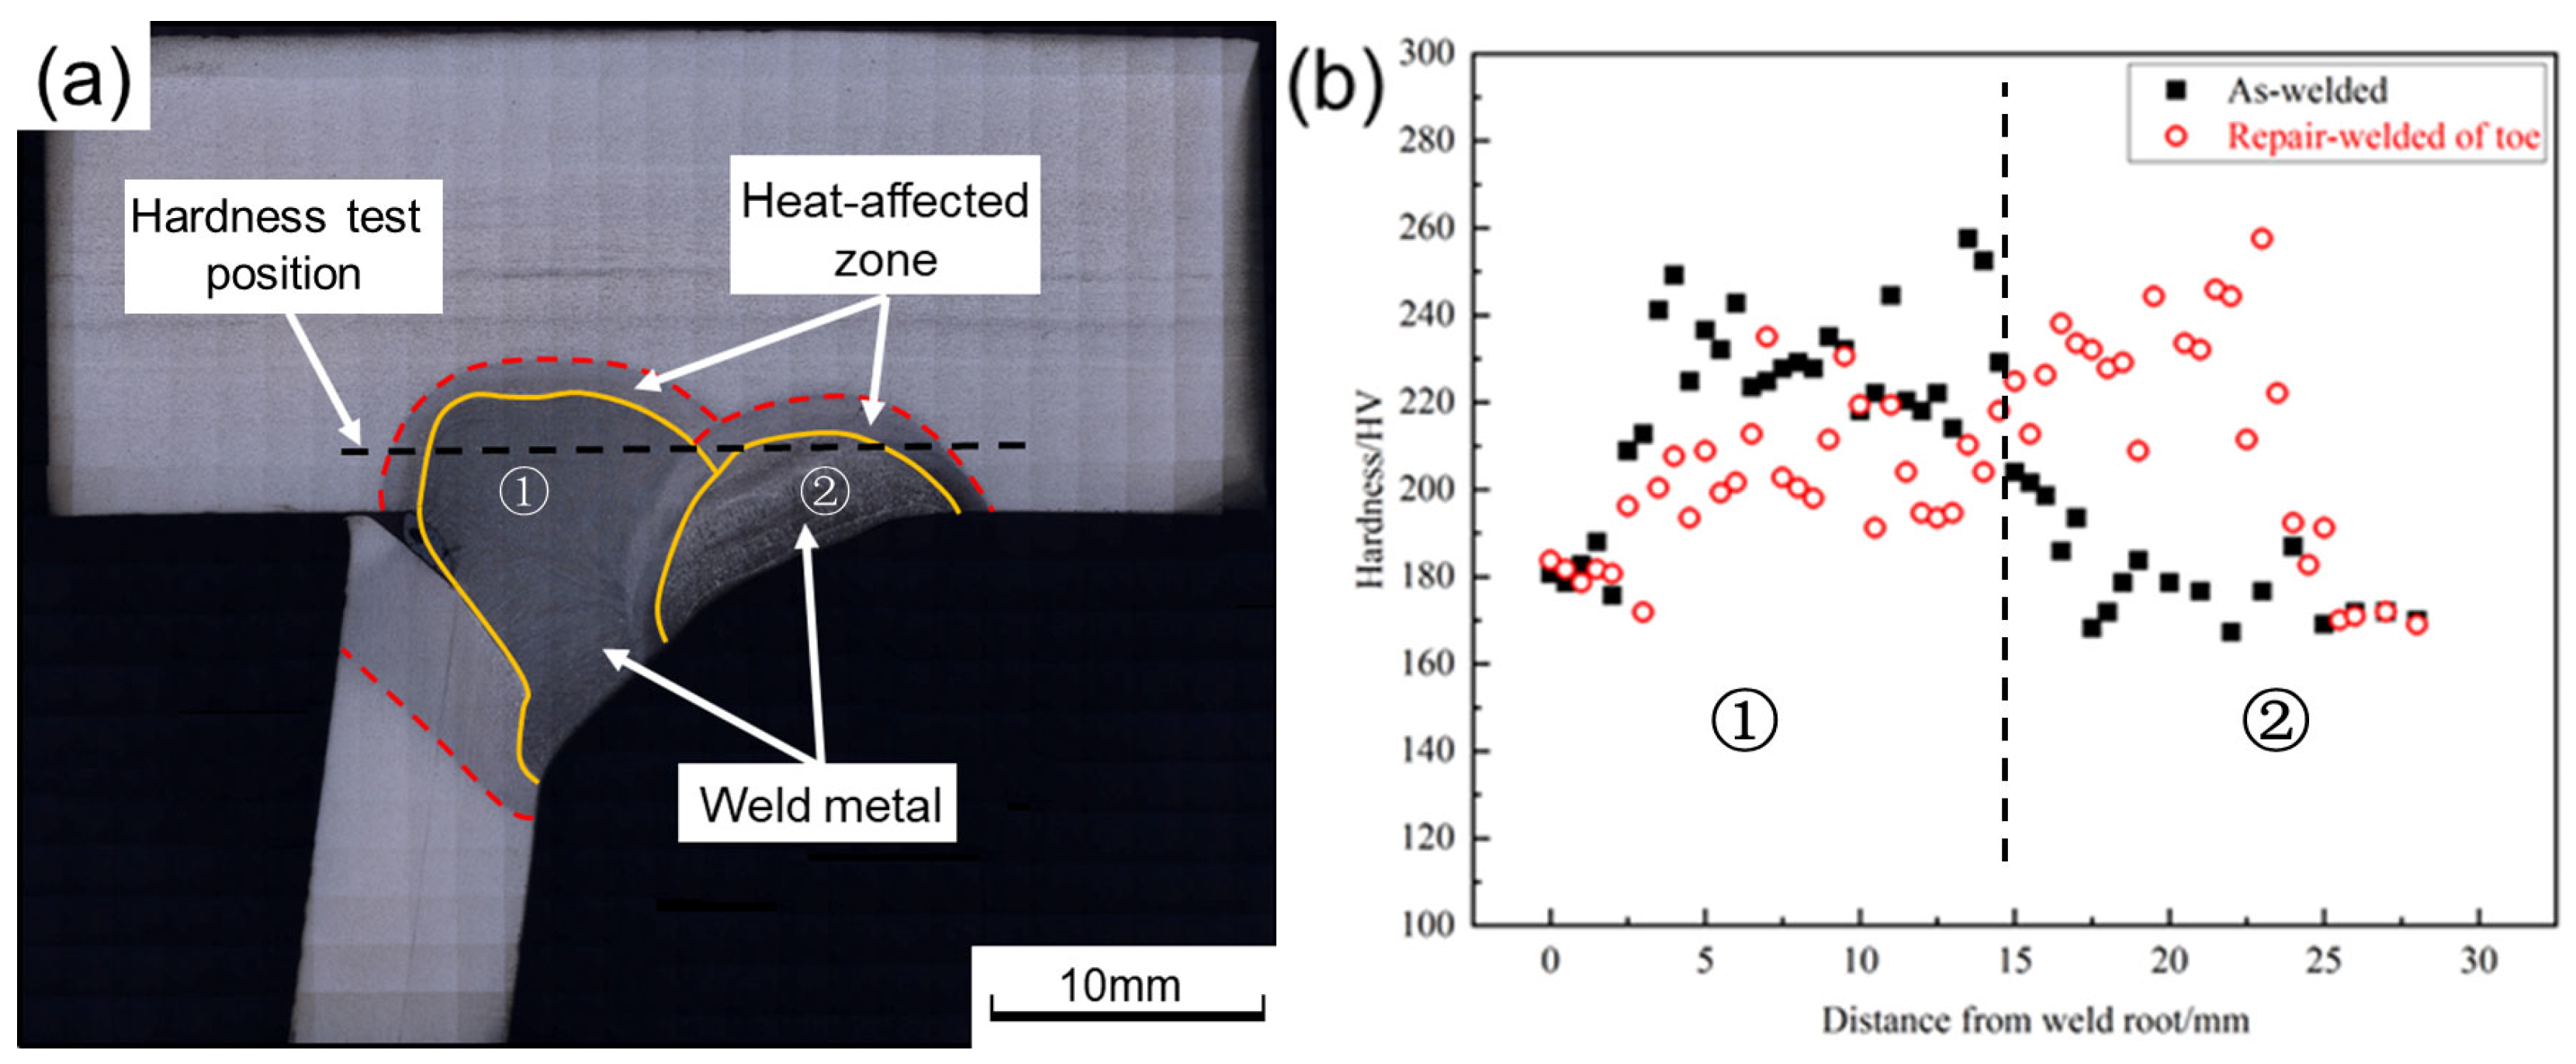
To eliminate the influence of point position on hardness, it must be ensured that the test position is the same in welded and the repair-welded joints, see Figure 12a. The hardness test results are demonstrated in Figure 12b. The zone ① to the left of the black line in Figure 12b is the WM of welded joints. Due to the grain growth, the average hardness of this zone decreases by about 30 HV after repair welding. The zone ② to the right of the black line in Figure 12b is the WM of repair-welded joints, and it can be found that the hardness of this zone increases by about 60 HV. This is because repair welding remelts this zone and reduces the grain size, which results in the enhancement of hardness.

3.3. Tensile

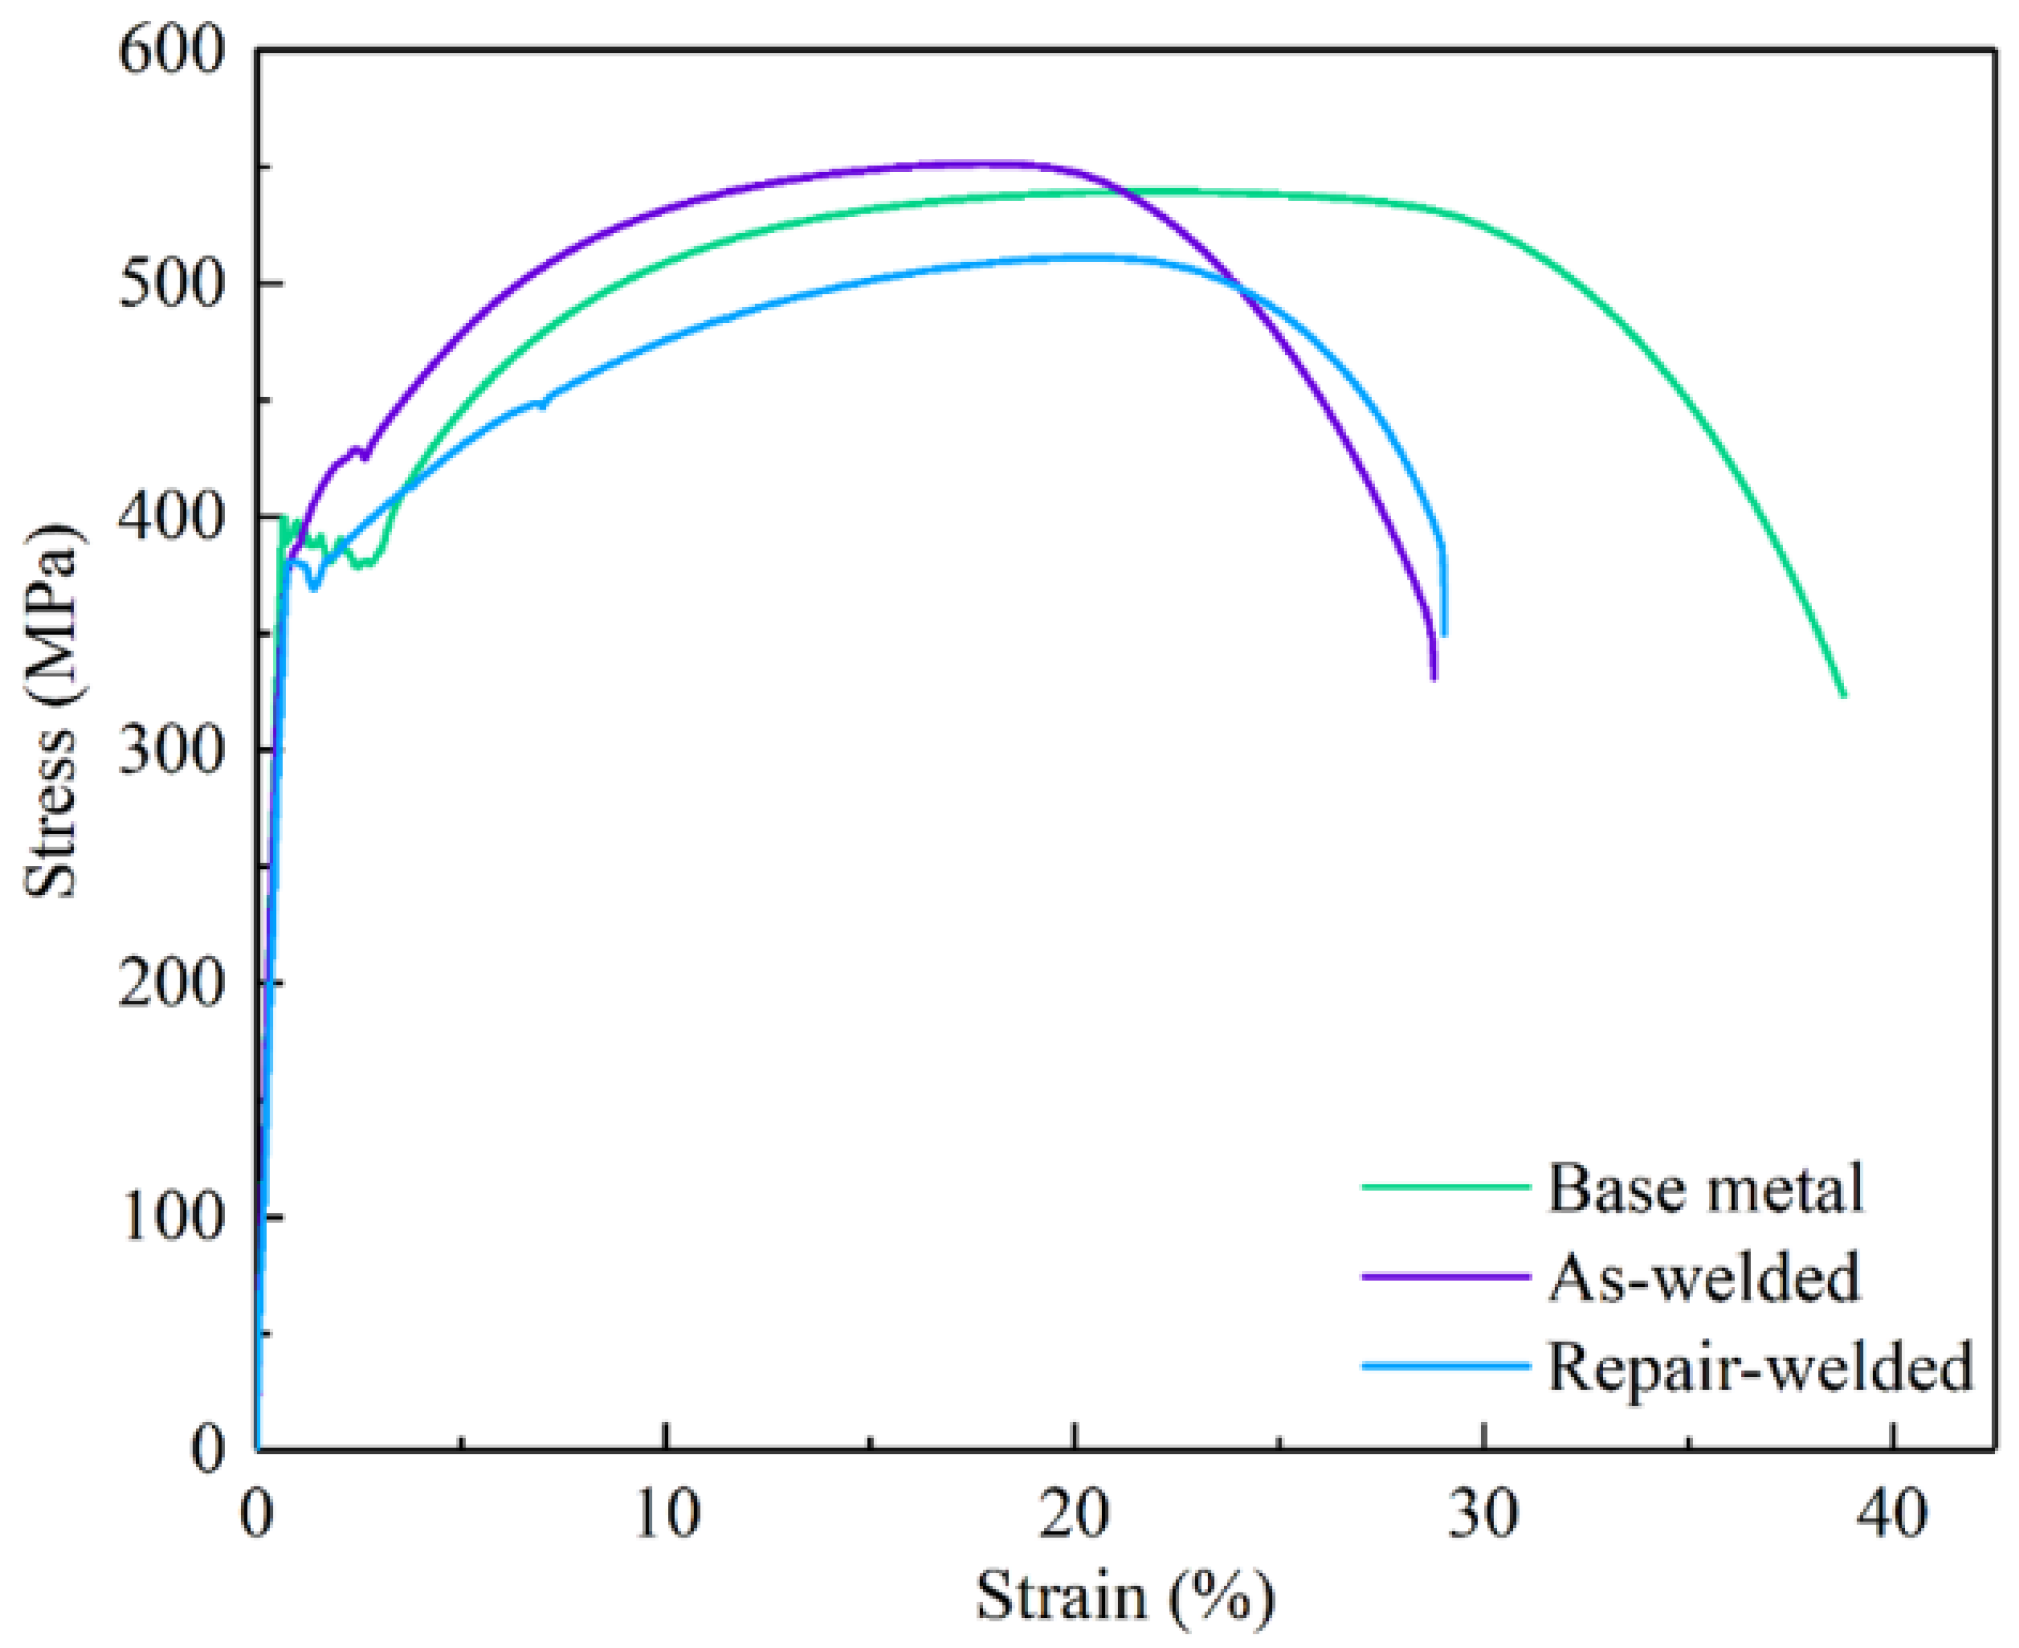
The tensile properties of welded and repair-welded joints are presented in Figure 13 and Table 5. The ultimate tensile and yield strength of the welded joint and the base metal are similar. While the ultimate tensile and yield strength of the repair-welded joint decrease by 21 MPa and 40 MPa, respectively. Compared with the base metal, the elongation of the welded and repair-welded joints decreases by about 25%. This may be attributed to the fact that the coarse grains in HAZ under the weld thermal cycles reduce the toughness of the materials.

4. HCF Behavior of T-Joints

4.1. Fatigue Test Results

The HCF test results of the welded and repair-welded joints are presented in Table 6. By calculation, the fatigue properties of toe and deck repair-welded joints are reduced by about 60% and 30% under the same fatigue load compared with the welded joints.
The fracture position of each welded joint is divided into two places: weld toe and weld root. Figure 14 show pictures of A1 (fracture at weld root) and A2 (fracture at weld toe), respectively. The A-2,3,4 fractures at the weld toe and A-1 fractures at the weld root. Among four deck repair-welded joints (B-D-1,2,3,4), two breaks at the weld toe and two at the weld root. This indicates that the fatigue property of the weld toe and weld root is comparable. While toe repair-welded joints (B-DZ-1,2,3,4) are all broken at the weld root. The data in Table 4 show that the angle between the weld and deck (toe angle2) increases from 120° to 155°, reducing the stress concentration at the weld toe, which results in the failure positions of toe repair-welded joints all located at the weld root. More fracture picture of joints are show in Appendix A.

4.2. Fracture Characteristics

The macro-fracture characteristics of B-DZ-1 (fracture at weld root) and B-D-1 (fracture at weld toe) are presented in Figure 15. It can be seen that the HCF fracture surfaces are divided into fatigue crack initiation, propagation, and fast fracture zone.
The fatigue crack of B-DZ-1 initiates on the surface of the specimen and propagates along the direction of the thickness of the deck. The color of the crack initiation is dark. After the fatigue crack propagation, the effective bearing area continues to decrease until the instant break. The fatigue crack of B-D-1 originates at the middle of the toe and diverges to both sides. Due to obvious welding defects such as pits and undercuts at the weld toe, it is easy to produce stress concentration and cause fatigue crack initiation.

4.3. Fatigue Life Assessment Based on Equivalent Traction Structural Stress

Through calculation of the procedures in Section 2.3, the equivalent traction structural stress of the toe surface and root surface of the welded joint is 1.599 MPa and 1.687 MPa, respectively. The equivalent traction structural stress of the toe surface and root surface of the toe repair-welded joint is 1.608 MPa and 1.679 MPa, respectively. The equivalent traction structural stress under other fatigue loads can be calculated based on these data, as demonstrated in Table 7.
In engineering, Equation (8) is used to evaluate the fatigue life of welded structures through equivalent traction structural stress.
N = Δ S S / C d 1 / h
The C d and h are constant parameters obtained by fitting a large number of fatigue test data. Table 8 lists the constant parameters of the master S-N curve provided by ASME standard [29].
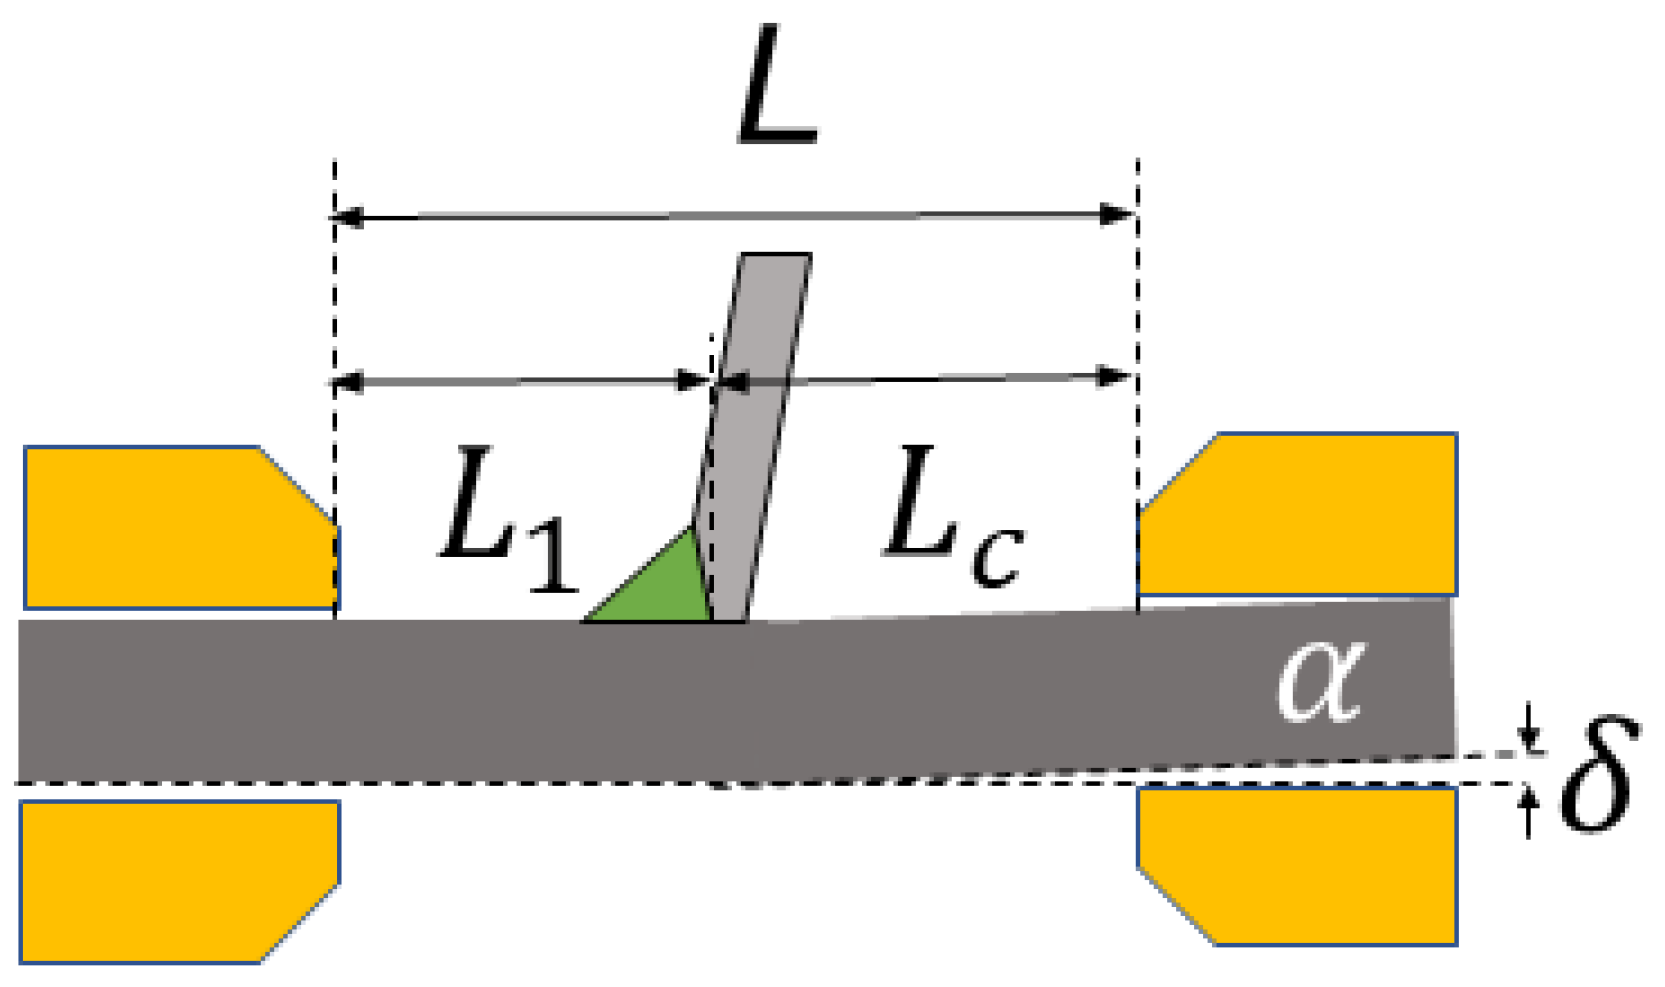
In the actual welding process, the AM generated by nonuniform temperature field distribution, assembly clamping, and other factors will affect the welding joint’s fatigue performance [30]. However, the equivalent traction structural stress calculated above does not consider the influence of AM, so the introduction of a correction formula can further improve the accuracy of fatigue life evaluation of the welded joints. Figure 16 is the schematic diagram of the AM of the welded joint. The welding root is set as the critical position, and t (mm) is the path length of fatigue crack growth, namely, the thickness of the deck plate. The δ (mm) is the distance between the lower edge of the misalignment side and the clamp block. The α (°) is the degree of AM of the specimen. The L (mm) is the distance between the test machine blocks. The distance between the critical position and the two blocks is defined as L1 (mm) and Lc (mm), respectively.
The position of the toe repair welding is on the same side of the deck as the original weld, so the AM is increased relative to the welded joint, see Figure 17. While the position of deck repair welding is on the different sides of the deck from the original weld, so the AM is reduced relative to the welded joint.
The AM correction coefficient k α can be calculated by Equation (9) [31]. Then, the traction structural stress σ s is modified with AM by Equation (10).
k α = 0.8 L 4 9 L 3 L c + 39 L 2 L c 2 60 L c 3 L + 30 L c 4 L 3 t α
σ s m = σ s 1 + k α
The AM α of each specimen can be obtained by using three-dimensional scanning technology and computer-aided design (CAD). The detailed parameters of the AM size of each specimen and the calculation of the correction coefficient k α are shown in Table 9.
The fatigue data with and without AM are plotted in the master S-N curve, as shown in Figure 18. The AM means that the AM is considered. It is observed that all fatigue data are within the ±95% confidence interval of the main curve. It can be observed that the data considering AM are more aggregated to the main curve, meaning that the traction structural stress method with AM is applicable to predict the fatigue life of repair-welded joints. In addition, the fatigue properties of deck repair-welded joints are higher than that of the toe repair-welded joints. Considering that the AM of toe repair-welded joints is larger than that of deck repair-welded joints, it can be determined that the larger AM will reduce the fatigue life of the repair-welded joints.

5. Conclusions

In this paper, the microstructure and mechanical properties of the S355J2 steel welded and repair-welded joints are studied. The HCF properties of the T-joints are evaluated by testing and FEA. Moreover, the influence of AM on HCF performance is emphatically considered. The main conclusions are as follows:
  • Repair welding increases the grain size of WM and HAZ, which reduces the hardness of WM by about 30 HV. The tensile strength of the welded joint is the same as that of the base metal, while the tensile strength of the repair-welded joint is reduced by about 20 MPa. Compared with the base metal, the elongation of the welded and repair-welded joint decreases by about 25%.
  • The fracture positions of the welded joints are both weld toe and root, and the ratio is even, which is the same for deck repair-welded joints cracking. However, all of toe repair-welded joints fracture at the weld root. The macro-fracture characteristics of the root surface show that the fatigue cracks initiate on the surface of the specimen and propagate along the thickness of the deck, while the cracks of the toe surface initiate at the middle of the weld toe and propagate to both sides.
  • The fatigue data with and without AM are all within the ±95% confidence interval of the master S-N curve, while the data considering AM is less discrete to the main curve.

Author Contributions

Investigation, P.Z.; Resources, P.W.; Writing – original draft, P.Z.; Writing – review & editing, B.Y.; Visualization, B.Y., P.W. and Y.L.; Supervision, Y.L.; Supervision and Funding acquisition, X.S. All authors have read and agreed to the published version of the manuscript.

Funding

This work was supported by the National Major Science and Technology Project of China (Grant 2019-VII-0004-0144), the National Natural Science Foundation of China (Grant No. 52175307), and the Taishan Scholars Foundation of Shandong Province (No. tsqn201812128).

Institutional Review Board Statement

Not applicable.

Informed Consent Statement

Not applicable.

Data Availability Statement

Not applicable.

Conflicts of Interest

The authors declare no conflict of interest.

Appendix A

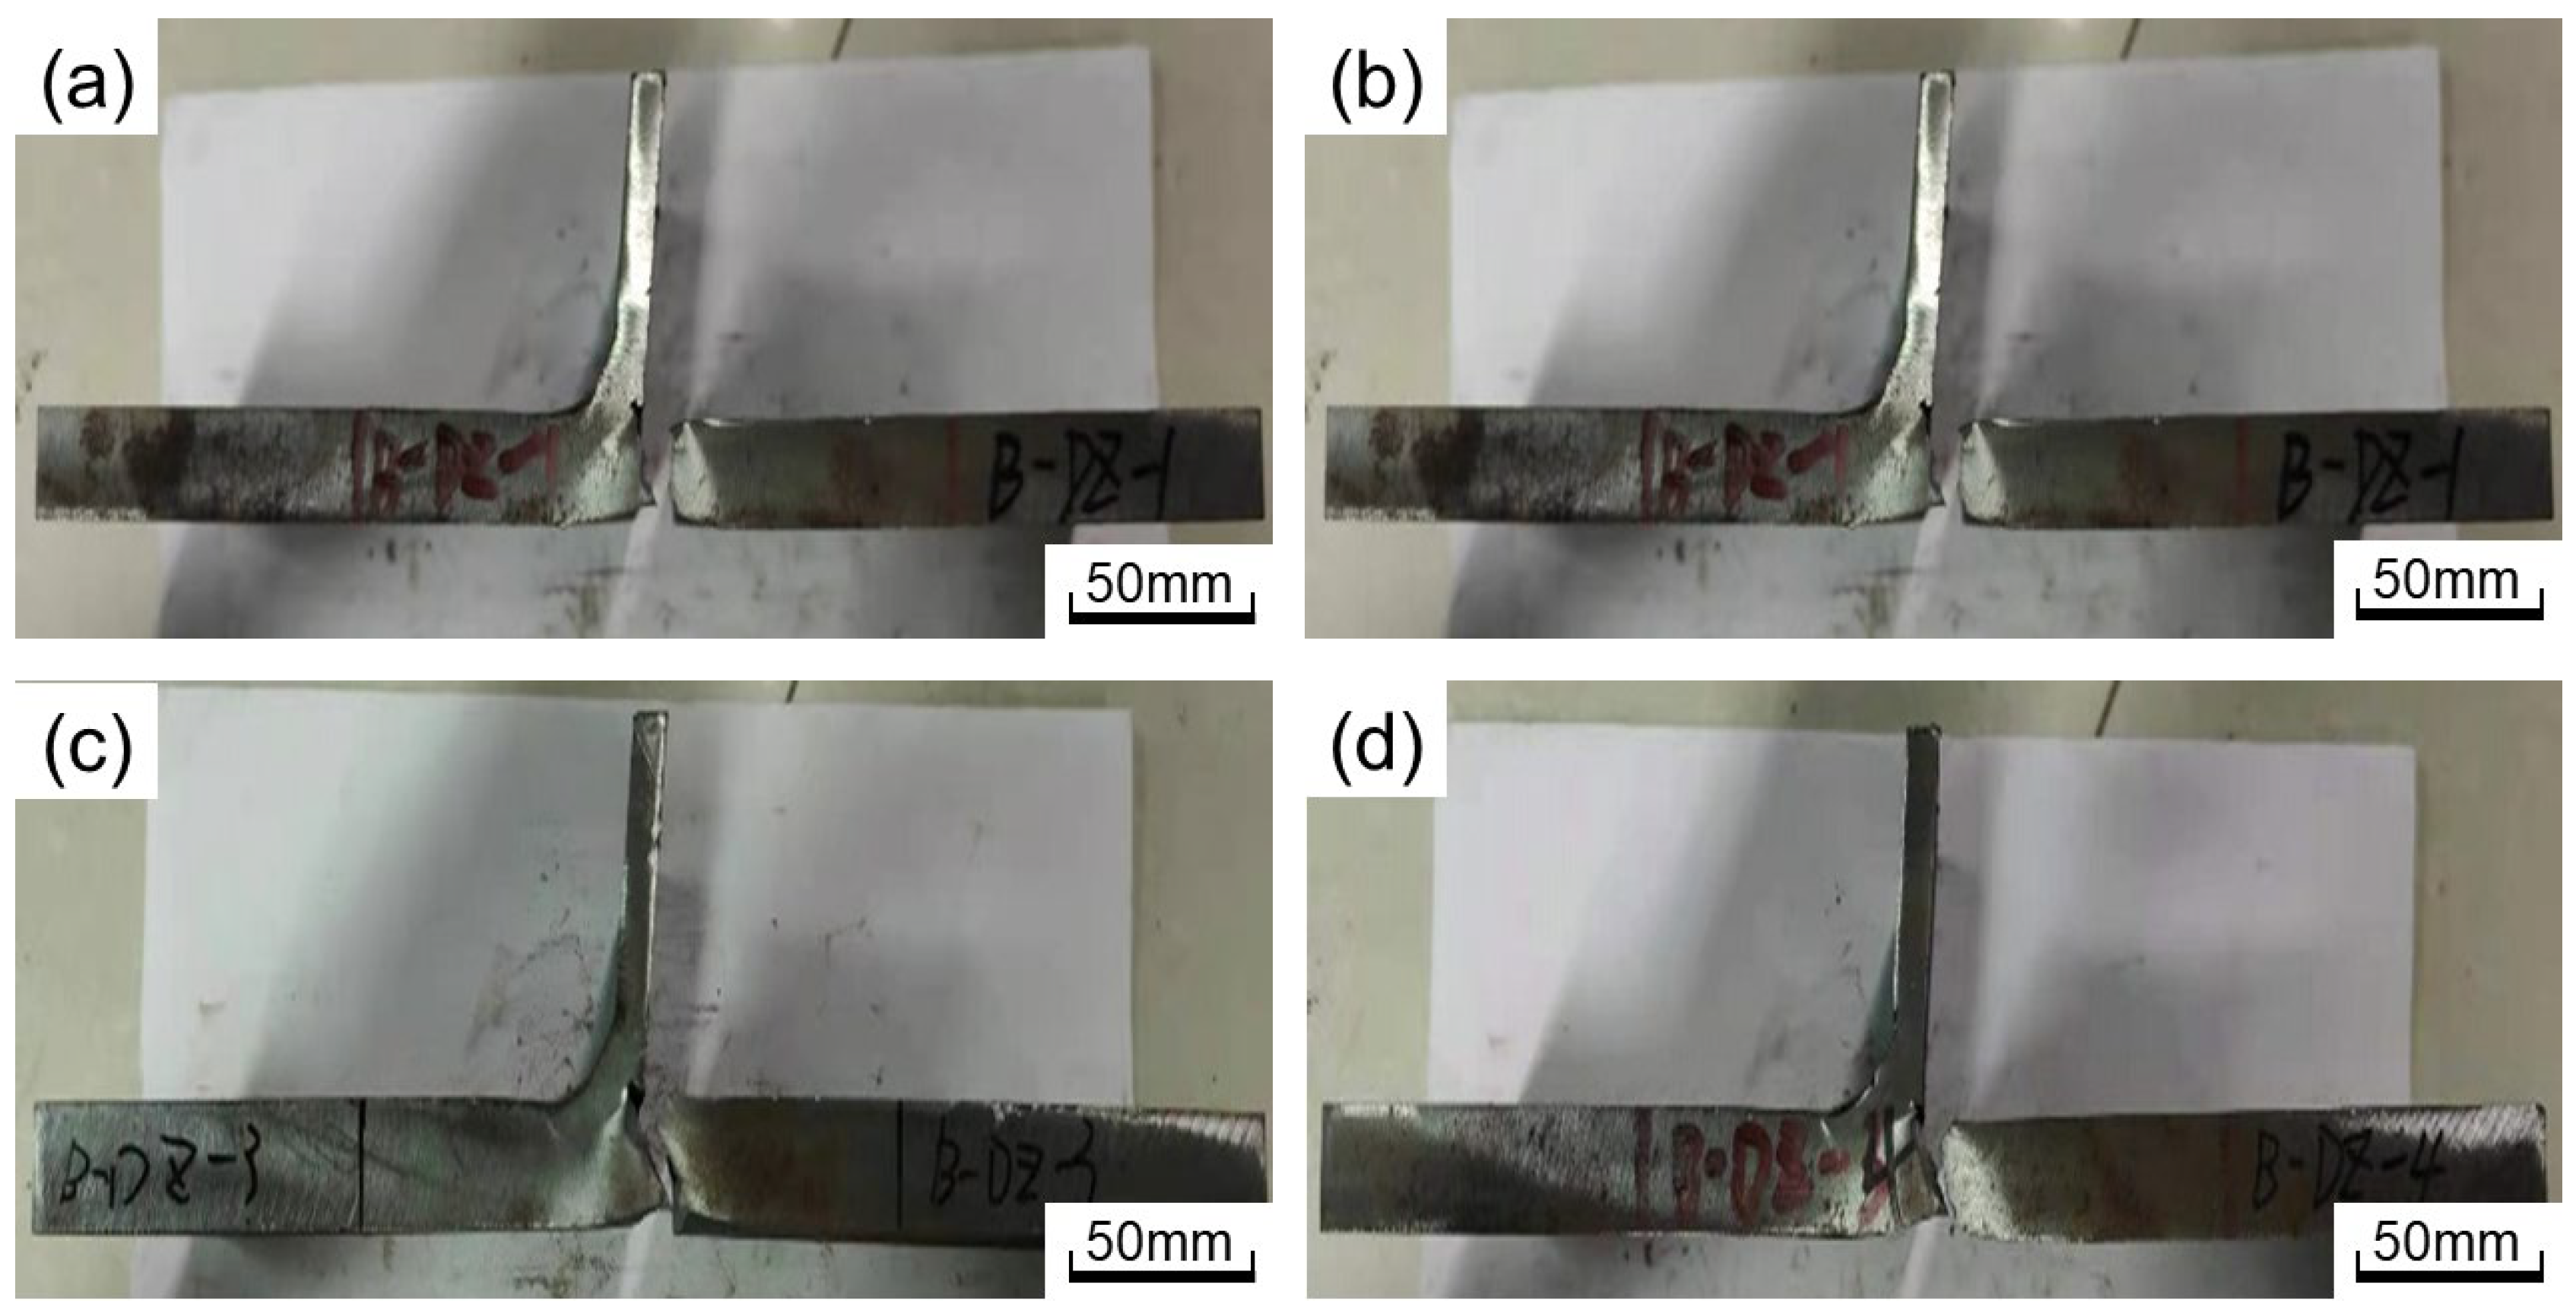
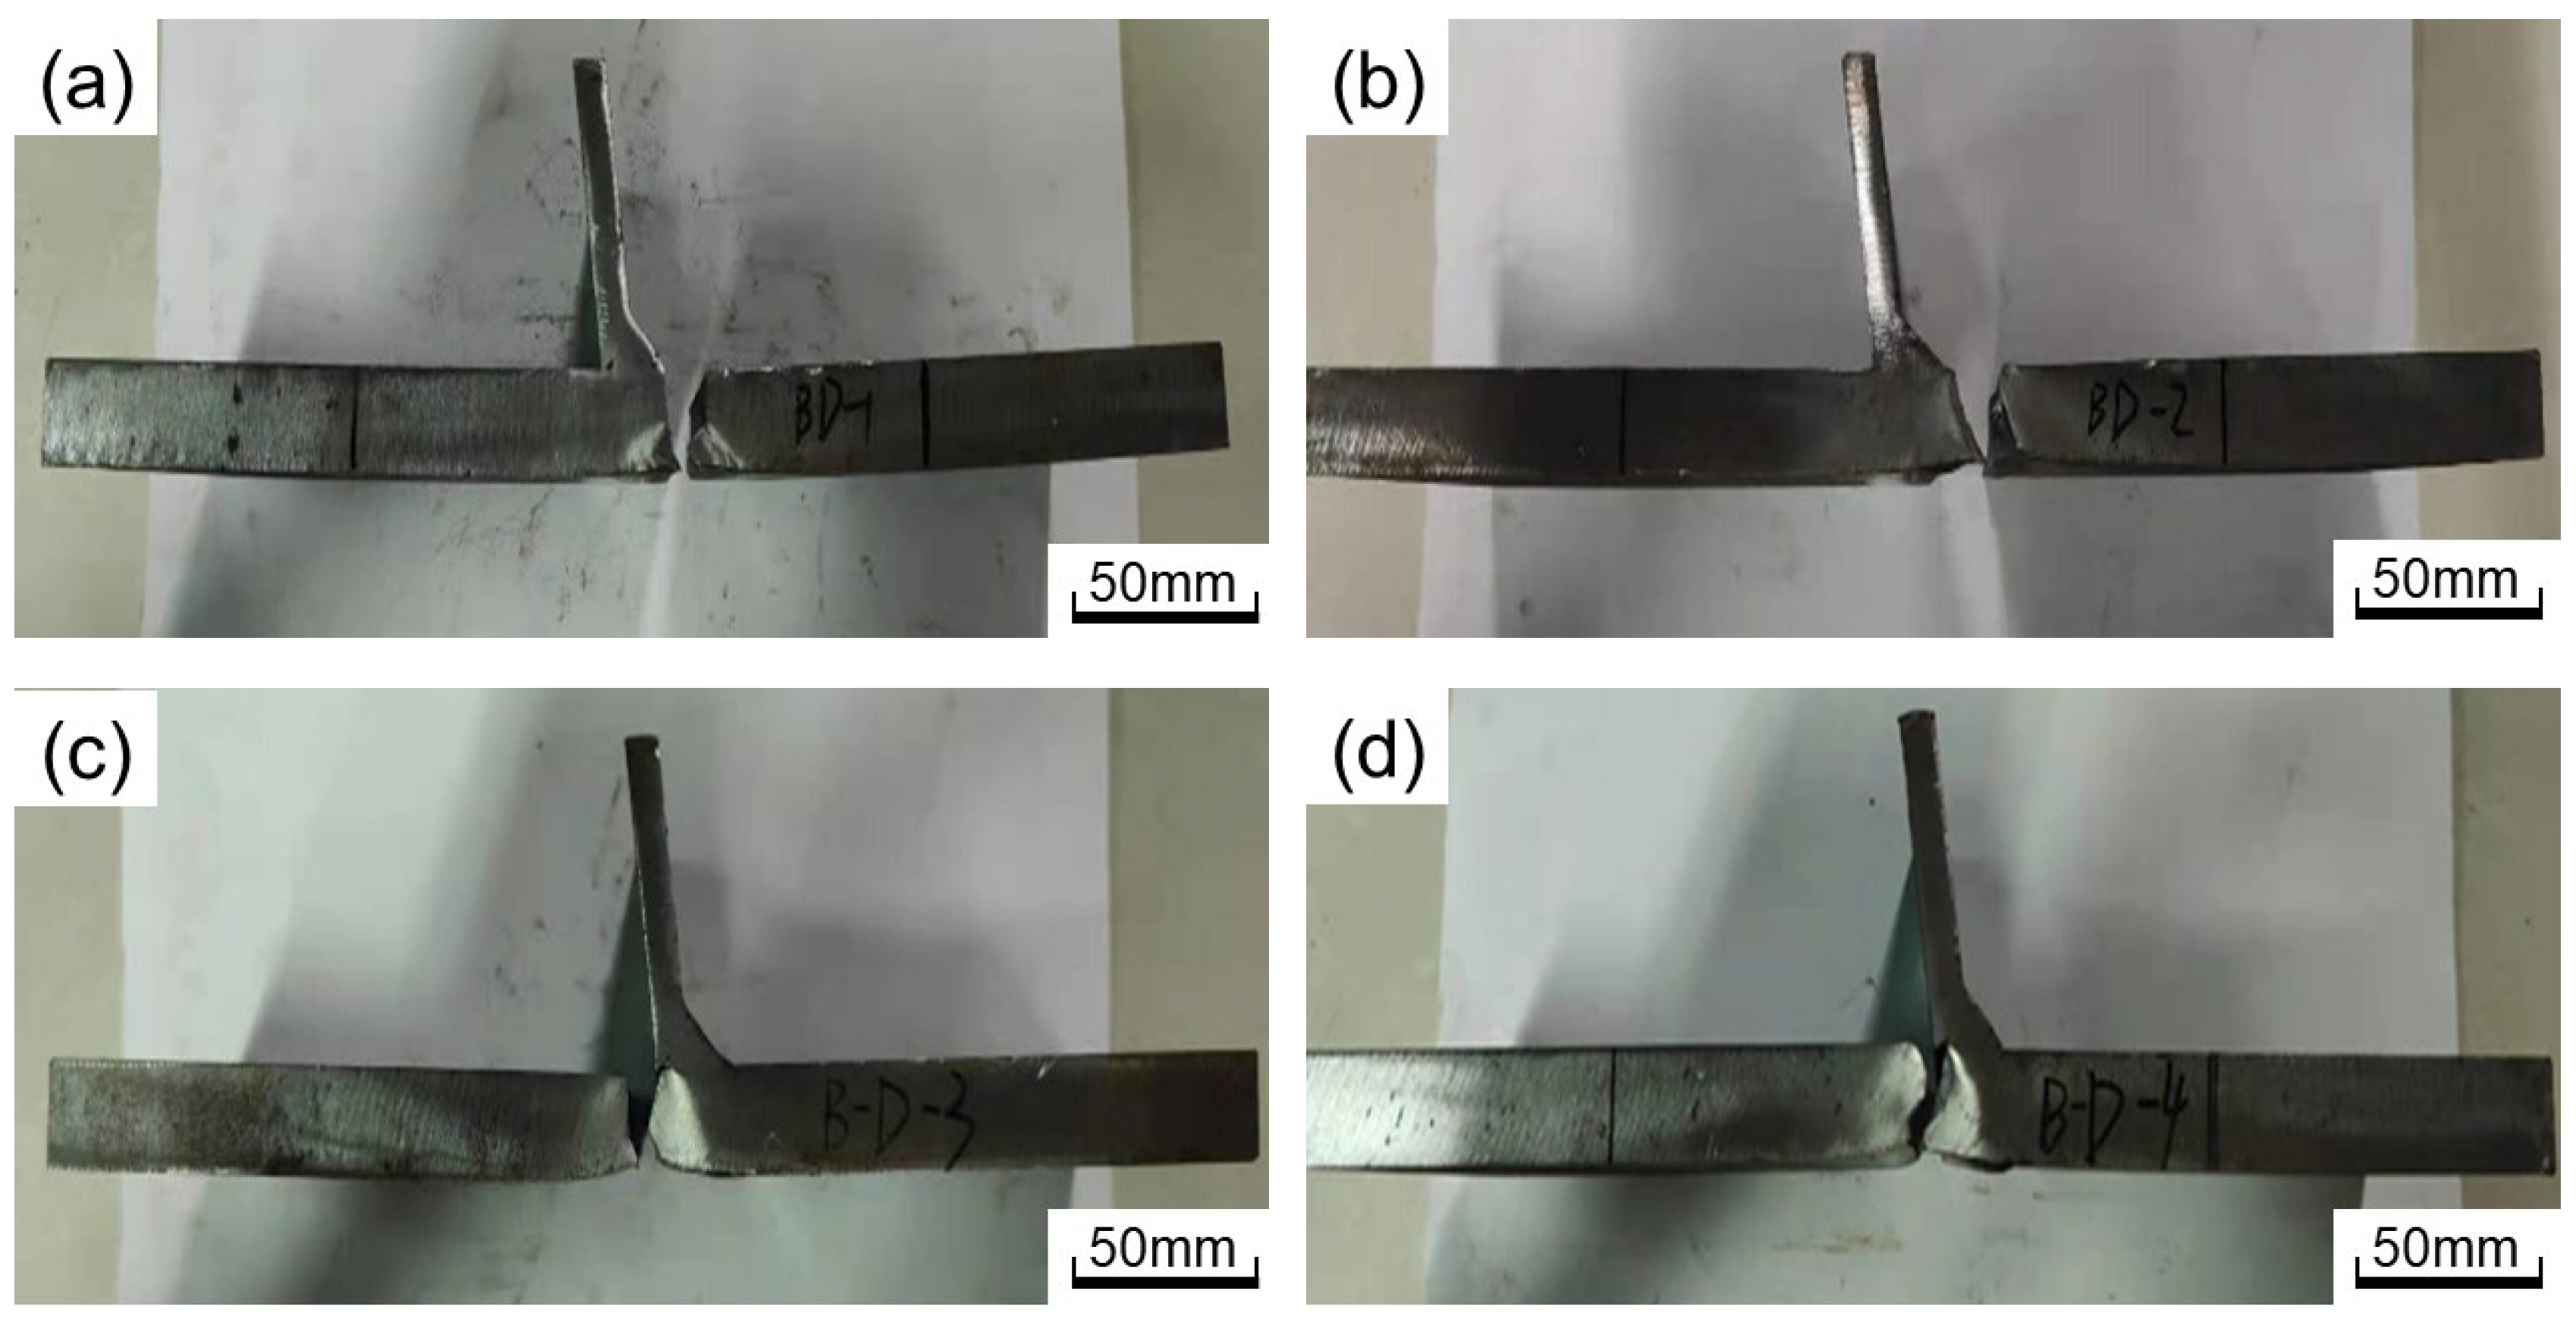
For the readability of the article, the fracture pictures of welded and repaired joints corresponding to Table 6 are shown in Figure A1, Figure A2 and Figure A3.
Figure A1. Fracture positions of the welded joints: (a) A-1; (b) A-2; (c) A-3; (d) A-4.
Materials 16 03682 g0a1
Figure A2. Fracture positions of toe repair-welded joints: (a) B-DZ-1; (b) B-DZ-2; (c) B-DZ-3; (d) B-DZ-4.
Materials 16 03682 g0a2
Figure A3. Fracture positions of deck repair-welded joints: (a) B-D-1; (b) B-D-2; (c) B-D-3; (d) B-D-4.
Materials 16 03682 g0a3

References

  1. Li, J.; Zhang, Q.H.; Bao, Y.; Zhu, J.Z.; Chen, L.; Bu, Y.Z. An equivalent structural stress-based fatigue evaluation framework for rib-to-deck welded joints in orthotropic steel deck. Eng. Struct. 2019, 196, 109304. [Google Scholar] [CrossRef]
  2. Zeng, Y.; He, H.W.; Qu, Y.; Sun, X.D.; Tan, H.M.; Zhou, J.T. Numerical Simulation of Fatigue Cracking of Diaphragm Notch in Orthotropic Steel Deck Model. Materials 2023, 16, 457. [Google Scholar]
  3. Cheng, C.; Xie, X.; Yu, W.T. Investigation of the Fatigue Stress of Orthotropic Steel Decks Based on an Arch Bridge with the Application of the Arlequin Method. Materials 2021, 14, 7653. [Google Scholar] [CrossRef]
  4. Jiang, F.; Fu, Z.; Ji, B.; Wan, L. Fatigue life evaluation of deck to U-rib welds in orthotropic steel deck integrating weldment size effects on welding residual stress. Eng. Fail. Anal. 2021, 124, 105359. [Google Scholar] [CrossRef]
  5. Wang, D.L.; Xiang, C.; Ma, Y.H.; Chen, A.R.; Wang, B.J. Experimental study on the root-deck fatigue crack on orthotropic steel decks. Mater. Des. 2021, 203, 109601. [Google Scholar] [CrossRef]
  6. Ji, B.H.; Liu, R.; Chen, C.; Maeno, H.F.; Chen, X.F. Evaluation on root-deck fatigue of orthotropic steel bridge deck. J. Constr. Steel Res. 2013, 90, 174–183. [Google Scholar] [CrossRef]
  7. Kolstein, M.H. Fatigue Classification of Welded Joints in Orthotropic Steel Bridge Decks; Delft University of Technology: Delft, The Netherlands, 2007. [Google Scholar]
  8. Sim, H.B.; Uang, C.M. Stress analyses and parametric study on full-scale fatigue tests of rib-to-deck welded joints in steel orthotropic decks. J. Bridge Eng. 2012, 17, 765–773. [Google Scholar] [CrossRef]
  9. Huang, Y.; Zhang, Q.H.; Guo, Y.W.; Bu, Y.Z. Comparison of Different Design Codes on Fatigue Assessment of Typical Welded Joints in Orthotropic Steel Bridge Decks. In Proceedings of the 40th IABSE Symposium, Nantes, France, 19–21 September 2018. [Google Scholar]
  10. Sakagami, T.; Izumi, Y.L.; Kubo, S. Application of infrared thermography to structural integrity evaluation of steel bridges. J. Mod. Opt. 2010, 57, 1738–1746. [Google Scholar] [CrossRef]
  11. Yuriok, N.; Horii, Y. Recent developments in repair welding technologies in Japan. Sci. Technol. Weld. Join. 2006, 11, 255. [Google Scholar] [CrossRef]
  12. AghaAli, I.; Farzam, M.; Golozar, M.A.; Danaee, I. The effect of repeated repair welding on mechanical and corrosion properties of stainless steel 316L. Mater. Des. 2014, 54, 331–341. [Google Scholar] [CrossRef]
  13. Luo, Y.; Gu, W.B.; Peng, W.; Jin, Q.; Qin, Q.L.; Yi, C.M. A study on microstructure, residual stresses and stress corrosion cracking of repair welding on 304 stainless steel: Part i-effects of heat input. Materials 2020, 13, 2416. [Google Scholar] [CrossRef]
  14. Katsas, S.; Papadimitriou, J.N. Microstructural changes accompanying repair welding in 5xxx aluminium alloys and their effect on the mechanical properties. Mater. Des. 2006, 27, 968–975. [Google Scholar] [CrossRef]
  15. Shojaati, M.; Bozorg, S.F.K.; Vatanara, M.; Yazdizadeh, M.; Abbasi, M. The heat affected zone of X20Cr13 martensitic stainless steel after multiple repair welding: Microstructure and mechanical properties assessment. Int. J. Press. Vessel. Pip. 2020, 188, 104205. [Google Scholar] [CrossRef]
  16. Dong, P.S. On repair weld residual stresses and significance to structural integrity. Weld. World 2018, 62, 351–362. [Google Scholar] [CrossRef]
  17. Wang, Y.X.; Ji, B.H.; Fu, Z.Q.; Yao, Y. Fatigue repairing craftsmanship of deck-to-vertical stiffener weld in the steel bridge deck. Adv. Steel Constr. 2019, 15, 232–241. [Google Scholar]
  18. Seo, J.W.; Kwon, S.J.; Lee, C.W.; Lee, D.F.; Goo, B.C. Fatigue strength and residual stress evaluation of repair welding of bogie frame for railway vehicles. Eng. Fail. Anal. 2020, 119, 104980. [Google Scholar] [CrossRef]
  19. Savaidis, G.; Vormwald, M. Hot-spot stress evaluation of fatigue in welded structural connections supported by finite element analysis. Int. J. Fatigue 2000, 22, 85–91. [Google Scholar] [CrossRef]
  20. Lee, J.M.; Seo, J.K.; Kim, M.H.; Shin, S.B.; Han, M.S.; Park, J.S.; Mahendran, M. Comparison of hot spot stress evaluation methods for welded structures. Int. J. Nav. Archit. Ocean Eng. 2010, 2, 200–210. [Google Scholar] [CrossRef]
  21. Zamzami, I.A.; Davison, B.; Susmel, L. Nominal and local stress quantities to design aluminium-to-steel thin welded joints against fatigue. Int. J. Fatigue 2019, 123, 279–295. [Google Scholar]
  22. Fricke, W. Fatigue analysis of welded joints: State of development. Mar. Struct. 2003, 16, 185–200. [Google Scholar] [CrossRef]
  23. Dong, P.S. A robust structural stress method for fatigue analysis of offshore/marine structures. Offshore Mech. Arct. Eng. 2005, 127, 68. [Google Scholar] [CrossRef]
  24. ASME:2007; Sec VIII, Div. 2 (ASME BPVC-VIII-2 e2007). American Society of Mechanical Engineers: New York, NY, USA, 2007.
  25. ISO 6892-1:2009; Metallic Materials—Tensile Testing—Part 1: Method of Test at Room Temperature. ISO: Berlin, Germany, 2009.
  26. Chen, Z.H.; Yu, B.L.; Wang, P.; Qian, H.L.; Dong, P.S. Fatigue behaviors of aluminum alloy butt joints with backing plates: Experimental testing and traction stress modeling. Int. J. Fatigue 2022, 163, 107040. [Google Scholar] [CrossRef]
  27. Wang, P.; Pei, X.J.; Dong, P.S.; Song, S.P. Traction structural stress analysis of fatigue behaviors of rib-to-deck joints in orthotropic bridge deck. Int. J. Fatigue 2019, 125, 11–22. [Google Scholar] [CrossRef]
  28. Dong, P.S. A structural stress definition and numerical implementation for fatigue analysis of welded joints. Int. J. Fatigue 2001, 23, 865–876. [Google Scholar] [CrossRef]
  29. Veerababu, J.; Goyal, S.; Sandhya, R.; Laha, K. Low cycle fatigue behaviour of Grade 92 steel weld joints. Int. J. Fatigue 2017, 105, 60–70. [Google Scholar] [CrossRef]
  30. Xing, S.Z.; Dong, P.S.; Wang, P. A Quantitative Weld Sizing Criterion for Fatigue Design of Load-Carrying Fillet-Welded Connections. Int. J. Fatigue 2017, 101, 448–458. [Google Scholar] [CrossRef]
  31. Xing, S.Z.; Dong, P.S. An analytical SCF solution method for joint misalignments and application in fatigue test data interpretation. Mar. Struct. 2016, 50, 143–161. [Google Scholar] [CrossRef]
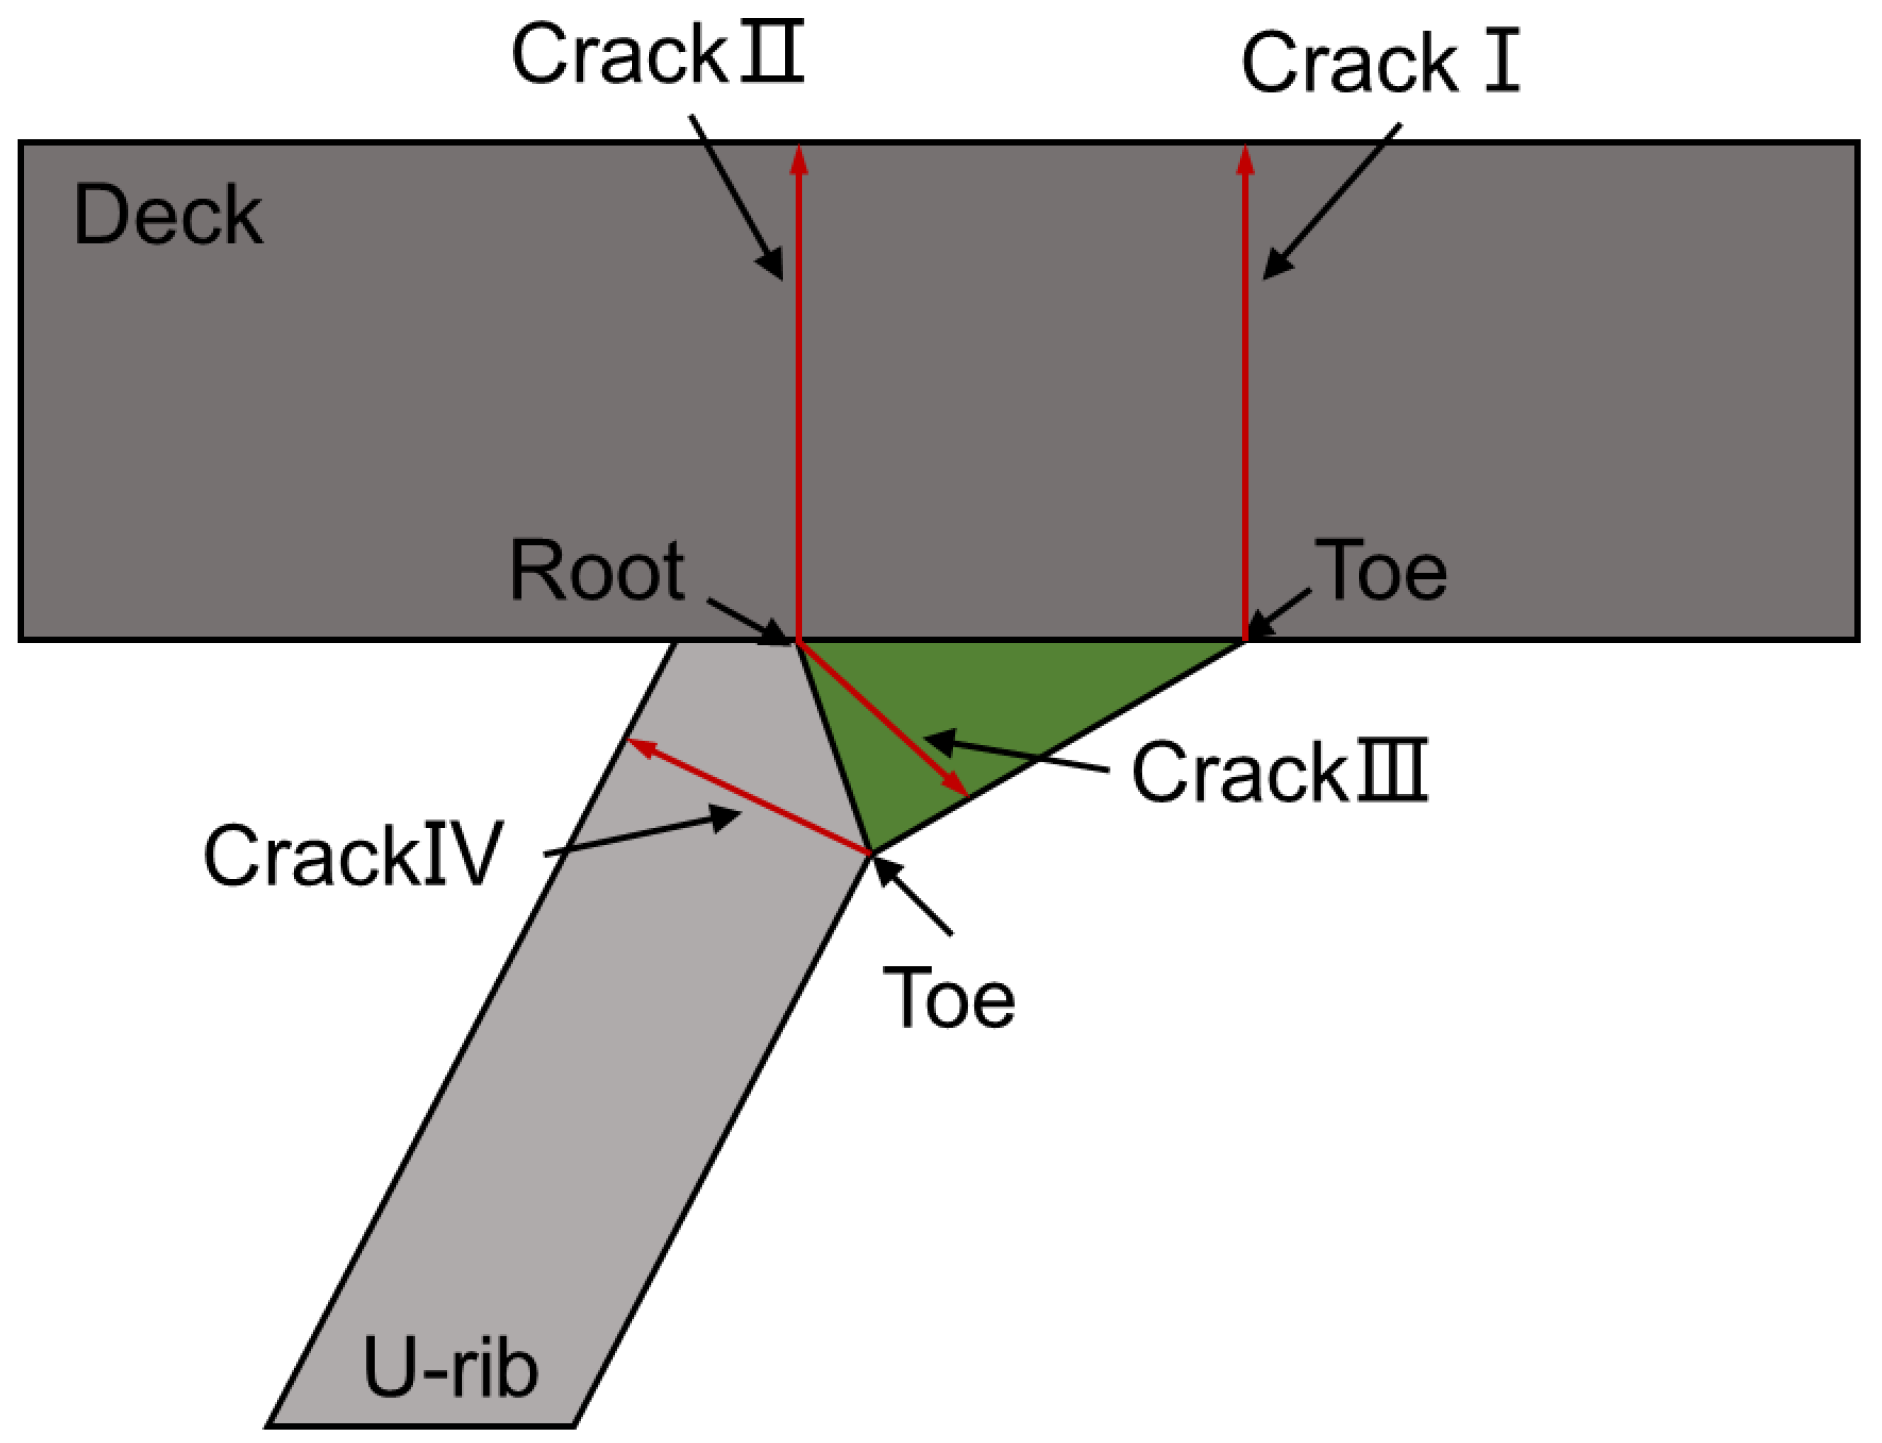
Figure 1. Types of orthotropic deck fatigue crack.
Materials 16 03682 g001
Figure 2. Schematic diagram of repair-welded joint: (a) toe repair-welded joint; (b) deck repair-welded joint.
Materials 16 03682 g002
Figure 3. Dimensions of tensile specimen.
Materials 16 03682 g003
Figure 4. (a) MTS high-frequency fatigue testing machine; (b) clamping mode of T-joint.
Materials 16 03682 g004
Figure 5. Diagram of stress distribution along the direction of the thickness of the deck.
Materials 16 03682 g005
Figure 6. Dimensional parameters measurement of joints: (a) as-welded; (b) toe repair-welded.
Materials 16 03682 g006
Figure 7. Comparison of FEM between the welded joint and repair-welded joint: (a) as-welded; (b) repair-welded.
Materials 16 03682 g007
Figure 8. Nodal forces extraction along the weld line at weld toe and root in FEM: (a) weld toe; (b) weld root.
Materials 16 03682 g008
Figure 9. Variation of microstructure across the welded joint of S355J2 steel: (a) the welded joint; (b) WM; (c) CGHAZ; (d) FGHAZ; (e) ICHAZ.
Materials 16 03682 g009aMaterials 16 03682 g009b
Figure 10. Microstructure of toe repair-welded joint: (a) the repair-welded joint; (b) region b; (c) region c; (d) region d.
Materials 16 03682 g010
Figure 11. Comparison of CGHAZ microstructure of S355J2 steel joint: (a) as-welded; (b) repair-welded.
Materials 16 03682 g011
Figure 12. (a) hardness test position; (b) hardness test results of the welded and repair-welded joint.
Materials 16 03682 g012
Figure 13. Stress-strain curves of tensile specimens.
Materials 16 03682 g013
Figure 14. Fracture picture of welded joints: (a) fracture at weld root; (b) fracture at weld toe.
Materials 16 03682 g014
Figure 15. Macro-fracture characteristics of joints: (a) B-DZ-1; (b) B-D-1.
Materials 16 03682 g015
Figure 16. Schematic diagram of AM.
Materials 16 03682 g016
Figure 17. Effect of repair welding on AM.
Materials 16 03682 g017
Figure 18. The master S-N curve of the welded and repair-welded joints.
Materials 16 03682 g018
Table 1. Chemical composition of the base and filler metal (wt%).
MaterialSiMnCPSNiCrCuFe
S355J20.501.700.180.0250.0250.500.300.30Bal.
E500T-10.901.750.180.030.03---Bal.
Table 2. The preparation process and dimensions of the test specimen.
SpecimenLength/mmWidth/mmDeck Thickness/mmSchematic Diagram
of Specimen
Post-weld specimen180060018Materials 16 03682 i001
Post-cut specimen60030018Materials 16 03682 i002
T-joint30010018Materials 16 03682 i003
Table 3. Parameters of the HCF test.
SpecimenWelding StateLoading Frequency/HzMinimum/Maximum Load/kN
A-1As-welded1536/360
A-2As-welded1540/400
A-3As-welded1544/440
A-4As-welded1546/460
B-DZ-1Repair-welded of deck1536/360
B-DZ-2Repair-welded of deck1540/400
B-DZ-3Repair-welded of deck1544/440
B-DZ-4Repair-welded of deck1546/460
B-D-1Repair welded of toe1536/360
B-D-2Repair welded of toe1540/400
B-D-3Repair welded of toe1544/440
B-D-4Repair welded of toe1546/460
Table 4. Dimensional parameters of welded and repair-welded joints.
SpecimenMaterials 16 03682 i004
Beta Angle
(°)
Materials 16 03682 i005
Leg1
(mm)
Materials 16 03682 i006
Leg2
(mm)
Materials 16 03682 i007
Throat
(mm)
Materials 16 03682 i008
Toe Angle1
(°)
Materials 16 03682 i009
Toe Angle2
(°)
Welded joints10110.17.995.4146120
Repair-welded joints9910.013.15.9144155
Table 5. Data of the tensile tests for the different conditions.
SpecimenYield Strength σYS/MPaUltimate Tensile Strength σUTS/MPaTensile Elongation δ/%
Base metal39353938.7
As-welded40155128.8
Repair-welded38051129
Table 6. HCF test results of S355J2 welded and repair-welded joints.
SpecimenMinimum/Maximum Load (kN)Test CycleFracture Location
A-136/360584,810Weld root
A-240/400709,590Weld toe
A-344/440356,690Weld toe
A-446/460288,464Weld toe
B-DZ-136/360202,070Weld root
B-DZ-240/400163,023Weld root
B-DZ-344/440223,383Weld root
B-DZ-446/460125,140Weld root
B-D-136/360413,257Weld toe
B-D-240/400325,298Weld toe
B-D-344/440187,688Weld root
B-D-446/460234,109Weld root
Table 7. Equivalent traction structural stress of FEM under different load.
SpecimenMinimum/Maximum Load (kN)Nominal Stress (MPa)Stress Concentration Factor of Fracture InterfaceEquivalent Traction Structural Stress of Fracture Interface (MPa)
A-136/3601801.687303.61
A-240/4002001.599319.80
A-344/4402201.599351.78
A-446/4602301.599367.77
B-DZ-136/3601801.679302.18
B-DZ-240/4002001.679335.76
B-DZ-344/4402201.679369.34
B-DZ-446/4602301.679386.12
B-D-136/3601801.599287.82
B-D-240/4002001.599319.80
B-D-344/4402201.687371.10
B-D-446/4602301.687387.95
Table 8. Parameters of the master S-N curve.
Curve C d h
Master curve19,930.20.3195
Upper curve ( + 2 σ )28,626.50.3195
Lower curve (− 2 σ )13,875.70.3195
Upper curve ( + 3 σ )34,308.10.3195
Lower curve (−3 σ )11,577.90.3195
Table 9. Parameters of the AM and the correction coefficient of each specimen.
SpecimenL (mm)Lc (mm)α (°) k α σ s m   ( MPa )
A-114069.20.990.0672322.56
A-214069.21.230.0835344.56
A-314069.21.360.0923381.90
A-414069.20.950.0645389.75
B-DZ-114069.22.3850.1618347.61
B-DZ-214069.23.2730.2221405.02
B-DZ-314069.23.4970.2373450.74
B-DZ-414069.22.90.1968456.70
B-D-114069.20.3420.0232294.00
B-D-214069.20.3030.0206325.88
B-D-314069.20.3280.0223378.76
B-D-414069.20.4190.0284398.20
Disclaimer/Publisher’s Note: The statements, opinions and data contained in all publications are solely those of the individual author(s) and contributor(s) and not of MDPI and/or the editor(s). MDPI and/or the editor(s) disclaim responsibility for any injury to people or property resulting from any ideas, methods, instructions or products referred to in the content.