Article

Charge Transfer and Charge Trapping Processes in Ca- or Al-Co-doped Lu2SiO5 and Lu2Si2O7 Scintillators Activated by Pr3+ or Ce3+ Ions

1
Institute of Physics of the Czech Academy of Sciences, Cukrovarnicka 10/112, 16200 Prague, Czech Republic
2
Faculty of Nuclear Sciences and Physical Engineering, Czech Technical University in Prague, Břehová 7, 11519 Prague, Czech Republic
*
Author to whom correspondence should be addressed.
Materials 2023, 16(12), 4488; https://doi.org/10.3390/ma16124488
Submission received: 14 May 2023 / Revised: 9 June 2023 / Accepted: 13 June 2023 / Published: 20 June 2023
(This article belongs to the Special Issue Advanced Luminescent Materials and Devices)

Abstract

:
Lutetium oxyorthosilicate Lu2SiO5 (LSO) and pyrosilicate Lu2Si2O7 (LPS) activated by Ce3+ or Pr3+ are known to be effective and fast scintillation materials for the detection of X-rays and γ-rays. Their performances can be further improved by co-doping with aliovalent ions. Herein, we investigate the Ce3+(Pr3+) Ce4+(Pr4+) conversion and the formation of lattice defects stimulated by co-doping with Ca2+ and Al3+ in LSO and LPS powders prepared by the solid-state reaction process. The materials were studied by electron paramagnetic resonance (EPR), radioluminescence spectroscopy, and thermally stimulated luminescence (TSL), and scintillation decays were measured. EPR measurements of both LSO:Ce and LPS:Ce showed effective Ce3+  Ce4+ conversions stimulated by Ca2+ co-doping, while the effect of Al3+ co-doping was less effective. In Pr-doped LSO and LPS, a similar Pr3+  Pr4+ conversion was not detected by EPR, suggesting that the charge compensation of Al3+ and Ca2+ ions is realized via other impurities and/or lattice defects. X-ray irradiation of LPS creates hole centers attributed to a hole trapped in an oxygen ion in the neighborhood of Al3+ and Ca2+. These hole centers contribute to an intense TSL glow peak at 450–470 K. In contrast to LPS, only weak TSL peaks are detected in LSO and no hole centers are visible via EPR. The scintillation decay curves of both LSO and LPS show a bi-exponential decay with fast and slow component decay times of 10–13 ns and 30–36 ns, respectively. The decay time of the fast component shows a small (6–8%) decrease due to co-doping.

1. Introduction

Scintillation materials are currently widely used for radiation detection in many fields, such as medical imaging, high energy physics calorimetry, bolometry for rare events searches, industrial control, safety and homeland security, and others [1]. Among them, wide bandgap oxide dielectrics with a high degree of structural perfection are the most suitable for such purposes [2]. In general, for scintillation applications, the material must accomplish fast and efficient transformations of incoming high energy photons/particles (or energy arising in a nuclear reaction with neutrons) into a number of electron–hole pairs collected in the conduction and valence bands, respectively, and their radiative recombination at suitable luminescence centers in the material. Therefore, most of the applications using scintillation materials are based on the density, scintillation, and time response performances. Based on these parameters, an impressive number of heavy cation-based hosts (particularly lutetium/yttrium/gadolinium) doped with Ce3+ or Pr3+ have been developed. Among them, a promising family of scintillation crystals is based on Lu2SiO5 (LSO), (Lu,Y)2SiO5 (LYSO) oxyorthosilicates, and Lu2Si2O7 (LPS) and recently (Gd,La)2Si2O7 pyrosilicates doped by Ce3+ or Pr3+ ions (see, e.g., review paper [2] and refs. [3,4,5,6]). All the abovementioned materials are excellent candidates for the detection of gamma rays in both positron emission tomography (PET), a very powerful medical imaging method to monitor metabolism, blood flow, or neurotransmission [7], and high energy calorimetry [2,8]. LYSO:Ce crystals are currently used in scintillation detectors in PET scanners, and various co-doping schemes have been reported in the last decade to further improve their performance [2,9,10]. In particular, co-doping LSO:Ce with divalent Ca2+ or Mg2+ ions has been shown to eliminate shallow electron traps and decrease the scintillation decay time from ~43 ns to ~30 ns while maintaining a high light output [8,11,12]. This improvement is at least partially related to the effective Ce3+  Ce4+ conversion, where the stable Ce4+ ion creates an additional fast radiative recombination pathway, which efficiently competes in electron trapping from the conduction band with any other electron traps [11]. Alternatively, co-doping with a trivalent metal ion (Al, Ga, or In) that substitutes a tetravalent Si ion has been proposed [13,14]. It was assumed that such co-doping creates a positive charge deficit that limits the trapping of electrons responsible for afterglow.
The same positive effect of Ca2+(Mg2+) or Al3+ co-doping on decay time improvements is expected in Ce- or Pr-doped Lu2Si2O7 pyrosilicates [15]. They show even better scintillation characteristics than oxyorthosilicates. In particular, with nearly the same light yield, energy resolution, and scintillation decay time as reported for LSO:Ce, Ce-doped pyrosilicates are free from the intense afterglow as reported in [16,17]. However, in general, the effect of Ca2+, Mg2+, or Al3+ co-doping on charge trapping processes has not been investigated practically, especially in Pr-doped oxyorthosilicates and pyrosilicates.
In oxyorthosilicates as well as in scintillating garnets, in addition to the Ce3+  Ce4+ recharge that improves the timing characteristics, the creation of additional charge trapping sites due to co-doping with aliovalent ions is important as well. Such traps will decrease the light yield and can also contribute to delayed luminescence or afterglow. This phenomenon can seriously limit the time response of a scintillator, which is crucial for PET scanners and other time-of-flight applications where a sub-100 ps time resolution is desirable. Although charge traps have been extensively studied in both LSO and LPS activated by Ce3+ and Pr3+ ions using the thermally stimulated luminescence (TSL) and the local probe electron paramagnetic resonance (EPR) methods [18,19,20,21], not much is known about charge traps in Ca2+(Mg2+) or Al3+ co-doped materials.
In this paper, we present the results of a detailed EPR study of polycrystalline Ce- and Pr-doped Lu2SiO5 and Lu2Si2O7 co-doped with Ca2+ and Al3+ with the aim of clarifying the Ce3+(Pr3+) Ce4+(Pr4+) conversion and to study the formation of lattice defects stimulated by co-doping with aliovalent ions. Our EPR study is also accompanied by the TSL and scintillation decay measurements of the synthesized materials.

2. Materials and Methods

The powder samples of LSO and LPS doped with 2000 ppm Ce (or Pr)/Lu and co-doped with 5000 ppm Al/Si or 5000 ppm Ca/Lu (see Table 1) were prepared by a conventional solid-state reaction process [22] consisting of several periods of annealing in air up to 1500–1600 °C/72 h and remixing in an agate mortar. The starting materials were 5N Lu2O3, 4N8 SiO2, 5N Al2O3, CaO grade I, 4N CeO2, or 5N Pr6O11. The weights of the starting oxides were corrected for the moisture content in the base materials determined after annealing at 1200 °C/12 h. Annealing was carried out in corundum boats with lids, which were washed and then annealed up to 1600 °C/12 h before their first use. It should be noted that due to segregation during the growth of crystallites, the final contents of the dopants in the lattice could be smaller by up to a factor of 0.5 [8] than those indicated in Table 1.
The phase purity of all synthesized LSO and LPS powders was evaluated by X-ray powder diffraction (XRPD) using a Rigaku MiniFlex 600 diffractometer equipped with a Cu X-ray tube and a NaI:Tl scintillation detector. The diffraction patterns exactly matched the following LSO and LPS database records in the ICDD PDF-2 database: 01-070-9485 and 01-071-3309, respectively (see Supplementary Materials). This proved that all samples after the final annealing step were phase-pure materials with a phase composition corresponding to the desired one; LSO samples contained just Lu2SiO5 (space group C2/c [23]) and LPS samples contained just Lu2Si2O7 (space group C2/m [24]).
EPR spectra were measured using a commercial Bruker EMX plus spectrometer at X-band (microwave frequency 9.25–9.5 GHz) within the temperature range of 10–290 K. An X-ray tube operating at a voltage and current of 55 kV and 30 mA, respectively, with a Co anode (ISO-DEBYEFLEX 3003 Seifert Gmbh., Ahrensburg, Germany) was used as the source of X-ray irradiation for LSO and LPS powders.
The radioluminescence (RL) and thermally stimulated luminescence measurements were performed in the spectral range 200–800 nm using the Horiba Jobin-Yvon 5000M spectrometer with an Oxford liquid nitrogen cryostat and a TBX-04 (IBH) photomultiplier (Glasgow, Scotland). The spectral bandwidth of the monochromator was 8 nm. The RL spectra were recorded at 295 K. The spectrally unresolved TSL glow curves were recorded in the temperature range of 77–500 K with a heating rate of 0.1 K/s. Irradiation of the samples was performed at 77 K via a Seifert X-ray tube operating at 40 kV with a tungsten target; the dose was estimated to be about 450 Gy. All the spectra were corrected for spectral distortions caused by the experimental setup.
Scintillation decays with ultra-high time resolution under the pulsed X-ray excitation were measured using a picosecond (ps) X-ray tube N5084 (Hamamatsu, 40 kV, Shizuoka, Japan). The X-ray tube was driven by a ps pulsed laser at a repetition rate of up to 1 MHz. The signal was detected by a hybrid picosecond photon detector and a Fluorohub unit (Horiba Scientific). The instrumental response function FWHM of the setup is about 75 ps. Spectrally unresolved luminescence decay curves were detected from the surface excited by X-rays. The convolution procedure of the instrumental response and fit function was applied to fit the decay curves and determine the true decay times (SpectraSolveTM software package for Windows, Ames Photonics, Hurst, TX, USA).

3. Results

3.1. EPR Spectra in Ca and Al Co-doped LSO:Ce and LSO:Pr

A detailed investigation of the Ce3+  Ce4+ charge conversion that plays an important role in the acceleration of the Ce3+ scintillation decay was performed on LSO:Ce, LSO:Ce,Al, and LSO:Ce,Ca samples. The corresponding EPR spectra are presented in Figure 1. The spectra contain two spectral lines from Ce3+ ions (S = 1/2, 4f1) corresponding to two principal g factors: g1 = 2.262 and g2 = 1.686. The third Ce3+ spectral line at g3 = 0.563 (Br = 16.676 kG) is outside of the magnetic field range. These g factors coincide with those measured previously in crystals [25]. Note that the second Ce3+ center detected in crystals was not resolved in the powder spectrum due to the low intensity of its spectral lines (the population of the second Ce3+ center is only about 5% [25]).
There are other spectral lines at low magnetic fields, which we assign to Fe3+ accidental impurities. The spectrum is typical for this ion (S = 5/2, 3d5) in a low-symmetry crystal field with large zero-field splitting of energy levels [26]. The corresponding simulated spectrum is shown in the inset of Figure 1 (red line), and the spin Hamiltonian parameters are listed in Table 2. For the fit, the conventional spin Hamiltonian was used:
H = β S g B + 1 3 ( b 2 0 O 2 0 + b 2 2 O 2 2 ) ,
where β is the Bohr magneton, g is the g-tensor, and b i m and O l m are crystal field parameters and Stevens spin operators [27], respectively. The fourth-rank crystal field terms were neglected as they are much smaller than the other terms and could not be determined from powder spectra. The roughly estimated concentration of Fe3+ ions from the EPR intensity is only 5–10 ppm. These ions, most probably, come from the raw materials.
A substantial (three-fold) decrease in Ce3+ concentration in Ca-co-doped samples was observed, confirming the effective Ce3+  Ce4+ conversion, while the effect of Al co-doping (when Al3+ is substituted for Si4+) was much smaller, at only about 15–20%. The Fe3+ EPR intensity also decreases under Ca and Al co-doping, indicating the recharge of the Fe3+ ions to a valence state invisible in EPR.
We also measured the Pr3+  Pr4+ conversion in LSO:Pr samples stimulated by Al and Ca co-doping. The EPR spectrum of Pr3+ (S = 1, 4f2) is not visible at 9–35 GHz which is available in our spectrometer due to a large splitting of the 4f2 energy levels already in zero field (non-paramagnetic ground state is not excluded as well). Moreover, even Pr4+, which has the same electron shell as Ce3+ and should be easily detectable in EPR, was not detected in the EPR spectra even at measurement temperatures down to 3.5 K. This suggests a much lower concentration of Pr4+ ions compared to Pr3+ ions. Therefore, the Pr3+  Pr4+ conversion stimulated by Al and Ca co-doping of LSO is much less effective than the Ce3+  Ce4+ conversion. Instead, as in the case of LSO:Ce, we observed a pronounced change in the Fe3+ concentration (Figure 2) induced by Al and Ca co-doping of LSO:Pr. However, here, the Fe3+ concentration increases, suggesting that the Fe2+  Fe3+ conversion takes place to compensate, at least partly, the excess negative charge caused by replacement of Lu3+ by Ca2+.

3.2. EPR Spectra in Ca- and Al-Co-doped LPS:Ce and LPS:Pr

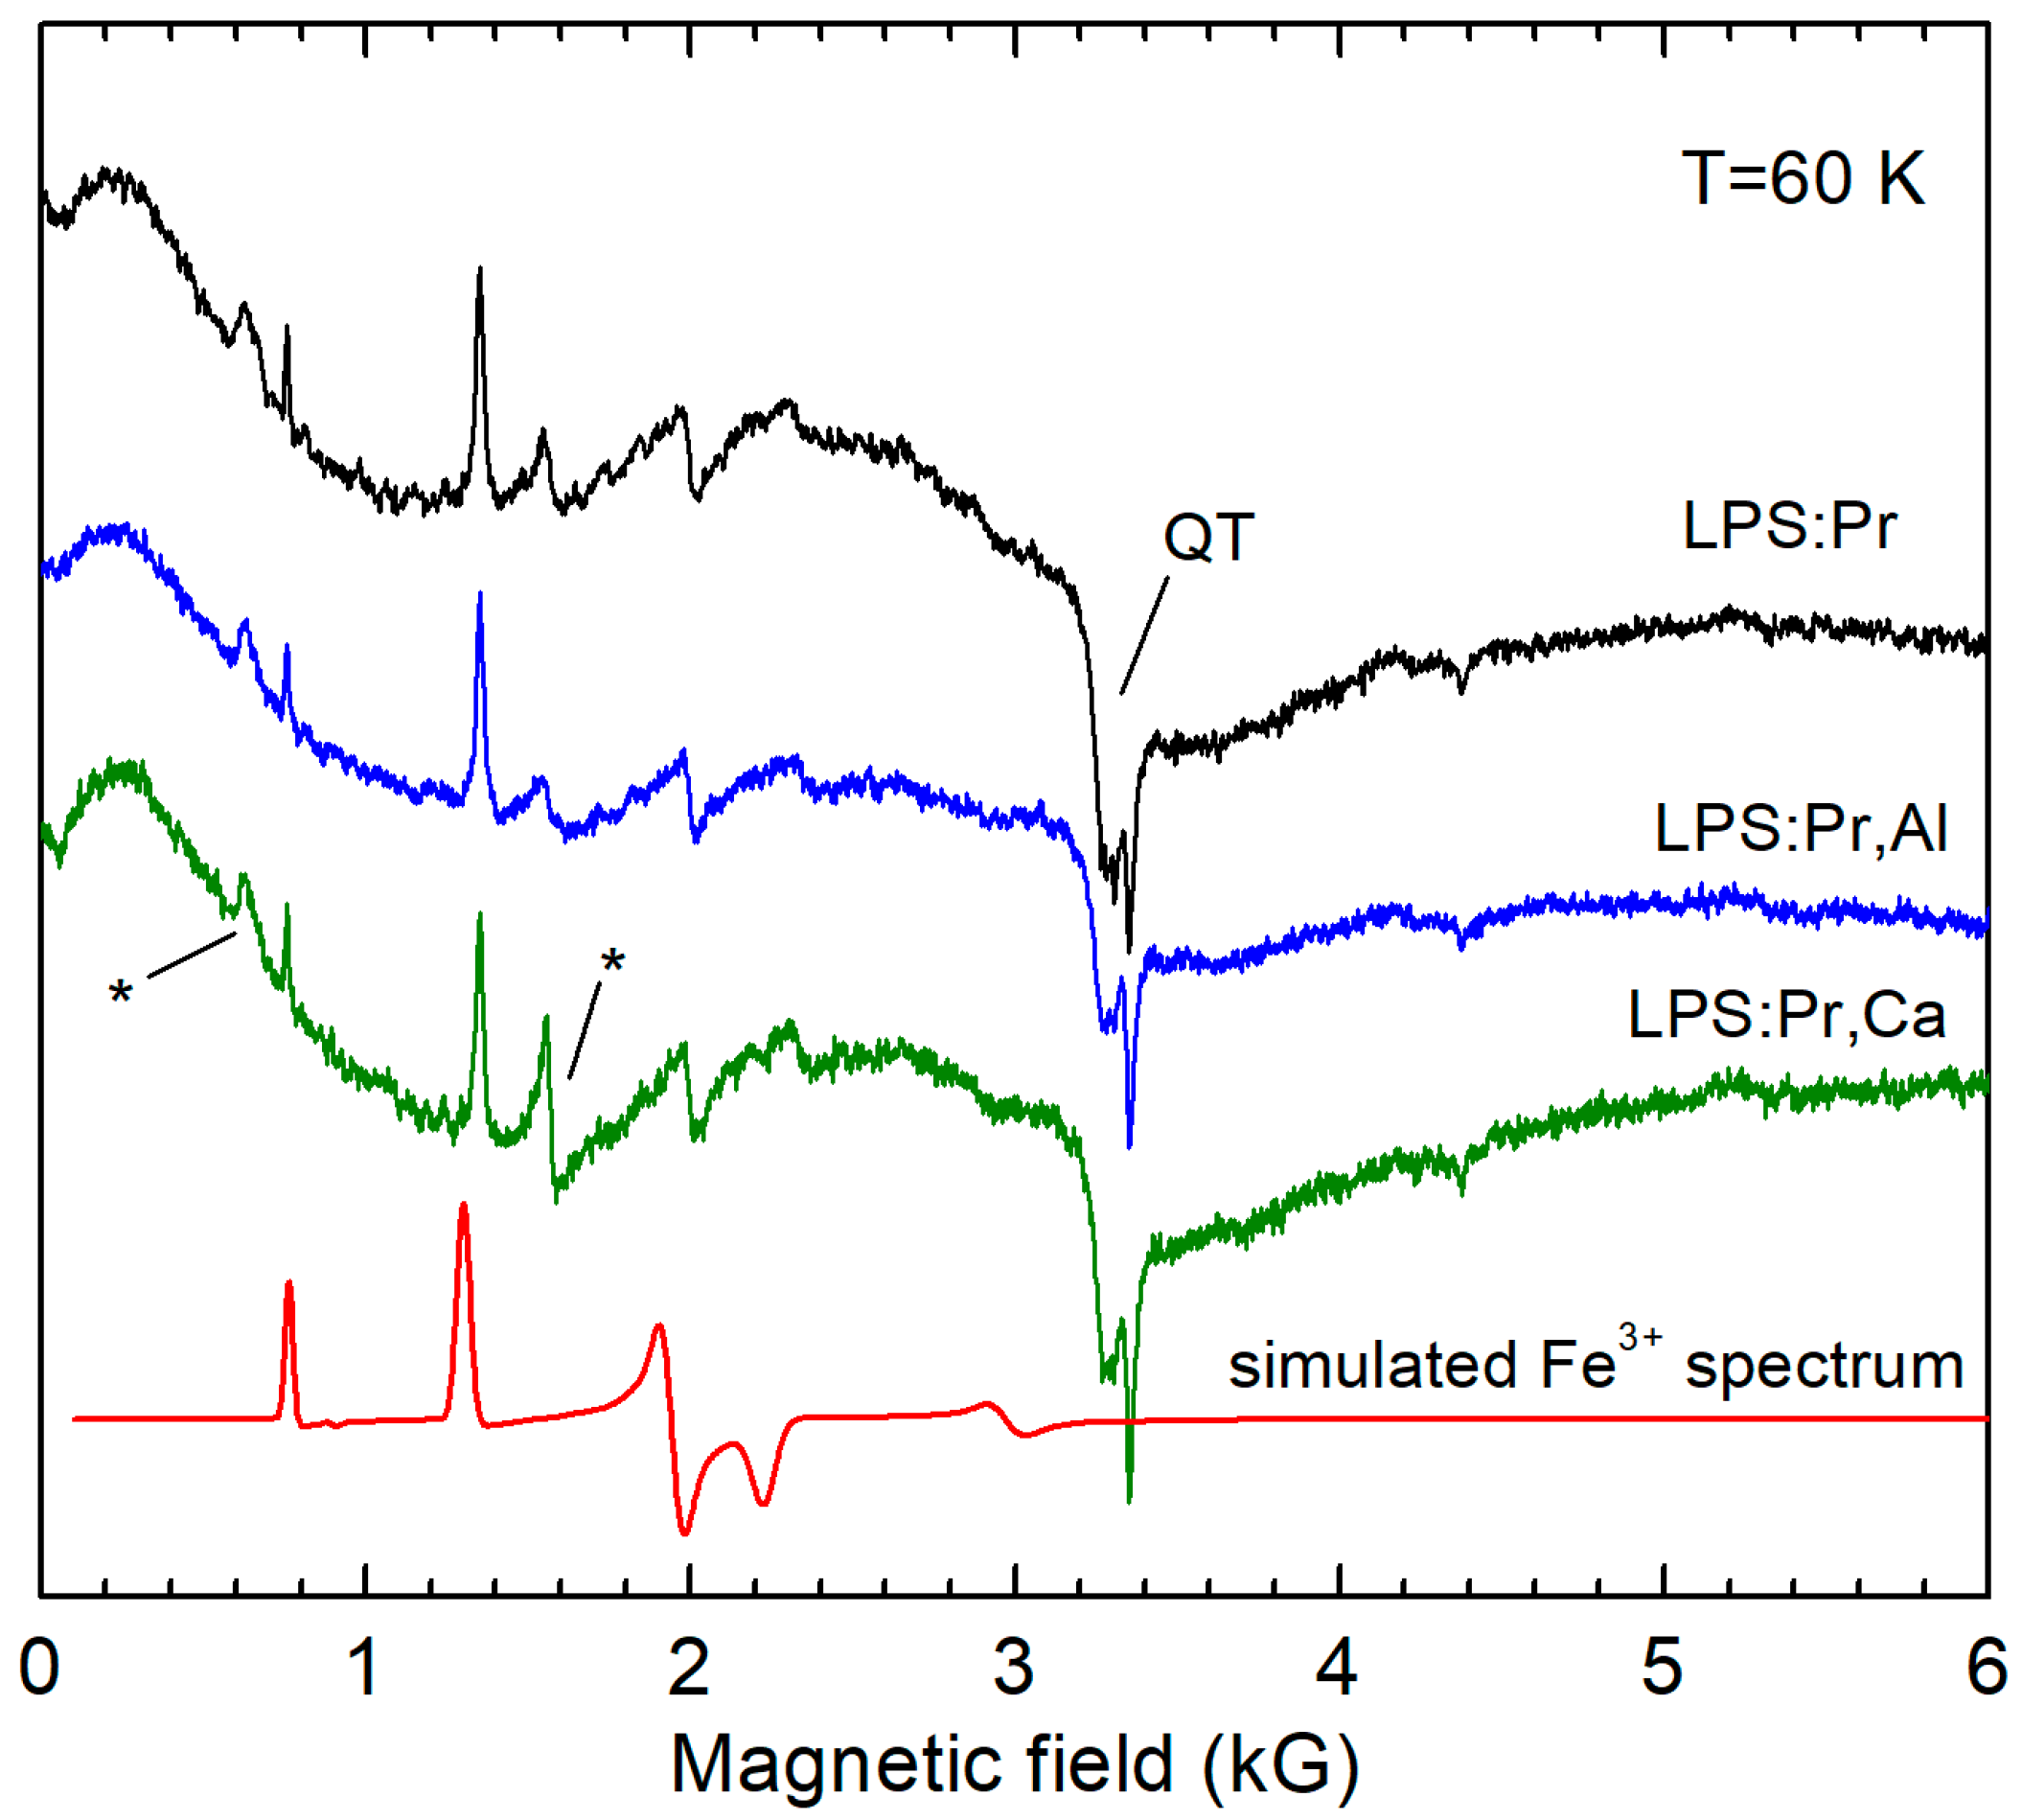
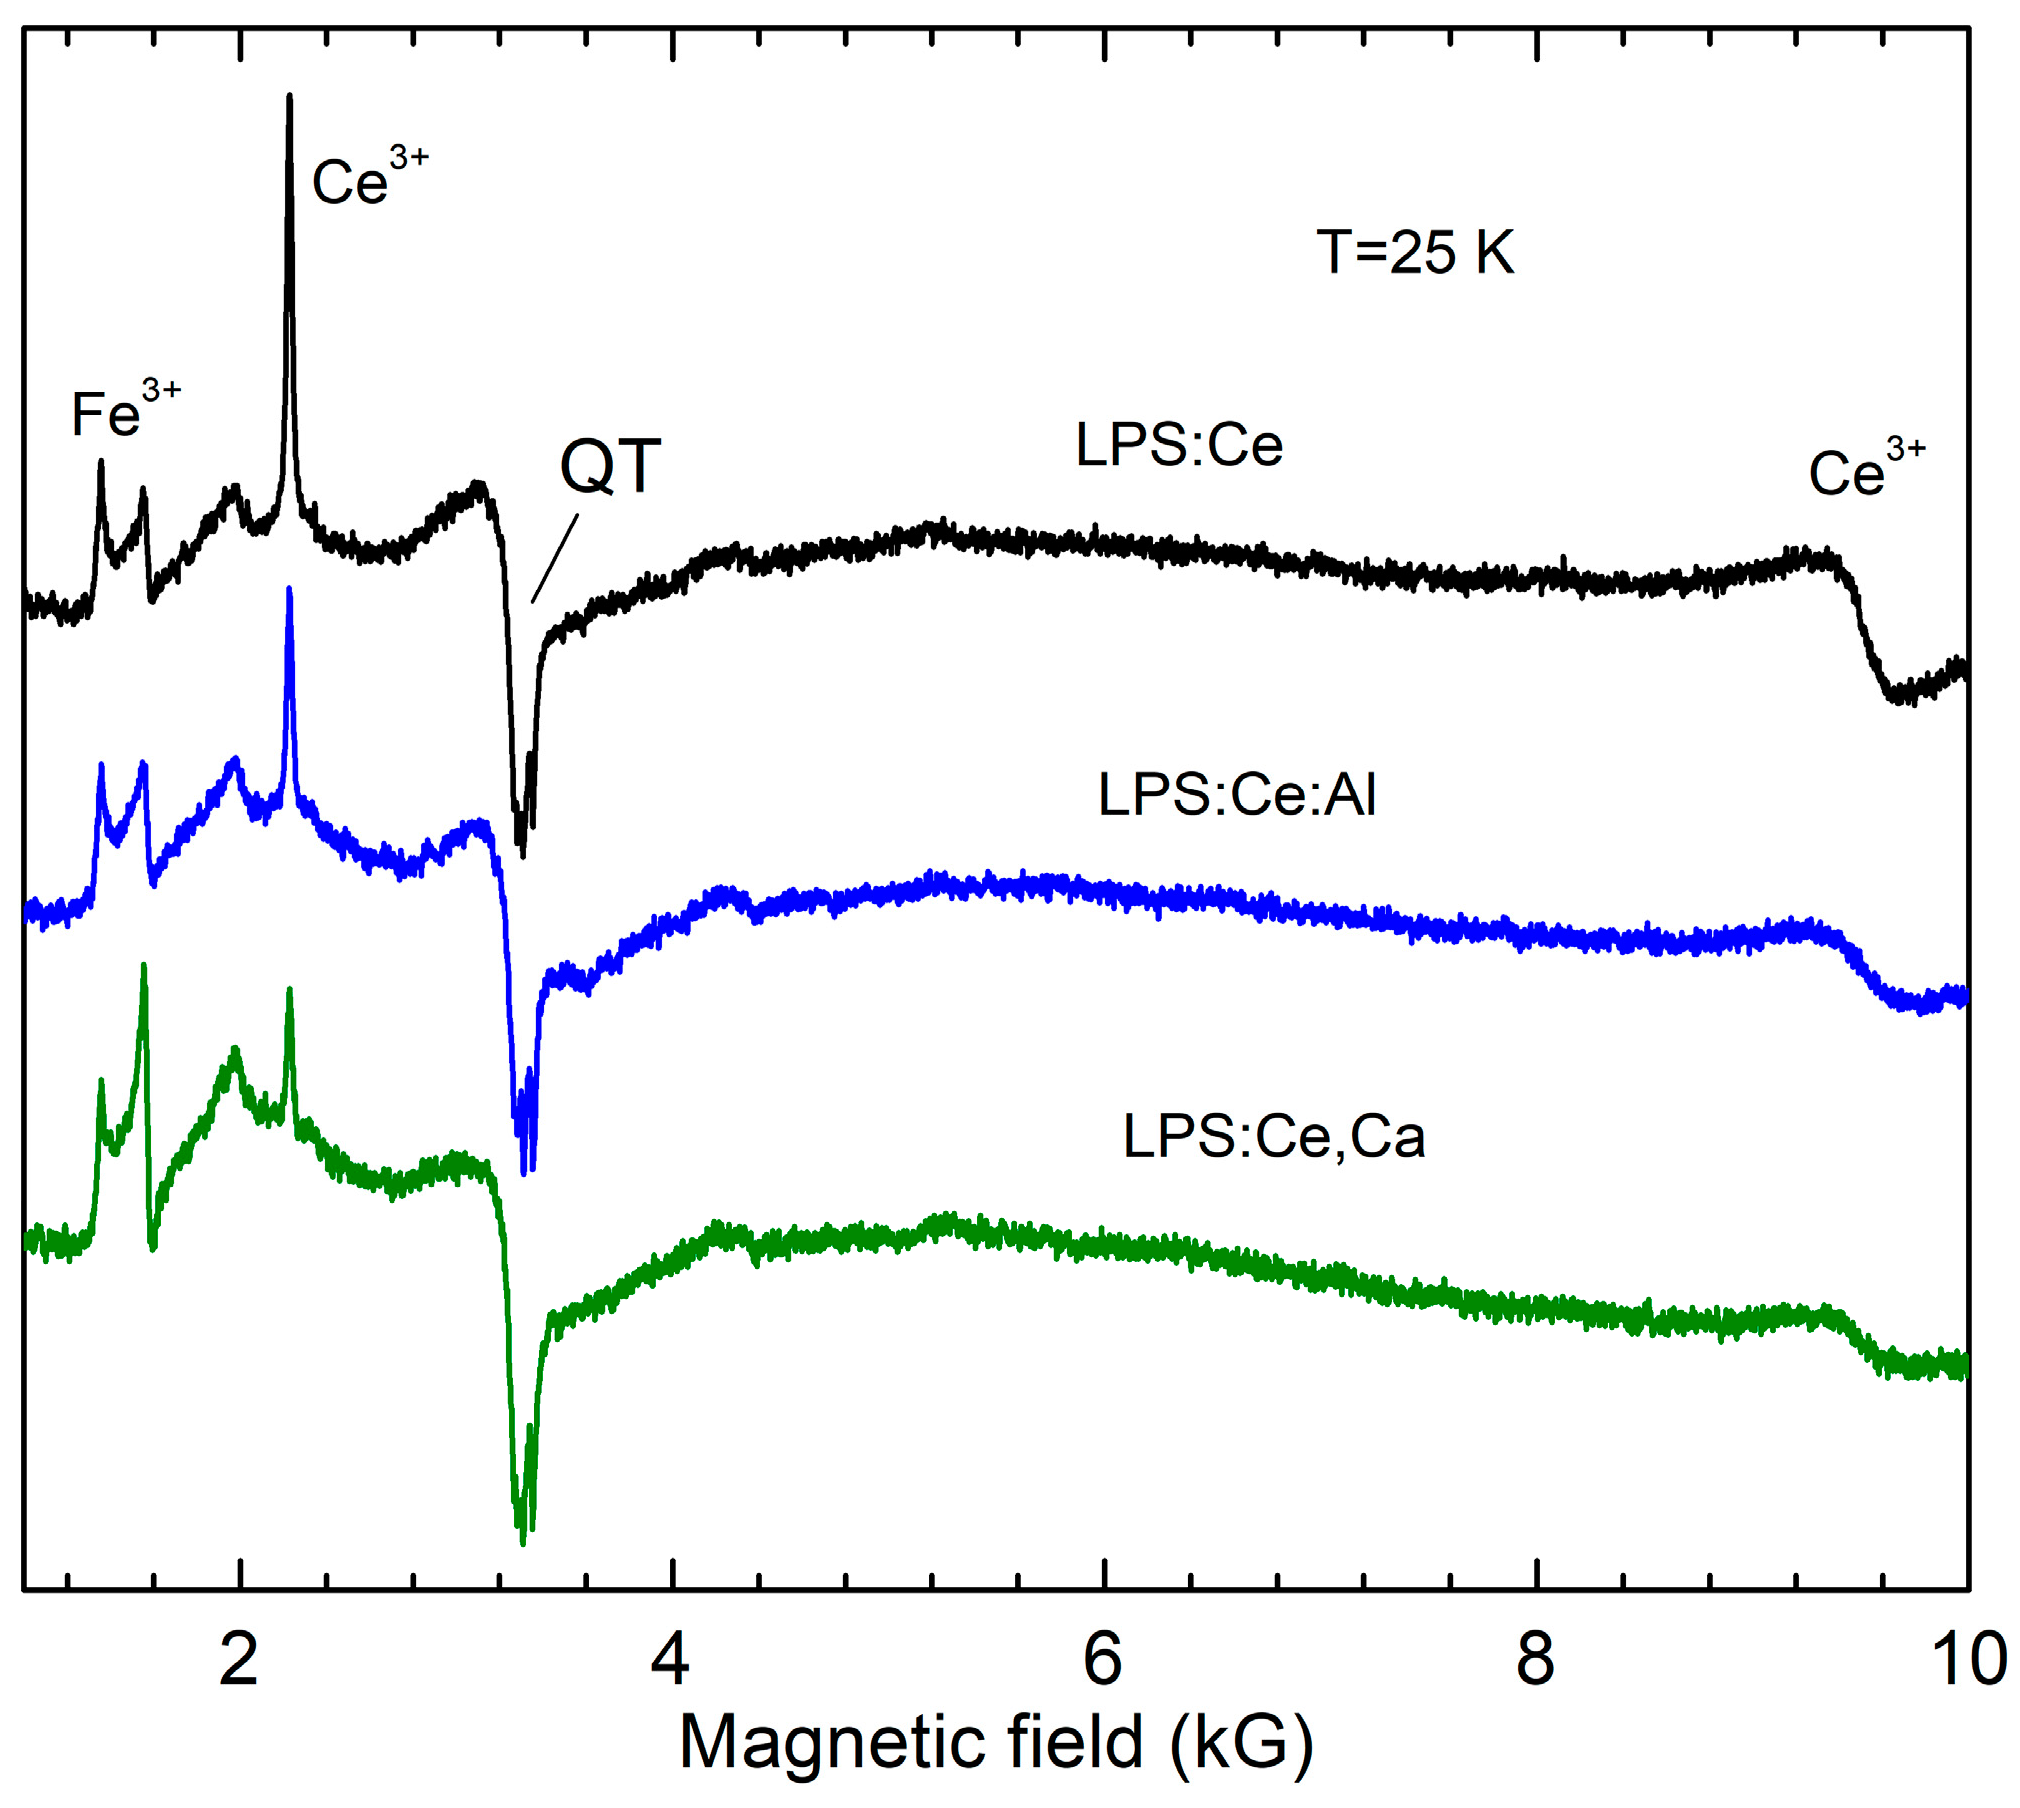
The EPR spectra measured in LPS:Pr, LPS:Pr,Al, and LPS:Pr,Ca powders are presented in Figure 3. As in the case of Pr-doped LSO samples, only Fe3+ ions were detected in EPR spectra. The spectral parameters of these ions in the LPS lattice (obtained from the simulation of the Fe3+ powder spectrum) are listed in Table 2. In contrast to the Pr-doped LSO, no change in the Fe3+ concentration was observed in LPS. However, in Ce-doped LPS (Figure 4), the Fe3+ concentration markedly increased with Ca co-doping. The Ce3+ spectral lines were identified according to the data published in [25,28]. The Ce3+ concentration markedly decreases with Al and Ca co-doping. The effect of the co-doping is especially large for the Ca co-dopant, similar LSO:Ce, indicating an effective Ce3+  Ce4+ conversion.

3.3. EPR Spectra Created by X-ray Irradiation in LPS:Ce, LPS:Pr, LSO:Ce, and LSO:Pr Co-doped with Ca2+ or Al3+ and Comparison with TSL

The effect of Al and Ca co-doping on the hole and electron trapping processes was investigated in X-ray-irradiated LPS:Ce(Pr) and LSO:Ce(Pr) samples via EPR measurements of X-ray-irradiation-induced paramagnetic centers and with TSL measurements. These measurements showed formation of O hole centers (a hole trapped at an oxygen ion) stabilized by Al3+ or Ca2+ ions at Si4+ or Lu3+ sites in LPS samples, respectively. Figure 5 illustrates the O EPR spectra created by X-ray irradiation at 295 K for selected samples.
The interpretation of these O spectra is based on our detailed study of the O centers in LPS:Ce and LPS:Pr crystals [21]. In particular, the O EPR spectra are mainly constructed from unresolved hyperfine components from 175Lu isotopes (nuclear spin I = 7/2, 97.4% natural abundance). In single crystal samples, the hyperfine structure of 175Lu isotopes is clearly observed [21]. As can be seen from Figure 5a,b, X-ray irradiation creates the same spectrum in both LPS:Ce and LPS:Ce,Al samples. However, the spectral intensity is much higher in the LPS:Ce,Al sample, suggesting that O centers are created near Al3+ impurities (Al3+ at Si4+ sites stabilizes the trapped hole in the neighboring oxygen lattice ion). Such hole centers are usually called bound small polarons [29]. The nominally Al undoped LPS:Ce probably also contains small amounts of the same O–Al centers, as powders were synthesized in an Al2O3 boat at 1500–1600 °C. It is assumed that the trapped hole interacts with the nuclear spins of the two nearest Lu ions and the nuclear spin of Al impurities. Together with the g factor anisotropy, this creates quite a complex spectral pattern which cannot realistically be simulated due to many unknown parameters. Therefore, this center was characterized in this work only by its average g factor value measured at the center of gravity of the spectral line (Table 2).
In the case of Ca co-doping, the Ca2+ ion at the Lu3+ site also serves as a stabilizing defect for the hole trapped at an oxygen ion. In the O–Ca centers, trapped holes interact only with the nuclear spin of one Lu ion (Ca has no isotopes with non-zero nuclear spins and the 29Si isotope only has a small natural abundance of 4.67%) and the O spectral line in the LPS:Ce,Ca sample is narrow (Figure 5c). Its shape can be easily simulated including the 175Lu hyperfine interaction (green solid line in Figure 5c and parameters in Table 2).
X-ray irradiation of Pr-doped LPS also created O hole centers. However, their EPR spectrum is broad (Figure 5d) and could not be qualitatively analyzed. O centers in LPS created by X-ray irradiation at room temperature are thermally stable to about 350 K, but their concentration slowly decreases even at room temperature (Figure 5e). They completely disappear at annealing temperatures of ~450–500 K (see also ref. [21]). This correlates well with the main TSL peak at 440–480 K created by X-ray irradiation measured in the same samples (Figure 6a,b). This TSL peak is broad and contains contributions from several traps [19,30], not all of them being paramagnetic. A complete fitting of the TSL peaks is presented in refs. [19,20,30]. Therefore, in general, the intensity of TSL does not correlate exactly with the intensity of the EPR spectra. On the other hand, one can notice that the TSL intensity is much higher in the Al-co-doped LPS:Pr sample as compared to the Al-free sample (Figure 6b).
Surprisingly, no X-ray-created paramagnetic active centers were detected in LSO samples even after irradiation at 77 K. TSL measurements revealed a weak glow peak at ≈110 K (Figure 6c), indicating an effective (practically full) recombination of electron–hole pairs at activator ions. This contradicts the data obtained in measurements of LSO:Ce single crystals, where a sequence of intense glow peaks was observed at 350–600 K [11,20]. To explain the nature of the corresponding charge traps, the authors of ref. [20] proposed a model where Ce3+ serves as the charge donor, the recombination center, and also the trap creating center. The traps are related to specific configurations of oxygen ions around the central Ce3+ ion. Each configuration is able to trap the 5d electron in a metastable electronic state, with mixed Ce3+ 5d and O2− orbitals at the same time creating a hole state near or at the Ce ion. According to our EPR data, the hole state is the O ion rather than the Ce4+ ion, but both may exist depending on the presence of other defects in the surrounding lattice.

3.4. Scintillation Decay Time Measurements

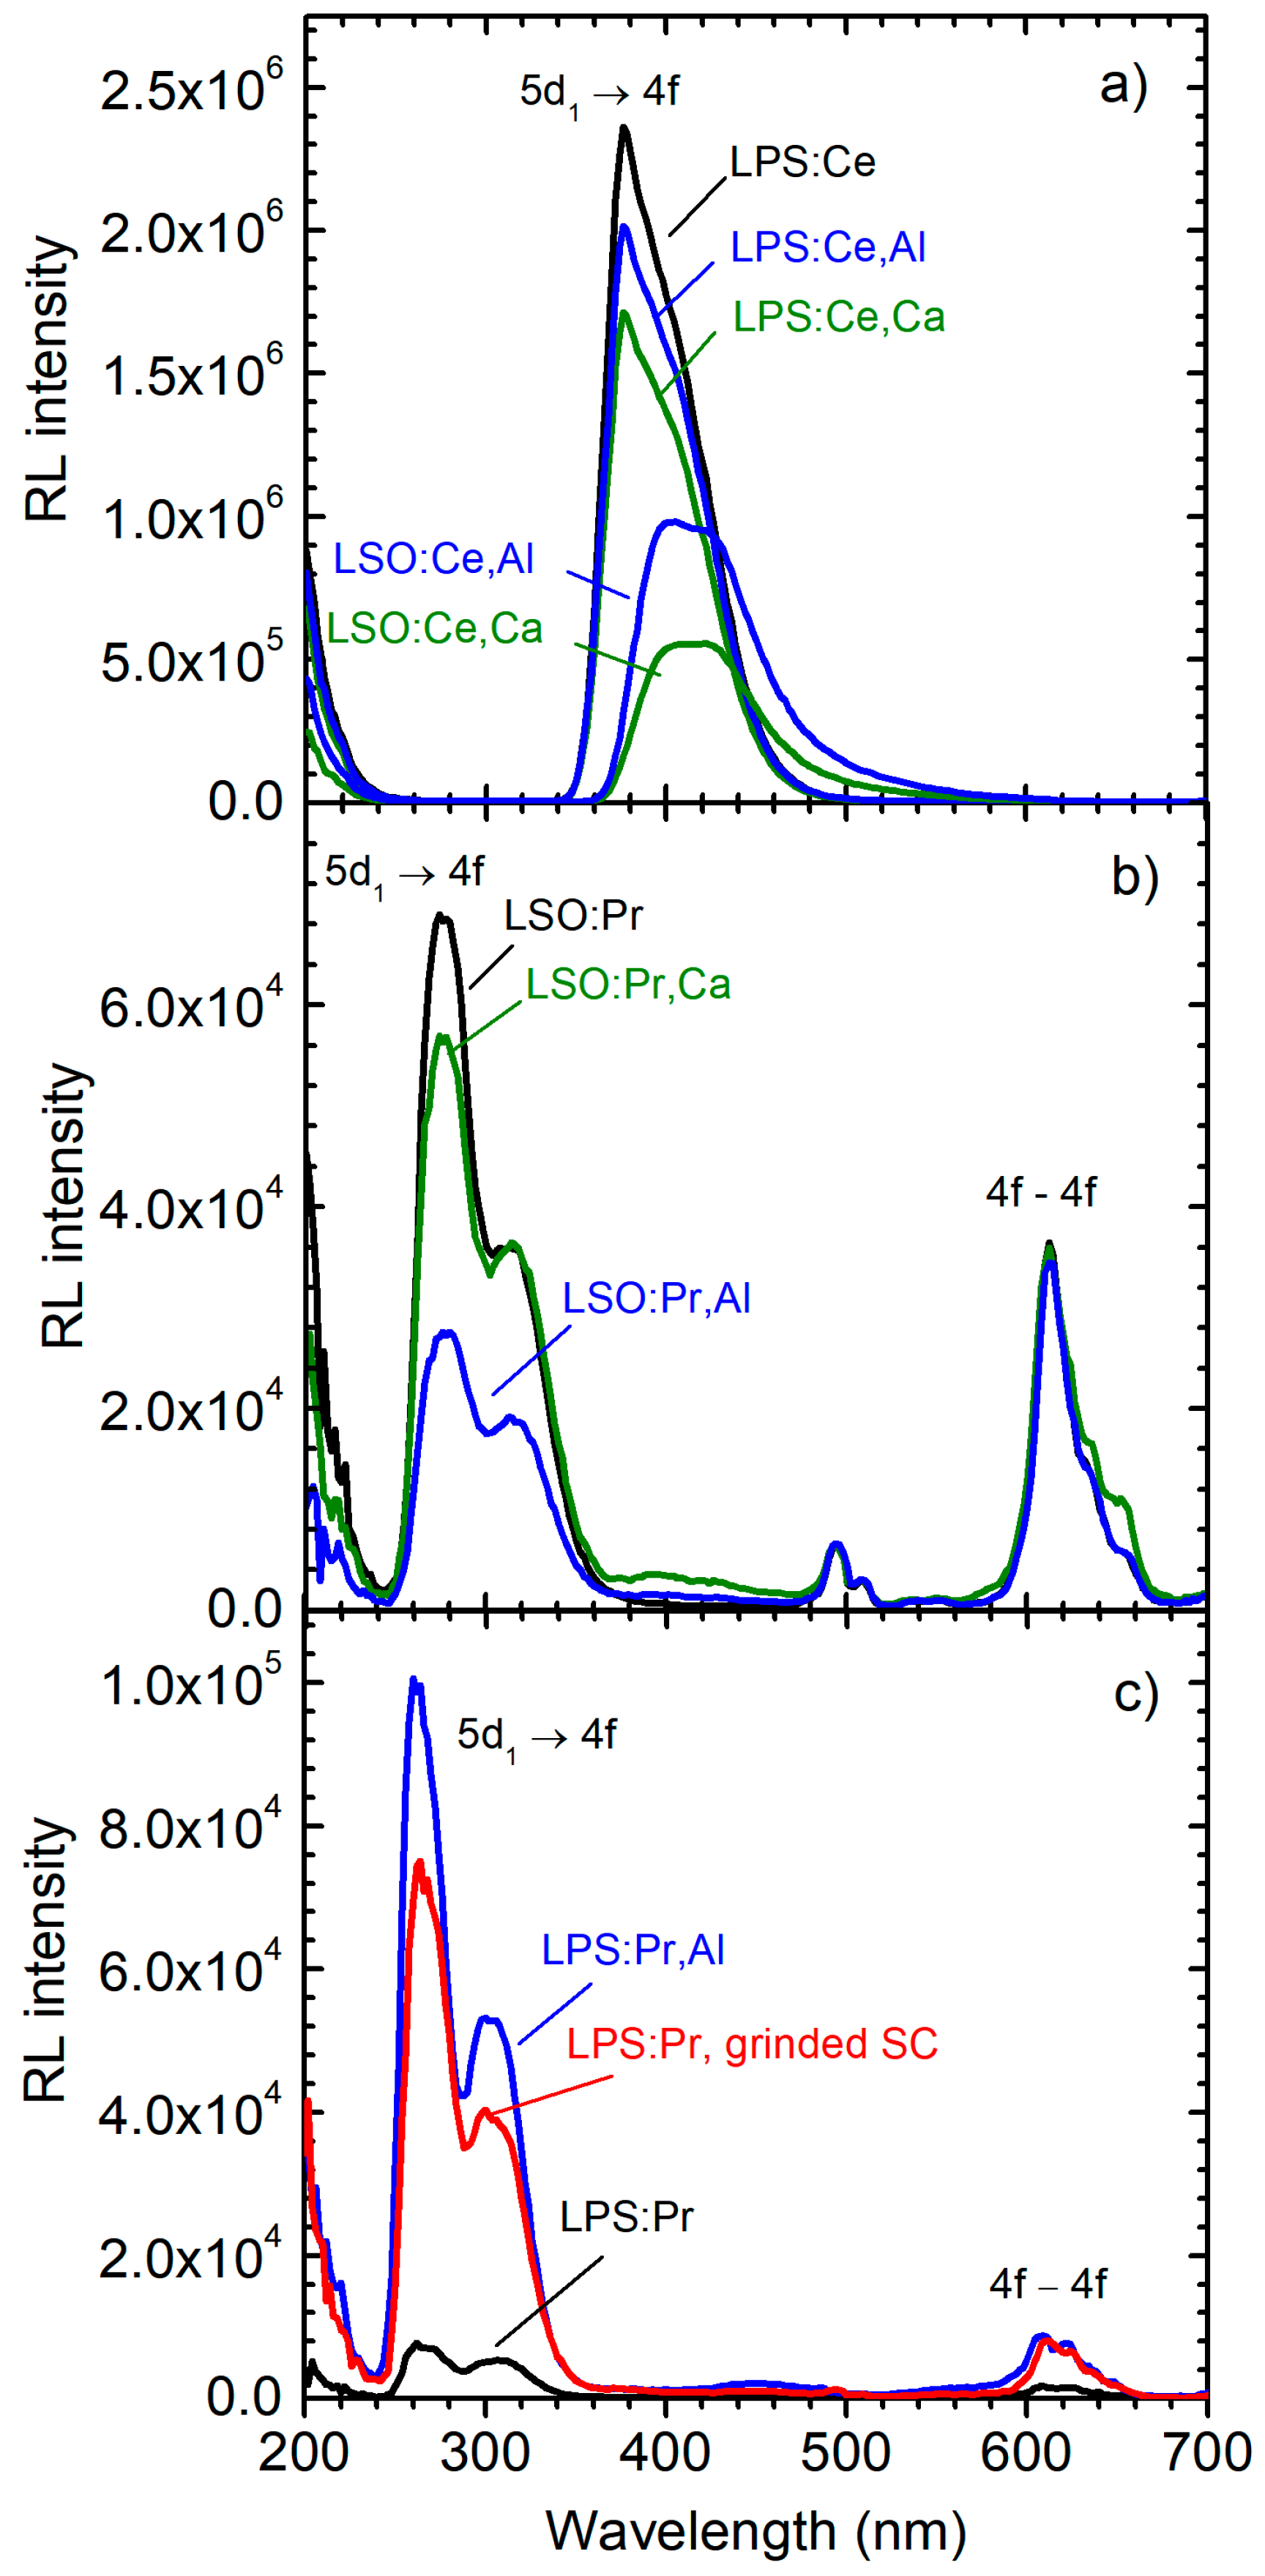
For selected samples, radioluminescence and scintillation decay curves within two time windows of 50 ns and 2 μs were measured at 296 K. The emission spectra of LPS:Ce samples (Figure 7a) are characterized by intense Ce-related bands with maxima located at about 380 nm in all samples. The emission intensity is largest in the non-co-doped sample and decreases by about 1.2-fold in the Al-co-doped sample and by 1.4-fold in the Ca-co-doped sample. In LSO:Ce samples, the Ce-related emission bands have maxima at about 405 nm; the intensity is the highest in the Al-co-doped sample while that of the Ca-co-doped it is about 2 times lower.
The spectra of LSO:Pr (Figure 7b) are dominated by the 5d–4f doublet emission peak with maxima at about 280 nm. Weaker 4f–4f transitions can be observed at longer wavelengths at around 610 nm. The emission spectra of LPS:Pr samples (Figure 7c) are similar to those of LSO:Pr, but the main 5d–4f emission peak is shifted to 260 nm and the 4f–4f transitions are much weaker. Although co-doping does not influence the spectral position of the emission bands, it markedly changes the RL emission intensity.
In order to study the influence of co-doping on scintillation kinetics characteristics, the ps-pulsed X-ray excited decay curves were measured with an ultra-high time resolution, and the results are shown in Figure 8.
All experimental decay curves were fitted using a bi-exponential function and the calculated parameters are presented in Table 3. The measurements showed, along with the conventional 33–38 ns decay component in the Ce-doped samples, a second fast component with the decay time of only about 11 ns. On the contrary, in the Pr-doped samples, along with the conventional fast decay component 13–14 ns, a second slower component (30–31 ns) is presented. The origin of the second components is unclear. To the best of our knowledge, the fast 11 ns scintillation decay component in Ce-doped LSO and LPS has never been observed before and this result needs further detailed investigation. For comparison, the decay curve of the LPS:Ce single crystal grinded into a powder can be fitted using a single exponential function (Figure 8d).
The changes in the decay time values due to co-doping are almost negligible. However, some common tendencies could be observed. The values of both fast and slow decay components demonstrate a mild decrease with the following sequence: non-co-doped → Al-co-doped → Ca-co-doped samples (e.g., compare τ1 component in LPS:Ce: 11.5 → 11.4 → 10.8 ns).

4. Conclusions

Single-phase powder samples of Lu2SiO5 (space group C2/c) and Lu2Si2O7 (space group C2/m) doped with 2000 ppm Ce (or Pr) and co-doped with 5000 ppm Al/Si or 5000 ppm Ca/Lu were prepared by the conventional solid-state reaction process. The phase purity was confirmed by X-ray diffraction measurements.
Detailed EPR measurements of LSO:Ce revealed a substantial (three-fold) decrease in the Ce3+ concentration in Ca-co-doped samples, confirming the effective Ce3+  Ce4+ conversion, while the effect of Al co-doping (Al3+ substituted for Si4+) was much smaller, at only a 15–20% decrease.
On the contrary, EPR measurements in LPS:Ce, LPS:Ce,Al, and LPS:Ce,Ca samples revealed approximately the same decrease in Ce3+ concentration (2–3 times) in both the Al- and Ca-co-doped samples (again with a stronger effect for Ca-co-doped sample), suggesting that the crystal structure and different number of chemical bonds with oxygen ions in LSO and LPS influences the charge balance and charge transfer between doping ions.
In both LSO and LPS samples, accidental Fe3+ impurities were detected by EPR. The Fe3+ EPR intensity changed under Ca and Al co-doping, indicating participation of the Fe3+ ions in the charge transfer processes induced by Ca and Al co-doping.
EPR measurements in the Pr-doped LSO and LPS did not reveal possible Pr3+  Pr4+ conversions stimulated by Al and Ca co-doping, despite the fact that the Pr4+ ion has the same electron shell as Ce3+ and, consequently, it should be clearly observed by EPR. This suggests that the charge compensation of Al3+ and Ca2+ ions is mainly realized via participation of other impurities and/or lattice defects.
X-ray irradiation of Ce- and Pr-doped LPS creates O centers attributed to a hole trapped at an oxygen ion in the neighborhood of Al3+ and Ca2+ ions. These hole centers are reasonably thermally stable up to about 400 K. They contribute to intense TSL glow peaks at 450–470 K. On the other hand, only a weak TSL peak was visible in all LSO samples at T ≈ 110 K and no paramagnetic active centers were detected via EPR after X-ray irradiation despite the intense radioluminescence. This suggests effective (practically full) recombination of electron–hole pairs at activator ions.
The X-ray-excited scintillation decay curves were measured for both LSO and LPS samples and could be approximated by a bi-exponential function. The measurements showed, along with the conventional dominating 33–38 ns decay component in Ce-doped LSO and LPS, the presence of a second fast component with a decay time of only about 11 ns. The origin of the latter component is unclear and needs further detailed investigations. On the contrary, in the Pr-doped samples, along with the usual fast decay component of 13–15 ns, a second slower component of 30–31 ns is present. Only a weak acceleration of the scintillation decay (6–8%) is found for the fast component in the Ca- and Al-co-doped samples. For the slower component, the acceleration is negligibly small.

Supplementary Materials

The following supporting information can be downloaded at: https://www.mdpi.com/article/10.3390/ma16124488/s1.

Author Contributions

Conceptualization, J.P. and M.N.; Methodology, J.B.; Validation, L.H. and J.P.; Formal analysis, V.B. and J.B.; Investigation, V.L., L.H. and V.B.; Writing—original draft, V.L.; Writing—review & editing, M.N. All authors have read and agreed to the published version of the manuscript.

Funding

This research was funded by the Czech Science Foundation project GA20-12885S.

Institutional Review Board Statement

Not applicable.

Informed Consent Statement

Not applicable.

Data Availability Statement

Data are contained within the article.

Acknowledgments

This work was supported by the Czech Science Foundation project GA20-12885S.

Conflicts of Interest

The authors declare no conflict of interest.

References

  1. Rodnyi, P.A. Physical Processes in Inorganic Scintillators; CRC Press: Boca Raton, FL, USA, 1997. [Google Scholar]
  2. Dujardin, C.; Auffray, E.; Bourret-Courchesne, E.; Dorenbos, P.; Lecoq, P.; Nikl, M.; Vasil’ev, A.N.; Yoshikawa, A.; Zhu, R.-Y. Needs, trends, and advances in inorganic scintillators. IEEE Trans. Nukl. Sci. 2018, 65, 1977–1997. [Google Scholar] [CrossRef] [Green Version]
  3. Wei, Q.; Shi, H.; Zhou, Z.; Liu, G.; Chen, Z.; Qin, L.; Shu, K.; Liu, Q. A study on the structure, luminescence and thermos-stability of polycrystalline Gd2Si2O7:Ce and (Gd,La)2Si2O7:Ce. J. Mater. Chem. C 2017, 5, 1443–1451. [Google Scholar] [CrossRef]
  4. Kantuptim, P.; Akatsuka, M.; Nakauchi, D.; Kato, T.; Kawaguchi, N. Scintillation properties of Pr-doped Lu2Si2O7 single crystal. Radiat. Meas. 2020, 134, 106320. [Google Scholar] [CrossRef]
  5. Lopez, L.; Pichon, P.; Loiseau, P.; Viana, B.; Mahiou, R.; Druon, F.; Georges, P.; Balembois, F. Ce:LYSO, from scintillator to solid-state lighting as a blue luminescent concentrator. Sci. Rep. 2023, 13, 7199. [Google Scholar] [CrossRef]
  6. Kantuptim, P.; Fukushima, H.; Kimura, H.; Nakauchi, D.; Kato, T.; Koshimizu, M.; Kawaguchi, N.; Yanagida, T. VUV- and X-ray-induced properties of Lu2Si2O7, Y2Si2O7, and Gd2Si2O7 single crystals. Sens. Mater. 2021, 33, 2195–2201. [Google Scholar] [CrossRef]
  7. Van Eijk, C.W.E. Inorganic scintillators in medical imaging. Phys. Med. Biol. 2002, 47, R85–R106. [Google Scholar] [CrossRef] [PubMed]
  8. Blahuta, S.; Bessière, A.; Viana, B.; Dorenbos, P.; Ouspenski, V. Evidence and consequences of Ce4+ in LYSO:Ce,Ca and LYSO:Ce,Mg single crystals for medical imaging applications. IEEE Trans. Nucl. Sci. 2013, 60, 3134–3141. [Google Scholar] [CrossRef]
  9. Wu, Y.; Peng, J.; Rutstrom, D.; Koschan, M.; Foster, C.; Melcher, C.L. Unraveling the critical role of site occupancy of lithium codopants in Lu2SiO5:Ce3+ single-crystalline scintillators. ACS Appl. Mater. Interfaces 2019, 11, 8194–8201. [Google Scholar] [CrossRef]
  10. Tian, J.; Xie, J.; Zhuang, W. Recent advances in multi-site luminescence materials: Design, identification and regulation. Materials 2023, 15, 2179. [Google Scholar] [CrossRef]
  11. Yang, K.; Melcher, C.L.; Rack, P.D.; Eriksson, L.A. Effects of calcium codoping on charge traps in LSO:Ce crystals. IEEE Trans. Nukl. Sci. 2009, 56, 2960–2965. [Google Scholar] [CrossRef]
  12. Spurrier, M.A.; Szupryczynski, P.; Yang, K.; Carey, A.A.; Melcher, C.L. Effect of Ca2+ co-doping on the scintillation properties of LSO:Ce. IEEE Trans. Nukl. Sci. 2008, 55, 1178–1182. [Google Scholar] [CrossRef]
  13. Ferrand, B.; Viana, B.; Pidol, L.; Dorenbos, P. Dense High-speed Scintillator Material of Low Afterglow. U.S. Patent 8,574,458 B2, 5 November 2013. [Google Scholar]
  14. Xue, Z.; Chen, L.; Zhao, S.; Yang, F.; An, R.; Wang, L.; Sun, Y.; Feng, H.; Ding, D. Enhancement of scintillation properties of LYSO:Ce crystals by Al codoping. Cryst. Growth Des. 2023, 23, 4562–4570. [Google Scholar] [CrossRef]
  15. Takasugi, T.; Yokota, Y.; Horiai, T.; Yoshino, M.; Yamaji, A.; Ohashi, Y.; Kurosawa, S.; Kamada, K.; Babin, V.; Nikl, M.; et al. Al-doping effects on mechanical, optical and scintillation properties of Ce:(La,Gd)2Si2O7 single crystals. Opt. Mater. 2019, 87, 11–15. [Google Scholar] [CrossRef]
  16. Pidol, L.; Kahn-Harari, A.; Viana, B.; Ferrand, B.; Dorenbos, P.; de Hass, J.T.M.; van Eijk, C.W.E.; Virey, E. Properties of Lu2Si2O7:Ce3+, a fast and efficient scintillator crystal. J. Phys. Condens. Matter 2003, 15, 2091–2102. [Google Scholar] [CrossRef]
  17. He, F.; Guohao, R.; Yuntao, W.; Jun, X.; Qiuhong, Y.; Jianjun, X.; Mitch, C.; Chenlong, C. Optical and thermoluminescence properties of Lu2Si2O7:Pr single crystal. J. Rare Earths 2012, 30, 775–779. [Google Scholar]
  18. Laguta, V.V.; Buryi, M.; Rosa, J.; Savchenko, D.; Hybler, J.; Nikl, M.; Zazubovich, S.; Karner, T.; Stanek, C.R.; McClellan, K.J. Electron and hole traps in yttrium orthosilicate single crystals: The critical role of Si-unbound oxygen. Phys. Rev. B 2014, 90, 64104. [Google Scholar] [CrossRef]
  19. Mihóková, E.; Fasoli, M.; Moretti, F.; Nikl, M.; Jary, V.; Ren, G.; Vedda, A. Defect states in Pr3+ doped lutetium pyrosilicate. Opt. Mater. 2012, 34, 872–877. [Google Scholar] [CrossRef]
  20. Dorenbos, P.; van Eijk, C.W.E.; Bos, A.J.J.; Melcher, C.L. Afterglow and thermoluminescence properties of Lu2SiO5:Ce scintillation crystals. J. Phys. Condens. Matter 1994, 6, 4167. [Google Scholar] [CrossRef]
  21. Laguta, V.; Buryi, M.; Wu, Y.; Ren, G.; Nikl, M. Electron and hole trapping in Ce3+- and Pr3+-doped lutetium pyrosilicate scintillation crystals studied by electron paramagnetic resonance. Phys. Rev. Appl. 2020, 13, 044060. [Google Scholar] [CrossRef]
  22. Aykol, M.; Montoya, J.H.; Hummelshoj, J. Rational solid-state synthesis routes for inorganic materials. J. Am. Chem. Soc. 2021, 143, 9244–9259. [Google Scholar] [CrossRef]
  23. Gustafsson, T.; Klintenberg, M.; Derenzo, S.E.; Weber, M.J.; Thomas, J.O. Lu2SiO5 by single-crystal X-ray and neutron diffraction. Acta Crystallog. C 2001, 57, 669. [Google Scholar] [CrossRef]
  24. Bretheau-Raynal, F.; Lance, M.; Charpin, P. Crystal data for Lu2Si2O7. J. Appl. Cryst. 1981, 14, 349–350. [Google Scholar] [CrossRef]
  25. Pidol, L.; Guillot-Noël, O.; Kahn-Harari, A.; Viana, B.; Pelenc, D.; Gourier, D. EPR study of Ce3+ ions in lutetium silicate scintillators Lu2Si2O7 and Lu2SiO5. J. Phys. Chem. Solids 2006, 67, 643–650. [Google Scholar] [CrossRef]
  26. Pilbrow, J.R. Transition Ion Electron Paramagnetic Resonance; Clarendon Press: Oxford, UK, 1990. [Google Scholar]
  27. Abragam, A.; Bleaney, B. Electron Paramagnetic Resonance of Transition Ions; Clarendon Press: Oxford, UK, 1970. [Google Scholar]
  28. Buryi, M.; Laguta, V.; Babin, V.; Laguta, O.; Brik, M.G.; Nikl, M. Rare-earth ions incorporation into Lu2Si2O7 scintillator crystals: Electron paramagnetic resonance and luminescence study. Opt. Mater. 2020, 106, 109930. [Google Scholar] [CrossRef]
  29. Schirmer, O.F. O bond small polarons in oxides materials. J. Phys. Condens. Matter 2006, 18, R667. [Google Scholar] [CrossRef]
  30. Feng, H.; Ding, D.; Li, H.; Lu, S.; Pan, S.; Chen, X.; Ren, G. Annealing effects on Czochralski grown Lu2Si2O7:Ce3+ crystals under different atmospheres. J. Appl. Phys. 2008, 103, 083109. [Google Scholar] [CrossRef]
  31. Pidol, L.; Viana, B.; Kahn-Harari, A.; Bessiere, A.; Dorenbos, P. Luminescence properties and scintillation mechanisms of Ce3+-, Pr3+- and Nd3+-doped lutetium pyrosilicate. Nukl. Instr. Methods Phys. Res. A 2005, 537, 125–129. [Google Scholar] [CrossRef]
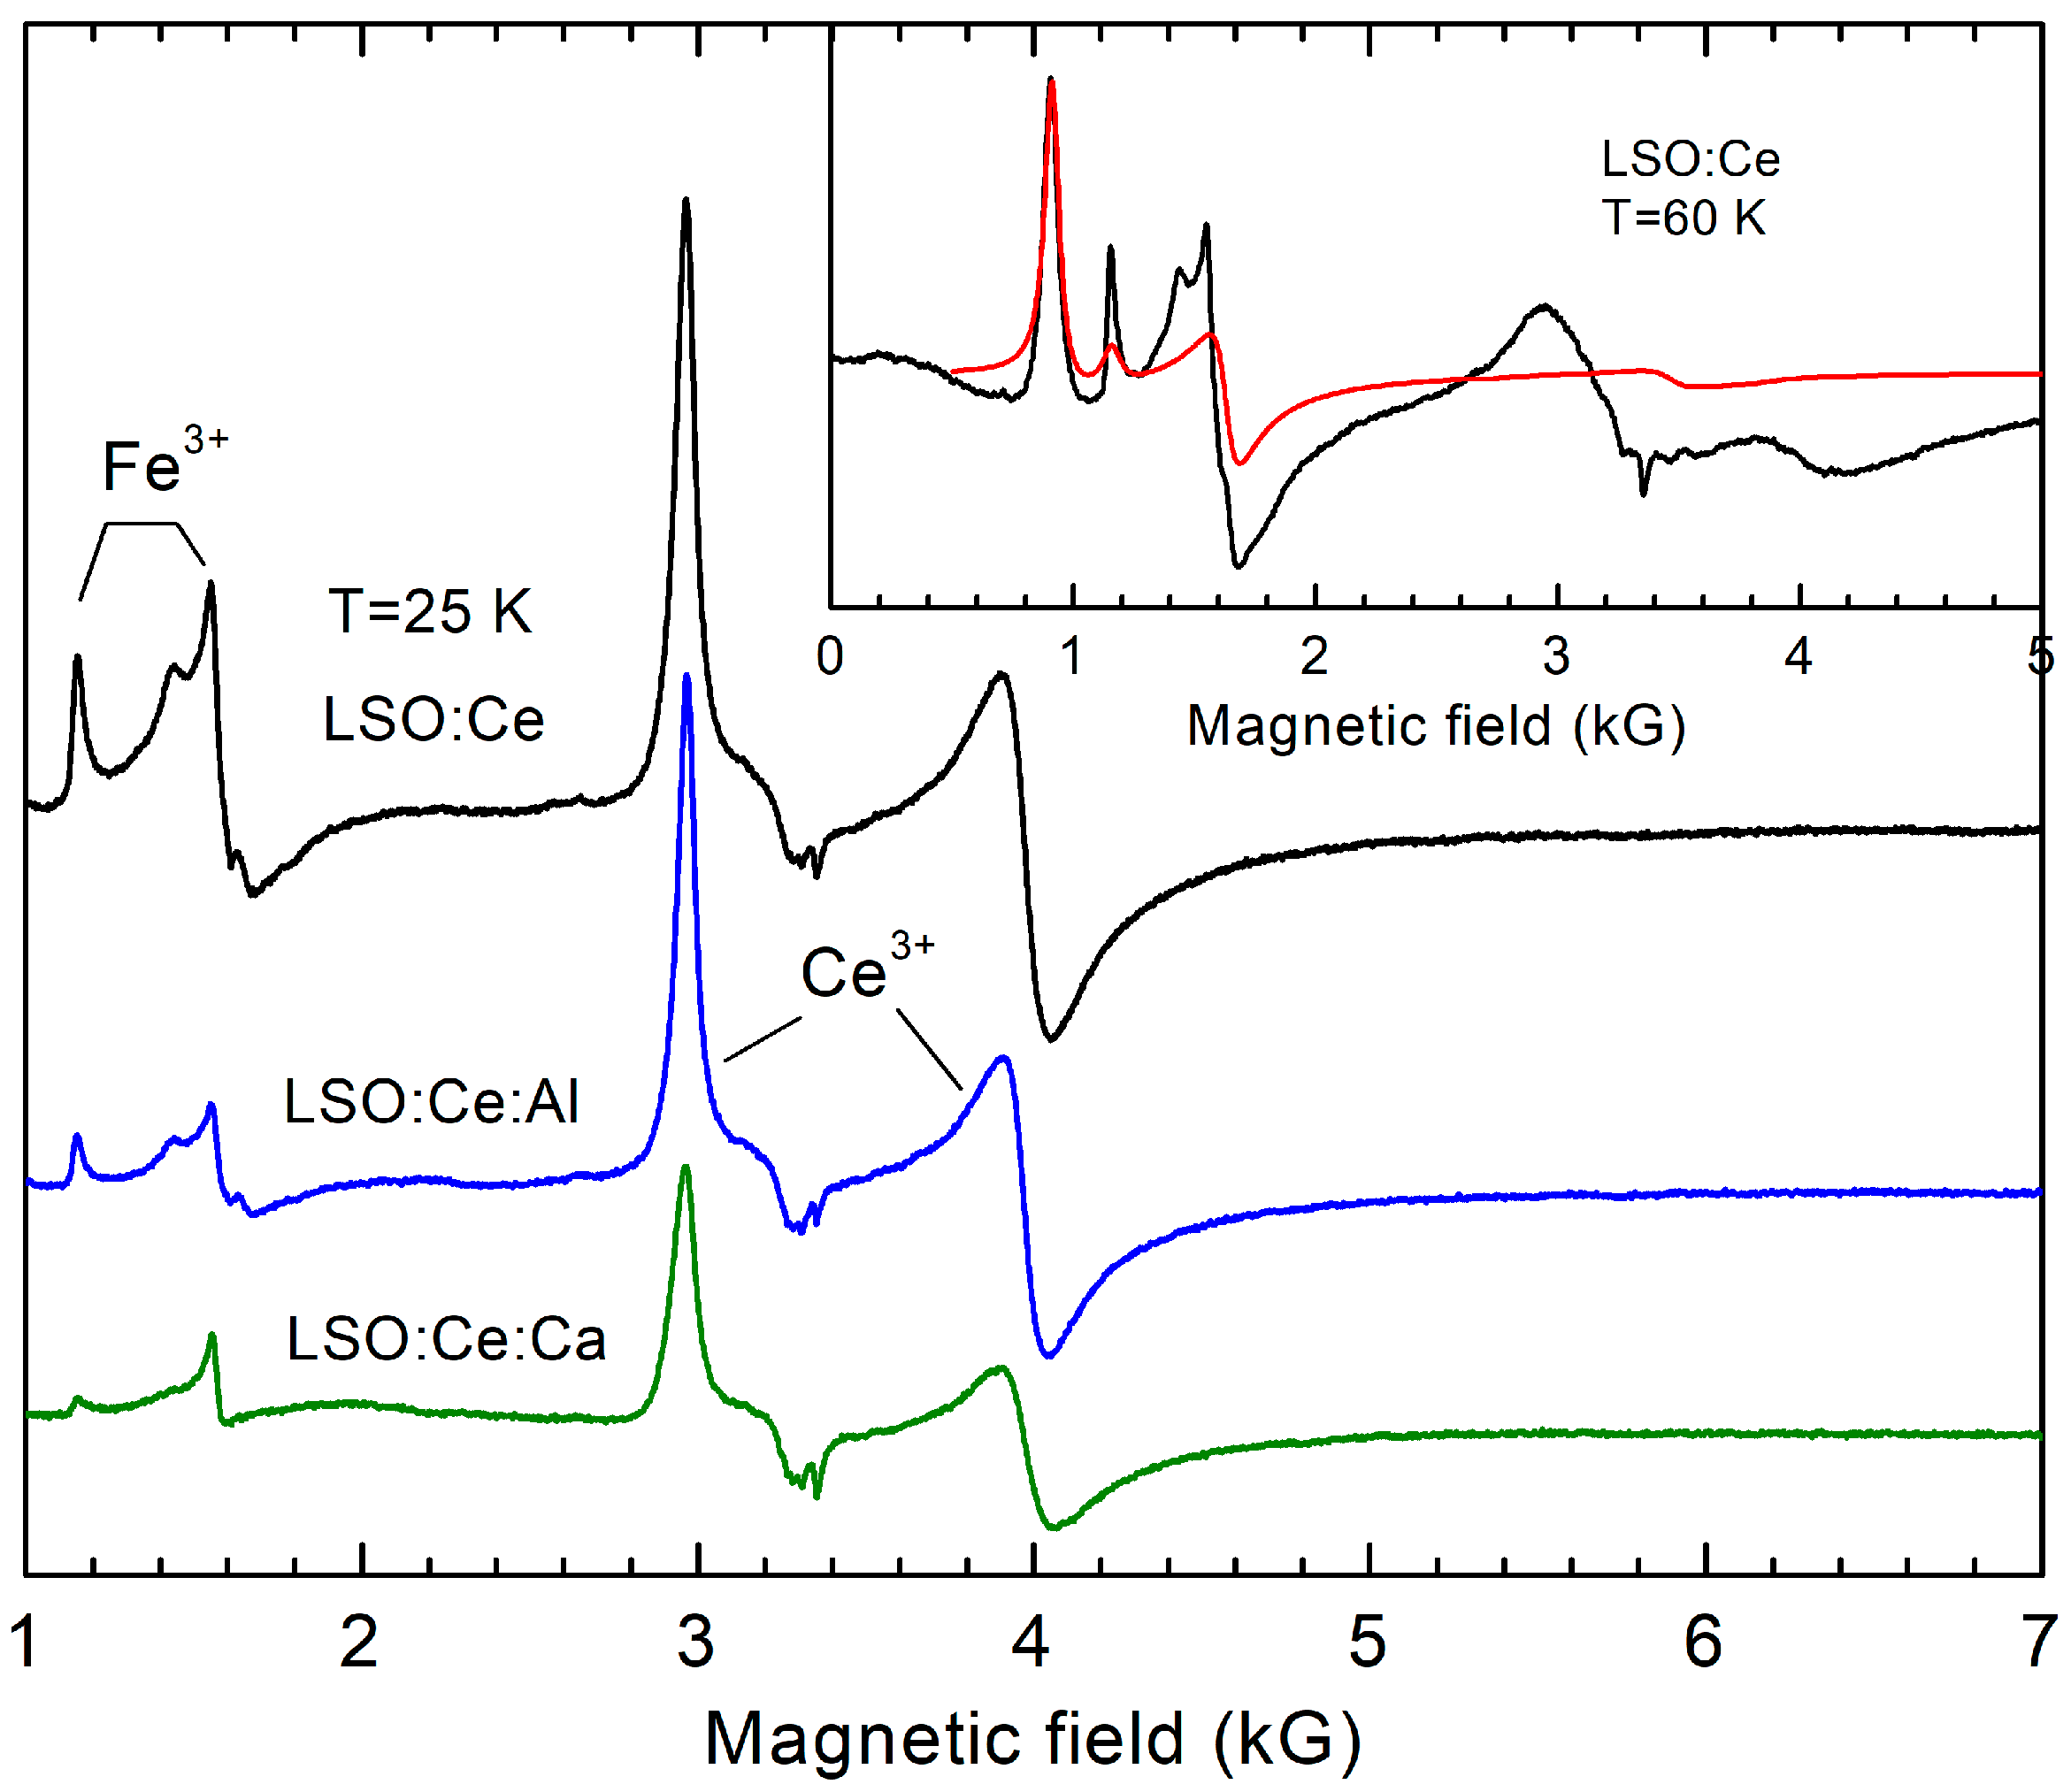
Figure 1. EPR spectra measured in LSO:Ce showing the change in the Ce3+ and Fe3+ concentration (EPR intensity is directly proportional to concentration) under co-doping with Ca2+ and Al3+ ions. The signal at low magnetic fields is assigned to Fe3+ ions. The inset shows a comparison of the Fe3+ simulated spectrum (red line) with the measured spectrum (black line). All spectra are normalized to the same sample volume.
Materials 16 04488 g001
Figure 2. EPR spectra measured in LSO:Pr, LSO:Pr,Al, and LSO:Pr,Ca powders showing the change in the Fe3+ concentration under Al and Ca co-doping. The broad signal denoted as QT belongs to quartz tubes of LHe cryostat. All spectra are normalized to the same sample volume.
Materials 16 04488 g002
Figure 3. EPR spectra measured in LPS:Pr, LPS:Pr,Al, and LPS:Pr,Ca powders. The broad signal denoted as QT belongs to quartz tubes of the LHe cryostat and asterisks denote unidentified spectral lines. The simulated Fe3+ spectrum (red line) is shown as well. All spectra are normalized to the same sample volume.
Materials 16 04488 g003
Figure 4. EPR spectra measured in LPS:Ce showing the change in the Ce3+ concentration under co-doping with Ca2+ and Al3+ ions. All spectra are normalized to the same sample volume.
Materials 16 04488 g004
Figure 5. O EPR spectra created by X-ray irradiation at room temperature in (a) LPS:Ce; (b) LPS:Ce,Al; (c) LPS:Ce,Ca; and (d) LPS:Pr,Al. (e) EPR spectrum after heating of the X-ray irradiated LPS:Ce,Al powder at 295 K for 7 days. (f) EPR spectrum measured in LPS:Ce,Al before X-ray irradiation. Simulated O EPR spectrum is shown by the green solid line for LPS:Ce,Ca in spectrum (c). The simulated spectrum coincides with the measured one (black solid line).
Materials 16 04488 g005
Figure 6. TSL glow curves of: (a) LPS:Ce, LPS:Ce,Al, and LPS:Ce,Ca; (b) LPS:Pr and LPS:Pr,Al; and (c) LSO:Ce,Al and LSO:Ce,Ca. TSL is created by X-ray irradiation at 77 K.
Materials 16 04488 g006
Figure 7. X-ray excited luminescence spectra measured at 296 K in (a) LPS:Ce, LPS:Ce,Al, LPS:Ce,Ca, LSO:Ce,Al, and LSO:Ce:Ca powders; (b) LSO:Pr, LSO:Pr,Ca, and LSO:Pr,Al powders; and (c) LPS:Pr and LPS:Pr,Al powders and LPS:Pr grinded SC.
Materials 16 04488 g007
Figure 8. Luminescence decay of Ce3+ and Pr3+ emissions excited by X-ray pulses at 296 K in (a) LSO:Ce,Al, (b) LPS:Ce,Al, and (c) LPS:Pr,Al powder samples. For comparison, the luminescence decay in the LPS:Ce single crystal grinded in powder is presented in graph (d). The fit of the experimental data (black dots) is shown by the red solid lines.
Materials 16 04488 g008
Table 1. Nominal composition of samples.
Theoretical Sample FormulaDesignation in the Text
Lu1.996Ce0.004SiO5LSO:Ce
Lu1.986Ce0.004Ca0.01SiO5LSO:Ce,Ca
Lu1.996Ce0.004Si0.995Al0.005O5LSO:Ce,Al
Lu1.996Ce0.004Si2O7LPS:Ce
Lu1.986Ce0.004Ca0.01Si2O7LPS:Ce,Ca
Lu1.996Ce0.004Si1.99Al0.01O7LPS:Ce,Al
Lu1.996Pr0.004SiO5LSO:Pr
Lu1.986Pr0.004Ca0.01SiO5LSO:Pr,Ca
Lu1.996Pr0.004Si0.995Al0.005O5LSO:Pr,Al
Lu1.996Pr0.004Si2O7LPS:Pr
Lu1.986Pr0.004Ca0.01Si2O7LPS:Pr,Ca
Lu1.996Pr0.004Si1.99Al0.01O7LPS:Pr,Al
Table 2. Spectral parameters of Ce3+, Fe3+, and O centers in LSO and LPS powders.
MaterialSpin Hamiltonian
Parameters
HF ConstantReference
LSO:Ce
LSO:Pr
Ce3+: g1 = 2.262
    g2 = 1.686
    g3 = 0.563
Fe3+: g = 1.99
     b 2 0 = 0.165 cm−1
    b 2 2 = 0.165 cm−1
This paper, [25]
This paper
LPS:Ce
LPS:Pr
Ce3+: g1 = 3.000
    g2 = 0.705
    g3 ≈ 0.10
Fe3+: g = 2.00
     b 2 0 = 0.700 cm−1
     b 2 2 = 0.380 cm−1
This paper, [25,28]
This paper
LPS:Ce,AlO: g = 2.012Not determinedThis paper
LPS:Ce,CaO: g = 2.011175Lu: A00 = 4.0 × 10⁻⁴ cm−1This paper
Table 3. Luminescence decay times and relative intensities of components in LPS and LSO powders doped with Ce or Pr and co-doped with Ca or Al, approximated by the bi-exponential function I ( t ) = A i exp ( t / τ i ) + b , where i = 1, 2, to fit the scintillation decay curves. The relative intensity of each component is calculated as I i = ( A i τ i / A i τ i ) × 100 % . For comparison, the luminescence decay time of the LPS:Ce single crystal and published data for decay times in LSO and LPS under γ-ray excitation are listed as well.
Compositionτ1 (ns)I1 (%)τ2 (ns)I2 (%)
LPS:Ce11.531.336.368.7
LPS:Ce,Al11.432.236.167.8
LPS:Ce,Ca10.832.535.567.5
LPS:Ce, SC 35.8, 38 *100
LSO:Ce,Al10.346.133.153.9
LSO:Ce,Ca9.850.832.949.2
LSO:Ce, SC 40 *100
LPS:Pr13.669.030.831.0
LPS:Pr,Al12.669.730.230.3
LPS:Pr, SC20 **, 15 ***100
* Decay time in SC under γ-ray excitation [16]; ** photoluminescence decay time in SC under excitation at 256 nm [28]; *** decay time in SC under γ-ray excitation [31].
Disclaimer/Publisher’s Note: The statements, opinions and data contained in all publications are solely those of the individual author(s) and contributor(s) and not of MDPI and/or the editor(s). MDPI and/or the editor(s) disclaim responsibility for any injury to people or property resulting from any ideas, methods, instructions or products referred to in the content.