3.1. Plasma Electrolytic Oxidation Processing
The current and voltage plots of the PEO process in aqueous solution (AS) and molten salt (MS) on samples of Ti-6Al-4V alloy are shown in
Figure 3.
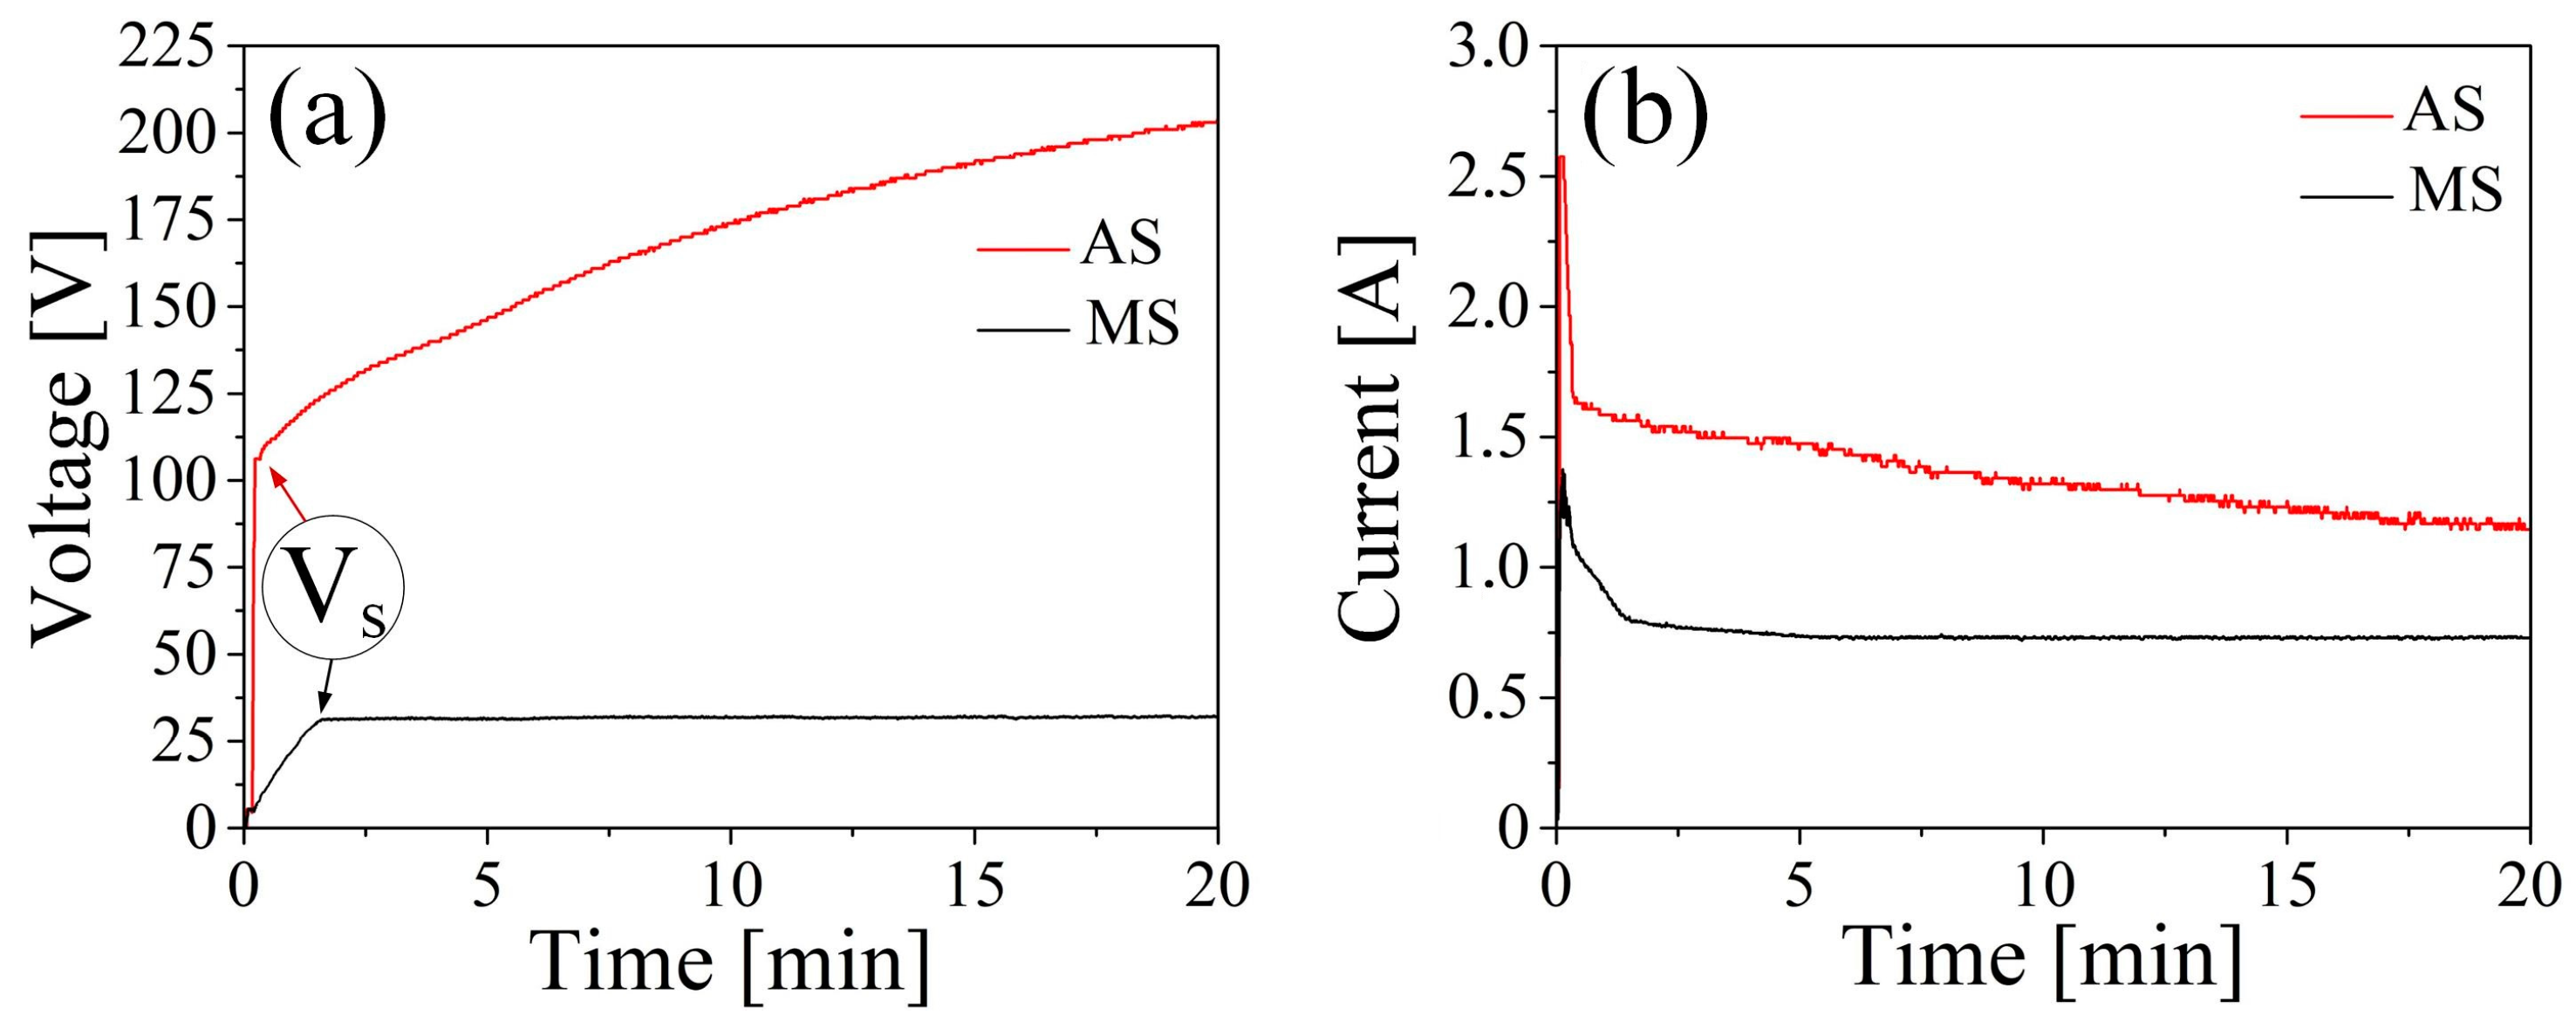
The voltage-time graphs illustrate the two general steps of the coating formation process. In the first step, a layer of adsorbed ions from the electrolyte composition forms on the surface of the sample [
47]. Subsequently, the anodizing process begins, leading to the formation of an amorphous oxide layer [
48]. As the oxide layer thickness increases, the required voltage for ion migration through the growing coating also increases. Concurrently, there is a sharp voltage increase accompanied by a drop in current, indicating a change in the dielectric characteristics of the formed coating and a decrease in its conductivity [
47].
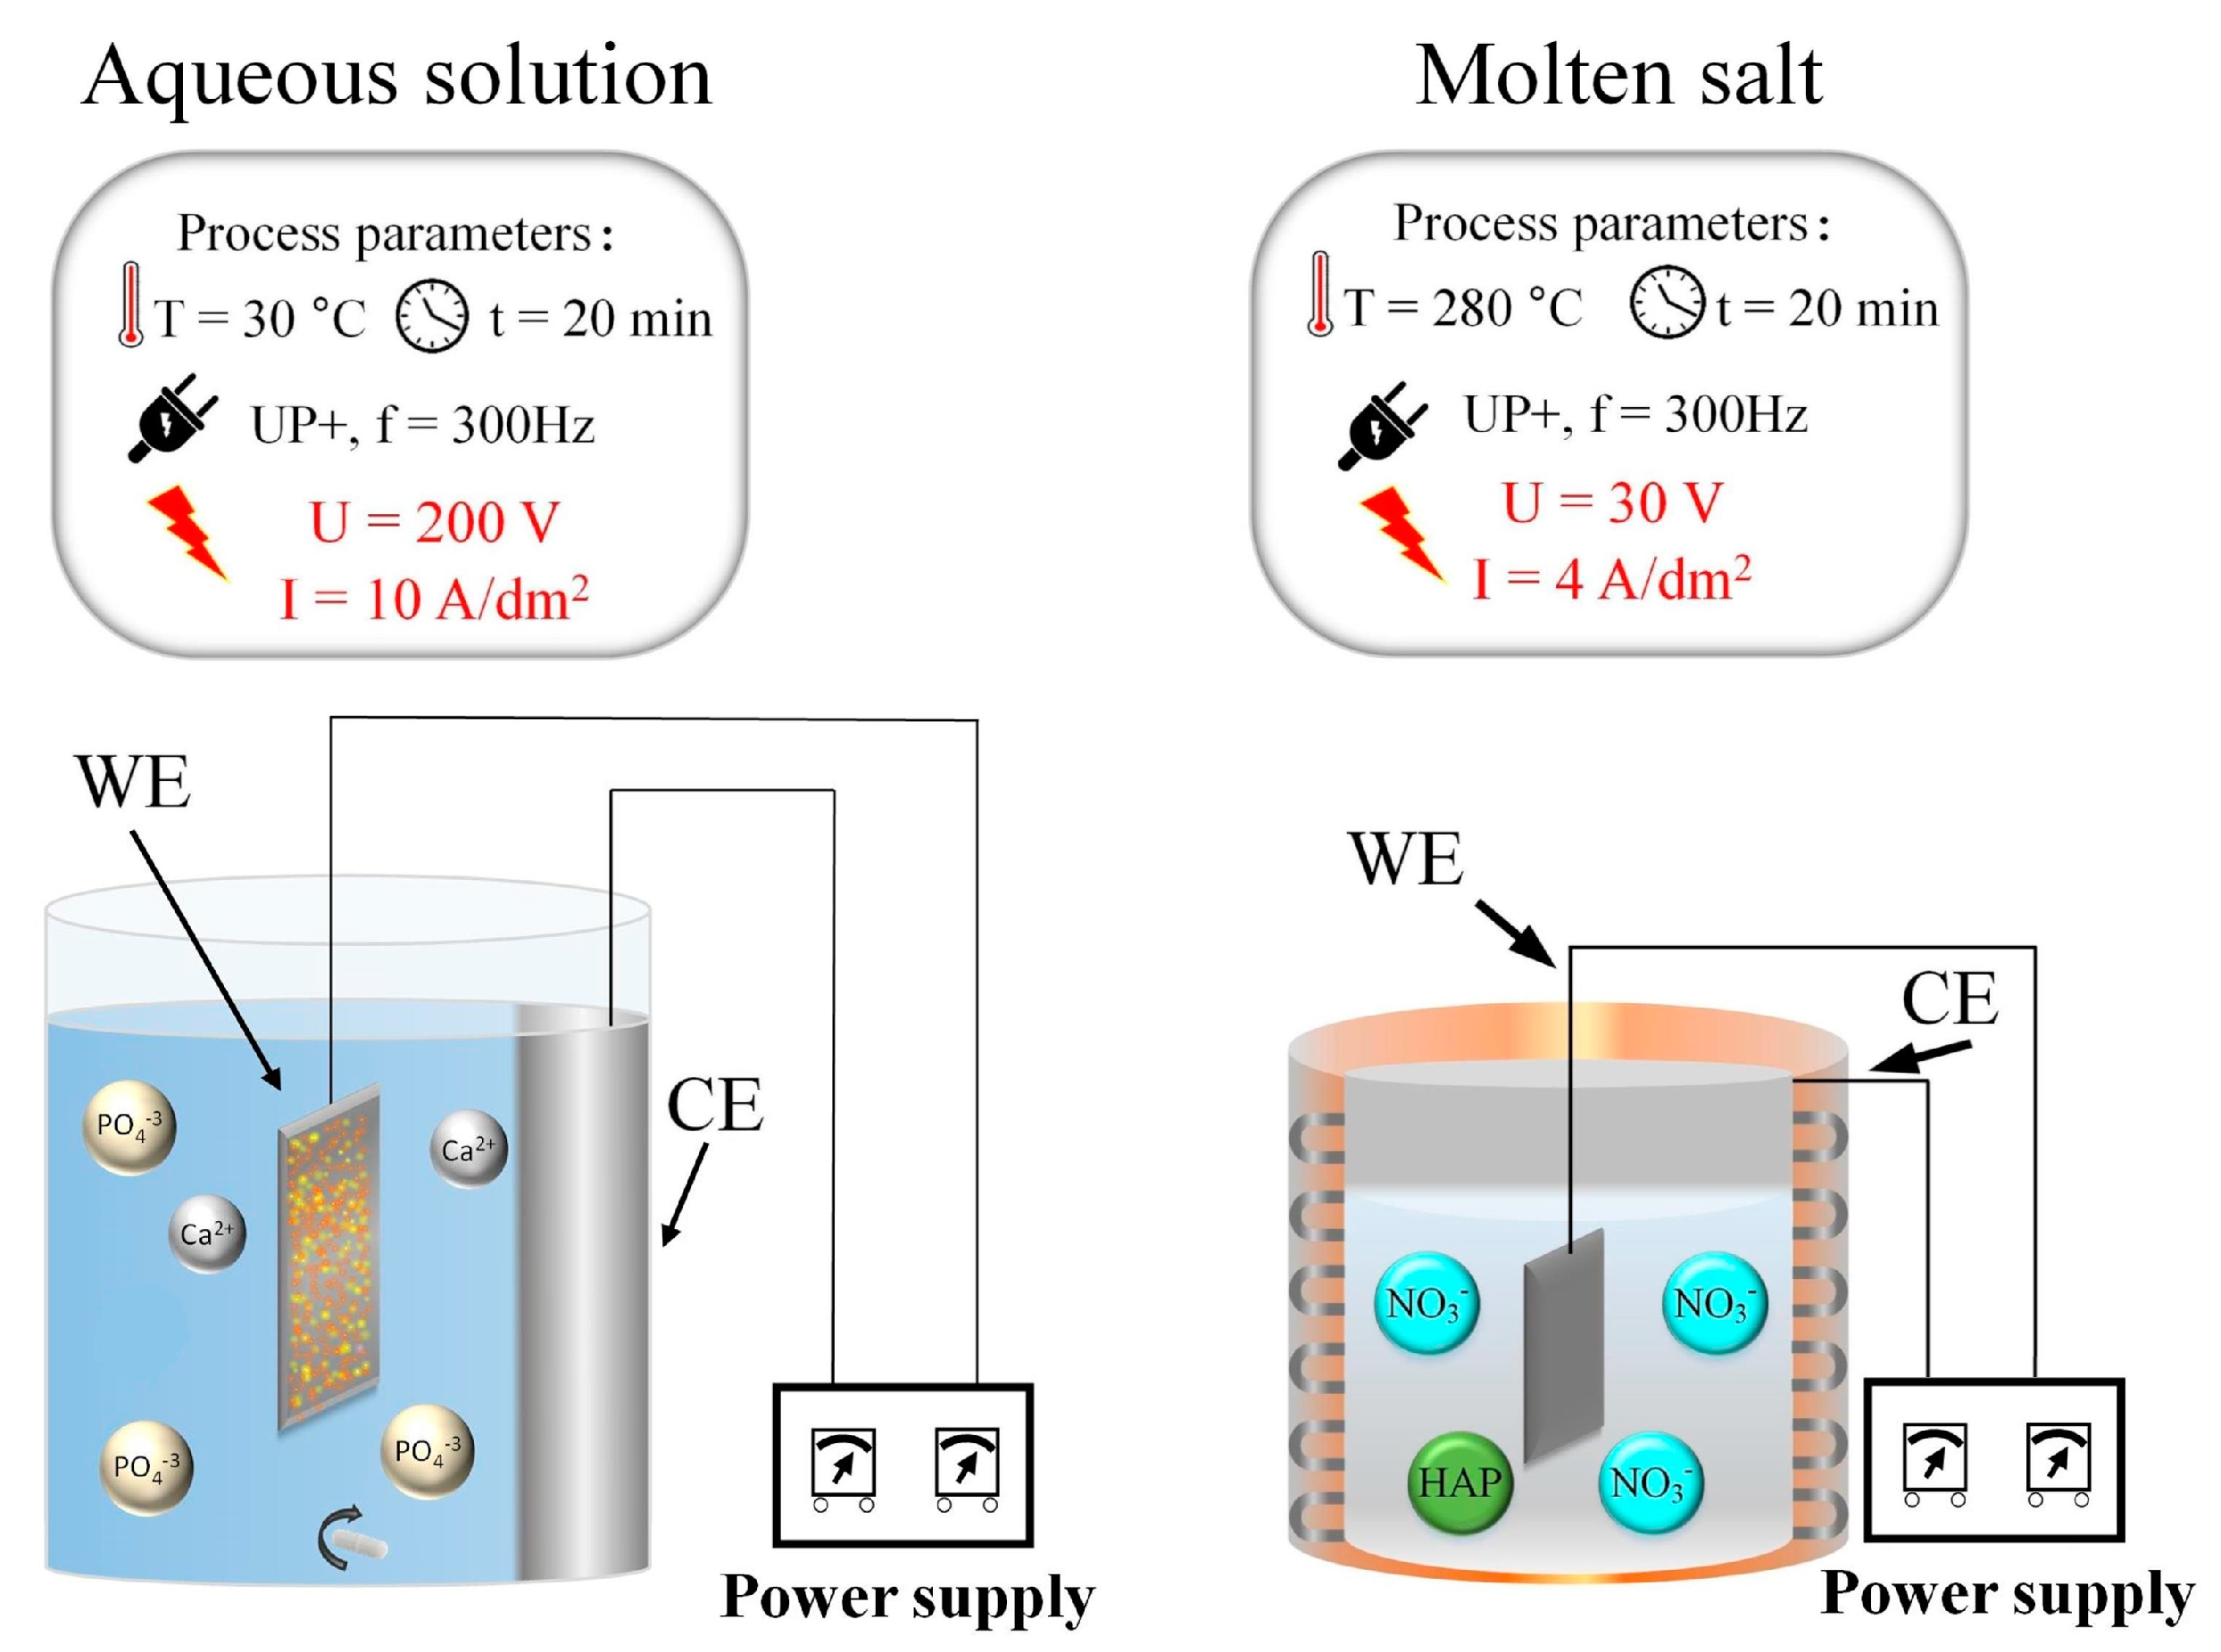
The formation of an amorphous oxide coating in an aqueous electrolyte can occur up to a voltage of 106 V, whereas in molten salts, it reaches up to 30 V.
Figure 3 demonstrates that the currents and voltages required for formation differ by nearly threefold between an aqueous electrolyte and molten salts. This difference is influenced by factors such as the composition of the electrolyte, its temperature, and its conductivity.
The next stage of coating formation is characterized by the formation of avalanche-like sparks on the surface of the processed samples [
49], known as micro-arc breakdowns. The appearance of micro-arc breakdowns is attributed to a sharp inflection in
Figure 3, and the inflection point (Vs) corresponds to the breakdown of the previously formed amorphous dielectric layer. With the appearance of micro-breakdowns, sparks are formed at specific points, reaching temperatures up to 10,000 K. Consequently, the previously formed amorphous coating undergoes phase transformations, resulting in the formation of crystalline titanium oxide [
50]. Additionally, at the moment of breakdown, electrolyte components are drawn into the discharge channel, leading to the formation of additional coating phases and the doping of the coating with the desired components [
51]. In our case, these components are calcium and phosphorus, which can form the hydroxyapatite (HAP) phase, thereby promoting the osseointegration and fusion of the implant with the bone matrix [
52].
3.2. Microstructural Characterization and Chemical Analysis
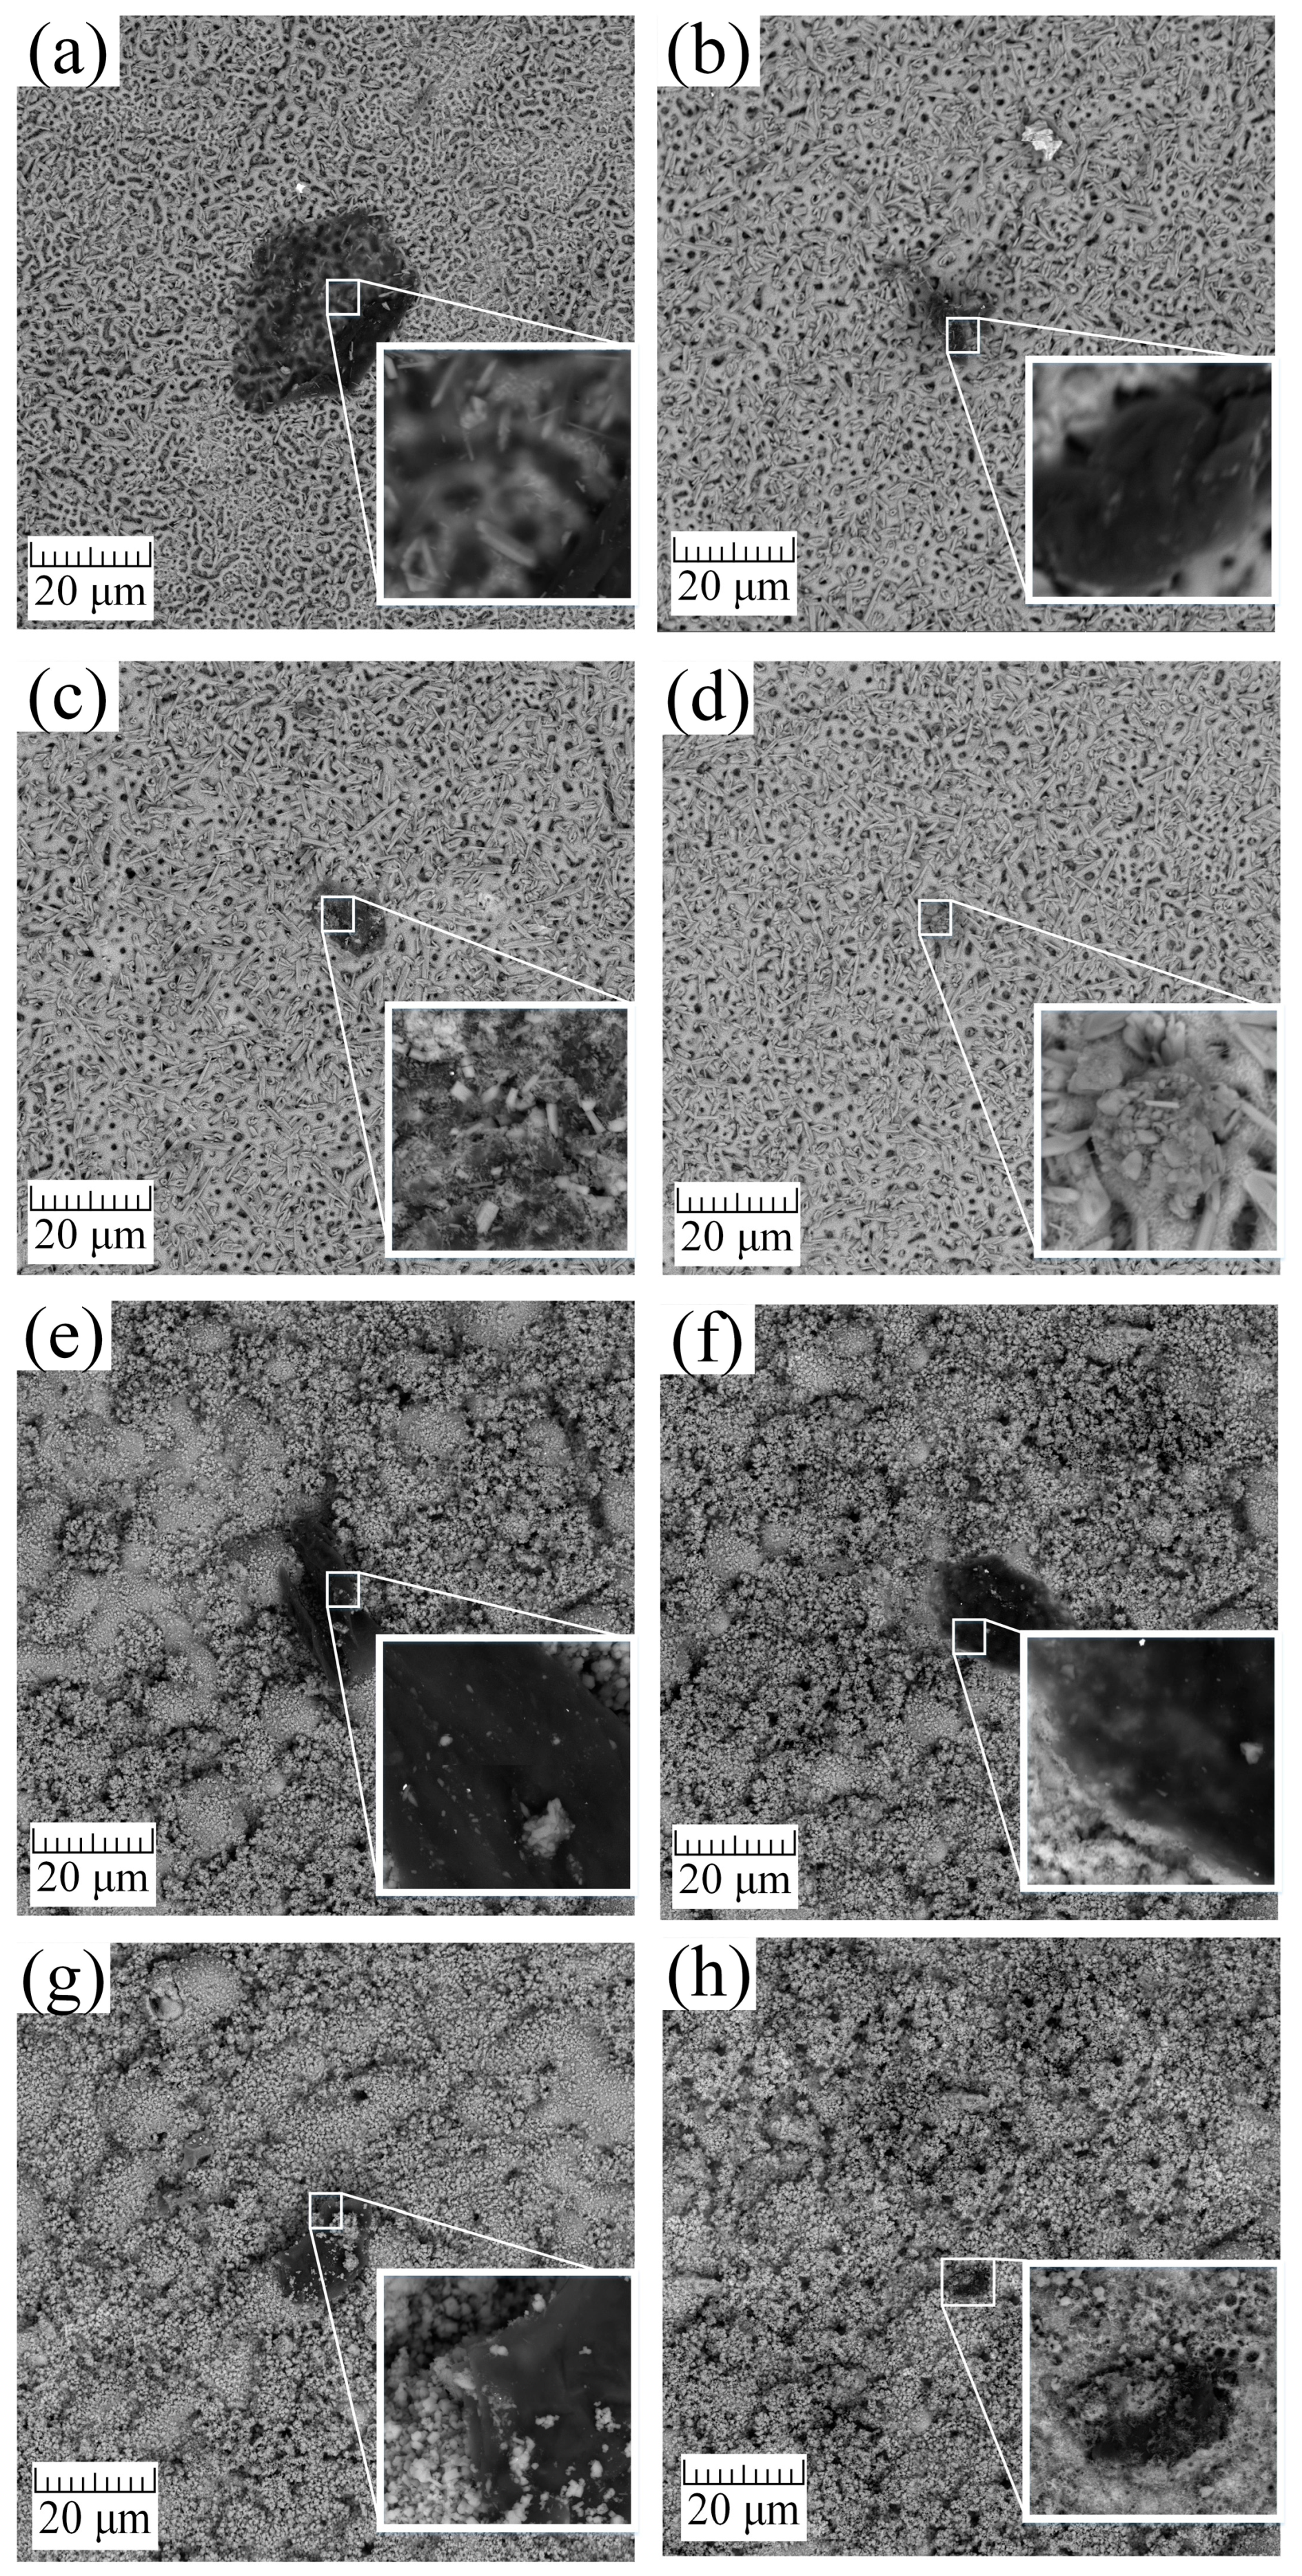
SEM images of the samples obtained by the PEO method in aqueous solutions (
Figure 4a–d) and in molten salts (
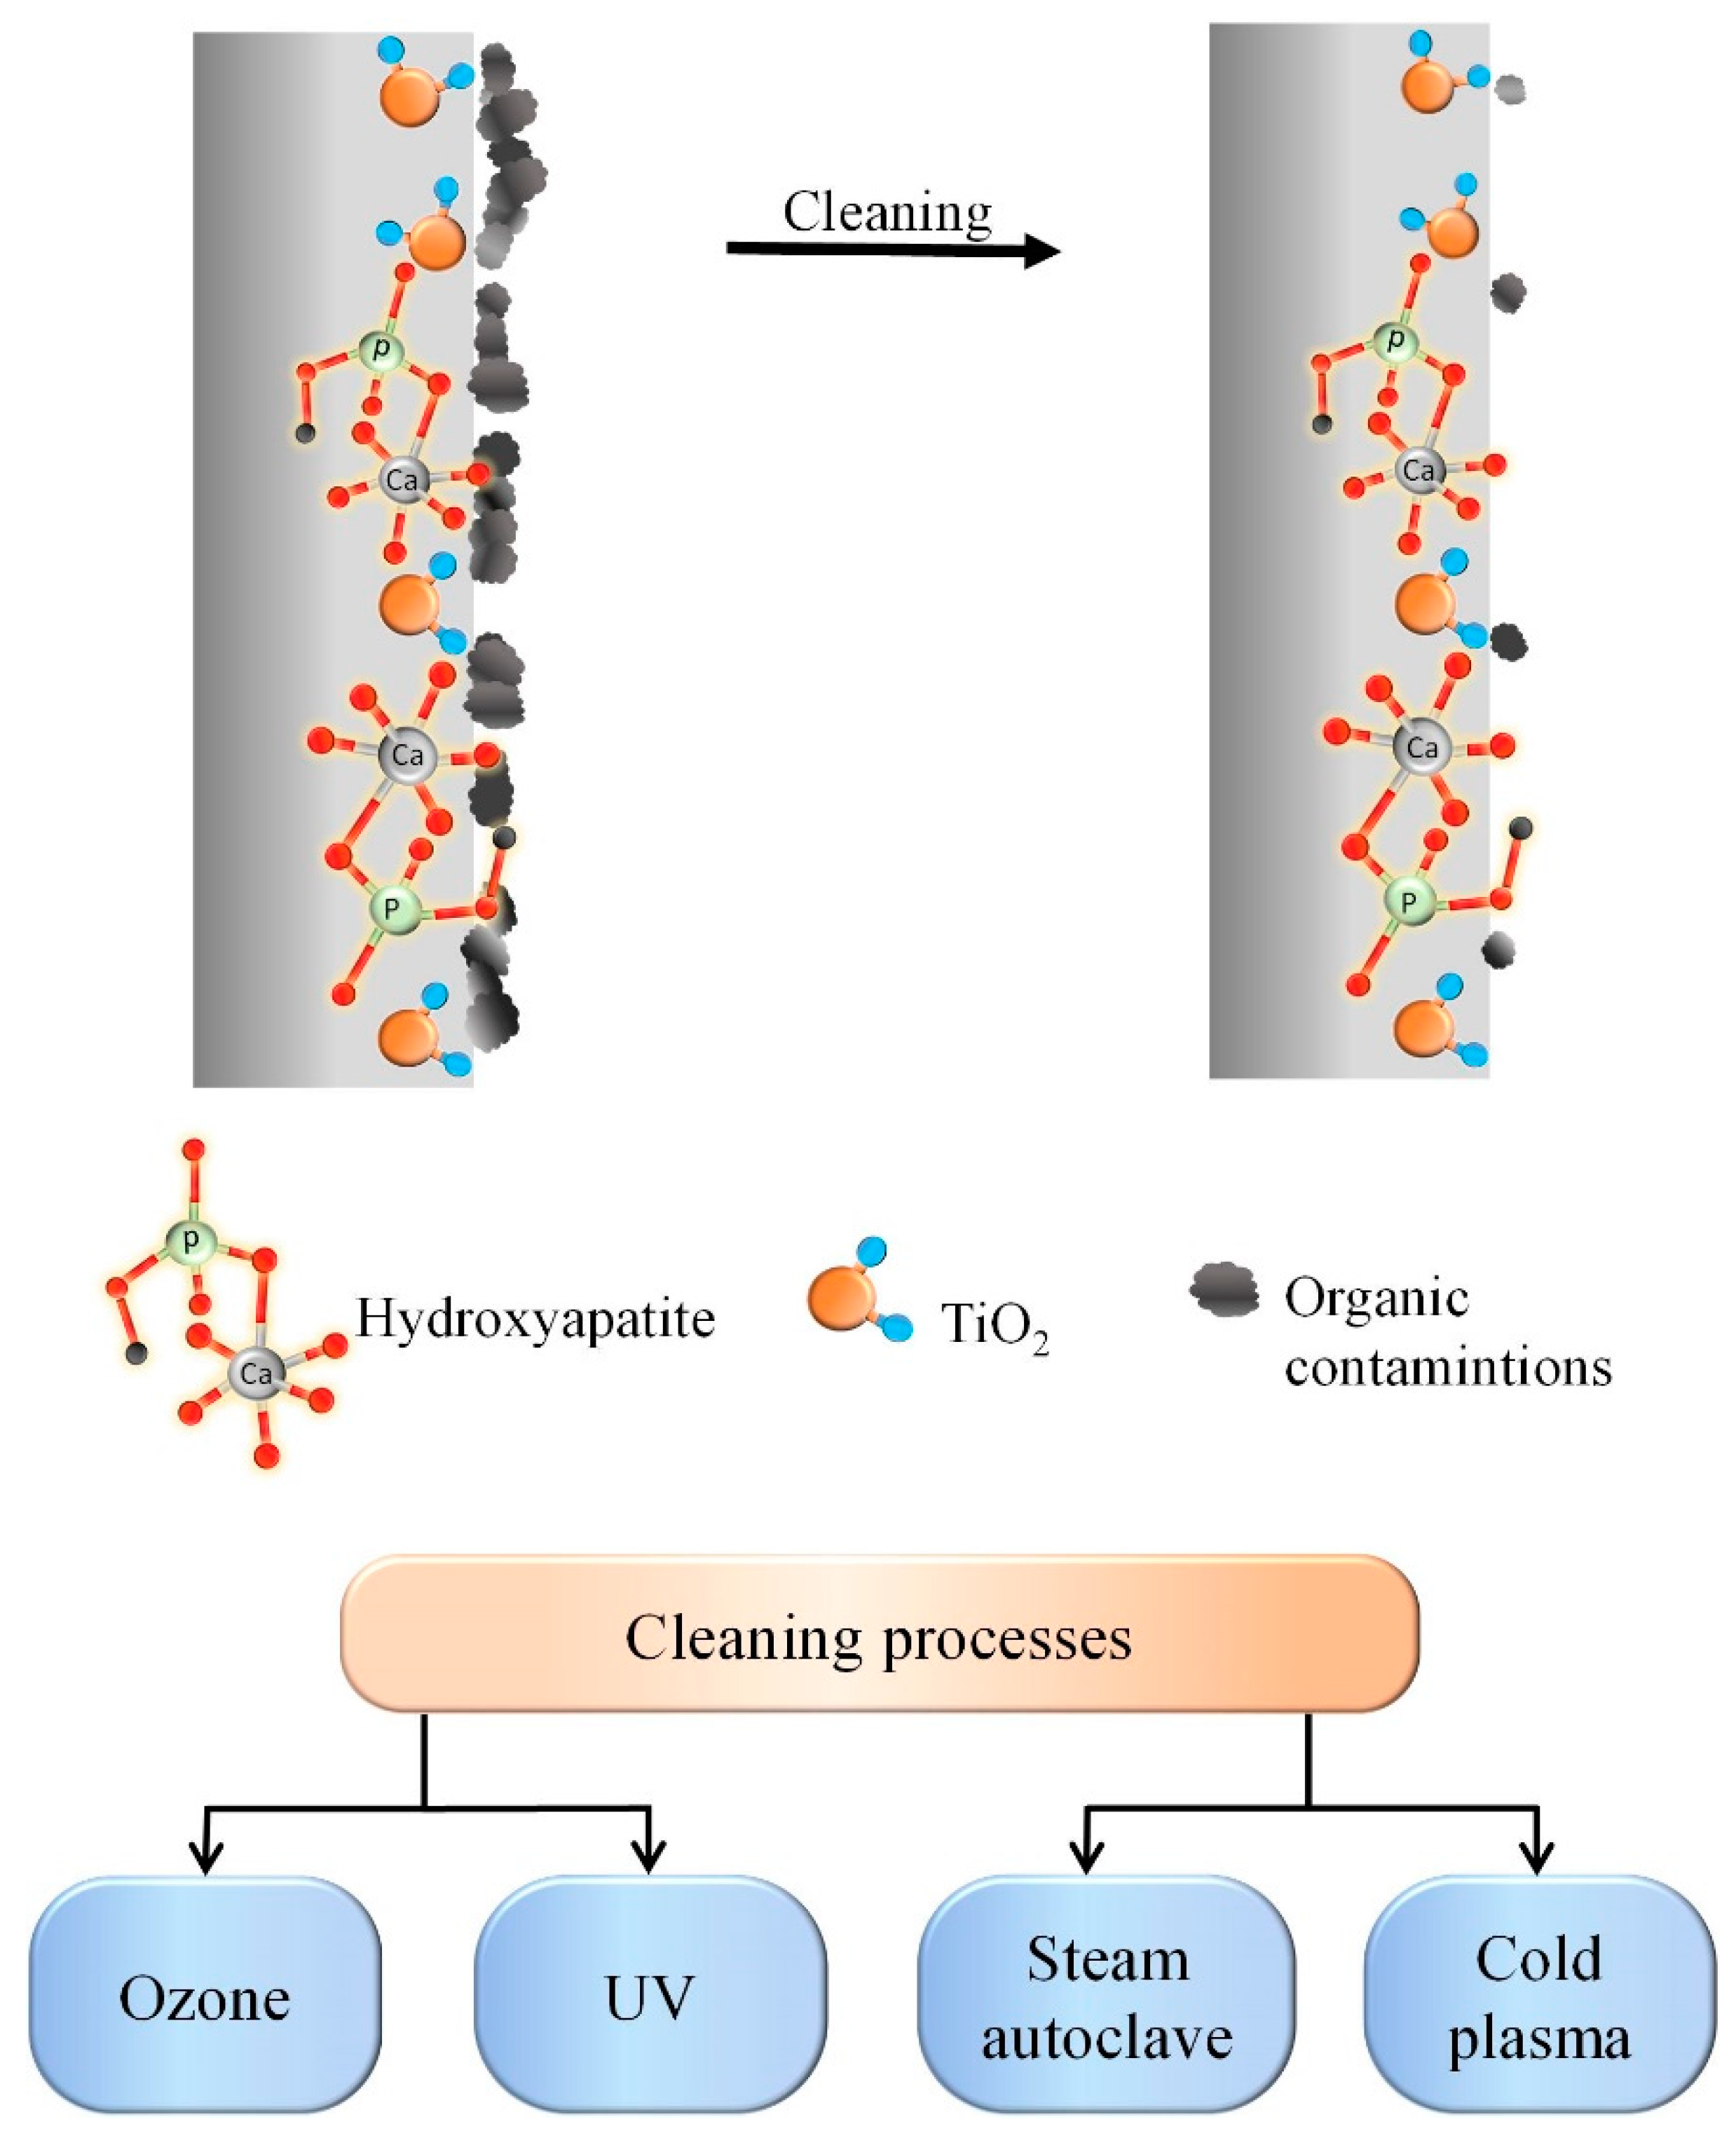
Figure 4e–h) and processed by the A method, which, on the one hand, forms crystalline hydroxyapatite from the previously introduced Ca and P precursors in the coating composition [
53]. On the other hand, the surface is cleared of organic pollutants by the A method. However, as seen from
Figure 4a,e, and
Table 3, the A method is insufficient for cleaning the surface of AS-A and MS-A samples, and additional post-processing is required. According to
Figure 4, the area of surface contamination after cleaning by the A method for samples AC-A is 955 µm
2, and for MC-A = 484 µm
2, and the total contamination over the entire area (0.17 dm
2) of the samples is, on average, 7.9% and 4%, respectively.
The UV treatment has been applied as an alternative method for more efficient cleaning of organic contaminants. After UV treatment (
Figure 4b,f), the amount and size of organic contaminants decreased to 105 μm
2 for the AS-A-UV sample, which is 0.83% of the total sample area (0.17 dm
2). For the MS-A-UV sample, the area of residual contamination was 302 μm
2, corresponding to 2.48% of the total area of the treated surface (0.17 dm
2). It should also be noted that UV irradiation cleans the surface more effectively than the A method. However, it also contributes to the degradation and destruction of the target coating, associated with a decrease in the size of the HAP crystals (
Figure 5b,f and
Table 3 and
Table 4). This surface reaction can be attributed to the photocatalytic properties of titanium oxide [
54,
55], which, when interacting with hard ultraviolet light, absorbs it and converts it to thermal energy or singlet oxygen and other radicals. The resulting compounds can enter into successive reactions that lead to the degradation and destruction of the film. The chemical analysis of the surface carried out below using EDS (
Table 3) and XPS (
Table 4) methods shows a decrease in the surface concentration of calcium and phosphorus, which also indicates the destruction of the coating.
The cold plasma treatment of the coating (
Figure 4c,g) did not significantly affect the morphology and chemical composition (
Table 3 and
Table 4), with a significant reduction in surface contamination can be seen. For example, for sample AS-A-P, the contaminated surface area decreased to 120 μm
2 (≈1% of the total sample area), and for sample MS-A-P = 205 μm
2, which corresponds to ≈1.65% of the total sample area 0.17 dm
2. However, for complete cleaning of the coating, either additional treatment or an increase in the processing time by the P method is required.
The ozone cleaning method was used as an alternative to the methods above. The results presented in
Figure 4d,h indicate that ozone treatment does not damage the coating and is the most effective method for dealing with organic contaminations. Surface morphology analysis (
Figure 4d) and chemical analysis (
Table 3 and
Table 4) demonstrate that the AS-A-O sample was completely free of organic contaminants. On the MS-A-O sample, the residual contamination area was 8.1 μm
2, which accounted for 0.66% of the total sample area (0.17 dm
2). The cleaning methods were replicated three times, yielding similar results. The organic contaminants exhibited similar size and shape across all the studied samples.
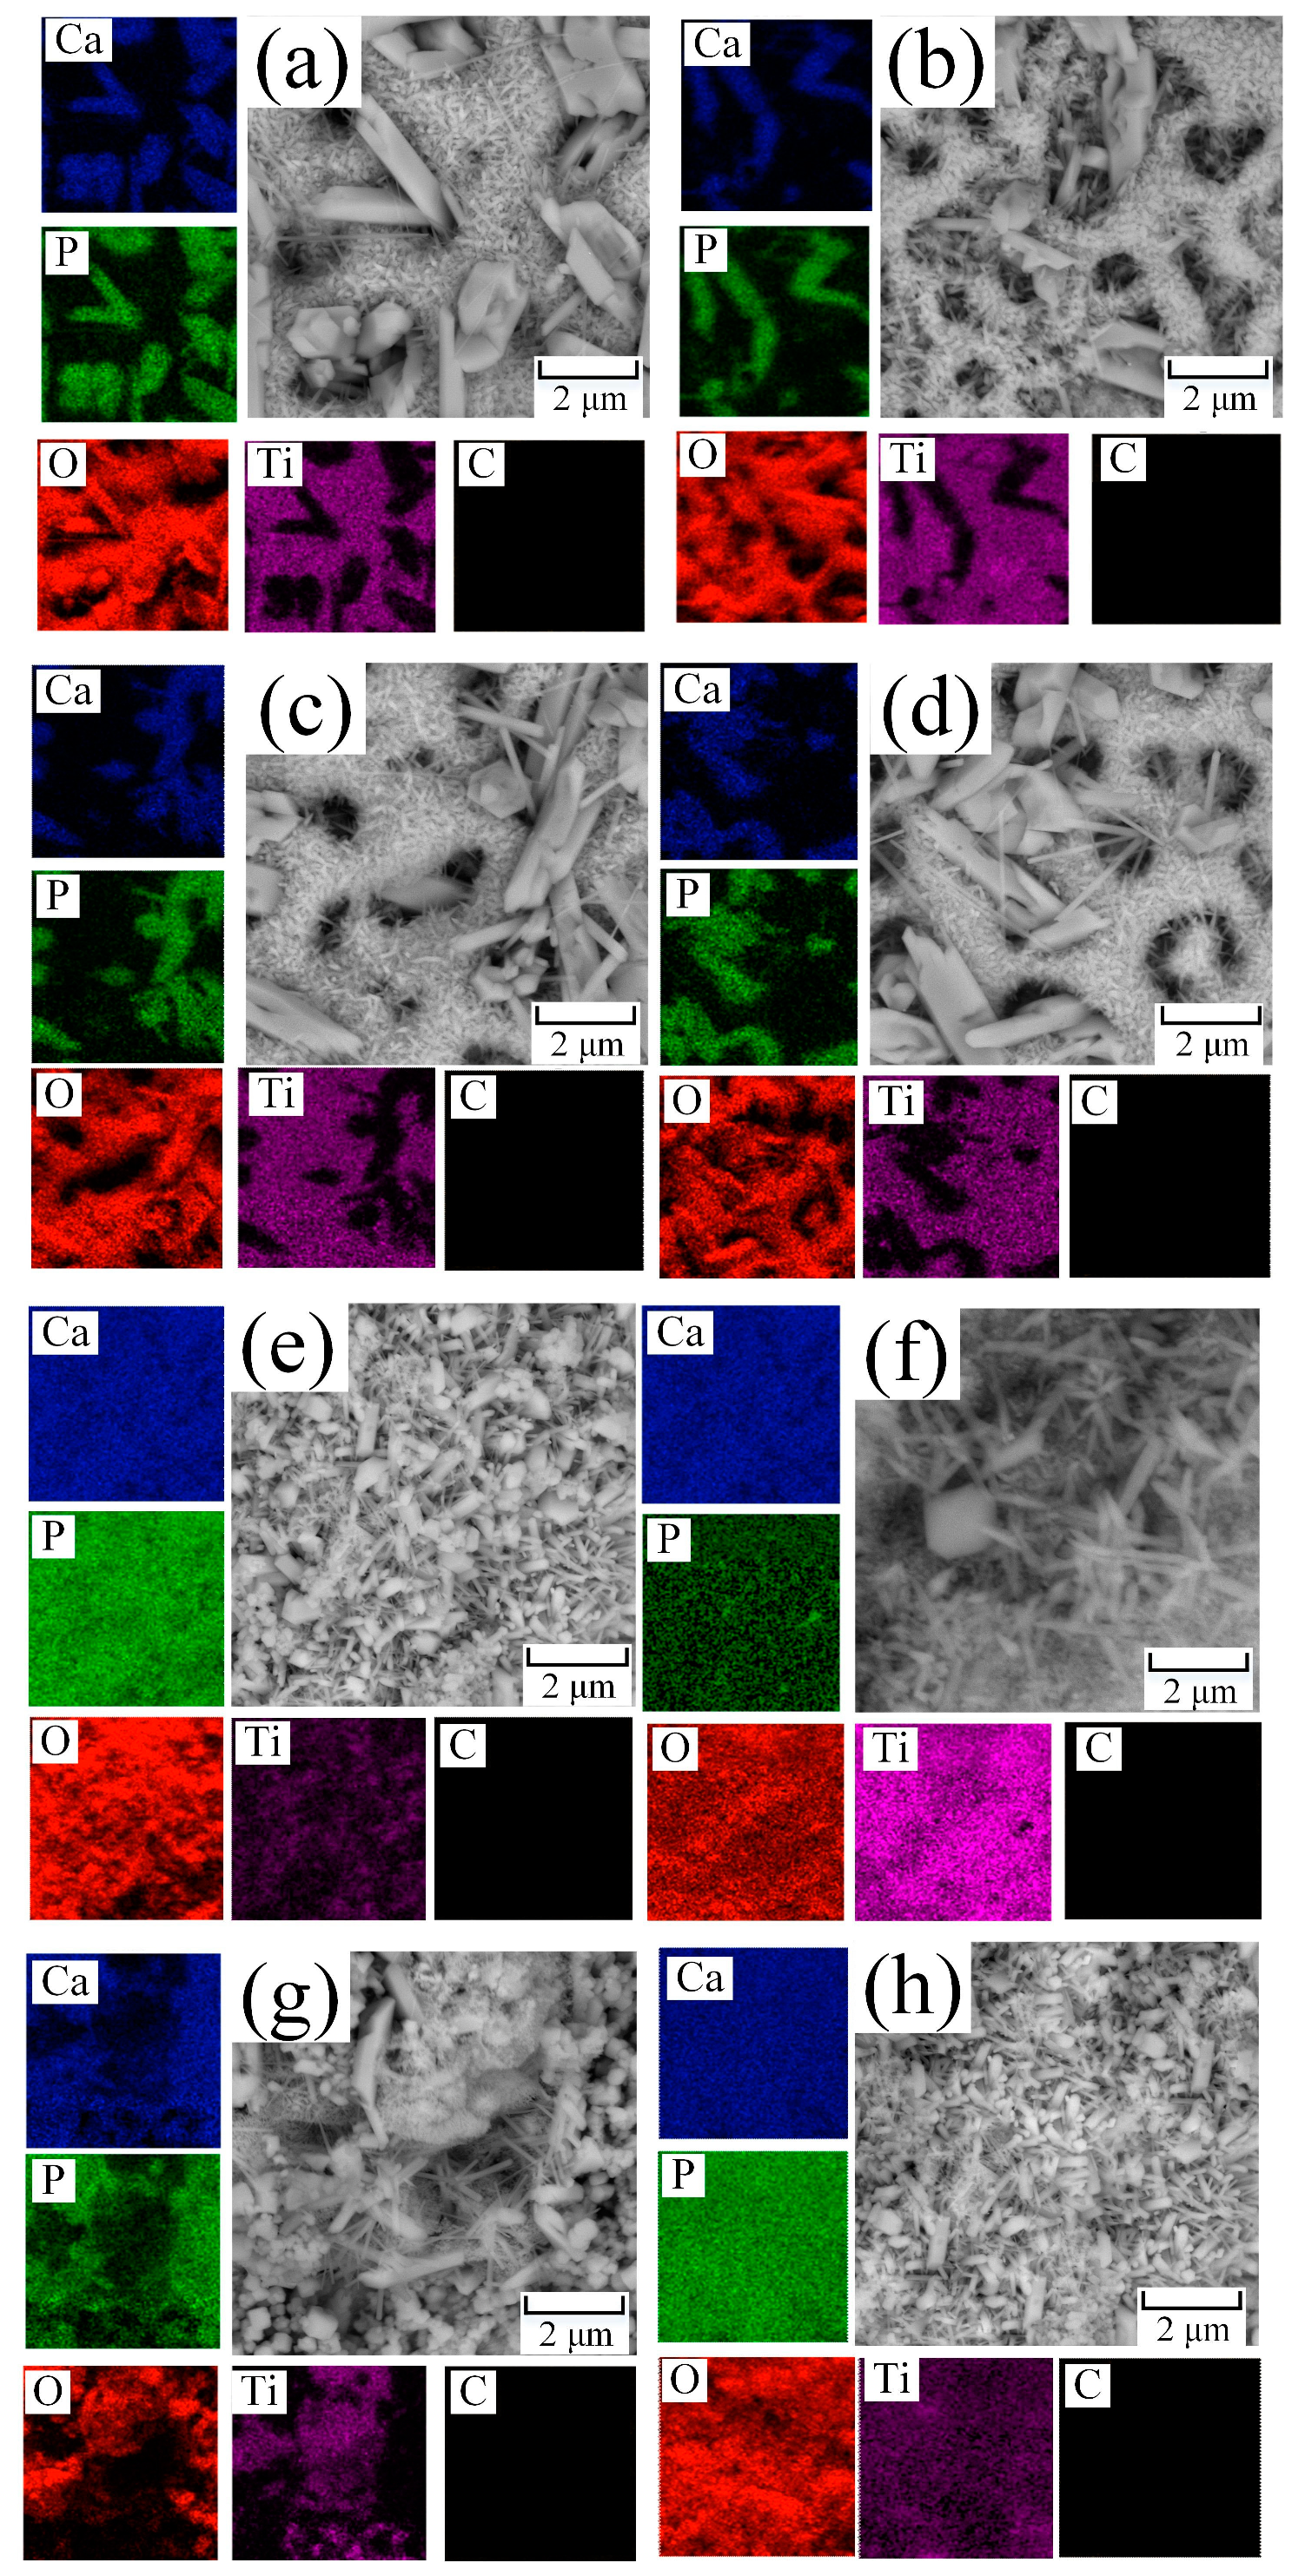
For a more detailed analysis of the coating morphology after cleaning, higher magnification SEM photographs were taken, as well as elemental mapping of the studied coatings (
Figure 5).
During the hydrothermal treatment after PEO in aqueous solutions and molten salt on the treated surface grew HAP crystals with sizes from 0.5 to 3 µm and 0.1 to 1 µm, respectively. The crystals have a regular shape without surface defects (
Figure 5a,e). In the case of intense ultraviolet treatment, as mentioned earlier, the surface was severely damaged on a macroscale (
Figure 4b,f). At higher magnification, it can be seen that the surface of the coating has degraded, and instead of acicular HAP, the surface has a looser structure (
Figure 5b,f). Plasma treatment had a similar effect on the surface of the coating; namely, the HAP crystals became thinner, and their number decreased (
Figure 5c,g). It should also be noted that with all the advantages of this method, it is not selective and knocks out both organic contaminants from the surface of the processed material and other target components necessary to impart special properties to the coating. The most effective method of cleaning from organic contaminants in the macro (
Figure 4d,h) and micro (
Figure 5d,h) scales of all presented is ozone treatment since it removes a significant amount of organic contaminants without destroying the surface layers of the coating and without changing its microstructures [
56].
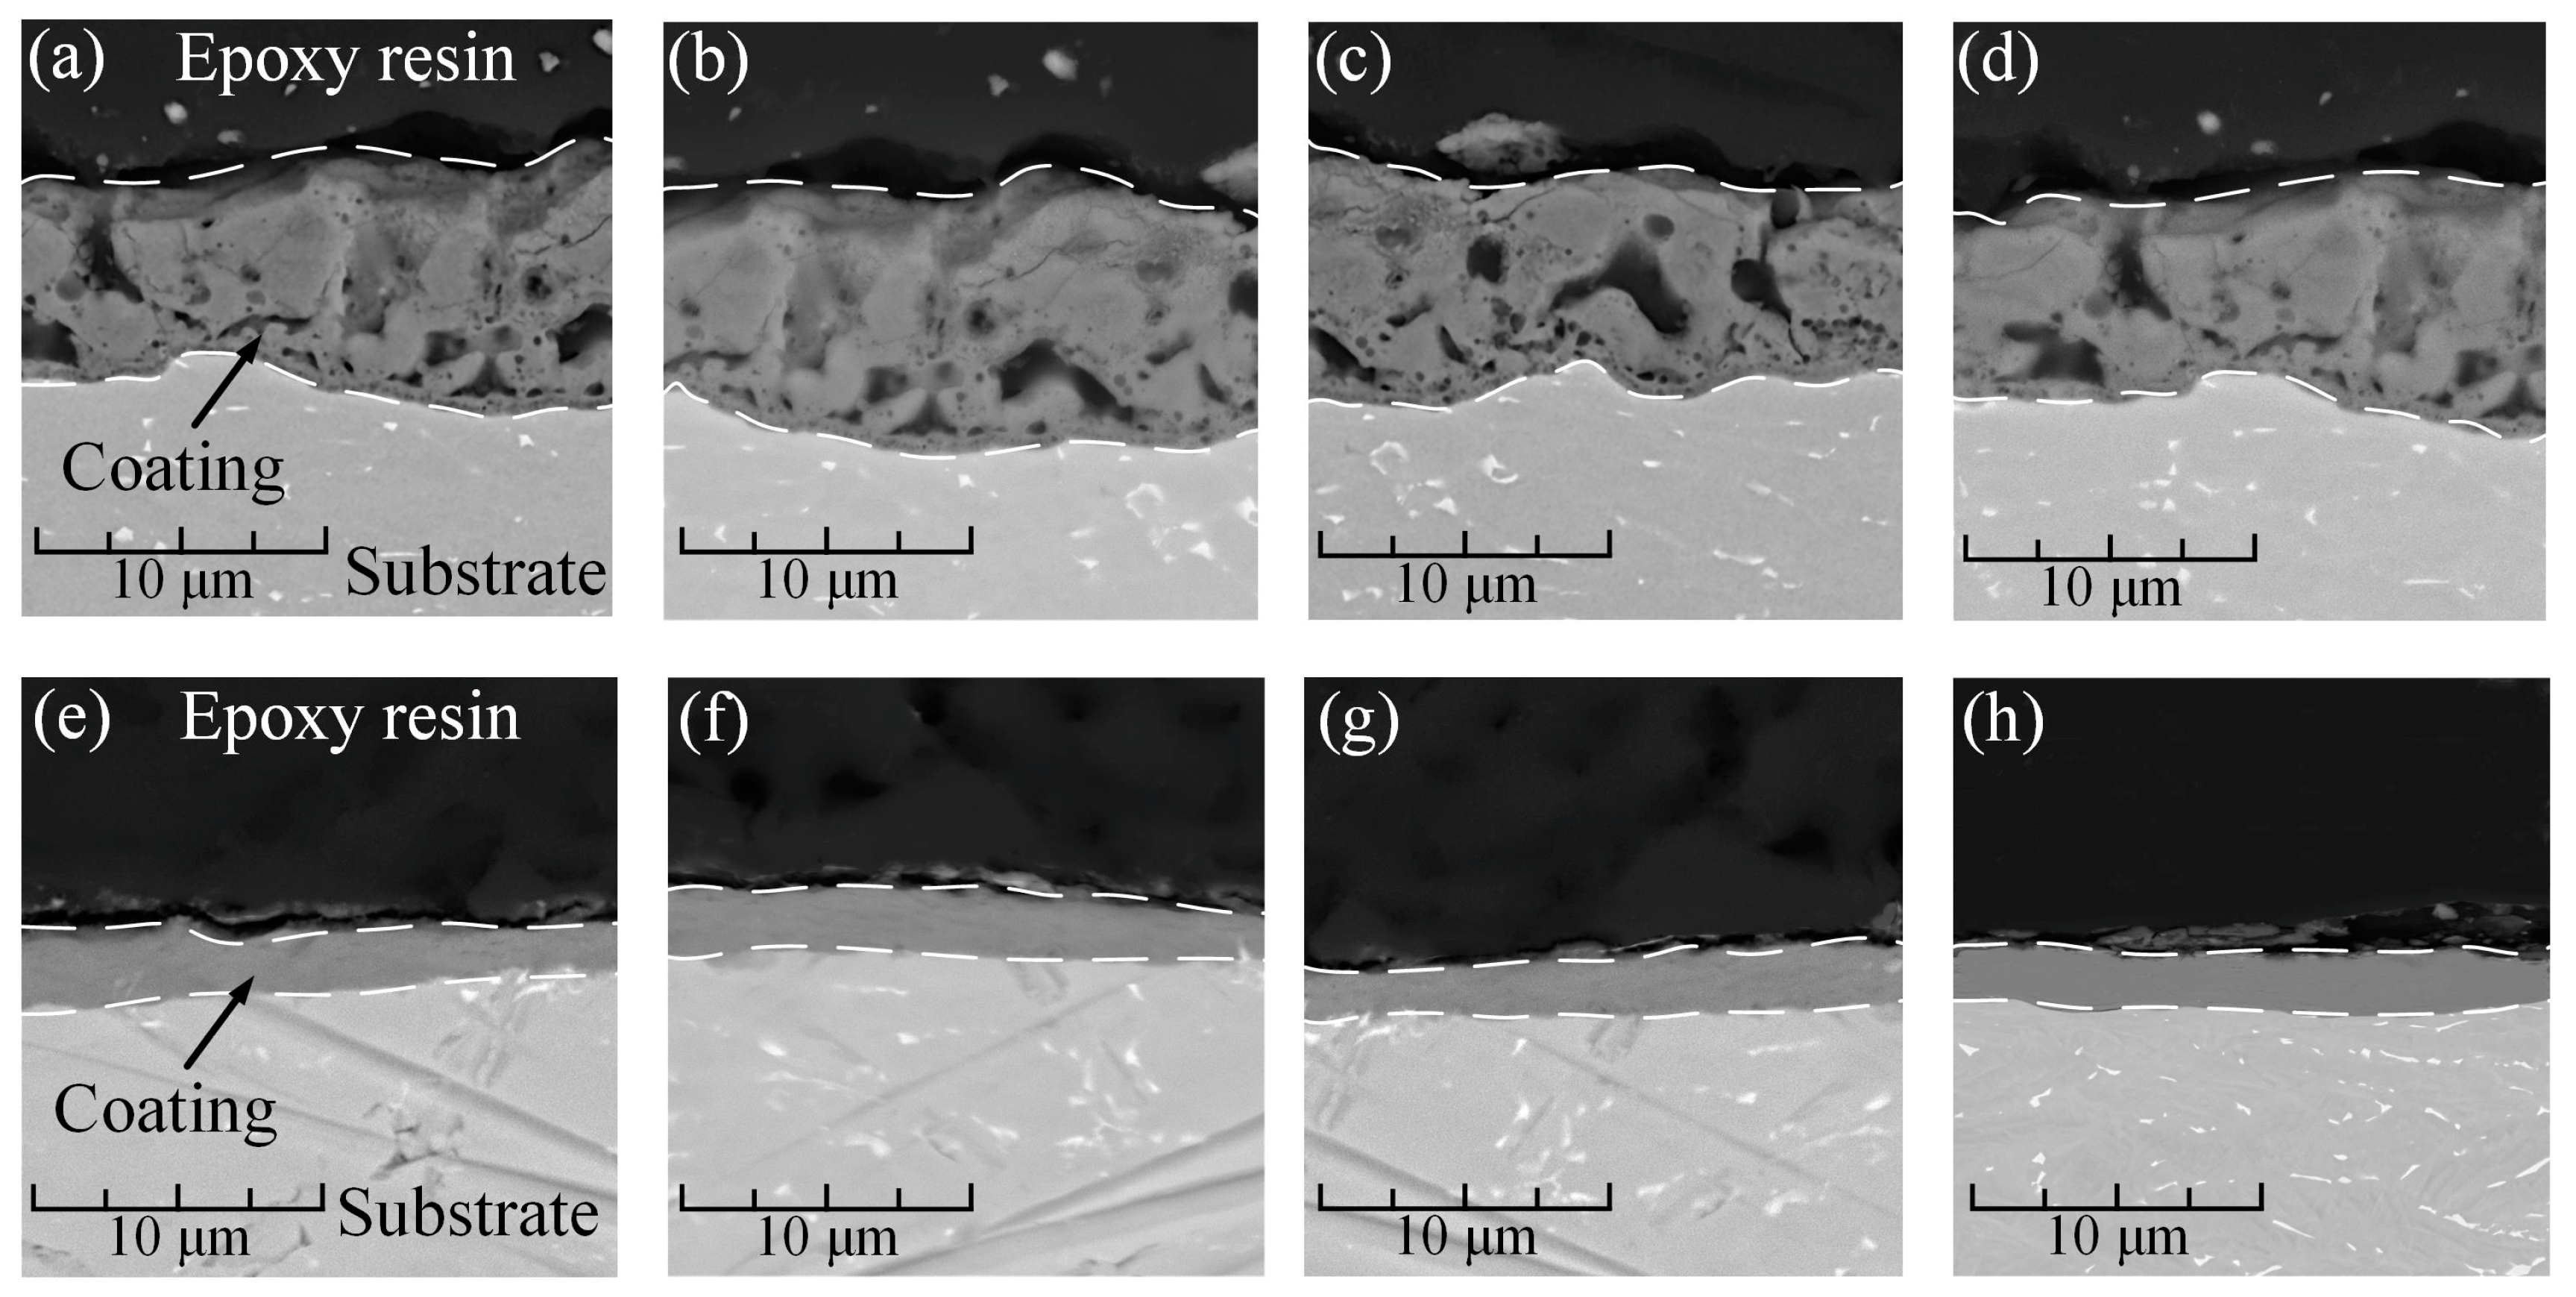
An analysis of the cross-sectional morphology of samples obtained by PEO and treated with A, UV, P, and O is presented in
Figure 6.
The morphology of the cross sections of samples obtained in an aqueous electrolyte (
Figure 6a–d) has a thickness of 8–10 μm and is a porous structure with a pore size of 0.1–4 μm. The samples obtained in molten salts (
Figure 6e–h) have a denser and non-porous coating structure with an average thickness of 1.5–2 μm. As can be seen from the presented micrographs, the surface treatment (A, UV, P, and O) of the coatings to clean them from organic contaminants did not affect their structural integrity. The presented morphological features of the cross-sections of the studied samples are typical. They are determined by the temperature, electrolyte type, voltages, and currents of coating formation, as well as the “nature” of the process itself.
The chemical composition of the surface
Figure 3 measured by the EDS detector is presented in
Table 3.
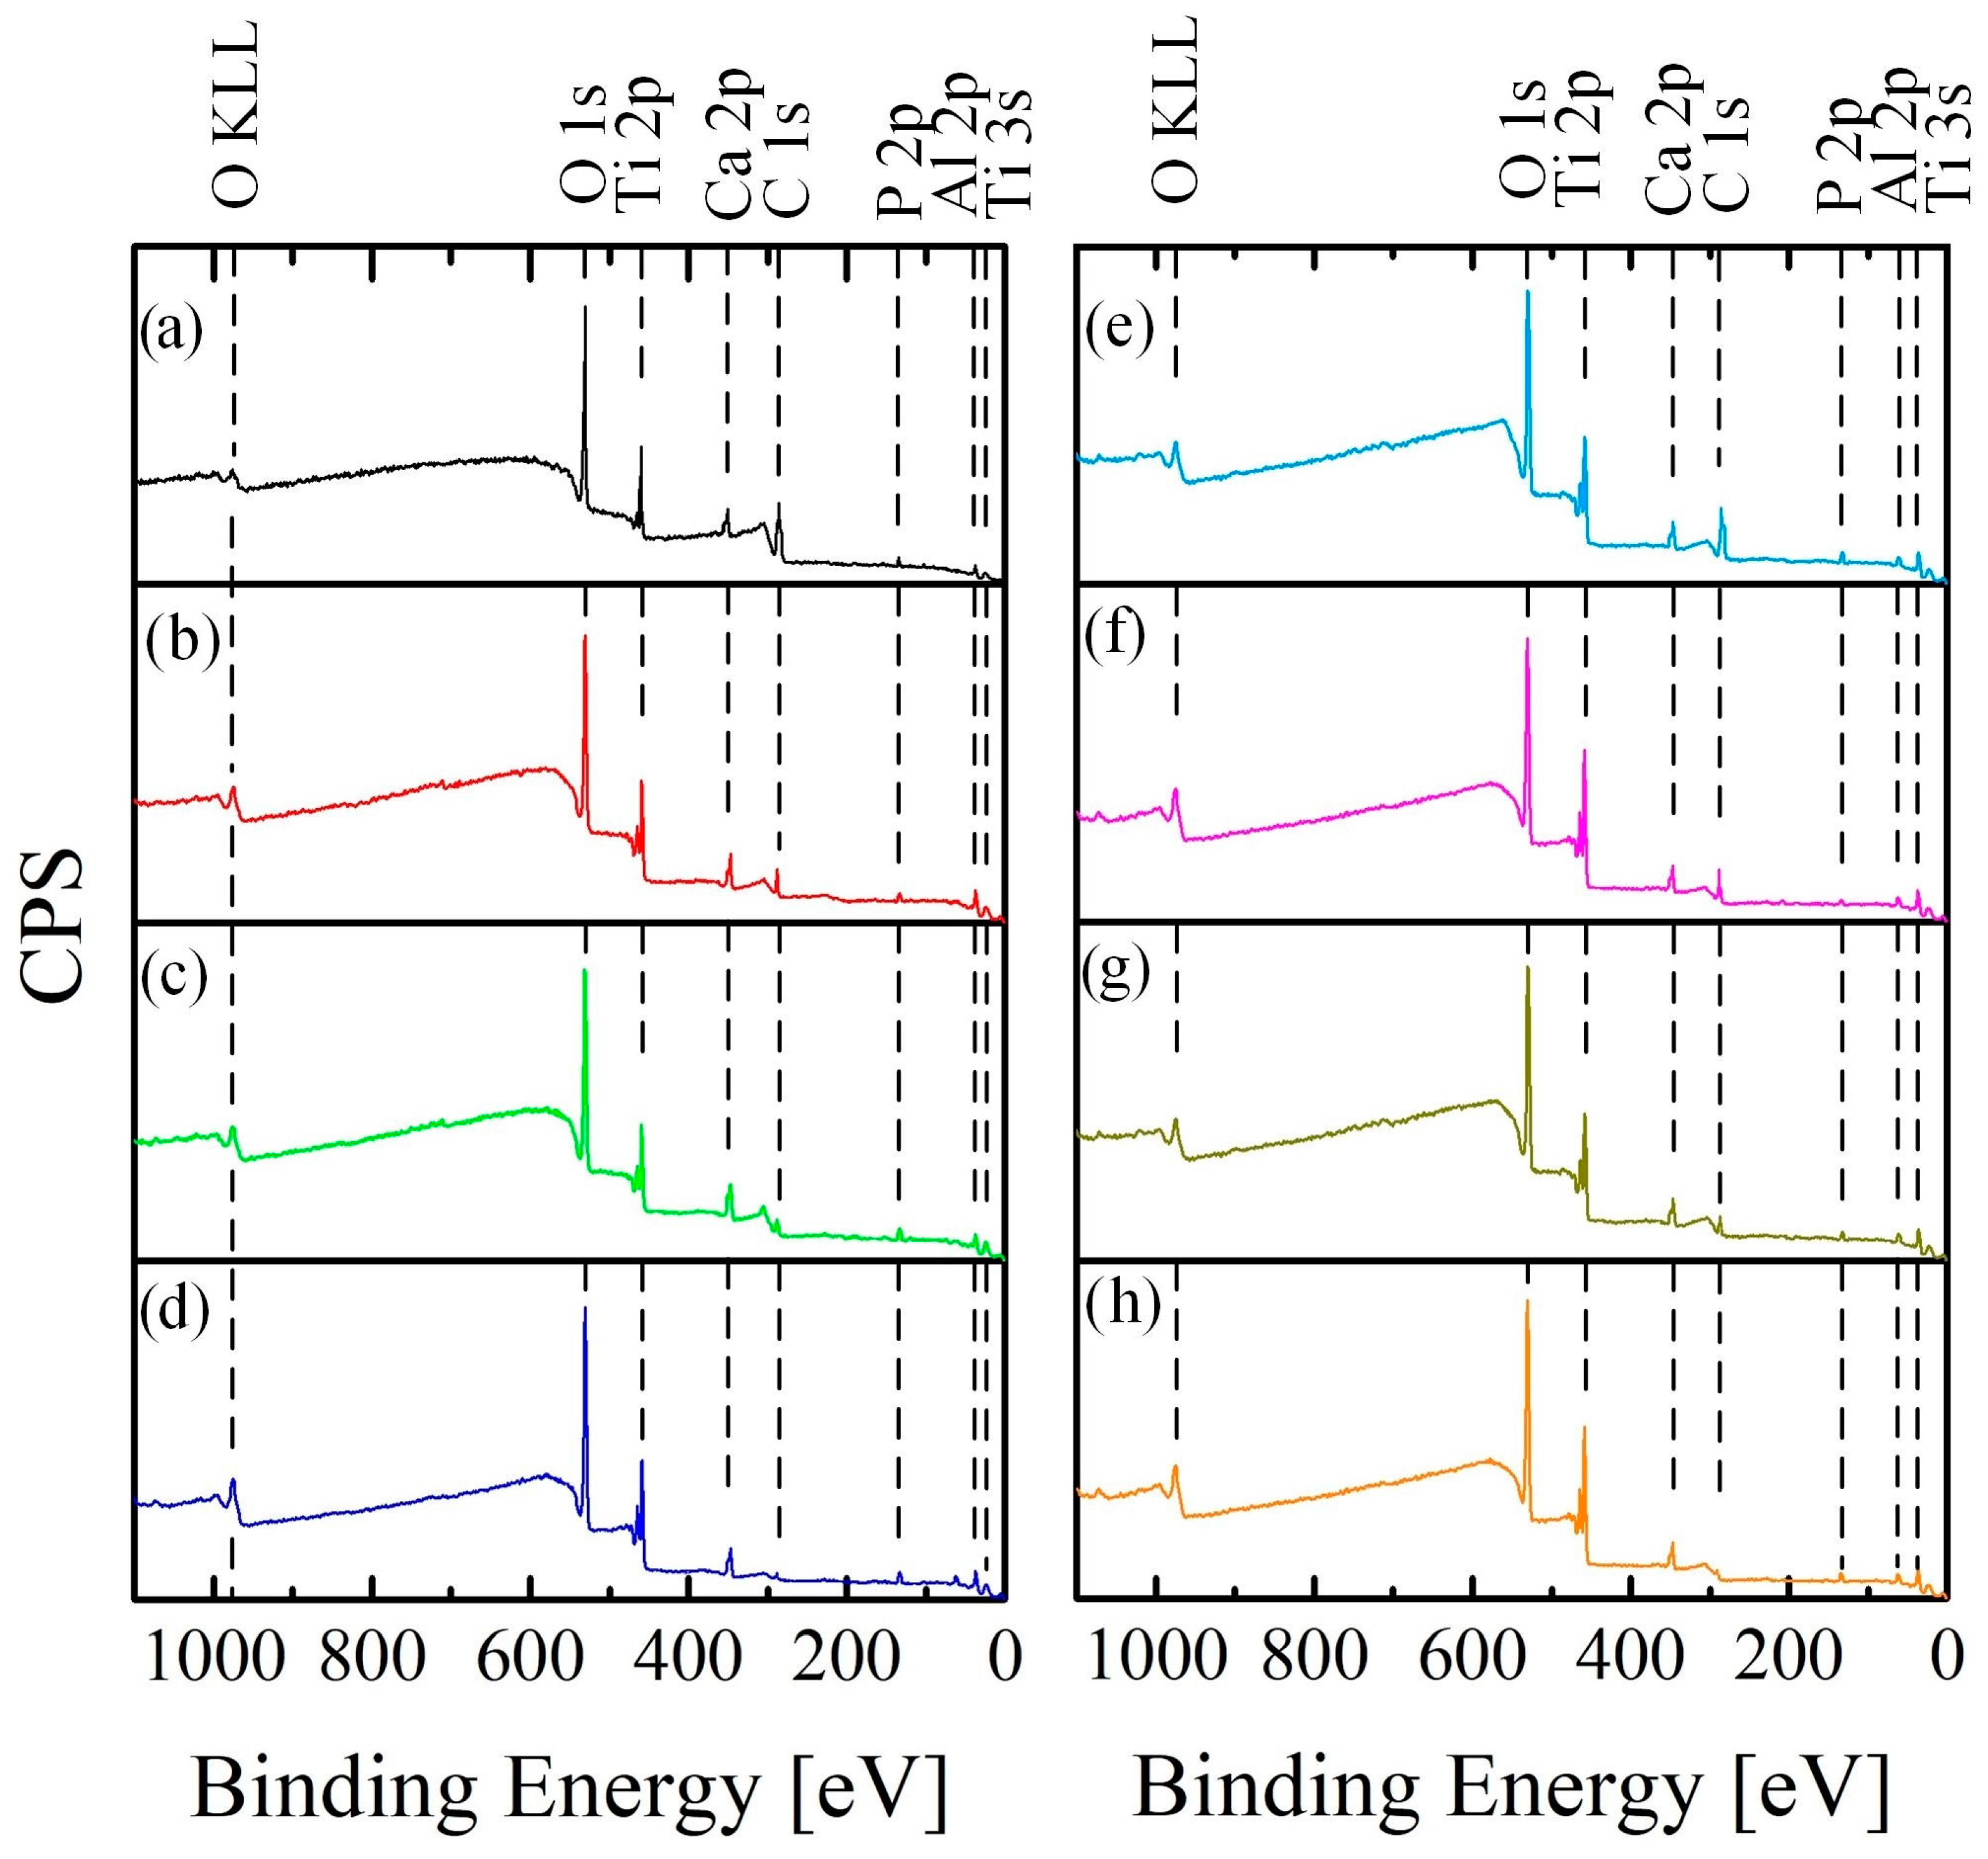
XPS chemical analysis was performed to improve the detection ability and accuracy of the research. The low-resolution spectrum for all samples under study is shown in
Figure 7.
XPS analysis confirmed the presence of carbon, oxygen, titanium, calcium, and phosphorus bonds on the surface. The samples obtained by the PEO method in aqueous electrolytes present high contamination with organic substances since organic salts (calcium glyceryl phosphate and calcium acetate) were used as electrolyte components. The samples obtained in molten salts had less organic contamination since molten salts at a temperature of 280 °C were used as an electrolyte.
After surface treatment by hydrothermal treatment, the carbon concentration on the surface was 5.21 ± 0.08 at.% and 4.63 ± 0.06 at.% for samples AS-A (
Figure 7a) and MS-A (
Figure 7e), respectively. The UV-treated samples showed a higher surface finish, and the carbon concentration was 2.13 ± 0.02 at.% and 1.63 ± 0.07 for AS-A-UV (
Figure 7a) and MS-A-UV (
Figure 7f), respectively. A fairly good result was shown by the CP method (AS-A-P = 1.01 ± 0.1 at.% and MS-A-P = 0.86 ± 0.2 at.%). However, an organic pollutant remained on the surface, which in the future could interfere with the effective osseointegration of the bioactive surface [
57]. It can also cause unwanted inflammatory processes in the human body.
Ozone treatment was the most moderate and effective surface cleaning method since the formed coating, and HAP crystals almost did not change their morphology. The amount of organic contaminants decreased by almost 50 times compared with the samples after A and amounted to 0.11 ± 0.03.% (AS-A-O) and 0.12 ± 0.02 at.% (MS-A-O). The percentage of chemical elements included in the coating increased (
Table 4) in proportion to the amount of carbon loss after cleaning.
Based on the results of chemical analysis conducted using EDS (
Table 3) and XPS (
Figure 7,
Table 4), it was observed that during the surface cleaning process, not only were the organic contaminants removed, but the bioactive coating layer was also affected and removed. For example, after UV treatment, the surface concentration of calcium and phosphorus in the coating on samples AS-A-UV and MS-A-UV decreased by almost 30% compared to AS-A and MS-A, respectively. The surfaces of the samples treated with plasma (AS-A-P, MS-A-P) were less destructive compared to the UV method, but the decrease in the concentration of Ca and P was about 17% compared to the samples treated with the A method. Ozone was the most gentle treatment method, which, on average, reduced the surface concentration of bioactive elements (Ca, P) by 3% compared to the base samples AS-A, and MS-A. The results of chemical analysis (EDS, XPS) show a decrease in the concentration of organic impurities or their complete removal, as well as a reduction of the concentration of the near-surface layer of calcium and phosphorus, also confirmed by the morphology of the coating.
It is important to note that all cleaned surfaces exhibit bioactive properties as they contain HAP crystals on their surfaces. Their bioactivity and osseointegration rate is determined by the presence of HAP on the surface and by their size and quantity per surface unit. Thus, with a decrease in the size of HAP crystals and an increase in their number per unit surface, their mechanical strength and osseointegration rate increase [
58], demonstrated by coatings obtained in molten salts (
Figure 5e–h).
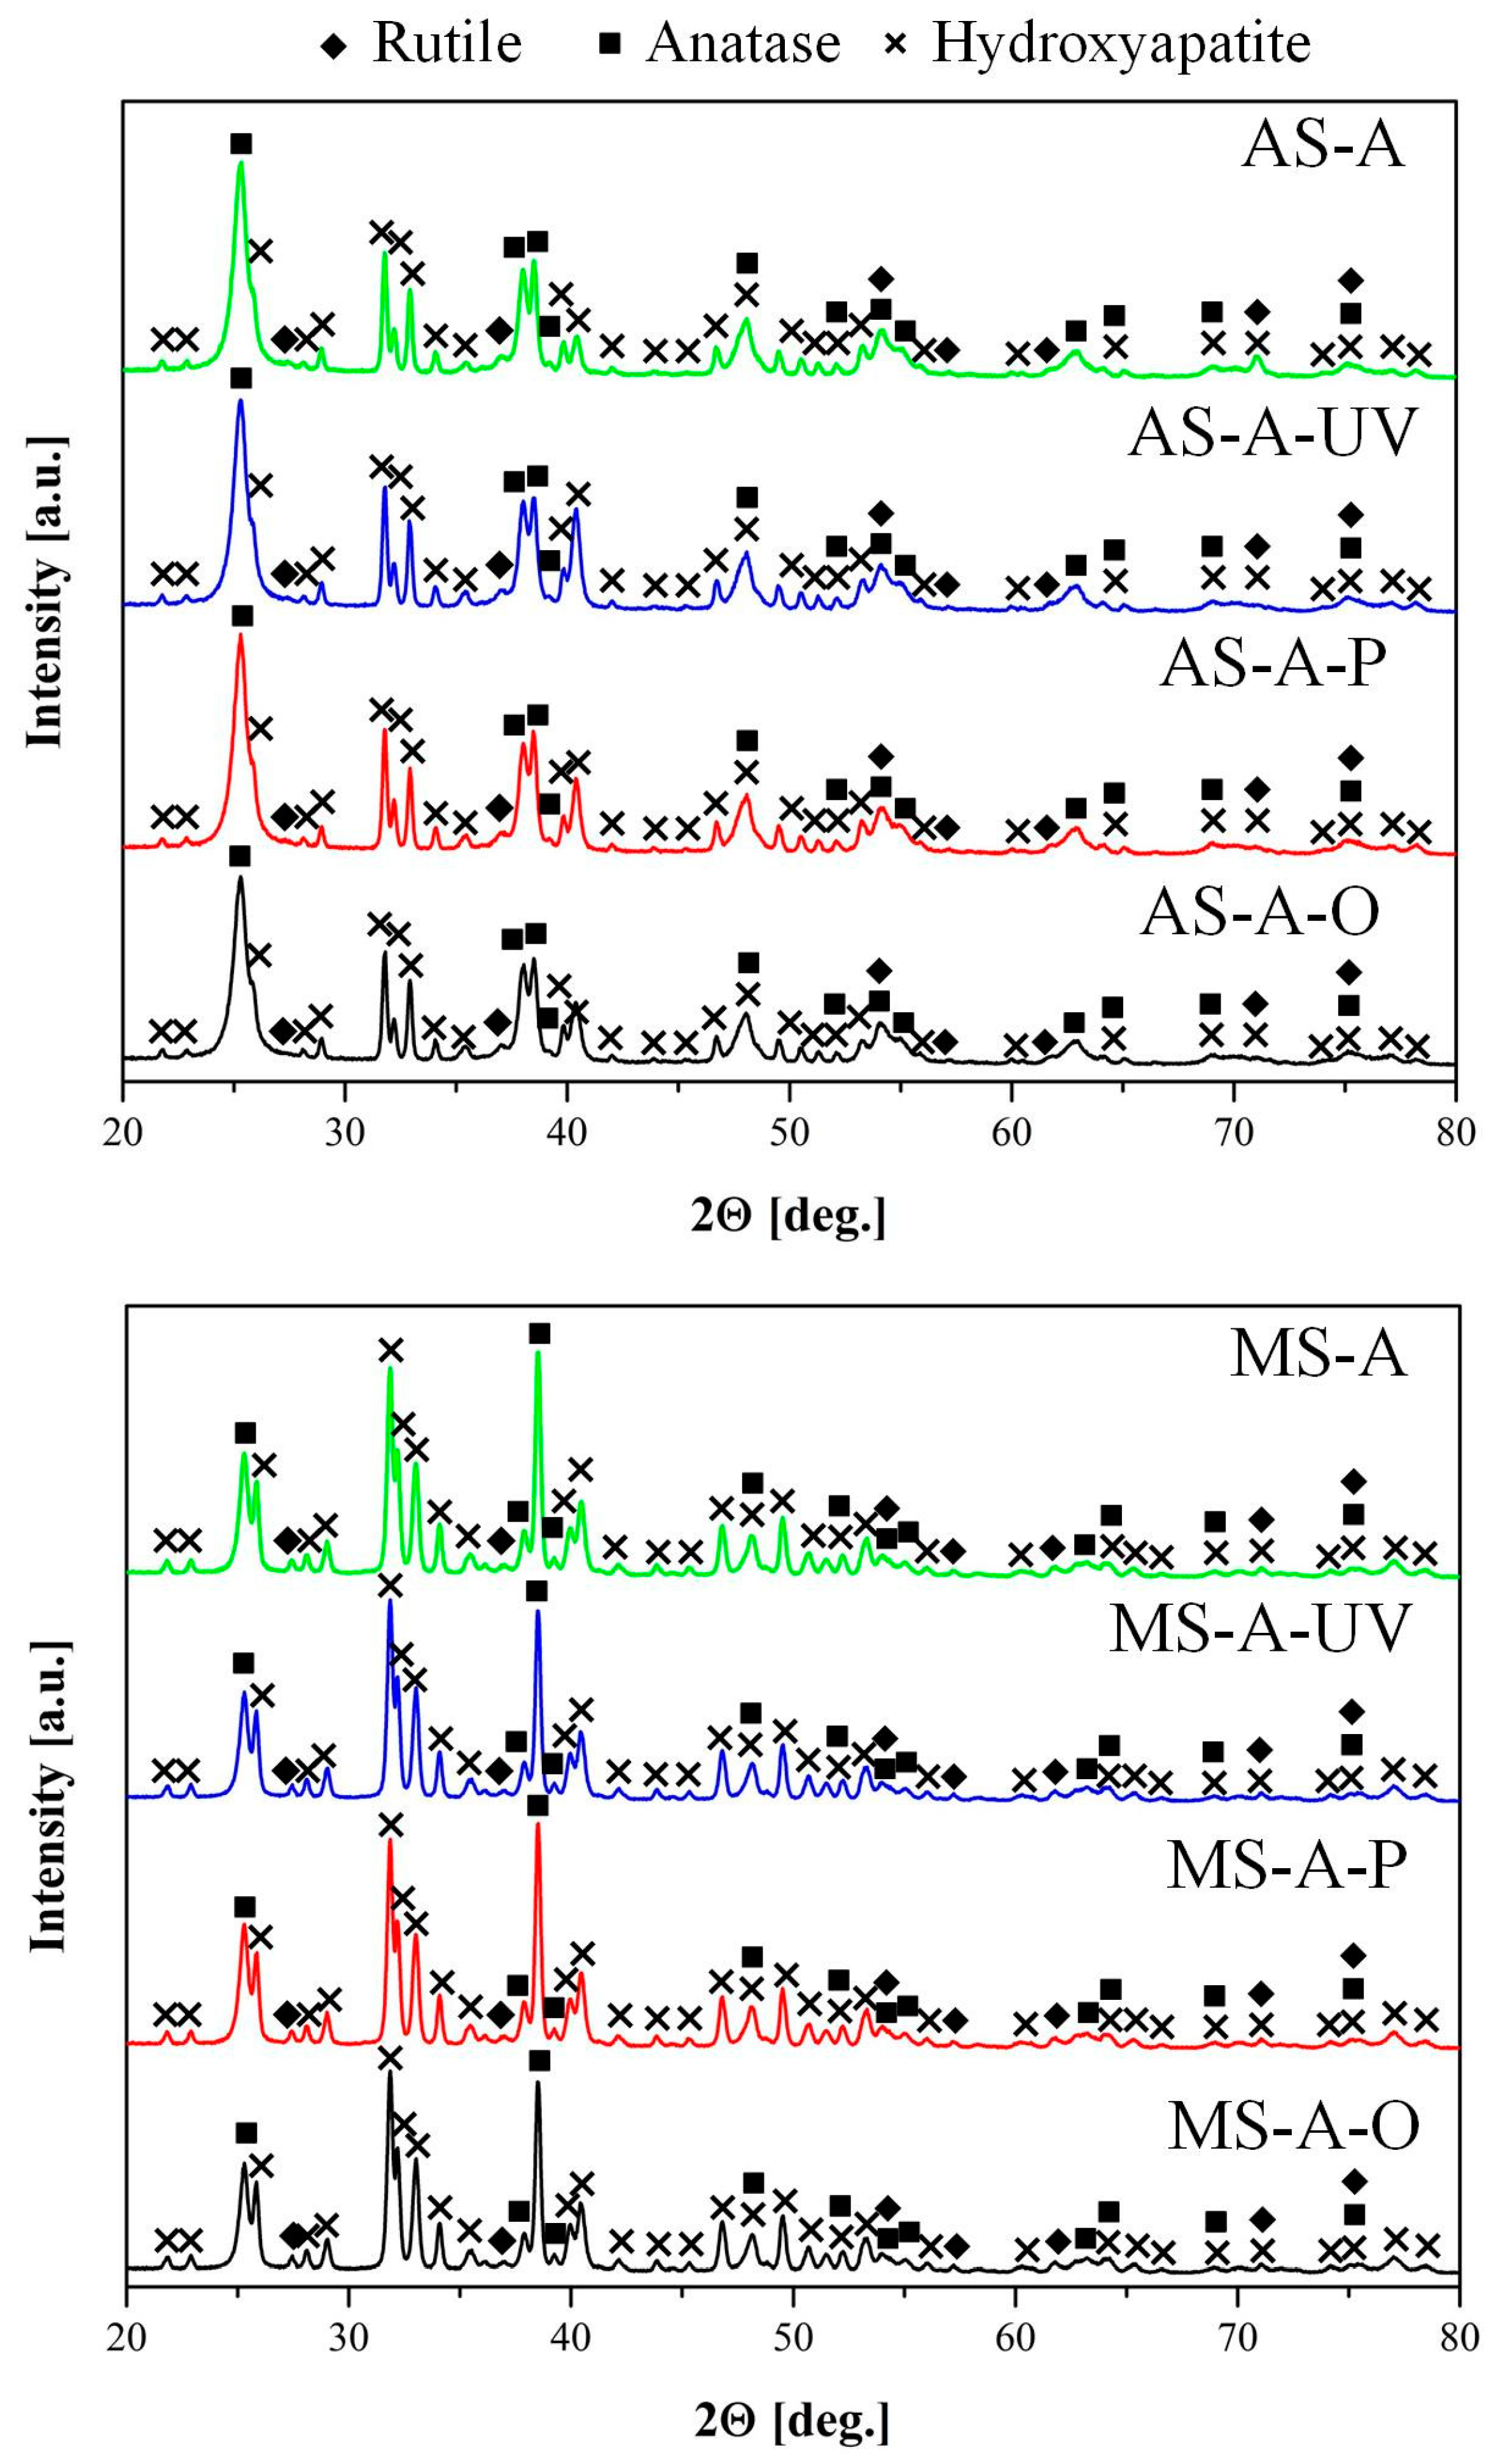
3.3. Phase Characterization
The phase compositions of the oxide layers after cleaning were analyzed using the X-ray patterns presented in
Figure 8.
The phase composition of the coatings obtained by the PEO method in aqueous electrolytes and molten salts after surface cleaning of organic contaminants was determined by XRD analysis. The coatings consist of anatase, rutile, and HAP phases. As a result of phase analysis, it was revealed that, regardless of the method of coating preparation (aqueous electrolytes or molten salts), surface cleaning methods have little effect on the final phase composition of the coating. However, it should be noted that based on the quantitative phase analysis using the Rietveld Refinement method (
Table 5), the content of the HAP phase in the samples obtained in molten salts is almost 2.5 times higher than in the samples obtained in aqueous electrolytes. These results are further supported by the surface morphology observations (
Figure 5), which reveal that the HAP crystals obtained in molten salts are smaller (
Figure 5e) and more evenly distributed across the surface. Additionally, their “packing” number and density are significantly higher than the HAP obtained in aqueous solutions (
Figure 5a). Furthermore, the content of the anatase phase in samples obtained in aqueous electrolytes is almost three times higher than in molten salt samples.
According to XRD data for coatings obtained in aqueous electrolytes and molten salt, shown in
Figure 8, the crystallite size (D) was calculated using the Debye–Scherrer equation:
where: β refers to the half-width of the detected diffraction maximum. The parameter K, commonly referred to as the shape factor, typically has a value of approximately 0.9, and λ denotes the wavelength of the X-ray source.
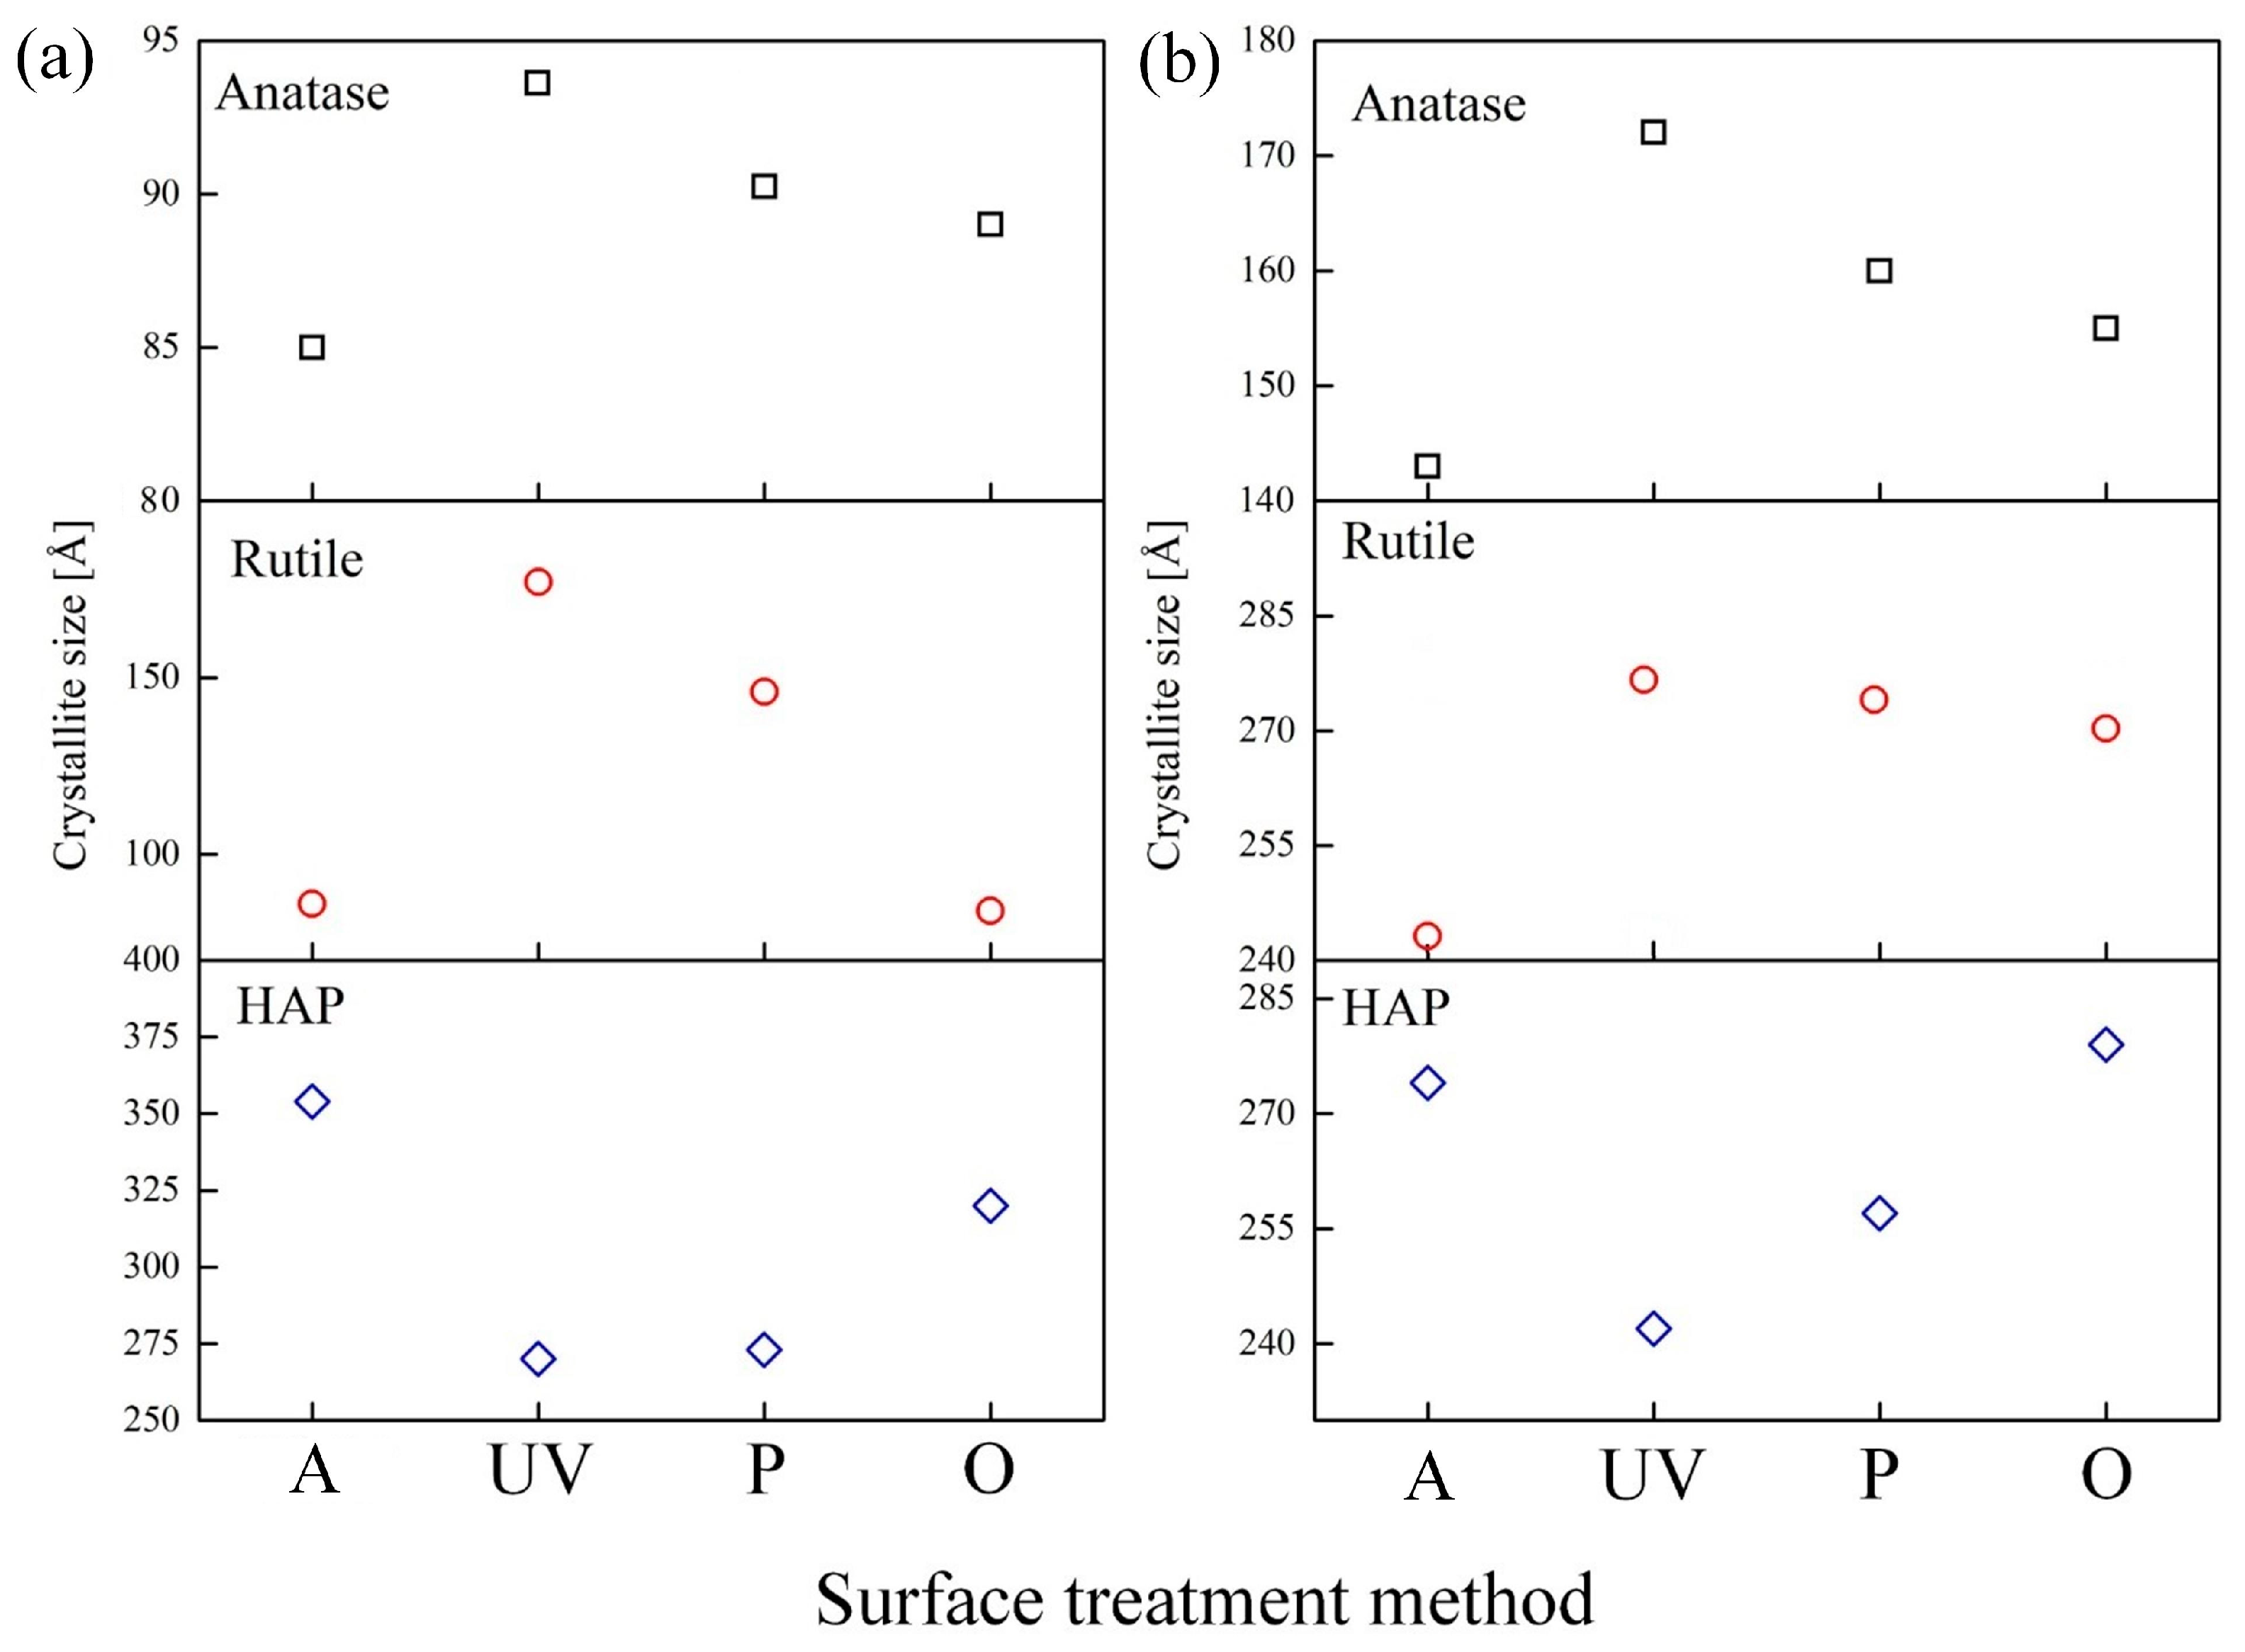
Based on the calculated data, it was revealed that the coating obtained in aqueous electrolytes consists of anatase (D = 85–95 Å), rutile (D = 86–177 Å), and HAP (D = 270–354 Å) crystallites.
The crystallite size obtained in molten salts by the PEO method for anatase (143–172 Å) and rutile (243–278 Å) increased by 1.5–2 times compared to the results in aqueous electrolytes. Most likely, the coatings obtained in molten salts have a larger crystallite size since the electrolyte used is kept at a higher temperature (280 °C) [
59]. The increased temperature promotes the growth of crystallites. In addition, it is pertinent to highlight that the elevated temperature of the electrolyte has a positive effect on the formation of coatings with high crystallinity, which is often difficult to achieve in aqueous electrolytes. Typically, the phase composition of coatings obtained in an aqueous electrolyte consists of a mixture of amorphous and crystalline phases. The size of the formed HAP crystallites included in the composition of the coating obtained in an aqueous electrolyte and molten salts have similar dimensions. It should also be noted that during the cleaning process, the size of HAP crystallites decreases (
Figure 9,
Table 5) in the following sequence for coatings obtained in aqueous electrolytes AS-A (354 Å) > AS-A-O (323 Å) > AS-A-P (275 Å) > AS-A-UV (270 Å) and molten salts MS-A (278 Å) > MS-A-O (270 Å) > MS-A-P (260 Å) > MS-A-UV (243 Å). This pattern of degradation of the HAP coating is also confirmed by the results of the surface morphology analysis (
Figure 4 and
Figure 5) and its chemical composition (
Figure 7 and
Table 3 and
Table 4). An opposite relationship is observed for the anatase and rutile phases, i.e., during the cleaning process, crystallites grow in the following sequence for anatase AS-A (85 Å) < AS-A-O (88 Å) < AS-A-P (90 Å) < AS-A-UV (94 Å), MS-A (143 Å) < MS-A-O (155 Å) < MS-A-P (160 Å) < MS-A-UV (172 Å), as well as for rutile AS-A (86 Å) < AS-A-O (87 Å) < AS-A-P (149 Å) < AS-A-UV (177 Å), MS-A (243 Å) < MS-A-O (263 Å) < MS-A-P (273 Å) < MS-A-UV (278 Å). As a result, it can be concluded that the ozone surface treatment method most effectively fights organic contaminations (
Figure 4d,h and
Figure 7d,h) and practically does not affect the crystallinity (
Figure 9), phase (
Figure 8), chemical (
Figure 7) and morphology (
Figure 5d,h) composition of the coatings.
3.4. Wettability
One of the main conditions for successful dental implantation is sufficient primary stabilization of the implant in the bone tissue [
60]. Primary stability depends on the geometry of the implant and its topography [
61]. The presence of micro defects (pores) [
62] and bioactive material (HAP) crystals on the implant surface increases the contact area. It allows osteoblasts to attach the implant surface using structural proteins and glycoproteins more effectively, thereby contributing to the acceleration of the osseointegration process [
63]. The effects of Facilitating the process of osseointegration are related to the surface’s wettability.
The study of surface wettability was carried out for samples obtained after PEO treatment in an aqueous solution and molten salts, followed by their purification by various methods presented above. Wettability was examined by measuring the contact angle (CA) using Hank’s solution kept at 37 °C.
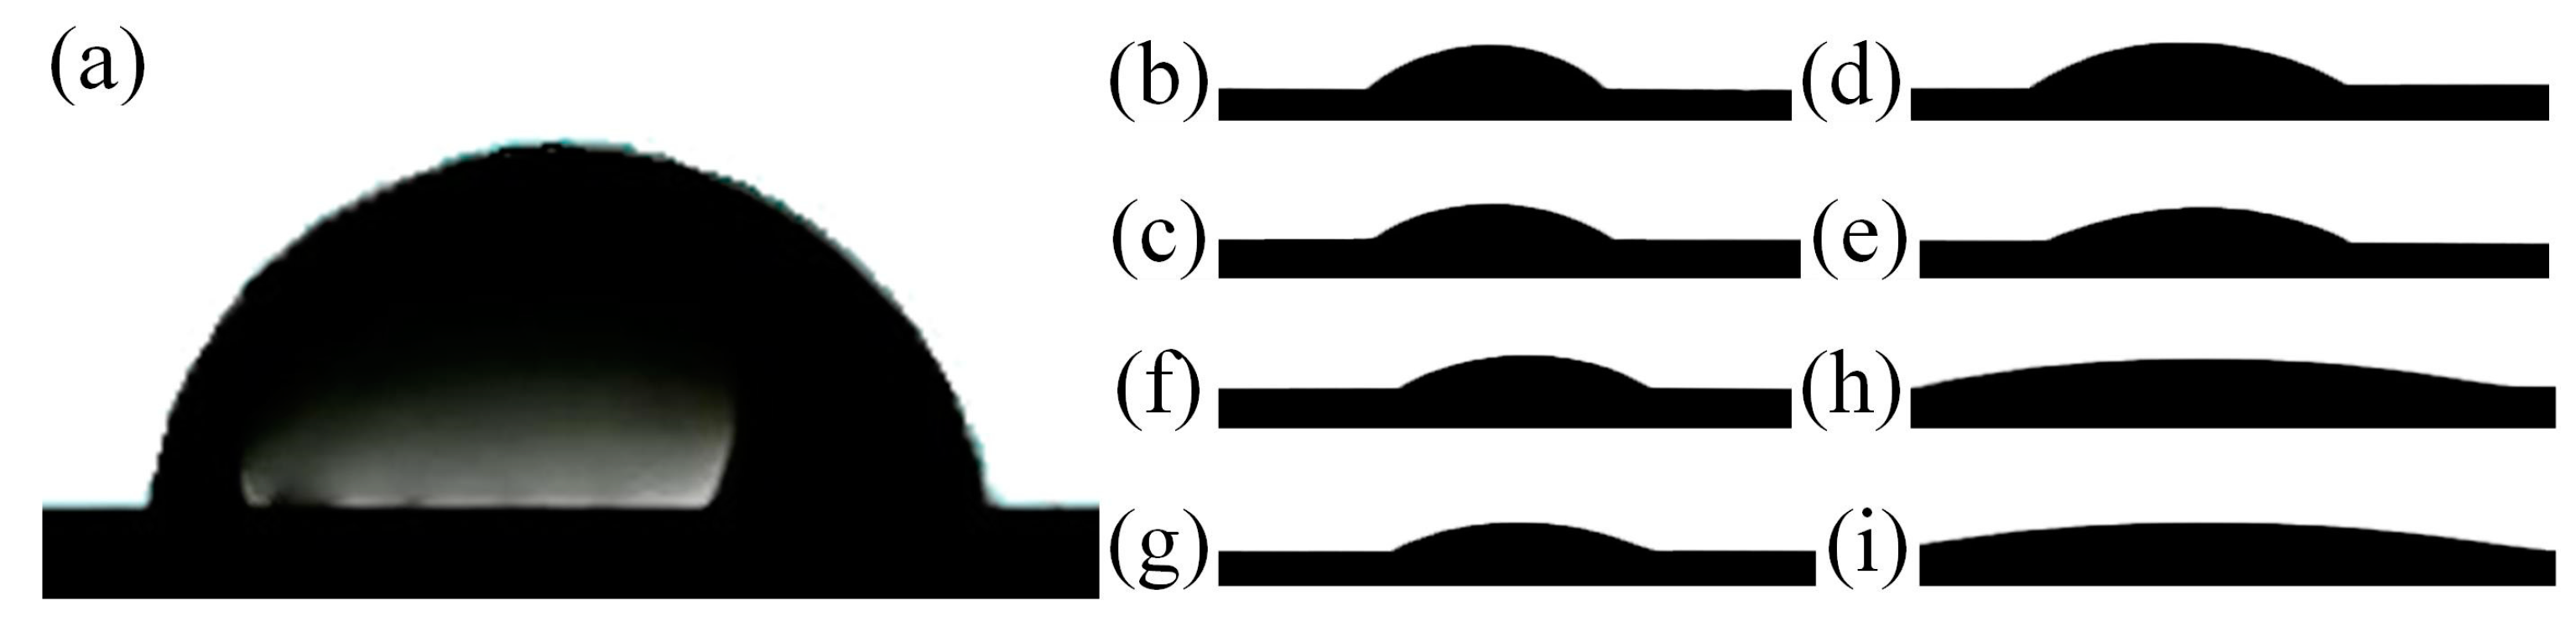
Dripped drops of Hanks’ solution and the measured CA’s are shown in
Figure 10 and
Table 6.
The untreated Ti-6Al-4V alloy had a less hydrophilic surface with CA = 78.2 ± 1.1°, compared with the treated samples in
Table 6.
After the PEO, in the process of surface treatment by the A method, HAP crystals are formed from the calcium and phosphorus precursors previously introduced into the coating composition, increasing the specific surface of the samples. In addition, the A method cleans the surface of organic contaminants. Based on the results of the contact angles measurements (
Table 6), the fine-grained structure of HAP obtained in molten salt has more hydrophilic surface properties (MS-A = 25.3 ± 1.1°) compared to the sample obtained in aqueous electrolyte (AS-A = 35.2 ± 1.5°). The hydrophilicity of the coated surface increased with further surface treatment by the UV, P, and O methods, which directly corresponds to a reduction in organic contaminations and a decrease in the contact angle as follows: A > UV > P > O. This holds true for coatings obtained in molten salt (25.3° > 19.5° > 10.5° > 7.5°) and coatings obtained in aqueous electrolytes (35.2° > 28.3° > 26.1° > 16.6°). Analyzing the morphology, phase, and chemical composition was also confirmed by reducing organic contamination.
An additional and significant factor affecting the surface’s physical properties is the coating’s degradation during cleaning. This pattern was discussed above for both MS and AS coatings.
Based on the results, ozone cleaning is the most effective and moderate surface treatment method. This treatment not only preserves the HAP crystals (
Figure 4d,h) but also efficiently eliminates organic contaminants (
Figure 5d,h and
Figure 7d,h), significantly reducing contact angles. Specifically, the contact angle for sample AC-A-O is reduced to 16.6 ± 0.7°, while for samples MS-A-O, it is reduced to 7.5 ± 0.4°.
This phenomenon is associated with the generation of singlet oxygen during ozone surface treatment. It efficiently eliminates organic contaminants and enhances the formation of polar groups on the surface, thereby increasing its surface energy and resulting in more excellent hydrophilicity.


 ,
, 


