Article

Effects of Bi–Sn–Pb Alloy and Ball-Milling Duration on the Reactivity of Magnesium–Aluminum Waste-Based Materials for Hydrogen Production

by
Olesya A. Buryakovskaya
*,
Grayr N. Ambaryan
,
Alexey B. Tarasenko
,
Musi Zh. Suleimanov
and
Mikhail S. Vlaskin
*
Joint Institute for High Temperatures of the Russian Academy of Sciences, 125412 Moscow, Russia
*
Authors to whom correspondence should be addressed.
Materials 2023, 16(13), 4745; https://doi.org/10.3390/ma16134745
Submission received: 28 May 2023 / Revised: 26 June 2023 / Accepted: 28 June 2023 / Published: 30 June 2023

Abstract

:
In the present study, composite materials were elaborated of mixed scrap of Mg-based casting alloys and low melting point Bi–Sn–Pb alloy by high energy ball milling, and their reactivity in NaCl solution with hydrogen release was tested. The impacts of the additive content and ball milling duration on their microstructure and hydrogen generation performance were investigated. Scanning electron microscopy (SEM) analysis revealed significant microstructural transformations of the particles during milling, and X-ray diffraction analysis (XRD) proved the formation of new intermetallic phases Mg3Bi2, Mg2Sn, and Mg2Pb. The said intermetallic phases were anticipated to act as ‘microcathodes’ enhancing galvanic corrosion of the base metal. The dependency of the samples’ reactivity on the additive content and milling duration was determined to be nonmonotonic. For the samples with 0, 2.5, and 5 wt.% Rose alloy, ball-milling during 1 h provided the highest hydrogen generation rates and yields (as compared to 0.5 and 2 h), while in the case of the maximum 10 wt.%, the optimal time shifted to 0.5 h. The sample activated with 10 wt.% Rose alloy for 0.5 h provided the highest ‘metal-to-hydrogen’ yield and rapid reaction, thus overperforming those with lower additive contents and that without additives.

1. Introduction

Global over-reliance on fossil fuels creates a good deal of problems. The environmental impacts include emission of greenhouse gases [1,2] and pollution of water sources [3,4], while regional economic development may suffer from shortages and disruptions in the energy carrier’s supply [5,6]. Overcoming those complex issues requires transition to renewable clean energy sources. Hydrogen represents an environmentally friendly secondary energy carrier that can serve as temporary storage for green energy; its chemical energy can be converted into electricity and/or heat by means of fuel cells, internal combustion engines, catalytic combustors, and hydrogen-steam or hydrogen-fired gas turbines [7,8,9,10,11,12]. This gas can be derived from biomass or obtained by water splitting using solar, wind, or hydropower electricity [13,14,15,16].
To ensure evolution toward the ‘hydrogen economy’, modern infrastructure should be designed. While plenty of practical techniques for hydrogen production have been proposed, its storage and transportation still pose quite a challenge. For those applications, the best known methods currently include compression to 350–700 bar [17,18], liquification at −253 °C [19,20], and storage in a bound form using zeolites, metal–organic frameworks, covalent organic frameworks, carbon-based materials, metal hydrides, ammonia, methanol, etc. [21,22,23]. Along with all the advantages, each of the listed systems has its downsides. Thus, high-pressure systems bear the safety risks of gas leakage because of the degradation of the material’s properties (burst, fiber damage, fatigue life failures, collapse and blistering of the liner, typical for types III and IV composite hydrogen storage tanks) [24,25]. The cryogenic method requires high capital expenses and heavy energy consumption [26,27], and the rest of the methods still fail to provide both high hydrogen storage capacity and acceptable hydrogenation/dehydrogenation conditions [28,29].
An alternative to the said approaches is the implementation of Al and Mg, which react with water with hydrogen evolution. Although under normal conditions the reaction between those metals and water is hindered by their surficial oxide films or ceases soon after beginning owing to the formation of dense hydroxide layers, many useful activation techniques have been proposed [26]. Thus, implementation of nanometer-sized Mg and Al powders with extremely high specific surface areas was reported to enable their entire oxidation at room temperature [30,31]. Some approaches included disruption of the product layer by grinding or friction between particles under intensive mixing [32,33], ultrasonic treatment, and laser irradiation [34,35,36]. Hydrothermal temperatures (over 100 °C) are known to increase the diffusivity of water (liquid or gaseous) through the protective oxide layer or product deposit [37,38,39]. The original passive film and generating product layers can be removed chemically by their transformation into soluble compounds from their reactions with salt, acid, or alkali (for Al) aqueous solutions [40,41,42,43,44,45,46,47,48]. Introduction of metal additives (e.g., Ni, Co, Fe, Cu, Sn, Bi, Zn) to the basic Mg and Al materials by alloying or high energy ball milling was proved to enhance their corrosion with hydrogen production [49,50,51,52,53,54,55]. Another notable effect is embrittlement of the Al matrix based on low melting point Ga and its alloys with In, Sn, Zn, Bi, etc. [56,57,58,59,60]. One more widely used activation method is the preparation of composite powder materials by ball milling of Al and Mg with various additives, contributing to the particle size reduction and preventing their agglomeration (Al2O3, NaCl, FeCl3, AlCl3, CoCl2, KCl, g-C3N4, LiH, graphite, MoS2, MoO2, MoO3, etc.) [61,62,63,64,65,66,67,68,69,70].
Conversion of Mg and Al into hydrogen (and ecologically friendly Mg(OH)2 and Al(OH)3 or AlOOH) by their oxidation in aqueous media can be useful not only for hydrogen production but for effective waste utilization as well. For instance, metal from composite multilayer materials can be oxidized with the separation of plastic and/or paper layers [43]. Dross, scrap, and dust capable of causing uncontrollable hydrogen release upon contact with leachate or other oxidizing media can be effectively disposed of [71,72,73,74,75,76,77,78,79]. Complex alloys with high contents of alloying elements and small fractions of impurities, mixed waste compositions, and disperse materials (chips, shavings, etc.) with their extended surface partially oxidized and covered by lubricants can be recycled [80,81,82].
The mentioned mixed waste of complex alloys in a disperse form can be activated by ball milling in order to increase its reactivity for hydrogen generation. Ball milling is an advantageous technique for that purpose since it provides particle size reduction, thus increasing the specific surface area of the sample exposed to oxidizing aqueous media. It also induces the accumulation of crystal lattice imperfections favoring local corrosion attacks with hydrogen release. Another useful effect of ball milling is the distribution of an activating additive over the sample’s particles. Additives of metals ‘nobler’ than Al or Mg form microgalvanic couples with them, thus intensifying their ‘anodic’ corrosion with hydrogen evolution. The efficiency of ball milling is considerably affected by many factors. Thus, relatively small stainless steel balls (6 mm in diameter) demonstrated poor usability for particle size reduction as compared to the larger ones (≥10 mm) [83]. The grinding jar filling fractions of 45–50 vol.% [84] and 40–60 vol.% [85] proved to be more effective in comparison with the smaller and the larger ones. Denser milling ball material, tungsten carbide, appeared to outperform stainless steel [84]. Low rotational speeds (up to 200 rpm) imposed rather a small impact on the milling process as compared to 300–700 rpm [85]. A larger ball-to-powder mass ratio provided more extensive milling and contributed to particle size reduction, together with refinement of the additive inclusions and intermixing of the components in composite powders [86,87]. Process duration also was a critical parameter affecting the structural evolution of the metal particles. Thus, for aluminum powders, long ball-milling intervals (over 7–8 h) resulted in a negligible further particle size reduction, a small increase in lattice imperfections, and insignificant changes in the dispersion of the additive (alumina nanoparticles) in the aluminum matrix [88,89].
Magnesium alloy castings are known as important components of automotive, aerospace, and other transportation industries, and their machining results in the generation of tons of scrap [90,91,92,93]. Those amounts of magnesium-based waste have the potential for effective utilization with hydrogen generation. Numerous small metal mechanical enterprises currently dispose of wastes generated in their production processes, thus imposing a negative environmental impact [94]. Instead of that, they could benefit from waste utilization with in situ hydrogen production and its conversion to provide energy for balance-of-plant needs. For better efficiency, the procedure should include waste collection and utilization at the same mechanical machining enterprise that generated it. In the present study, an approach to obtaining hydrogen from the reaction between aqueous salt solution and hydroreactive samples manufactured of mixed scrap of the ML10 and ML5 alloy grades, generally equivalent to the NZK (Mg–Nd–Zn–Zr) and AZ91D (Mg–Al–Zn) respectively, was tested. The solution was 3.5 wt.% NaCl, because it simulates ecologically friendly sea water, and it is a standard solution used in many studies on the corrosion of Mg-based alloys with hydrogen release. The hydroreactive materials were produced via high energy ball milling. The starting materials were the said mixed scrap and commercial low melting point Bi–Sn–Pb (Rose) alloy serving as an activating additive. Bi, Sn, and Pb were reported to intensify hydrogen release accompanying the corrosion of Mg alloys owing to the formation of intermetallic phases Mg3Bi2, Mg2Sn, and Mg2Pb. With their respective corrosion potentials of −1463, −1498 and −1002 mV (measured in 3.5 wt.% NaCl solution), those compounds are ‘cathodic’ to the Mg phase (−1669 mV) [95,96,97]. In recent years, prices for bismuth have decreased considerably [98], while tin and lead are known as available and inexpensive materials. Despite its toxicity, lead is widely used in batteries for which special recycling/recovery programs exist; some tin compounds can impose toxic effects; however, leaching, roasting, and precipitation procedures can be used for the effective extraction of these metals [99,100,101]. Low melting point metals (such as In, Zn, Bi) appear to be effective for Mg activation because they readily react with the formation of complex ‘cathodic’ compounds during ball milling [102]. The Rose alloy components have low melting temperatures (271 °C for Bi, 327 °C for Pb, and 232 °C for Sn [103,104,105]). For Rose alloy, the temperature is still lower (94 °C), which is potentially useful for its effective distribution over the samples’ particles during ball milling. The aim of the present study is to investigate the effects of the additive concentration and ball-milling time on the hydrogen yield and evolution rate of the hydroreactive samples manufactured from the scrap of the ML5 and ML10 alloys.

2. Materials and Methods

The original material for the hydroreactive samples was represented by shavings and chips of the ML10 and ML5 alloy grades (National Standard ‘GOST 2856-79′ [106]), whose elemental compositions were generally similar to those for the AZ91D (Mg–Al–Zn) and NZK (Mg–Nd–Zn–Zr) alloys. The additive was represented by a commercial low melting point Rose alloy containing 18 wt.% Sn, 32 wt.% Pb, and 50 wt.% Bi (Technical Specification No 6-09-4065-88, ‘Rushim’ LLC, Moscow, Russia). The solution was prepared by dissolving chemically pure NaCl (National Standard GOST 4233-77 [107], ‘LabTech’ Ltd., Moscow, Russia) in distilled water.
The original scrap covered with lubricating oil was degreased using pure acetonitrile (Technical Specification No. 2636-092-44493179-04, ‘EKOS-1′ JSC, Moscow, Russia). The scrap–acetonitrile mixture was exposed to ultrasonic cleaning (1 h) in an ultrasonic bath sonicator (PSB-2835-05; ‘PSB-Gals’ Ltd., Moscow, Russia) and successive stirring (1 h) via a magnetic mixer (C-MAG; ‘HS 7 IKA-Werke’ GmbH & Co. KG, Staufen, Germany). After these manipulations, the used liquid was replaced with a fresh acetonitrile portion, and the procedures repeated. Finally, the cleaned scrap was separated and dried at room temperature for 24 h.
Composite samples were produced using a 50 mL milling pot filled in a glove box (G-BOX-F-290; ‘FUMATECH’ Ltd., Novosibirsk, Russia) under pure argon (99.993%, National State Standard GOST 10157-79 [108], ‘NII KM’ Ltd., Moscow, Russia), stainless steel balls, and a centrifugal ball mill (S 100; ‘Retsch’ GmbH, Haan, Germany). The parameters of the ball milling and samples are listed in Table 1.
The experimental facility was similar to that from a preceding study [83], but with a larger glass reactor (1000 mL, JSC ‘Lenz Laborglas’, Wertheim, Germany). The reactor was equipped with a magnetic mixer (C-MAG HS 7; JSC ‘IKA-Werke’, Staufen, Germany) and a heater (CC-308B; JSC ‘ONE Peter Huber Kältemaschinenbau’, Offenburg, Germany). After pouring 1000 mL of the solution into the reactor, it was heated up; then a sample was introduced into it. The experiment parameters are given in Table 1. Hydrogen passing through a Drexel flask was collected in a glass vessel with water, which was ejected into a flask mounted onto scales (ATL-8200d1-I; ‘Acculab Sartorius Group’, New York, NY, USA). The temperatures in the reactor and glass vessel were measured correspondingly with an L-type thermocouple (TP.KhK(L)-K11; ‘Relsib’ LLC, Novosibirsk, Russia) and Pt100-type resistance temperature detector (TS-1288 F/11; ‘Elemer’ LLC, Podolsk, Russia) and displayed by the multichannel thermometer (TM 5103; ‘Elemer’ LLC, Podolsk, Russia). The temperature and mass readings were transmitted to a computer. The atmosphere pressure was measured at the beginning and the end of each experiment by a barometer (BTKSN-18; Technical Specification No. 1-099-20-85, ‘UTYOS’ JSC, Ulyanovsk, Russia) and averaged. The scheme of the experimental facility is shown in Figure 1. The hydrogen volume values at standard conditions (Standard DIN 1343: 101,325 Pa, 0 °C) were obtained using the collected data and the ideal gas law. For each of the samples, the experiment was repeated for three times. The kinetic curves and standard deviations were derived from averaging the data.
For the original materials, ball-milled samples, and solid reaction products, X-ray diffraction (XRD) analysis was conducted with a ‘Difraey 401′ diffractometer (‘Scientific Instruments’ JSC, Saint Petersburg, Russia) with Cr-Kα radiation (0.22909 nm). The XRD peaks were analyzed using an ICDD (International Centre for Diffraction Data) database (Powder Diffraction File™). The microstructure of the samples was investigated by the scanning electron microscopy (SEM) method in secondary electron (SE) and backscattered electron (BSE) imaging modes. The elemental compositions were estimated by the energy-dispersive X-ray spectroscopy (EDX) method. SEM-EDX analysis was performed by a scanning electron microscope TESCAN VEGA3 (‘Oxford Instruments’ PLC, Abingdon, UK) for all samples, excepting those without additives, whose microphotographs were taken previously using a scanning electron microscope NOVA NanoSem 650 (FEI Co., Hillsboro, OR, USA).

3. Results and Discussion

3.1. Properties of the Starting Materials and Ball-Milled Samples

As demonstrated in the previous studies [67,109], prolonged ball milling (2–4 h) combined with a relatively high 20 wt.% of low melting point Wood’s alloy diminished the hydrogen production performance for the samples produced of the same metal scrap. The measured specific surface areas of the original Mg scrap and samples ball milled for 0.5, 1, 2, and 4 h were respectively 2.567, 2.036, 2.022, <0.1, and 0.943 m2/g [109]. This nonmonotonic trend was caused by the microstructural evolution of the samples’ particles affected by competing agglomeration and disintegration processes driven by impacts from steel milling balls. After ‘short-time’ activations during 0.5 and 1 h, the particles looked like flattened ‘flakes’ and had average sizes (maximum Feret diameters) of 277 and 155 μm, respectively. Those milled for 2 and 4 h took the form of equiaxial solid objects with irregular shapes, 68 μm vs. 36 μm in average size. Considering the previous results, in the present study the maximum milling duration and additive content were correspondingly 2 h and 10 wt.%.

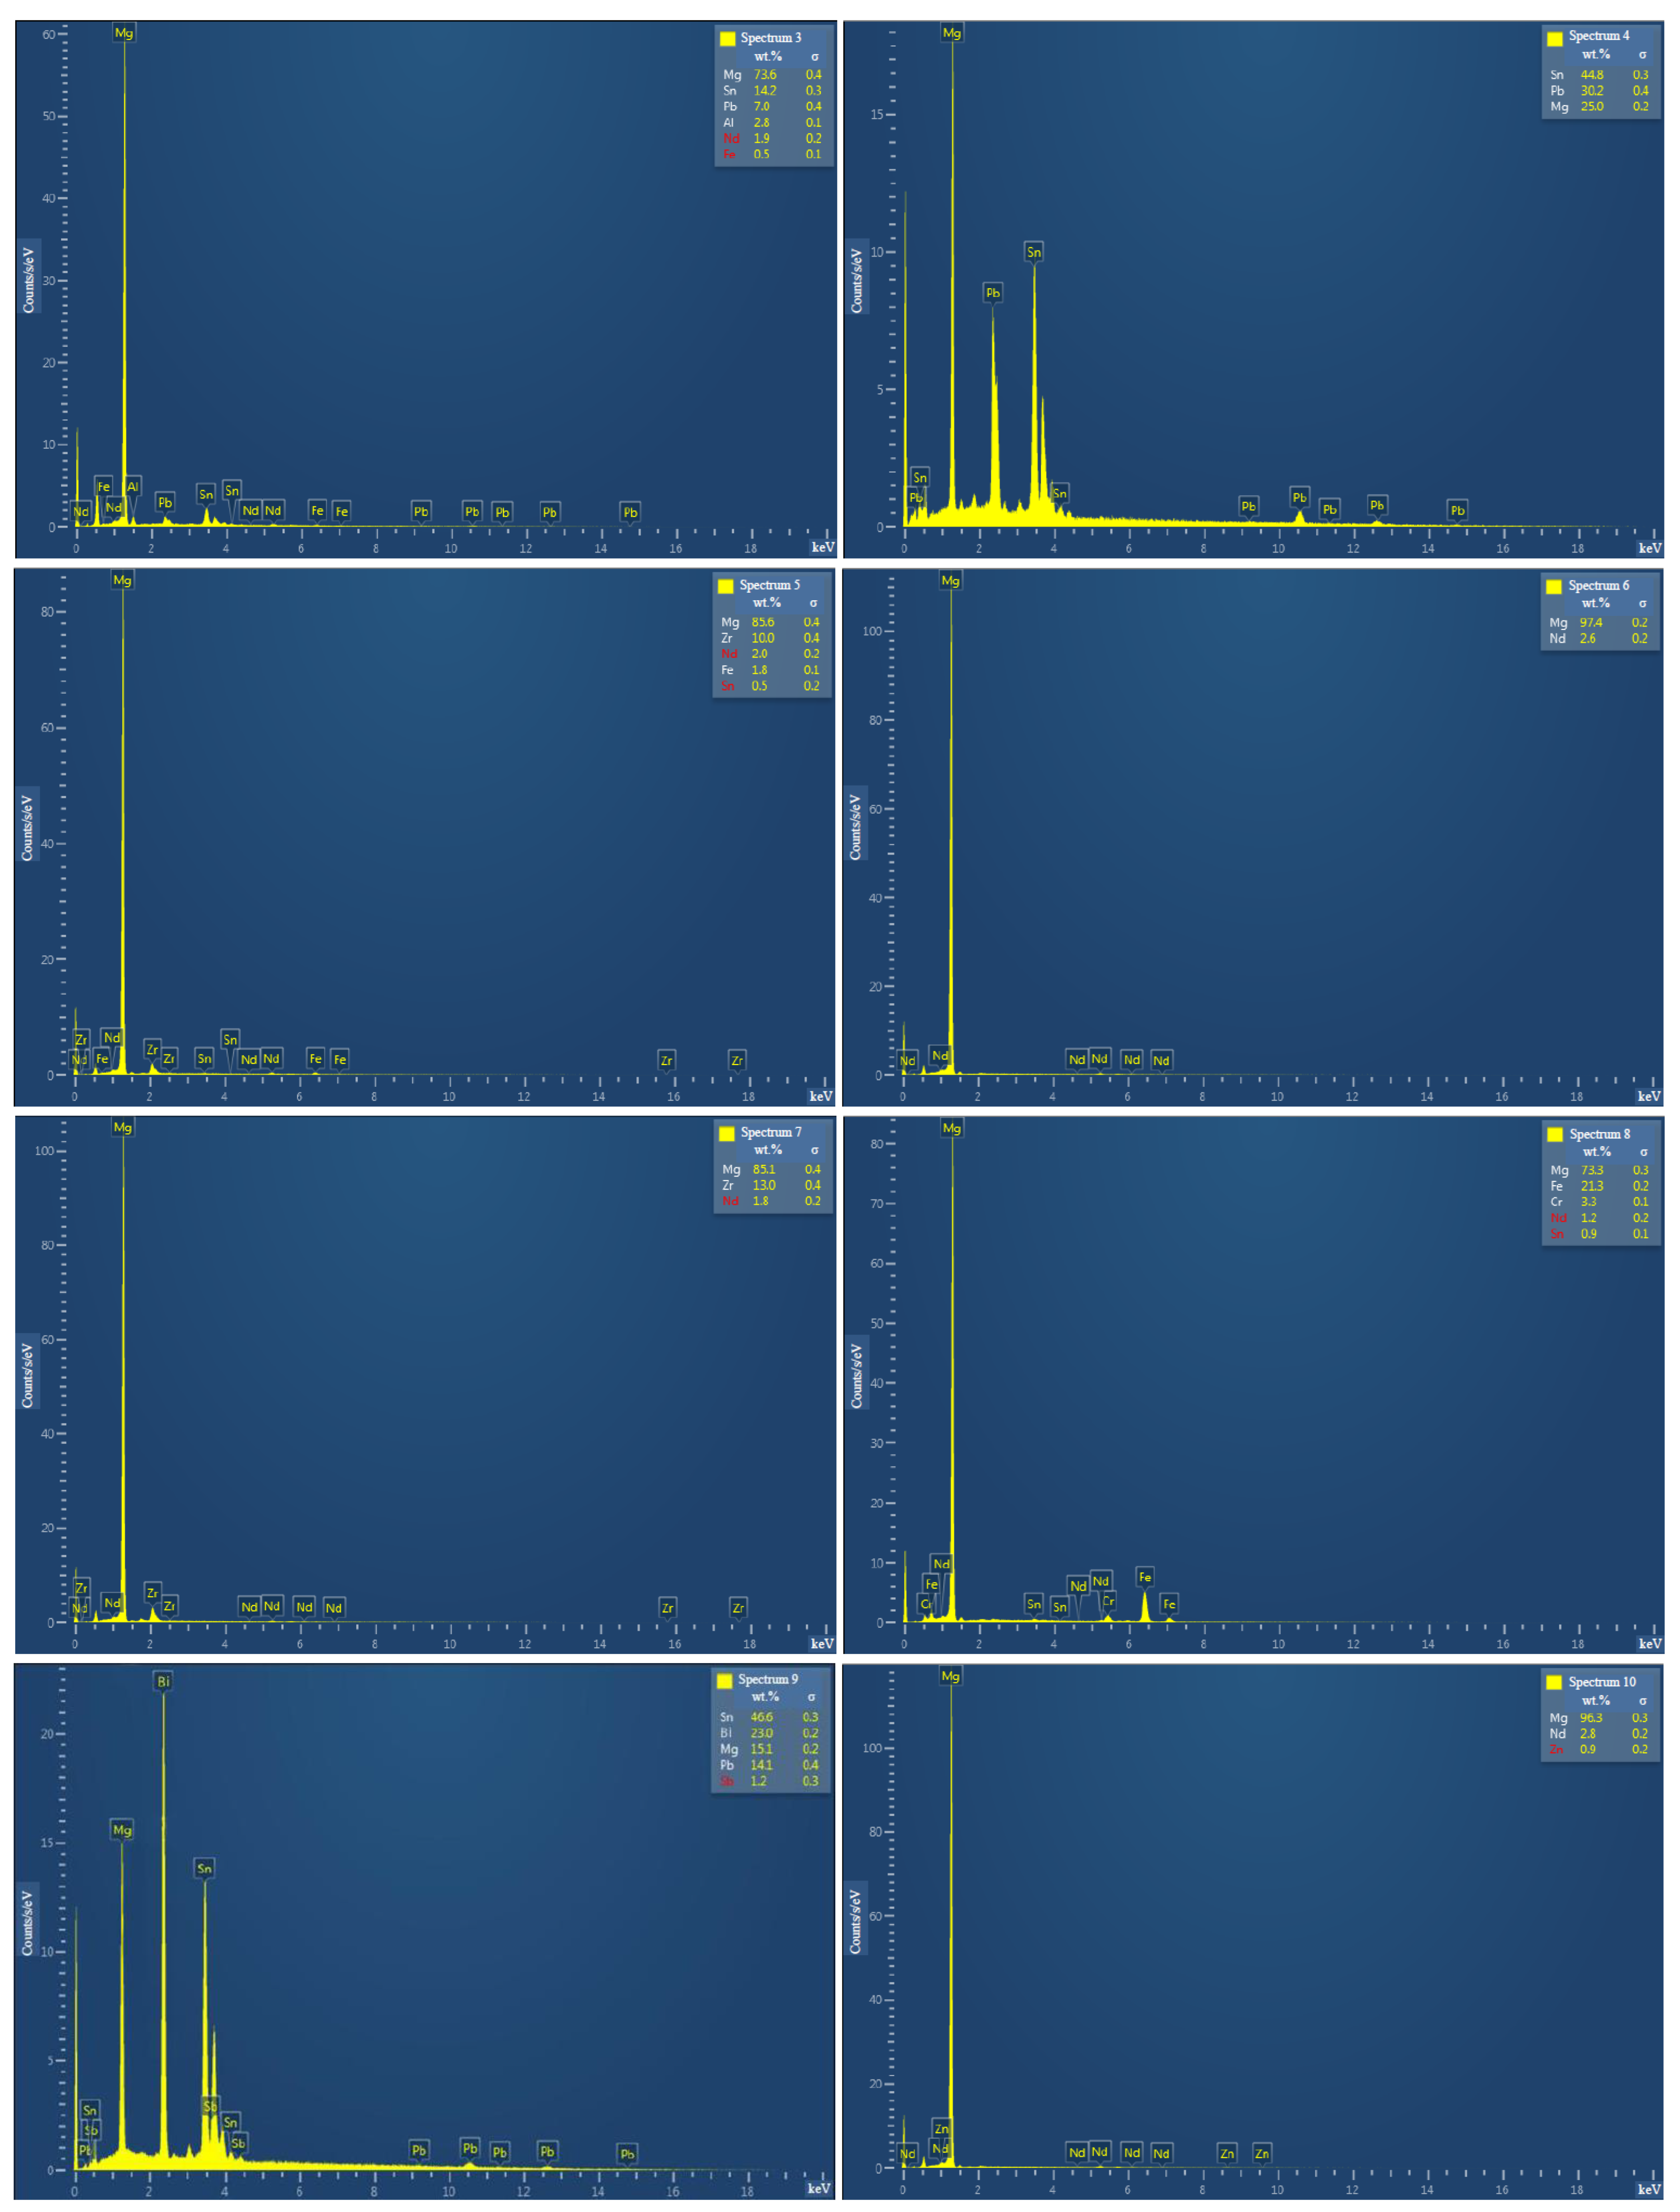
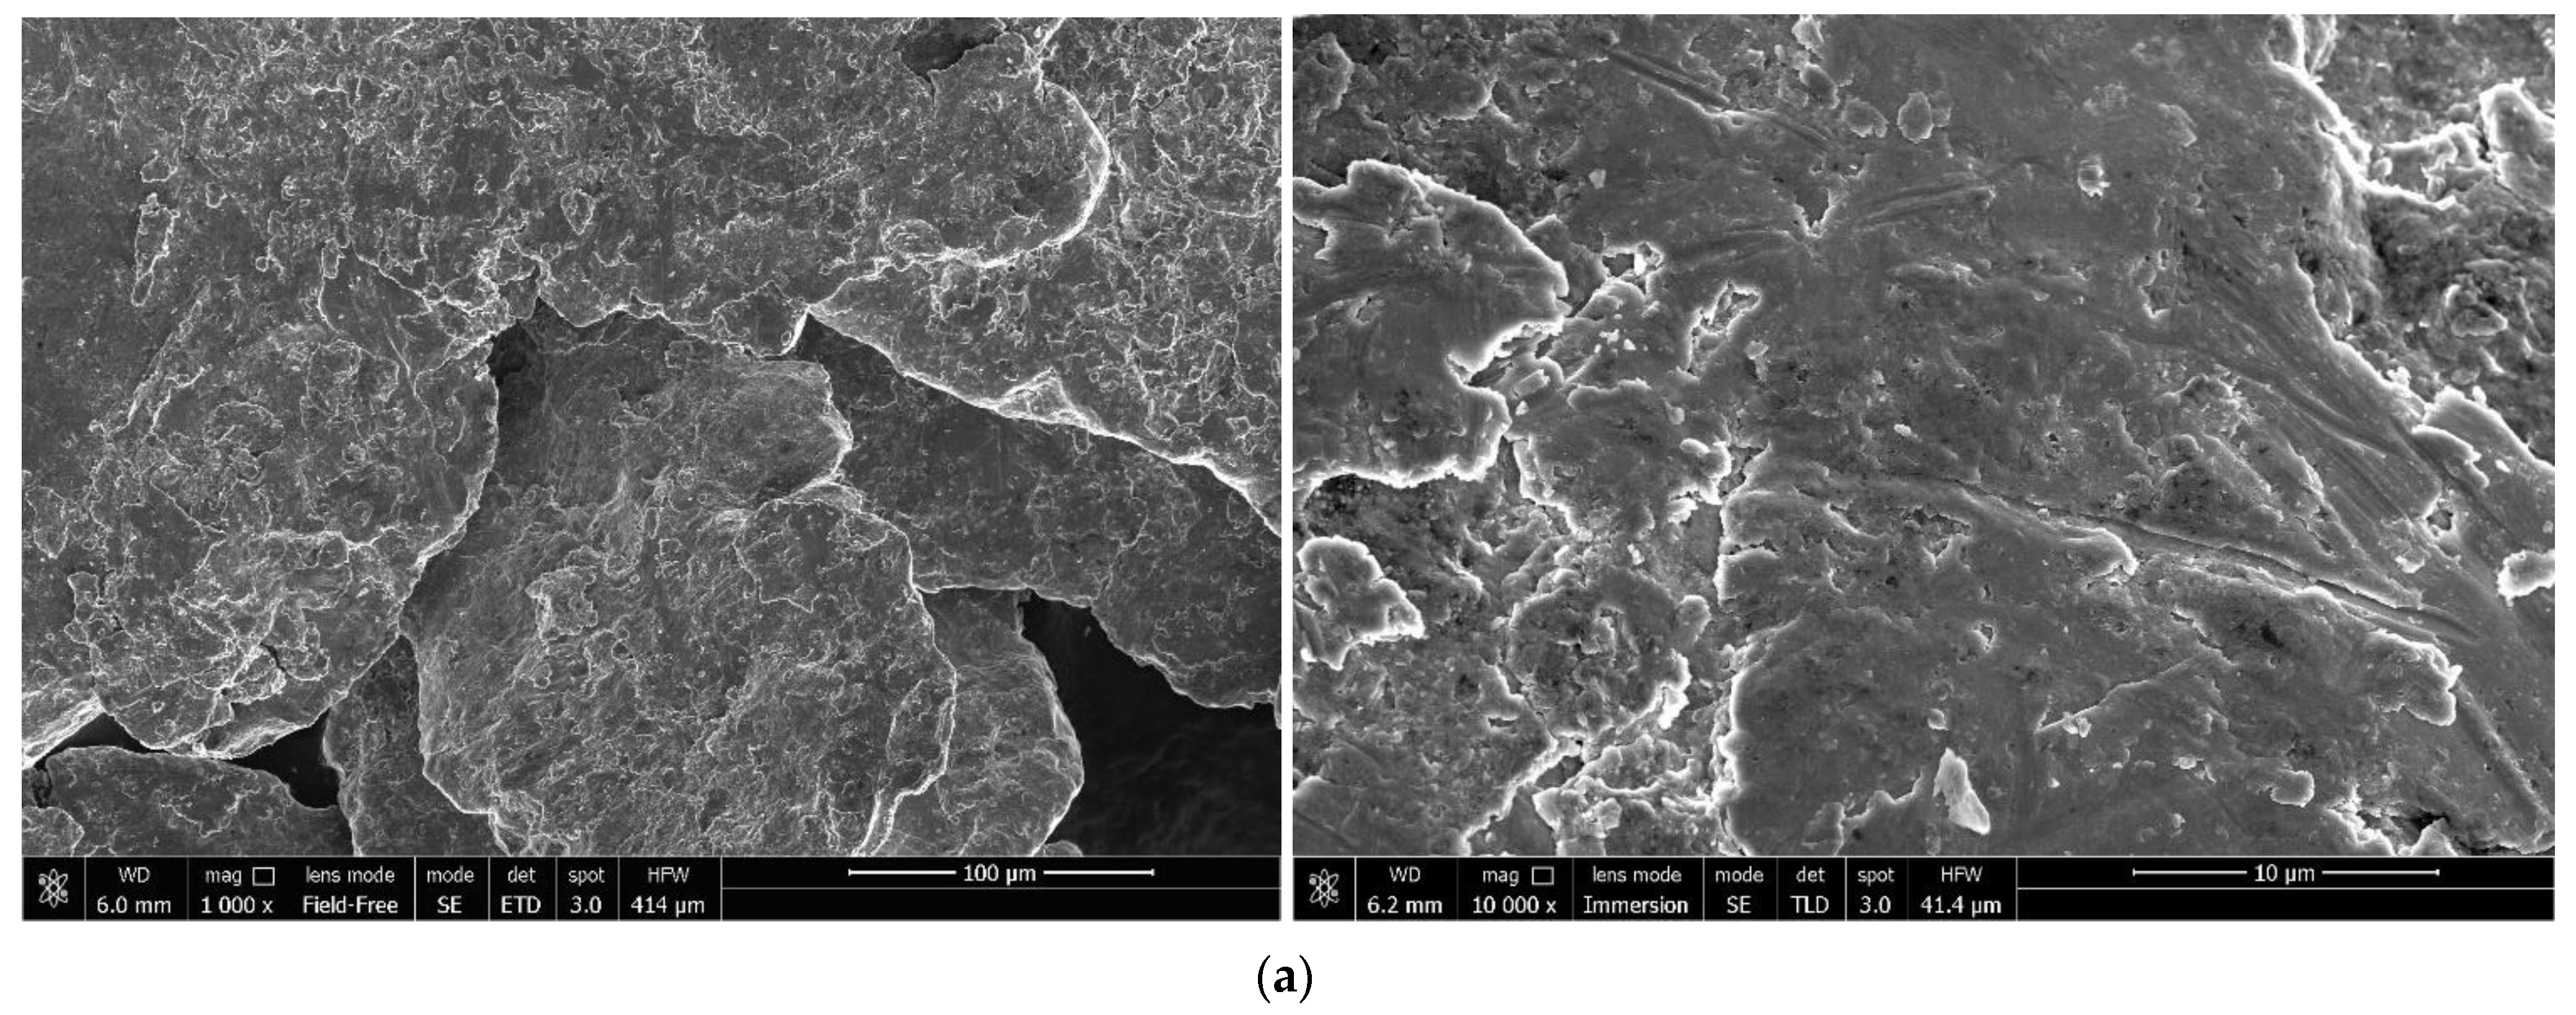
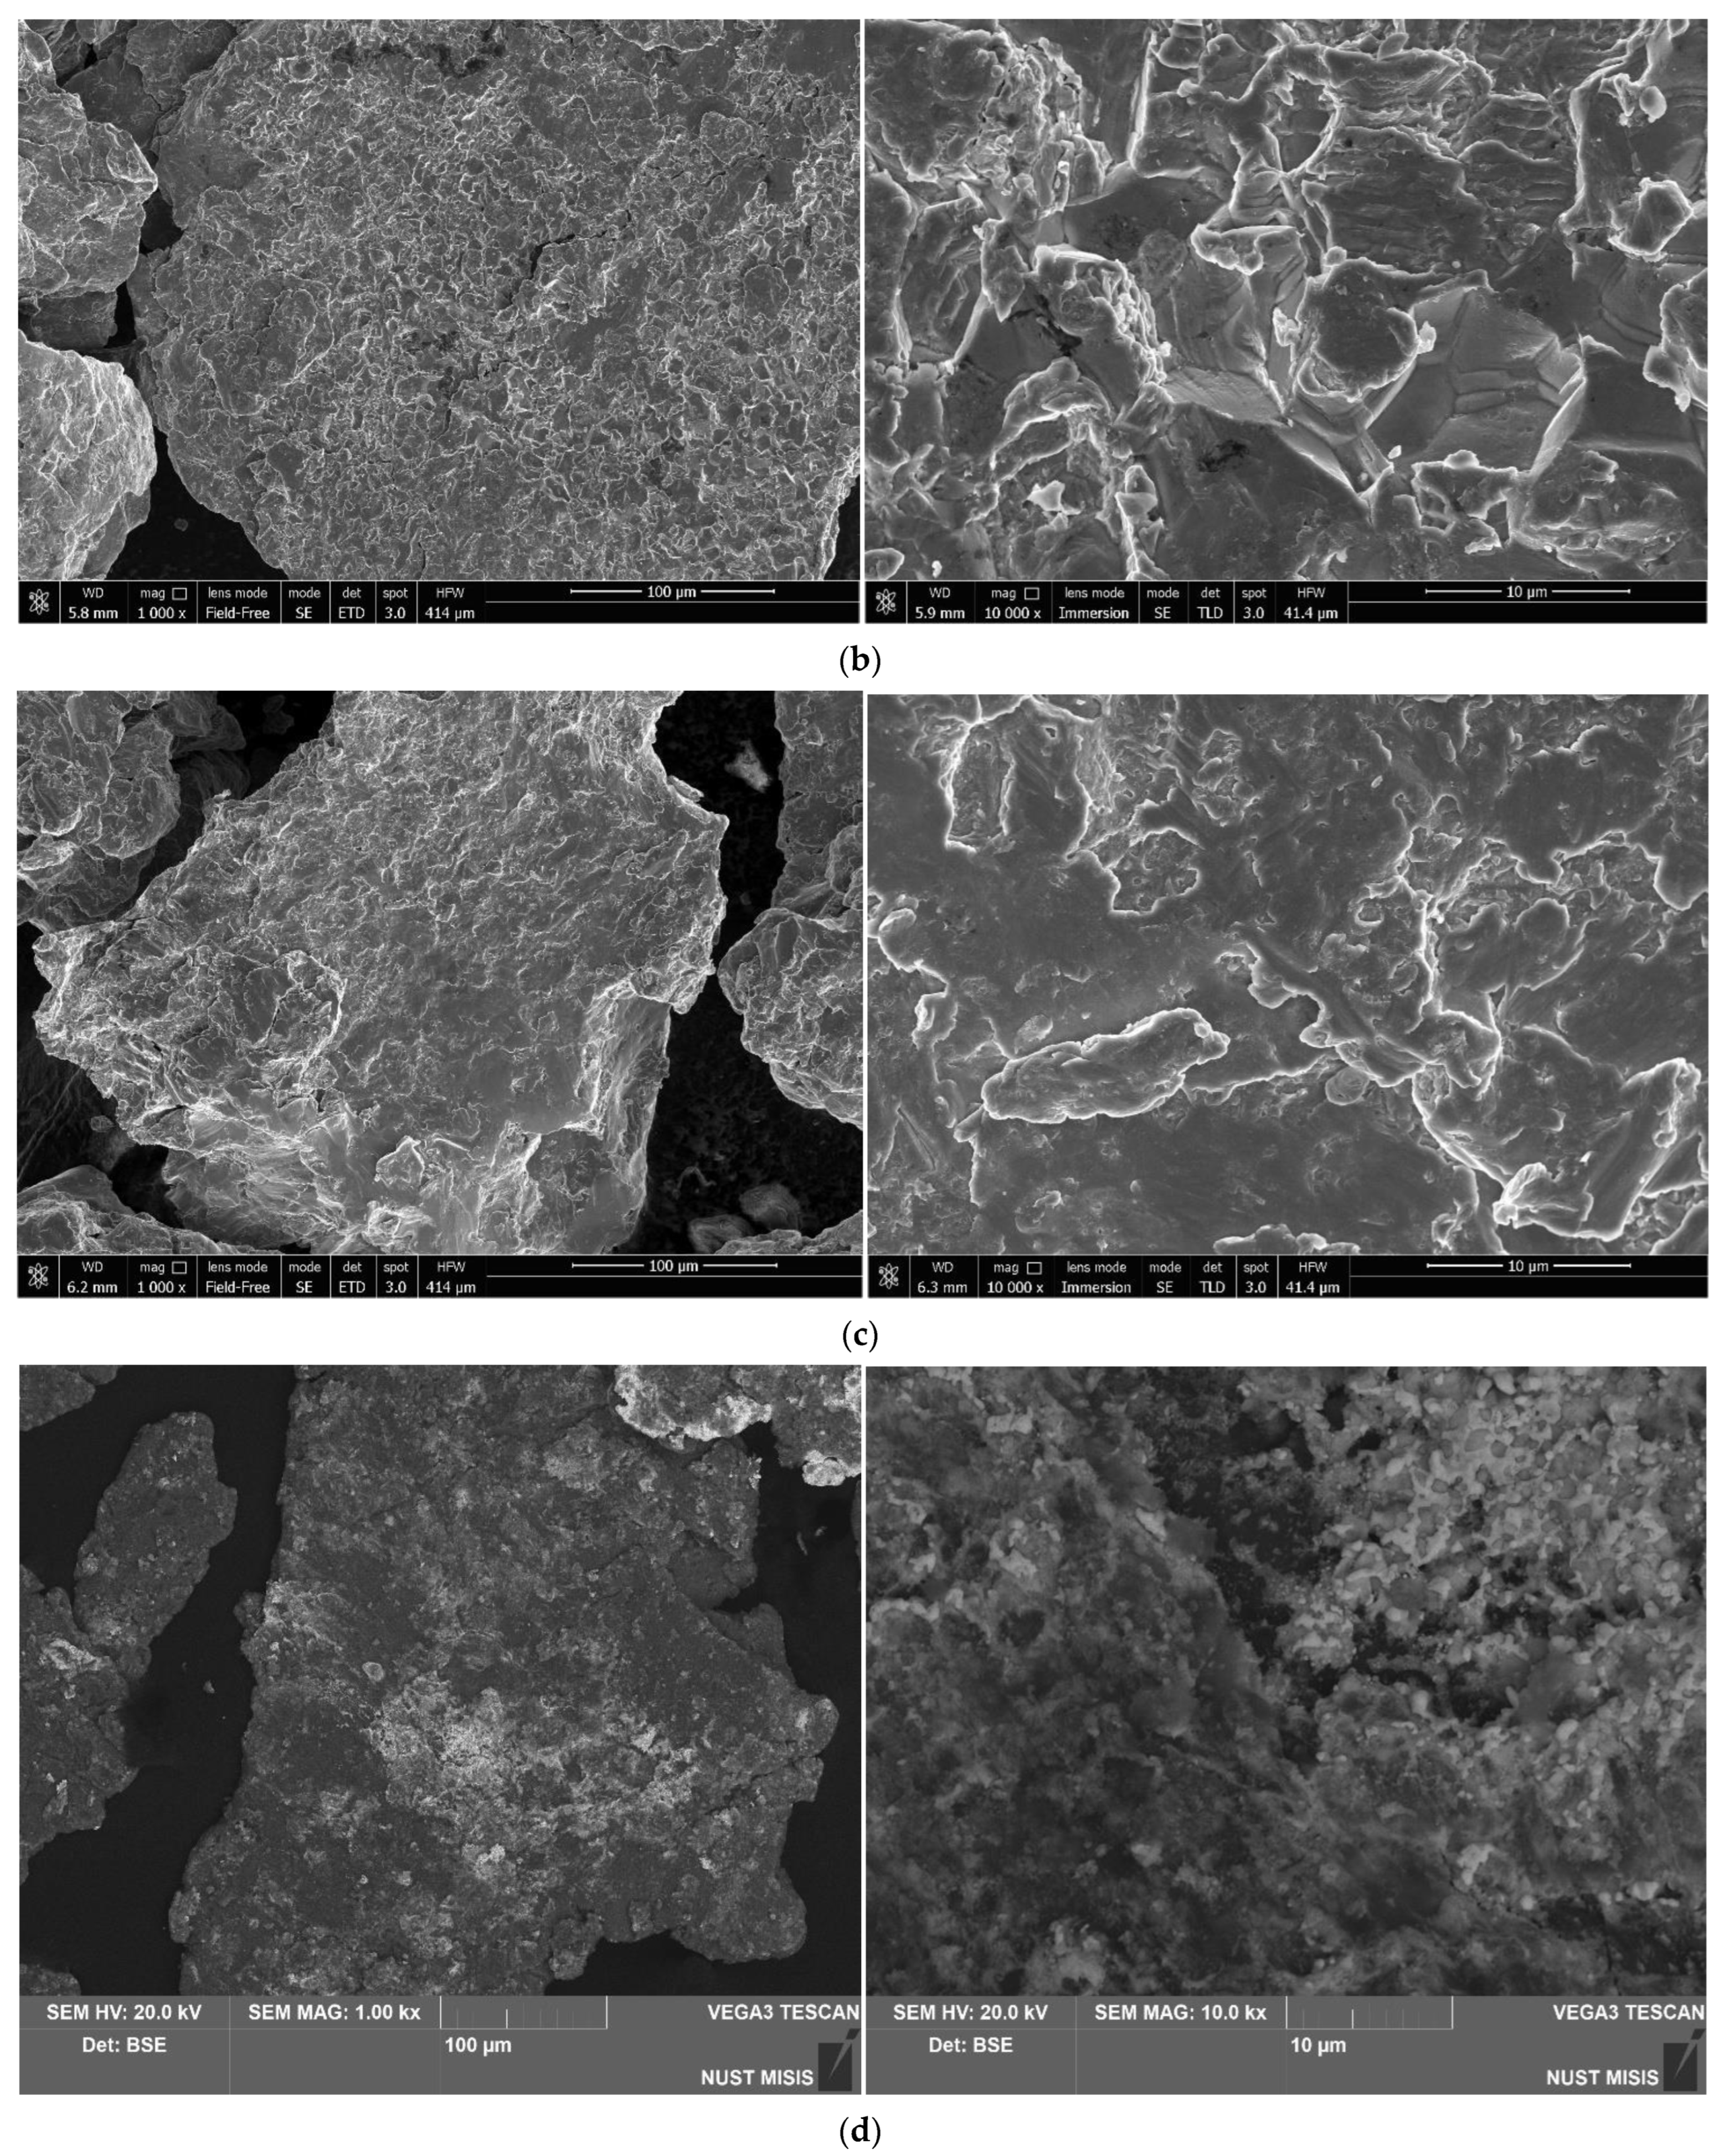
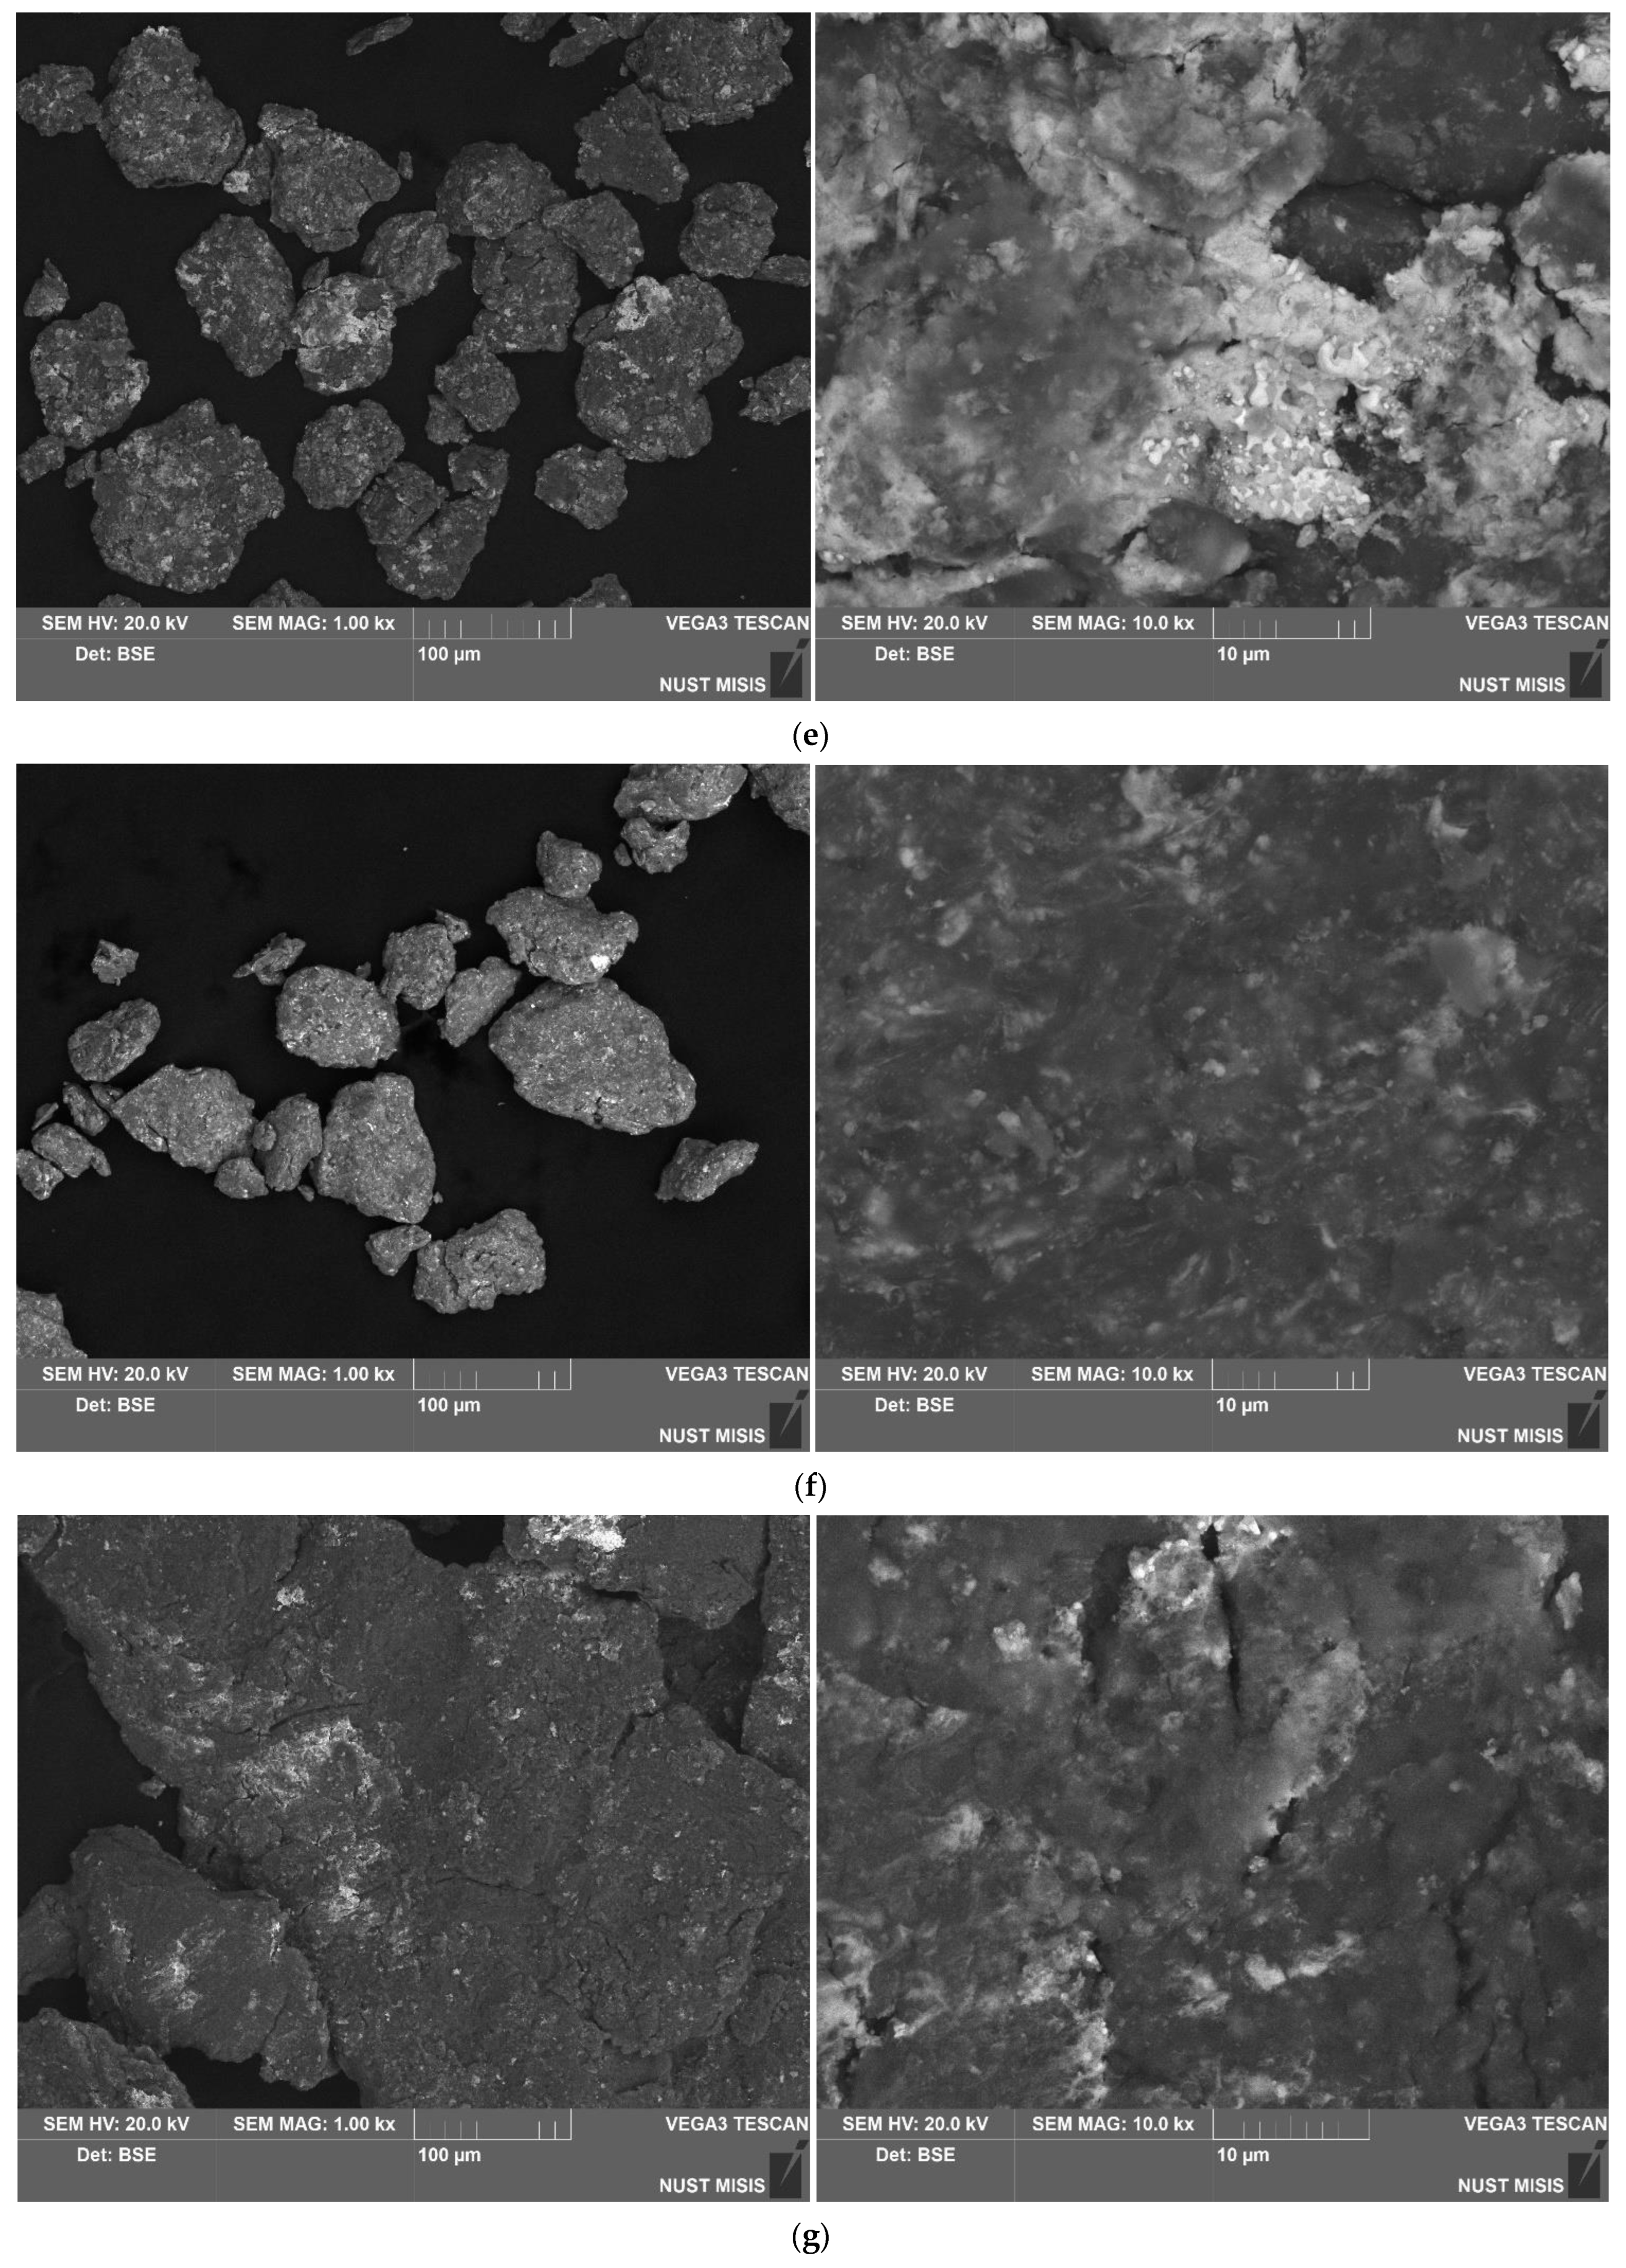
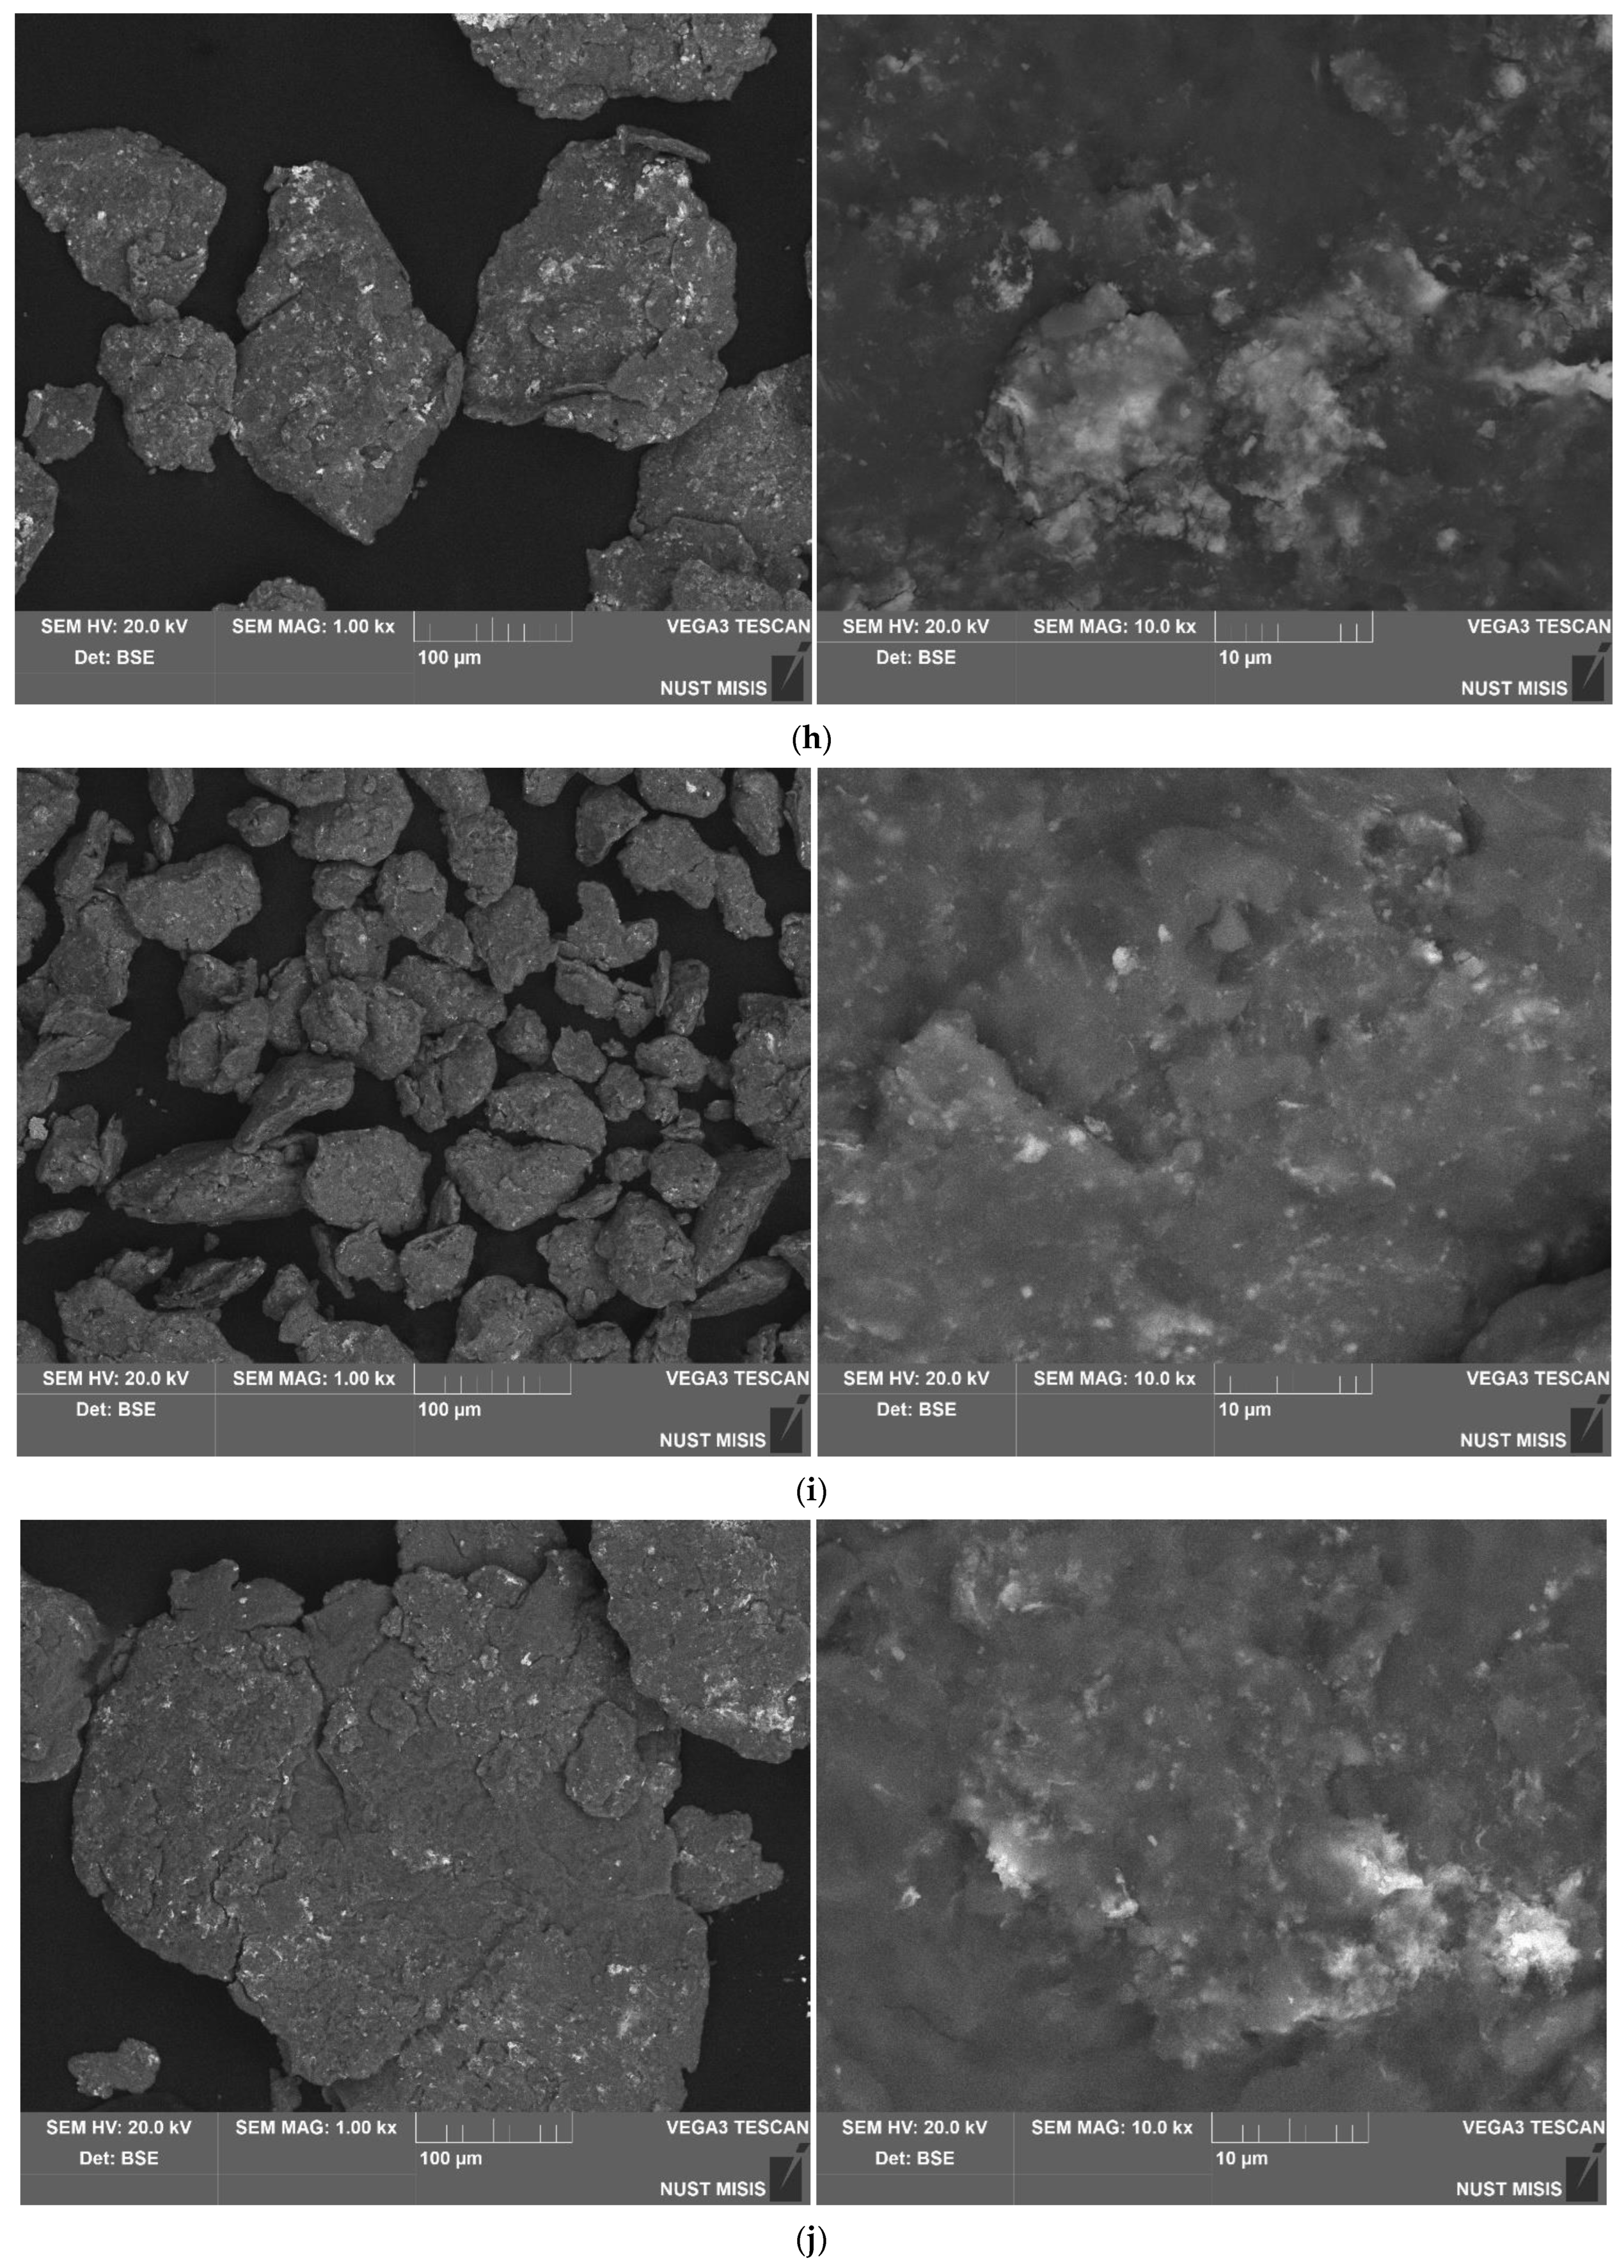
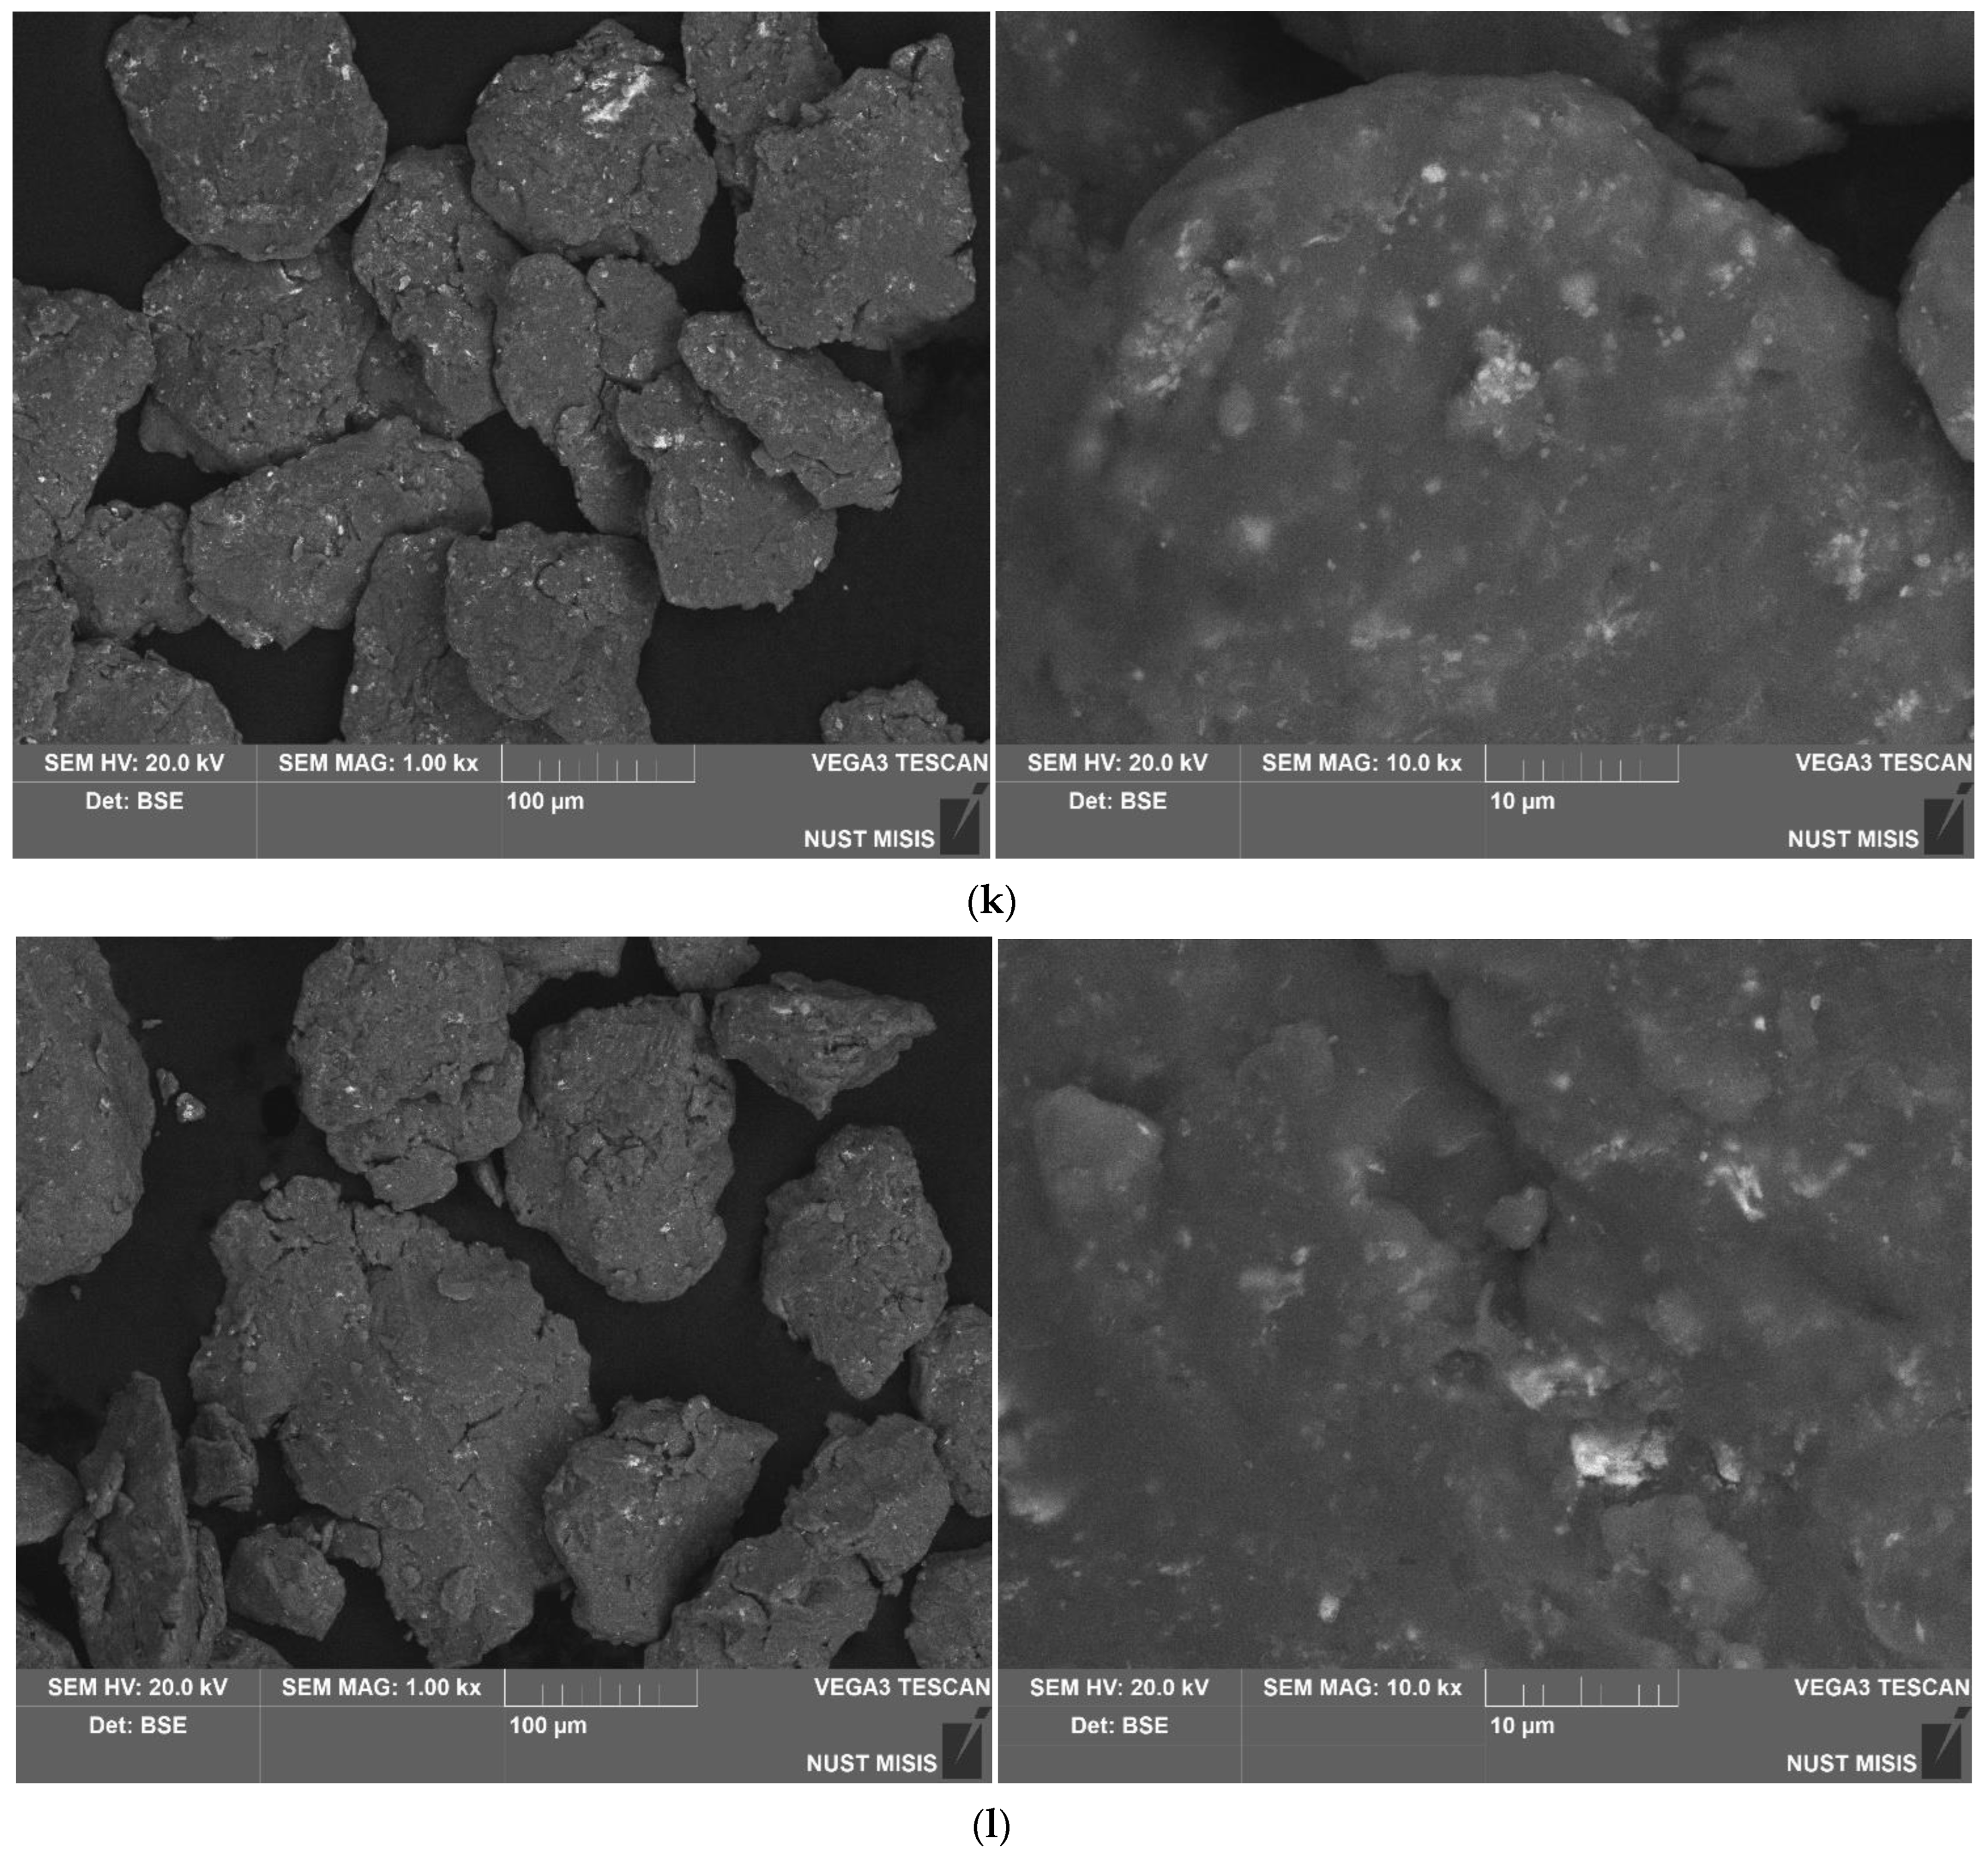
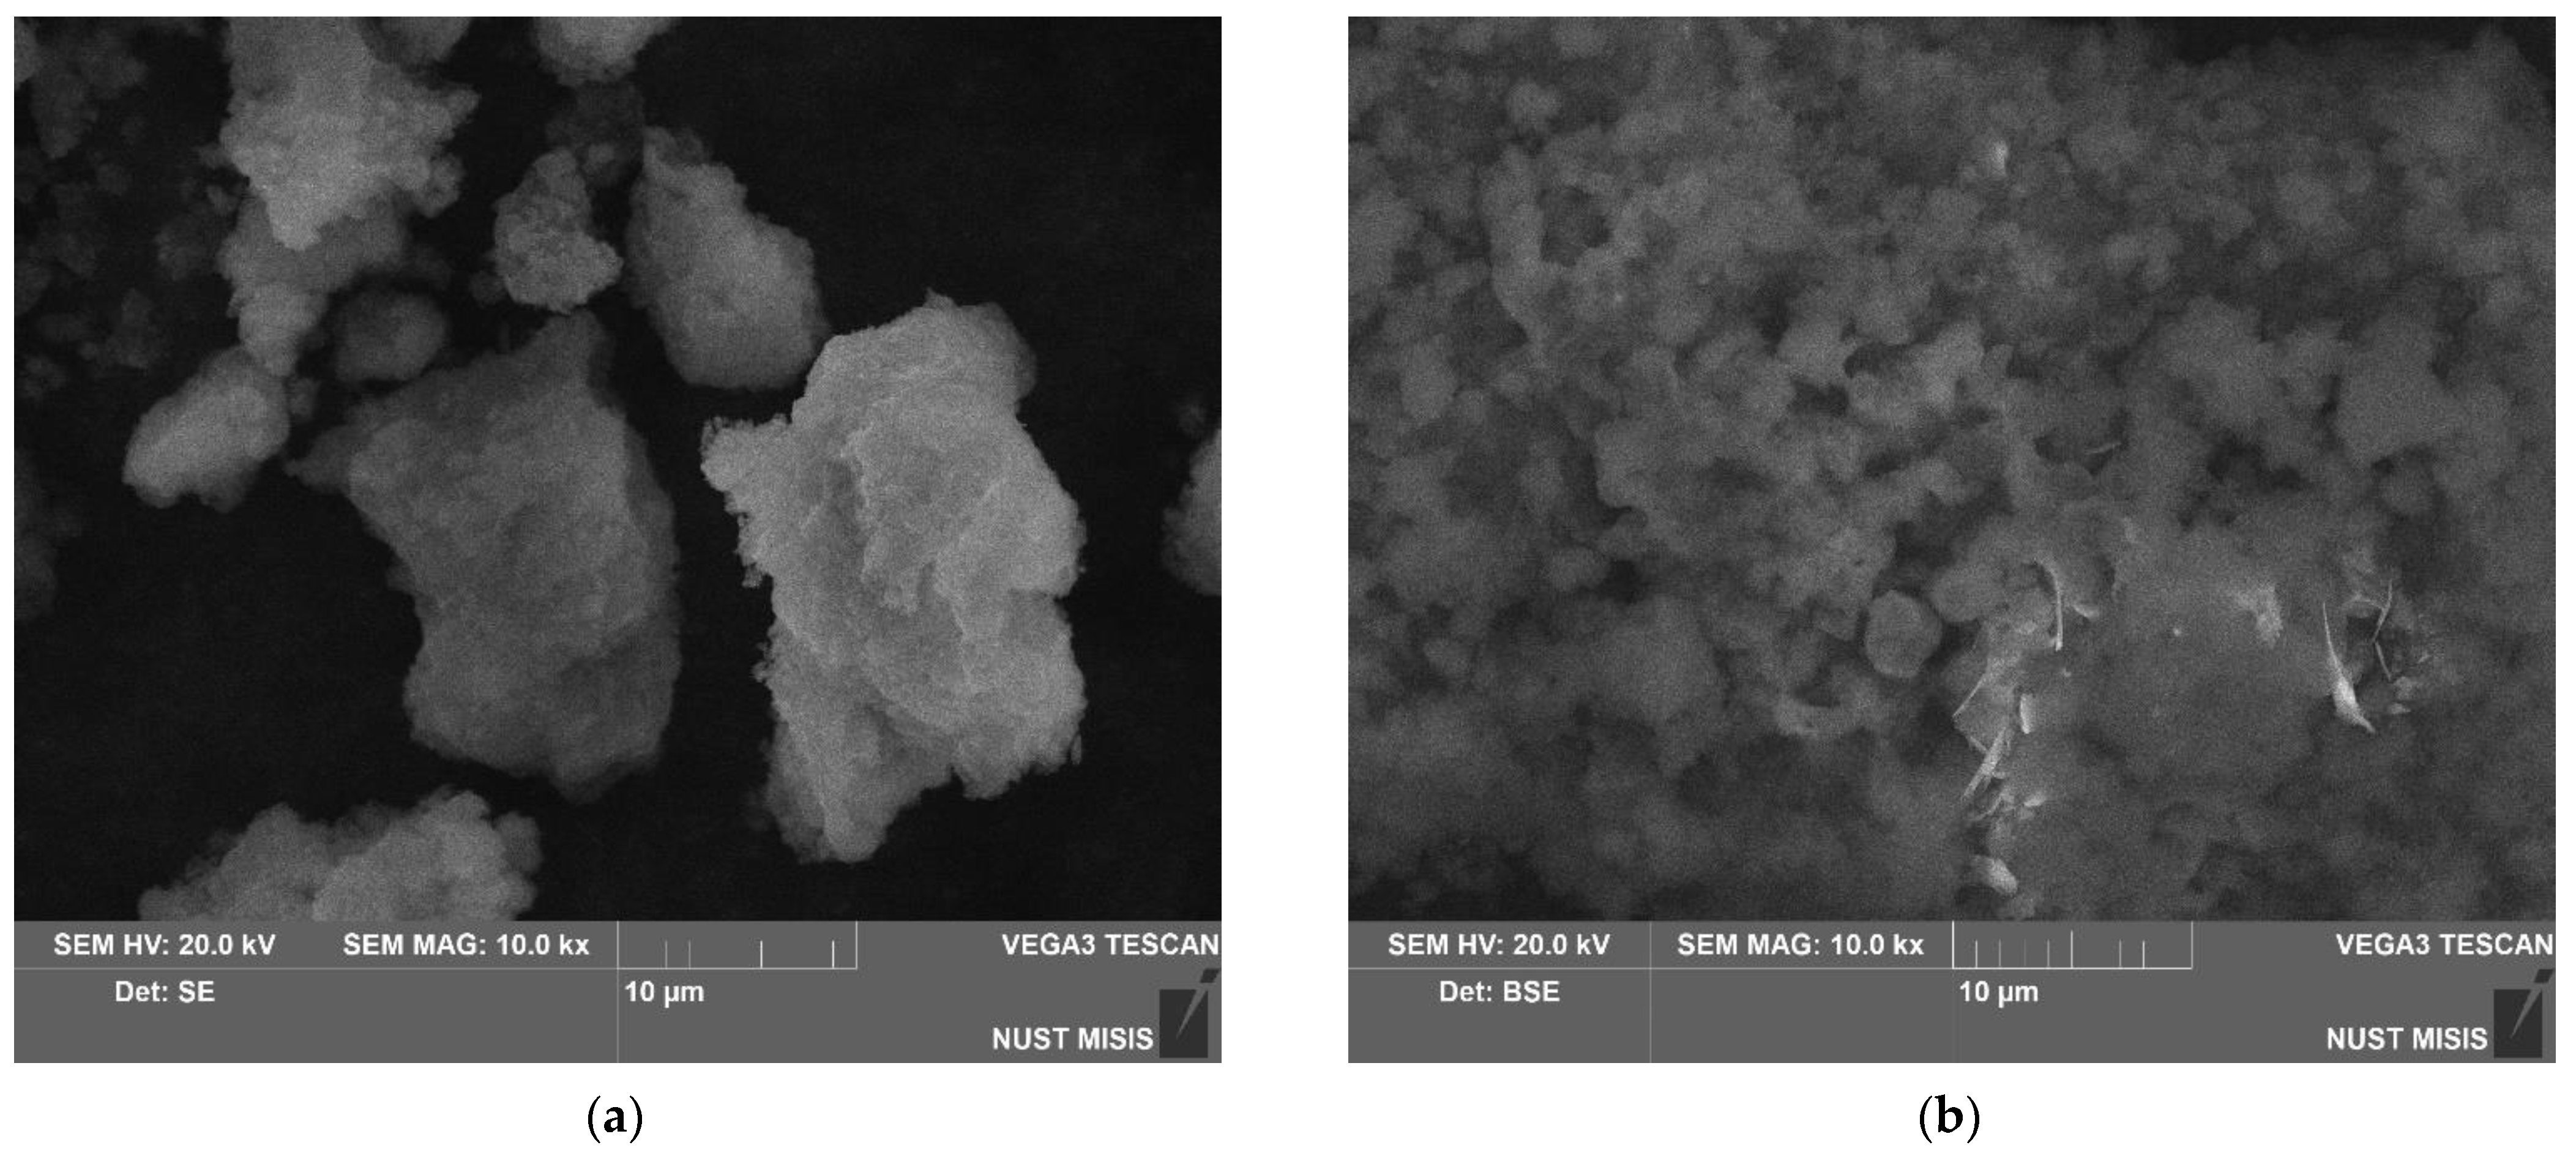
3.1.1. Investigation of Microstructure and Elemental Composition

Microstructures of the samples ball milled for 0.5, 1, and 2 h without additives and with different amounts of Rose alloy (10, 5, and 2.5 wt.%) are illustrated in Figure 2. The samples milled without additives were captured in the SE mode to demonstrate the surface morphology of the particles. As defined above, after 0.5 and 1 h of activation, the particles resembled flat-shaped ‘flakes’ with the traces from steel ball impacts on the surface. Under a higher magnification (see Figure 2a), voids, irregularities, and granulations roughly ~0.1 μm in size were observed. For the 1 h milled sample nearly a quarter of the particles had texturized (oriented) structures on their surface (see Figure 2b). These structures presumably resulted from polygonization and recrystallization processes known to be induced by plastic deformations of metals [110,111]. In the case of ‘prolonged’ (2 h) activation, the particles turned into compacted agglomerates of smaller particles, which resulted from fracturing of the mentioned flat-shaped ‘flakes’. As seen from the microphotographs, the described ‘reshaping trend’ was generally the same for all samples regardless of the presence or absence of the activating Rose alloy. For all samples, fractures, deformations, and small particles cold welded to the surface of the larger ones were observed. No considerable differences in the particle sizes were visually registered for the samples with the additive and without it.
Observations on the ball milling of ductile metals (such as aluminum and magnesium) revealed that short ball-milling durations led to the particles’ deformations. The particles trapped between colliding milling balls were subjected to compression and shearing loads, which induced their flattening and bending. Severe shearing loads and accumulation of microstrains in the crystalline lattice under compression loads led to the particles’ hardening and embrittlement, and that, in turn, resulted in their disintegration via shearing off or fracturing. The resulting smaller flattened particles were ‘cold welded’ to each other by high energy impacts from milling balls and formed ‘flake-like’ lamellar structures. Prolonged ball milling led to an increased accumulation of crystal microstrains and promoted work hardening of the particles with their embrittlement and fracturing into smaller pieces. These pieces again could be agglomerated into equiaxed solid shapes, forming ‘cabbage-like’ structures. These agglomerates were compacted by the balls’ impacts and, upon further accumulation of microstrains, could be cracked into smaller pieces. The eventual shape and size of the ball-milled metal particles were determined by the equilibrium between these competing processes—cold welding (size enlargement) and fracturing (size reduction) [83,88,112].
For the samples ball milled with the additive (10, 5, and 2.5 wt.% Rose alloy) the images were taken in the BSE mode that allowed highlighting the presence of the activator composed of heavy metals. In the said microphotographs, light gray and white colors depicted the heavy activator metals, Bi, Sn, and Pb, while the darker shades corresponded to the base scrap components (Mg and Al). The lighter regions, however, could potentially contain not only the Rose alloy traces but also sites enriched with heavy alloying elements (Nd, Zr, Zn) or those contaminated with Fe—major component of steel pieces chipped-off from the milling balls during activation. The maximum Fe contamination estimated from the changes in the balls’ masses was ~0.2 wt.%. Initially, Rose alloy presented in the form of pieces nearly several mm in size. Taking into account its ductility and low melting point of 94 °C, its spreading over particles was presumably caused by its melting by the heat released during ball milling rather than mechanical disintegration. The distribution of the alloy over the particles was determined to be non-uniform, which was not surprising for the relatively short milling durations tested in the present study. For shorter milling intervals, however, the particles’ surface regions enriched with heavy elements were generally larger in area and smaller in number, while for the maximum tested milling time they mostly represented a greater number of smaller spots.
The sample ball milled for 1 h with 10 wt.% Rose alloy was investigated by the EDX method. The results (spectra) for the selected analyzed spots are illustrated in Figure A1 (see Appendix A). The analysis revealed the presence of the major elements of scrap alloys (Mg, Al, Nd, Zr, and Zn), components of Rose alloy (Bi, Sn, and Pb), and an amount of impurities: Fe and Cr resulted from the contamination with chipped-off pieces of steel balls during ball milling, and Sb—a common impurity of Rose alloy.

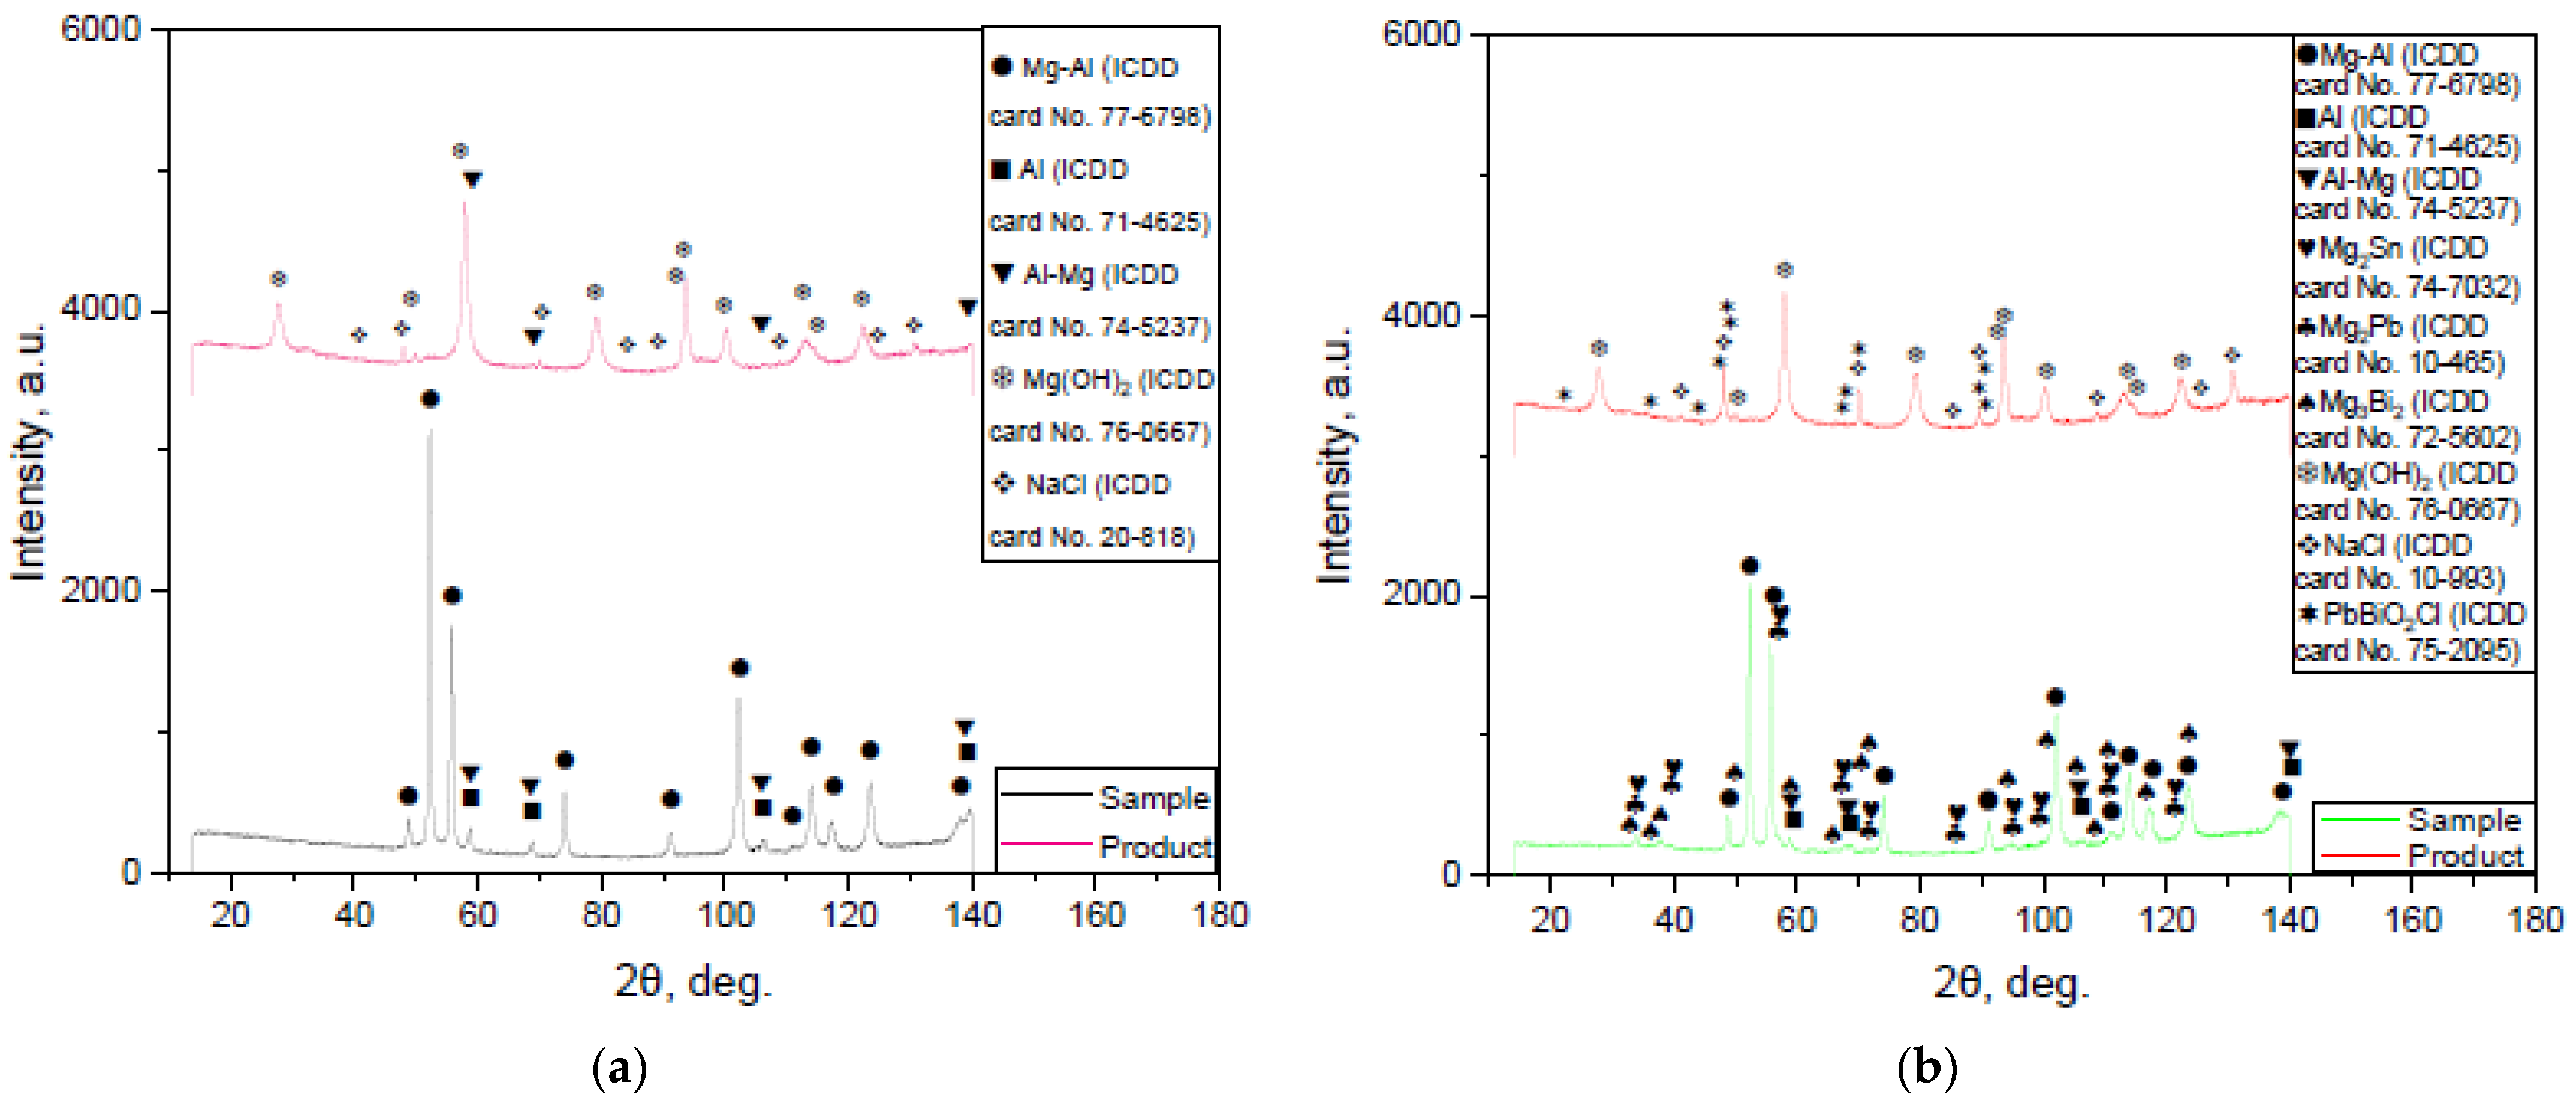
3.1.2. Results of XRD Analysis

The XRD patterns for the samples ball milled with no additives and those containing 10, 5, and 2.5 wt.% Rose alloy are shown in Figure 3. The base phase of the original scrap and all milled samples was a solid solution of Al in the primary hexagonal close-packed Mg lattice. Peaks of the face-centered cubic Al structure were detected as well. In the cases of scrap, 0.5 and 1 h milled samples, some of the peaks for the Mg–Al and Al phases had higher intensities as compared to those for the 2 h activated sample, whose relative peak intensities were in good agreement with those from the ICDD card patterns for powders. Such a difference could arise from the partial texturization (preferred crystal orientation along a certain crystallographic direction) of the scrap’s structure, which could be ascribed to mechanical machining. Mg–Al–Zn alloys were proved to contain a solid solution of Al and Zn in Mg and precipitates of the phases Φ-Mg21(Al, Zn)17 and Mg17Al12, wherein some of the Al atoms could be replaced by Zn with the formation of Mg17(Al, Zn)12 [113,114]. Corrosion resistance of Mg–Al–Zn alloys was ascribed to the existence of intermetallic phase precipitates ‘containing’ the grains (while in small amounts they functioned as microgalvanic cells) and to protective aluminum-rich subsurface regions [115,116]. Therefore, the Al presence could probably be explained by the existence of the local Al-rich regions. For the 1 and 2 h milled samples a new phase (Mg solution in Al) appeared. The peaks’ broadening and position shift were detected as well. Such changes indicated that high energy ball milling introduced lattice microstrains and crystalline imperfections, typically favorable for pitting corrosion, into the microstructure [88,117,118]. Because of the reduction in the grain size caused by ball milling, the number (and total length) of grain boundaries increased, potentially making the material more susceptible to intergranular corrosion [119].
In Rose alloy body-centered tetragonal Sn and rhombohedral Bi crystals were definitely identified, while for the third hexagonal phase its peaks fell within the angles of two intermetallides—Pb3Bi2 and Pb7Bi3. According to the findings from [120], Pb2Bi was formed in the Bi–Pb–Sn system with the similar composition. Another BiPb3 intermetallic phase was claimed in [121]. In another study [122], the formation of BiSn (minor amount) and Pb7Bi3 was reported. However, the characteristic peaks for the latter phase were notably shifted to larger angles—the same was observed in the present study. Presumably, the third phase actually represented some blended composition.
According to the XRD patterns, the samples activated with Rose alloy demonstrated the presence of the new phases—Mg3Bi2, Mg2Sn, and Mg2Pb. The latter two intermetallides had their intensity peaks majorly overlapping. For large angles, however, the actual peaks were located between the tabulated values for those phases. The formation of the new compounds (and the absence of the original alloy phases in the samples) supported the version that the Rose alloy melted during ball milling and its components reacted with Mg. The existence of Mg2Pb, Mg2Sn, and Mg3Bi2 was confirmed for a number of Mg-based alloys [123,124,125]. The samples ball milled with smaller amounts of additive differed from those with larger ones in that their peaks for the new phases were lower.

3.2. Tests for Hydrogen Generation Performance

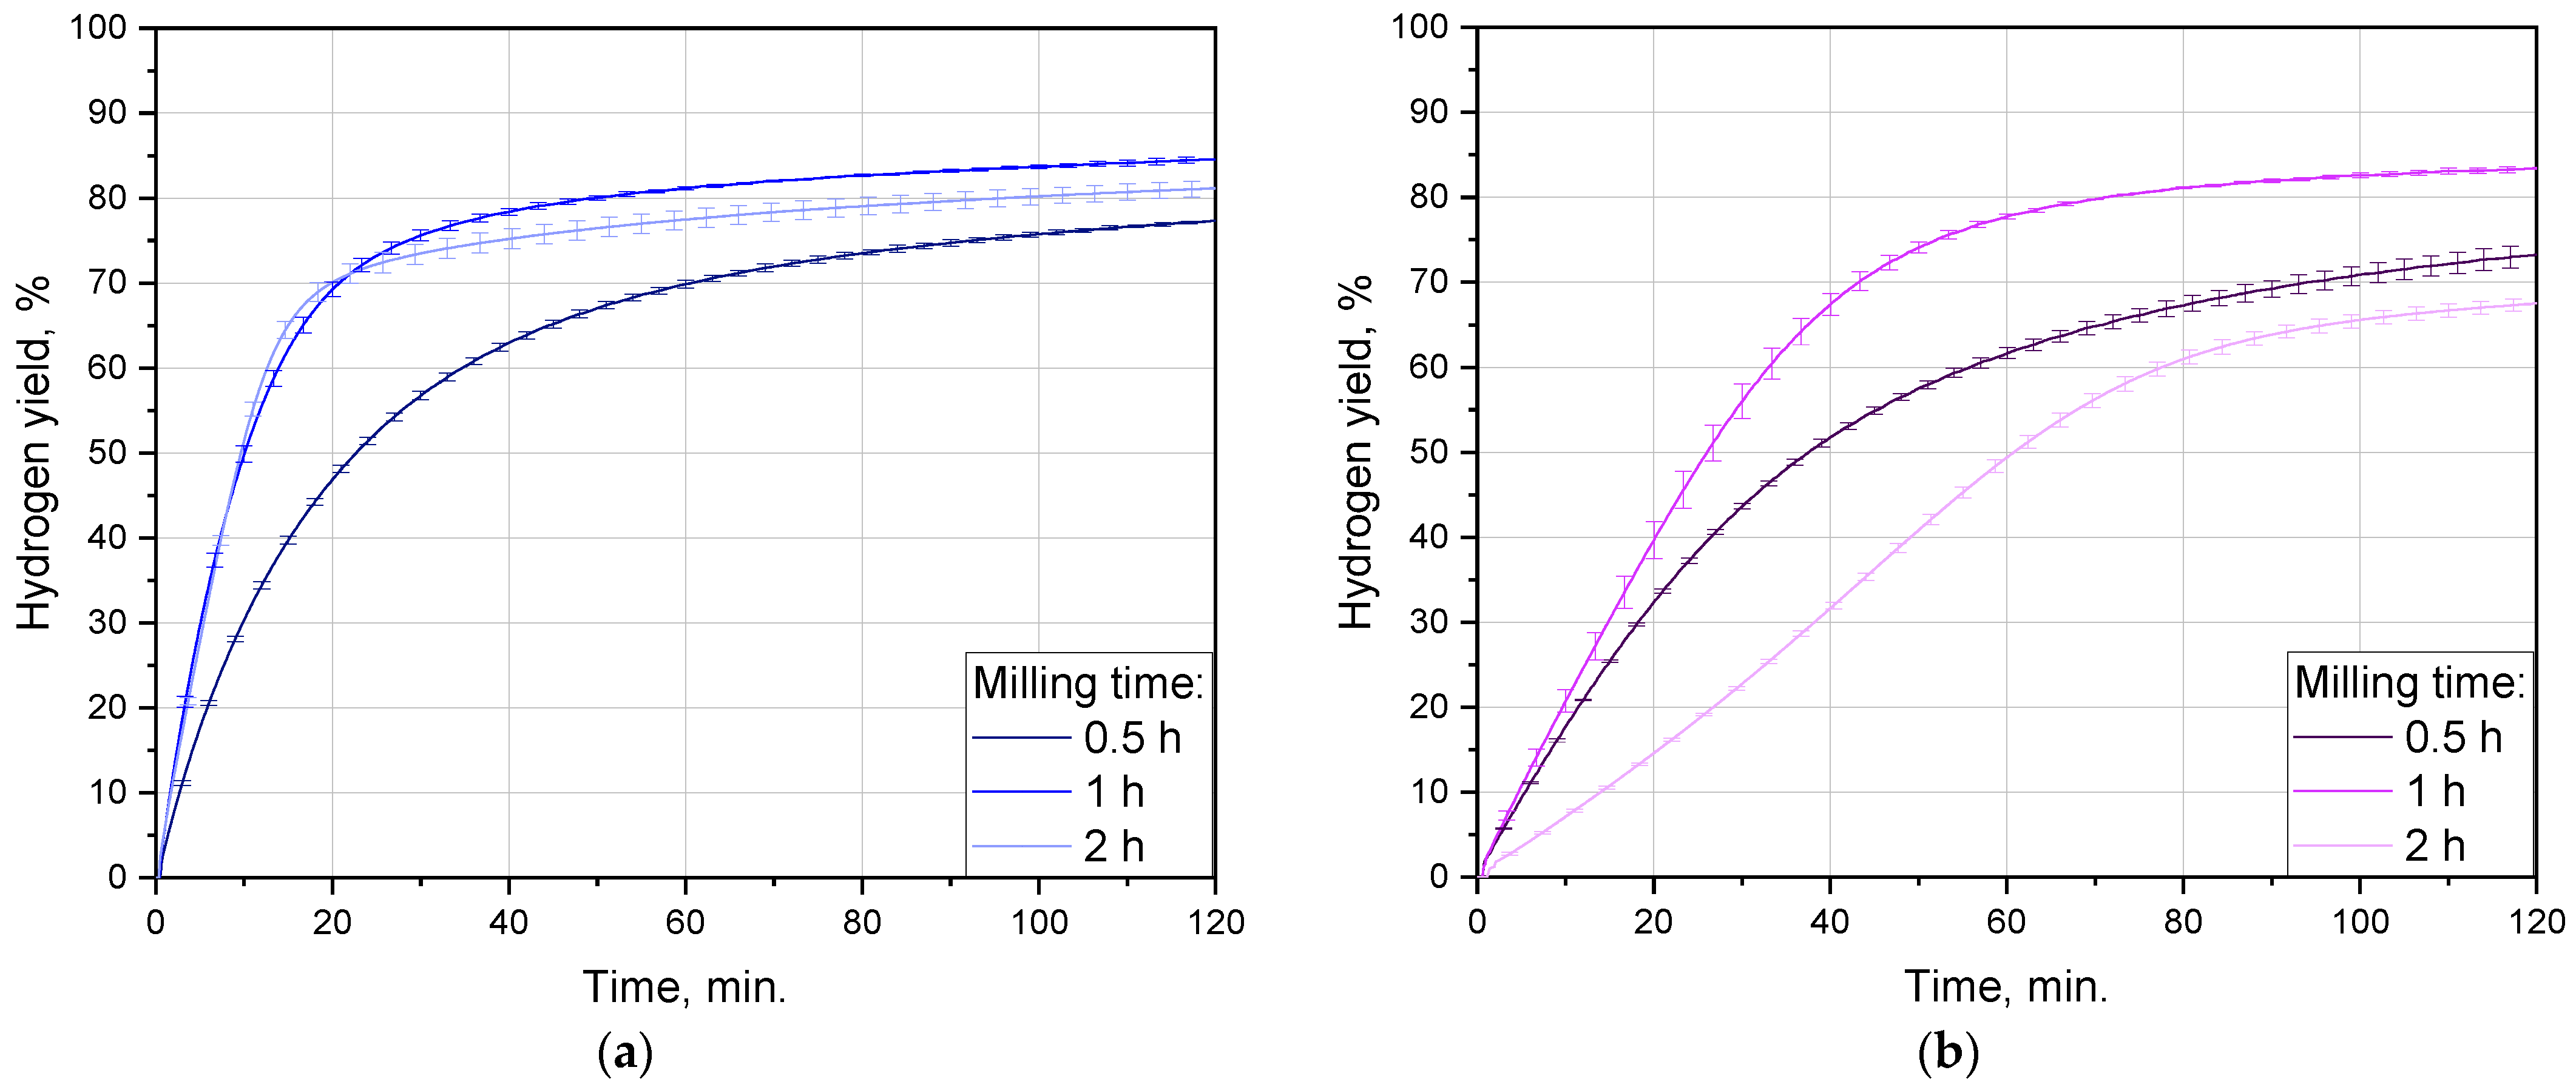
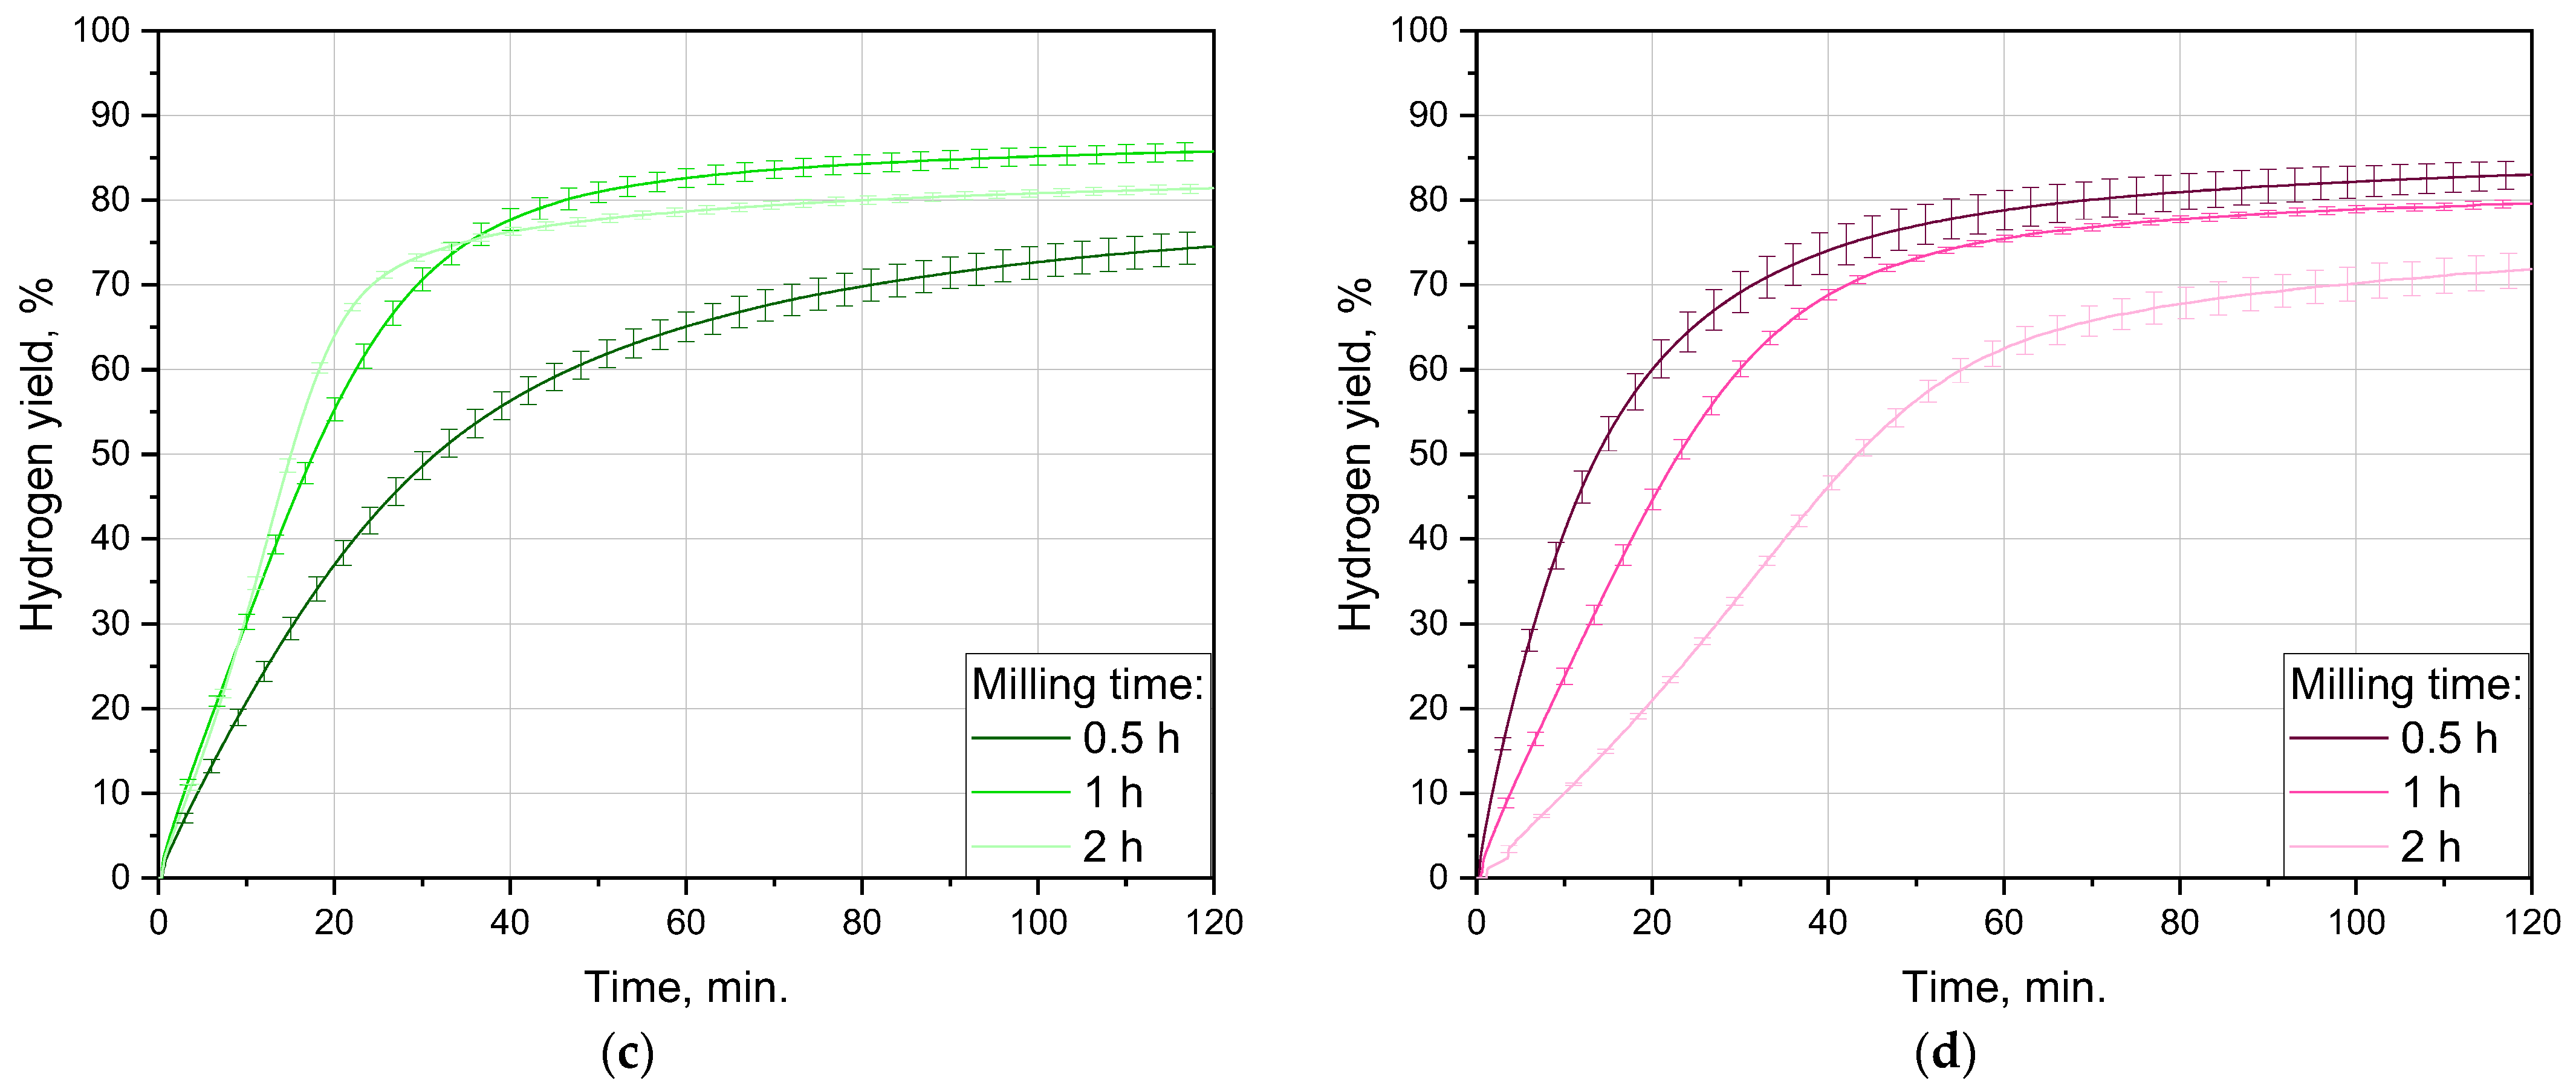
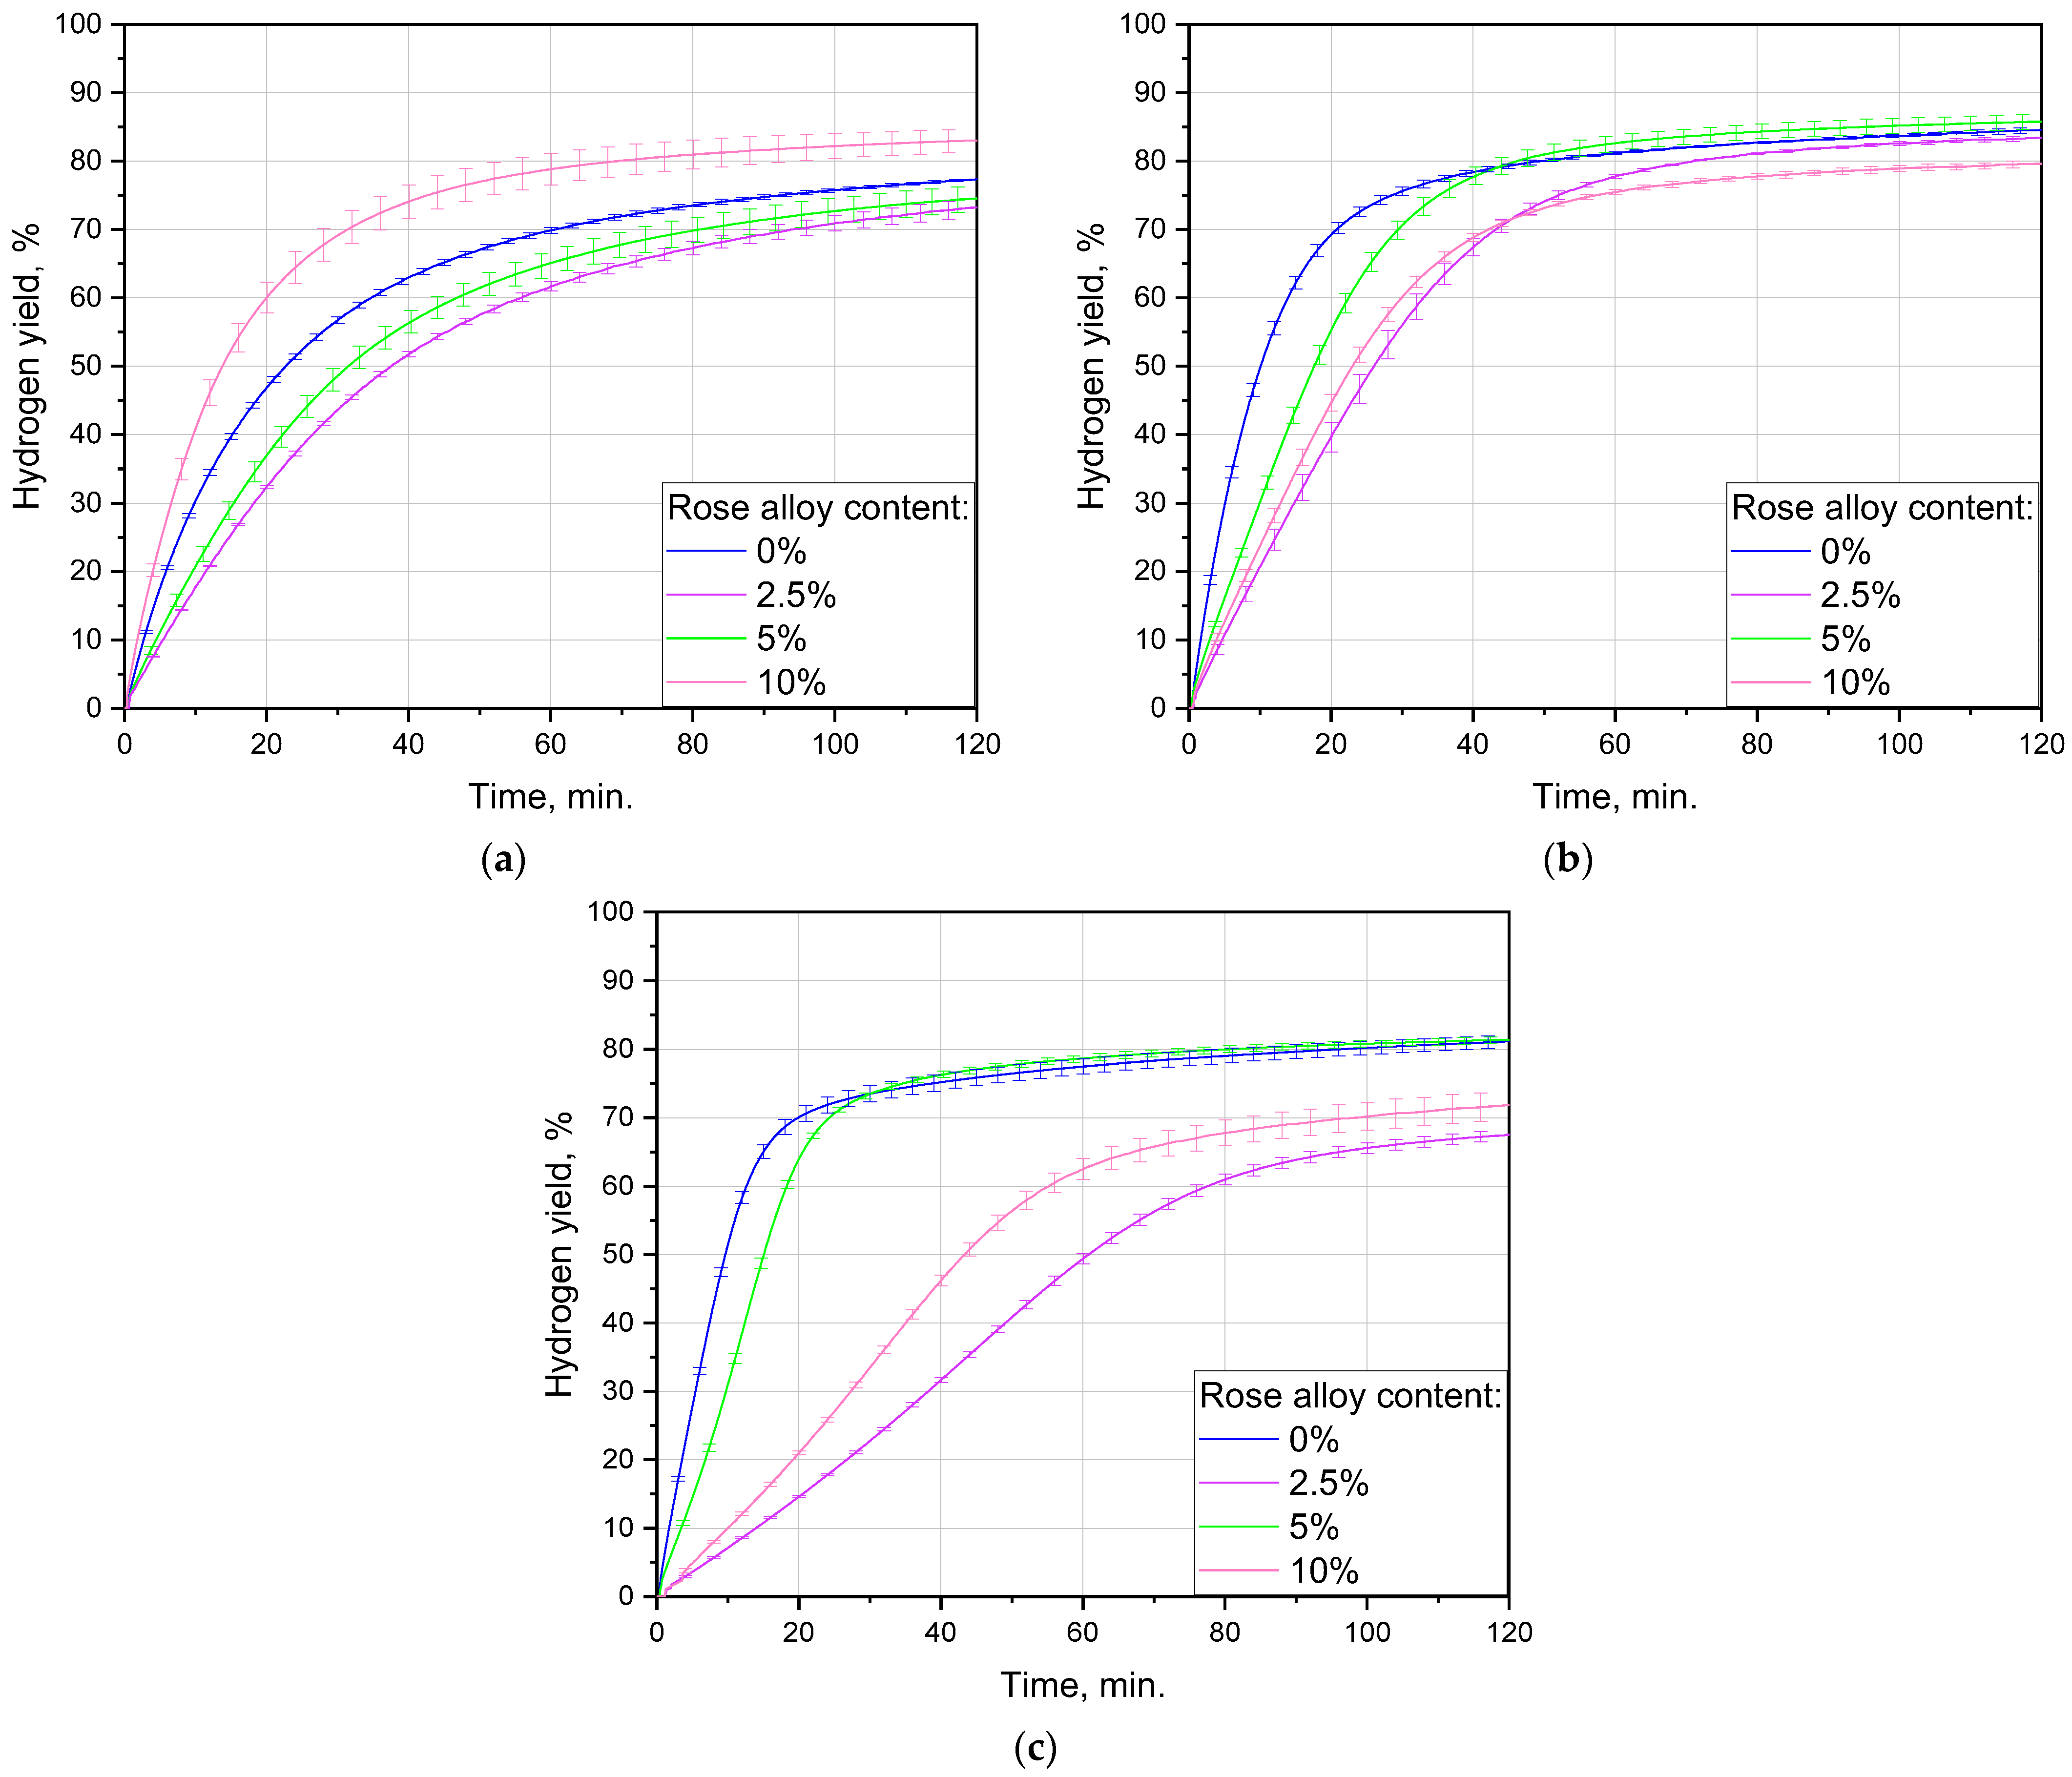
3.2.1. Impact of Ball-Milling Duration

The impact of the ball-milling time interval was investigated for all Rose alloy contents: 0, 2.5, 5 and 10 wt.%. The sets of hydrogen-release kinetic curves are represented in Figure 4; the data on hydrogen generation performance are listed in Table 2. For the samples with the alloy contents of 0, 2.5, and 5 wt.% the highest maximum hydrogen evolution rates were obtained in case of 1 h activation: 86, 35, and 49 mL/min./g, respectively, while for that with the maximum 10 wt.% the value of 39 mL/min./g was the second highest. After 2 h of activation, for all the compositions those values decreased correspondingly to 77, 19, 43, and 27 mL/min./g. Milling during 0.5 h resulted in the relevant rates of 56, 31, 35, and 66 mL/min./g. After 2 h of the experiment, the achieved hydrogen yields for the samples fell within the range ~65–90%. For the samples containing 0, 2.5, and 5 wt.% Rose alloy the highest scrap-to-hydrogen conversion values also corresponded to 1 h activation time and achieved (84.6 ± 0.4)%, (83.4 ± 0.3)%, (85.8 ± 1.1)%, while again the 10 wt.% (79.6 ± 0.5)% was the second highest value. Ball milling during 2 h resulted in the relevant figures of (81.2 ± 0.9)%, (67.5 ± 0.7)%, (81.4 ± 0.5)%, and (71.9 ± 2.1)%. After 0.5 h of milling, as much as (77.3 ± 0.2)%, (73.2 ± 1.3)%, (74.5 ± 1.9)%, and (83.0 ± 1.6)% were obtained, respectively.
It was notable that for all compositions the kinetic curves for 2 h of milling had a ‘canonical’ ‘S’-like shape with a clear acceleration part in the beginning, while those for 1 and 0.5 h continuously decelerated. The mentioned curve shape was known to be typical for topochemical reactions [126]. That acceleration section could arise from the partial oxidation of the samples with residual oxygen during prolonged ball milling, because the resulting MgO took some time to be hydrated in order to form a less dense Mg(OH)2 [127].
On the one hand, longer milling time favored the accumulation of a greater number of crystal lattice imperfections (grain boundaries, dislocations, stacking faults, wherein the energy of the atoms is higher) vulnerable to localized corrosion attacks, e.g., pitting corrosion by the enrichment in chloride [88,118,128,129]. On the other hand, however, it was capable of enhancing partial oxidation of the powdered samples, thus reducing their reactivity. It obviously affected the distribution of the activating additive as well. In study [130], in the case of Mg–Ni powders it was assumed that, after a shorter milling, a larger cathode (Ni) surface area contributed to faster hydrogen release. However, for aluminum-based powders Bi nanoparticles were reported to demonstrate better performance than bigger, micron-sized particles [131]. In [47], an intermediate-sized copper powder occurred to provide better aluminum activation than the finer and coarser ones. Most likely, different sorts of additives might have various ‘optimal cathodic structures’ (sizes of the sites enriched with additive components and their distribution over particles) prone to inducing intensive galvanic corrosion of the base metal.
The existence of the optimal ball-milling duration was established in numerous previous studies [88,109,130]. As seen for the tested alloy contents and milling conditions, 1 h was optimal for the samples with 0, 2.5, and 5 wt.% Rose alloy since that duration provided the best hydrogen evolution performance (yields and maximum reaction rates), while in the case of the maximum 10 wt.% that optimum shifted to 0.5 h.

3.2.2. Influence of Additive Content

The influence of the additive content for various milling durations is demonstrated in Figure 5. It was noteworthy that for all tested activation intervals, the lowest maximum hydrogen reaction rates were observed for the sample with 2.5 wt.% Rose alloy. At longer time intervals of 1 and 2 h, the second-lowest values corresponded to the 10 wt.% of the additive, while the highest rates were achieved for the sample without additives. For the shortest tested period of 0.5 h the fastest hydrogen evolution along with its maximum yield were obtained for the sample with 10 wt.% Rose alloy, while that without additives moved to the ‘second-best position in the rating’. The largest divergence in the hydrogen yields emerged for the samples with different additive contents after prolonged 2 h activation. It appeared to be smaller in the case of 0.5 h and was minimal for 1 h of ball milling.
Intensified oxidation of Mg and Al powders ‘mechanically coupled’ with metal additives (Ni, Co, Bi) by air at elevated temperatures was proved by thermogravimetric analysis [132,133]. Accordingly, after 2 h of milling, the highest activator amounts of 5 and 10 wt.% tested in the present study were expected to enhance oxidation of the samples with residual oxygen, and their maximum reaction rates were anticipated to decline below those for 0 and 2.5 wt.% Rose alloy contents. That forecast, however, failed to turn into reality. Therefore, to elaborate an explanation for the observed dependency of the samples’ reactivity on the Rose alloy content, other factors were considered below.
The samples with 2.5, 5, and 10 wt.% of the additive contained 0.45, 0.9, and 1.8 wt.% Sn; 0.8, 1.6, and 3.2 wt.% Pb; and 1.25, 2.5, and 5 wt.% Bi, respectively. Various amounts of those alloying elements were determined to improve or reduce the corrosion stability of various Mg-based alloys. Thus, a small Pb content of 0.1 wt.% had a negative effect on the corrosion resistance of the AZ91 alloy [134], but in the range 0.2–1 wt.% it improved the stability of the Mg–10Al–12Si system [135]. For the tested 0.6, 1.2, and 1.8 wt.% fractions of Pb added to the Mg97–Zn1–Y2 alloy, corrosion protection decreased with the increase in the additive content [124]. Increase in the Pb concentration from 2.5 to 7.5 wt.% improved the corrosion protection for the Mg–3Al alloy, but reduced it for the Mg–9Al and Mg–6Al systems [136]. According to the findings from [137,138,139,140], the Mg–6Al and Mg–6Al–1In compounds modified with 5 wt.% Pb had enhanced anodic reaction activity. In large amounts (~30 wt.%), Pb inhibited corrosion of the Mg–9.2Al–0.8B alloys [141]. The proposed mechanism of corrosion enhancement in Mg–Al alloys by Pb was associated with the formation of a complex reaction product, wherein precipitated PbxO on the alloy’s surface facilitated the precipitation of Al(OH)3 that could ‘peel off’ dense Mg(OH)2 in the form of Al(OH)3∙2Mg(OH)2 [137,140].
The Mg–1Sn alloy was reported to suffer from more rapid corrosion than pure Mg, and 1–3 wt.% of Sn significantly accelerated the corrosion and hydrogen release rate of the Mg–6Al–1Zn, Mg–6Al–5Pb–0.5Mn–0.5RE, and Mg–7Al–0.2Mn compounds [142,143,144,145,146]. For the Mg–Sn alloy 1.5 wt.% Sn was determined to provide the best corrosion resistance as compared to 0.5, 1, and 2 wt.% [147]. In contrast, 3 wt.% Sn added to the Mg–2Al–6Zn and Mg–Zn alloys improved their corrosion protection, and an extruded Mg alloy modified with 5 wt% Sn demonstrated improved corrosion resistance [148,149,150]. Large Sn amounts of 5 and 10 wt.% introduced into high pure Mg were reported to improve its corrosion resistance drastically [151]. Nevertheless, in Mg-based alloys with 2–8 wt.% Sn, as the area fraction of the grain boundaries increased (i.e., grain size decreased), the amount of Mg2Sn particles increased and accelerated the H2 evolution rate [152]. Meanwhile, in another study [153] it was suggested that the grain size refinement and decrease in volume fraction of the second-phase particles could improve the corrosion resistance of Mg–Ca alloys. An important Sn property was the formation of Sn-rich intermetallics at the Mg (α-phase) grain boundaries responsible for the grain refinement. The reduced free energy barrier on the Mg2Sn (β-phase) surface favored the nucleation of the β-phase at the locations of the Mg2Sn particles. Because of that, a larger number of nucleation cores were created, thus forming a refined and dispersed β-phase hampering the grain growth [154].
In case of the AZ91 modified with Ca and Bi (1 wt.%), no corrosion was observed in the Mg2Ca phase while Mg3Bi2 sites were exposed to severe attack [155]. The introduction of 0.5 wt.% Bi into the Mg–1.2Ca system was reported to increase its protection against corrosion, while the larger tested values of 1.5, 3, 5, and 12 wt.% diminished it; for the concentrations of 3 wt.% and higher, a significant reduction in the grain size and enhanced dynamic recrystallization of the matrix were established as well [123,156,157]. In study [158], for the tested Mg–Bi alloys the self-discharge rates associated with hydrogen evolution were the lowest for 0.5 wt.% and gradually increased for 1 and 2 wt.%. Minor amounts of Bi, 0.2–1 wt.%, added to the Mg–8Al system demonstrated that the optimal additive content was 0.4 wt.% [159], and in pure Mg 0.8 wt.% Bi provided excellent anticorrosion properties [160]. In study [97] it was concluded that for as-cast and as-rolled Mg–6Bi–2Sn alloys their respective predominant corrosion modes were intergranular and pitting corrosions. Another finding was that the refined grain structure and finely dispersed secondary phase particles with considerably smaller sizes and lower volume fraction enhanced the corrosion resistance of the as-rolled alloy. The formation of complex passive films (MgO, Mg(OH)2, SnO2, and Bi2O3) contributing to corrosion stability was assumed in [97,160]. It was established as well that Bi addition yielded significant strength improvement to Mg alloys produced via extrusion (plastic deformation at elevated temperature took place during ball milling as well). At the same time, large amounts of undissolved coarse Mg3Bi2 particles reduced their ductility because they acted as cracking sources [161,162].
According to the findings from [163], low (0.1–0.5 wt.%) amounts of Pb, Sn, or Bi introduced into a pure (99.95%) Mg alloy augmented its corrosion protection. It was noteworthy that in the BSE microphotographs of the alloys with 0.5 wt.% additive, no irregularities for the samples with Sn and Pb were observed, while they were clearly visible in case of Bi. Such a discrepancy could be ascribed to the high solubility of Pb and Sn in the Mg lattice as compared to that for Bi (maximum 7.75, 3.35, and 1.12 wt.%, respectively).
Summarizing the abovementioned data, one could come to a conclusion that for different alloy systems, within some content ranges the additives had a positive influence on the corrosion resistance, while other amounts had the opposite effect. The combined impact of grain size and secondary phase properties on the corrosion behavior of Mg-based alloys generally remained unclear. As to the grain-refining properties of Sn and Bi, it was difficult to derive whether they introduced any contributions to the grain refining provided by severe plastic deformations during high energy ball milling or not. Moreover, their effects were considered for solidification of alloys produced by melting and not for ‘mechanical alloying’ via ball milling.
The lowest hydrogen generation performance in the case of the minimum 2.5 wt.% Rose alloy could be associated with the small Sn and Pb amounts that fell within the ranges favorable for corrosion stability, while the Bi content was close to the ‘borderline’ between ‘positive’ and ‘negative’ impacts. According to the data from [164], Pb solubility in Mg at 100 °C was as high as 0.4 at.%, i.e., 3.3 wt.%, which was quite a high value. At room temperature it apparently was lower; however, its large solubility probably resulted in the formation of a negligible Mg2Pb amount in the sample with 2.5 wt.% (and 5 wt.%) Rose alloy, if any at all. As the XRD patterns for Mg2Pb and Mg2Sn overlapped, those phases could not be distinguished. Therefore, for the samples with relatively low Rose alloy contents, Pb possibly did not contribute to galvanic corrosion by the formation of Mg2Pb. The effect of Pb atoms dissolved in the Mg lattice on its corrosion behavior still was not clearly explained; however, it might be similar to that proposed for Sn. The solubility of Sn at room temperature was ~0.17 wt.% [165]. In study [154], it was stated that Sn in the form of Sn2Mg (~0.2 wt.% of total 0.5 wt.%) could promote galvanic corrosion of Mg, while Sn in a solid solution imposed an opposite effect (stabilization of the Mg matrix with incorporated Sn atoms also still lacks a detailed explanation). So, it could turn out that considerable amounts of Sn and Pb merely dissolved in the Mg lattice (indeed, the respective XRD peaks for Sn2Mg and Mg2Pb were barely visible), and generally their impact on the corrosion promotion was either neutral or negative. Considering a low solubility of 0.1 wt.% at room temperature [166] and visible respective diffraction peaks, Bi definitely formed a Mg3Bi2 phase. In the case of that phase, its influence on the Mg corrosion intensification could extend from neutral to negative because of the following reasons. As it was established in the studies discussed above, small-sized and evenly distributed Mg3Bi2 particles could be beneficial for corrosion protection. First, in contrast with the coarse particles, they did not represent cracking sources promoting corrosion. Second, their ability to form more uniform and continuous complex passive films of MgO, Mg(OH)2, and Bi2O3 (by the oxidation of the samples’ components with residual air during ball milling) was higher. Third, if the protection film was destroyed, although Mg3Bi2 particles provided sites for the pitting corrosion initiation, they represented too small ‘cathodic sites’, thus hampering the corrosion pits’ growth, and those pits could be ‘shielded’ by the mentioned components of the passive films. In the case of the minimum Rose alloy content, the additive was majorly distributed over the particles in the form of small sites presumably resistant to severe corrosion attacks.
For the samples with the maximum 10 wt.% additive, their poor efficiency after 1 and 2 h could have the following possible explanation. The longer milling durations resulted in more uniform distribution of the secondary phase regions with considerably smaller sizes over the particles. As mentioned above, even distribution of fine Mg3Bi2 particles was beneficial for the formation of more uniform and continuous complex passive films of MgO, Mg(OH)2, and Bi2O3, thus providing better corrosion resistance. For the samples under discussion, because of the larger amount, Sn could contribute as well by forming another film’s component, SnO2. Longer activation intervals resulted in significant particles’ ‘reshaping’ from flattened shapes into equiaxed compacted solid objects that reduced their specific surface area. A hypothetical effect for the high activation content could be local cracking of the material in the vicinity of the coarse Mg3Bi2 particles formed in the first 0.5 h of ball milling. Such embrittled regions could contribute to the mechanical embrittlement from steel ball impacts and accelerate the mentioned microstructural transformations owing to more intensive fracturing. This could potentially lead to a more rapid decrease in the specific surface area of the samples.
The excellent result for the sample with 10 wt.% Rose alloy and 0.5 h activation could be ascribed to the following reasons. First, it had a relatively large specific surface area because the originally flat particles did not pass through drastic transformations after the relatively short milling time of 0.5 h (proved by the SEM analysis). Second, the said embrittlement in the vicinity of the Mg3Bi2 phase (which was likely deposited in the form of coarse particles because of the additive abundance and uneven distribution after a short milling time) could result in the formation of crevices, thus enlarging the area in contact with the aqueous solution (hypothesis). Third, the complex passive films (MgO, Mg(OH)2, SnO2, and Bi2O3) determined to improve corrosion resistance were not formed in a continuous and/or uniform manner after such a short milling time (hypothesis). Fourth, the formed large-sized regions enriched with the intermetallic phases Mg3Bi2, Mg2Sn, and Mg2Pb could be beneficial for intensive corrosion with hydrogen release (hypothesis). As the optimal sizes of ‘cathodic’ sites were determined to be the smallest (Al milled with Bi) [131], the largest (Mg–Ni system) [130], and intermediate (Al activated with Cu) [47] in different relevant studies on hydrogen generation, further studies are needed to support or abandon the idea of the optimal sizes and distributions of the ‘cathodic’ sites.
As to the samples with the intermediate 5 wt.% Rose alloy content ball milled for 1 and 2 h and their lower performance as compared to those without additives, the potential reason again could be the formation of the abovementioned complex passive oxide films. However, because of the lower concentrations of the additive components, those films were possibly removed more readily as compared to those for the compounds with 10 wt.% additive. Presumably, this provided the acceleration of the reaction rates for these samples and caused their kinetic curves to match (within error bars) those for the samples without additives along their deceleration sections. The underperformance of the 0.5 h milled sample was quite a complex question. Based on the above data, it could be assumed that some other effects determined by the concentrations of the separate Rose alloy components, Pb, Sn, and Bi, on the Mg alloys corrosion behavior could come into the spotlight. The findings from the different studies discussed above did not provide a complete picture of the dependency of the corrosion resistance or intensification on the contents of the listed metals. It could be that in the lack of mechanical activation (as compared with longer milling durations), the corrosion behavior of that sample was governed by a combination of some protective and destructive effects imposed by partially dissolved Pb and Sn (found to have enhanced corrosion resistance), minor Mg2Sn and, probably, Mg2Pb phases, and the predominant Mg3Bi2 compound, which could produce quite controversial effects. Therefore, for clear understanding of the corrosion behavior of Mg-based alloys affected by Sn, Pb, and Bi, future investigations are needed.
To provide further insights into the reasons for the observed non-monotonic hydrogen production dependency on the additive concentration along with ball milling, some additional techniques can be employed. One of them could be X-ray photoelectron spectroscopy (XPS) for the investigation of the complex oxide films that could be formed on the particles’ surfaces. Another useful procedure could be mixing the particles with carbon and resin, polishing the solidified mixture, and investigating the particles’ cross-sections by a metallographic microscope to clarify the distribution of the intermetallic phases. Since only obviously large deviations in the particles’ sizes could be detected by visual inspection through a microscope, accurate size measurements for large quantities of particles of different samples could also provide valuable information on whether the larger additive content accelerated microstructural transformation during ball milling or not.

3.3. Characteristics of the Reaction Products

The microphotographs of the reaction products from the 1 h milled samples without additives and with 5 wt.% Rose alloy are shown in Figure 6. The product was deposited in the form of agglomerates of small ‘flakes’. In the BSE image for the sample with Rose alloy, the solid product composed of the base metal, hydrogen, and oxygen (shown in gray shades) contained a structure of large ‘lamellas’ (shown in white). These ‘lamellas’ likely were Mg compounds with heavier elements (Mg3Bi2, Mg2Sn, and Mg2Pb), as their contrasting light color indicated the presence of heavy chemical elements.
The XRD patterns for the products are given in Figure 7. The product majorly comprised Mg(OH)2, as expected. Residual NaCl from the solution was identified as well. None of the intermetallic phases was detected. However, their presence was proved by the microphotograph. Presumably, their amounts in the samples appeared to be too low owing to their possible ‘exfoliation’ in the course of the reaction. In [159], the formation of BiOCl for Mg-based materials reacting with 3.5 wt.% NaCl solution was revealed. In the present study, a third compound matching the XRD pattern for the product obtained from the sample with Rose alloy was PbBiO2Cl.

4. Conclusions

Twelve types of samples for hydrogen generation were elaborated of the mixed scrap of Mg–Al–Zn and Mg–Nd–Zr–Zn casting alloys with 0, 2.5, 5, and 10 wt.% low melting point Rose alloy by high energy ball milling during 0.5, 1, and 2 h. Their reactivity in 3.5 wt.% aqueous NaCl solution was tested at room temperature. The impacts of additive content and milling time were investigated.
The main influence from ball milling was the creation of imperfections in the crystal lattice of the base metal that increased its vulnerability to pitting corrosion, structural evolution of the particles from flat shapes to compacted solid objects that diminished their specific surface area, and partial surficial oxidation of the particles with residual oxygen during ball milling that decreased the reaction rates in the beginning. For all samples except that with 10 wt.% Rose alloy, 1 h of activation provided the highest hydrogen yields and reaction rates. For the sample with the maximum additive content, 0.5 h appeared to be optimal as it provided the maximum hydrogen yield and rapid reaction progress.
The impact of the additive content was complex. The lowest amount of 2.5 wt.% Rose alloy produced a negative effect on the hydrogen release of the samples for all ball-milling durations. The reason for this could be the considerable dissolution of Pb and Sn in the Mg crystal lattice with the formation of a solid solution inhibiting corrosion, together with the formation of fine sparsely distributed Mg3Bi2 particles generally resistant to severe corrosion attacks. The overperforming result for the sample with the maximum 10 wt.% additive content and 0.5 h activation could be ascribed to the following reasons. First, it had a relatively large specific surface area because no drastic transformations took place after the relatively short milling time. Second, embrittlement in the vicinity of the Mg3Bi2 phase (likely deposited as coarse particles owing to the additive abundance and uneven distribution after a short milling time) could result in the formation of crevices, thus enlarging the area in contact with the aqueous solution. Third, the short milling time could be insufficient for the formation of the complex passive films (MgO, Mg(OH)2, SnO2, and Bi2O3). Fourth, the observed large-sized regions enriched with the intermetallic phases Mg3Bi2, Mg2Sn, and Mg2Pb could turn out to be beneficial for the intensive corrosion with hydrogen release. The underperformance of the samples with 10 wt.% Rose alloy after 1 and 2 h milling was associated with the following effects. First, structural particle transformations during prolonged ball milling involved a decrease in their specific surface area (this process might be promoted by the embrittlement coming from the cracking sources of the coarse Mg3Bi2 particles). Second, prolonged ball milling could result in a much more uniform distribution of the small-sized intermetallic phases Mg3Bi2, Mg2Sn, which contributed to the formation of a dense and continuous complex oxide film (MgO, Mg(OH)2, SnO2, and Bi2O3). As to the samples with the intermediate 5 wt.% additive content milled for 1 and 2 h and their underperforming the samples without additives, the potential reason again could be the formation of the abovementioned complex passive oxide films. No reliable explanation for the 0.5 h milled sample was elaborated. It could be that in the lack of mechanical activation, the corrosion behavior of that sample was governed by a combination of some protective and destructive effects imposed by partially dissolved Pb and Sn (found to have enhanced corrosion resistance), minor Mg2Sn and, probably, Mg2Pb compounds, and the predominating Mg3Bi2 phase, which could produce quite controversial effects. Therefore, to provide a clear understanding of the corrosion behavior of Mg-based alloys affected by Sn, Pb, and Bi, further studies should be carried out.
The findings of the present study could be interesting as another contribution to the existing knowledge about Mg-based material corrosion behavior. It was shown that intermetallic structures that were expected to enhance Mg corrosion with hydrogen release could impose quite the opposite effect. Potentially, the corrosion inhibition properties of Rose alloy can be studied for Mg-based materials manufactured by some plastic deformation techniques (e.g., friction stir processing, cold or hot rolling). The major challenge could be associated with the elaboration of such materials not via a laboratory ball mill but using a large industrial ball mill. Variation in milling conditions can significantly affect the properties of the resulting composite materials. The findings of the present study, however, can be potentially extended or applied to other types of composite or waste materials. For example, the waste of some other Mg alloy grades can be activated in a similar manner, and some close compositions of the activating alloy can be used. Summarizing the above, the investigated method can be employed for the utilization of mixed Mg-based waste with hydrogen generation.

Author Contributions

Conceptualization, funding acquisition, writing—original draft preparation, O.A.B.; investigation, data curation, supervision, O.A.B. and A.B.T.; visualization, validation, M.Z.S.; methodology, formal analysis, G.N.A.; writing—review and editing, resources, project administration, M.S.V. All authors have read and agreed to the published version of the manuscript.

Funding

This work was supported by the Ministry of Science and Higher Education of the Russian Federation (State Assignment No. 075-01129-23-00).

Institutional Review Board Statement

Not applicable.

Informed Consent Statement

Not applicable.

Data Availability Statement

Not applicable.

Acknowledgments

We would like to express our gratitude to the Ministry of Science and Higher Education of the Russian Federation for financial support (State Assignment No. 075-01129-23-00).

Conflicts of Interest

The authors declare no conflict of interest.

Appendix A

EDX analysis results for the selected spots on the samples ball milled with 10 wt.% Rose alloy during 1 h are shown in Figure A1.
Figure A1. EDX analysis results (spectra) for the 1 h ball-milled sample with 10 wt.% Rose alloy.
Materials 16 04745 g0a1aMaterials 16 04745 g0a1b

References

  1. Ritchie, H.; Roser, M.; Rosado, P. CO2 and Greenhouse Gas Emissions. Our World Data 2020. Available online: https://ourworldindata.org/co2-and-greenhouse-gas-emissions (accessed on 27 May 2023).
  2. Elveny, M.S.; Jalil, A.T.; Davarpanah, A.; Alfakeer, M.; Bahajjaj, A.A.A.; Ouladsmane, M. CFD-based simulation to reduce greenhouse gas emissions from industrial plants. Int. J. Chem. React. Eng. 2021, 19, 1179–1186. [Google Scholar] [CrossRef]
  3. Samelak, I.; Balaban, M.; Antić, M.; Šolević Knudsen, T.; Jovančićević, B. Geochromatographic migration of oil pollution from a heating plant to river sediments. Environ. Chem. Lett. 2020, 18, 459–466. [Google Scholar] [CrossRef]
  4. Zhang, B.; Matchinski, E.J.; Chen, B.; Ye, X.; Jing, L.; Lee, K. Chapter 21—Marine Oil Spills—Oil Pollution, Sources and Effects. In World Seas: An Environmental Evaluation, 2nd ed.; Sheppard, C., Ed.; Academic Press: Cambridge, MA, USA, 2019; pp. 391–406. [Google Scholar]
  5. Dastan, S.A. The predicaments of the Turkish natural gas market between supply shortages and price hikes. Resour. Policy 2023, 82, 103566. [Google Scholar] [CrossRef]
  6. Xue, M.-M.; Wu, G.; Wang, Q.; Yao, Y.-F.; Liang, Q.-M. Socioeconomic impacts of a shortage in imported oil supply: Case of China. Nat. Hazards 2019, 99, 1415–1430. [Google Scholar] [CrossRef]
  7. Panchenko, V.A.; Daus, Y.V.; Kovalev, A.A.; Yudaev, I.V.; Litti, Y.V. Prospects for the production of green hydrogen: Review of countries with high potential. Int. J. Hydrogen Energy 2023, 48, 4551–4571. [Google Scholar] [CrossRef]
  8. Vlaskin, M.S.; Dudoladov, A.O.; Buryakovskaya, O.A.; Ambaryan, G.N. Modelling of aluminum-fuelled power plant with steam-hydrogen enthalpy utilization. Int. J. Hydrogen Energy 2018, 43, 4623–4631. [Google Scholar] [CrossRef]
  9. Yu, M.; Wang, K.; Vredenburg, H. Insights into low-carbon hydrogen production methods: Green, blue and aqua hydrogen. Int. J. Hydrogen Energy 2021, 46, 21261–21273. [Google Scholar] [CrossRef]
  10. Alhuyi Nazari, M.; Fahim Alavi, M.; Salem, M.; Assad, M.E.H. Utilization of hydrogen in gas turbines: A comprehensive review. Int. J. Low-Carbon Technol. 2022, 17, 513–519. [Google Scholar] [CrossRef]
  11. Ha, C.; Jiao, Y.; Wang, C.; Qin, J.; Wang, S.; Liu, H.; Liu, Z.; Guo, F. Experimental study of hydrogen catalytic combustion wall temperature distribution characteristics and its effect on the coupling performance of autothermal reformers. Energy 2023, 271, 127052. [Google Scholar] [CrossRef]
  12. Hassan, Q.; Abdulateef, A.M.; Hafedh, S.A.; Al-samari, A.; Abdulateef, J.; Sameen, A.Z.; Salman, H.M.; Al-Jiboory, A.K.; Wieteska, S.; Jaszczur, M. Renewable energy-to-green hydrogen: A review of main resources routes, processes and evaluation. Int. J. Hydrogen Energy 2023, 48, 17383–17408. [Google Scholar] [CrossRef]
  13. Zhao, H.; Lu, D.; Wang, J.; Tu, W.; Wu, D.; Koh, S.W.; Gao, P.; Xu, Z.J.; Deng, S.; Zhou, Y.; et al. Raw biomass electroreforming coupled to green hydrogen generation. Nat. Commun. 2021, 12, 2008. [Google Scholar] [CrossRef]
  14. Jovan, D.J.; Dolanc, G. Can Green Hydrogen Production Be Economically Viable under Current Market Conditions. Energies 2020, 13, 6599. [Google Scholar] [CrossRef]
  15. Armijo, J.; Philibert, C. Flexible production of green hydrogen and ammonia from variable solar and wind energy: Case study of Chile and Argentina. Int. J. Hydrogen Energy 2020, 45, 1541–1558. [Google Scholar] [CrossRef]
  16. Kakoulaki, G.; Kougias, I.; Taylor, N.; Dolci, F.; Moya, J.; Jäger-Waldau, A. Green hydrogen in Europe—A regional assessment: Substituting existing production with electrolysis powered by renewables. Energy Convers. Manag. 2021, 228, 113649. [Google Scholar] [CrossRef]
  17. Cho, S.M.; Kim, C.; Kim, K.S.; Kim, D.K. Lightweight hydrogen storage cylinder for fuel cell propulsion systems to be applied in drones. Int. J. Press. Vessel. Pip. 2021, 194, 104428. [Google Scholar] [CrossRef]
  18. Li, M.; Bai, Y.; Zhang, C.; Song, Y.; Jiang, S.; Grouset, D.; Zhang, M. Review on the research of hydrogen storage system fast refueling in fuel cell vehicle. Int. J. Hydrogen Energy 2019, 44, 10677–10693. [Google Scholar] [CrossRef] [Green Version]
  19. Zhang, T.; Uratani, J.; Huang, Y.; Xu, L.; Griffiths, S.; Ding, Y. Hydrogen liquefaction and storage: Recent progress and perspectives. Renew. Sustain. Energy Rev. 2023, 176, 113204. [Google Scholar] [CrossRef]
  20. Aziz, M. Liquid Hydrogen: A Review on Liquefaction, Storage, Transportation, and Safety. Energies 2021, 14, 5917. [Google Scholar] [CrossRef]
  21. Lee, S.-Y.; Lee, J.-H.; Kim, Y.-H.; Kim, J.-W.; Lee, K.-J.; Park, S.-J. Recent Progress Using Solid-State Materials for Hydrogen Storage: A Short Review. Processes 2022, 10, 304. [Google Scholar] [CrossRef]
  22. Tang, D.; Tan, G.-L.; Li, G.-W.; Liang, J.-G.; Ahmad, S.M.; Bahadur, A.; Humayun, M.; Ullah, H.; Khan, A.; Bououdina, M. State-of-the-art hydrogen generation techniques and storage methods: A critical review. J. Energy Storage 2023, 64, 107196. [Google Scholar] [CrossRef]
  23. Dvoynikov, M.; Buslaev, G.; Kunshin, A.; Sidorov, D.; Kraslawski, A.; Budovskaya, M. New Concepts of Hydrogen Production and Storage in Arctic Region. Resources 2021, 10, 3. [Google Scholar] [CrossRef]
  24. Zou, Q.; Tian, Y.; Han, F. Prediction of state property during hydrogen leaks from high-pressure hydrogen storage systems. Int. J. Hydrogen Energy 2019, 44, 22394–22404. [Google Scholar] [CrossRef]
  25. Zhang, M.; Lv, H.; Kang, H.; Zhou, W.; Zhang, C. A literature review of failure prediction and analysis methods for composite high-pressure hydrogen storage tanks. Int. J. Hydrogen Energy 2019, 44, 25777–25799. [Google Scholar] [CrossRef]
  26. Faye, O.; Szpunar, J.; Eduok, U. A critical review on the current technologies for the generation, storage, and transportation of hydrogen. Int. J. Hydrogen Energy 2022, 47, 13771–13802. [Google Scholar] [CrossRef]
  27. Moradi, R.; Groth, K.M. Hydrogen storage and delivery: Review of the state of the art technologies and risk and reliability analysis. Int. J. Hydrogen Energy 2019, 44, 12254–12269. [Google Scholar] [CrossRef]
  28. Dewangan, S.K.; Mohan, M.; Kumar, V.; Sharma, A.; Ahn, B. A comprehensive review of the prospects for future hydrogen storage in materials-application and outstanding issues. Int. J. Energy Res. 2022, 46, 16150–16177. [Google Scholar] [CrossRef]
  29. Usman, M.R. Hydrogen storage methods: Review and current status. Renew. Sustain. Energy Rev. 2022, 167, 112743. [Google Scholar] [CrossRef]
  30. Uda, M.; Okuyama, H.; Suzuki, T.S.; Sakka, Y. Hydrogen generation from water using Mg nanopowder produced by arc plasma method. Sci. Technol. Adv. Mater. 2012, 13, 025009. [Google Scholar] [CrossRef]
  31. Ilyin, A.P.; Root, L.O.; Mostovshchikov, A.V. Application of Aluminum Nanopowder for Pure Hydrogen Production. Key Eng. Mater. 2016, 712, 261–266. [Google Scholar] [CrossRef]
  32. Uehara, K.; Takeshita, H.; Kotaka, H. Hydrogen gas generation in the wet cutting of aluminum and its alloys. J. Mater. Process. Technol. 2002, 127, 174–177. [Google Scholar] [CrossRef]
  33. Ambaryan, G.N.; Vlaskin, M.S.; Dudoladov, A.O.; Meshkov, E.A.; Zhuk, A.Z.; Shkolnikov, E.I. Hydrogen generation by oxidation of coarse aluminum in low content alkali aqueous solution under intensive mixing. Int. J. Hydrogen Energy 2016, 41, 17216–17224. [Google Scholar] [CrossRef]
  34. Yavor, Y.; Goroshin, S.; Bergthorson, J.M.; Frost, D.L.; Stowe, R.; Ringuette, S. Enhanced hydrogen generation from aluminum–water reactions. Int. J. Hydrogen Energy 2013, 38, 14992–15002. [Google Scholar] [CrossRef]
  35. Escobar-Alarcón, L.; Iturbe-García, J.L.; González-Zavala, F.; Solis-Casados, D.A.; Pérez-Hernández, R.; Haro-Poniatowski, E. Hydrogen production by laser irradiation of metals in water under an ultrasonic field: A novel approach. Int. J. Hydrogen Energy 2019, 44, 1579–1585. [Google Scholar] [CrossRef]
  36. Aduev, B.P.; Kraft, Y.V.; Nurmukhametov, D.R.; Belokurov, G.M.; Nelubina, N.V.; Ismagilov, Z.R. Hydrogen production by oxidation of aluminum nanopowder in water under the action of laser pulses. Int. J. Hydrogen Energy 2023, 48, 22484–22494. [Google Scholar] [CrossRef]
  37. Trowell, K.; Goroshin, S.; Frost, D.; Bergthorson, J. Hydrogen production rates of aluminum reacting with varying densities of supercritical water. RSC Adv. 2022, 12, 12335–12343. [Google Scholar] [CrossRef]
  38. Etminanbakhsh, M.; Reza Allahkaram, S. Reaction of aluminum particles with superheated steam to generate hydrogen gas as a readily usable clean fuel. Fuel 2023, 332, 126011. [Google Scholar] [CrossRef]
  39. Yavor, Y.; Goroshin, S.; Bergthorson, J.M.; Frost, D.L. Comparative reactivity of industrial metal powders with water for hydrogen production. Int. J. Hydrogen Energy 2015, 40, 1026–1036. [Google Scholar] [CrossRef]
  40. Kravchenko, O.V.; Sevastyanova, L.G.; Genchel, V.K.; Bulychev, B.M. Hydrogen generation from magnesium oxidation by water in presence of halides of transition and non-transition metals. Int. J. Hydrogen Energy 2015, 40, 12072–12077. [Google Scholar] [CrossRef]
  41. Kantürk Figen, A.; Coşkuner, B.; Pişkin, S. Hydrogen generation from waste Mg based material in various saline solutions (NiCl2, CoCl2, CuCl2, FeCl3, MnCl2). Int. J. Hydrogen Energy 2015, 40, 7483–7489. [Google Scholar] [CrossRef]
  42. Dudoladov, A.O.; Buryakovskaya, O.A.; Vlaskin, M.S.; Zhuk, A.Z.; Shkolnikov, E.I. Generation of hydrogen by aluminium oxidation in aquaeous solutions at low temperatures. Int. J. Hydrogen Energy 2016, 41, 2230–2237. [Google Scholar] [CrossRef]
  43. Buryakovskaya, O.A.; Vlaskin, M.S. Hydrogen Recovery from Waste Aluminum–Plastic Composites Treated with Alkaline Solution. Materials 2022, 15, 8699. [Google Scholar] [CrossRef] [PubMed]
  44. Soberanis, M.A.E.; Vales-Pinzón, C.; Hernández-Núñez, E.; Flota-Bañuelos, M.; Medina, J.; Quintal-Palomo, R.; San-Pedro, L.; Ruiz-Gómez, M. Temperature dependence on hydrogen production from hydrolysis reaction of recycled aluminum. Clean Technol. Environ. Policy 2023, 25, 35–49. [Google Scholar] [CrossRef]
  45. Alviani, V.N.; Hirano, N.; Watanabe, N.; Oba, M.; Uno, M.; Tsuchiya, N. Local initiative hydrogen production by utilization of aluminum waste materials and natural acidic hot-spring water. Appl. Energy 2021, 293, 116909. [Google Scholar] [CrossRef]
  46. Saishu, H.; Kosaka, T.; Tsuchiya, N.; Watanabe, N. Empirical studies of the hydrogen generation system by using hot springs water and waste aluminum. J. Geotherm. Res. Soc. Jpn. 2017, 39, 15–24. [Google Scholar]
  47. Buryakovskaya, O.A.; Suleimanov, M.Z.; Vlaskin, M.S.; Kumar, V.; Ambaryan, G.N. Aluminum Scrap to Hydrogen: Complex Effects of Oxidation Medium, Ball Milling Parameters, and Copper Additive Dispersity. Metals 2023, 13, 185. [Google Scholar] [CrossRef]
  48. Al Bacha, S.; Thienpont, A.; Zakhour, M.; Nakhl, M.; Bobet, J.L. Clean hydrogen production by the hydrolysis of magnesium-based material: Effect of the hydrolysis solution. J. Clean. Prod. 2021, 282, 124498. [Google Scholar] [CrossRef]
  49. Kravchenko, O.V.; Sevastyanova, L.G.; Urvanov, S.A.; Bulychev, B.M. Formation of hydrogen from oxidation of Mg, Mg alloys and mixture with Ni, Co, Cu and Fe in aqueous salt solutions. Int. J. Hydrogen Energy 2014, 39, 5522–5527. [Google Scholar] [CrossRef]
  50. Rodríguez, M.; Urretavizcaya, G.; Bobet, J.-L.; Castro, F.J. Effective hydrogen production by hydrolysis of Mg wastes reprocessed by mechanical milling with iron and graphite. J. Alloys Compd. 2023, 946, 169352. [Google Scholar] [CrossRef]
  51. Li, S.-L.; Song, J.-M.; Uan, J.-Y. Mg-Mg2X (X = Cu, Sn) eutectic alloy for the Mg2X nano-lamellar compounds to catalyze hydrolysis reaction for H2 generation and the recycling of pure X metals from the reaction wastes. J. Alloys Compd. 2019, 772, 489–498. [Google Scholar] [CrossRef]
  52. Li, S.-L.; Lin, H.-M.; Uan, J.-Y. Production of an Mg/Mg2Ni lamellar composite for generating H2 and the recycling of the post-H2 generation residue to nickel powder. Int. J. Hydrogen Energy 2013, 38, 13520–13528. [Google Scholar] [CrossRef]
  53. Davies, J.; du Preez, S.P.; Bessarabov, D.G. On-Demand Hydrogen Generation by the Hydrolysis of Ball-Milled Aluminum–Bismuth–Zinc Composites. Materials 2022, 15, 1197. [Google Scholar] [CrossRef] [PubMed]
  54. Davies, J.; Du Preez, S.P.; Bessarabov, D.G. The Hydrolysis of Ball-Milled Aluminum–Bismuth–Nickel Composites for On-Demand Hydrogen Generation. Energies 2022, 15, 2356. [Google Scholar] [CrossRef]
  55. Kolupula, A.P.; Pant, H.; Varam, S.; Srikanth, V.V.S.S. Novel nanocomposite constituted by Al-Bi alloy and MoS2 for hydrogen generation through hydrolysis. Mater. Lett. 2023, 337, 133946. [Google Scholar] [CrossRef]
  56. Jin, Z.; Wang, H.; Shi, J.; Wang, H.; Gao, X.; Gao, Q.; Sun, X. Unveiling the role of indium and tin in Al–Ga based alloys for on-demand hydrogen supply from simulation to validation. J. Power Sources 2023, 554, 232268. [Google Scholar] [CrossRef]
  57. Wang, W.; Zhao, X.M.; Chen, D.M.; Yang, K. Insight into the reactivity of Al–Ga–In–Sn alloy with water. Int. J. Hydrogen Energy 2012, 37, 2187–2194. [Google Scholar] [CrossRef]
  58. Huang, T.; Gao, Q.; Liu, D.; Xu, S.; Guo, C.; Zou, J.; Wei, C. Preparation of Al-Ga-In-Sn-Bi quinary alloy and its hydrogen production via water splitting. Int. J. Hydrogen Energy 2015, 40, 2354–2362. [Google Scholar] [CrossRef]
  59. Wei, C.; Liu, D.; Xu, S.; Cui, T.; An, Q.; Liu, Z.; Gao, Q. Effects of Cu additives on the hydrogen generation performance of Al-rich alloys. J. Alloys Compd. 2018, 738, 105–110. [Google Scholar] [CrossRef]
  60. An, Q.; Hu, H.; Li, N.; Liu, D.; Xu, S.; Liu, Z.; Wei, C.; Luo, F.; Xia, M.; Gao, Q. Effects of Bi composition on microstructure and Al-water reactivity of Al-rich alloys with low-In. Int. J. Hydrogen Energy 2018, 43, 10887–10895. [Google Scholar] [CrossRef]
  61. Su, M.; Wang, H.; Xu, H.; Chen, F.; Hu, H.; Gan, J. Enhanced hydrogen production properties of a novel aluminum-based composite for instant on-site hydrogen supply at low temperature. Int. J. Hydrogen Energy 2022, 47, 9969–9985. [Google Scholar] [CrossRef]
  62. Ma, M.; Yang, L.; Ouyang, L.; Shao, H.; Zhu, M. Promoting hydrogen generation from the hydrolysis of Mg-Graphite composites by plasma-assisted milling. Energy 2019, 167, 1205–1211. [Google Scholar] [CrossRef]
  63. Wang, S.; Sun, L.-X.; Xu, F.; Jiao, C.-L.; Zhang, J.; Zhou, H.-Y.; Huang, F.-L. Hydrolysis reaction of ball-milled Mg-metal chlorides composite for hydrogen generation for fuel cells. Int. J. Hydrogen Energy 2012, 37, 6771–6775. [Google Scholar] [CrossRef]
  64. Czech, E.; Troczynski, T. Hydrogen generation through massive corrosion of deformed aluminum in water. Int. J. Hydrogen Energy 2010, 35, 1029–1037. [Google Scholar] [CrossRef]
  65. Alinejad, B.; Mahmoodi, K. A novel method for generating hydrogen by hydrolysis of highly activated aluminum nanoparticles in pure water. Int. J. Hydrogen Energy 2009, 34, 7934–7938. [Google Scholar] [CrossRef]
  66. Huang, M.; Ouyang, L.; Liu, J.; Wang, H.; Shao, H.; Zhu, M. Enhanced hydrogen generation by hydrolysis of Mg doped with flower-like MoS2 for fuel cell applications. J. Power Sources 2017, 365, 273–281. [Google Scholar] [CrossRef]
  67. Buryakovskaya, O.A.; Kurbatova, A.I.; Vlaskin, M.S.; Valyano, G.E.; Grigorenko, A.V.; Ambaryan, G.N.; Dudoladov, A.O. Waste to Hydrogen: Elaboration of Hydroreactive Materials from Magnesium-Aluminum Scrap. Sustainability 2022, 14, 4496. [Google Scholar] [CrossRef]
  68. Sun, Q.; Zou, M.; Guo, X.; Yang, R.; Huang, H.; Huang, P.; He, X. A study of hydrogen generation by reaction of an activated Mg–CoCl2 (magnesium–cobalt chloride) composite with pure water for portable applications. Energy 2015, 79, 310–314. [Google Scholar] [CrossRef]
  69. Huang, M.; Ouyang, L.; Ye, J.; Liu, J.; Yao, X.; Wang, H.; Shao, H.; Zhu, M. Hydrogen generation via hydrolysis of magnesium with seawater using Mo, MoO2, MoO3 and MoS2 as catalysts. J. Mater. Chem. A 2017, 5, 8566–8575. [Google Scholar] [CrossRef]
  70. Ostovan, F.; Hasanzadeh, E.; Toozandehjani, M.; Shafiei, E.; Jamaludin, K.R.; Amrin, A.B. A combined friction stir processing and ball milling route for fabrication Al5083-Al2O3 nanocomposite. Mater. Res. Express 2019, 6, 065012. [Google Scholar] [CrossRef]
  71. David, E.; Kopac, J. Hydrolysis of aluminum dross material to achieve zero hazardous waste. J. Hazard. Mater. 2012, 209–210, 501–509. [Google Scholar] [CrossRef]
  72. Kale, M.; Yılmaz, İ.H.; Kaya, A.; Çetin, A.E.; Söylemez, M.S. Pilot-scale hydrogen generation from the hydrolysis of black aluminum dross without any catalyst. J. Energy Inst. 2022, 100, 99–108. [Google Scholar] [CrossRef]
  73. Mahinroosta, M.; Allahverdi, A. Hazardous aluminum dross characterization and recycling strategies: A critical review. J. Environ. Manag. 2018, 223, 452–468. [Google Scholar] [CrossRef] [PubMed]
  74. Mary Joseph, A.; Snellings, R.; Nielsen, P.; Matthys, S.; De Belie, N. Pre-treatment and utilisation of municipal solid waste incineration bottom ashes towards a circular economy. Constr. Build. Mater. 2020, 260, 120485. [Google Scholar] [CrossRef]
  75. Moreno-Flores, R.; Loyola-Morales, F.; Valenzuela, E.; Sebastian, P.J. Design and performance evaluation of a prototype hydrogen generator employing hydrolysis of aluminum waste. Clean Technol. Environ. Policy 2023, 25, 747–753. [Google Scholar] [CrossRef]
  76. Salueña-Berna, X.; Marín-Genescà, M.; Massagués Vidal, L.; Dagà-Monmany, J.M. Waste Aluminum Application as Energy Valorization for Hydrogen Fuel Cells for Mobile Low Power Machines Applications. Materials 2021, 14, 7323. [Google Scholar] [CrossRef]
  77. Zhang, Y.; Liu, B.; Chen, S.; Xu, K. A new idea for industrial safety in magnesium grinding: Suppression of hydrogen generation in wet dust collectors. Int. J. Hydrogen Energy 2022, 47, 20333–20346. [Google Scholar] [CrossRef]
  78. Zhang, Y.; Xu, K.; Ge, J.; Liu, B. Study on hydrogen evolution risk and suppression methods of Mg–Al/Mg–Zn alloy waste dust in wet dust collector. Process Saf. Environ. Prot. 2022, 163, 321–329. [Google Scholar] [CrossRef]
  79. Al Bacha, S.; Pighin, S.A.; Urretavizcaya, G.; Zakhour, M.; Nakhl, M.; Castro, F.J.; Bobet, J.L. Effect of ball milling strategy (milling device for scaling-up) on the hydrolysis performance of Mg alloy waste. Int. J. Hydrogen Energy 2020, 45, 20883–20893. [Google Scholar] [CrossRef]
  80. Cinkilic, E.; Ridgeway, C.D.; Yan, X.; Luo, A.A. A Formation Map of Iron-Containing Intermetallic Phases in Recycled Cast Aluminum Alloys. Metall. Mater. Trans. A 2019, 50, 5945–5956. [Google Scholar] [CrossRef]
  81. Capuzzi, S.; Timelli, G. Preparation and Melting of Scrap in Aluminum Recycling: A Review. Metals 2018, 8, 249. [Google Scholar] [CrossRef] [Green Version]
  82. Itoh, S.; Tsujita, K.; Morishige, T.; Takenaka, T. The Effect of Vibration Condition for Magnesium Dry Gravity Sorting by Vibrating Particulate Bed. Mater. Sci. Forum 2019, 941, 1535–1539. [Google Scholar] [CrossRef]
  83. Razavi-Tousi, S.S.; Szpunar, J.A. Effect of ball size on steady state of aluminum powder and efficiency of impacts during milling. Powder Technol. 2015, 284, 149–158. [Google Scholar] [CrossRef]
  84. Shelekhov, E.V.; Tcherdyntsev, V.V.; Pustov, L.Y.; Kaloshkin, S.D.; Tomilin, I.A. Computer Simulation of Mechanoactivation Process in the Planetary Ball Mill: Determination of the Energy Parameters of Milling. J. Metastable Nanocrystalline Mater. 2000, 8, 603–608. [Google Scholar] [CrossRef]
  85. Sato, A.; Kano, J.; Saito, F. Analysis of abrasion mechanism of grinding media in a planetary mill with DEM simulation. Adv. Powder Technol. 2010, 21, 212–216. [Google Scholar] [CrossRef]
  86. Vummidi Lakshman, S.; Gibbins, J.D.; Wainwright, E.R.; Weihs, T.P. The effect of chemical composition and milling conditions on composite microstructure and ignition thresholds of AlZr ball milled powders. Powder Technol. 2019, 343, 87–94. [Google Scholar] [CrossRef]
  87. Salili, S.M.; Ataie, A.; Sadighi, Z. Effect of Ball Size and Ball to Powder Ratio Variation on Crystallite Size and Formation of Nanocrystalline Materials in Planetary Ball Mill. AIP Conf. Proc. 2011, 1400, 127–130. [Google Scholar] [CrossRef]
  88. Razavi-Tousi, S.S.; Szpunar, J.A. Effect of structural evolution of aluminum powder during ball milling on hydrogen generation in aluminum–water reaction. Int. J. Hydrogen Energy 2013, 38, 795–806. [Google Scholar] [CrossRef]
  89. Ostovan, F.; Matori, K.A.; Toozandehjani, M.; Oskoueian, A.; Yusoff, H.M.; Yunus, R.; Ariff, A.H.M. Microstructural evaluation of ball-milled nano Al2O3 particulate-reinforced aluminum matrix composite powders. Int. J. Mater. Res. 2015, 106, 636–640. [Google Scholar] [CrossRef]
  90. Li, Z.; Wang, Q.; Luo, A.A.; Peng, L.; Zhang, P. Fatigue behavior and life prediction of cast magnesium alloys. Mater. Sci. Eng. A 2015, 647, 113–126. [Google Scholar] [CrossRef]
  91. Viswanadhapalli, B.; Bupesh Raja, V.K. Application of Magnesium Alloys in Automotive Industry-A Review. In Proceedings of the Emerging Trends in Computing and Expert Technology, Chennai, India, 22–23 March 2019; Springer: Cham, Switzerland, 2020; pp. 519–531. [Google Scholar]
  92. Oslanec, P.; Iždinský, K.; Simančík, F. Possibilities of magnesium recycling. Mater. Sci. Technol. 2008, 4, 83–88. [Google Scholar]
  93. Gouty, Q.; Castro, F.J.; Urretavizcaya, G.; Sabatier, J.; Bobet, J.L. Experimental and theoretical approach of the hydrolysis of pelleted magnesium alloys scraps. J. Alloys Compd. 2022, 919, 165784. [Google Scholar] [CrossRef]
  94. Leite, R.; Amorim, M.; Rodrigues, M.; Oliveira Neto, G. Overcoming barriers for adopting cleaner production: A case study in Brazilian small metal-mechanic companies. Sustainability 2019, 11, 4808. [Google Scholar] [CrossRef] [Green Version]
  95. Duan, Y.; Sun, Y.; He, J.; Guo, Z.; Fang, D. Corrosion behavior of as-cast Pb-Mg-Al alloys in 3.5% NaCl solution. Corrosion 2012, 68, 822–826. [Google Scholar] [CrossRef] [PubMed]
  96. Gabalcová, Z.; Gogola, P.; Gerhátová, Ž.; Palcut, M. Corrosion Behavior of an Mg2Sn Alloy. Materials 2022, 15, 2025. [Google Scholar] [CrossRef] [PubMed]
  97. Cheng, W.-L.; Ma, S.-C.; Bai, Y.; Cui, Z.-Q.; Wang, H.-X. Corrosion behavior of Mg-6Bi-2Sn alloy in the simulated body fluid solution: The influence of microstructural characteristics. J. Alloys Compd. 2018, 731, 945–954. [Google Scholar] [CrossRef]
  98. Deady, E.; Moon, C.; Moore, K.; Goodenough, K.M.; Shail, R.K. Bismuth: Economic geology and value chains. Ore Geol. Rev. 2022, 143, 104722. [Google Scholar] [CrossRef]
  99. Periyapperuma, K.; Tran, T.T.; Purcell, M.I.; Obrovac, M.N. The Reversible Magnesiation of Pb. Electrochim. Acta 2015, 165, 162–165. [Google Scholar] [CrossRef]
  100. Babayigit, A.; Duy Thanh, D.; Ethirajan, A.; Manca, J.; Muller, M.; Boyen, H.-G.; Conings, B. Assessing the toxicity of Pb- and Sn-based perovskite solar cells in model organism Danio rerio. Sci. Rep. 2016, 6, 18721. [Google Scholar] [CrossRef]
  101. Kim, W.J.; Seo, S.; Lee, S.I.; Kim, D.W.; Kim, M.J. A study on pyro-hydrometallurgical process for selective recovery of Pb, Sn and Sb from lead dross. J. Hazard. Mater. 2021, 417, 126071. [Google Scholar] [CrossRef]
  102. Xiao, F.; Guo, Y.; Yang, R.; Li, J. Hydrogen generation from hydrolysis of activated magnesium/low-melting-point metals alloys. Int. J. Hydrogen Energy 2019, 44, 1366–1373. [Google Scholar] [CrossRef]
  103. Pilidi, A.; Tzanis, A.; Helm, T.; Arfanis, M.; Falaras, P.; Speliotis, T. Nanometer-Thick Bismuth Nanocrystal Films for Sensoric Applications. ACS Appl. Nano Mater. 2020, 3, 9669–9678. [Google Scholar] [CrossRef]
  104. Liu, Y.; Tu, K.N. Low melting point solders based on Sn, Bi, and In elements. Mater. Today Adv. 2020, 8, 100115. [Google Scholar] [CrossRef]
  105. Radetić, T.; Popović, M.; Alil, A.; Markoli, B.; Naglič, I.; Romhanji, E. Effect of homogenization temperature on microstructure and mechanical properties of Al-Mg-Si alloy containing low-melting point elements. J. Alloys Compd. 2022, 902, 163719. [Google Scholar] [CrossRef]
  106. GOST 2856-79; Casting Magnesium Alloys. Grades. IPK Standards Publishing House: Moscow, Russia, 1981.
  107. GOST 4233-77; Reagents. Sodium Chloride. Specifications. IPK Standards Publishing House: Moscow, Russia, 1978.
  108. GOST 10157-79; Gaseous and Liquid Argon. Specifications. IPK Standards Publishing House: Moscow, Russia, 1980.
  109. Buryakovskaya, O.A.; Vlaskin, M.S. Microstructural Transformation and Hydrogen Generation Performance of Magnesium Scrap Ball Milled with Devarda’s Alloy. Materials 2022, 15, 8058. [Google Scholar] [CrossRef] [PubMed]
  110. Bobrynina, E.; Koltsova, T.; Larionova, T. Investigation of Copper–Carbon Composite Microstructure and Properties. Metals 2023, 13, 1052. [Google Scholar] [CrossRef]
  111. Tang, L.; Peng, X.; Huang, J.; Ma, A.; Deng, Y.; Xu, G. Microstructure and mechanical properties of severely deformed Al-Mg-Sc-Zr alloy and their evolution during annealing. Mater. Sci. Eng. A 2019, 754, 295–308. [Google Scholar] [CrossRef]
  112. Calka, A.; Wexler, D. A Study of the Evolution of Particle Size and Geometry during Ball Milling. Mater. Sci. Forum 2001, 360–362, 301–310. [Google Scholar] [CrossRef]
  113. Czerwinski, F. The reactive element effect on high-temperature oxidation of magnesium. Int. Mater. Rev. 2015, 60, 264–296. [Google Scholar] [CrossRef]
  114. Feng, H.; Liu, S.; Du, Y.; Lei, T.; Zeng, R.; Yuan, T. Effect of the second phases on corrosion behavior of the Mg-Al-Zn alloys. J. Alloys Compd. 2017, 695, 2330–2338. [Google Scholar] [CrossRef]
  115. Candan, S.; Candan, E. Comparative study on corrosion behaviors of Mg-Al-Zn alloys. Trans. Nonferrous Met. Soc. China 2018, 28, 642–650. [Google Scholar] [CrossRef]
  116. Li, J.; Zhang, B.; Wei, Q.; Wang, N.; Hou, B. Electrochemical behavior of Mg-Al-Zn-In alloy as anode materials in 3.5wt.% NaCl solution. Electrochim. Acta 2017, 238, 156–167. [Google Scholar] [CrossRef]
  117. Ren, T.; Yang, S.; Wu, S.; Wang, M.; Xue, Y. High-energy ball milling enhancing the reactivity of microscale zero-valent aluminum toward the activation of persulfate and the degradation of trichloroethylene. Chem. Eng. J. 2019, 374, 100–111. [Google Scholar] [CrossRef]
  118. Wang, C.; Yang, T.; Liu, Y.; Ruan, J.; Yang, S.; Liu, X. Hydrogen generation by the hydrolysis of magnesium–aluminum–iron material in aqueous solutions. Int. J. Hydrogen Energy 2014, 39, 10843–10852. [Google Scholar] [CrossRef]
  119. Zhao, W. The Corrosion Behavior and Mechanical Properties of AZ31 Magnesium Alloy. Master’s Thesis, Washington State University, Pullman, WA, USA, 2017. [Google Scholar]
  120. Ruggiero, M.A.; Rutter, J.W. Formation of microstructure during solidification of Bi–Pb–Sn ternary eutectic. Mater. Sci. Technol. 1999, 15, 1110–1114. [Google Scholar] [CrossRef]
  121. Gierlotka, W.; Tung, Y.-C. A New Thermodynamic Description of the Bi-Pb-Sn System. J. Phase Equilibria Diffus. 2017, 38, 814–828. [Google Scholar] [CrossRef]
  122. Kamal, M.; Moharram, B.M.; Farag, H.; El-Bediwi, A.; Abosheiasha, H.F. Structure, attenuation coefficients and physical properties of Bi–Pb–Sn fusible alloys. Radiat. Eff. Defects Solids 2006, 161, 137–142. [Google Scholar] [CrossRef]
  123. Guo, T.; Lu, X.; Varma, R.K.; Zhao, C.; Wang, J.; You, J.; Chen, J. Influence of Coarse Mg3Bi2 Particles on Deformation Behaviors of Mg-Bi Alloys. Front. Mater. 2021, 8, 633789. [Google Scholar] [CrossRef]
  124. Wan, D.-Q.; Hu, Y.-L.; Ye, S.-T.; Wang, H.-B.; Wei, S.-M. Effects of Pb on microstructure, mechanical properties and corrosion resistance of as-cast Mg97Zn1Y2 alloys. China Foundry 2018, 15, 443–448. [Google Scholar] [CrossRef] [Green Version]
  125. Deng, Y.; Sun, W.; Yang, Y.; Zhan, H.; Yan, K.; Zeng, G. Effects of Mg2Sn precipitation on the age-hardening and deformation behaviour of a Mg-Sn-Al-Zn alloy. Mater. Sci. Eng. A 2023, 867, 144714. [Google Scholar] [CrossRef]
  126. Michael, E.B.; Brown, E. Handbook of Thermal Analysis and Calorimetry: Principles and Practice; Elsevier: Amsterdam, The Netherlands, 1998. [Google Scholar]
  127. Birchal, V.; Rocha, S.; Mansur, M.; Ciminelli, V. A simplified mechanistic analysis of magnesia hydration. Can. J. Chem. Eng. 2001, 79, 507–511. [Google Scholar] [CrossRef]
  128. Al Bacha, S.; Aubert, I.; Devos, O.; Zakhour, M.; Nakhl, M.; Bobet, J.L. Corrosion of pure and milled Mg17Al12 in “model” seawater solution. Int. J. Hydrogen Energy 2020, 45, 15805–15813. [Google Scholar] [CrossRef]
  129. Rodríguez, M.; Niro, F.; Urretavizcaya, G.; Bobet, J.-L.; Castro, F.J. Hydrogen production from hydrolysis of magnesium wastes reprocessed by mechanical milling under air. Int. J. Hydrogen Energy 2022, 47, 5074–5084. [Google Scholar] [CrossRef]
  130. Grosjean, M.H.; Zidoune, M.; Roué, L.; Huot, J.Y. Hydrogen production via hydrolysis reaction from ball-milled Mg-based materials. Int. J. Hydrogen Energy 2006, 31, 109–119. [Google Scholar] [CrossRef]
  131. Xiao, F.; Yang, R.; Gao, W.; Hu, J.; Li, J. Effect of carbon materials and bismuth particle size on hydrogen generation using aluminum-based composites. J. Alloys Compd. 2020, 817, 152800. [Google Scholar] [CrossRef]
  132. Zou, M.-S.; Yang, R.-J.; Guo, X.-Y.; Huang, H.-T.; He, J.-Y.; Zhang, P. The preparation of Mg-based hydro-reactive materials and their reactive properties in seawater. Int. J. Hydrogen Energy 2011, 36, 6478–6483. [Google Scholar] [CrossRef]
  133. Wang, C.-H.; Guo, X.-Y.; Zou, M.-S.; Yang, R.-J. Preparation and hydro-reactivity of ball-milled aluminum-based hydro-reactive metal materials. Acta Armamentarii 2016, 37, 817–822. [Google Scholar] [CrossRef]
  134. Südholz, A.D.; Birbilis, N.; Bettles, C.J.; Gibson, M.A. Corrosion behaviour of Mg-alloy AZ91E with atypical alloying additions. J. Alloys Compd. 2009, 471, 109–115. [Google Scholar] [CrossRef]
  135. Çiçek, B.; Sun, Y. A study on the mechanical and corrosion properties of lead added magnesium alloys. Mater. Des. 2012, 37, 369–372. [Google Scholar] [CrossRef]
  136. Wang, L.; Wang, R.; Feng, Y.; Deng, M.; Wang, N. Effect of Al and Pb Contents on the Corrosion Electrochemical Properties and Activation of Mg-Al-Pb Alloy Anode. J. Electrochem. Soc. 2017, 164, A438. [Google Scholar] [CrossRef]
  137. Wang, N.-G.; Wang, R.-C.; Peng, C.-Q.; Yan, F.; Zhang, X.-Y. Influence of aluminium and lead on activation of magnesium as anode. Trans. Nonferrous Met. Soc. China 2010, 20, 1403–1411. [Google Scholar] [CrossRef]
  138. Wang, N.-G.; Wang, R.-C.; Peng, C.-Q.; FENG, Y.; Zhang, X.-Y. Corrosion behavior of Mg-Al-Pb and Mg-Al-Pb-Zn-Mn alloys in 3.5% NaCl solution. Trans. Nonferrous Met. Soc. China 2010, 20, 1936–1943. [Google Scholar] [CrossRef]
  139. Wang, N.; Wang, R.; Peng, C.; Feng, Y.; Chen, B. Effect of hot rolling and subsequent annealing on electrochemical discharge behavior of AP65 magnesium alloy as anode for seawater activated battery. Corros. Sci. 2012, 64, 17–27. [Google Scholar] [CrossRef]
  140. Wang, N.; Wang, R.; Peng, C.; Peng, B.; Feng, Y.; Hu, C. Discharge behaviour of Mg-Al-Pb and Mg-Al-Pb-In alloys as anodes for Mg-air battery. Electrochim. Acta 2014, 149, 193–205. [Google Scholar] [CrossRef]
  141. Li, B.; Duan, Y.; Zheng, S.; Li, M.; Peng, M.; Qi, H. Microstructure evolution and corrosion properties of ECAPed Mg–Pb-9.2Al-0.8B alloys. J. Mater. Res. Technol. 2023, 24, 6048–6064. [Google Scholar] [CrossRef]
  142. Wang, P.; Li, J.P.; Guo, Y.C.; Yang, Z.; Xia, F. Effect of Tin on Microstructure and Electrochemistrical Properties of Mg-Al-Sn-Zn Magnesium Alloys Anodic Materials. Adv. Mater. Res. 2011, 197–198, 1129–1134. [Google Scholar] [CrossRef]
  143. Wang, P.; Li, J.; Guo, Y.; Yang, Z.; Xia, F.; Wang, J. Effect of tin addition on microstructure and electrochemical properties of rolled AZ61-Sn magnesium anodic materials. Rare Met. 2011, 30, 639. [Google Scholar] [CrossRef]
  144. Ping, W.; Jianping, L.; Yongchun, G.; Zhong, Y.; Feng, X.; Jianli, W. Effect of Sn on microstructure and electrochemical properties of Mg alloy anode materials. Rare Met. Mater. Eng. 2012, 41, 2095–2099. [Google Scholar] [CrossRef]
  145. Song, G.-L. Effect of tin modification on corrosion of AM70 magnesium alloy. Corros. Sci. 2009, 51, 2063–2070. [Google Scholar] [CrossRef]
  146. Gu, X.; Zheng, Y.; Cheng, Y.; Zhong, S.; Xi, T. In vitro corrosion and biocompatibility of binary magnesium alloys. Biomaterials 2009, 30, 484–498. [Google Scholar] [CrossRef]
  147. Wang, J.; Li, Y.; Huang, S.; Zhou, X. Study of the corrosion behavior and the corrosion films formed on the surfaces of Mg–xSn alloys in 3.5wt.% NaCl solution. Appl. Surf. Sci. 2014, 317, 1143–1150. [Google Scholar] [CrossRef]
  148. Jihua, C.; Zhenhua, C.; Hongge, Y.; Fuquan, Z.; Yingliang, C. Effects of Sn and Ca additions on microstructure, mechanical properties, and corrosion resistance of the as-cast Mg-Zn-Al-based alloy. Mater. Corros. 2008, 59, 934–941. [Google Scholar] [CrossRef]
  149. Ha, H.-Y.; Kang, J.-Y.; Yang, J.; Yim, C.D.; You, B.S. Role of Sn in corrosion and passive behavior of extruded Mg-5 wt% Sn alloy. Corros. Sci. 2016, 102, 355–362. [Google Scholar] [CrossRef]
  150. Tong, F.; Chen, X.; Wei, S.; Malmström, J.; Vella, J.; Gao, W. Microstructure and battery performance of Mg-Zn-Sn alloys as anodes for magnesium-air battery. J. Magnes. Alloy. 2021, 9, 1967–1976. [Google Scholar] [CrossRef]
  151. Cain, T.W.; Glover, C.F.; Scully, J.R. The corrosion of solid solution Mg-Sn binary alloys in NaCl solutions. Electrochim. Acta 2019, 297, 564–575. [Google Scholar] [CrossRef]
  152. Ha, H.-Y.; Kang, J.-Y.; Kim, S.G.; Kim, B.; Park, S.S.; Yim, C.D.; You, B.S. Influences of metallurgical factors on the corrosion behaviour of extruded binary Mg–Sn alloys. Corros. Sci. 2014, 82, 369–379. [Google Scholar] [CrossRef]
  153. Zeng, R.-C.; Qi, W.-C.; Cui, H.-Z.; Zhang, F.; Li, S.-Q.; Han, E.-H. In vitro corrosion of as-extruded Mg–Ca alloys—The influence of Ca concentration. Corros. Sci. 2015, 96, 23–31. [Google Scholar] [CrossRef]
  154. Mingo, B.; Arrabal, R.; Mohedano, M.; Mendis, C.L.; del Olmo, R.; Matykina, E.; Hort, N.; Merino, M.C.; Pardo, A. Corrosion of Mg-9Al alloy with minor alloying elements (Mn, Nd, Ca, Y and Sn). Mater. Des. 2017, 130, 48–58. [Google Scholar] [CrossRef] [Green Version]
  155. Zhou, W.; Aung, N.N.; Sun, Y. Effect of antimony, bismuth and calcium addition on corrosion and electrochemical behaviour of AZ91 magnesium alloy. Corros. Sci. 2009, 51, 403–408. [Google Scholar] [CrossRef]
  156. Tok, H.Y.; Hamzah, E.; Bakhsheshi-Rad, H.R. The role of bismuth on the microstructure and corrosion behavior of ternary Mg–1.2Ca–xBi alloys for biomedical applications. J. Alloys Compd. 2015, 640, 335–346. [Google Scholar] [CrossRef]
  157. Yu, H.; Liu, H.; Jiang, B.; Yu, W.; Kang, S.; Cheng, W.; Park, S.; Chen, D.; Yin, F.; Shin, K.; et al. A Comprehensive Study of Dynamic Recrystallization Behavior of Mg Alloy with 3 wt.% Bi Addition. Metals 2021, 11, 838. [Google Scholar] [CrossRef]
  158. Chen, Y.-H.; Cheng, W.-L.; Gu, X.-J.; Yu, H.; Wang, H.-X.; Niu, X.-F.; Wang, L.-F.; Li, H. Discharge performance of extruded Mg-Bi binary alloys as anodes for primary Mg-air batteries. J. Alloys Compd. 2021, 886, 161271. [Google Scholar] [CrossRef]
  159. Wu, C.; Meng, X.; Wang, W. High-Performance Mg–Al–Bi Alloy Anode for Seawater Batteries and Related Mechanisms. Processes 2020, 8, 1362. [Google Scholar] [CrossRef]
  160. Xu, W.-T.; Cheng, W.; Guo, Z.-Y.; Yu, H.; Wang, L.-F.; Li, H.; Wang, H.-X.; Wang, J.-H.; Meng, S.-J. Development of Dilute Mg-Bi Alloy Sheet with Good Synergy of Corrosion-Resistance and Tensile Properties. SSRN 2023. [Google Scholar] [CrossRef]
  161. Go, J.; Lee, J.U.; Yu, H.; Park, S.H. Influence of Bi addition on dynamic recrystallization and precipitation behaviors during hot extrusion of pure Mg. J. Mater. Sci. Technol. 2020, 44, 62–75. [Google Scholar] [CrossRef]
  162. Yu, H.; Fan, S.; Meng, S.; Choi, J.O.; Li, Z.; Go, Y.; Kim, Y.M.; Zhao, W.; You, B.S.; Shin, K.S. Microstructural evolution and mechanical properties of binary Mg–xBi (x = 2, 5, and 8 wt%) alloys. J. Magnes. Alloy. 2021, 9, 983–994. [Google Scholar] [CrossRef]
  163. Liu, R.L.; Scully, J.R.; Williams, G.; Birbilis, N. Reducing the corrosion rate of magnesium via microalloying additions of group 14 and 15 elements. Electrochim. Acta 2018, 260, 184–195. [Google Scholar] [CrossRef] [Green Version]
  164. Nayeb-Hashemi, A.A.; Clark, J.B. The Mg–Pb (Magnesium–Lead) system. Bull. Alloy Phase Diagr. 1985, 6, 56–66. [Google Scholar] [CrossRef]
  165. Elsayed, F.R.; Sasaki, T.T.; Mendis, C.L.; Ohkubo, T.; Hono, K. Compositional optimization of Mg–Sn–Al alloys for higher age hardening response. Mater. Sci. Eng. A 2013, 566, 22–29. [Google Scholar] [CrossRef]
  166. Guangyin, Y.; Yangshan, S.; Wenjiang, D. Effects of bismuth and antimony additions on the microstructure and mechanical properties of AZ91 magnesium alloy. Mater. Sci. Eng. A 2001, 308, 38–44. [Google Scholar] [CrossRef]
Figure 1. Experimental set: 1—reactor, 2—thermocouple, 3—magnetic mixer and stirring bar, 4—thermostat, 5—Drexel flask, 6—glass vessel, 7—resistance temperature detector, 8—flask, 9—scales, 10—multichannel thermometer, 11—computer, 12—barometer [83].
Materials 16 04745 g001
Figure 2. Microphotographs of the ball-milled samples: (a) 0.5 h milled sample without additives (SE); (b) 1 h milled sample without additives (SE); (c) 2 h milled sample without additives (SE); (d) 0.5 h milled sample with 10 wt.% Rose alloy (BSE); (e) 1 h milled sample with 10 wt.% Rose alloy (BSE); (f) 2 h milled sample with 10 wt.% Rose alloy (BSE); (g) 0.5 h milled sample with 5 wt.% Rose alloy (BSE); (h) 1 h milled sample with 5 wt.% Rose alloy (BSE); (i) 2 h milled sample with 10 wt.% Rose alloy (BSE); (j) 0.5 h milled sample with 2.5 wt.% Rose alloy (BSE); (k) 1 h milled sample with 2.5 wt.% Rose alloy (BSE); (l) 2 h milled sample with 2.5 wt.% Rose alloy (BSE).
Materials 16 04745 g002aMaterials 16 04745 g002bMaterials 16 04745 g002cMaterials 16 04745 g002dMaterials 16 04745 g002e
Figure 3. XRD patterns of the original materials, scrap and Rose alloy, and activated samples with different additive concentrations and ball-milling durations.
Materials 16 04745 g003
Figure 4. Hydrogen evolution kinetic curves for different ball-milling durations and sample compositions: (a) no additive; (b) 2.5 wt.% additive; (c) 5 wt.% additive; (d) 10 wt.% additive.
Materials 16 04745 g004aMaterials 16 04745 g004b
Figure 5. Hydrogen generation kinetic curves for different sample compositions and ball-milling time intervals: (a) 0.5 h; (b) 1 h; (c) 2 h.
Materials 16 04745 g005
Figure 6. Microstructure of the solid reaction product obtained from different samples: (a) no additives (SE); (b) 5 wt.% Rose alloy (BSE).
Materials 16 04745 g006
Figure 7. XRD patterns of the solid reaction product obtained from different samples: (a) no additives; (b) 5 wt.% Rose alloy.
Materials 16 04745 g007
Table 1. Parameters of experiments, ball milling, and samples.
Milling Speed, rpmBalls Diameter,
mm
Balls-to-Powder Mass ratioPowder Portion Mass, gMilling Time, hRose Alloy Content, wt.%Experiment Temperature, °CAqueous
Solution
Sample Mass, g
5801024:140.5; 1; 20; 2.5; 5; 10253.5 wt.% NaCl0.75
Table 2. Hydrogen generation performance of the samples with different compositions and milling durations.
CompositionBall-Milling Time, hHydrogen Yield, %Maximum Reaction Rate, mL/g/min.
Scrap without additives0.577.3 ± 0.256
184.6 ± 0.486
281.2 ± 0.977
Scrap + 2.5 wt.% Rose alloy0.573.2 ± 1.331
183.4 ± 0.335
267.5 ± 0.719
Scrap + 5 wt.% Rose alloy0.574.5 ± 1.935
185.8 ± 1.149
281.4 ± 0.543
Scrap + 10 wt.% Rose alloy0.583.0 ± 1.666
179.6 ± 0.539
271.9 ± 2.127
Disclaimer/Publisher’s Note: The statements, opinions and data contained in all publications are solely those of the individual author(s) and contributor(s) and not of MDPI and/or the editor(s). MDPI and/or the editor(s) disclaim responsibility for any injury to people or property resulting from any ideas, methods, instructions or products referred to in the content.

