Abstract
The distributions of the lattice parameter of the γ′-phase (aγ′) and angular components of the primary crystal orientation along the lines parallel to the main axis of the single-crystalline CMSX 4-cored turbine blades were studied. The studies were carried out on the regions of the blades located far from the selector and its continuer extension (CE), positioned asymmetrically relative to the blade’s axis. It was found that, similarly to the regions of the blade located close to the CE (studied in part I), at the level of the blade related to the change of its cross-section, there were correlated local changes in aγ′ and the angular components of the primary crystal orientation representing the bending of the dendrites. However, the correlation was less clear due to the presence of low-angle boundaries (LABs) and the intensification of the consequences of the “fanning effect” in the regions far from the CE. It was found that the range of local changes in aγ′ and the angular components of the primary crystal orientation of the blade regions were influenced by both the distance from the CE and the separation of these regions from the CE by surfaces of the cooling bores. It was found that the deviation angle in the [001] direction from the blade axis increased with an increase in the distance from the CE. Based on the aγ′ changes, differences in the alloying element concentration near the cooling bores were discussed.
1. Introduction
The turbine blades applied as the component of the turbine hot section of jet engines are required to resist high thermomechanical loads and corrosion caused by an aggressive environment in the combustion chamber. The blades are made as single-crystalline (SX) casts of heat and creep-resistant materials, for example, commonly used superalloys. They have an impressive combination of high-temperature strength, phase stability, and high-temperature oxidation resistance [1,2,3,4]. The most recently used representative is CMSX-4, the second-generation superalloy based on Ni3Al, provided by Cannon-Muskegon.
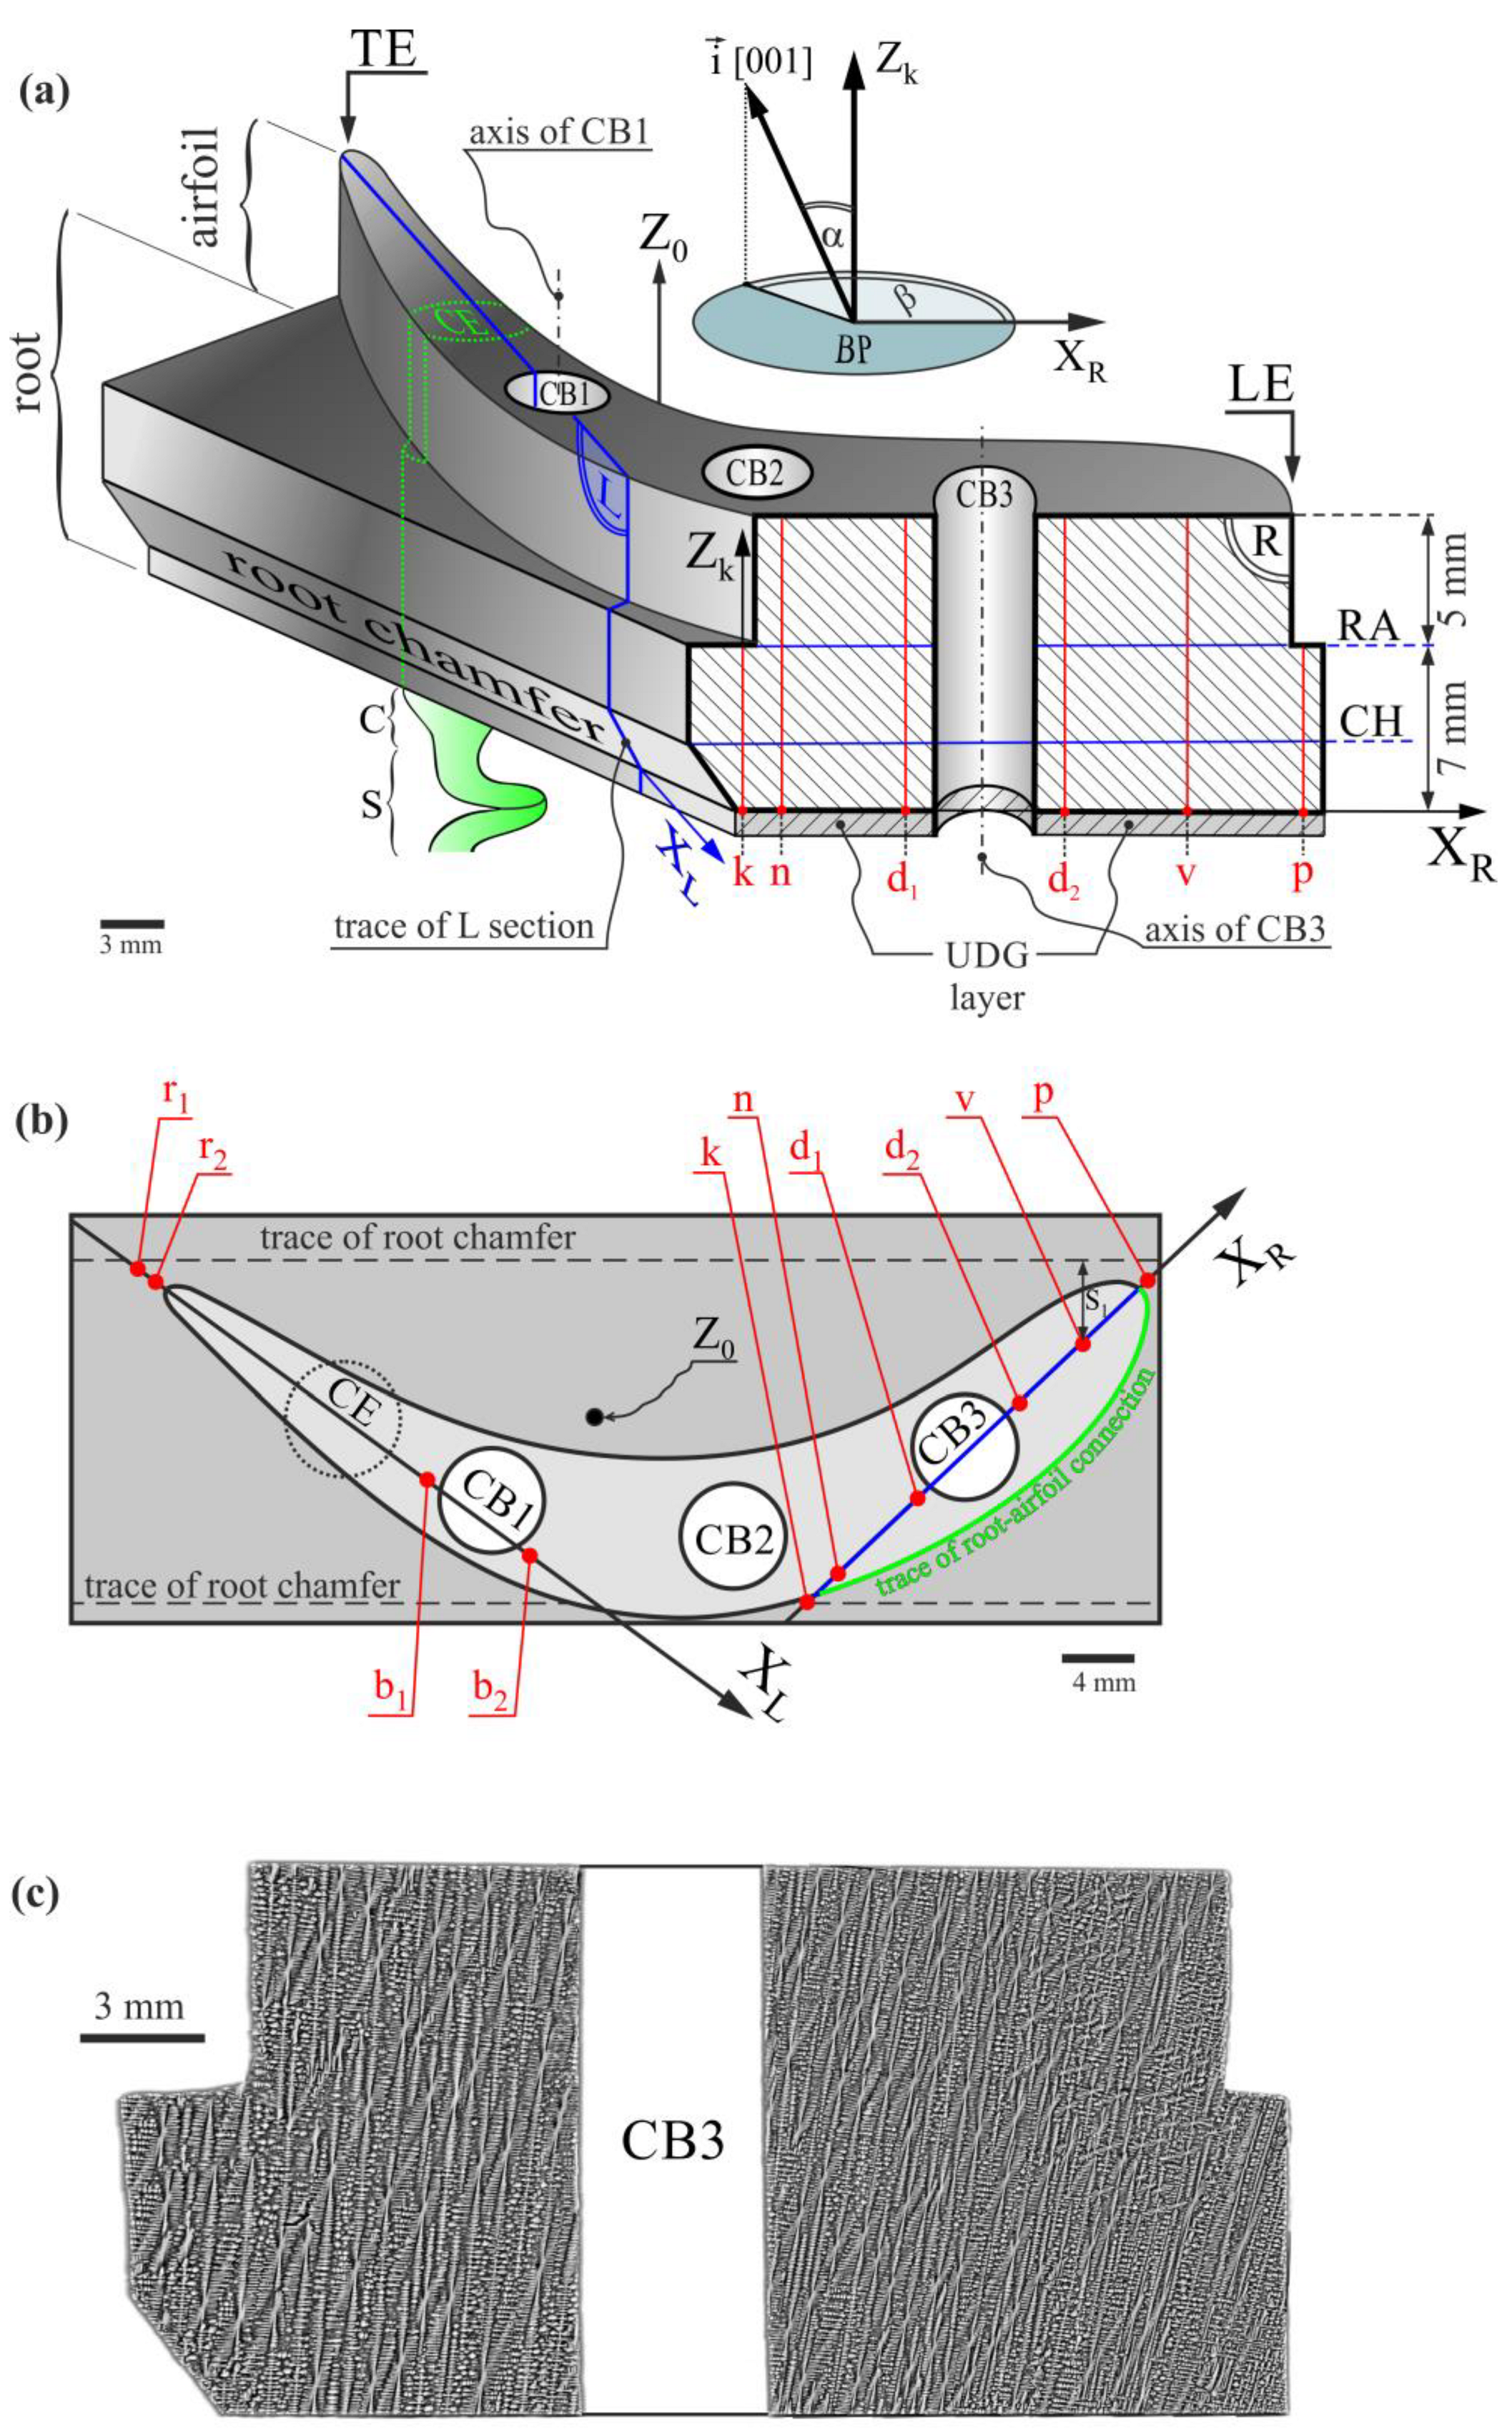
Single-crystalline turbine blades may be produced during the process of directional dendritic crystallization in ceramic molds using the Bridgman technique. The blades are often produced with channels and bores through which cooling air flows during engine operation. They are called cored blades because the casting molds use ceramic cores to form the cooling bores. The crystallization by the Bridgman method allows for the obtaining of blades with the required crystal orientation of [001]-type, which gives the blade a high creep resistance [1]. In practice, such an orientation means that the [001]-type crystal direction is nearly parallel to the main blade axis Z0 (Figure 1a). Hence, the α angle between [001] and Z0, characterizing the primary crystal orientation, is low. The [001]-type crystal direction is parallel to the γ-dendrite growth direction in the crystallization of blades by the Bridgman method. Stochastic misorientation of the neighboring dendrites, and thus the areas of the blades, and also the misorientation created due to the complex shape of the blade [5] can allow the formation of low-angle boundaries (LABs) [6,7,8] that reduce the strength parameters of the blade. The crystal orientation of SX blades significantly influences thermal fatigue strength [9], and its local changes may also affect the corrosion resistance of SX Ni-base superalloys [10]. Local changes in the crystal orientation in the blade are expressed by local changes to the α angle during the formation of the γ-dendrites that grow in the casting mold. Such dendritic structure inhomogeneity may also cause the creation of sliver defects, which influences the mechanical properties of the blades [11]. Therefore, it may be concluded that the local change of the primary crystal orientation causes several types of defects during crystallization due to dendrite growth disturbance. A large concentration of defects related to the local crystal misorientation, such as low-angle boundaries, may reduce the blade’s high-temperature strength and creep resistance. Hence, it is necessary to analyze, in the blades, the spatial distribution of the primary crystal orientation mainly characterized by the α angle that describes the inclination of the [001] crystal direction to the main blade axis Z0 or axes parallel to it. The full primary orientation of the local blade areas is additionally described by the rotation of the [001] direction around axes parallel to Z0, represented by the β angle (Figure 1). Therefore, the spatial distribution of the β component of the primary orientation can also be important.
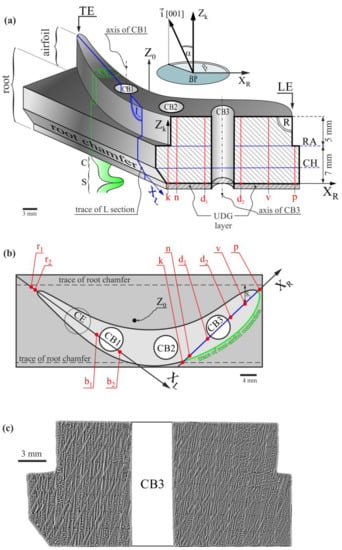
Figure 1.
The shape of a model blade with a prepared R-section in oblique view (a) and top view (b), and the dendritic structure of the R-section (SEM, BSE) (c). The insert on the top of Figure 1a shows the scheme of the α and β angles definition for measuring line k, where Zk is its axis. The axes of the other measuring lines have not been marked for the figure’s clarity. Z0—main vertical axis of the blade; CH—chamfer level; RA—root–airfoil connection level; k, n, d1, d2, v, p—measuring lines; LE, TE—leading and trailing edges of the airfoil, respectively; S—spiral selector; C—a continuer of the selector; CE—continuer extension; CB1, CB2, CB3—cooling bores; UDG layer—unsteady dendrite growth layer. A description of other symbols is provided in the text.
Local bending of single-crystalline dendrites during solidification may be related to the crystal misorientation of the neighboring blade areas and, thus, the formation of macroscopic subgrains and LABs [12,13,14]. The bending of dendrites causes the non-parallel growth of adjacent dendrites, generally in small crystal lattice disorientation. Several reasons exist for dendrite bending during growth, morphological and mechanical bending being notable factors [15]. Morphological bending is related to the local changes in the chemical composition of the liquid, influencing the growth direction of the dendrites without changing their crystal orientation. Some reasons for the changes in chemical composition are similar to those in the case of the so-called dendritic segregation of alloying elements that superalloys contain a lot of [16,17,18,19,20]. Moreover, if there is a change in the crystal orientation of the growing dendrite, it means there is a mechanical bending related to the local distortion of its crystal lattice. Both types of bending cause a local change in the lattice parameter and, thus, the formation of residual stresses, adversely affecting the stability of protective coatings applied to the surface of the blades at subsequent stages of their production [21,22,23,24]. The reason for the dendrites’ local bending may be the casting mold’s complex shape that gives the required shape to the single-crystalline blades. In turn, the bends may be related to a change in chemical composition. Characterization of single-crystalline blades for heterogeneity and the determination of the causes for such heterogeneity formation are essential because they can determine the ways of eliminating or reducing such heterogeneity.
The engines run at ever-higher turbine inlet temperatures to meet ever-increasing operating demands. The blades of the hot turbine work in temperatures close to those at the start of the melting process of the superalloy they are made of. The blades are cooled by the air passing through the inner bores of complex geometry, reducing their temperature. A more complicated cooling is based on “blade film cooling”, based on the supply of cold air through the channels to the blade’s surface which eliminates direct contact with the gas flowing out of the combustion chamber to a certain extent. In any case, cooling bores must be created within the blades approximately parallel to the main blade axis Z0 to supply air from the root to the airfoil. The blades with cooling bores are produced using a casting mold prepared with internal ceramic cores [25,26,27,28].
Directional crystallization of the blades using the Bridgman method is based on the growth of single-crystalline dendrites of the γ-phase toward the [001] crystal direction. During crystallization, when the temperature is decreased below the solvus, the γ → γ′ + γII transition takes place, where γ′ is a solid solution of the ordered cubic Ni3Al phase with numerous alloying elements like W, Re, Ta, Ti, and γ and γII that are the disordered cubic phases of the Ni-based solid solution. However, this phase transition does not change the crystal orientation. It was assumed that the spatial distribution of the crystal orientation given during the growth process of the γ-dendrites is inherited by the distribution of the γ′-phase orientation. On the other hand, local changes in the lattice parameter aγ′ of this phase will be located in the same areas of the blade where changes in the lattice parameter of the γ-phase exist before the transformation. Therefore, the analysis of the spatial distributions of the primary crystal orientation of the γ′-phase and its lattice parameter, and the correlation between them in the blades in an as-cast state, can be related to the γ-dendrite growth process. The measurement of these distributions can be performed quite easily in the CMSX-4 superalloys using X-ray diffraction methods. It is justified because the volume fraction of the γ′-phase is above 70% in the as-cast superalloy.
In the first part of the studies reported in [5], the distribution of the α angle and the aγ′ lattice parameter along the measuring lines traced parallel to the main axis Z0 of the blade on the surface of the L-section (Figure 1a,b) that passed through the selector’s continuer extension (CE) region was examined. The measuring lines were located relatively close to the CE region (Figure 1b). Since, at a certain stage of Bridgman crystallization, the dendrites’ growth area and the crystallization front enlarges from a narrow selector or its continuer to a wide root, it is therefore important to compare the distributions of α(Z) and aγ′(Z) (where Z is parallel to Z0) measured for the L-section surface, i.e., close to the selector or continuer (Figure 1a,b) with similar distributions measured for the R-section surface, i.e., far from them. It is especially important for bulk blades with large cross-sections.
As presented in [5], clear changes in the relations of α and aγ′ as the functions of coordinates of the measuring line axes traced parallel to Z0 on the surface of the L-section were found on certain levels, i.e., for certain Z. These changes were related to chamfer of the root surface and the root–airfoil connection; in other words, they occurred at the CH and RA levels (Figure 1a). It was found that there are significant differences in the α and aγ′ distributions along the lines traced at different areas of the L-section. This was the case for the measuring lines that matched with the areas of the blade root over which the airfoil is not located and areas in which the airfoil is a continuation of the root, e.g., the area where the k- and n-type lines are traced in Figure 1a. In addition, it was found that the α and aγ′ distributions along the n-type lines traced near the first cooling bore (CB1) have specific characteristics. Therefore, in the currently presented studies, areas of the same type were analyzed but located in the R-section at a much longer distance from the selector and its continuer extension, considering the top view.
Although the problem of dendrite bending illustrated by α changes and combined with residual stresses has been the subject of many studies [24,29,30], none present a precisely defined bending angle nor relate it to the geometry of the blades.
The goal of the current study was to analyze the influence of the external and internal surfaces of single-crystalline cored turbine blades made of CMSX-4 superalloy on changes of the γ′ lattice parameter (aγ′) and angular components α and β of the primary crystal orientation of the regions located far from the selector, considering the top view, on the R-section. The influence was examined based on changes in the aγ′ and α and β angles occurring at the levels of the root chamfer and the root–airfoil connection for the measuring lines traced near the external surface of the blade and the internal surface of its cooling bores. The areas of the blade root over which the airfoil is not located and areas in which the airfoil is a continuation of the root, as well as the areas similar to the latter but located near the walls of the cooling bore, were examined. The current paper describes the continuation of the studies presented in [5] in which the research results on regions of the L-section located close to the selector and its continuer extension were presented.
2. Material and Methods
The castings were obtained using CMSX-4 superalloy in the Research and Development Laboratory for Aerospace Materials, Rzeszów University of Technology, Rzeszów, Poland. The directional crystallization of the Bridgman method was applied using the ALD Vacuum Technologies Co. (Hanau, Germany) VIMIC 2E–DS/SC industrial furnace. The withdrawal rate was 3 mm/min. The nominal chemical composition of CMSX-4 melt was: 5.6 Al, 1.0 Ti, 6.5 Ta, 6.5 Cr, 0.6 Mo, 6.0 W, 9.0 Co, 3.0 Re, 0.1 Hf, less than 0.002 C, Ni bal. (wt.%). The crystallization process was conducted in the ceramic mold with a starting temperature of 1520 °C.
The blade castings contained three cylindrical cooling bores, CB1, CB2, and CB3, and a spiral selector (S) with the continuer (C). The selector was asymmetrically located relative to the main blade axis Z0 (Figure 1a,b). The continuer extension (CE) marked in Figure 1a,b was a cylindrical shape bounded by the projection of the continuer’s perimeter into the blade. The model blades with a relatively short airfoil, 5 mm long (Figure 1a), with cooling bores of the simplest cross-section shape—circular—and the simplest orientation—parallel to the main blade axis Z0—were used for the tests.
The model blades were cut along the plane, which was parallel to the main axis Z0 and passed through the airfoil’s leading edge (LE) and the center of the third cooling bore (CB3), located farthest from the CE (Figure 1a). The longitudinal R-section of the shape presented in Figure 1a was prepared for the measurements using the standard metallographic procedure [31].
The dendritic structure of the analyzed section surface was visualized with the use of a JSM-6480 JEOL SEM microscope (JEOL Ltd., Tokyo, Japan). Figure 1c shows an image of the dendritic structure revealed on the surface of the R-section. The image was obtained using backscattered electron (BSE) imaging by collecting numerous smaller images.
The measurements of the γ′ lattice parameter (aγ′) and the angular components of the primary orientation (α and β angles) have proceeded in the Research and Development Laboratory for Aerospace Materials, Rzeszów University of Technology, Rzeszów, Poland. The specialized EFG Freiberg Instruments X-ray diffractometer (Freiberg Instruments, Freiberg, Germany) [32] was used during tests. The pseudo-parallel primary X-ray beam was 0.8 mm in diameter. The full primary crystal orientation (orientation of primary dendrite arms) is defined by two angles, α and β, which describe the tilt and rotation of the primary dendrite arms growing along the [001] unit vector , presented in the insert of Figure 1a. A laser scanner mapped out the measuring lines parallel to the blade axis Z0 on the R-section surface. The aγ′, α, and β values were calculated with the software equipment of the diffractometer, based on the Ω-scan method [32]. The mean error of the aγ′ and α and β measurements was 0.0005 Å and 0.006°, respectively.
The aγ′, α, and β measurements were completed at points along several lines traced parallel to the main blade axis Z0 on the R-section surface. The chosen lines are as follows: k, located near the side surface of the root; n, located near the outside surface of the airfoil; d1 and d2, located nearby the internal surfaces of the blade on the left and right sides of the CB3, respectively; v and p, located close to the LE of the airfoil (Figure 1a,b). Lines p and k cover only the blade root because the airfoil is not located directly above, and the other lines cover the root together with the airfoil because, for them, the airfoil is a continuation of the root.
3. Results and Discussion
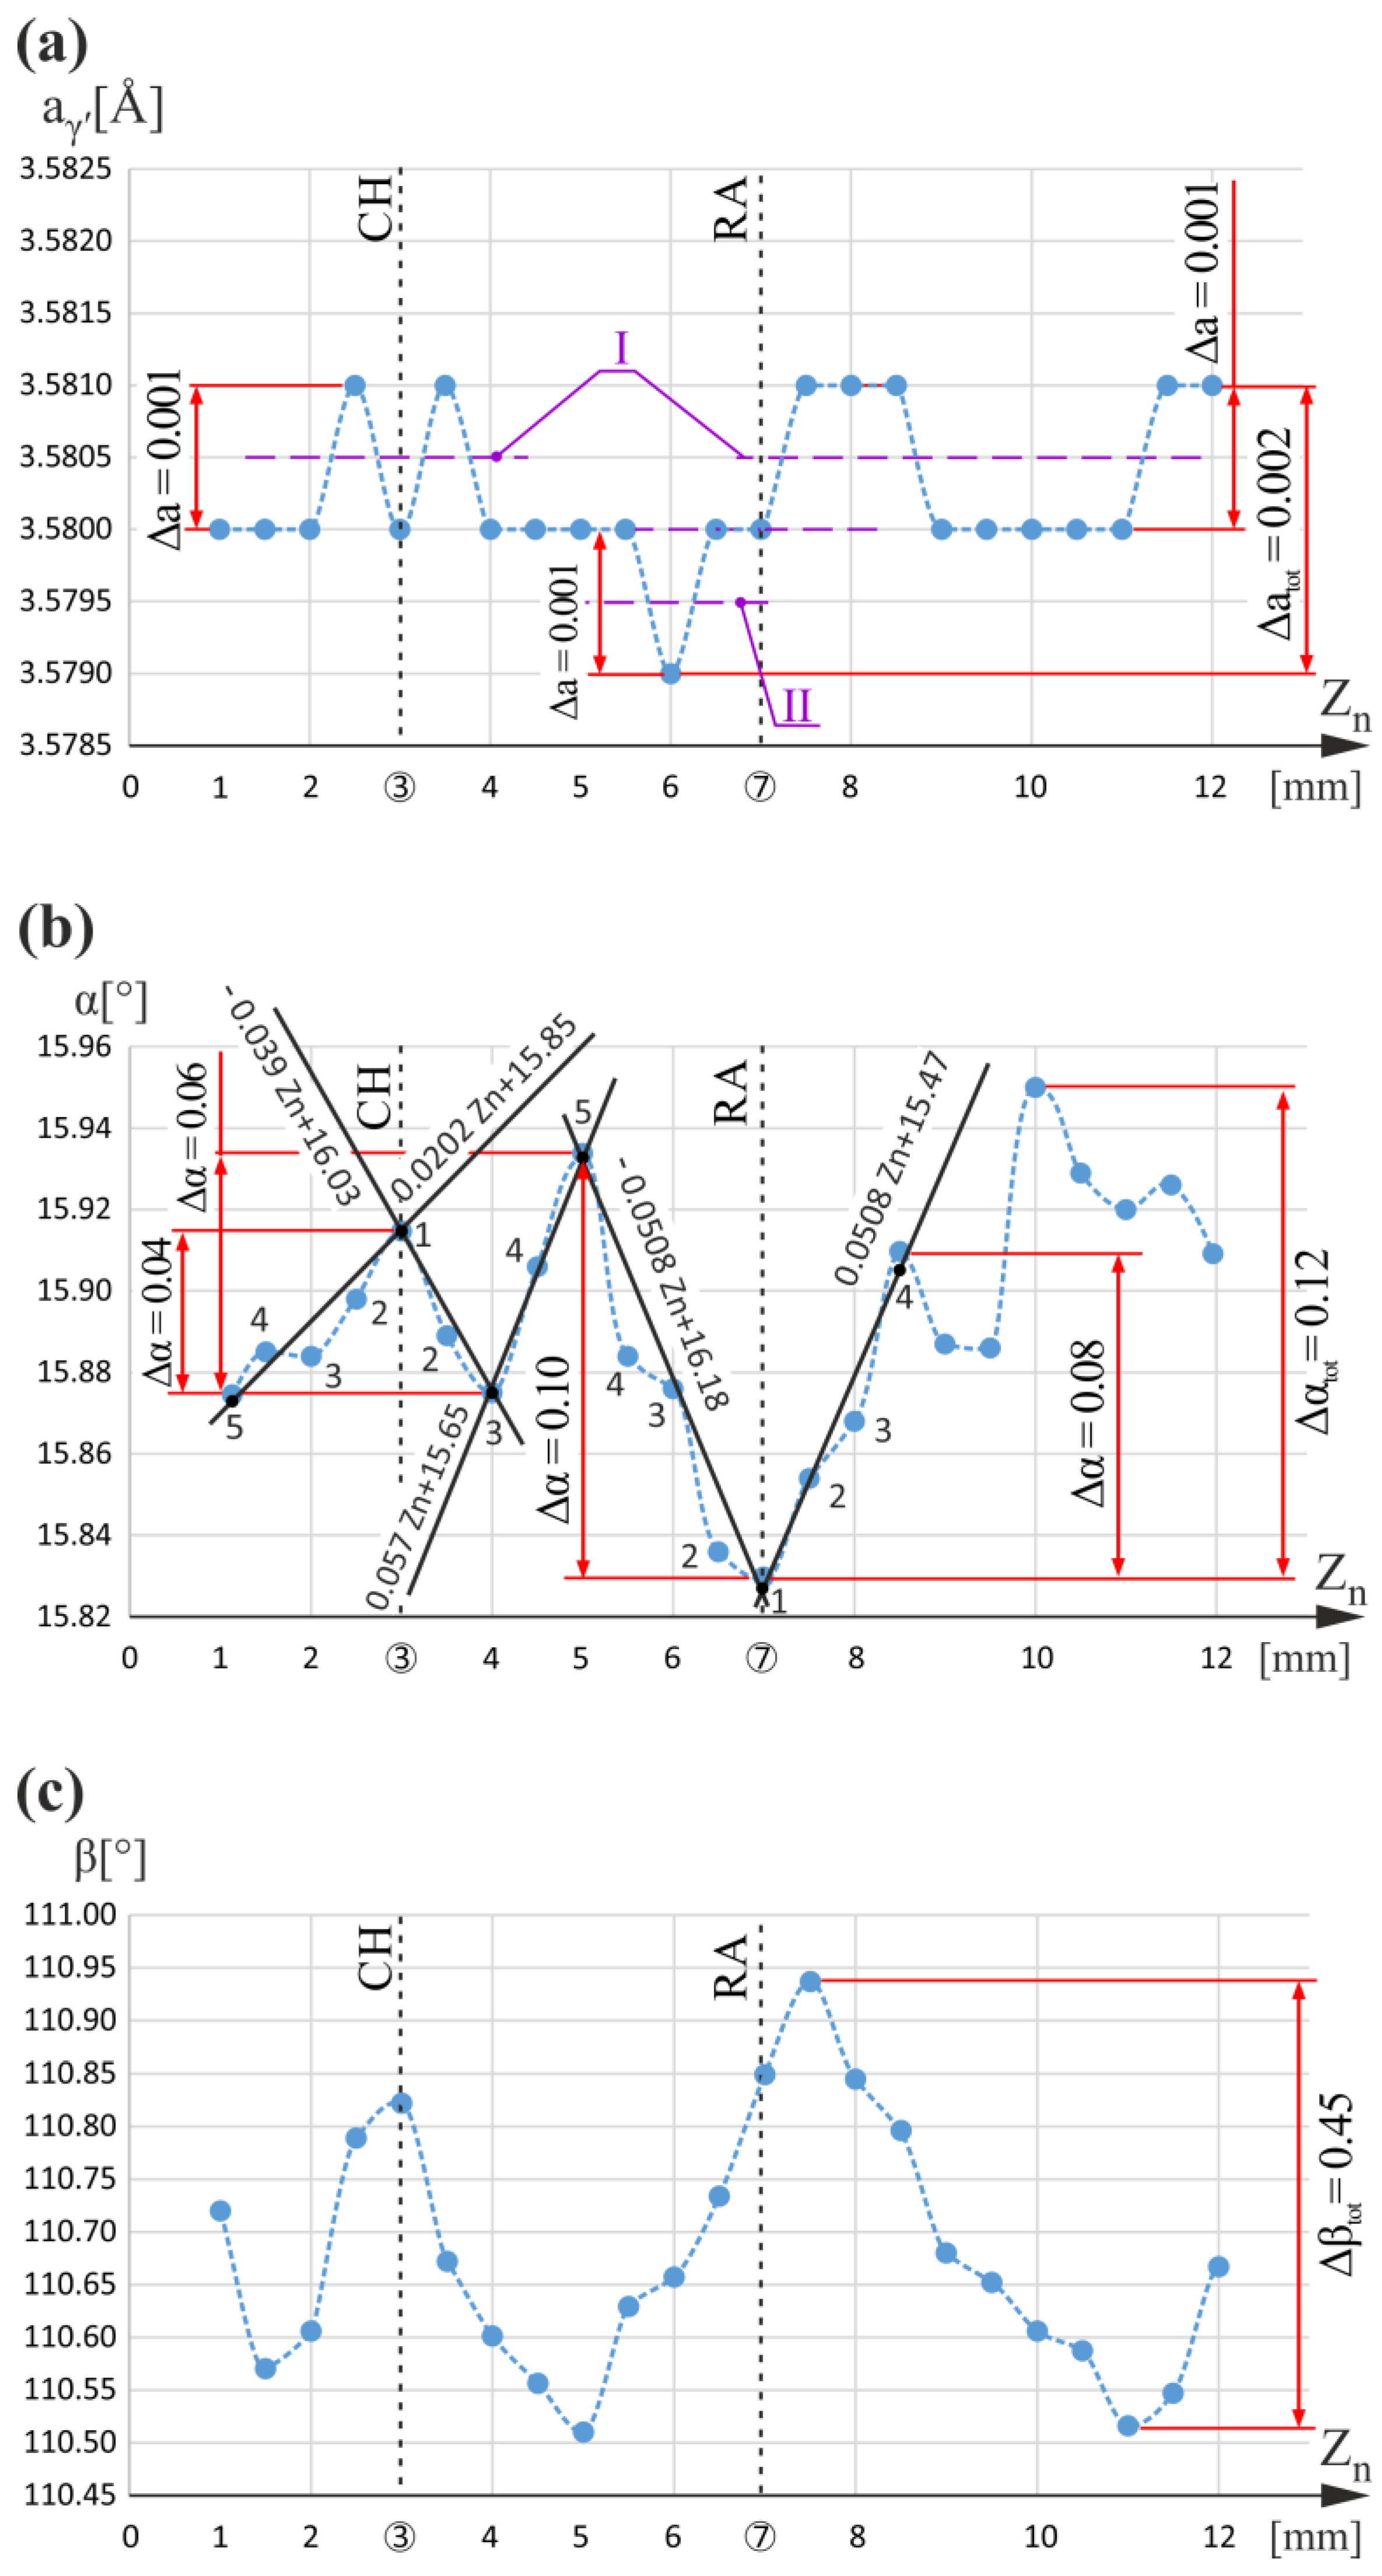
Figure 2 shows the graphs of the aγ′(Zn), α(Zn), and β(Zn) relationship obtained for the measuring line n. The value of aγ′ for the Zn ranged between 1 mm and 5.5 mm and varied about 3.5805 Å in the range of 0.001 Å, which corresponds to the fluctuations of aγ′ in an undisturbed dendritic structure [5,33]. However, for Zn equal to 6 mm, aγ′ decreases, and then, near Zn equal to 7 mm corresponding to the RA level, it increases by 0.002 Å, reaching the value of 3.5810 Å. The total range of aγ′ changes for the entire Zn measurement range equal to 0.002 Å and was marked as Δatot (right side of Figure 2a). On the graph of the α(Zn) relationship, there is a minimum for Zn equal to 7 mm. The difference in the slope coefficients of local linear approximations (the trend lines) of α(Zn) for Zn less than 7 mm (measuring points 1–5) and Zn greater than 7 mm (measuring points 1–4) is 0.1016°/mm (0.0508 − (−0.0508) = 0.1016 (°/mm)). The change in α near Zn equal to 7 mm varies in the range from 0.08° to 0.10°. The details of the extremes analysis of the α(Z)-type relationships in the context of its correlation with αγ′(Z) changes induced by dendrite bending were presented for the first time in [5]. Additionally to the extreme at Zn equal to 7 mm on the α(Zn) graphs, there are three more extremes: near CH at Zn equal to 3 mm and at Zn equal to 4 mm and 5 mm. However, both the value of the slope coefficients difference and the α value changes were the highest for the minimum at Zn equal to 7 mm. Nearby Zn of 3 mm value, where the maximum α(Zn) is observed, the α changes equal to 0.04° are much smaller, both for Zn less than 3 mm (measuring points 1–5) and for Zn greater than 3 mm (measuring points 1–3), and the difference in the slope coefficients of the α(Zn) trend lines is 0.0592°/mm (0.0202 − (−0.039) = 0.0592 (°/mm)). These two parameters are smaller than that for a minimum at Zn equal to 7 mm. For the minimum at Zn equal to 4 mm, the difference in the slope coefficients of α(Zn) is 0.0897°/mm (0.0507 − (−0.039) = 0.0897 (°/mm)), which is lower than that determined near Zn equal to 7 mm. Additionally, the change of the α value is equal to 0.04° for Zn less than 4 mm (measuring points 1–3) and equal to 0.06° for Zn greater than 4 mm (measuring points 3–5), and is also much smaller than that for Zn near 7 mm.
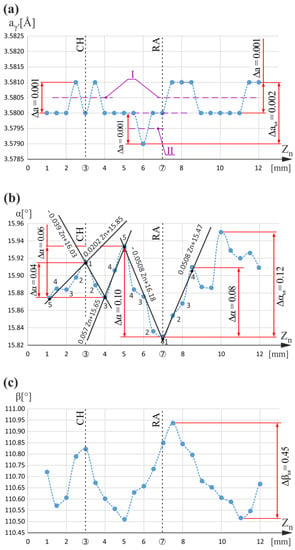
Figure 2.
Graphs of the aγ′(Zn) (a), α(Zn) (b), and β(Zn) (c) relationships obtained for measuring line n. Zn is parallel to Z0. The conditions Zn = 3 mm and Zn = 7 mm determine the level of root chamfering (CH) and root–airfoil connection (RA), respectively.
For maximum at Zn equal to 5 mm, the difference in the slope coefficients α(Zn) is 0.1078°/mm (0.057 − (−0.0508) = 0.1078 (°/mm)), which is comparable to that determined for the minimum at Zn equal to 7 mm. A change in the α value of 0.10° for the Zn ranged between 5 mm and 7 mm is the same for both extremes at Zn equal to 5 mm and 7 mm. However, changes in the α values of 0.06° for Zn less than 5 mm (measuring points 3–5) are smaller than those for Zn greater than 7 mm, equal to 0.08° (measuring points 1–4). As explained in [5], the extremes of α(Zn) correspond to the bends of the dendrites. Since the degree of dendrite bending is determined both by the value of the α changes and the difference of the slope coefficients, therefore, it should be assumed that the bending of the dendrites at the levels of Zn equal to 3 mm (CH level) and Zn equal to 4 mm, expressed by the extremes of α(Zn), was insufficient to change the lattice parameter αγ′ by more than the fluctuation range (0.001 Å). However, the degree of dendrite bending at Zn equal to 5 mm, represented by maximum α(Zn), and at Zn equal to 7 mm, represented by minimum α(Zn), was so significant that it caused a decrease in αγ′ from level I to level II of the fluctuation at Zn equal to 6 mm, and an increase from level II to level I of the fluctuation above Zn equal to 7 mm, respectively.
For Zn greater than 8 mm, the graph of the αγ′(Zn) relationship (Figure 2a) only shows a fluctuation range of 0.001 Å about level I. This means that the growth of the dendrites in this area was undisturbed despite the changes of α(Zn), and the dendrite bends may have been created after the crystallization. The α(Zn) changes may also be related to the vicinity of the measuring line n to the walls of the CB2. A much clearer correlation between αγ′ changes and α(Z) extremes occurs for the regions of the blades located near the CE, as described in [5]. This is because for these regions, in wide ranges of Zn, the fluctuation areas, with 0.001 Å serving as reference, occurred. Unfortunately, among the R-section measuring lines located far from the CE, the widest range of αγ′ fluctuation occurred for line n. To explain these incomprehensible effects, it was decided to perform additional measurements of the β-angle component of the primary orientation. The additional reasons will be described afterward. The β component expresses the rotation of the “i” [001] unit vector about the Zn axis (Figure 1a, insert), which is parallel to the main axis Z0 of the blade. The “i” unit vector is consistent with the dendrites’ growth direction. In other words, β describes the rotation of the dendrites around some axis (e.g., axis Zn or Zk) that is parallel to Z0.
A comparison of the α(Zn) and β(Zn) relationship graphs (Figure 2b,c) shows the correlation between local extremes at points with coordinates Zn equal to 3 mm, Zn equal to 5 mm, and near the point with coordinate Zn equal to 7 mm. This means that the tilting of the dendrites from the Zn axis (change in α value) and their rotation around this axis (change in β value) occurs simultaneously during growth. However, for the entire Zn measurement range, the total change in the rotation angle, marked on the right of Figure 2c as Δβtot and equal to 0.45°, was significantly higher than the change in the tilt angle marked on the right of Figure 2b as Δαtot was equal to only 0.12°.
To be able to reliably isolate any local aγ′ changes greater than the stochastic fluctuations of 0.001 Å (for example, related to the CH or RA levels) on any graph of a α(Z)-type relation, there must be a noticeably long (for a relatively long Z range) segment on which only aγ′ fluctuations of 0.001 Å occur. Such types of segments serve as reference areas. For the entire R-section, the graph in which these segments are clearly visible occurred only for the measuring line n (Figure 1a). Local aγ′ changes above 0.001 Å are related to any disturbances in the formation of the dendrite array visualized on the blades’ longitudinal sections. In [5], it was shown that CE can serve as an example of an undisturbed region. The disturbances are formed mainly during the growth of dendrites and may be related to the shape of the blade and/or the shape of the casting mold.
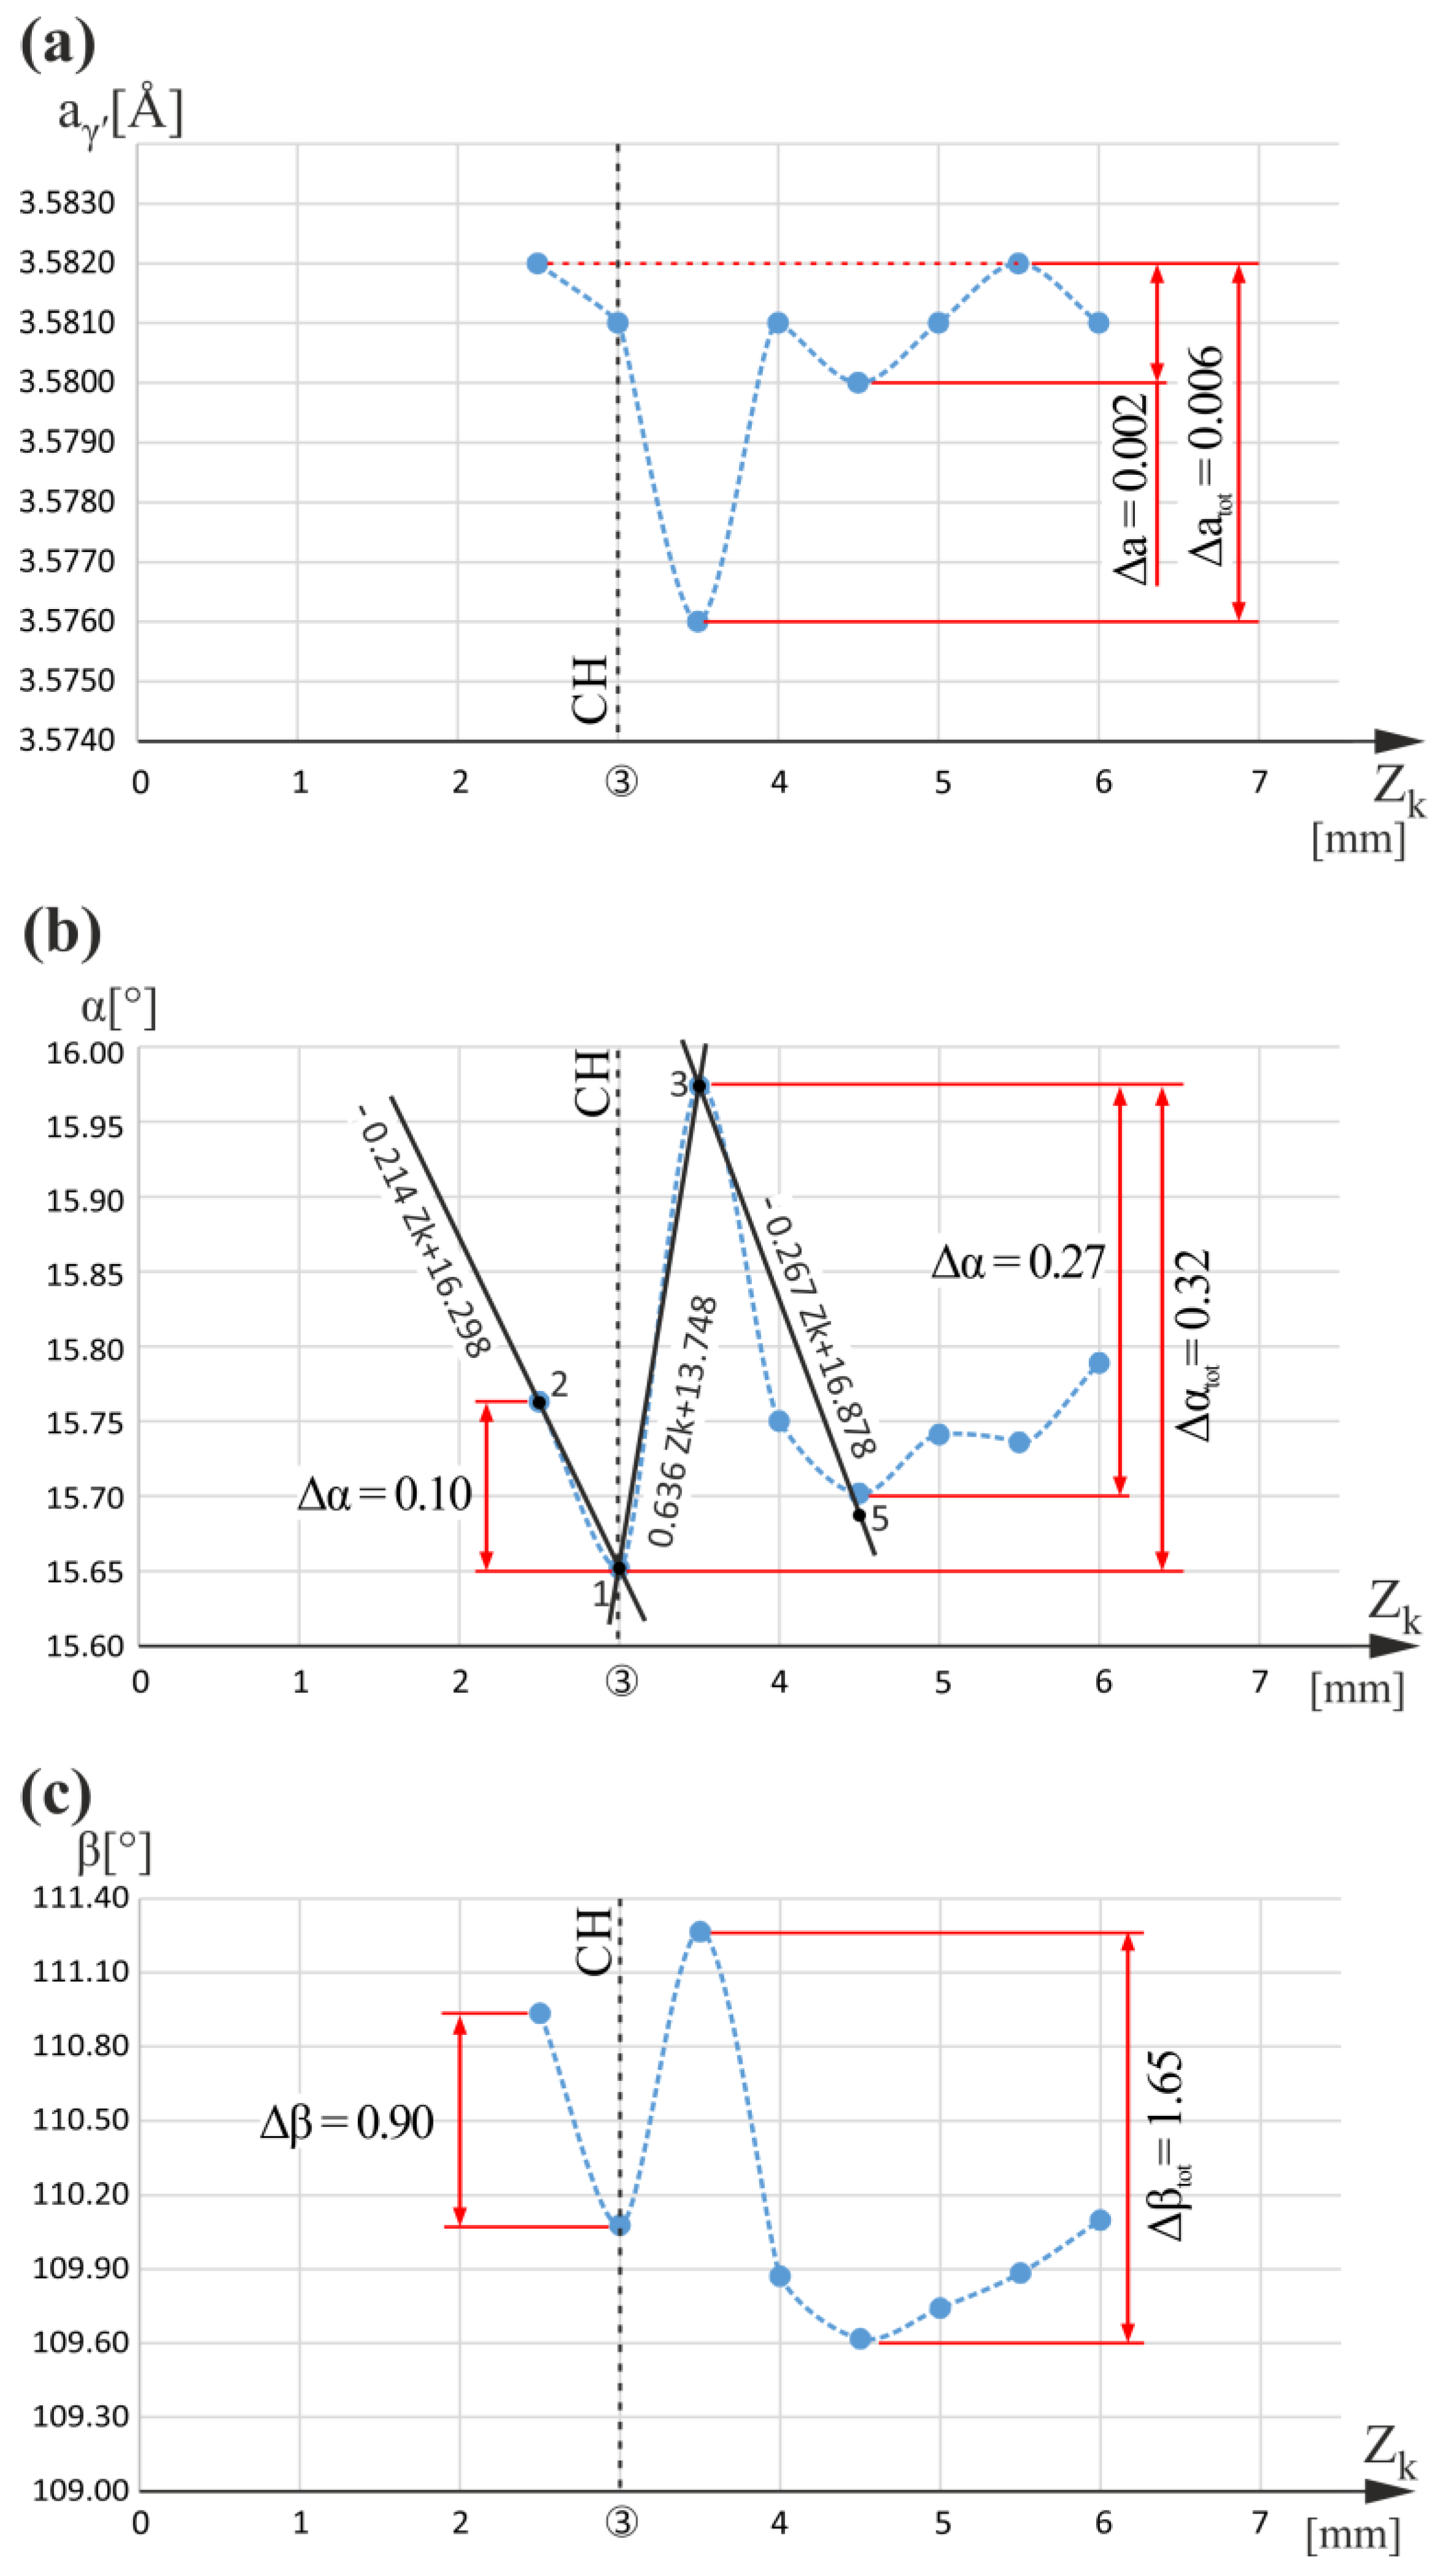
Figure 3 shows graphs of the aγ′(Zk), α(Zk), and β(Zk) relationships obtained for the measuring line k (Figure 1a,b). The airfoil is not located over the root for line k. Slightly higher than the CH level, for Zk equal to 3.5 mm, there is a clear minimum of the aγ′(Zk). One of the effects of this minimum is that when Zk decreases below 3.5 mm, there is a large aγ′ increase of 0.006 Å. An effect of similar character is also observed and described in [5] during the analysis of the root measuring lines r1 and r2 of the L-section, the location of which is marked in Figure 1b. However, the increase in aγ′ value was much smaller (0.002 Å) and occurred slightly lower than the CH level. The r1 and r2 measuring lines are positioned farther from the cooling bores, whereas line k is near the CB2. Therefore, it was assumed that for the areas of the root located near the cooling bore and over which the airfoil is not situated, changes in aγ′ are much greater. This assumption was confirmed by the small changes of aγ′ (0.002 Å) found for line p (see Figure 1a,b) positioned farther from the CB3 (see below). Since the aγ′ depends on the concentration of alloying elements, it can be concluded that local changes in the chemical composition related to the root chamfer are much higher near the cooling bores.
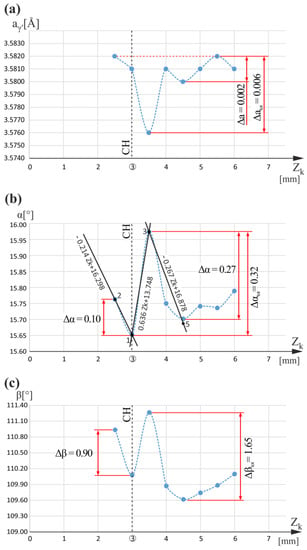
Figure 3.
Graphs of the aγ′(Zk) (a), α(Zk) (b), and β(Zk) (c) relationships obtained for measuring line k. The condition Zk = 3 mm determines the root chamfering (CH) level.
The graph in Figure 3a shows that between Zk of 4.5 mm and 5.5 mm, there is an increase in aγ′ of 0.002 Å. This change is difficult to explain and perhaps may be related to the closeness of the measuring line k to two fragments of the casting mold wall simultaneously: horizontal, limiting the root, and vertical, limiting the airfoil (see Figure 1a). Such surface refraction of the casting mold surface may cause the generation of significant residual stresses. They probably precluded the measurement of aγ′ for Zk greater than 6 mm because the X-ray diffraction conditions were not met, and no diffraction reflexes were obtained. Additionally, for Zk less than 2.5 mm, diffraction did not occur, probably for a similar reason because there is a refraction of the mold surface related to the chamfer of the root (Figure 1a).
Figure 3b presents the graph of the α(Zk) relationship. The figure analysis allows us to conclude that a minimum of the α(Zk) for Zk equal to 3 mm (at the CH level), and the maximum of α(Zk) for Zk equal to 3.5 mm were observed. The changes of α recorded nearby the minimum are 0.1° (measuring points 1–2) and 0.32° (measuring points 1–3), respectively. The value of 0.32° is the largest for the entire Zk measuring range and is therefore marked as Δαtot. The changes in the slope coefficients of the α(Zk) trend lines, for the minimum and the maximum, were 0.850°/mm (0.636− (−0.214) = 0.850 (°/mm)) and 0.903°/mm (0.636 − (−0.267) = 0.903 (°/mm)) and were much larger than for line n (Figure 2b). This means that there was a significant local bending of dendrites at the CH level and a slightly higher bending at Zn equal to 3.5 mm, much greater than that observed for line n.
The β(Zk) relationship graph is presented in Figure 3c. On the CH level and above it, local changes in β have a character similar to that in α, and are correlated with α changes. However, the scope of local β changes is much wider. The observed decrease in β at Zk equal to 3 mm (the CH level) is 0.90°, and in α it is only 0.10°. For the entire measurement range of Zk, the total β change, marked as Δβtot, is 1.65°, and a similar total α change Δαtot is 0.32°. From the correlation and the fact that local changes in the β angle are generally higher than changes in the α angle, it follows that during the growth of the dendrites, their rotation rate relative to axis Zk parallel to main blade axis Z0 was significantly higher than their tilting rate relative to these axes.
The rates of the change in α angle, determined by the absolute value of the slope coefficients of the trend line, are linear approximation of α(Zk), for Zk less than 3 mm and in the range between 3 mm and 3.5 mm, as well as, in the range between 3.5 mm and 4.5 mm are 0.214°/mm, 0.636°/mm, and 0.267°/mm, respectively (Figure 3b). The difference of these coefficients on the right and left of Zk equal to 3 mm is 0.750°/mm (0.636 − (−0.214) = 0.750 (°/mm)), and on the left and right of Zk equal to 3.5 mm are 0.903°/mm (0.636 − (−0.267) = 0.903 (°/mm)). These differences are some of the parameters that determine the degree of dendrite bending at the local extremes in α(Zk) [5], and they are similar for the extremes of Zk equal to 3 mm and 3.5 mm. Additionally, the degree of dendrite bending depends on the absolute value of changes in α near the extremes. For the extreme at Zk equal to 3.5 mm, on their right side, the α change is 0.27° (Figure 3b), and on the left side, it is 0.32°, which is equal to Δαtot. On the right side of the extreme for Zk equal to 3 mm, the change in the α angle was equal to 0.32°, which is equal to Δαtot. In contrast, on the left side, it was not possible to precisely determine this change because, for Zk less than 2.5 mm, the measurement of the α angle, as well as the β angle and the aγ′ lattice parameter, failed. The reason may be that the diffraction conditions in this range of Zk were not satisfied because of the high residual stress in the vicinity of both external and internal (CB2, Figure 1b) mold walls. Therefore, it cannot be determined whether large changes in aγ′ near Zk equal to 3.5 mm (Figure 3a) may be related to the minimum in α(Zk) at Zk equal to 3 mm or the maximum in α(Zk) at Zk equal to 3.5 mm. It was estimated and assumed that to the left of Zk equal to 3 mm, the change in α is 0.10° and the change in β is 0.90° (Figure 3b,c).
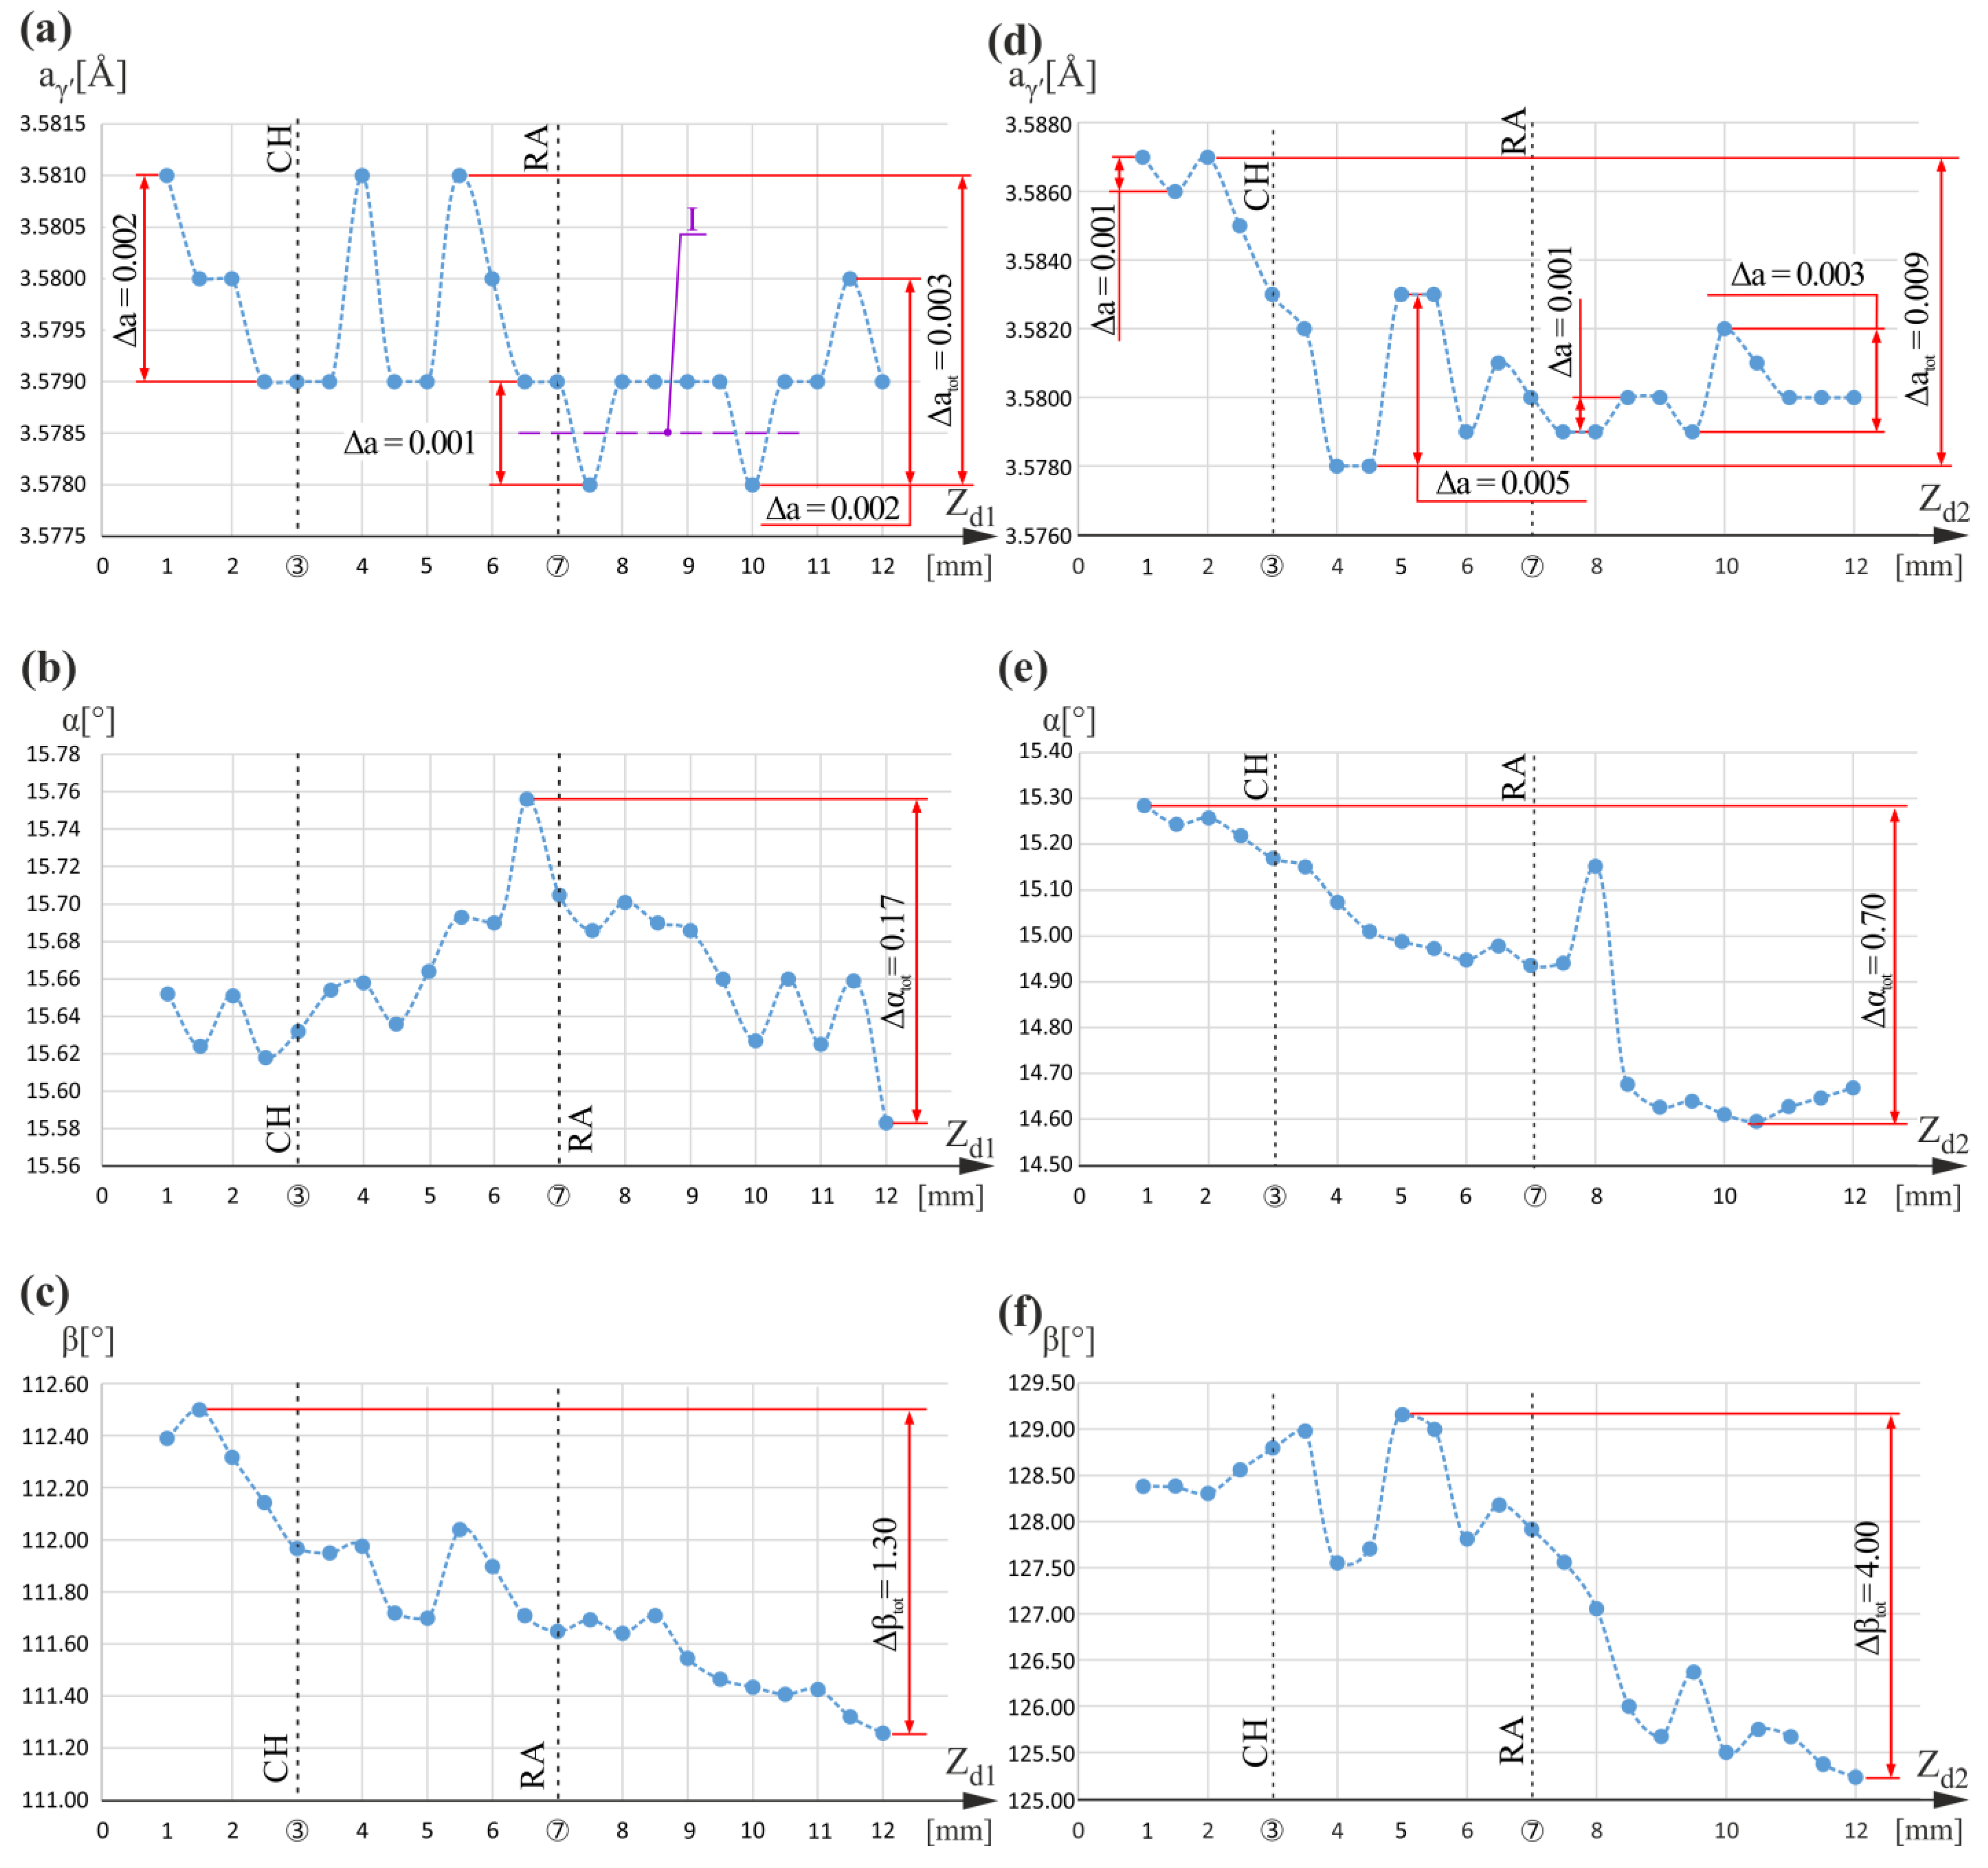
Figure 4 presents graphs of the aγ′(Zd1), α(Zd1), and β(Zd1) relationships for measuring line d1, as well as graphs of the aγ′(Zd2), α(Zd2), and β(Zd2) relationships obtained for measuring line d2. Measuring lines d1 and d2 were located near CB3 (Figure 1a,b) on its left and right side. The aγ′(Zd1) graph has some characteristics similar to those shown in Figure 2 as well as to those presented in [5] for the measuring lines located nearby CB1 (measuring lines b1 and b2 in Figure 1b). In the graph from Figure 4a, some level I aγ′ changes in a range of 0.001 Å can be distinguished. These changes correspond to an undisturbed dendritic structure without significant bending of the dendrites [5,33] and, therefore, can be called fluctuations. Comparing the value of Zd1 equal to 6.5 mm, for which the fluctuation starts with the coordinates of changes occurring in the α(Zd1) graphs (Figure 4b), a correlation of the α maximum at Zd1 equal to 6.5 mm with a decrease in aγ′(Zd1) greater than the fluctuation range near Zd1 equal to 6.5 mm can be observed. It confirms the conclusion from [5] that the large local bending of dendrites is related to the local change in aγ′ above the fluctuation range of aγ′(Zd1).
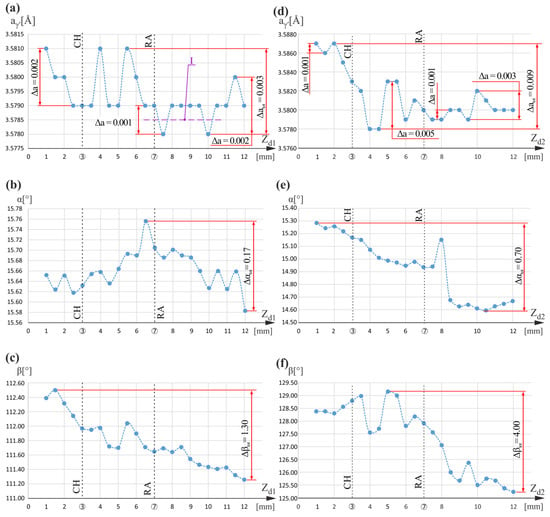
Figure 4.
Graphs of the aγ′(Zd1) (a), α(Zd1) (b), and β(Zd1) (c) relationships obtained for measuring line d1; and graphs of the aγ′(Zd2) (d) α(Zd2) (e) and β(Zd2) (f) relationships obtained for measuring line d2. Zd1 and Zd2 are parallel to Z0 and located near at left and right sides of CB3.
For α(Zd1) in the scope limited by Zd1 ranged between 1 mm and 6 mm and between 8 mm and 12 mm, no clear correlations between α(Zd1) and aγ′(Zd1) were observed despite changes of aγ′ equal to 0.002 Å, that is higher than the fluctuation range for the scope limited by Zd1 between 1 mm and 6 mm, and for Zd1 greater than 10 mm. It can be assumed that in these areas, measuring line d1 passes through macroscopic low-angle boundaries (LAB), near which aγ′ changes significantly [34]. Such boundaries, which occurred in large numbers in similar-cored blades near the CB3, were shown in [35]. Because the misorientation angle of the LABs is related to both the α and β component changes, it could be assumed that changes in aγ′ may be related not only to the α(Zd1) relationship extremes but also to the β(Zd1) relationship extremes. To check this assumption, the β(Zd1) relationship was experimentally determined, which is shown in Figure 4c. Unfortunately, it is difficult to observe a clear correlation between changes in aγ′ and changes in β(Zd1). Only in the β(Zd1) graph can a general decrease in the β value be observed for the entire range of Zd1. It may be related to the so-called “fanning effect” [24] or/and to the directing of growing dendrites by vertical mold walls parallel to the Z0 axis, similarly to the case of the so-called “force directing” effect [36,37]. Comparing the α(Zd1) and β(Zd1) graphs, it can be observed that the total changes in the β value Δβtot equal to 1.3° are much wider than the changes in the α value Δαtot that is equal to 0.17°.
On the right side of the CB3, the relation of the γ′ phase lattice parameter aγ′ and the Zd2 is visualized by the graph shown in Figure 4d. In the graph, only in small areas between Zd2 equal to 1 mm and 2 mm, and between 7.5 mm and 9.5 mm, are the aγ′ fluctuations in the 0.001 Å range observed. In other, much wider areas, the changes in aγ′ are much greater and equal to 0.009 Å, 0.005 Å, and 0.003 Å for different ranges of Zd2. This means that there is a much greater amount of local changes in chemical composition and higher segregation of alloying elements on the right side of CB3 than on the left, where the total changes of aγ′ were only 0.003 Å.
In the α(Zd2) graph, against the background of a general decrease in α, only one clear maximum is visible at Zd2 equal to 8 mm. It is unrelated to any change on the aγ′(Zd2) graph greater than the fluctuation range. The β(Zd2) relationship graph (Figure 4f) has several extremes of varied character., e.g., for Zd2 equal to 3.5 mm, 4.0 mm, and 5.0 mm, as well as for Zd2 equal to 9.5 mm. Near these values of Zd2 in the aγ′(Zd2) graph, there are significant changes in aγ′. It can be concluded that the change in aγ′ can be influenced not only by the bending of dendrites related to the change in the α angle but also by the bending related to the β angle corresponding to the rotation of the dendrites around the axes parallel to the main axis Z0 of the blade. Comparing the α(Zd2) and β(Zd2) graphs, it can be observed that the total change in β defined for the entire measuring range is equal to 4.00° (Δβtot), and is much higher than the total change in α, which is only equal to 0.70° (Δαtot). In Figure 4c,e,f, for the entire Zd1 and Zd2 measuring ranges, there is a tendency to decrease the values of the α and β angles. This may be related to the so-called “fanning effect” described in [24].
The Δaγ′ changes in the range from 0.003 to 0.009 Å observed for the d2 measuring line are comparable or higher to those shown in [38] for areas near the dendrite core and in the interdendritic regions. The convergent beam electron diffraction (CBED) method was used for the aγ′ measurement of the heat-treated CMSX-4 superalloy. In [39], for the same heat-treated superalloy, changes in aγ′ values for similar areas were determined by high-resolution X-ray diffraction. The area covered by the primary X-ray beam had a diameter of 0.1 mm, which is eight times smaller than the beam of 0.8 mm in diameter used in our research. In both papers [38,39], fragments of single-crystalline castings of CMSX-4 superalloy obtained by the Bridgman method, with a primary arm spacing (PAS) of about 300 μm, were examined. It can be concluded that the crystallization rate determined by the rate of pulling out of the mold from the high-temperature zone in the Bridgman method applied in the above-presented studies was about 3 mm/min., i.e., the same as the rate of obtaining the blades studied in our research. From the results presented in [39], it can be concluded that the maximum changes in aγ′ in the area 100 μm away from the dendrite core compared to the changes in aγ′ inside the dendrite core were 0.003 Å.
In our studies, on the longitudinal cross-section of the blades, the distribution of “hourglasses” visualizing the cores and secondary arms of the dendrites was such that it allowed an X-ray beam with a diameter of 0.8 mm to cover, separately, the areas located near the cores of dendrites or areas near the ends of secondary arms. Changes in aγ′ in the range of 0.001 Å, which can be called fluctuations due to their stochastic character, correspond to these two locations [33]. In contrast, Δaγ′ changes above 0.001 Å are caused by specific local crystallization conditions related to the complex shape of the entire blade [40,41,42,43].
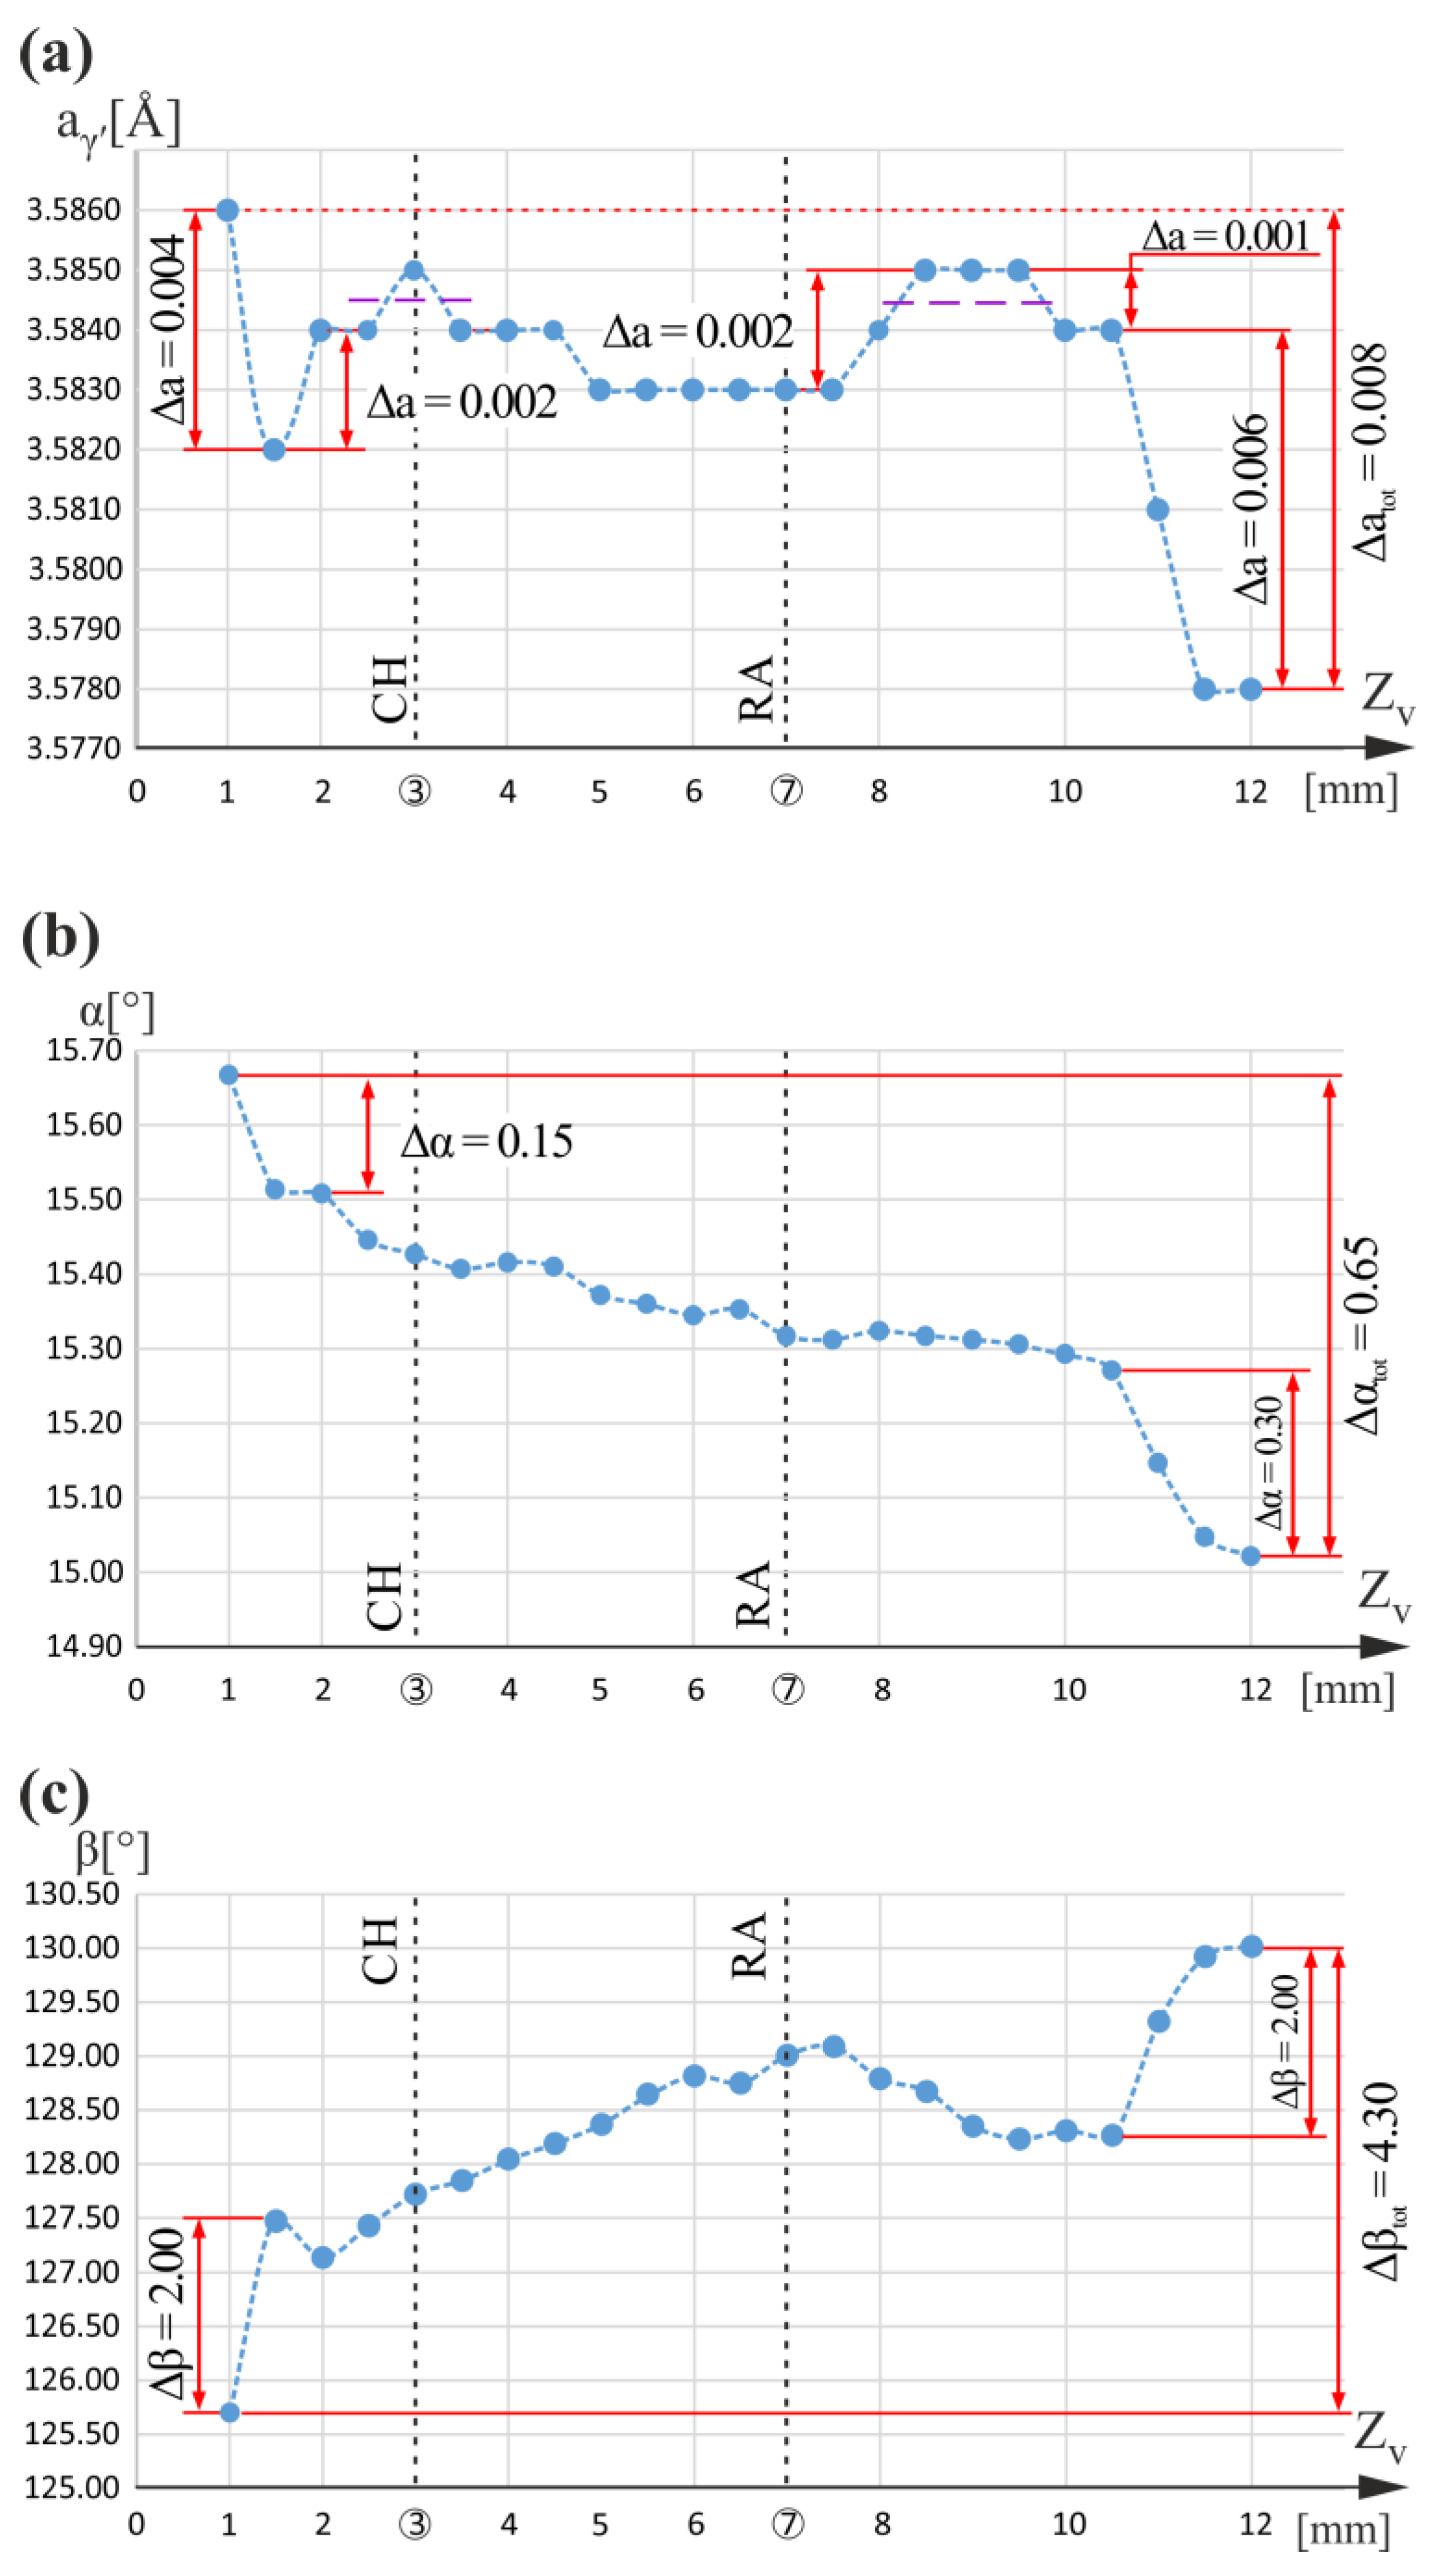
Figure 5 shows a graph of the aγ′(Zv), α(Zv), and β(Zv) relationship obtained for measuring line v (Figure 1a,b). Local fluctuations of 0.001 Å in the aγ′ lattice parameter corresponding to the undisturbed dendritic structure occur in the area limited by Zv, ranging only between 8 mm and 10.5 mm. For other ranges of Zv, local changes in aγ′ of 0.004 Å, 0.002 Å and 0.006 Å were observed. The greatest changes of aγ′ were for the starting values of Zv ranging between 1 mm and 1.5 mm, and for ending values of Zv, ranging between 10.5 mm and 12 mm. There is an aγ′ change with the value of 0.001 Å on the CH level. It is difficult to determine whether this change is related to the change of the growth conditions in the chamfer of the root or has a stochastic character. If such a small change results from the chamfer, then it is probably related to a significantly long distance (distance S1, Figure 1b) of the measuring line v from the chamfer of the root. Above the RA level, for Zv equal to 8.5 mm, there is an increase in aγ′ of 0.002 Å.
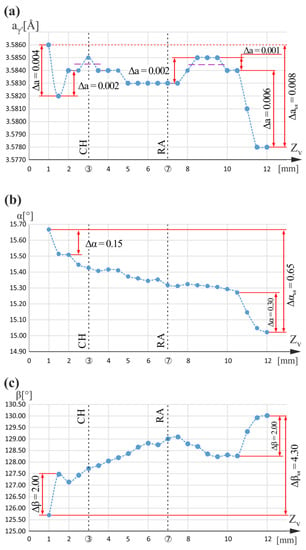
Figure 5.
Graphs of the aγ′(Zv) (a), α(Zv) (b), and β(Zv) (c) relationships obtained for measuring line v. Zv is parallel to Z0.
In Figure 5b, by visualizing the α(Zv) relationship, generally, a continuous decrease in the α value can be observed for the entire measurement range of Zv. There are no extremes near the CH or RA levels. The large local decreases in the α value of 0.15° and 0.30° occur for the starting and ending Zv values of the same Zv ranges for which the aγ′ changes were greater. In the same ranges of Zv, large local increases in the β angle were also observed, but by significantly higher values (Δβ = 2.0°) in comparison to α changes (Δα = 0.15° or 0.30°). For the entire measuring range of Zv, the total β change is equal to 4.3° and α change is only equal to 0.65°. These values are marked in Figure 5b,c as Δβtot and Δαtot, respectively. No changes in β were observed for the CH level, while near the RA level, there was a very faintly distinct maximum. It is obvious that not only the presence of the local extremes of α(Zv) and/or β(Zv) relations demonstrate local dendrite bending. Also, the presence of local decreases or increases of α and/or β values, similar to those found in Figure 5 at the start and end of the Zv measurement range, demonstrate such bends. However, the degree of these local bends is much smaller. From Figure 5, it can be concluded that the aγ′ changes at the beginning of line v and at the end of line v are related to dendrite bending manifested by changes in the α and β angles. However, it cannot be unequivocally concluded that dendrite bends cause aγ′ changes, as is the case for changes at the CH and RA levels of the blade region located near the CE [5].
The complex nature of changes in the aγ′(Zv) and lack of clear correlation of changes in its value on the CH and RA levels with changes of α and β is probably due to the presence of many macroscopic low-angle boundaries and the predominance of effects caused by the segregation of alloying element near these boundaries compared to the effects of the segregation of alloying elements close to the CH and RA levels due to dendrite bending. In addition, the trends of α decreasing and β increasing for the entire Zv range may be related to the “fanning effect”, the consequences of which are intensified in the regions of the R-section located far from the CE (see Figure 1b), which masks local changes of α and β angles related to CH and RA levels.
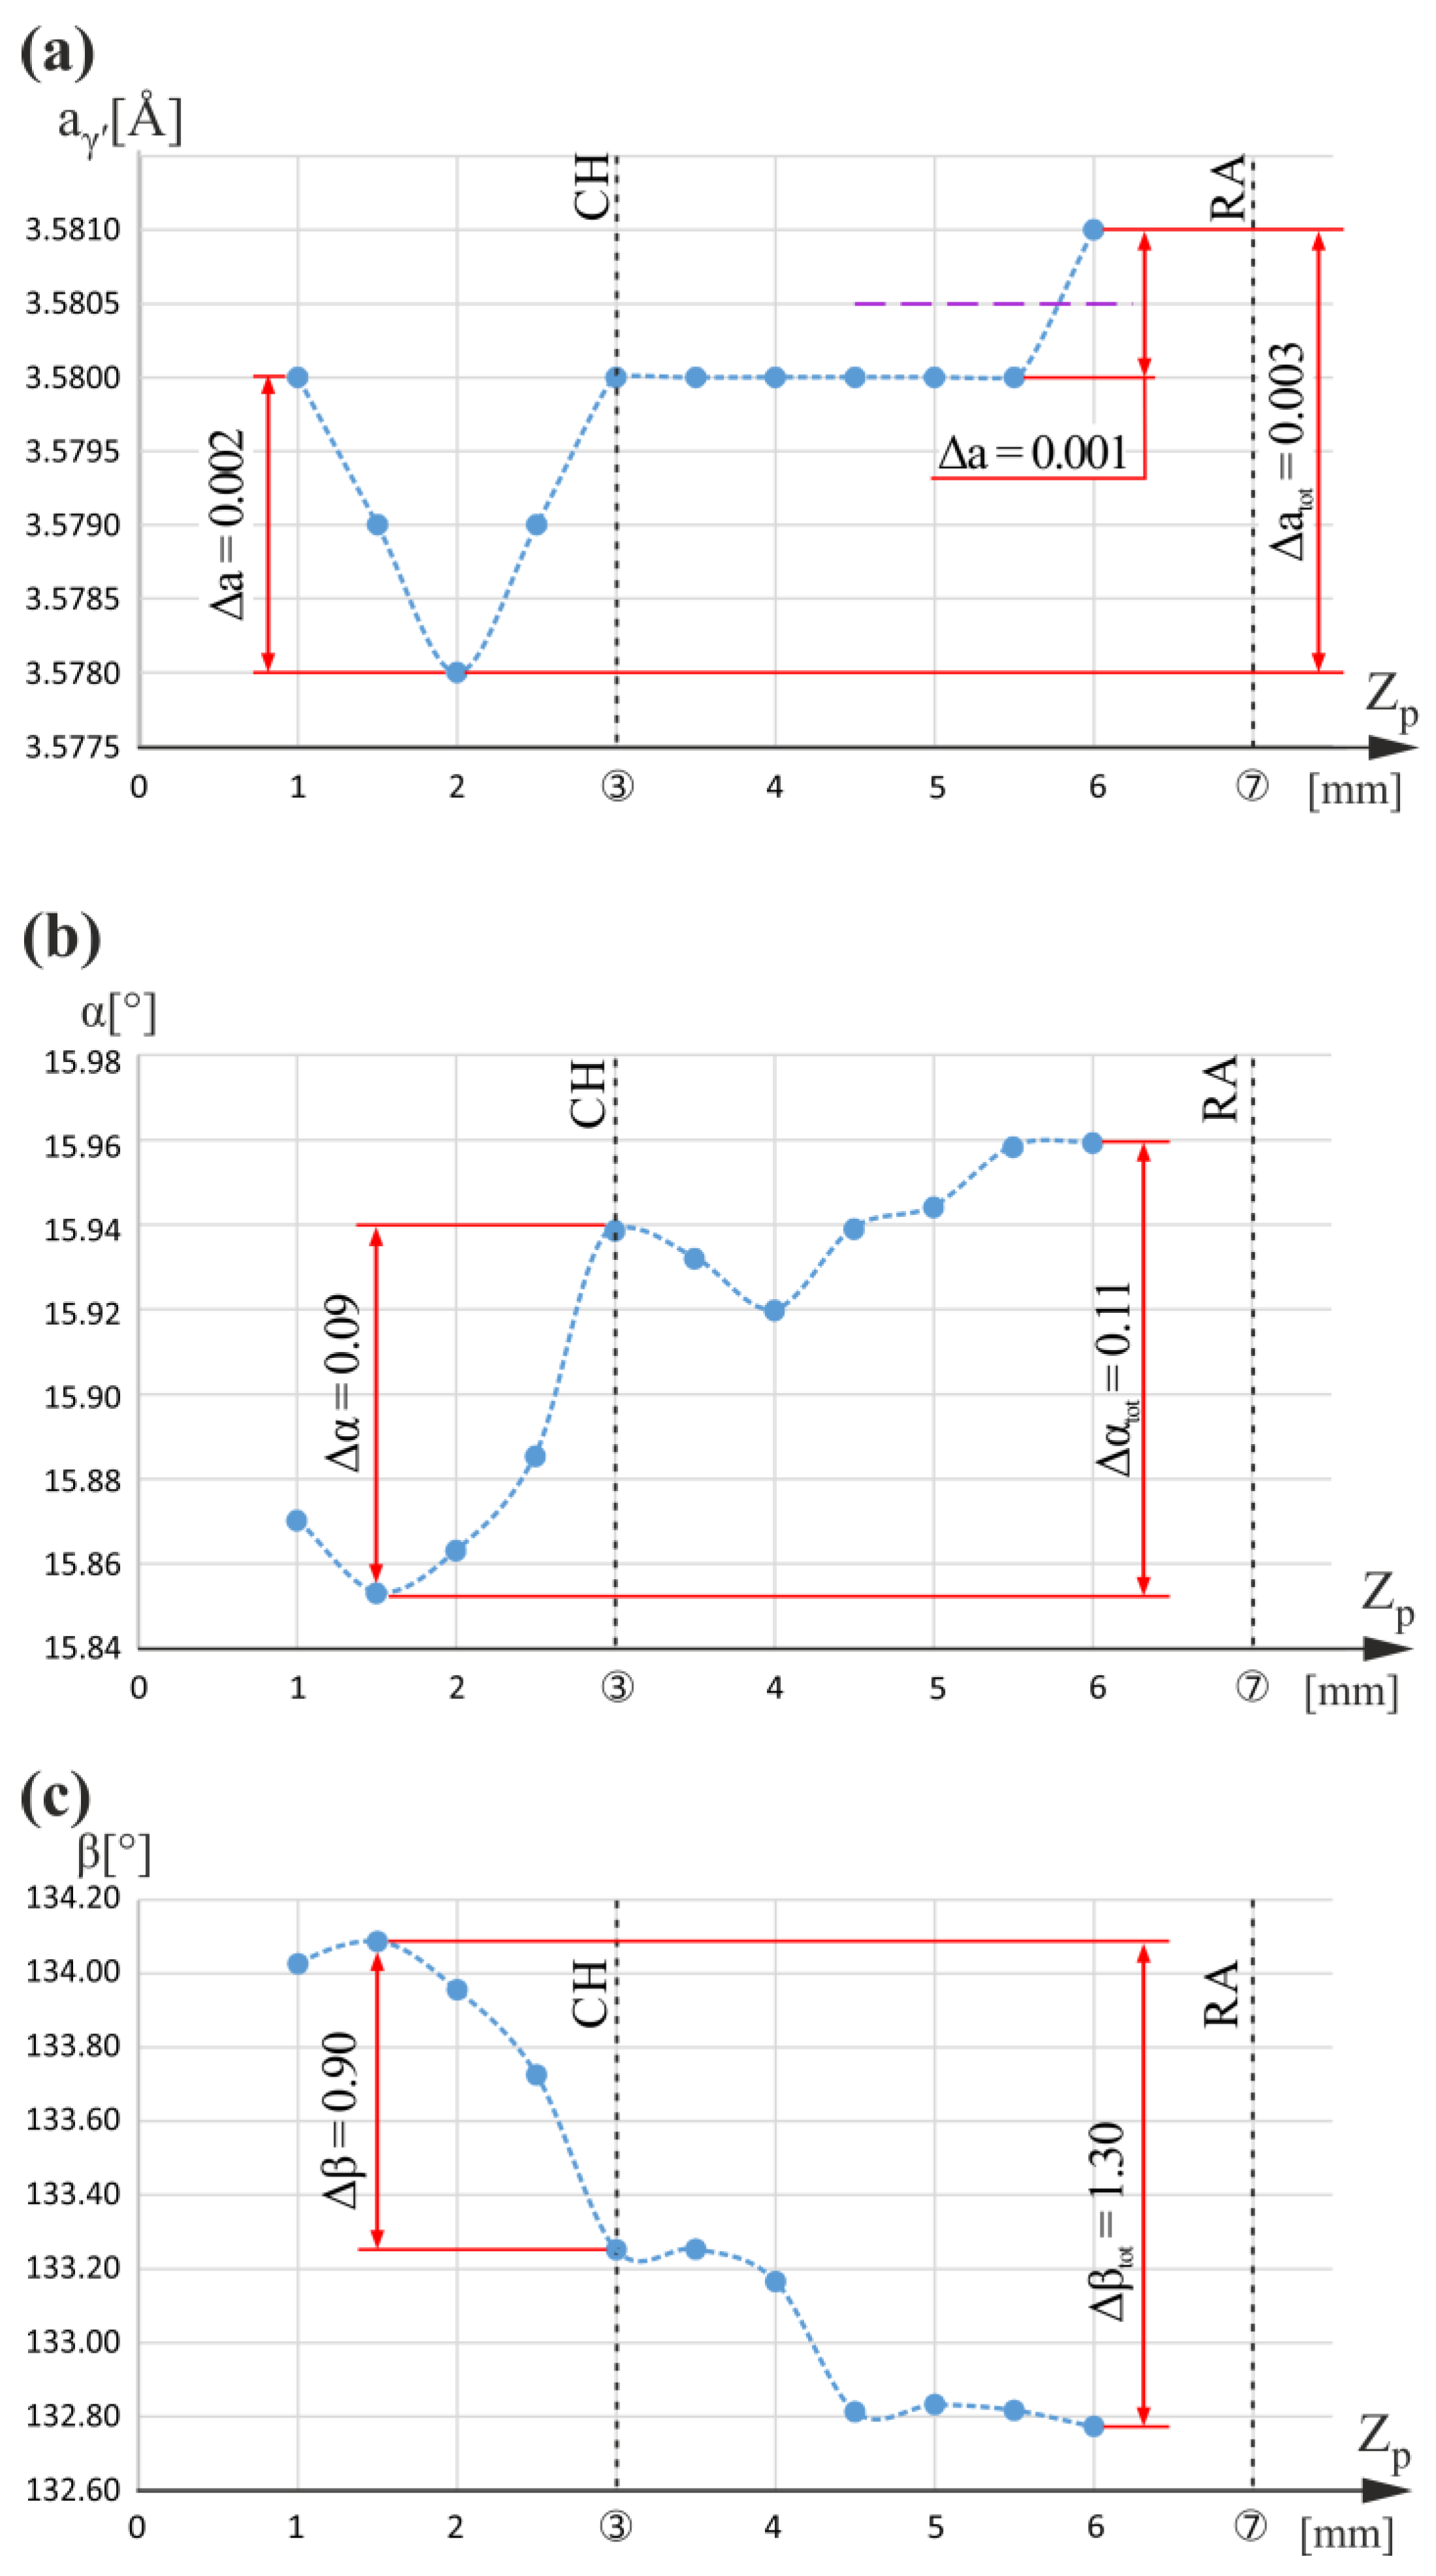
Figure 6 shows the graphs of the aγ′(Zp), α(Zp), and β(Zp) relationships obtained for measuring line p only located in the blade root (Figure 1a,b). For line p, there was no airfoil above the root fragment, and the line was simultaneously located near the root chamfer and root–airfoil connection (Figure 1b). Below the CH level, a local minimum at Zp equal to 2 mm can be observed.
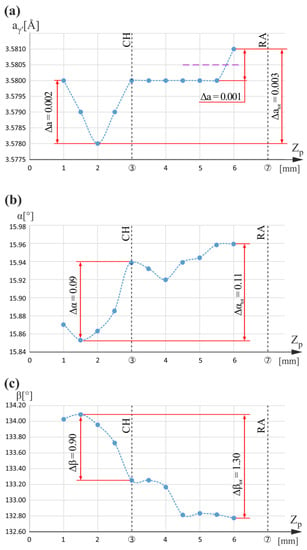
Figure 6.
Graphs of the aγ′(Zp) (a), α(Zp) (b), and β(Zp) (c) relationships obtained for measuring line p. Zp is parallel to Z0.
Figure 6b shows that for Zp equal to 3 mm corresponding to the CH level, there is a faint maximum of the α(Zp) relationship. However, for the entire Zp measuring range, the increasing trend, in general, is visible, whereas, for the β(Zp) relationship (Figure 6c), a decreasing trend is visible with some disturbance near the CH level. The rates of the α and β changes under the CH level (Zp < 3 mm) are significantly higher compared to the areas localized above it. In addition, all changes in the β angle below and above the CH level are much greater than changes in the α angle. This means that the dendrites mostly rotate about the Zp axis and tilt to a lesser extent.
For both L- and R-sections of the entire blade, measurements were made along four lines traced on the root areas over which the airfoil is not located. These measuring lines are p and k of the R-section and r1 and r2 of the L-section. Local changes in aγ′ values of measuring line p and their correlations with α changes have a different character than those occurring for measuring line k. Both lines are located near the chamfer of the root, but line p is distanced from the cooling bores, and the k line is located near the middle cooling bore (CB2). The following can be concluded by comparing the relation of the aγ′ lattice parameter on the coordinates of the measuring lines p and k. In the areas of root over which the airfoil is not located and which are distant from cooling bores (line p), the local changes in lattice parameter aγ′ related to the chamfer of the root are much lower than the changes in areas located closer to the cooling bores (line k). It is also confirmed by the measurement for lines b1 and b2 of the L-section, obtained in the first part of our research [5]. The aγ′ changes for these lines are only 0.002 Å and are much smaller than the aγ′ changes for line k. This means that the presence of the cooling bores significantly increased the heterogeneity of the alloying elements’ distribution in these root areas.
In general, the character and range of the aγ′, α, and β changes related to the CH level observed on all measuring lines of the R-section are complex, more complicated than those observed on the lines of the L-section. The reason may be the overlap of different effects, such as the “fanning effect” [35], and effects related to the existence of macroscopic low-angle boundaries occurring in the R-section area [35]. Therefore, the analysis of the influence of blade geometry on the lattice parameter of the γ′ phase and the primary orientation is difficult. The value of the α angle for all measuring lines of the R-section roughly ranges from 14.5° to 16.0° and is about twice as large for the areas of the L-section, where such value ranges roughly from 7.0° to 7.4°. Taking into account that the areas which belong to the R-section are located farther from the CE, it can be concluded that increasing the distance from the CE may be one of the reasons for the increase in the deviation of the [001]-type direction from the main blade axis. Comparing the aγ′ values for the entire R-section and L-section is difficult because the ranges of changes for each section are not separable, as is the case with the α angle value. For the entire R-section, aγ′ varies from 3.576 Å (minimum for line k) to 3.587 Å (maximum for line d2). On the other hand, for the entire L-section, aγ′ varies in the range from 3.578 Å (minimum for line t) to 3.582 Å (maximum for line b1)—which is also seen in [5].
For the areas of the L-section over which the airfoil is not located, the aγ′ values ranged from 3.579 Å to 3.581 Å (for both lines r1 and r2), as presented in [5]. On the other hand, for the mentioned areas of the R-section, the aγ′ value ranged in a very similar range from 3.578 Å to 3.581 Å for line p and in a much wider range from 3.576 Å to 3.582 Å for line k. Measuring lines r1, r2, and p are located far from the cooling bore, but the distance from the CE for line p is much longer than for r1 and r2. Comparing the ranges of changes in aγ′ for lines r1, r2, and line p leads to the conclusion that the distance from the CE does not play a significant role in these areas. On the other hand, comparing the ranges of changes in aγ′ for lines p and k, it can be concluded that for line k, the lower limit of aγ′ changes is decreased by 0.002 Å, and the upper limit is increased only by 0.001 Å. As a result, it can be deduced that the value of aγ′ is decreased for line k. Since line p is located far from any cooling bores, and line k is close to the second cooling bore (CB2), it can be additionally concluded that for the areas of root over which the airfoil is not located, the vicinity of the cooling bores causes the aγ′ value to decrease. This was also stated in [35]. According to the interpretation presented in [34], this means that there was an increase in the concentration of alloying elements, such as Re, W, Mo, and/or a decrease in Al, Ti, and Ta concentration.
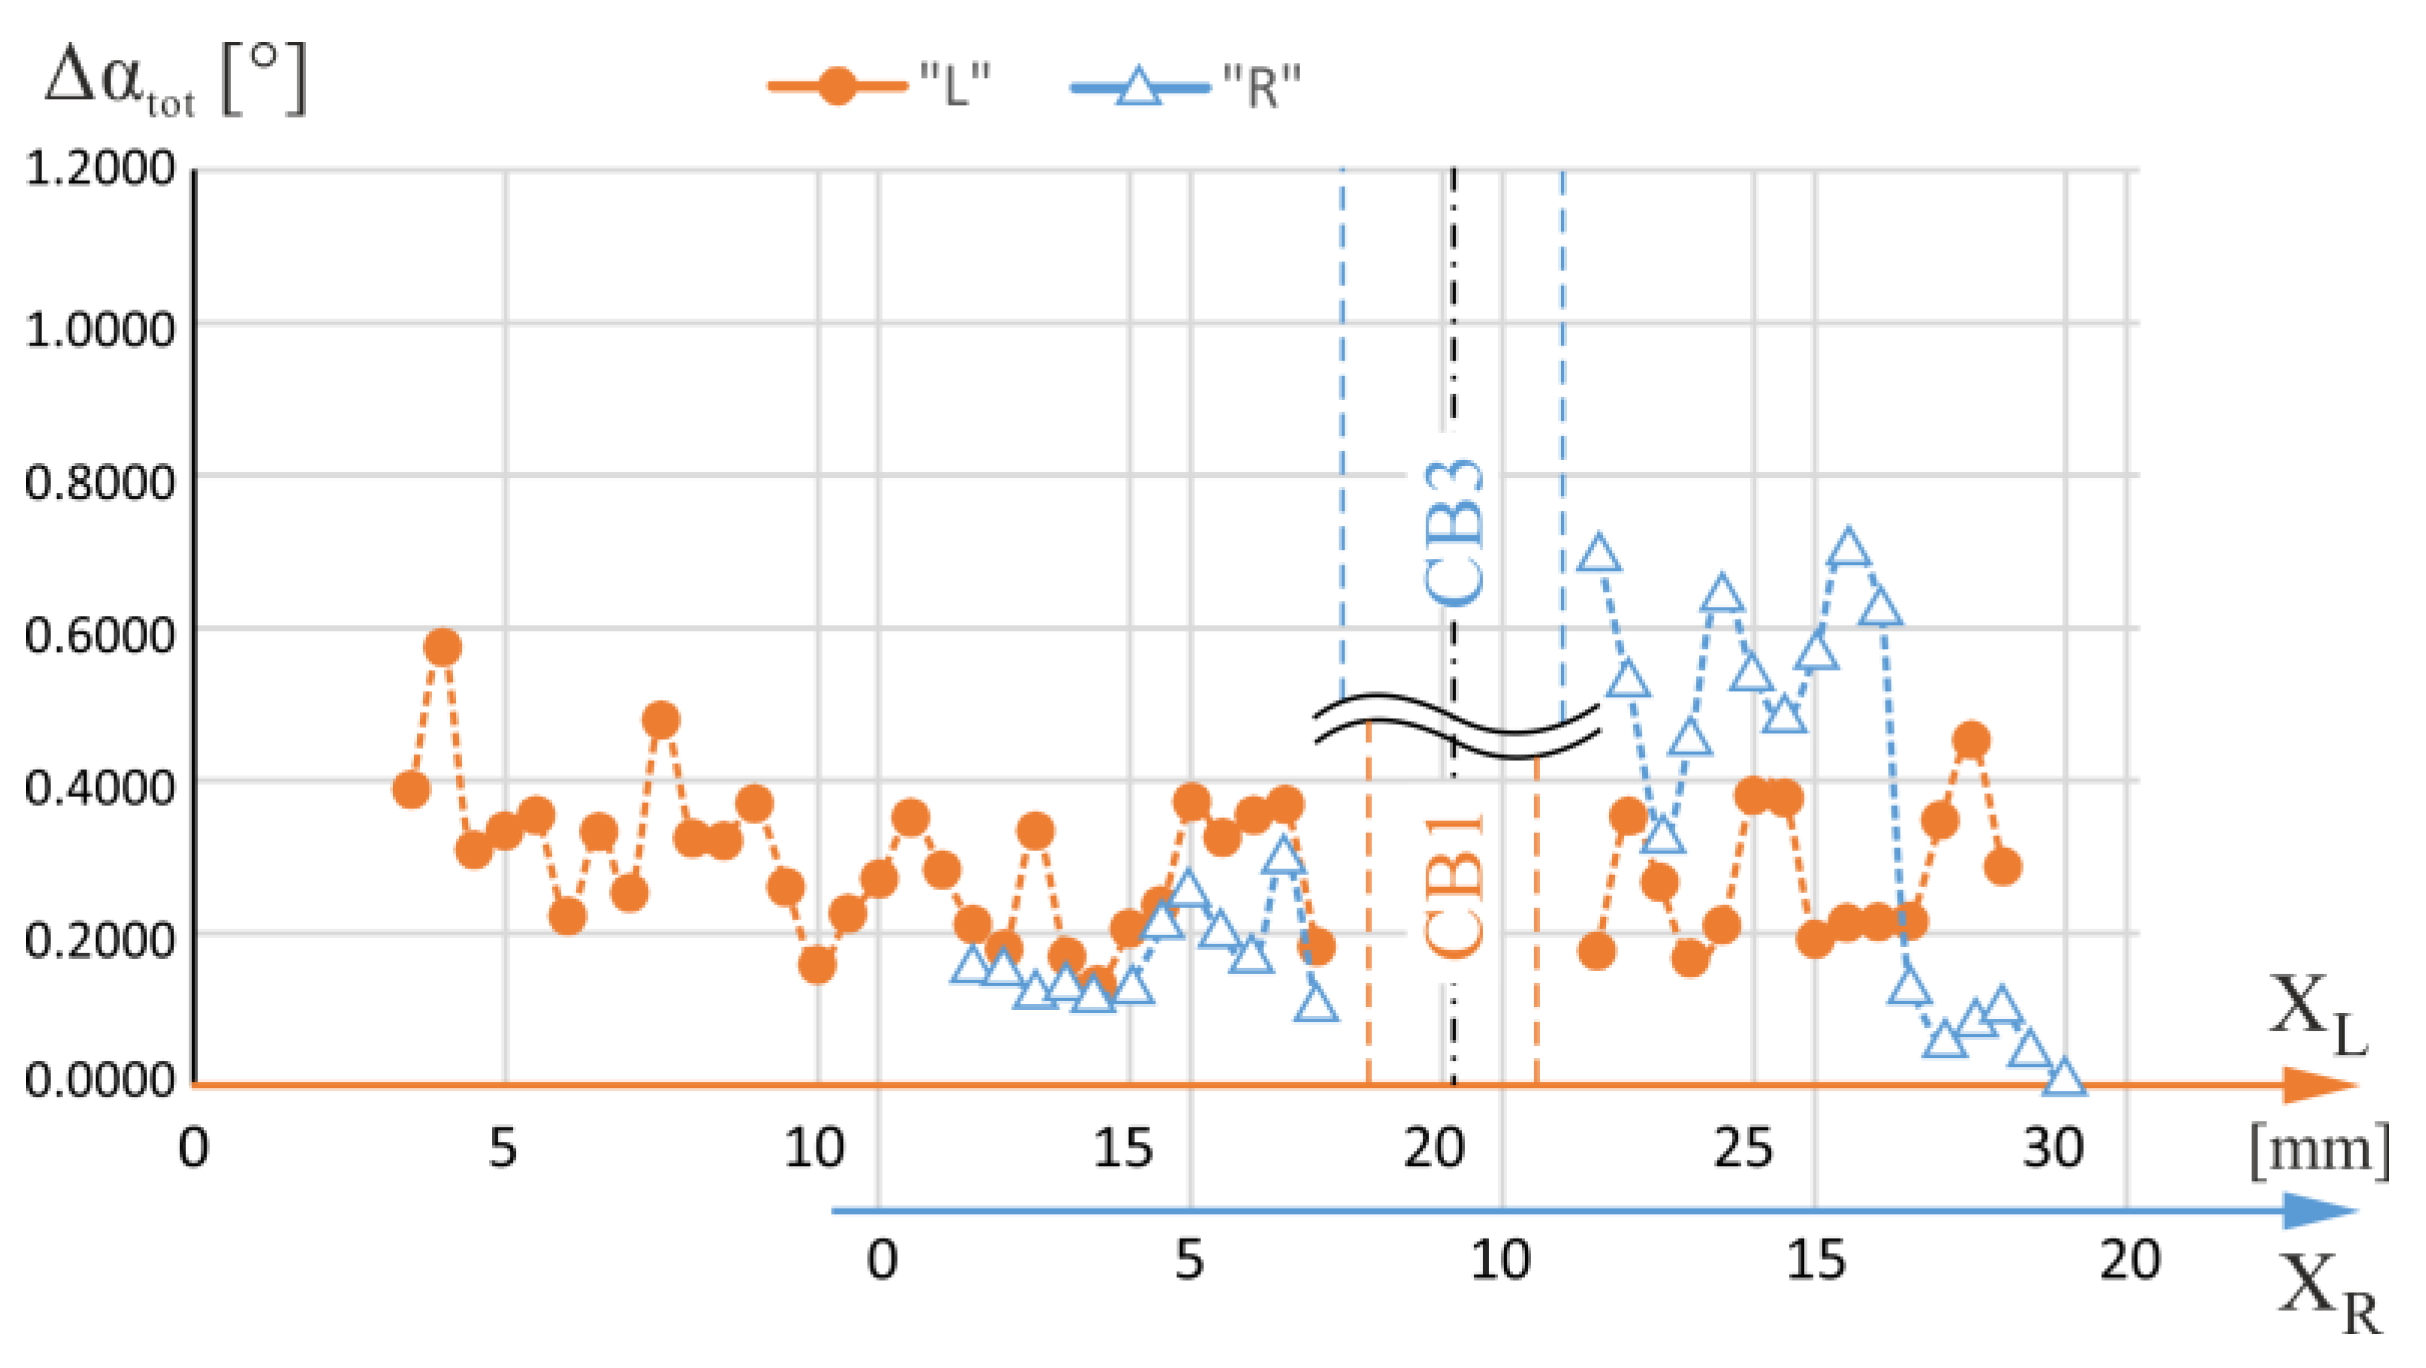
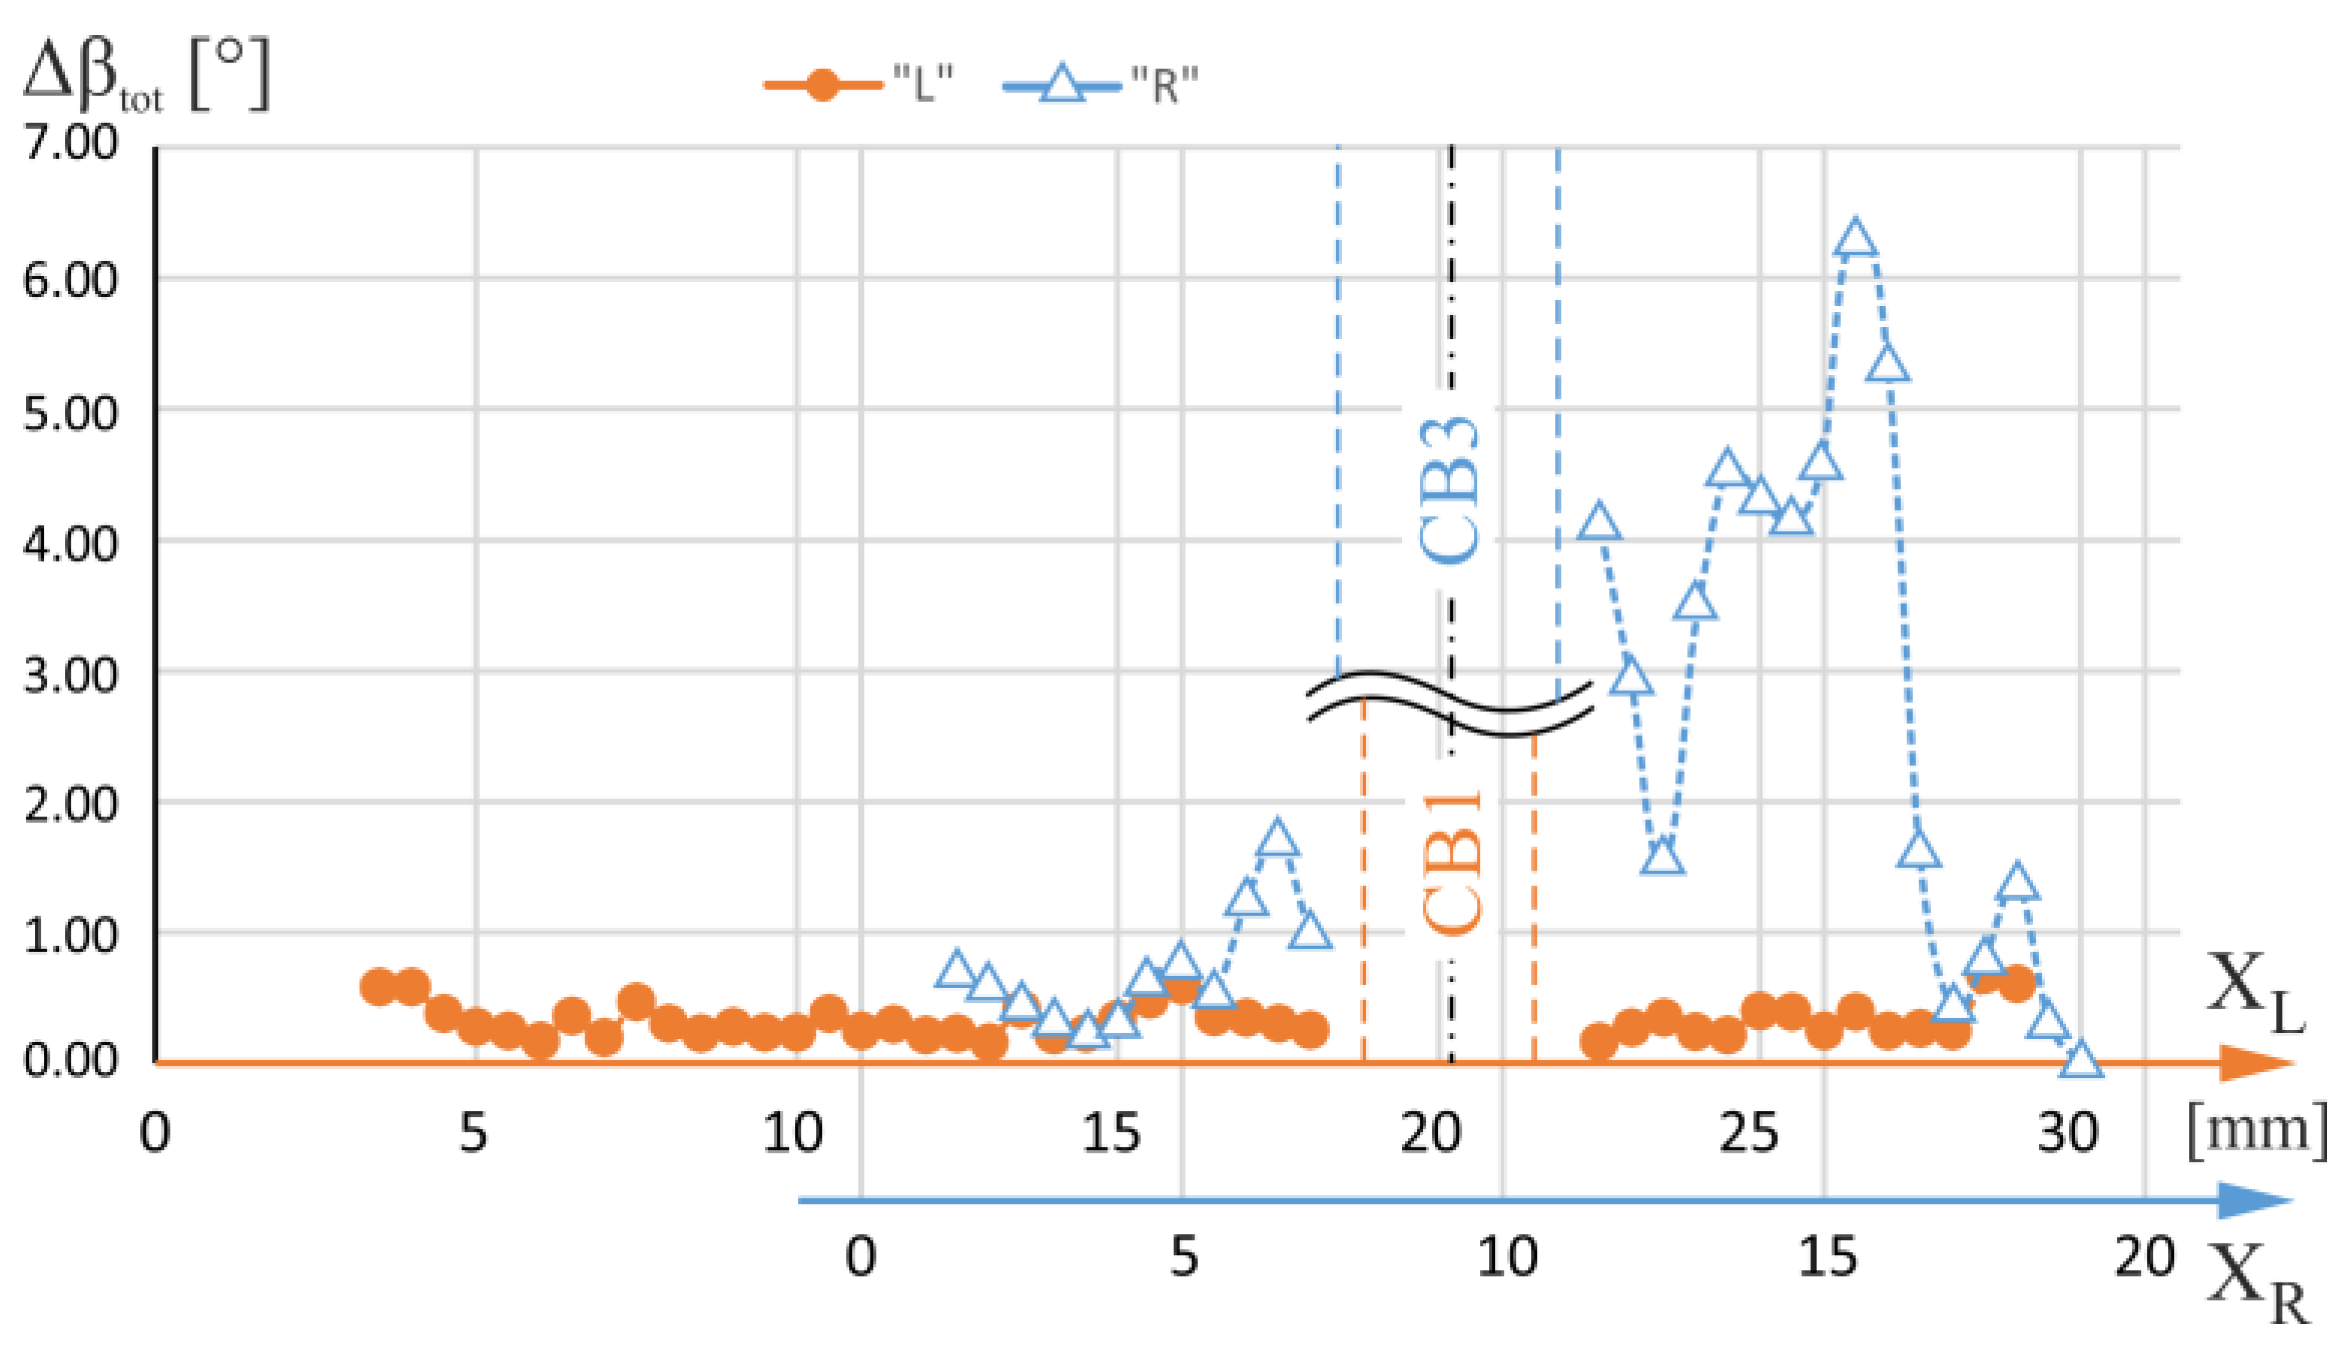
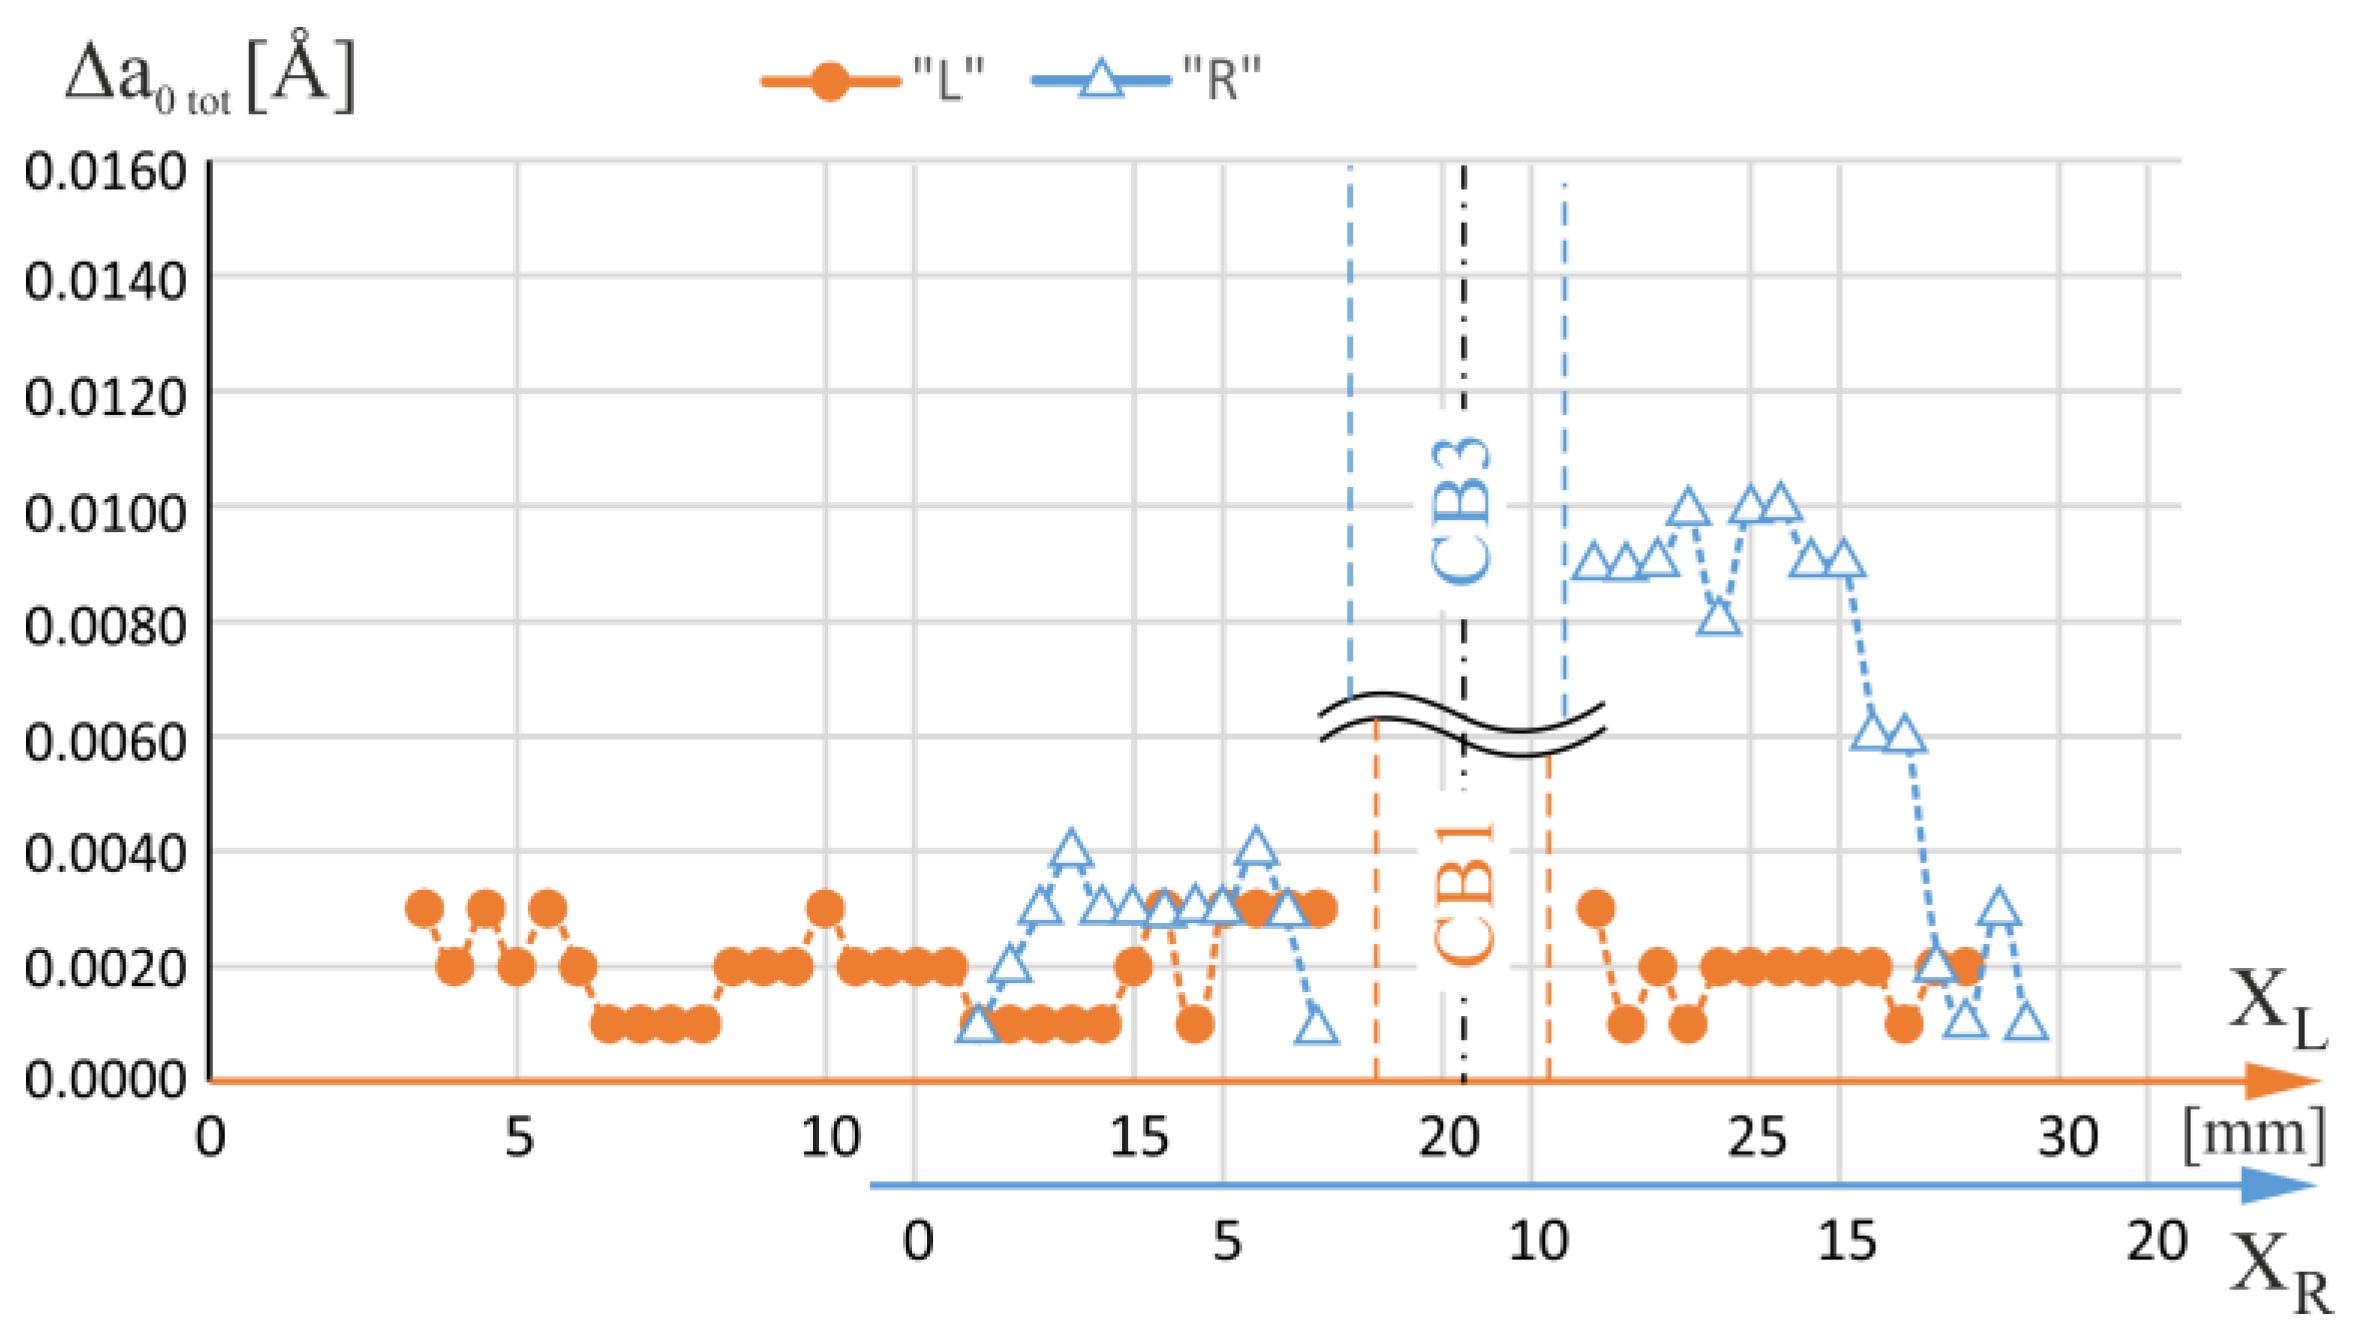
Figure 7 shows the total ranges of the α angle changes—Δαtot—specified for each measuring line with XL coordinates of the axis located on the L-section and XR coordinates of the axis located on the R-section. The lines were traced to pass through the blade area for which the airfoil is a continuation of the root and therefore covered both the root and the airfoil. The XL and XR measurement axes in Figure 7 have been mutually shifted so that the geometric axes of the CB1 and CB3 overlap each other. Figure 8 shows the total changes of the β angle—Δβtot—specified for the same L- and R-sections axes. From the analysis of Figure 7 and Figure 8, it can be concluded that, in general, for the R-section, on the right side of the CB3, the values of both the α and β total changes are higher than on the left side of the CB3. The area on the right side of the CB3 is separated from the region of the CE (Figure 1b) by the side surfaces of the CB3, while the area on the left side is not. This effect does not occur for CB1.
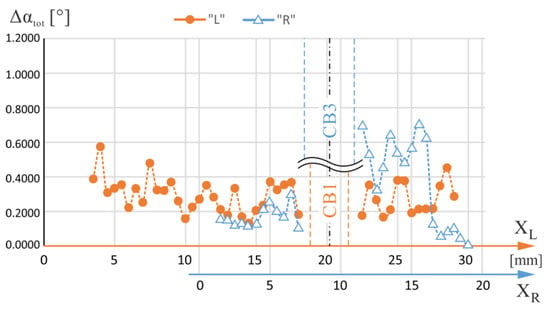
Figure 7.
The total changes of α angle—Δαtot—defined for each measuring line with coordinates XL of the L-section axis and XR of the R-section axis. The lines were traced to pass through the blade area for which the airfoil is a continuation of the root. The XL and XR axes have been mutually shifted so that the geometric axes of the CB1 and CB3 overlap each other.
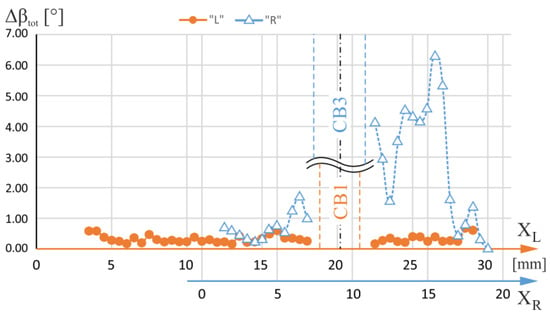
Figure 8.
The total changes of β angle—Δβtot—defined for each measuring line with coordinates XL of the L-section axis and XR of the R-section axis. The lines were traced to pass through the blade area for which the airfoil is a continuation of the root. The XL and XR axes have been mutually shifted so that the geometric axes of the CB1 and CB3 overlap each other.
Significant α and β changes indicate the existence of macroscopic low-angle boundaries (LABs). They may be inherited by the root and then by the blade’s airfoil from the UDG layer (Figure 1a) of unsteady growth of dendrites [34]. The creation of the LABs in the UDG layer occurs at the initial crystallization stage of the root and is related to the disturbances in the lateral growth of dendrites arms from the region of the CE. Such disturbances are significantly increased when the walls of the CB3 are situated in the path of the laterally growing dendrites. From Figure 7 and Figure 8, it can be concluded that on the right and left sides of CB1, such changes in alpha and beta angles are comparable, which may be related to the small distance of CB1 from the region of the CE.
As shown in Figure 9, the value of Δatot for the R-section is on average higher than that of the L-section on the right side of the CB3. This means that there was an increase in the segregation of alloying elements. On the right side of the CB3, the values of Δαtot and Δβtot are high. This may indicate the presence of many LABs that are manifested by changes in the crystal orientation. They are also related to the change in the value of the lattice parameter aγ′ related to the segregation of alloying elements. This segregation increases the heterogeneity of the chemical composition of the blade and is unfavorable to its strength because it increases the heterogeneity of stress distribution during its operation. Reducing the heterogeneity of cored blades by heat treatment seems difficult due to the presence of cooling bores which inhibit the diffusion process on their side surfaces. The heterogeneity is affected by two factors: the distance from the region of the CE and the presence of cooling bore walls in the UDG layer. Therefore, reduction of this type of segregation can be realized by the symmetrical positioning of the selector to reduce the distance of particular blade areas from the selector and abandon the fabrication of the cooling channels in the UDG layer.
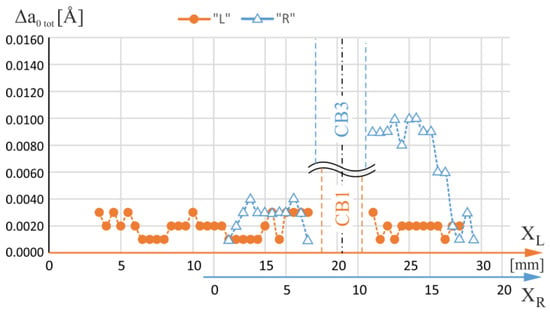
Figure 9.
The total changes of lattice parameter aγ′ changes—Δatot—defined for each measuring line with coordinates XL of the L-section axis and XR of the R-section axis. The lines were traced to pass through the blade area for which the airfoil is a continuation of the root. The XL and XR axes have been mutually shifted so that the geometric axes of the CB1 and CB3 overlap each other.
4. Conclusions
Three areas of blade geometry were considered. The first area covered the blade root only with no airfoil continuation above the root; the second area covered both the root and the airfoil where the airfoil was a continuation of the root; the third area was part of the latter but located near the side walls of the cooling bore. For these areas, the influence of the blade geometry on aγ′ lattice parameter and the α and β angles of the dendrites’ primary orientation was analyzed based on changes in aγ′, α and β at two levels of alterations in the shape of the blade cross-section—the level of the root chamfer (CH) and the level of root–airfoil (RA) connection.
For the R-section areas, both for which the airfoil was not located directly above the root and those for which the airfoil was a continuation of the root, the correlation between the change in the lattice parameter aγ′ and extremes of the α angle describing the dendrite bending on or near the levels of CH and RA of the blade was less clear than in the case of the L-section. This is because macroscopic low-angle boundaries (LABs) are present for the R-section, and the consequences of the “fanning effect” are intensified. Therefore, the relationship details between the aγ′ changes and dendrite bending are difficult to study in the R-section located far from the selector’s continuer extension (CE), unlike in the L-section located closer to them.
For the areas of the blade in which the airfoil is a continuation of the root and which are located near the cooling bores, the total ranges of the changes in the α and β angles of the primary crystal orientation and lattice parameter of the γ′-phase are higher for the regions that are separated from the CE by surfaces of the cooling bores, unlike the regions of L-section close to the CE.
The change in the α angle near both the CH and RA levels appears together with the changes in the β angle that describes the rotation of the [001] direction about the main axis of the blade. For the R-section, far from the CE, the β changes are generally greater, which indicates the higher rotation of the dendrites compared to their tilting during growth.
In the areas of root over which the airfoil was not located and which were close to the cooling bores, the bends of the dendrites and changes in the lattice parameter aγ′ related to the chamfer of the root were much greater than the changes in regions of the root distanced from the bores.
Near the levels of the R-section, at which significant changes of the α and β angles occurred, there were local changes in the aγ′ ranging from 0.002 Å to 0.006 Å. The upper limit of the range of the changes was much larger than for the same L-section levels, which were only 0.002 Å.
Increasing the distance from the continuer extension (CE) may be one reason for the increase in the changes and value of the α angle that describes the deviation of the [001]-type direction from the main blade axis.
Author Contributions
Conceptualization, J.K. and W.B.; methodology, J.K.; software, J.K.; validation, J.K., W.B. and J.S.; formal analysis, J.K.; investigation, J.K. and W.B.; resources, J.K.; data curation, J.K.; writing—original draft preparation, J.K.; writing—review and editing, W.B and J.K.; visualization, J.K.; supervision, J.S.; project administration, J.K.; funding acquisition, J.S. All authors have read and agreed to the published version of the manuscript.
Funding
The research activities were co-financed by the funds granted under the Research Excellence Initiative of the University of Silesia in Katowice, Poland.
Institutional Review Board Statement
Not applicable.
Informed Consent Statement
Not applicable.
Data Availability Statement
Not applicable.
Acknowledgments
The authors would like to thank the management and employees of the Department of Materials Science and Research & Development Laboratory for Aerospace Materials, Rzeszów University of Technology, Poland, for their cooperation and valuable help.
Conflicts of Interest
The authors declare no conflict of interest. The funders had no role in the design of the study; in the collection, analyses, or interpretation of data; in the writing of the manuscript; or in the decision to publish the results.
References
- Reed, R.C. The Superalloys Fundamentals and Applications; Cambridge University Press: Cambridge, UK, 2006. [Google Scholar]
- Pollock, T.M.; Tin, S. Nickel-Based Superalloys for Advanced Turbine Engines: Chemistry, Microstructure and Properties. J. Propuls. Power 2006, 22, 361. [Google Scholar] [CrossRef]
- Donachie, M.J.; Donachie, S.J. Superalloys—A Technical Guide, 2nd ed.; ASM International: Geauga, OH, USA, 2002. [Google Scholar]
- Konter, M.; Thumann, M. Materials and manufacturing of advanced industrial gas turbine components. J. Mater. Process. Technol. 2001, 117, 386–390. [Google Scholar] [CrossRef]
- Krawczyk, J.; Bogdanowicz, W.; Sieniawski, J. Effect of Blade Geometry on γ′ Lattice Parameter and Primary Orientation of SX Cored Turbine Blades (I). Materials 2023, 16, 112. [Google Scholar] [CrossRef]
- Bogdanowicz, W.; Krawczyk, J.; Paszkowski, R.; Sieniawski, J. Variation of Crystal Orientation and Dendrite Array Generated in the Root of SX Turbine Blades. Materials 2019, 12, 4126. [Google Scholar] [CrossRef]
- Krawczyk, J.; Bogdanowicz, W.; Sieniawski, J. The Number of Subgrain Boundaries in the Airfoils of Heat-Treated Single-Crystalline Turbine Blades. Materials 2021, 14, 8. [Google Scholar] [CrossRef]
- Li, J.R.; Zhao, J.Q.; Liu, S.Z.; Han, M. Effect of low angle boundaries on the mechanical properties of single crystal superal-loy DD6. In Superalloys 2008; Reed, R.C., Green, K.A., Caron, P., Grabb, T.P., Fahrmann, M.G., Huron, E.H., Woodart, S.A., Eds.; Wiley: Hoboken, NJ, USA, 2008; pp. 443–451. [Google Scholar]
- Savikovskii, A.V.; Semenov, A.S.; Getsov, L.B. Crystallographic orientation, delay time and mechanical constants influence on thermal fatigue strength of single—Crystal nickel superalloys. Mater. Phys. Mech. 2020, 44, 125–136. [Google Scholar] [CrossRef]
- Yang, Y.; Wen, Z.; Zhao, Y.; Wang, J.; Li, Z.; Yue, Z. Effect of crystallographic orientation on the corrosion resistance of Ni-based single crystal superalloys. Corros. Sci. 2020, 170, 108643. [Google Scholar] [CrossRef]
- Xu, W.; Wang, F.; Ma, D.; Zhu, X.; Li, D.; Bührig-Polaczek, A. Sliver defect formation in single crystal Ni-based superalloy castings. Mater. Des. 2020, 196, 109138. [Google Scholar] [CrossRef]
- Aveson, J.W.; Reinhart, G.; Nguyen-Thi, H.; Mangelinck-Noël, N.; Tandjaoui, A.; Billia, B.; Goodwin, K.; Lafford, T.A.; Ba-ruchel, J.; Stone, H.J.; et al. Dendrite bending during directional solidification. In Superalloys 2012; Huron, E.S., Reed, R.C., Hardy, M.C., Mills, M.J., Montero, R.E., Portella, P.D., Telesman, J., Eds.; TMS: Hoboken, NJ, USA, 2012; p. 615. [Google Scholar] [CrossRef]
- Aveson, J.W.; Reinhart, G.; Nguyen-Thi, H.; Mangelinck-Noël, N.; D’Souza, N.; Stone, H.J. Origins of misorientation defects in single crystal castings: A time resolved in situ synchrotron X-ray radiography study. In Proceedings of the MATEC Web of Conferences 14, 2nd European Symposium on Superalloys and Their Applications, Giens, France, 12–15 May 2014. [Google Scholar] [CrossRef]
- Mullis, A.M.; Walker, D.J.; Battersby, S.E.; Cochrane, R.F. Deformation of dendrites by fluid flow during rapid solidification. Mater. Sci. Eng. A 2001, 304–306, 245–249. [Google Scholar] [CrossRef]
- Doherty, R.D. Comments on Mechanical deformation of dendrites by fluid flow during the solidification of undercooled melts. Scr. Mater. 2003, 49, 1219–1222. [Google Scholar] [CrossRef]
- Cheng, K.Y.; Jo, C.Y.; Kim, D.H.; Jin, T.; Hu, Z.Q. Influence of local chemical segregation on the γ′ directional coarsening behavior in single crystal superalloy CMSX-4. Mater. Charact. 2009, 60, 210–218. [Google Scholar] [CrossRef]
- Warnken, N. Studies on the Solidification Path of Single Crystal Superalloys. J. Phase Equilibria Diffus. 2016, 37, 100–107. [Google Scholar] [CrossRef]
- Seo, S.M.; Jeong, H.W.; Ahn, Y.K.; Yun, D.W.; Lee, J.H.; Yoo, Y.S. A comparative study of quantitative microsegregation analyses performed during the solidification of the Ni-base superalloy CMSX-10. Mater. Charact. 2014, 89, 43–55. [Google Scholar] [CrossRef]
- Ber, L.B.; Rogozhkin, S.V.; Khomich, A.A.; Zaluzhnyi, A.G. Distribution of Alloying Element Atoms between γ- and γ′-Phase Particles in a Heat-Resistant Nickel Alloy. Phys. Met. Metall. 2022, 123, 163–177. [Google Scholar] [CrossRef]
- Zhang, J.; Zong, H.; Lu, F.; Huang, T.; Wang, D.; Zhang, J.; Zhang, J.; Su, H.; Liu, L. Synergistic effects of Re and Ta on the distribution of W in Ni-based superalloys. Intermetalics 2022, 147, 107609. [Google Scholar] [CrossRef]
- Aveson, J.W.; Reinhart, G.; Goddard, C.J.L.; Nguyen-Thi, H.; Mangelinck-Noël, N.; Tandjaoui, A.; Davenport, J.R.; Warnken, N.; Di Gioacchino, F.; Lafford, T.A.; et al. On the Deformation of Dendrites During Directional Solidification of a Nick-el-Based Superalloy. Metall. Mater. Trans. A 2019, 50, 5234–5241. [Google Scholar] [CrossRef]
- Lee, D.N.; Kim, K.H.; Lee, Y.G.; Choi, C.H. Factors determining crystal orientation of dendritic growth during solidification. Mater. Chem. Phys. 1997, 47, 154–158. [Google Scholar] [CrossRef]
- Dragnevski, K.; Mullis, A.M.; Walker, D.J.; Cochrane, R.F. Mechanical deformation of dendrites by fluid flow during the solidification of undercooled melts. Acta Mater. 2002, 50, 3743–3755. [Google Scholar] [CrossRef]
- Hallensleben, P.; Scholz, F.; Thome, P.; Schaar, H.; Steinbach, I.; Eggeler, G.; Frenzel, J. On Crystal Mosaicity in Single Crys-tal Ni-Based Superalloys. Crystals 2019, 9, 149. [Google Scholar] [CrossRef]
- Han, J.-C.; Dutta, S.; Ekkad, S. Gas Turbine Heat Transfer and Cooling Technology; CRC Press: Boca Raton, FL, USA; London, UK, 2013. [Google Scholar]
- Moskalenko, A.B.; Kozhevnikov, A.I. Estimation of Gas Turbine Blades Cooling Efficiency. Proc. Eng. 2016, 150, 61–67. [Google Scholar] [CrossRef]
- Priyadarsini, C.I.; Kashyap, T.A.; Kumar, K.A.; Reddy, M.D.; Krishna, S.V. Analysis of Gas Turbine Blade with Number of Holes for Cooling. Int. J. Eng. Adv. Res. Technol. 2016, 2, 18–22. [Google Scholar]
- Pudake, P.; Elgandelwar, A.M.; Lele, M.M. Gas Turbine Blade Cooling Technology—A Case Study. Int. J. Curr. Eng. Technol. 2017, 7, 195–201. [Google Scholar]
- Chen, C.; Sun, J.; Diao, A.; Yang, Y.; Li, J.; Zhou, Y. On the dendrite deformation and evolution mechanism of Ni-based superalloy during directional solidification. J. Alloys Compd. 2022, 891, 161949. [Google Scholar] [CrossRef]
- Huo, M.; Liu, L.; Yang, W. Dendrite deformation in the rejoined platforms of Ni-based single crystal superalloys. Adv. Eng. Mater. 2023, 2300385. [Google Scholar] [CrossRef]
- Zipperian, D.C. Metallographic Handbook; PACE Technologies: Tucson, AR, USA, 2011. [Google Scholar]
- Berger, H.; Bradaczek, H.A.; Bradaczek, H. Omega-Scan: An X-ray tool for the characterization of crystal properties. J. Mater. Sci. Mater. Electron. 2008, 19, 351–355. [Google Scholar] [CrossRef]
- Krawczyk, J.; Bogdanowicz, W. Correlation between the Dendritic Structure and Lattice Parameter of γ′-Phase in Single-Crystalline Turbine Blades Made of Superalloys. Materials 2022, 15, 781. [Google Scholar] [CrossRef]
- Paszkowski, R.; Bogdanowicz, W.; Szeliga, D. The Low-Angle Boundaries Misorientation and Lattice Parameter Changes in the Root of Single-Crystalline CMSX-4 Superalloy Blades. Materials 2021, 14, 5194. [Google Scholar] [CrossRef]
- Krawczyk, J.; Bogdanowicz, W.; Sieniawski, J. The Influence of the Cooling Bores on Crystal Orientation and Lattice Parameter in Single-Crystalline Cored Turbine Blades. Materials 2021, 14, 3842. [Google Scholar] [CrossRef]
- Bogdanowicz, W.; Krawczyk, J.; Paszkowski, R.; Sieniawski, J. Primary Crystal Orientation of the Thin-Walled Area of Single-Crystalline Turbine Blade Airfoils. Materials 2019, 12, 2699. [Google Scholar] [CrossRef]
- Krawczyk, J.; Bogdanowicz, W.; Sieniawski, J.; Kubiak, K. Mould Walls Inclination and Dendritic Morphology of CMSX-4 Blades’ airfoils. Acta Phys. Pol. A 2016, 130, 1100–1103. [Google Scholar] [CrossRef]
- Völkl, U.R.; Glatzel, M. Feller-Kniepmeier, Measurement of the lattice misfit in the single crystal nickel based superalloys CMSX-4, SRR99 and SC16 by convergent beam electron diffraction. Acta Mater. 1998, 46, 4395–4404. [Google Scholar] [CrossRef]
- Brückner, A.U.; Epishin, T. Link, Local X-ray diffraction analysis of the structure of dendrites in single-crystal nickel-base superalloys. Acta Mater. 1997, 45, 5223–5231. [Google Scholar] [CrossRef]
- Durand, M.; Cormier, J.; Paumier, F.; Katnagallu, S.; Saksena, A.; Kontis, P.; Pettinari-Sturmel, F.; Hantcherli, M.; Franchet, J.-M.; Dumont, C.; et al. Chemical redistribution and change in crystal lattice parameters during stress relaxation annealing of the AD730TM superalloy. Acta Mater. 2022, 237, 118–141. [Google Scholar] [CrossRef]
- Xia, W.; Zhao, X.; Yue, L.; Zhang, Z. Microstructural evolution and creep mechanisms in Ni-based single crystal superalloys: A review. J. Alloys Compd. 2020, 819, 152954. [Google Scholar] [CrossRef]
- Bezold, A.; Stone, H.J.; Rae, C.M.F.; Neumeier, S. In Situ Investigation of TCP Phase Formation, Stress Relaxation and γ/γ′Lattice Misfit Evolution in Fourth Generation Single Crystal Ni-Base Superalloys by X-Ray High Temperature Diffraction. Metall. Mater. Trans. A 2022, 53A, 2890. [Google Scholar] [CrossRef]
- Bruno, G.; Schumacher, G.; Pinto, H.C.; Schulze, C. Measurement of the lattice misfit of the nickel-base superalloy SC16 by high-energy synchrotron radiation. Metall. Mater. Trans. A 2003, 34, 193–197. [Google Scholar] [CrossRef]
Disclaimer/Publisher’s Note: The statements, opinions and data contained in all publications are solely those of the individual author(s) and contributor(s) and not of MDPI and/or the editor(s). MDPI and/or the editor(s) disclaim responsibility for any injury to people or property resulting from any ideas, methods, instructions or products referred to in the content. |
© 2023 by the authors. Licensee MDPI, Basel, Switzerland. This article is an open access article distributed under the terms and conditions of the Creative Commons Attribution (CC BY) license (https://creativecommons.org/licenses/by/4.0/).

