Article

Study on Enhancing the Thermoelectric Stability of the β-Cu2Se Phase by Mn Doping

1
Beijing Municipal Key Lab of Advanced Energy Materials and Technology, School of Materials Science and Engineering, University of Science and Technology Beijing, Beijing 100083, China
2
College of Physics and Electronic Information Engineering, Qinghai Normal University, Xining 810016, China
3
The State Key Laboratory of Refractories and Metallurgy, Wuhan University of Science and Technology, Wuhan 430081, China
*
Author to whom correspondence should be addressed.
Materials 2023, 16(14), 5204; https://doi.org/10.3390/ma16145204
Submission received: 19 June 2023 / Revised: 13 July 2023 / Accepted: 17 July 2023 / Published: 24 July 2023
(This article belongs to the Special Issue Advanced Thermoelectric Materials, Devices and Systems)

Abstract

:
Cu2Se is a promising thermoelectric (TE) material due to its low cost, Earth abundance, and high thermoelectric properties. However, the biggest problem of Cu2Se is its unstable chemical properties. In particular, under the action of an electric field or gradient temperature field, the chemical potential of copper ions inside the material increases. When the external field is strong enough, the chemical potential of copper ions at the negative end of the material reaches the chemical potential of elemental copper. Under these conditions, copper ions must precipitate out, causing Cu2Se to be unstable, and making it unsuitable for use in applications. In this study, we prepared Cu2−xMnxSe (x = 0, 0.02, 0.04 and 0.06) series bulk materials by vacuum melting–annealing and sintered by spark plasma sintering (SPS). We investigated the effects of Mn doping on the composition, microstructure, band structure, scattering mechanism, thermoelectric properties, and stability of Cu2Se. The results show that Mn doping can adjust the carrier concentration, promote the stabilization of the β-phase structure and improve the electrical properties of Cu2Se. When x = 0.06, the highest power factor (PF) value of Cu1.94Mn0.06Se at 873 K was 1.62 mW m−1 K−2. The results of carrier scattering mechanism analysis based on the conductivity ratio method show that the sample doped with Mn and pure Cu2Se had the characteristics of ionization impurity scattering, and the scattering factor was 3/2. However, the deterioration in thermal conductivity was large, and a superior zT value needs to be obtained. The cyclic test results of high-temperature thermoelectric properties show that Mn doping can hinder Cu+ migration and improve its thermoelectric stability, which preliminarily verifies the feasibility of using the stable zirconia mechanism to improve the thermoelectric stability of Cu2Se.

1. Introduction

TE technology, which enables direct energy conversion between heat and electricity and can directly convert waste heat generated by industrial plants or automobiles into useful electricity, is one of the most promising technologies for improving energy efficiency and has attracted widespread interest for decades [1]. TE materials for civilian use should have high thermoelectric properties and good stability, and have characteristics that lead to financial and environmental benefits. The properties of thermoelectric materials are evaluated using a dimensionless quality factor value zT = σS2 T/(κe + κl), where σ is electrical conductivity; S is the Seebeck coefficient; T is the absolute temperature; and κ is the total thermal conductivity, consisting of electron thermal conductivity (κe) and lattice thermal conductivity (κl) [2]. Therefore, an excellent thermoelectric material must have high σ, and S, and low κ. Many methods have been used to optimize these thermoelectric parameters, such as changing the band structure [3], introducing resonant energy levels [4], and de-dimensionalization, ionization, or alloying to induce scattering [5]. One of the most influential and easiest ways to do this is by doping elements in the alloy.
In recent years, Cu2Se with a “phonon liquid–electron crystal” (PLEC) [6] structure has attracted much attention as a promising P-type thermoelectric material, not only because of its excellent thermal (ultra-low thermal conductivity) and electrical (high conductivity) transport properties, but also because of its unique properties such as environmental friendliness, low cost, low toxicity, rich ores, and Earth abundance, high PF value, and high zT value [7]. Cu2Se exhibits P-type conductivity with high carrier concentration at relatively low temperatures, while ionic conductivity becomes obvious at temperatures above 400 K due to the transition from the α-Cu2Se to β-Cu2Se high-temperature phase [8]. β-Cu2Se is a valuable thermoelectric material in which liquid Cu ions are dynamically disordered within a face-centered cubic framework of Se [9]. The excellent thermoelectric properties of Cu2Se mainly depend on the anion having a simple lattice structure sublattice. At the same time, the cation is highly chaotic with liquid-like mobility and specific liquid superionic properties, which have an additional scattering effect on the lattice phonons, further hindering heat conduction or changing phonon transfer so that the mean free path of phonons is close to the minimum wavelength of glass. Thus, the material’s thermal conductivity is extremely low [10]. As a TE material, the biggest problem of Cu2Se is its unstable chemical properties. That is, the chemical potential of copper ions inside the material increases under the action of an electric field or gradient temperature field. When the external field is strong enough, the chemical potential of copper ions at the negative end of the material reaches the chemical potential of copper elements, and copper ions are precipitated as simple elements [11], making practical application impossible. This instability can be partially mitigated by adding impurities that cause lattice distortion and impede the migration of Cu ions in β-Cu2Se. However, current chemical doping is mainly achieved by the addition of transition metals (Fe [12], Mn [13], Ni [14], Ag [15]) or alkaline elements (Li [16], Na [17], K [18], Mg [19]) instead of Cu, or halogens or sulfur elements (I [20], Cl [21], S [22], Te [23]) instead of Se regulate the thermoelectric properties of Cu2Se to optimize the thermoelectric properties of Cu2Se. This paper proposes three basic principles for stabilizing cation (Cu+) for Cu2Se series materials with “phonon liquid–electron crystal” structure based on the mechanism of stabilizing zirconia: (1) The formed Se compound forms a solid solution with β-Cu2Se, maintaining the inherent structure in various compositions and temperatures, with no crystal transformation (or very slow transformation). (2) The metal ion radius and Cu+ radius are similar, with the difference between them not more than 12%. (3) The Mn–Se bond is more ionizing than that of Cu2Se, which has less electronegativity than Cu+. Elements in the periodic table with less electronegativity are selected. Then elements with less than a 12% difference between the ionic radius and Cu+ are selected from the elements with less electronegativity according to the periodic table of ionic radius. On this basis, through the binary and ternary phase diagrams, the solid solution characteristics with β-Cu2Se are determined, and the elements meeting the above three requirements are identified as the candidate elements for stabilizer doping. Mn meets the above three requirements and the relevant parameters of the doping element Mn are shown in Table 1.
The atomic radius of Mn (1.32 Å) is approximately equal to the atomic radius of Cu (1.28 Å), the covalent radius of Mn and Cu are the same, and the ionic radius of Mn2+ (0.67 Å) is smaller than that of Cu+ (0.77 Å). Therefore, as a dopant, Mn is easily dissolved into the structure of Cu2Se. The electronegativity of Mn (1.55 eV) is less than that of Cu (1.90 eV). Theoretically, manganese VIIB has a strong reducing ability, and losing electrons to become manganese ions is more accessible. Mn has a higher valence state (+2, +3, +4, +6, +7) than copper (+1, +2), which is compatible with the idea of doping stable Cu ions with Mn. However, if Mn occupies the Cu position because Mn2+ loses more extranuclear electrons than Cu+, it increases the electron concentration and thus increases the conductivity. When Mn is doped as a cation, Li Wen [26] et al. showed that Mn doping in SnTe not only adjusted the band structure but also reduced the lattice thermal conductivity, resulting in the alloy form reaching a record zT~1.3 at 900 K. Sayan Das [27] et al. investigated the thermoelectric properties of Mn-doped BiCuSeO and found that Mn2+ was introduced at the Bi3+ site to increase the hole concentration and Seebeck coefficient through heterovalent doping and incorporation of magnetic impurities. The highest power factor of 0.284 mW m−1 K−2 with zT of 0.4 was obtained with Bi0.92Mn0.08CuSeO at 773 K. Xiang Siqi [28] et al. used Mn doping and S evaporation to improve cuprous sulfide thermoelectric materials’ thermoelectric properties and thermal stability.
In this study, Cu2−xMnxSe (x = 0, 0.02, 0.04, 0.06) samples were synthesized by the melting–annealing and SPS methods. With the increase in Mn, the formation of the β-Cu2Se phase is promoted, the diffraction peak shifts to a large angle, and the grain size decreases. The resulting PF value of Cu1.94Mn0.06Se at 873 K was 1.62 mW m−1 K−2, which is 1.2 times higher than that of Cu2Se without Mn at 873 K. Because Mn doping introduces electrons, its bipolar diffusion thermal conductivity significantly increases, resulting in no low thermal conductivity, so Mn-doped samples do not achieve a high zT value. According to the results of four cycles, the doped Mn samples show excellent thermal and chemical stability.

2. Experiment

2.1. Fabrication

Polycrystalline samples with nominal compositions of Cu2−xMnxSe (x = 0, 0.02, 0.04 and 0.06) were fabricated by a vacuum melting–annealing method and SPS technology. The starting materials (Cu (powder, 99.99%), Se (powder, 99.99%), Mn (powder, 99.99%)) were weighed as per the nominal composition Cu2−xMnxSe, thoroughly ground, mixed and cold-pressed in an argon glove box, then loaded into graphite crucibles that were sealed in a fused silica tube under vacuum. The sealed glass tube was placed in the melting furnace, heated to 470 °C at the speed of 10 °C/min, held at 470 °C for 10 h, then heated to 1200 °C at the speed of 10 °C/min, held and melted at 1200 °C for 24 h, and then cooled to 600 °C at the speed of 1 °C/min for 5 days, and finally cooled to room temperature with the furnace. The frit of the desired compound was obtained by cracking the glass tube. After grinding the molten sample into powder, the graphite mold with an inner diameter of 20 mm was sintered in the discharge plasma sintering furnace, and a dense cylindrical block material was obtained. The process parameters of the sintering process are as follows: the average heating rate was 40 °C/min, the sintering temperature was 620 °C, the sintering pressure was 45 MPa, and the heat preservation was 10 min (see Figure 1).

2.2. Testing and Characterization

The phase structures of the samples were determined by X-ray diffraction (XRD, Rigaku/SmartLab 3 KW diffractometer Cu-Kα). In order to obtain the cell parameters and other crystal structure information of Cu2Se, Rietveld structure refinement was performed on the XRD data for the samples sintered at different temperatures. The microstructure was studied by field emission scanning electron microscopy (FESEM, ZEISS MERLIN Compact, Jena, Germany) and high-resolution transmission electron microscopy (Magellan-400, HRTEM, Titan Themis Z, Thermo Fisher Scientific, Waltham, MA, USA). X-ray photoelectron spectroscopy (XPS, Escalab 250Xi, Thermo Fisher Scientific, USA) was used for analysis of the chemical binding states of the elements. The Seebeck coefficient and electrical conductivity from 303 K to 873 K were measured on a thermoelectric measurement system using (ZEM-3, Ulvac-Riko, Yokohama, Japan). The total thermal conductivity (κ) of all the samples was calculated according to the relationship κ = DCpρ, where D is the thermal diffusivity measured by the laser flash analysis (LFA) method (LFA 467; Netzsch, Selb, Germany), Cp is the specific heat capacity measured by the LFA method, where a pellet of graphite was used as a reference for Cp determination, and ρ is the sample density determined using the Archimedes method. The Hall coefficient (RH) at 303 K and 473 K was measured using a physical properties measurement system (PPMS-9, Quantum Design, San Diego, CA, USA) with a magnetic field from −3 to 3 T. The Hall carrier concentration (nH) was calculated using nH = 1/(RHe), where e is the elementary charge. Hall carrier mobility (μH) was calculated according to the relation μH = RHσ. The phase transition process was determined by differential scanning calorimeter (DSC, Netzsch, Selb, Germany) under the following conditions: in a nitrogen atmosphere, the rate of temperature rise was 10 °C/min, and the temperature rose from room temperature to 500 °C.

3. Results and Discussion

3.1. Crystal Structure Analysis

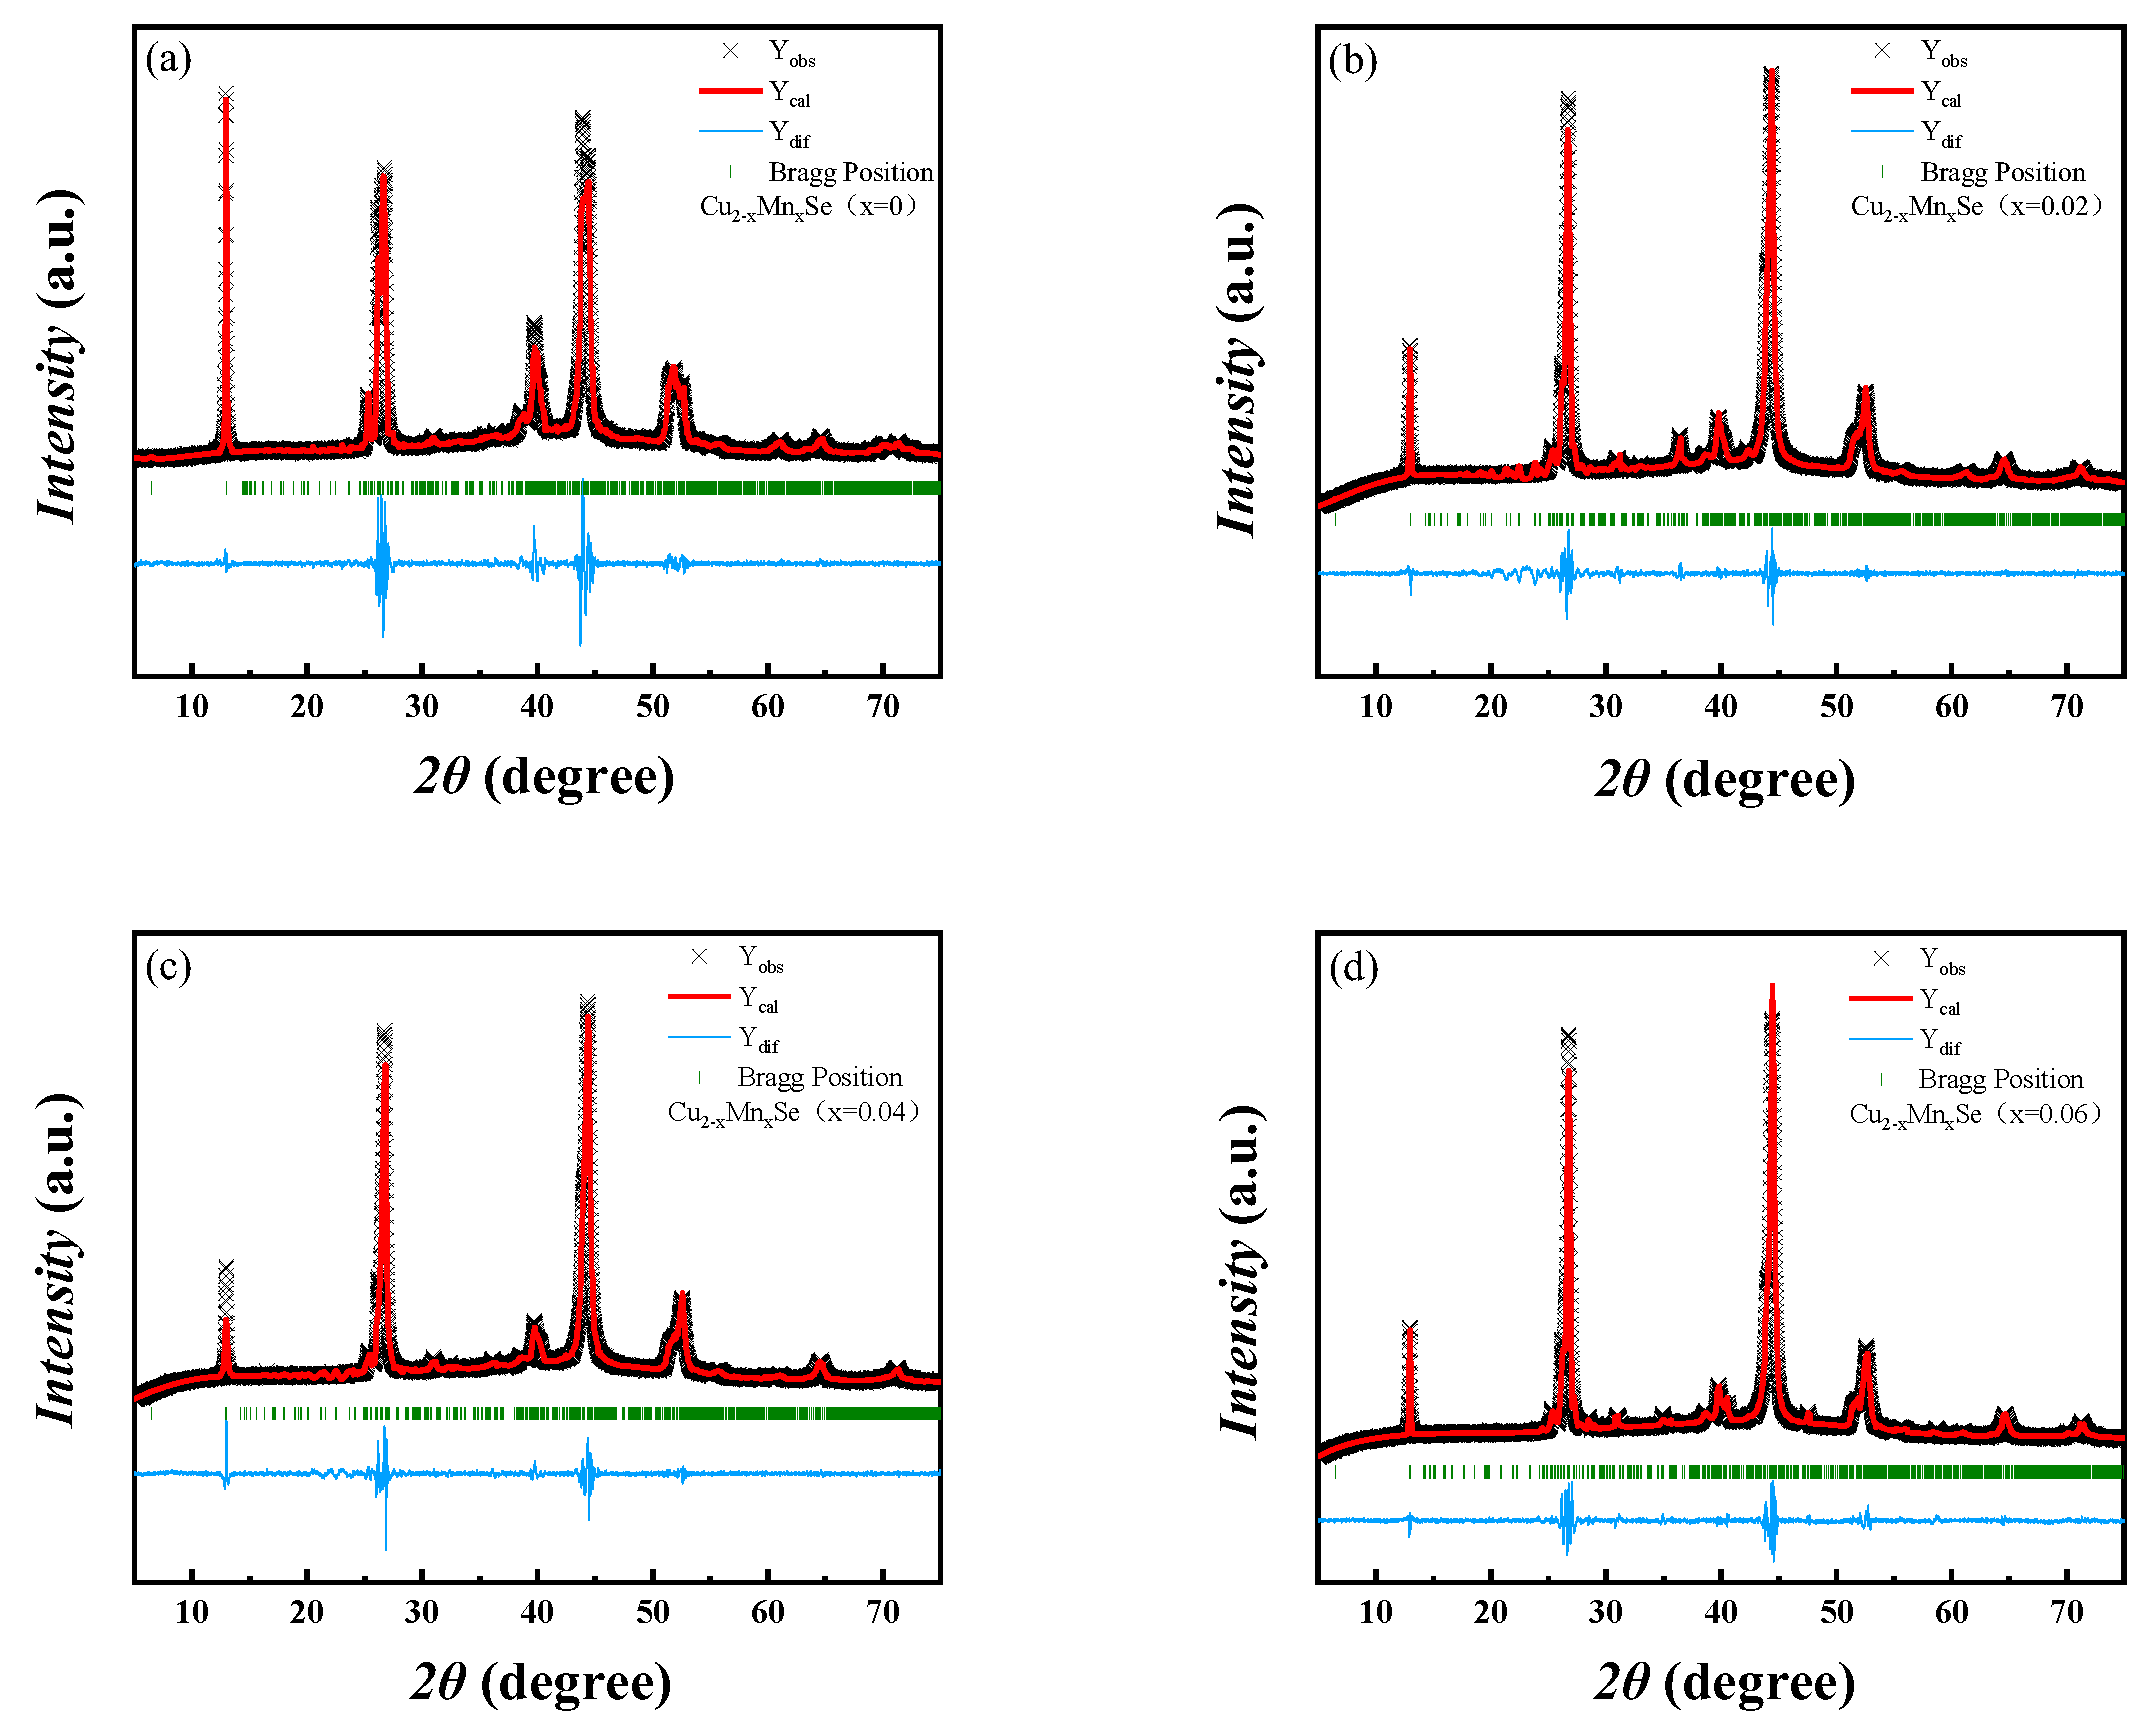
Figure 2a shows the XRD pattern of Cu2−xMnxSe (x = 0, 0.02, 0.04, 0.06) measured at room temperature. The XRD diffraction peaks coincide with α-phase monoclinic Cu2Se (PDF#47-1448) (a = 13.807, b = 20.393, c = 3.923 A) and β-phase Cu2Se (PDF#71-0044) (a = b = c = 5.76 A). The diffraction peak intensities of α-Cu2Se phase (250) and (211) gradually decrease with the increase in Mn content, while the diffraction peak intensity of β-Cu2Se phase (111) gradually increases in Figure 2b. The diffraction peak intensity of the α-Cu2Se phase (541) gradually decreases, while that of the β-Cu2Se phase (220) gradually increases in Figure 2c. The diffraction peak intensity of the α-Cu2Se phase (701) is significantly weakened, enhancing the diffraction peak intensity of the β-Cu2Se phase (311). The increase in Mn content induces the advancement of the phase transition from α-Cu2Se to the β-Cu2Se phase structure, consistent with other reports in the literature [21]. The composition and phase structure of the synthesized sample can be well controlled through Mn blending and vacuum melting–annealing combined with SPS sintering. The β-Cu2Se phase can be stabilized with increased Mn. With an increase in Mn, the 2θ angles of the (111), (220), and (311) crystal faces of Cu2−xMnxSe are prominent at 26.74°, 44.38°, 52.53°, respectively, and the diffraction peak is shifted to the right or at a large angle. According to the Bragg diffraction equation 2dsinθ = nλ, the cell parameters become smaller because the ionic radii of Cu+ and Mn2+ are 0.77 Å and 0.67 Å, respectively, the ionic radius of Mn2+ is smaller than that of Cu+. As the lattice of solid solution doped Mn decreases, the crystal plane spacing decreases, the diffraction angle 2θ increases, and the diffraction angle shifts to a large angle. The (220) and (311) plane diffraction peaks slightly shift in the direction of large angles compared with the standard card. Figure 3 shows the differential scanning calorimetry (DSC) map of Cu2−xMnxSe (x = 0, 0.02, 0.04, 0.06). With the increase in Mn doping concentration, the heat absorption peak moves to a lower temperature, and the phase transition temperature decreases from 400.1 K to 390.3 K. It was also shown that Mn doping directly affects the phase transition characteristics. As Mn doping concentration increases, the phase transition temperature decreases, thereby changing from α-phase Cu2Se to β-phase Cu2Se in advance, which is consistent with the results of XRD. Further, all the XRD patterns were refined and calculated based on the Rietveld refinement. The refinement results are shown in Figure 4, and all samples’ lattice constants and cell volumes were obtained, as shown in Table 2. The refinement results also confirm that compared with the pure Cu2Se sample without Mn, the cell volume decreased with the increase in Mn doping content.
Figure 5a shows the XPS measurement spectrum of the Cu1.94Mn0.06Se sample, which proves the existence of the Cu 2p, Se 3d, and Mn 2p energy states. As shown in the Cu 2p XPS spectrum in Figure 5b, the values of the peaks are 934.80 eV and 954.25 eV, which correspond to the respective binding energies of Cu 2p1/2 and Cu 2p1/2 of the Cu2Se lattice in the NIST XPS database, indicating the presence of Cu+. As shown in the Se 3d XPS spectrum in Figure 5c, this peak decomposes into two peaks of 54.3 eV and 55.05 eV, corresponding to the binding energies of Se 3d5/2 and 3d3/2 in the Cu2Se lattice, respectively, indicating that Se is in the −2 valence state. The peaks in Figure 5d are 641.35 eV and 649.5 eV, corresponding to the respective binding energies of Mn2p1/2 and 2p3/2 of the compound. Mn2p1/2 indicates the presence of Mn2+ ions, which Mn successfully dopes into the Cu2Se samples.

3.2. Micromorphology Characterization

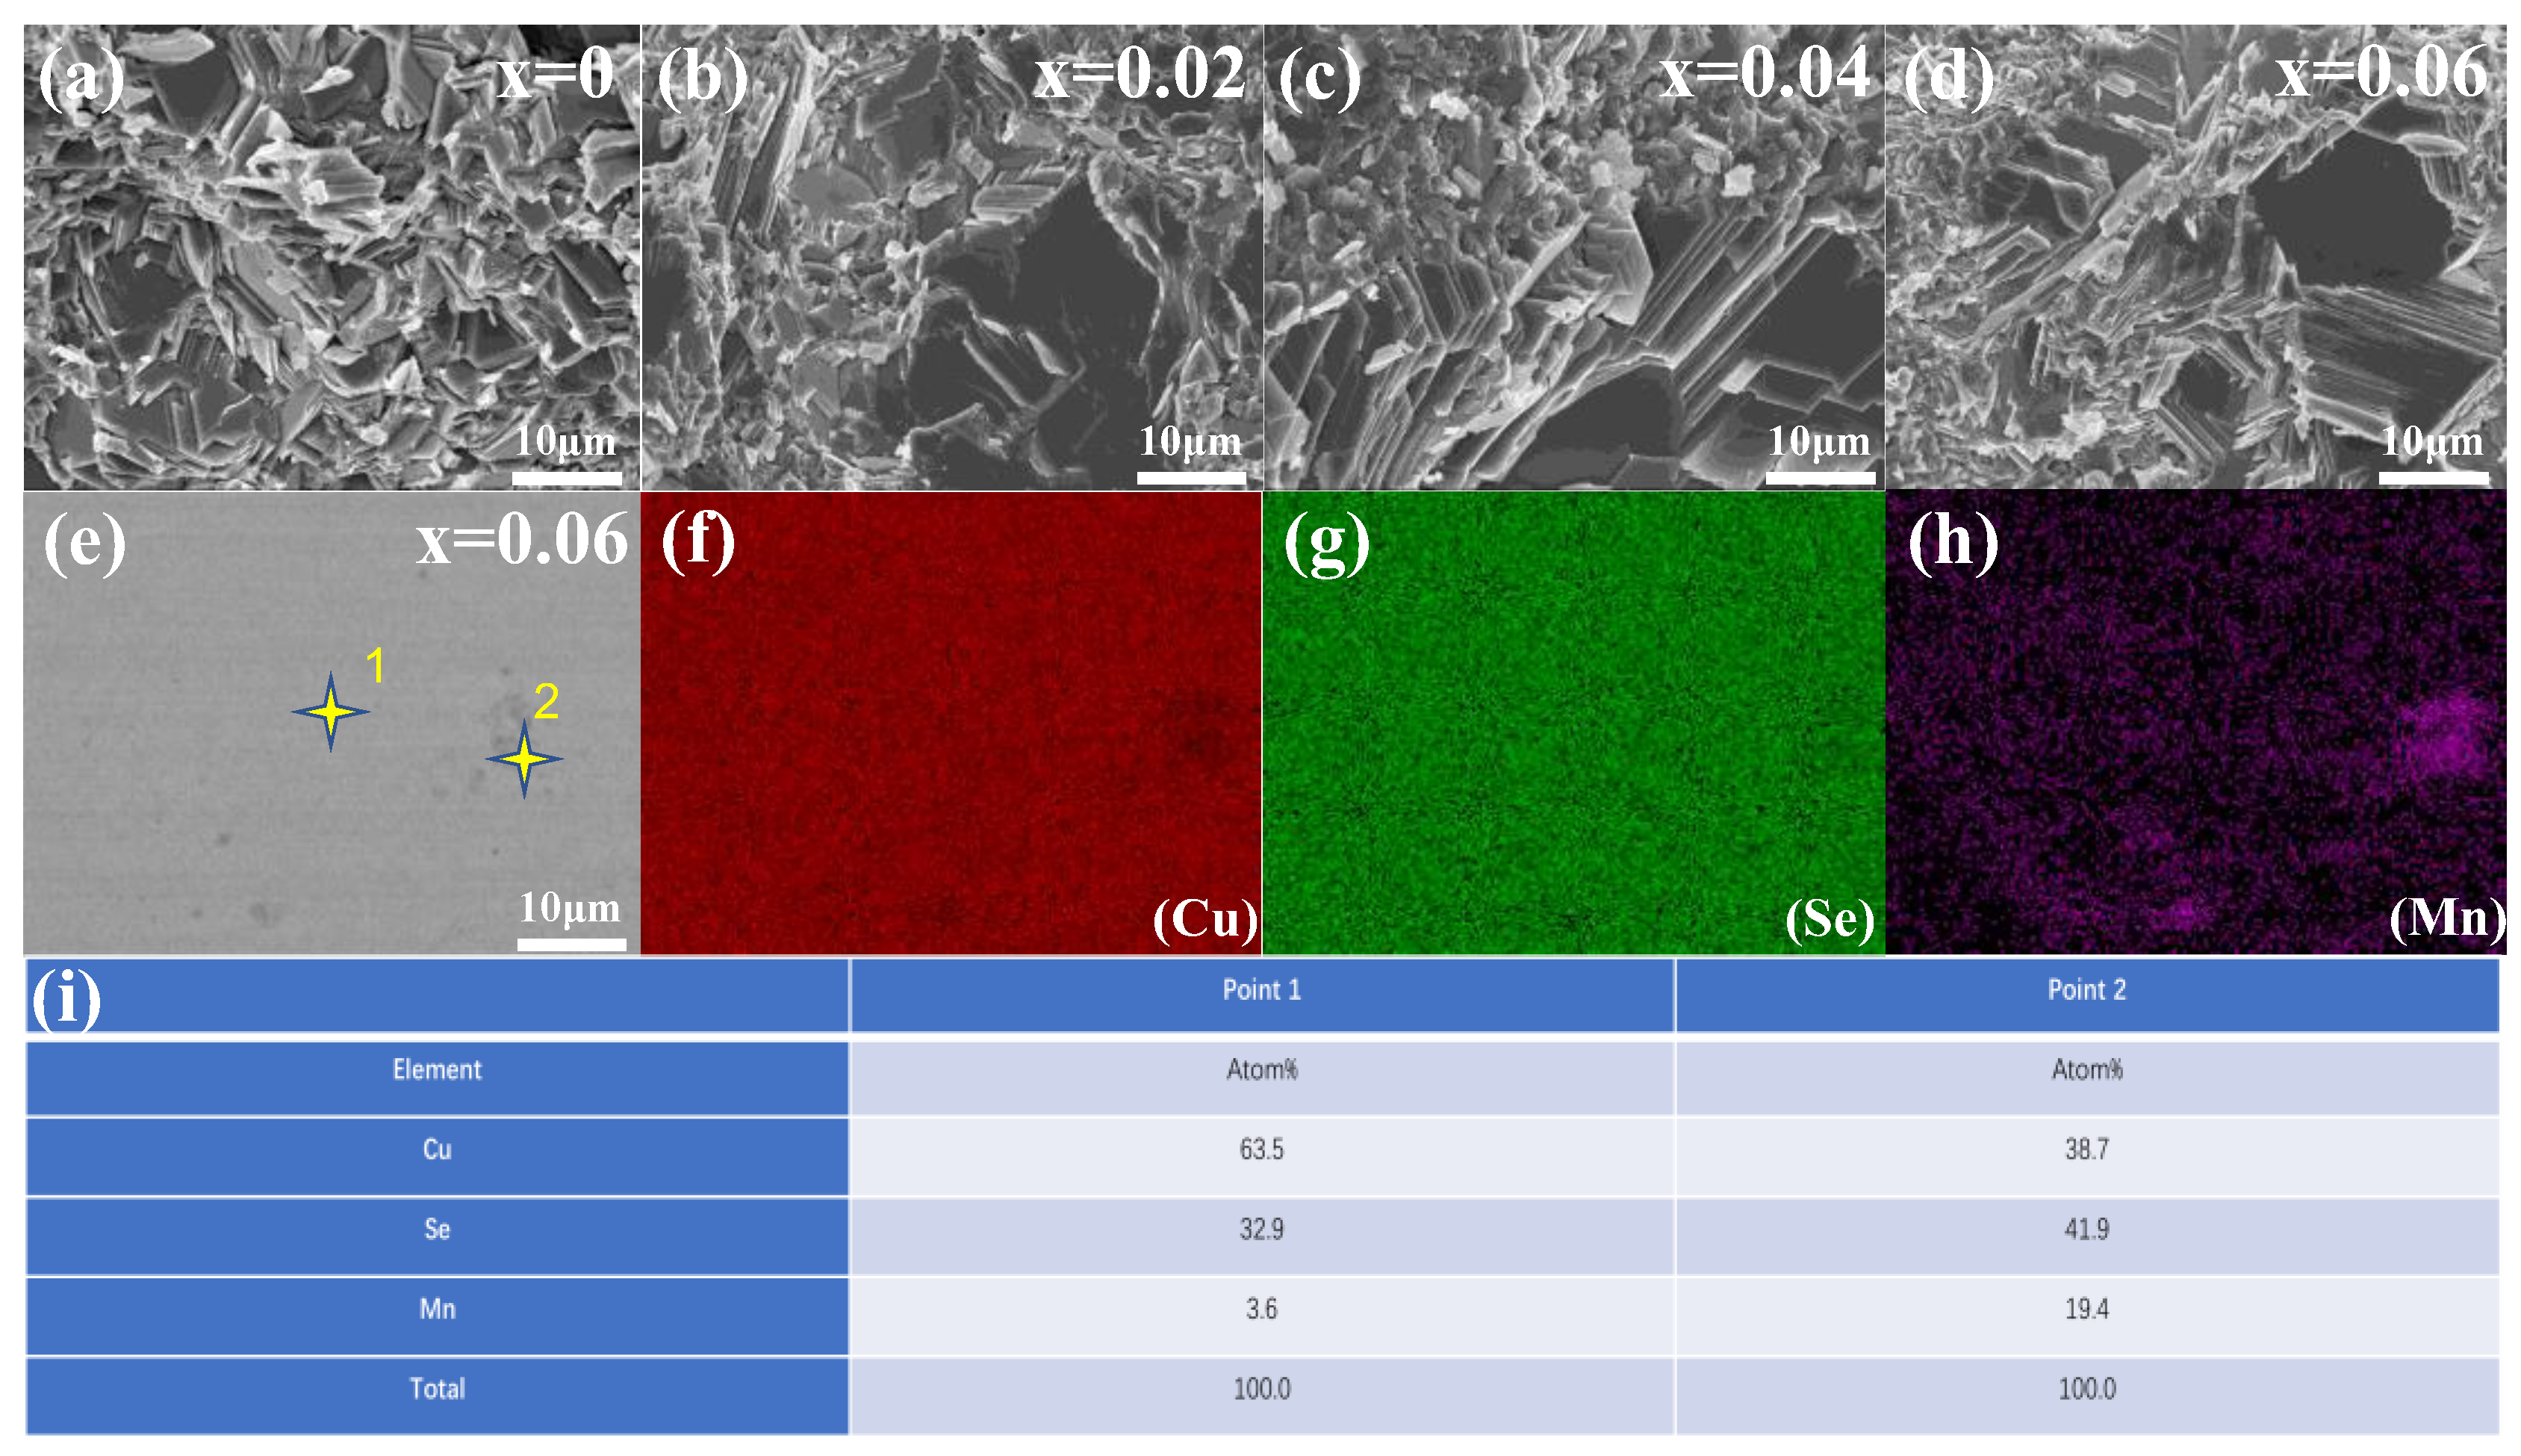
Figure 6 is the SEM diagram of the fracture of the sample. The sintered sample has a typical layered crystal structure, showing the characteristics of layer-by-layer stacking and grains with a fixed orientation, with apparent boundaries, and the appearance of all the samples is the same. In addition to the large flake crystals, there are many small particle wafers, and the size of these small particle wafers decreases with the increase in Mn content. Mn doping increases the melting point of Cu2Se, the degree of supercooling increases during the cooling process at the same rate, and the number of nucleations of Cu2Se per unit time increases. At the same time, due to the effect of the grain boundary, the difficulty of element diffusion or agglomeration growth increases, so the particle size reduces. Figure 6e–h show the SEM microscopic images of the polished Cu2−xMnxSe (x = 0.06) block samples and the corresponding EDS diagrams of Cu, Se, and Mn elements. Irregular dark precipitates ranging in size from submicron to micron are distributed in the Cu2Se matrix in Figure 6e. The concentrations of Mn in the light and dark regions of the EDS diagrams in Figure 6f–h indicates an uneven distribution of elements. The EDS data of the gray area (point 1) in Figure 6i shows a Cu-rich phase. The EDS data of the dark region (point 2) in Figure 6i shows a Mn-rich phase.
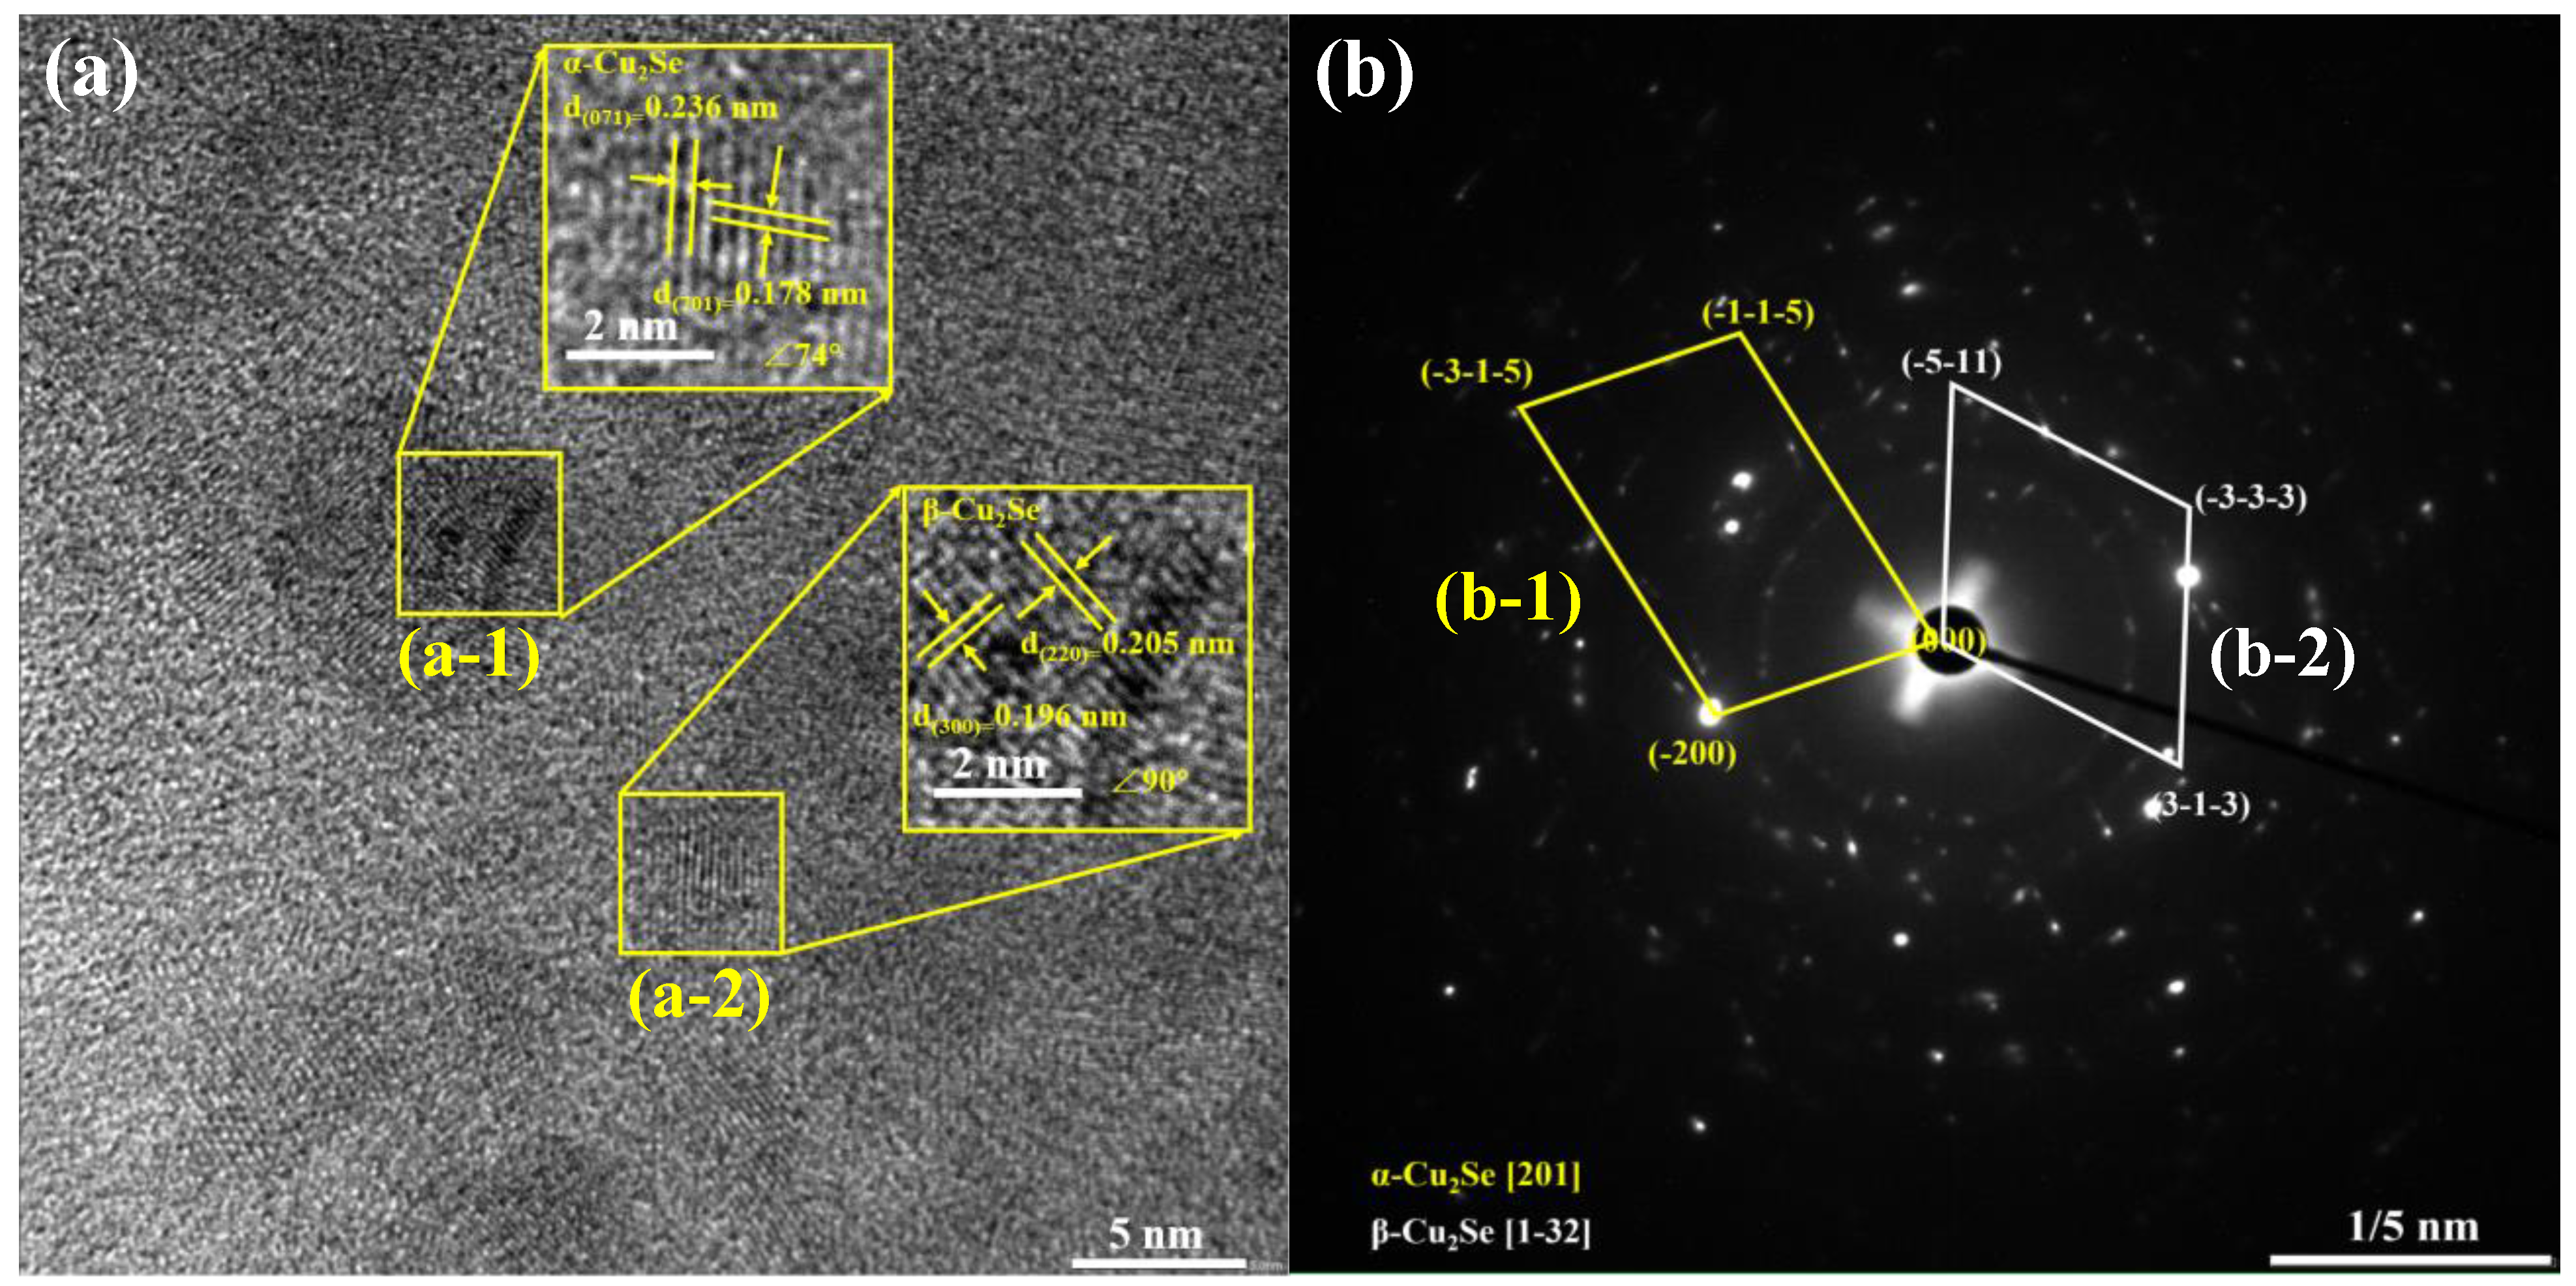
We obtained further high-resolution transmission electron microscopy (HRTEM) images of Cu2−xMnxSe (x = 0.06). The calculated lattice spacing is comparable to the theoretical crystal plane spacing in Figure 7a, which indicates that (a-1) is the (701) crystal face of α-Cu2Se (00-047-1448). The (220) crystal face of β-Cu2Se (01-071-0044) in (a-2) is consistent with the XRD results. Selected electron diffraction (SAED) images of the Cu1.94Mn0.06Se sample are shown in Figure 7b. The diffraction point in Figure 7(b-1) well matches the [201] region axis of the α-phase monoclinic Cu2Se phase, and the diffraction point in Figure 7(b-2) well matches with the [1-32] region axis of the β-phase cubic Cu2Se phase. In the region indicated by a red circle in Figure 7a, the color difference of different micro-regions is likely caused by component segregation. The region has an irregular shape and a size of 5–10 nm. The lattice dislocations and fringes marked by yellow boxes could effectively scatter phonons and reduce lattice thermal conductivity.

3.3. Thermoelectric Performance Discussion

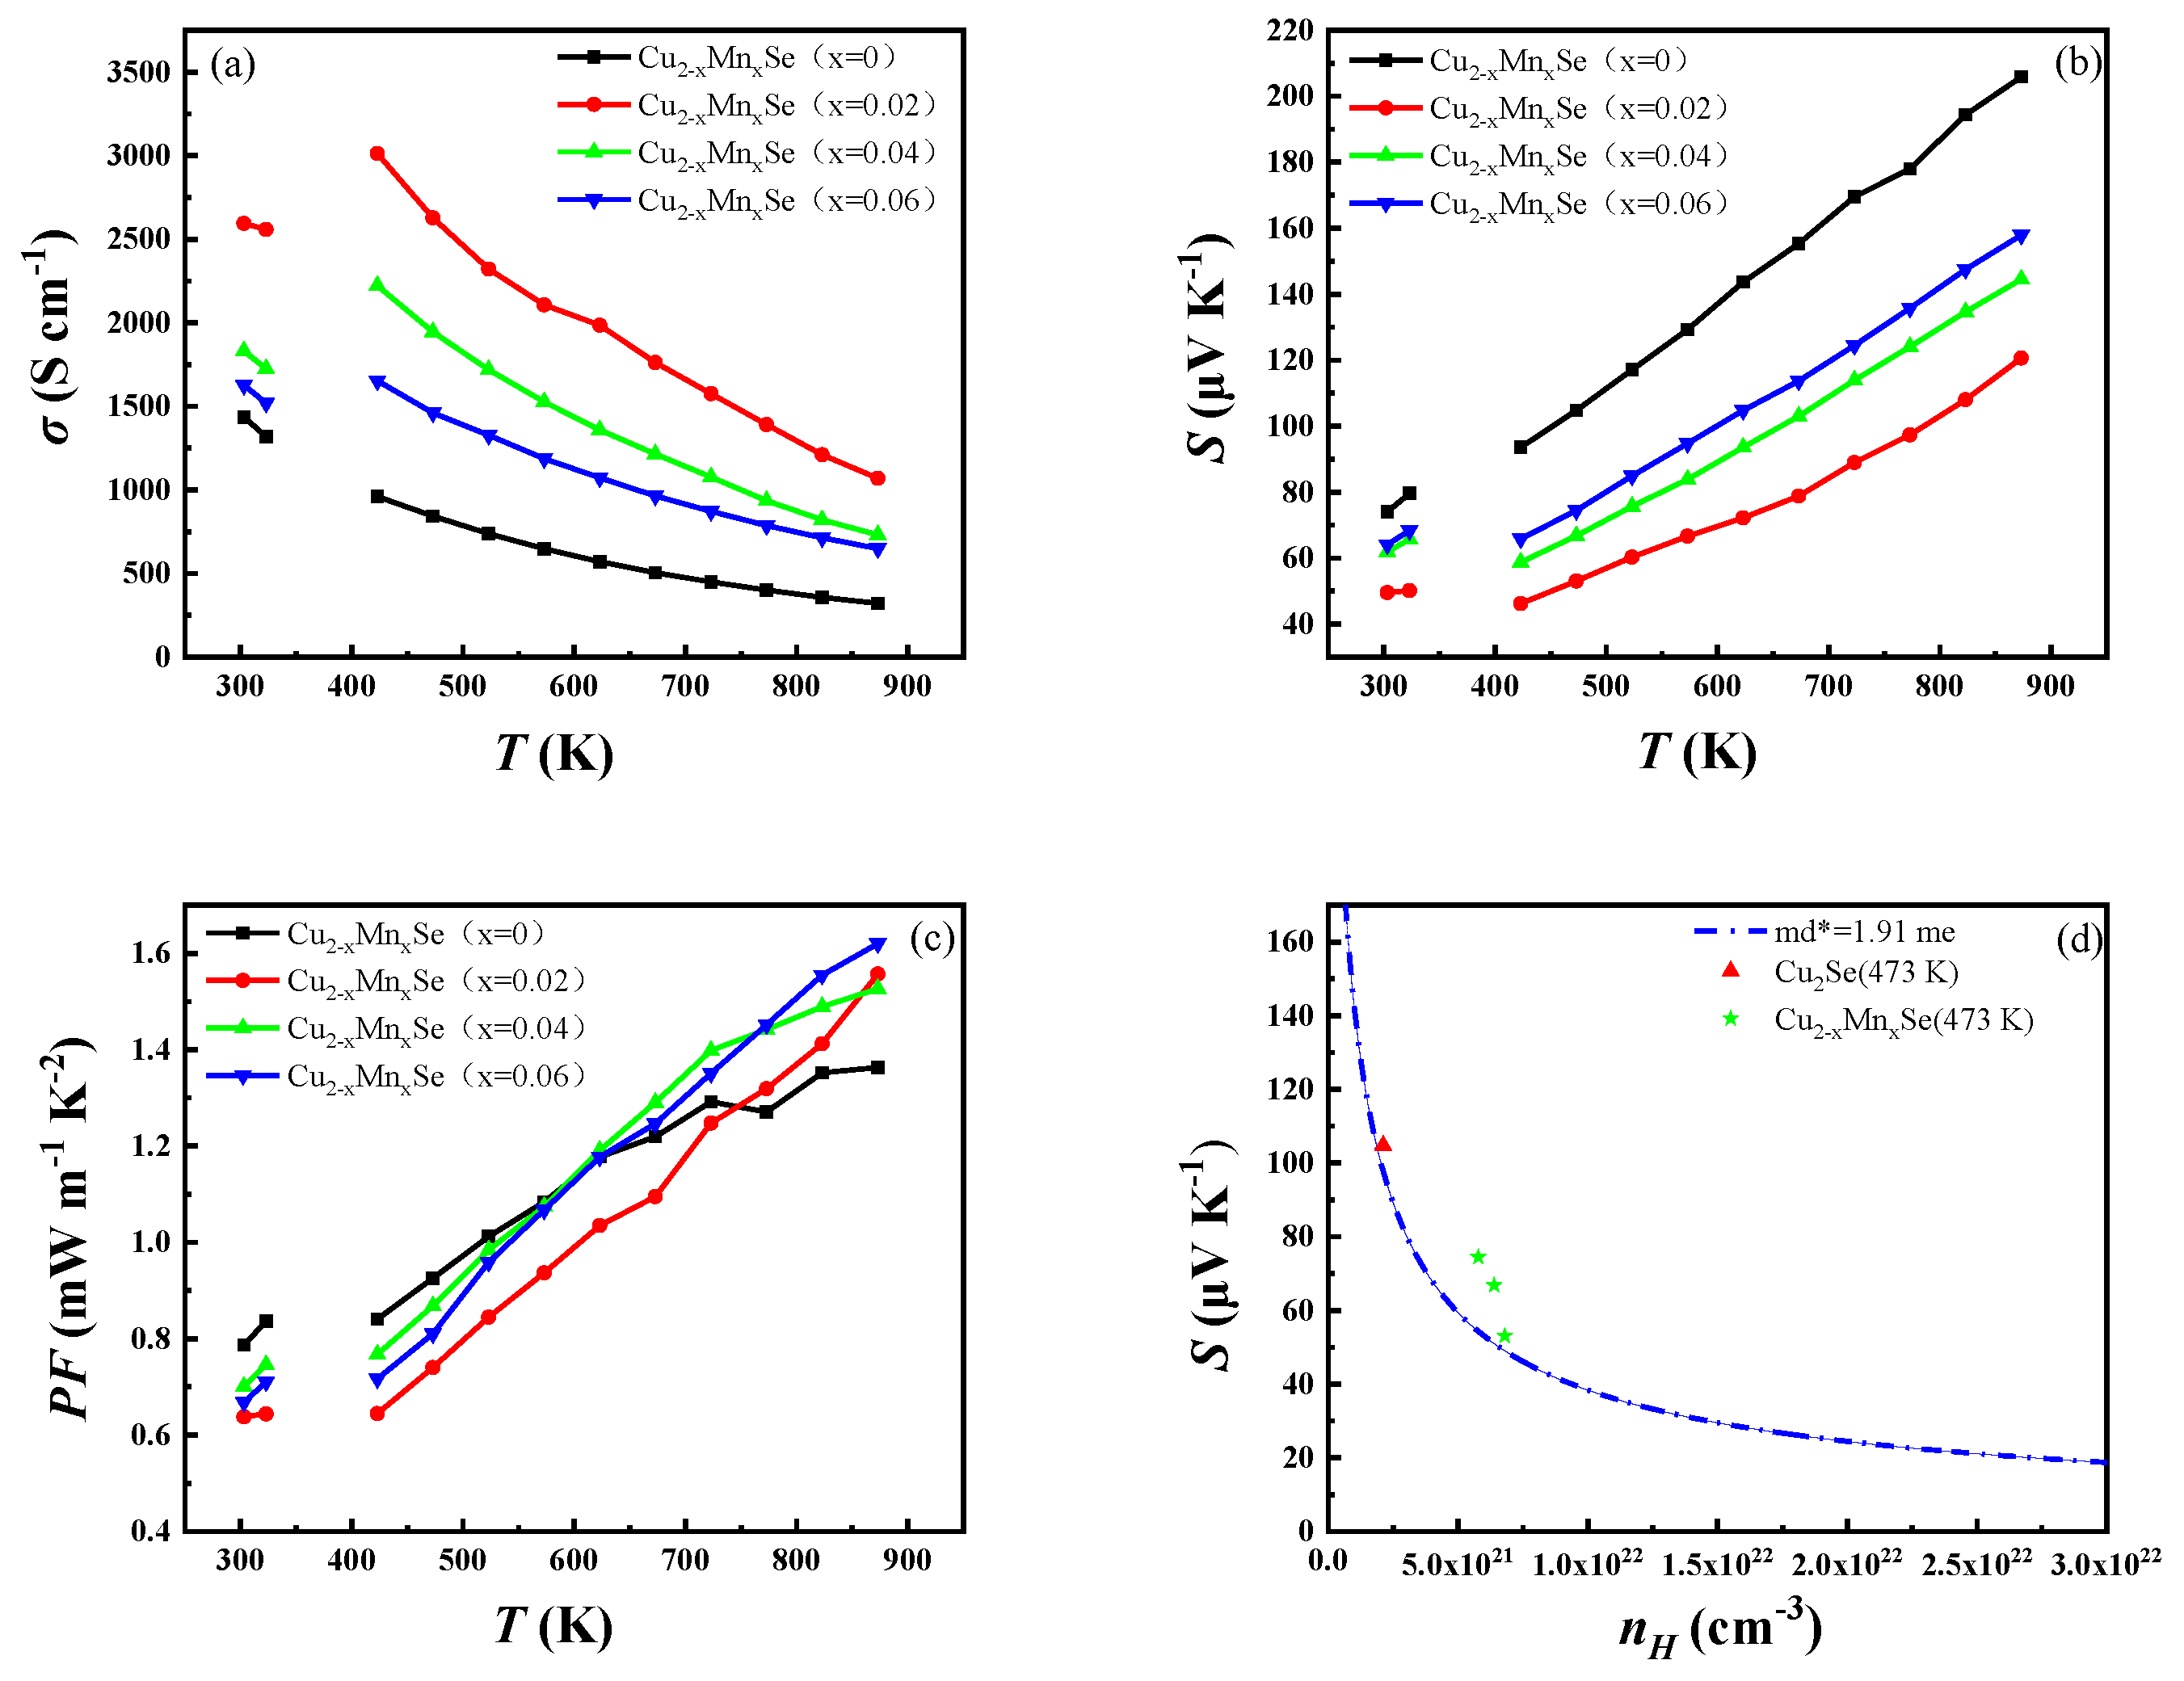
The compound’s electrical properties and temperature changes are shown in Figure 6a–d. The TE properties of β-Cu2Se after the phase transition are analyzed in detail because of the discontinuity of the phase transition around 400 K. The electrical conductivity of the doped sample, like that of the matrix, gradually decreases with the increase in temperature, showing typical degenerate semiconductor characteristics in Figure 8a. Meanwhile, the electrical conductivity of the doped sample is higher than that of the pure phase Cu2Se within the measured temperature range, increasing first with the increase in the impurity content, reaching the maximum value at x = 0.02 and then decreasing. For example, the conductivity at 473 K increases from ~843.1 μV K−1 for the x = 0 sample to ~2627.8 μV K−1 for the x = 0.02 sample, ~1945.5 μV K−1 for the x = 0.04 sample, and ~1461.5 μV K−1 for the x = 0.06 sample. Doped Mn occupies the Cu position, Mn2+ loses more extranuclear electrons than Cu+, or Mn has more extranuclear electrons than Cu, destroying the original charge balance. Each doped or dissolved Mn atom gains one electron, and Mn doping increases the carrier concentration of Cu2Se, thereby increasing its conductivity. With the increase in Mn doping, the relative increase in β-Cu2Se decreases the carrier concentration and the conductivity of Cu2Se. As shown in Figure 8b, the Seebeck coefficients of all the samples are positive throughout the test temperature range, indicating that the holes were the leading carriers. The Seebeck coefficient is opposite to the conductivity, and the Seebeck coefficient of the sample shows a temperature and doping concentration dependence opposite to the conductivity. The Seebeck coefficient increases with the increase in test temperature. With the increase in doping concentration, the Seebeck coefficient of the sample first decreases, reaches the minimum value at x = 0.02 and then increases. The Seebeck coefficient of all doped samples is smaller than that of the pure samples. For example, the Seebeck coefficient decreases from ~104.8 s cm−1 for the x = 0 sample to ~53.1 s cm−1 for the x = 0.02 sample at 473 K and then increases to ~66.8 s cm−1 for the x = 0.04 sample and ~74.5 s cm−1 for the x = 0.06 sample.
The power factor values in Figure 8c are calculated according to the formula PF = S2σ. The room temperature PF of the Cu2−xMnxSe solid solution ranges from 0.63 to 0.74 mW m−1 K−2, which is significantly lower than that of Cu2Se. However, the PF significantly improves with the increase in temperature. The solid solution doped with the Mn element is higher than the Cu2Se sample at the same temperature at 773 K. The significant increase in σ compensating is attributed to decreased S and improved PF at higher doping levels. Finally, PF reaches the highest value of 1.62 mW m−1 K−2 for Cu1.94Mn0.06Se. As shown in Figure 8d, the Pisarenko line (dependent on the S and carrier concentration) of pure phase Cu2Se (blue line) with a temperature of 473 K is calculated based on the SPB model. The calculated results are in good agreement with the measured carrier concentration. In contrast, Mn-doped sample (solid green five-pointed star points) is above the Pisarenko line and close to the pure phase curve. The single band model explains the thermoelectric properties of Cu2Se doped with Mn. After the phase transition (473 K), the effective mass md* values of the samples doped with x = 0, x = 0.02, x = 0.04, and x = 0.06 Mn are 1.91, 2.32, 2.79 and 2.82me, respectively. The effective mass increases with the increase in doping concentration.
S = k B e [ r + 5 2 F r + 3 / 2 η r + 3 2 F r + 1 / 2 η η ]
n = ( 2 m * k B T ) 3 / 2 3 π 2 3 r + 3 / 2 2 F r + 1 / 2 2 η 2 r + 3 / 2 F 2 R + = 1 / 2 η
F j η = 0 ξ j d ξ 1 + E x p ( ξ η )
where kB is the Boltzmann constant, e is the electronic charge, ħ is the reduced Planck constant, η is the reduced Fermi level, md* is the density of a state’s effective mass, and Fj(η) is the jth Fermi integral.
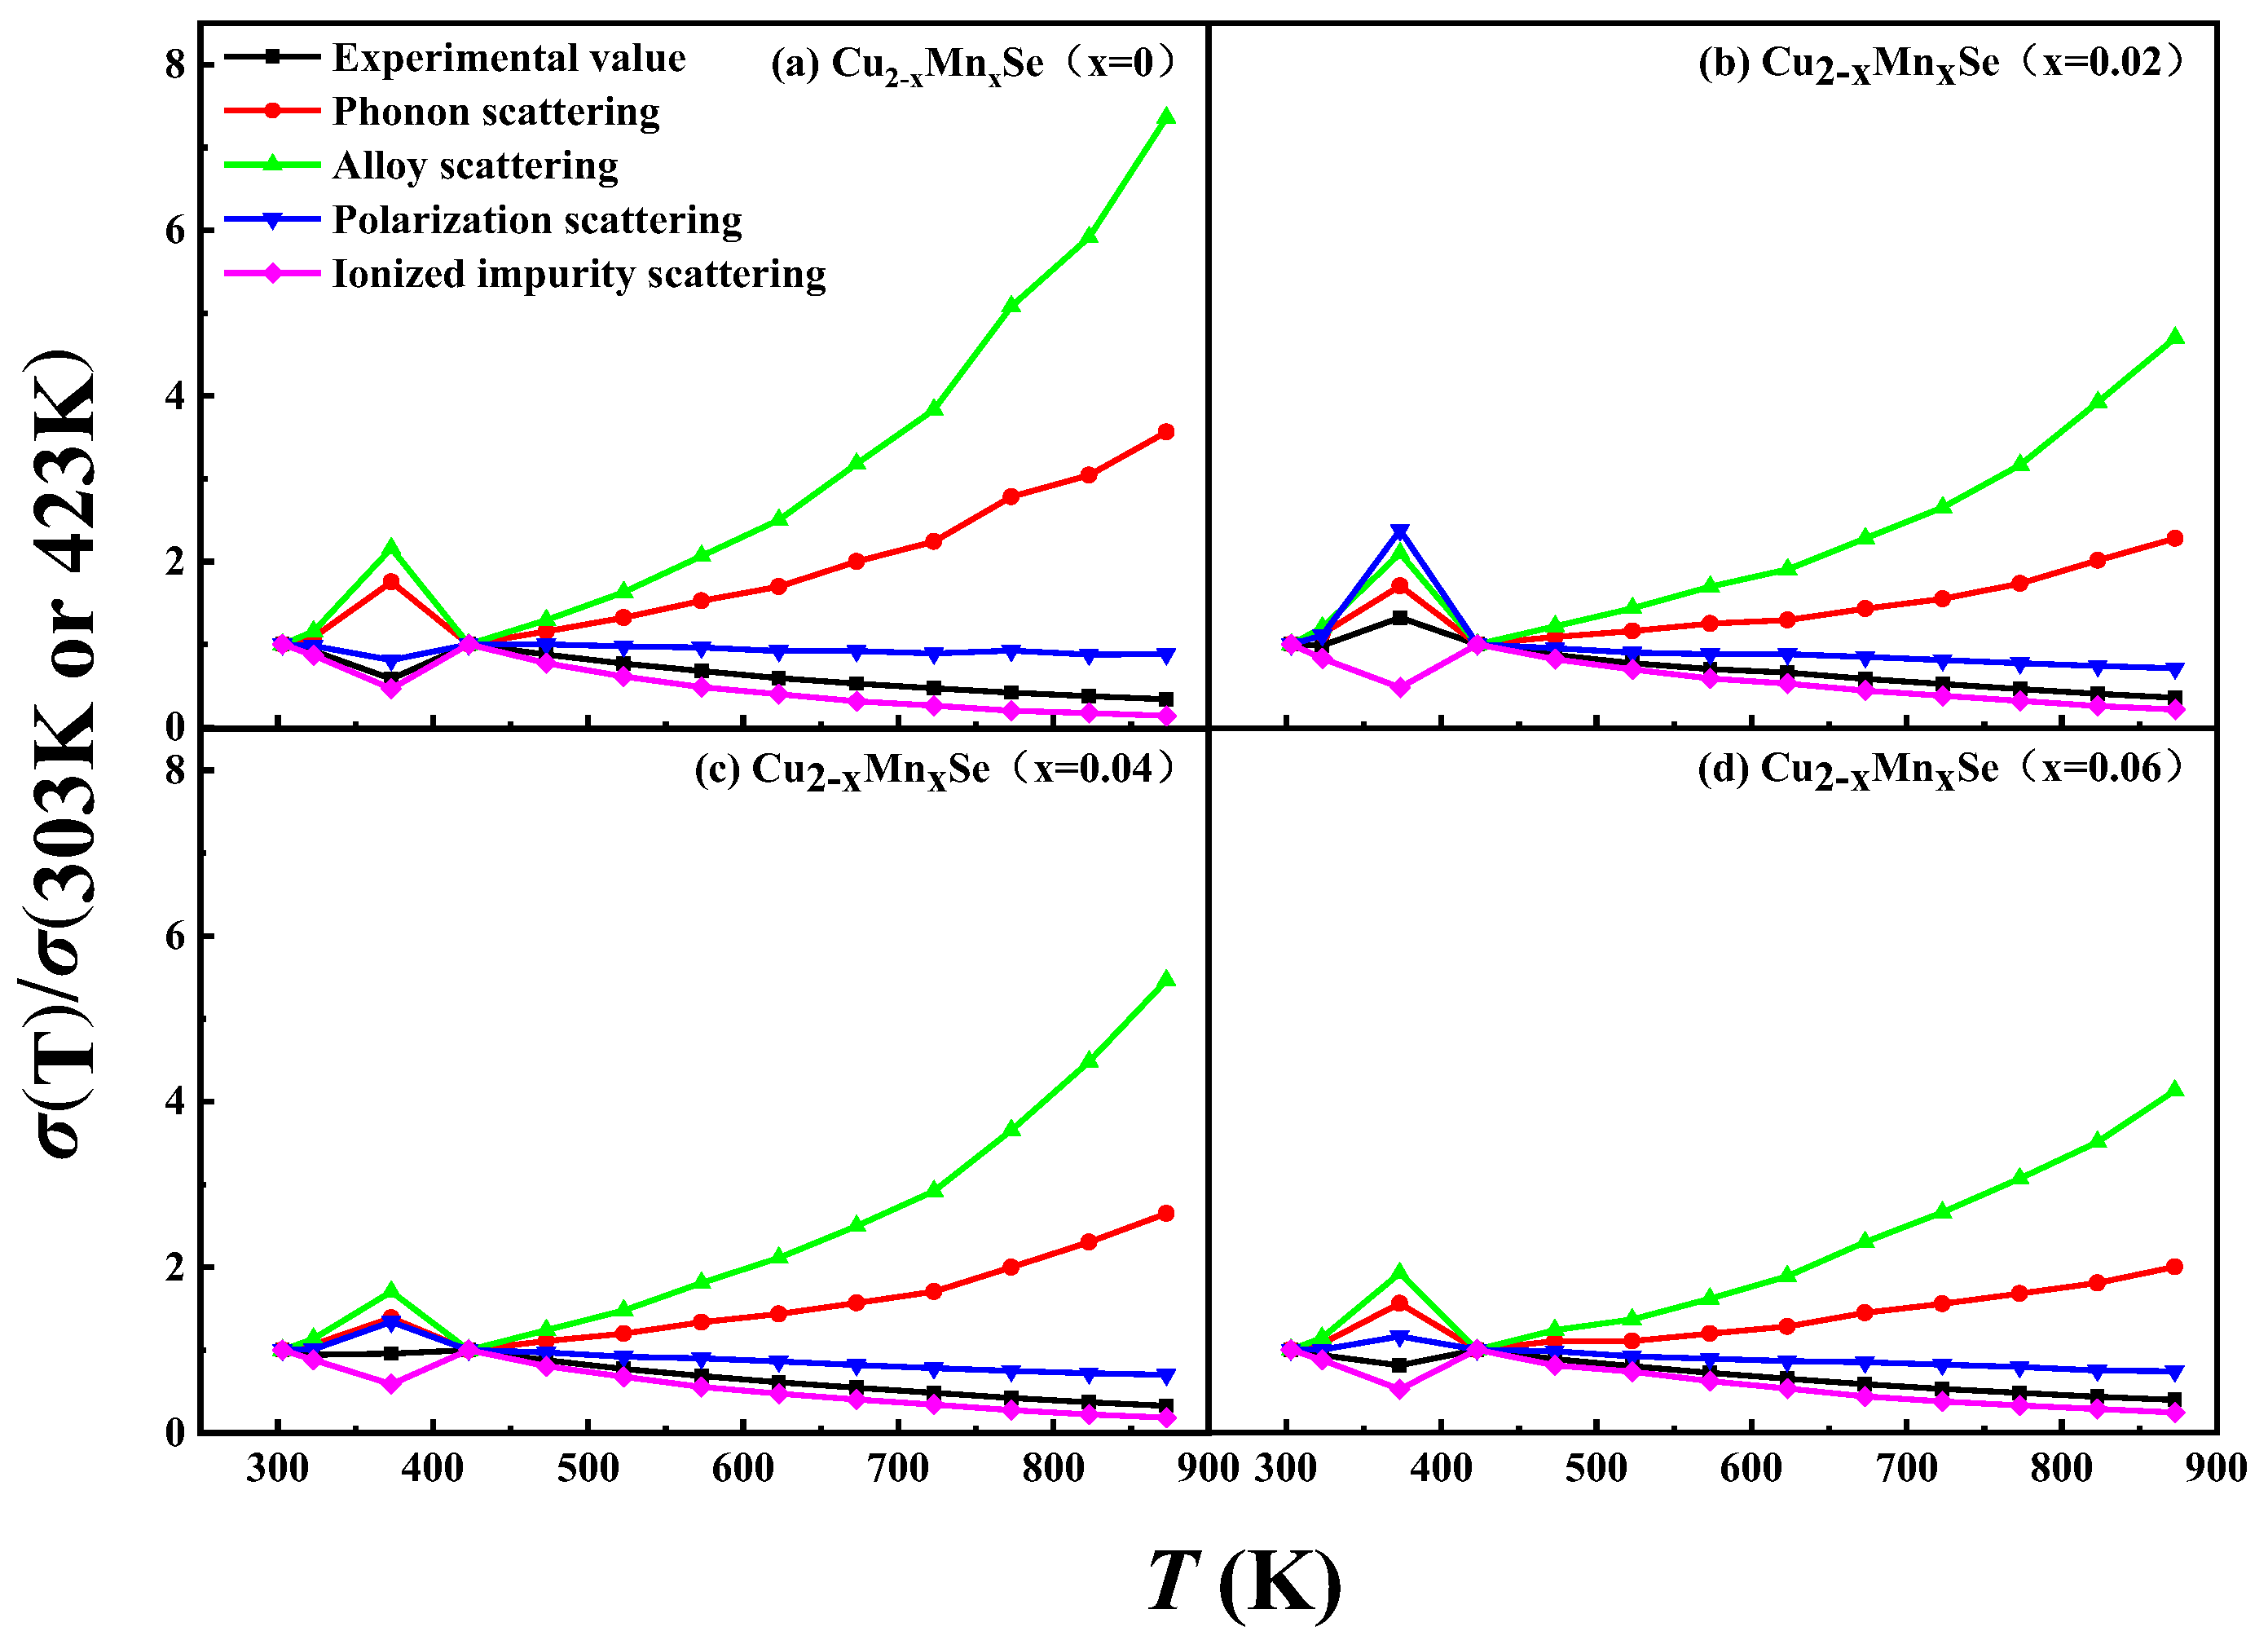
Based on the single band model, the carrier scattering mechanisms of the samples were analyzed by the electrical conductivity ratio method [29], according to Equations (4)–(7) in Table 3, and the results are shown in Figure 9. The electrical conductivity ratios (σ(T)/σ(T0) of ionized impurity scattering in the test temperature range (303–873 K) for all samples were closest to the experimental values. Therefore, ionized impurity scattering was predominant, and the scattering factor (r) was 3/2. This is one of the reasons why Cu2Se had a high Seebeck coefficient.
To analyze the mechanism of the temperature dependency of electrical conductivity and the Seebeck coefficient, the temperature dependences of the reduced Fermi level (η = EF/kBT), carrier concentration (n), carrier mobility (μ), and effective mass (m*/m0*) of the samples were calculated according to Equations (8)–(12), based on the test results of the electrical conductivities, Seebeck coefficients, and carrier concentrations. The results are illustrated in Figure 10.
E F = ± π 2 3 k B 2 T ( r + 3 2 ) e S ±
( m * ) 1 / 2 = 3 σ h 3 e 2 16 2 π τ 0 E F r + 3 2
τ 0 = 3 σ h 3 16 π 2 e 2 ( m * ) 1 / 2 E F r + 3 2
n = π 3 ( 8 m * E F ) 3 / 2 h 3
μ = e ( m * ) 1 τ 0 E F s
where σ is the conductivity, kB is the Boltzmann constant, T is the temperature in Kelvin, e is the electron charge, τ0 is the constant, m* (DOS) is the effective mass, EF is the Fermi level, r is the scattering factor, and h is Planck’s constant.
It can be seen in Figure 10a that each sample’s reduced Fermi level is much higher than 3. Therefore, it is reasonable to select the degenerate calculation model. The reduced Fermi level decreases with the increase in test temperature, indicating that the degree of degeneracy decreases. However, it increases with Mn doping, indicating that it will increase its degeneracy and carrier concentration. The effective mass of the state density of the carrier presents the complete opposite change rule to that of mobility in Figure 10b. It decreases with the increase in temperature and increases with the increase in Mn doping amount. According to the single parabolic band model, under the scattering condition of ionized impurities, the effective mass of the state density m*, conductivity and Fermi level follow the relationship shown in Equation (13):
( m * ) 1 2 = 3 σ h 3 16 2 π e 2 τ 0 E F 3
m* is directly proportional to the conductivity and inversely proportional to the Fermi level. According to Figure 10a, the conductivity of each sample decreases rapidly with the increase in temperature, while its EF increases slightly with the increase in temperature. This shows that Mn doping can improve the effective mass of carrier state density, which is conducive to increasing the Seebeck coefficient of Cu2Se. However, as mentioned before, Mn doping causes an increase in the carrier concentration, especially the concentration of a few carriers, so the amount of Mn doping is crucial. It can be seen in Figure 10c that the carrier mobility increases with the increase in temperature, which is reflected in the scattering of ionized impurities. This result is consistent with the carrier scattering mechanism analysis results based on the conductivity ratio method mentioned above. With the increase in Mn concentration, the mobility of the sample decreases. On the one hand, the alloy scattering increases. On the other hand, the grain boundary and impurity scattering to the carrier increase. As shown in Figure 10d, the carrier concentration decreases with the increase in test temperature, which is mainly caused by the decrease in Cu+ vacancies with the increase in temperature, and a defect reaction occurs, as shown in Equation (14):
C u s u r f a c e + V C u + h = C u C u
The carrier concentration of the doped sample is higher than that of the pure sample in the whole test temperature range. With the increase in doping, the carrier concentration first increases, reaches the maximum at x = 0.02 and then decreases. Because the ionic radius of Mn2+ is smaller than that of Cu+, doping Mn can occupy not only the Cu vacancy but also the lattice site of Cu, resulting in defect reaction Equations (15) and (16), respectively. Mn2+ loses more extranuclear electrons than Cu+, or Mn has more extranuclear electrons than Cu, destroying the original charge balance. The result is that each Mn atom doped or dissolved produces one electron. Equation (15) does not reduce the carrier concentration, and Equation (16) increases the carrier concentration, so Mn doping increases the carrier concentration of Cu2Se, and thus increases its conductivity.
Mn + V’Cu+ + h →Mn˙Cu+ + e (x − y > 0)
xMn + Cu2−xSe → xMn˙Cu+ + (2 − x)CuCu + SeSe + xe
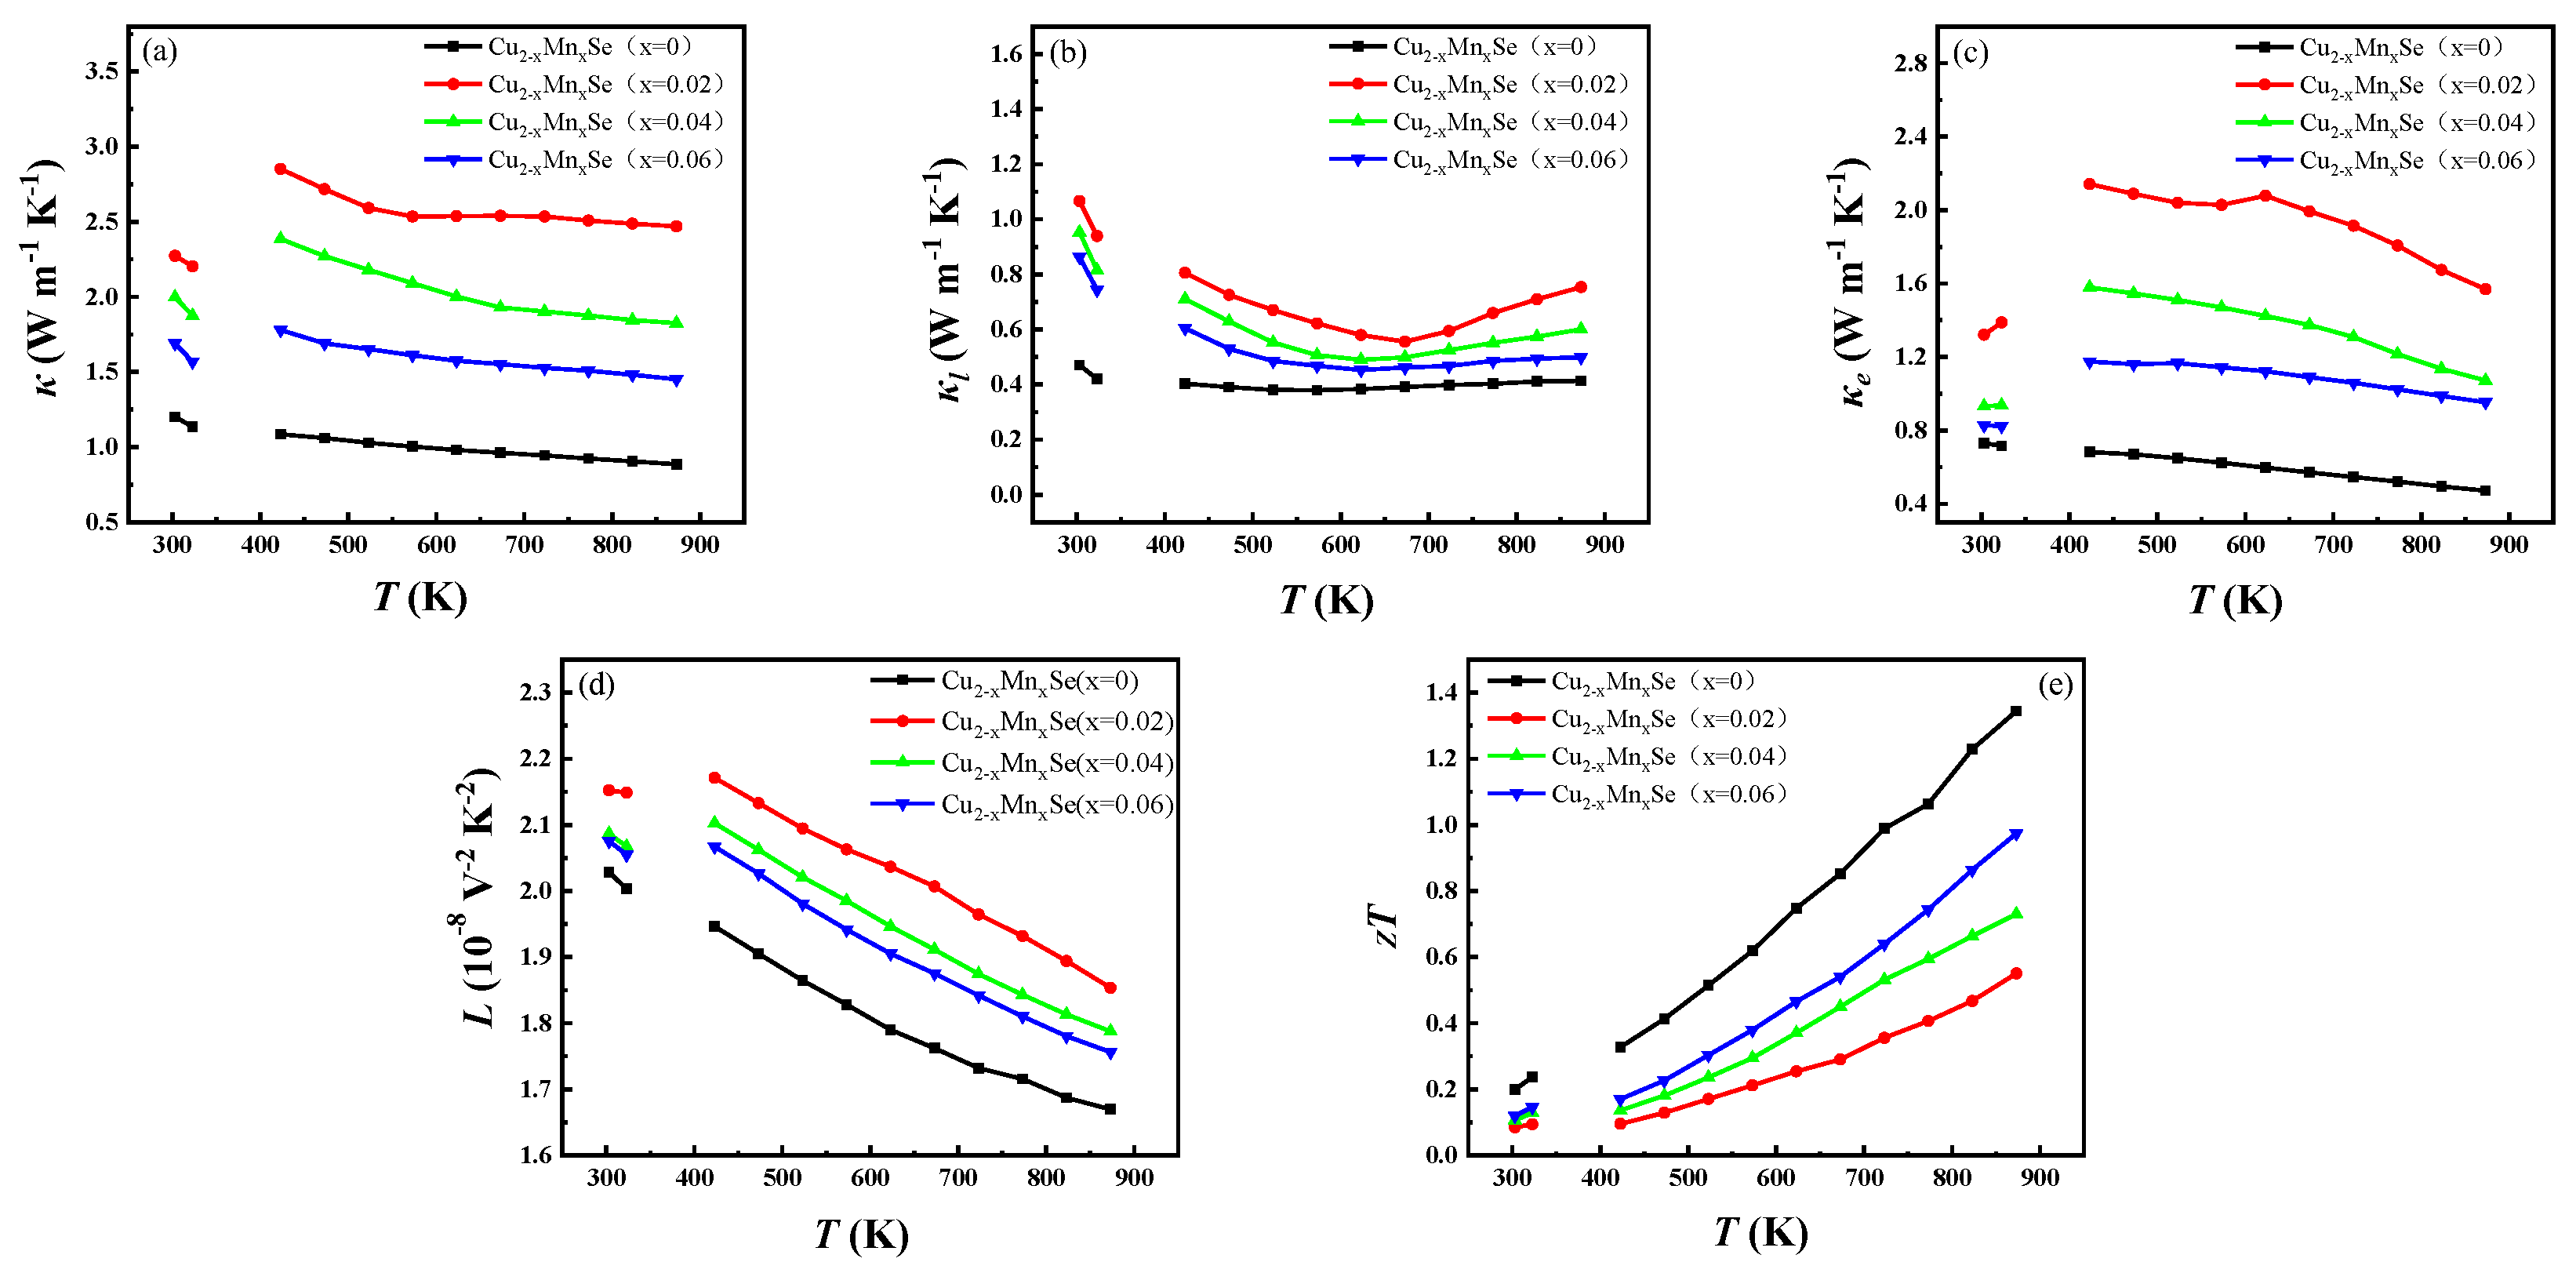
Figure 11a shows the variations in thermal conductivity with the test temperature for the Cu2−xMnxSe (x = 0, 0.02, 0.04, 0.06) samples. Compared with pure Cu2Se, the total thermal conductivity of the sample containing Mn shows a temperature- and doping concentration-dependent relationship, with its conductivity decreasing with increasing temperature. As the doping concentration increases, it reaches a maximum value at x = 0.02 and then decreases but remains higher than that of the pure sample throughout the measured temperature range. The main reason is that the electrical conductivity of the doped samples is higher than that of the pure Cu2Se samples. For example, at 473 K, the total thermal conductivity increases from ~1.06 W m−1 K−1 for the original Cu2Se to ~2.71 W m−1 K−1, for the x = 0.02 sample, to ~2.27 W m−1 K−1 for the x = 0.04 sample, to ~1.69 W m−1 K−1 for the x = 0.06 sample. Because Mn doping introduces a large number of minority carriers or electrons, its total thermal conductivity (κb) mainly consists of lattice thermal conductivity (κl), carrier thermal conductivity (κe), and bipolar diffusion thermal conductivity κb, that is, κ = κl + κe + κb. In order to fully understand the change in total thermal conductivity, the κe and κl + κb of the sample are analyzed in Figure 11b,c. According to Wiedemann-Franz’s law, κe = LσT, where L is the Lorentz constant, and the Lorentz constant L (10−8 W Ω K−1) = 1.5 + exp (−S/116). The calculation results are shown in Figure 11d. The lattice thermal conductivity and the sum of the bipolar diffusion thermal conductivity (κl + κb) of the doped samples are higher than those of the undoped Cu2Se samples, and the lattice thermal conductivity increases first with the increase in Mn concentration, reaches the maximum value at x = 0.02, and then decreases. The first reason is consistent with the results of the SEM microstructure analysis, that is, with the increase in Mn doping content, the decrease in grain size, the increase in composition heterogeneity, and the increase in lattice defects such as dislocation enhance the lattice scattering of phonons and reduce the lattice thermal conductivity. Second, Mn doping introduces a small number of carriers, the concentration of which first increases with the increase in the x value, reaches a maximum value at x = 0.02, and then decreases with the increase in Mn doping content and Mn solid solubility. The increase in minority carrier concentration increases the bipolar diffusion thermal conductivity, and κl + κb increases compared with the undoped sample, reaching a maximum value at x = 0.02.
As shown in Figure 11e, the zT values of the Mn-doped samples are significantly lower than those of the pure Cu2Se samples over the entire temperature range. Mn doping increases the power factor of samples due to the increase in electrical conductivity. However, due to the influence of bipolar diffusion thermal conductivity, Mn doping does not reduce the thermal conductivity, so the ideal zT value is not obtained.

3.4. Cyclic Test of Thermoelectric Properties

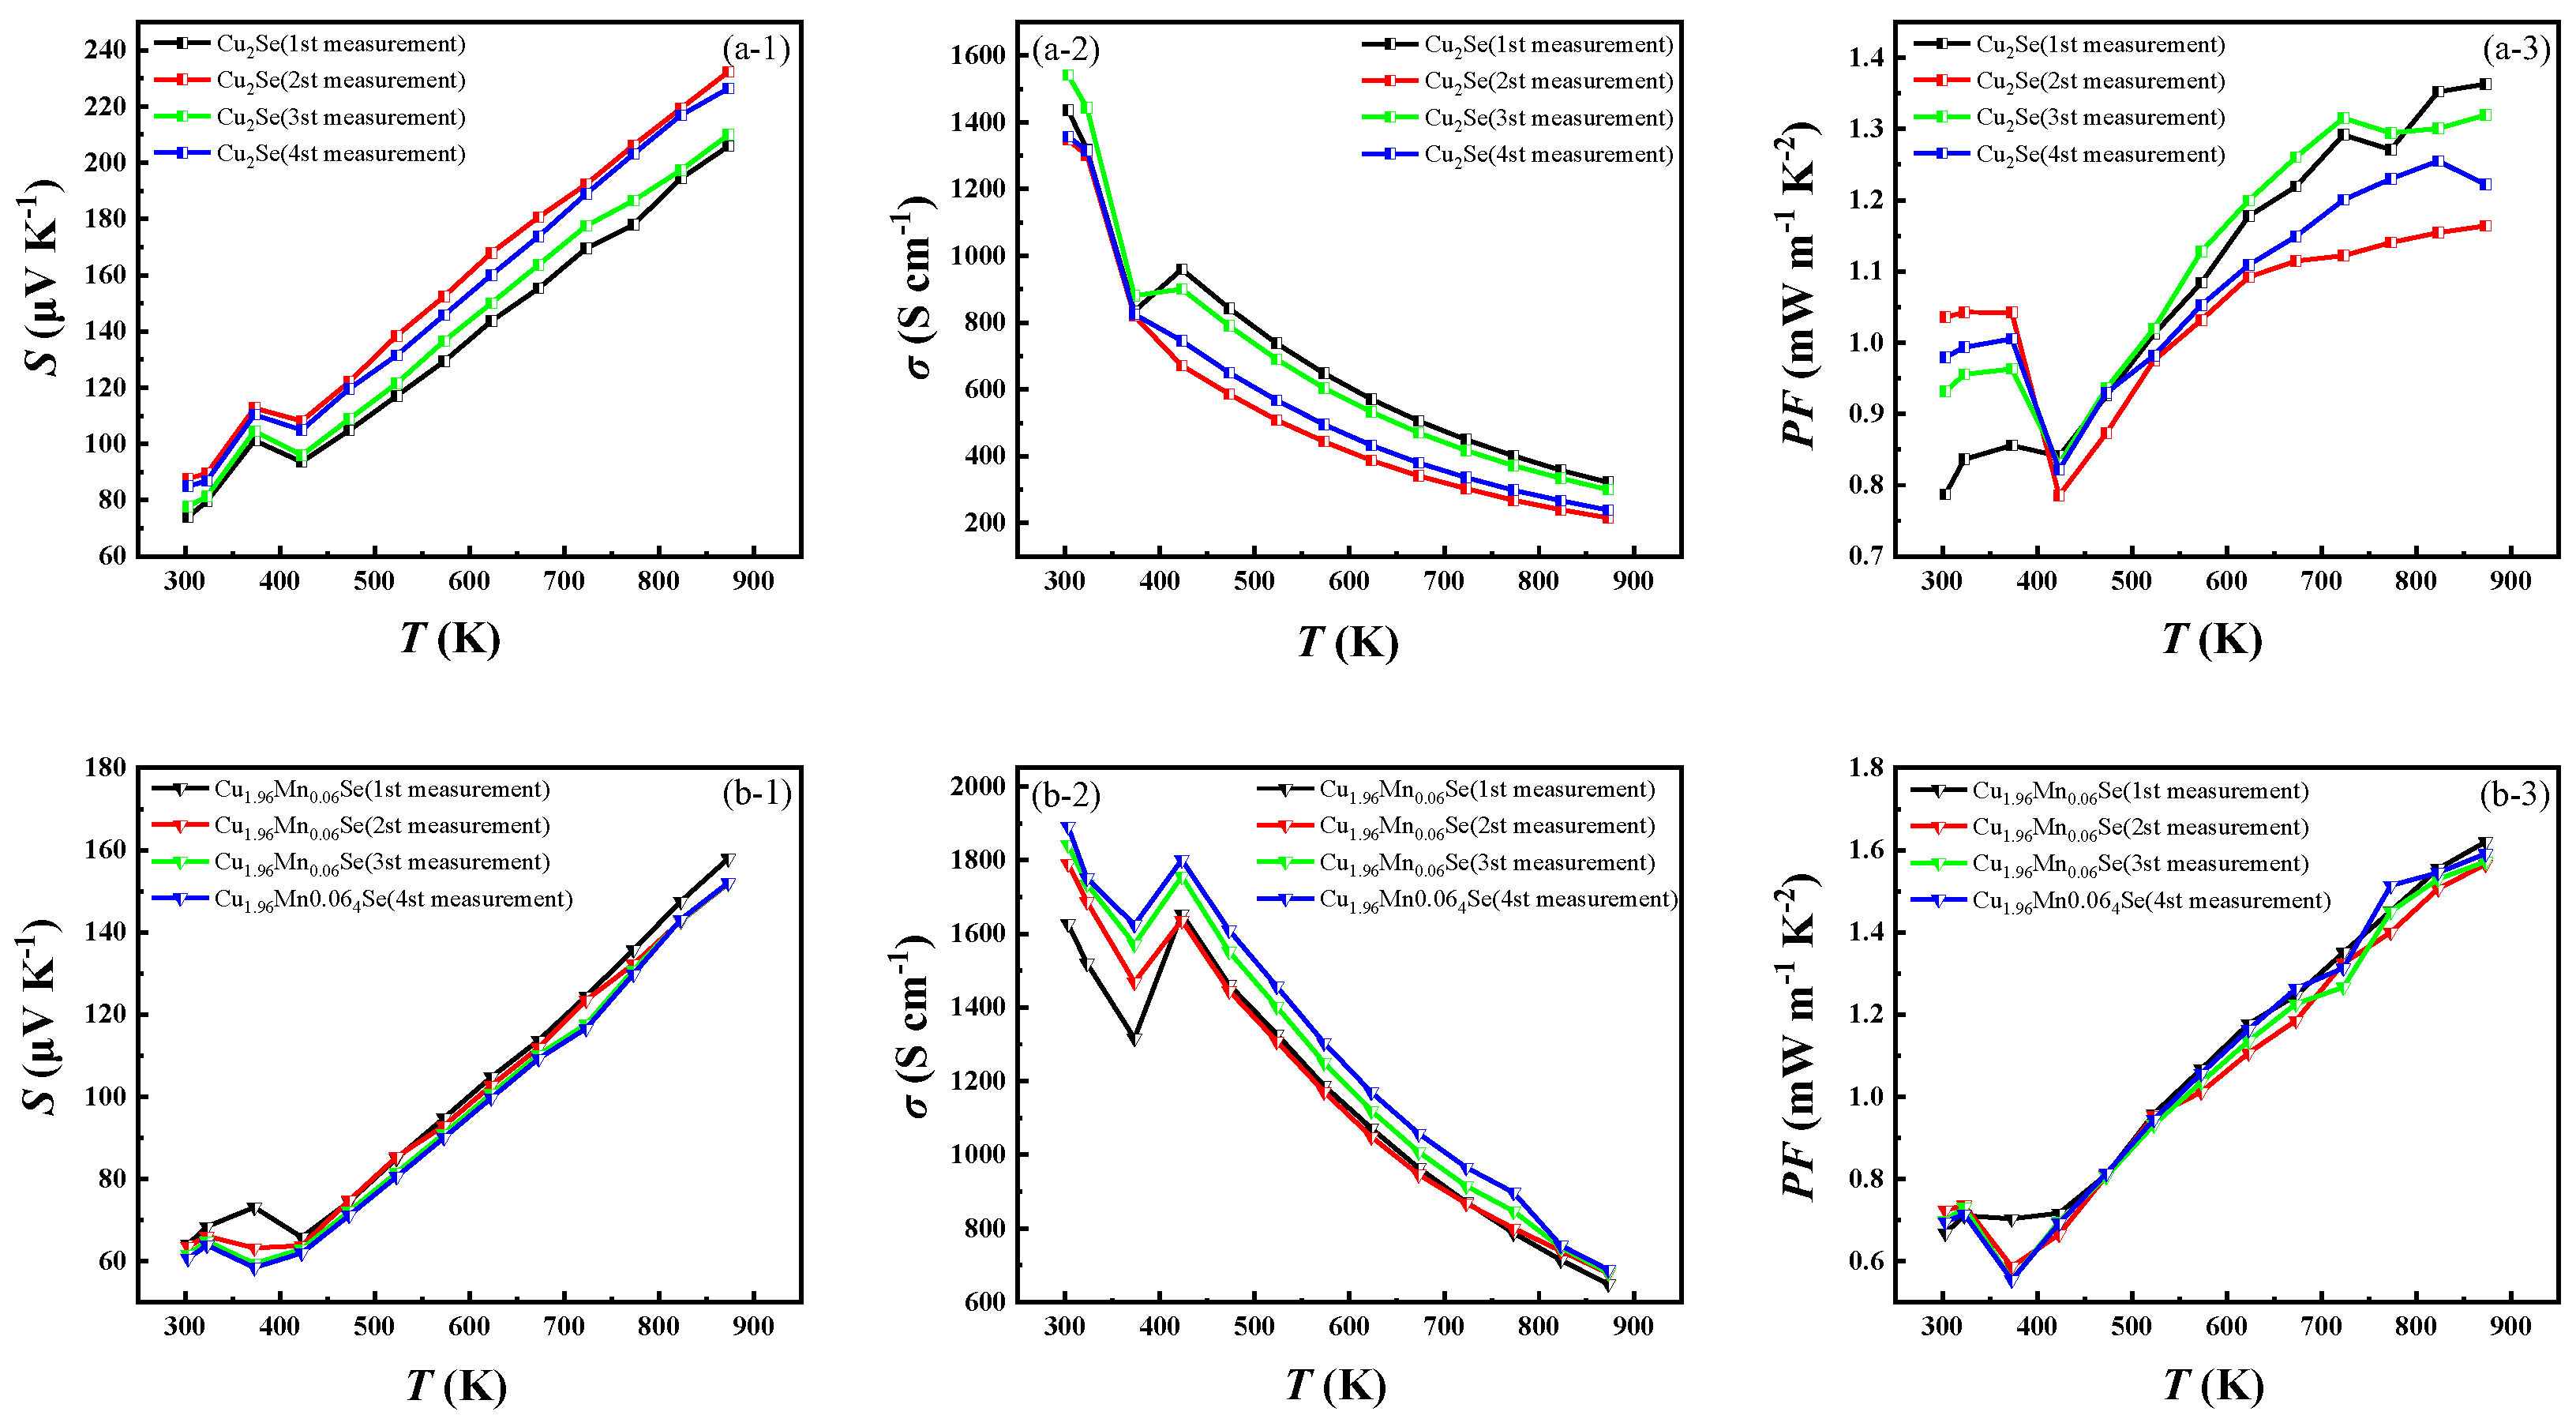
In order to verify the effect of Mn doping on Cu+ migration, the thermoelectric properties of Cu2Se and Cu1.94Mn0.06Se were tested four times and the results are shown in Figure 12. The variation range of S, σ, and PF of doped Cu1.94Mn0.06Se after multiple cycles is significantly smaller than that of pure Cu2Se. The pyroelectric properties of Cu1.94Mn0.06Se after four cycles of testing show little change. Cu1.94Mn0.06See has better cyclic stability at high temperatures than Cu2Se. Mn doping can effectively reduce Cu+ migration and provide the experimental basis for improving its thermoelectric stability.

4. Conclusions

By vacuum melting–annealing synthesis and the SPS sintering process, Cu2−xMnxSe (x = 0, 0.02, 0.04, 0.06) semiconductors were fabricated successfully. The crystal structure, microstructure, thermoelectric properties, carrier scattering mechanism, and energy band parameters of Mn-doped samples were studied at a range of test temperatures (303–873 K) and doping amounts of Mn. The thermal stability of the Mn-doped samples was studied by cyclic testing of high-temperature thermoelectric properties. Conclusions are drawn as follows:
  • XRD analysis shows that the Mn-doped samples are a mixture of α-Cu2Se and Cu2Se. With the increase in Mn content, the cell parameters of the material decrease, and the β-Cu2Se phase content increases. Specifically, with the increase in Mn content, the β-Cu2Se phase can be stabilized theoretically. DSC analysis showed that the heat absorption peak moves to low temperatures, and the phase transition temperature decreases with the increase in Mn doping content.
  • SEM and HRTEM analysis showed that the sample is composed of flaky crystal piles. the flaky particles decreased with the increase in Mn doping amount; the shape of the segregation region of the sample was irregular; the size was 5–10 nm; and there were many dislocations in each segregation micro-interval, which enhanced the scattering of carriers and phonons.
  • The σ and S showed opposite test temperature and Mn doping dependence. The conductivity decreases with the increase in temperature, and S increases with the increase in temperature. The PF value of Cu1.94Mn0.06Se at 873 K was 1.62 mW m−1 K−2, which is 1.2 times higher than that of Cu2Se without Mn at 873 K.
  • Conductivity ratio analysis showed that the Mn impure sample and pure phase Cu2Se have the exact carrier scattering mechanism, the scattering characteristic of ionized impurities. This is consistent with the result that the carrier mobility increases with temperature, so the scattering factor value is 3/2. This feature could be one of the reasons for Cu2Se’s high Seebeck coefficient and thermoelectric properties.
  • Due to Mn’s inclusion of electrons, its bipolar diffusion thermal conductivity significantly increases. The minority carrier concentration introduced at x = 0.02 is the highest for the lattice thermal conductivity of the sample, which does not reach a high zT value.
  • The results of four high-temperature cycle tests showed that the thermoelectric properties of Cu1.94Mn0.06Se show little change, and the high-temperature cycle stability is better than that of Cu2Se. The ionic radius of Mn2+ is smaller than that of Cu+. Therefore, as a dopant, Mn is easily dissolved into the structure of Cu2Se. The electronegativity of Mn is less than that of Cu. Theoretically speaking, the manganese VIIB element has a strong reducing ability.

Author Contributions

Methodology, G.X.; Resources, Y.L., X.F., Q.Y. and B.N.; Writing—original draft, J.T. All authors have read and agreed to the published version of the manuscript.

Funding

This work was financially supported by the National Key Research and Development Program of China (2017YFF0204706), the Fundamental Research Funds for the Central Universities (FRF-MP-18-005, FRF-MP-19-005), and the Disruptive Innovation Funding Programs (19-163-13-ZT-001-008-19).

Institutional Review Board Statement

Not applicable.

Informed Consent Statement

Not applicable.

Data Availability Statement

Not applicable.

Conflicts of Interest

There are no conflict of interest to declare.

References

  1. Mao, J.; Chen, G.; Ren, Z. Thermoelectric cooling materials. Nat. Mater. 2021, 20, 454–461. [Google Scholar] [CrossRef] [PubMed]
  2. Zhao, K.; Qiu, P.; Shi, X.; Chen, L. Recent Advances in Liquid-Like Thermoelectric Materials. Adv. Funct. Mater. 2020, 30, 1903867. [Google Scholar] [CrossRef]
  3. Zhang, Z.; Zhao, K.; Wei, T.-R.; Qiu, P.; Chen, L.; Shi, X. Cu2Se-Based liquid-like thermoelectric materials: Looking back and stepping forward. Energy Environ. Sci. 2020, 13, 3307–3329. [Google Scholar] [CrossRef]
  4. Pei, Y.; Wang, H.; Snyder, G.J. Band Engineering of Thermoelectric Materials. Adv. Mater. 2012, 24, 6125–6135. [Google Scholar] [CrossRef] [PubMed]
  5. Lu, R.; Olvera, A.; Bailey, T.P.; Uher, C.; Poudeu, P.F. Nanoscale Engineering of Polymorphism in Cu2Se-Based Composites. ACS Appl. Mater. Interfaces 2020, 12, 31601–31611. [Google Scholar] [CrossRef] [PubMed]
  6. Liu, H.; Shi, X.; Xu, F.; Zhang, L.; Zhang, W.; Chen, L.; Li, Q.; Uher, C.; Day, T.; Jeffrey, G.S. Copper ion liquid-like thermoelectrics. Nat. Mater. 2012, 11, 422–425. [Google Scholar] [CrossRef]
  7. Wei, T.-R.; Wu, C.-F.; Li, F.; Li, J.-F. Low-cost and environmentally benign selenides as promising thermoelectric materials. J. Mater. 2018, 4, 304–320. [Google Scholar] [CrossRef]
  8. Bo, L.; Zhang, R.; Zhao, H.; Hou, Y.; Wang, X.; Zhu, J.; Zhao, L.; Zuo, M.; Zhao, D. Achieving High Thermoelectric Properties of Cu2Se via Lattice Softening and Phonon Scattering Mechanism. ACS Appl. Energy Mater. 2022, 5, 6453–6461. [Google Scholar] [CrossRef]
  9. Byeon, D.; Sobota, R.; Delime-Codrin, K.; Choi, S.; Hirata, K.; Adachi, M.; Kiyama, M.; Matsuura, T.; Yamamoto, Y.; Matsunami, M.; et al. Discovery of colossal Seebeck effect in metallic Cu2Se. Nat. Commun. 2019, 10, 72. [Google Scholar] [CrossRef] [Green Version]
  10. Zhao, K.; Blichfeld, A.B.; Eikeland, E.; Qiu, P.; Ren, D.; Iversen, B.B.; Shi, X.; Chen, L. Extremely Low Thermal Conductivity and High Thermoelectric Performance in Liquid-like Cu2Se 1−xSx Polymorph Materials. J. Mater. Chem. A 2017, 5, 18148–18156. [Google Scholar] [CrossRef] [Green Version]
  11. Zhang, J.; Zhang, C.; Zhu, T.; Yan, Y.; Su, X.; Tang, X. Mechanical Properties and Thermal Stability of the High-Thermoelectric-Performance Cu2Se Compound. ACS Appl. Mater. Interfaces 2021, 13, 45736–45743. [Google Scholar] [CrossRef] [PubMed]
  12. Peng, P.; Gong, Z.N.; Liu, F.S.; Huang, M.J.; Ao, W.Q.; Li, Y.; Li, J.Q. Structure and thermoelectric performance of β-Cu2Se doped with Fe, Ni, Mn, In, Zn or Sm. Intermetallics 2016, 75, 72–78. [Google Scholar] [CrossRef]
  13. Wang, N.; Song, G.; Li, G.; Wu, Y.; You, J. Thermoelectric properties of β-(Cu,Mn)2Se films with high (111) preferred orientation. Vacuum 2022, 197, 110845. [Google Scholar] [CrossRef]
  14. Ducka, A.; Trawiński, B.; Bochentyn, B.; Dubiel, A.; Kusz, B. Structure and thermoelectric properties of nickel-doped copper selenide synthesised in a hydrogen atmosphere. Mater. Res. Bull. 2021, 133, 111042. [Google Scholar] [CrossRef]
  15. Day, T.W.; Borup, K.A.; Zhang, T.; Drymiotis, F.; Brown, D.R.; Shi, X.; Chen, L.; Iversen, B.B.; Snyder, G.J. High-temperature thermoelectric properties of Cu1.97Ag0.30Se1+y. Mater. Renew. Sustain. Energy 2014, 3, 111042. [Google Scholar] [CrossRef] [Green Version]
  16. Hu, Q.; Zhu, Z.; Zhang, Y.; Li, X.-J.; Song, H.; Zhang, Y. Remarkably high thermoelectric performance ofCu2−xLixSe bulks with nanopores. J. Mater. Chem. A 2018, 6, 23417–23424. [Google Scholar] [CrossRef]
  17. Zhu, Z.; Zhang, Y.; Song, H.; Li, X.-J. High thermoelectric performance and low thermal conductivity in Cu2−xNaxSe bulk materials with micro-pores. Appl. Phys. A 2019, 125, 572. [Google Scholar] [CrossRef]
  18. Zhu, Z.; Zhang, Y.; Song, H.; Li, X.-J. Enhancement of thermoelectric performance of Cu2Se by K doping. Appl. Phys. A 2018, 124, 871. [Google Scholar] [CrossRef]
  19. Bhardwaj, R.; Bhattacharya, A.; Tyagi, K.; Gahtori, B.; Chauhan, N.S.; Vishwakarma, A.; Johari, K.K.; Bathula, S.; Auluck, S.; Dhar, A. Enhancement in thermoelectric performance of single step synthesized Mg doped Cu2Se: An experimental and theoretical study. Intermetallics 2019, 112, 106541. [Google Scholar] [CrossRef]
  20. Wang, J.; Liu, B.; Miao, N.; Zhou, J.; Sun, Z. I-doped Cu2Se nanocrystals for high-performance thermoelectric applications. J. Alloys Compd. 2019, 772, 366–370. [Google Scholar] [CrossRef]
  21. Kim, M.J.; Lee, G.-G.; Kim, W.; Kim, K.; Tak, J.-Y.; Shin, W.H.; Seo, W.-S.; Hong, J.; Lim, Y.S. Effects of Cl-Doping on Thermoelectric Transport Properties of Cu2Se Prepared by Spark Plasma Sintering. J. Electron. Mater. 2018, 48, 1958–1964. [Google Scholar] [CrossRef]
  22. Zhao, K.; Blichfeld, A.B.; Chen, H.; Song, Q.; Zhang, T.; Zhu, C.; Ren, D.; Hanus, R.; Qiu, P.; Iversen, B.B.; et al. Enhanced Thermoelectric Performance through Tuning Bonding Energy in Cu2Se1−xSx Liquid-like Materials. Chem. Mater. 2017, 29, 6367–6377. [Google Scholar] [CrossRef]
  23. Butt, S.; Xu, W.; Farooq, M.U.; Ren, G.K.; Zhang, Q.; Zhu, Y.; Khan, S.U.; Liu, L.; Yu, M.; Mohmed, F.; et al. Enhanced Thermoelectricity in High-Temperature β-Phase Copper(I) Selenides Embedded with Cu2Te Nanoclusters. ACS Appl. Mater. Interfaces 2016, 8, 15196–15204. [Google Scholar] [CrossRef] [PubMed]
  24. James, G.; Speight, P.D. Lange’s Handbook of Chemistry; McGraw-Hill Professional: Chicago, IL, USA, 1972. [Google Scholar]
  25. Gordy, W.; Thomas, W.J.O. Electronegativities of the Elements. J. Chem. Phys. 1956, 24, 439–444. [Google Scholar] [CrossRef]
  26. Li, W.; Chen, Z.; Lin, S.; Chang, Y.; Ge, B.; Chen, Y.; Pei, Y. Band and scattering tuning for high performance thermoelectric Sn1−xMnxTe alloys. J. Mater. 2015, 1, 307–315. [Google Scholar] [CrossRef] [Green Version]
  27. Das, S.; Valiyaveettil, S.M.; Chen, K.-H.; Suwas, S.; Mallik, R.C. Thermoelectric properties of Mn doped BiCuSeO. Mater. Res. Express 2019, 6, 086305. [Google Scholar] [CrossRef]
  28. Xiang, S.; Liang, Y.; Zhang, X. Thermoelectric properties and thermal stability of metal-doped cuprous sulfide thermoelectrics. J. Eur. Ceram. Soc. 2022, 42, 7468–7474. [Google Scholar] [CrossRef]
  29. Xu, G.; Ren, P.; Lin, T.; Wu, X.; Zhang, Y.; Niu, S.; Bailey, T.P. Mechanism and application method to analyze the carrier scattering factor by electrical conductivity ratio based on thermoelectric property measurement. J. Appl. Phys. 2018, 123, 015101. [Google Scholar] [CrossRef]
Figure 1. Schematic diagram of the manufacturing process of Mn-doped Cu2Se sample.
Materials 16 05204 g001
Figure 2. (a) Room temperature X-ray diffraction patterns for Cu2−xMnxSe. (b) Enlarged views of diffraction peaks around 24–28°. (c) Enlarged views of diffraction peaks around 43–53°.
Materials 16 05204 g002
Figure 3. DSC curve and obtained phase transition temperature of Cu2−xMnxSe sample.
Materials 16 05204 g003
Figure 4. Rietveld refinements of XRD profiles of the Cu2−xMnxSe samples. (a) x = 0; (b) x = 0.02; (c) x = 0.04; (d) x = 0.06.
Materials 16 05204 g004
Figure 5. (a) XPS spectra of Cu1.94Mn0.06Se sample, and high-resolution XPS spectra of (b) Cu, (c) Se and (d) Mn.
Materials 16 05204 g005
Figure 6. (ad) SEM images of Cu2−xMnxSe (x = 0, 0.02, 0.04, 0.06) sample fractures; (eh) SEM images of the polished surface morphology of Cu1.94Mn0.06Se samples and the distribution of energy dispersive X-ray spectroscopy (EDS); (i) point 1, point 2 element content.
Materials 16 05204 g006
Figure 7. (a) HRTEM image of Cu1.94Mn0.06Se sample, (b) SAED images of Cu1.94Mn0.06Se sample.
Materials 16 05204 g007
Figure 8. (a) Electrical conductivities. (b) Seebeck coefficients. (c) Power factors. (d) Calculated Pisarenko lines of Cu2−xMnxSe (x = 0, 0.02, 0.04, 0.06).
Materials 16 05204 g008
Figure 9. The ratio of the experimental electrical conductivity σ(T) to the electrical conductivity at 303 K and 423K as a function of temperature T (line 1) and the calculated ratio values versus T based on acoustic phonon scattering (line 2), alloy scattering (line 3), polar optical phonon scattering (line 4), and ionized impurity scattering (line 5) models for (a) Cu2Se, (b) Cu1.98Mn0.02Se, (c) Cu1.96Mn0.04Se, (d) Cu1.94Mn0.06Se.
Materials 16 05204 g009
Figure 10. (a) Temperature dependences of reduced Fermi level; (b) effective mass of Cu2−xMnxSe; (c) mobility; (d) carrier concentration.
Materials 16 05204 g010
Figure 11. (a) Temperature dependence of total thermal conductivity; (b) the lattice thermal conductivity; (c) the electronic thermal conductivity; (d) Lorentz constant; (e) zT value.
Materials 16 05204 g011
Figure 12. Cyclic tests of Cu2Se and Cu1.94Mn0.06Se. (a-1,b-1) Seebeck cycle test; (a-2,b-2) conductivity cycle test; (a-3,b-3) PF calculation results after the cycle.
Materials 16 05204 g012
Table 1. Parameters of doped elements.
ElementCuMnCu+Cu2+Mn2+
radius/Å [24]1.281.320.770.730.67
electronegativity/eV [25]1.901.551.82.01.4
Table 2. Lattice constants of Cu2−xMnxSe samples at room temperature.
Samplea
(Å)
b
(Å)
c
(Å)
Vol (Å3)χ2
x = 07.15941812.00241127.7716222345.0754.151
x = 0.027.00577912.40827027.327600 2344.6394.165
x = 0.046.98807312.51490927.3937092244.0774.626
x = 0.067.37300212.07990527.4174712243.8474.028
Table 3. Formulas used for carrier scattering mechanism analysis.
Carrier Scattering MechanismScattering FactorElectrical Conductivity
Acoustical phonon scattering−1/2 σ = σ 0 η m *             (4)
Alloy scattering−1/2 σ = σ 0 T η m *             (5)
Polar optical phonon scattering1/2 σ = σ 0 T 2 η 2          (6)
Ionized impurity scattering3/2 σ = σ 0 m * T 3 η 3     (7)
Disclaimer/Publisher’s Note: The statements, opinions and data contained in all publications are solely those of the individual author(s) and contributor(s) and not of MDPI and/or the editor(s). MDPI and/or the editor(s) disclaim responsibility for any injury to people or property resulting from any ideas, methods, instructions or products referred to in the content.