3.1. Chemical Modification and Characterization of Diatomite Adsorbents
In our research, the raw diatomite material was studied before and after sulfuric acid purification. The surface morphology of the initial diatomite and washing derivate was obtained using the scale dependency of the SEM data (
Figure 1).
Figure 1a indicates that the raw material exhibited highly porous disk- and rod-like shapes, with sizes of approx. 0.5–50 μm. Numerous well-developed pores can be clearly observed, indicating the high honeycomb porosity and accessible surface of diatomite as expected. It was also found that the natural mineral showed specific surface area of up to 30.0 m
2/g. However, there were many inclusions on the surface of the raw diatomite. Most of the pores on the surface of diatomite were opened. The average diameter of the pores was observed to be approximately 50–500 nm in the peripheral area of the diatomite disk. In
Figure 1b, after washing the surface of the diatomite in general, it became clean, with clearly identifiable channels. We can clearly see that the porous structure of the diatomite changed as expected after the purification process.
The XRF and EDX methods (
Figure S1) are applied to determinate the chemical composition of the natural diatomite because the principal constituents of diatomite depend on the origin of the diatomaceous earth. The phase compositions of the solids obtained from the analyzed data are presented in
Table 2.
As can be seen, the EDX results showed that the main components of the natural diatomite were SiO
2 and Al
2O
3, with small amounts of Fe
2O
3, MgO, and K
2O. Metal ions were mainly in the form of carbonate, according to the EDX data (
Table 2). Additional XRF analyses showed that the chemical composition was consistent with the results obtained with the EDX analysis.
Phosphorylation of natural diatomite. A modification of the diatomite by phosphonic-derivative groups was carried out in several steps using covalent and non-covalent approaches (
Scheme 1). The following parameters were optimized for all the phosphorylation reactions: temperature, reagents concentration, reaction time, and pH.
Route I involved the preparation of a P-containing functional group with direct interaction of raw diatomite with H3PO3 (non-covalent approach) combined with calcination. In Route II, the natural diatomite was reacted with trimethoxy(vinyl)silane followed by a salinization reaction (covalent approach). Silanization of the diatomite is associated with the interaction of silanes with the hydroxyl groups present on the inner walls and the surface of the natural diatomite (mainly ≡ Si-OH). Two synthetic approaches were applied for the phosphorylation of the vinyl-functionalized diatomite (DIT-Vin). In the first route, DIT-Vin was reacted with the H3PO3 solution in the presence of AIBN as an initiator (DIT-Vin-PAin). In the second route, DIT-Vin along with heating was reacted with the H3PO3 solution (DIT-Vin-PAcov). Based on this, H3PO3 was also directly covalently immobilized on DIT-Vin.
To compare the immobilizing behaviours of the phosphonic groups on the diatomite support with different surface chemistries, we investigated the natural diatomite and derivative solids via various instrumental methods, such as powder XRD, solid state NMR, and FT-IR analysis.
The structures of the starting diatomite and the P-derivative solids were investigated by powder XRD (
Figure 2).
The XRD pattern of natural diatomite (
Figure 2) demonstrated essentially an amorphous silica phase, revealed as a “
halo” between 16° and 26° (2θ). There were also several reflections at 17.7, 19.6, 20.8, 26.3, 27.8, 30.1, 34.5, 36.4, 39.5, 40.1, 45.6, 50.0, 60.1, etc., of crystalline impurities and reflections of quartz (2θ = 20.87, 26.66, 36.54, etc.) (
Figure S2), calcite, and illite, which were present in the amount of approximately 2–3%, according to a semi-quantitative evaluation of the mineral (
Table 1). The efficient immobilisation of silane on the surface of the diatomite during the silanization process (
Scheme 1) was confirmed by the appearance of the second “
halo” reflection in the small angle region (up to 10°). This effect could be attributed to the increase in the amorphous silica layer after hydrolysis and corresponded to the polycondensation of the anchoring -Si(OEt)
3 groups of the silane. It can be clearly seen that other sharp and intense diffraction peaks of the raw material were observed for the prepared organo-diatomite, indicating that the structure of the starting diatomite was not destroyed after the modification.
The chemical characterization of the surface of the diatomite-based samples with the phosphonic groups and the determination of the structure of the functional layer was performed by solid state
29Si and
31P MAS NMR spectroscopy (
Figure 3 and
Figure 4).
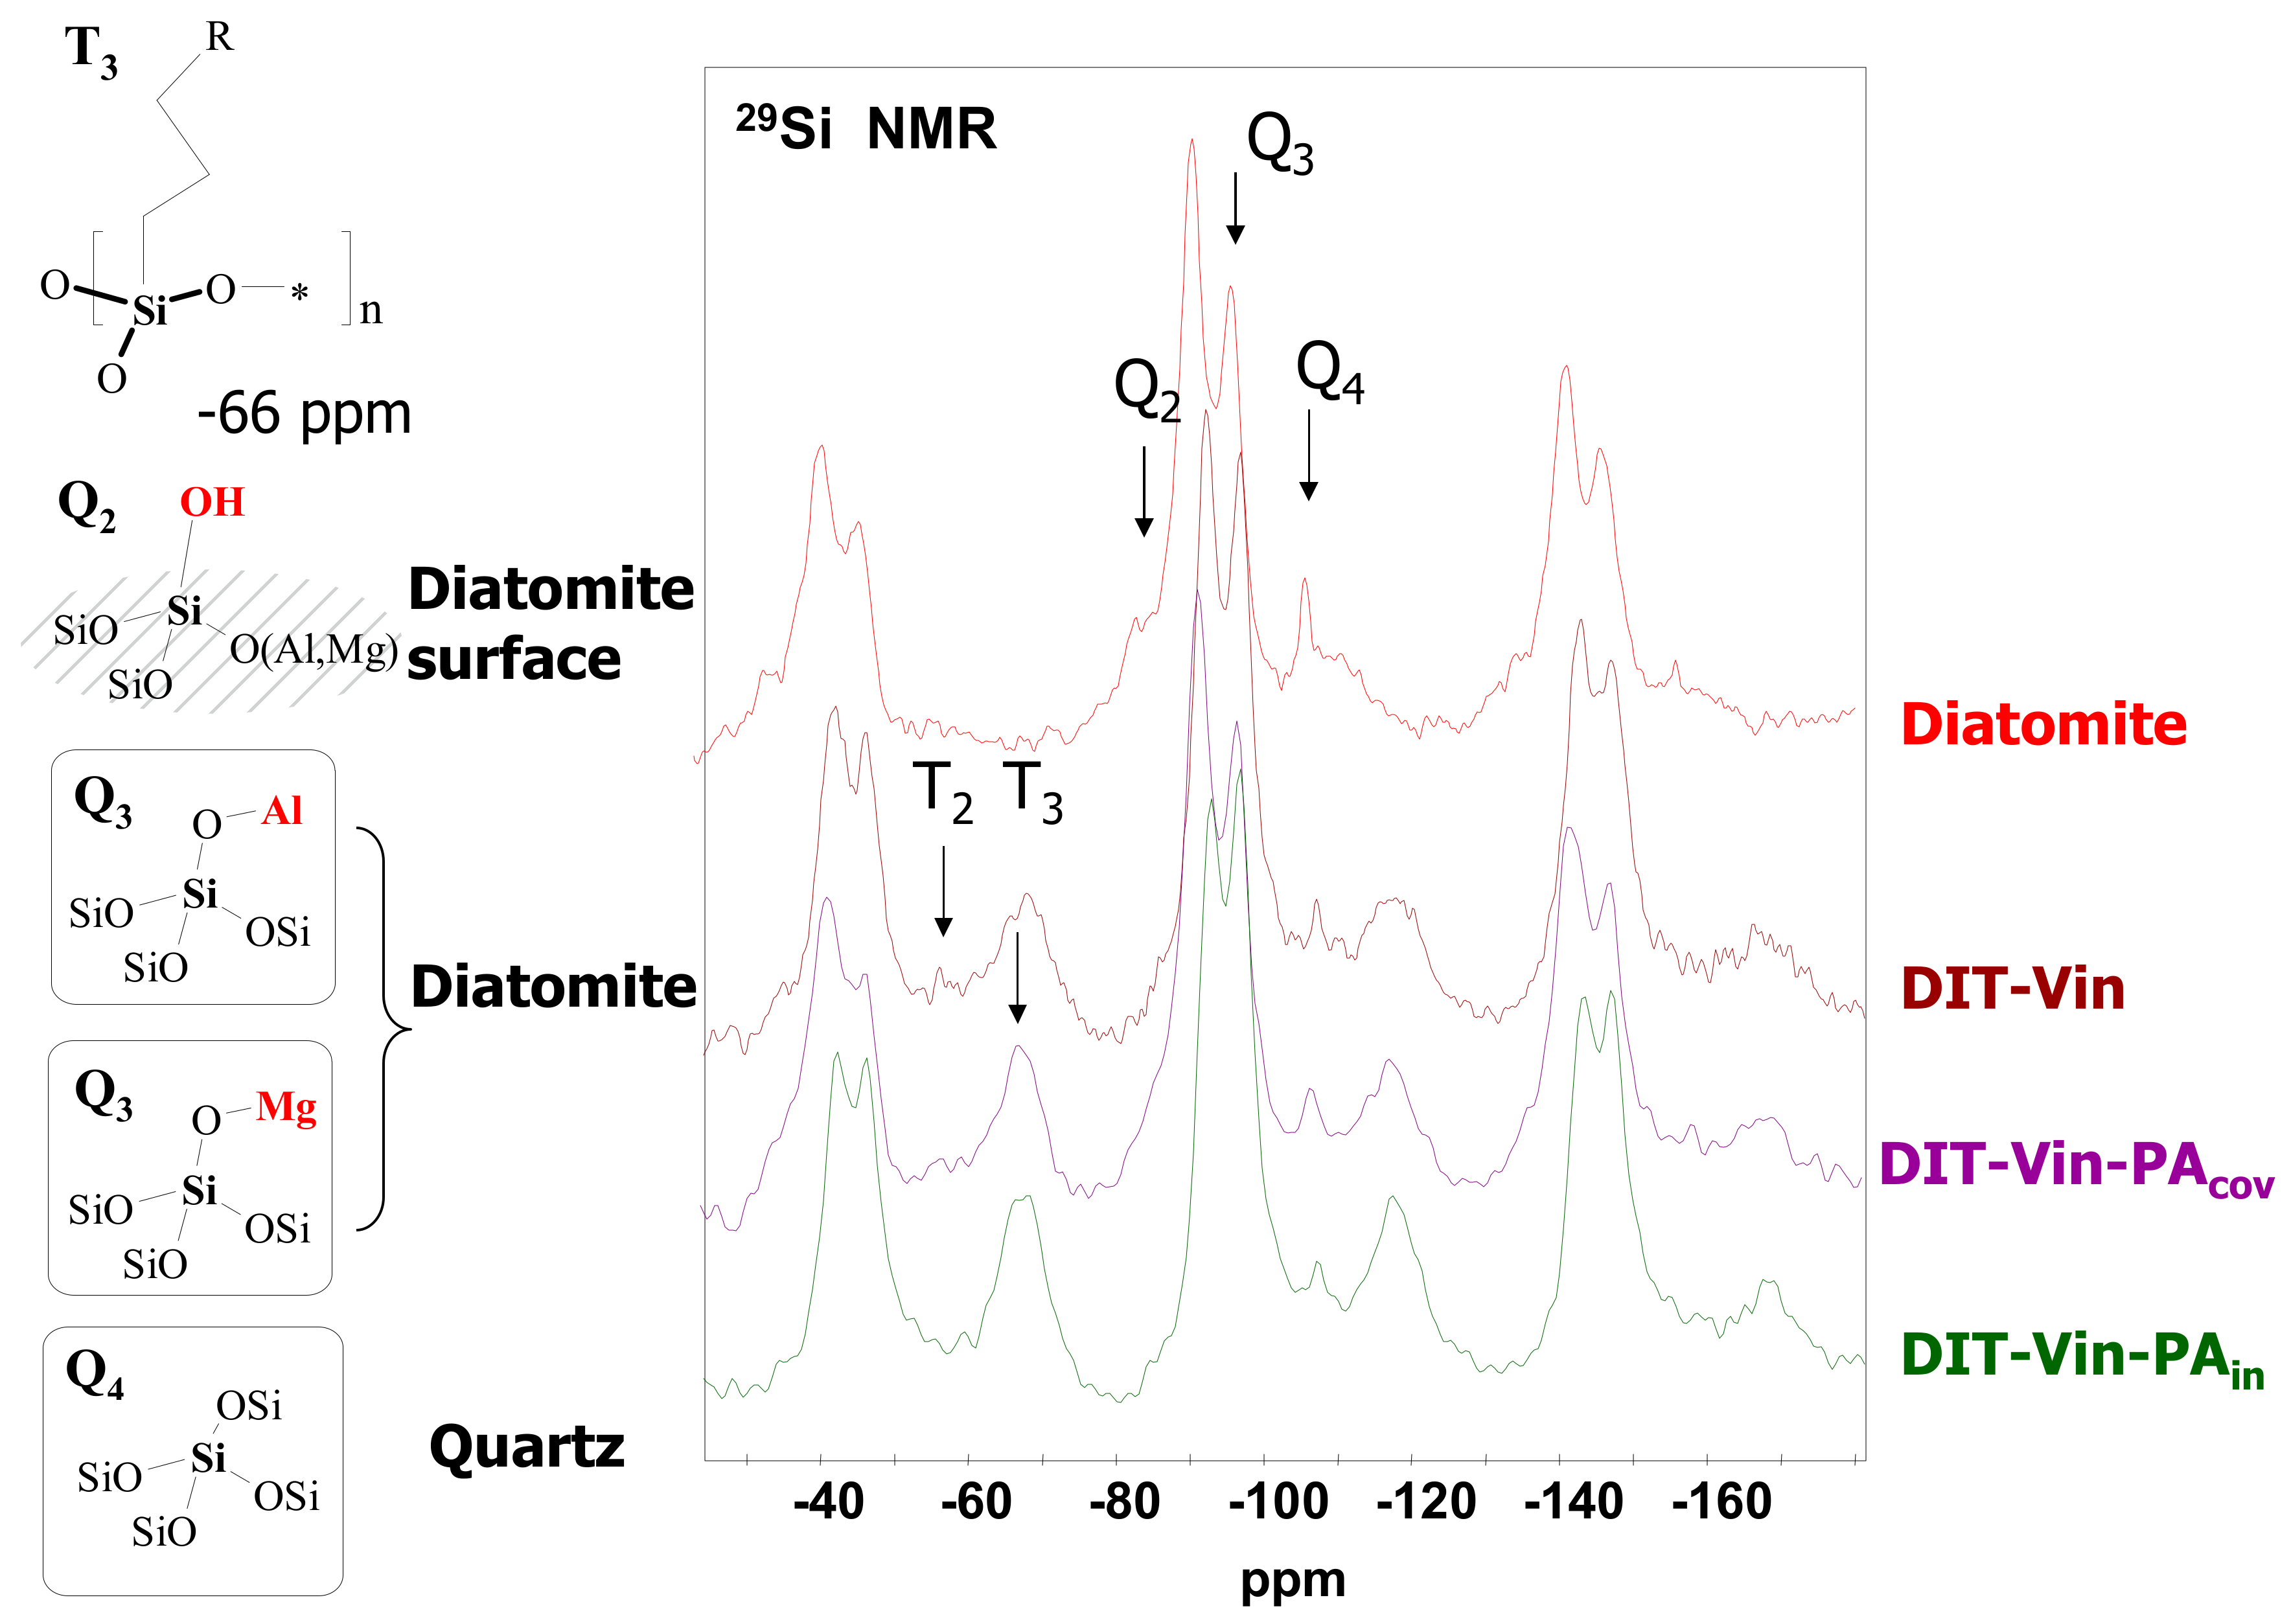
The 29Si MAS NMR spectrum of the natural diatomite, besides the major signals at −92.7 ppm (Q3 = HO−Si(OSi)3, MgO−Si(OSi)3, or AlO−Si(OSi)3 sites) and −107.6 ppm (Q4 = [Si−(OSi)4] sites of quartz), showed that the peaks for DIT-Vin, DIT-Vin-PAin, and DIT-Vin-PAcov samples could be assigned to different Q species, i.e., geminal silanols (Q2, δ = −99.1 ppm), single silanols (Q3, δ = −102.9 ppm), and siloxane groups (Q4; δ = −110.2 ppm), and contained different Tn species (1 < n ≤ 3), where n is related to the number of siloxane bonds formed between the surface and the functional center at −60.9 and −65.1 ppm that can be assigned to T3 [R−Si−(OSi)3] and T2 [R2−Si−(OSi)2] groups, respectively. The effect of the silanization corresponding to the covalent Si-C bond on the surface of adsorbents indicated the presence of the polycondensed layer of organo-silane on the diatomite surface.
The magnitude of the chemical shift and the width of the
31P MAS NMR signal is an important tool for explaining the interactions of phosphonic acids with the matrix based on the oxide materials [
27,
46]. The
31P CP/MAS NMR spectra of the DIT-Vin sample with contact times of 0.5, 2.0, 5.0, and 10.0 ms are shown in
Figure 4. Many fuzzy peaks and noises at the low times appear in the spectra of the diatomite with the physically adsorbed H
3PO
3 (DIT-Vin sample). The peak intensities for the
31P spectra changed as the time changed. The intensities for the main peaks of the phosphonic groups increased, and those for the noises decreased, as
t increased. The observed
31P peaks of the DIT-Vin sample were assigned by triad configurations. Namely, these signals at 35.2 ppm, 27.9 ppm, and 19.2 ppm are believed to be related to the various types of phosphonic acid centres present in the natural material. This might have been due to the interaction between the canter bonding (-Mg-OH, ≡Si-OH, and =Al-OH) of the diatomite and H
3PO
3 that led to the “apparent” difference in their acidic activities. The
31P MAS NMR spectra were also recorded for the other P-containing diatomite samples (see
Figure 5).
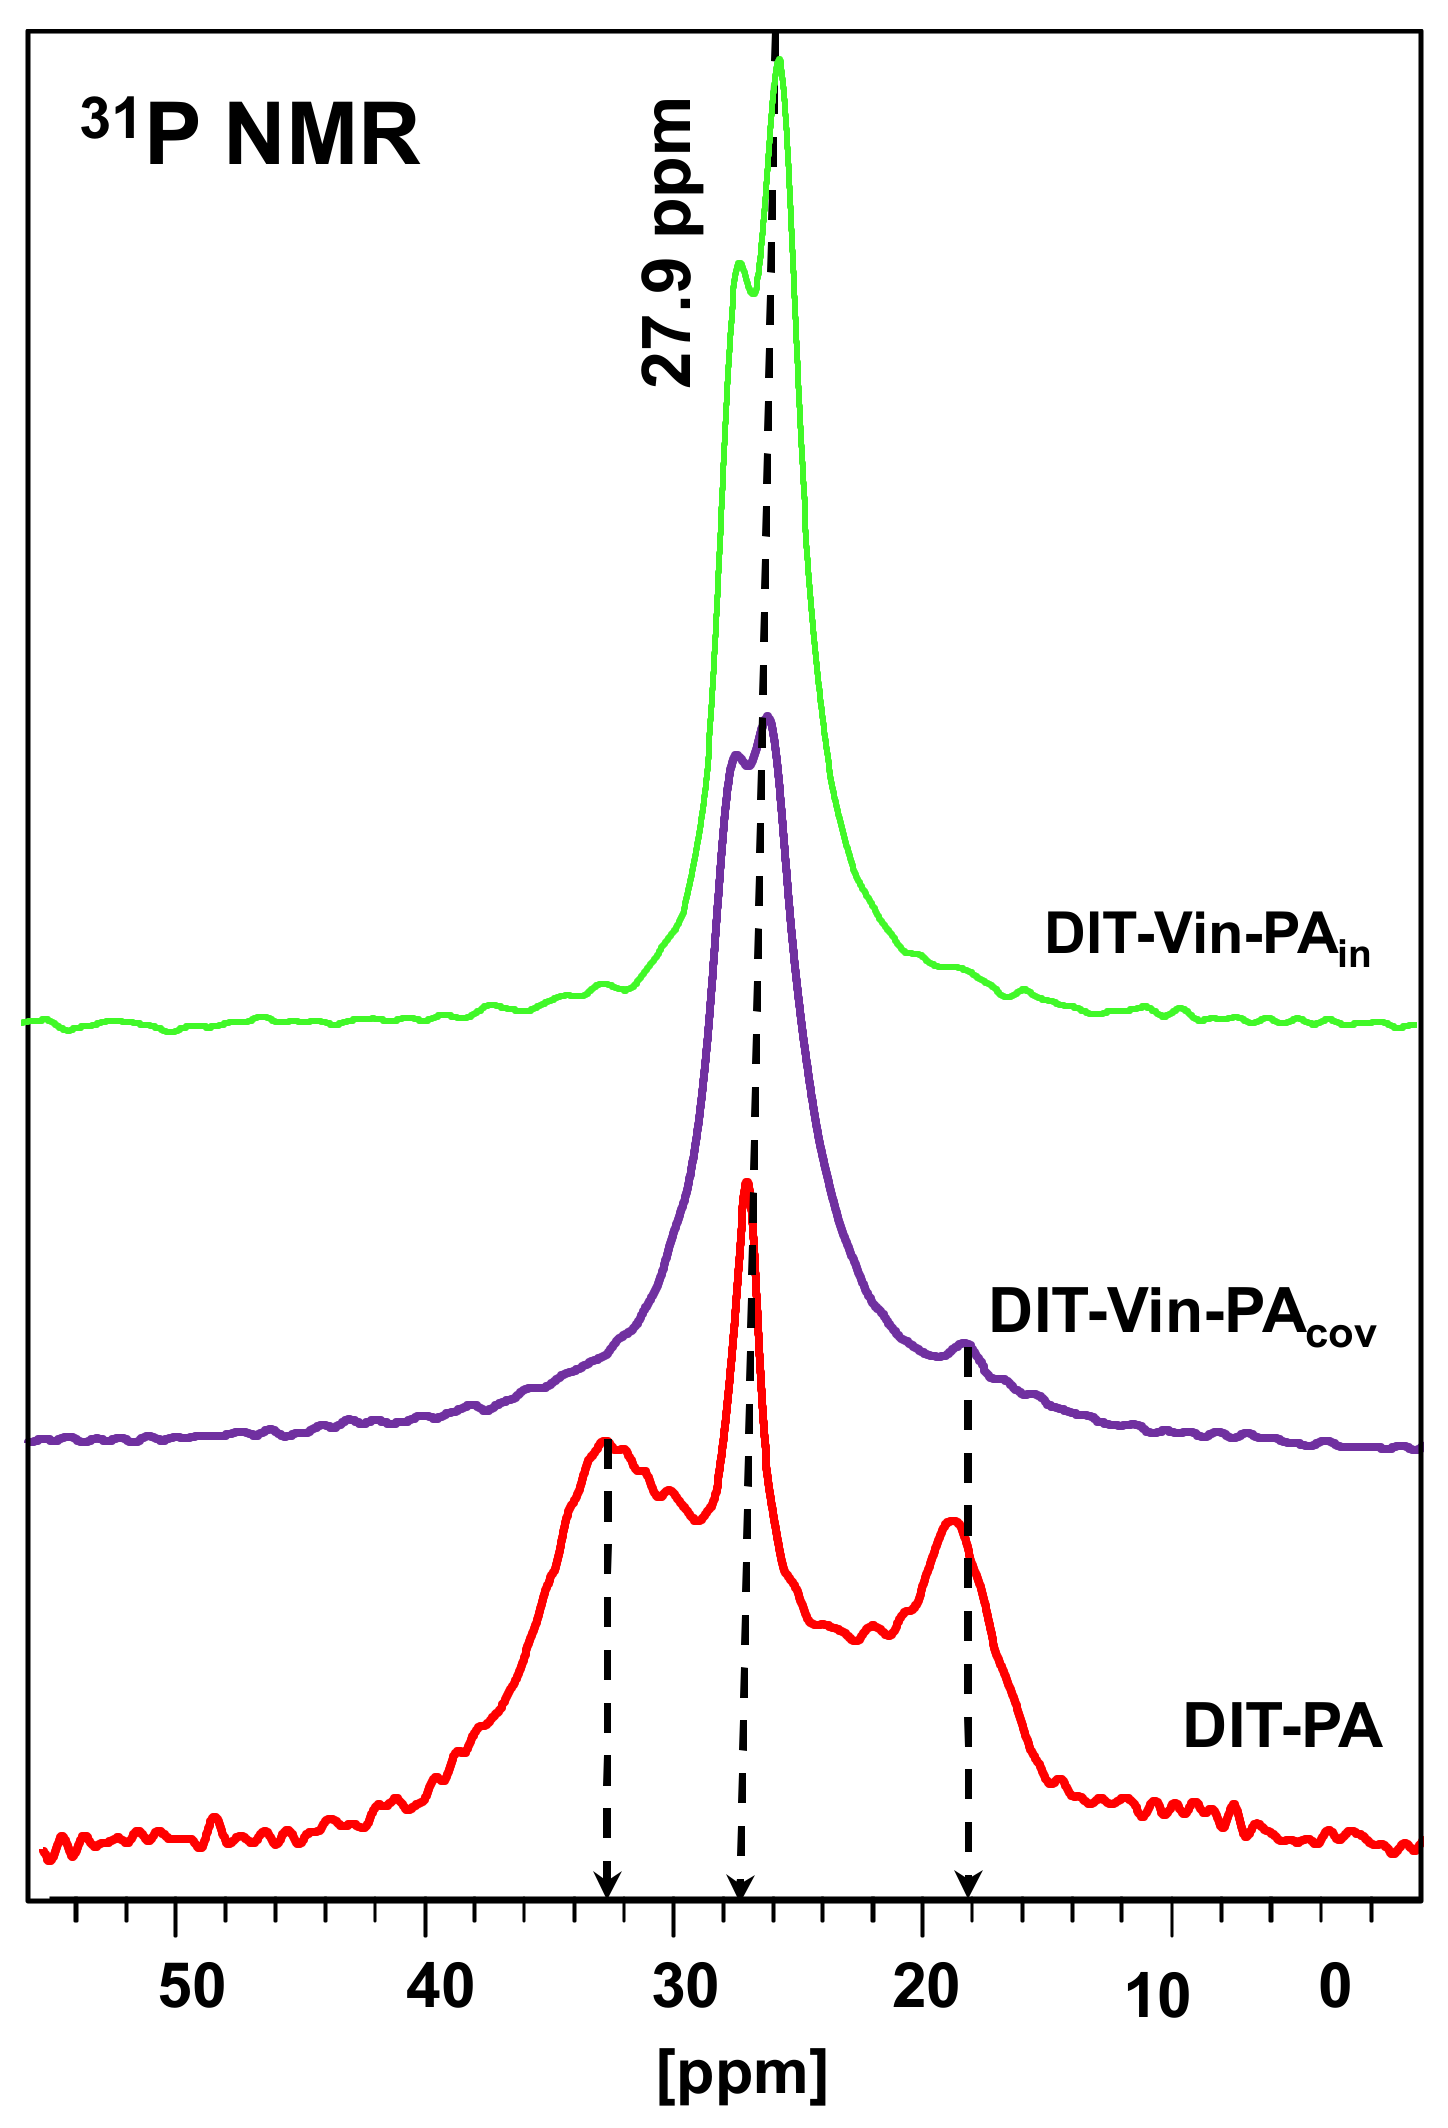
The
31P MAS NMR spectra (
Figure 5) displayed intensive signals only at 28–30 ppm, indicative of the formation of uniform phosphorus environments using both covalent approached for synthesizing the diatomite samples with the immobilized phosphonic groups (
DIT-Vin-PAcov and
DIT-Vin-PAin samples). In the
31P NMR spectra of the phosphonic acids on the diatomite surfaces, there was a low shift and a splitting of the signal into two components: a low-field shift (up to 1–3 ppm) of the narrow component of the doublet due to the physically adsorbed acid molecules and signals of expanded high-field resonances (equaling 5–7 ppm), which could be attributed to the chemicals bounded with the diatomite surface phosphonates by forming the C-OP bonds [
47]. The unsuccessful interaction of the phosphonic acids with the diatomite in the non-polar solvents is due to the instability of the Si-O-P and (Mg/Al)-O-P bonds [
48] in contrast to the DIT-PA sample, which allowed their modification in aqueous media.
The diatomite samples before and after modification were analysed by FTIR spectroscopy. The obtained spectra are shown in
Figure 6.
In the FTIR spectra of all diatomite-based samples, the vibration bands appeared at approximately 1250, 1090, 798, and 470 cm
−1, which could be attributed to the condensed silica network (
Figure 6). The intense broad band observed at 1000–1200 cm
−1 was assigned to the stretching vibration of the Si-O-Si siloxane group framework bonds. In the spectra, only the low peak at 700 cm
−1 represented the bending vibration of the Al–O groups; the peak at 679 cm
−1 indicated the vibration of the Mg-O groups of the diatomite. The characteristic shoulder of the stretching vibrations of Fe-O at 570 cm
−1 did not appear. In addition, the peaks at 2860 cm
−1, 2930 cm
−1, 955 cm
−1, and 842 cm
−1 were caused by the stretching vibration of the –C-H functional groups. The C-H bands in the FTIR spectra of the natural diatomite appeared without the chemical modification of the surface. Diatomite could contain the carbon element because it formed from the accumulation of single-celled aquatic plants of diatoms [
40,
41]. Carbon was the main element of the algae plant. The C-H peak was instead related to the organo-modified materials rather than to the other natural silica-based minerals [
27]. The band at 3750 cm
−1 corresponded to the single silanol groups (SiO-H), and the broad band at 3425 cm
−1 represented the H-bonding vibration of the OH-groups from the Al-OH, Mg-OH, and Si-OH fragments. In addition, the peaks of symmetric stretching vibrations of the SiO-H bonds at 798 and 950 cm
−1 were observed. All these characteristic peaks suggested that the tested diatomite contained mainly silica dioxide. These data are consistent with the XRD analysis.
The chemical modification of the diatomite by the vinyl functional groups was accompanied by the ν(C-H), δ(C-H), and ν(C=C) stretches. The new intensive band around 1385 cm−1 was assigned to the δ(C-H) bending of the vinyl groups. The DIT-Vin-PAin spectrum also did not display transmittances due to ν(SiO-H(isolated)) (3750 cm−1) and ν(SiO-H(vicinal)) (3660 cm−1), reflecting the relatively low concentration of the residual silanols and the hydrophobicity of the sample. The peak intensity of SiO-H and O-H in the modified diatomite was higher than that in the starting diatomite, possibly because the silanization reaction increased the quantity of SiO-H and OH by means of silane incorporation. The νs(P-C) bands at 720–790 cm−1 and νs(P-O) at 1100–1270 cm−1 could not be identified in the real spectra of organo-diatomite because of the overlap with the bands of diatomite (mainly SiO2 matrix) supporting the absorption region.
The evolution of the amount of active functional groups of the diatomite-based samples after various modification approaches was performed by acid–base potentiometric or conductometric titrations [
49]. The shapes of the pH-metric and conductometric titration curves of the natural diatomite using the NaOH solution are shown in
Figure 7.
The pH of the raw diatomite suspension in water was close to 6.2 (neutral),
Figure 7. The conductivity of the aqueous suspension of diatomite in the selected range increased in an almost linear proportion to the quantity of the added NaOH solution. This effect in the conductometric curve of the raw diatomite in relation to H
+/OH
− was due to the weak acid–base properties of the Si-OH or Al-OH proton-active sites on the surface of the solid [
49].
Then, pH titration was used to test whether the natural diatomite was indeed capped by the protolitic-active functional groups (
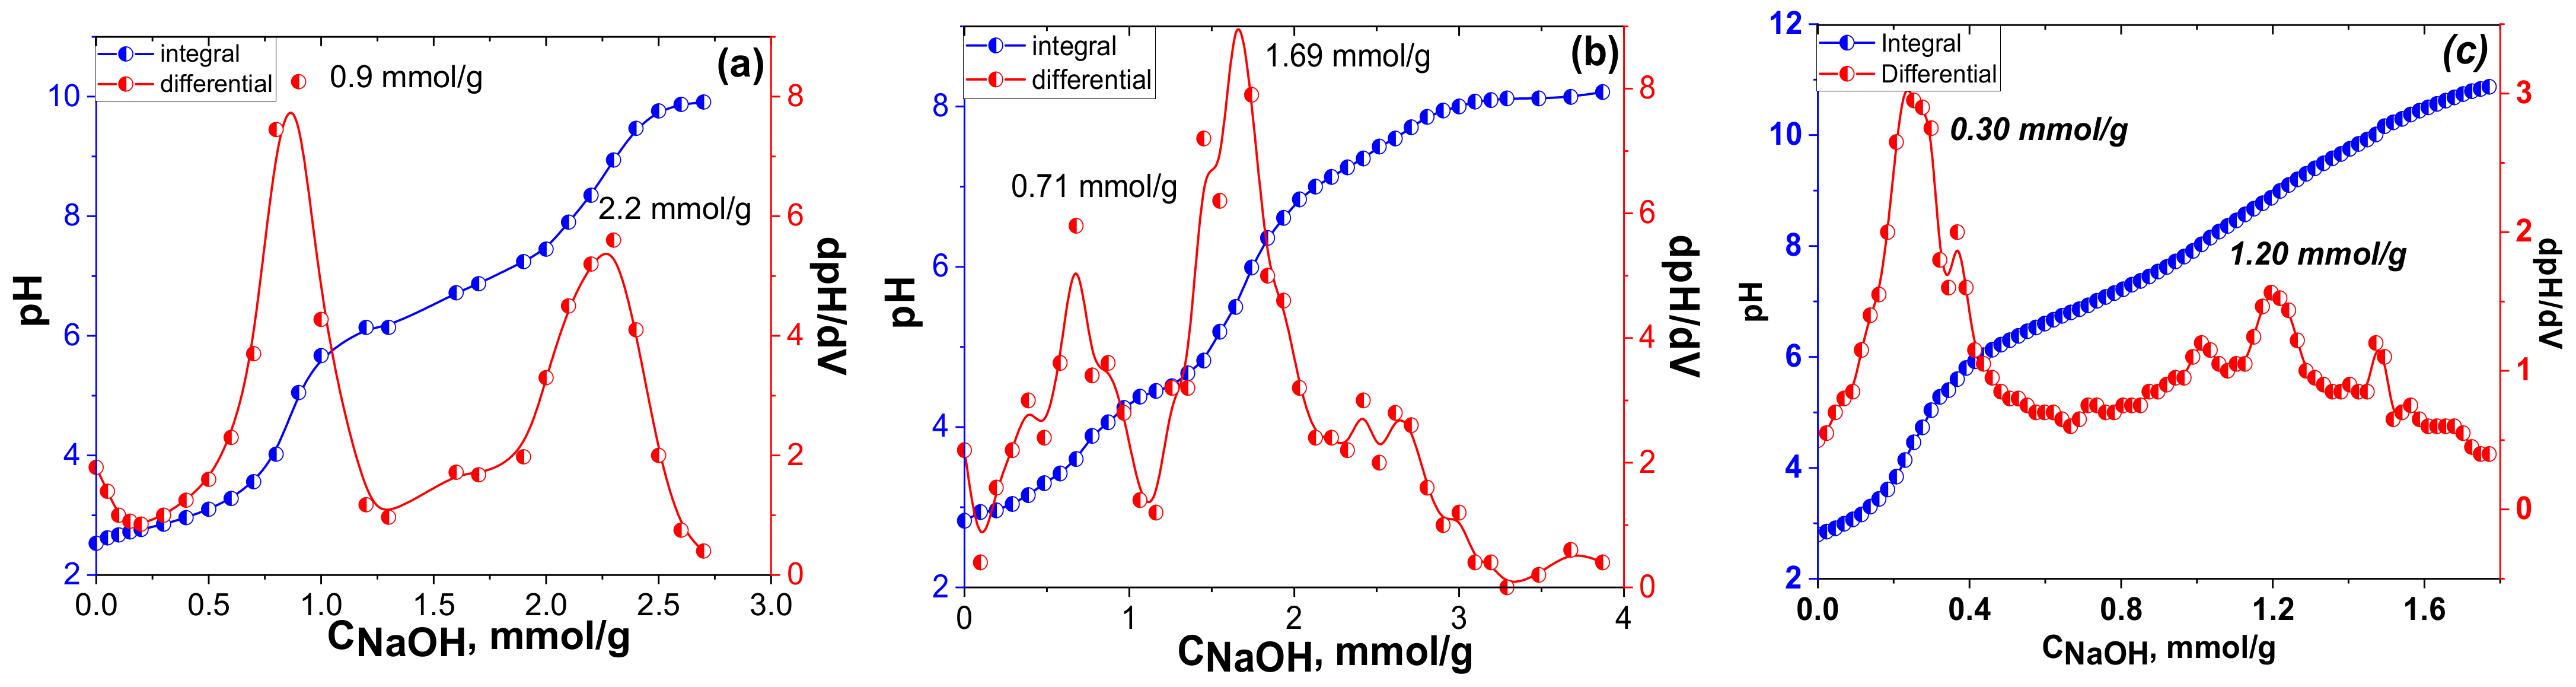
Figure 8). The polyfunctional surface of the obtained material made it difficult to determine the accurate concentration of the acidic centres from the potentiometric titration alone; thus, the corresponding first derivative of the titration curves was applied.
Two equivalence points were clearly defined in the integral curve of the pH-metric titration of a phosphonic acid-group-functionalized diatomite suspension with the NaOH solution (
Figure 8). Such behaviour of the titration curve was indicative of the simultaneous presence of several acid groups of different strengths on the surface. Thus, the interaction of the suspension with the alkali occurred stepwise, similar to the titration of phosphonic acid in solution [
49]. Furthermore, according to the titration data, the concentration of the acidic functional groups on the surface of the
DIT-Vin-PAcov and
DIT-Vin-PAin samples were calculated to be 2.2 mmol/g and 1.69 mmol/g, respectively, thus indicating that the adsorbents with the phosphonic acid groups were successfully synthesized. When using the covalent approach for synthesis of the P-containing adsorbents, the concentration of the functional groups was higher for the time-effective non-covalent approach (
DIT-PA sample).
In addition, the initial value of the pH suspensions of the P-containing diatomite samples was higher than the one for the natural mineral (
Figure 7), which indicated the presence of mobile ions in the solution. This could be due to the dissociation of the phosphonic acid groups. Thus, the proposed covalent immobilization of the functional phosphonic groups on the surface did not significantly change the acidic properties of H
3PO
3 in contrast to the previous results [
49,
50].
To further evaluate the effects of the phosphonic group modification approaches on the adsorption properties of the obtained materials, the starting natural and organo-diatomite samples were used for the U(VI) ions adsorption tests.
3.2. Effects of the Phosphonic Groups Modification of Diatomite on Its U(VI) Ion Adsorption Performance
The pH value is an important parameter influencing the adsorption process, especially by protolithic active P-containing fictionalized materials [
50]. Diatomite, as a material containing mainly silica with some additive of metal oxides, was limited to pH ≥ 9.0 during dissolution in the alkaline media (≡Si-OH
(solid) + NaOH
(solution) ⇒ ≡Si-O
− Na
+ + H
2O or =Al-O-Al=
(solid) + NaOH ⇒ =Al-O
− Na
+ + =Al-O-H). Depending on the nature of the liquid, radioactive wastes may have pH values ranging from 5.7 to 12.3, with the inorganics and radionuclides being the primary contaminants [
51]. Based on these data, the tests were carried out in the pH range from 3 to 9.
Firstly, the pH effect of the U(VI) ions entrapment onto the natural diatomite and the obtained samples was evaluated, as shown in
Figure 9.
It can be clearly observed that the adsorption performance of the obtained adsorbents was highly dependent on the solution pH values, and the U(VI) entrapment efficiency increased gradually with the increasing pH of the solutions (
Figure 9). The removal efficiency of U(VI) was higher for the P-containing diatomite samples than for the raw material, indicating that the dominant mechanism for the U(VI) ion uptake with the modified adsorbents was achieved through an outer-sphere complexation with the functional groups. That particular adsorption behaviour can be attributed to the fact that there may exist one main interaction mechanism during the removal process. The maximum adsorption (92% and 95.5%) occurred at an initial pH near 9 (
Figure 9). Hence, this pH was used in further studies. The obtained effect was particularly satisfactory because the radioactive wastewater from nuclear power plants is usually alkaline [
35,
51].
Additionally, it is worth noting that most of the materials reported in the literature are effective in removing uranyl ions from the neutral pH (4–5), but their efficiency drops significantly in the case of high pH values (
Table 3).
Secondly, the pH initial solutions of the obtained suspensions under consideration were compared with the pH of the solutions in the equilibrium state, and the results are shown in
Figure 10.
As shown in
Figure 10, the pH values were significantly changed for the adsorption of the U(VI) ions by the studied adsorbents from the aqueous solutions. The decrease in pH upon adsorption of the U(VI) ions by the P-containing samples (
DIT-Vin-PAcov,
DIT-PA and
DIT-Vin-PAin) was higher compared with the natural diatomite. In the case of
DIT-Vin in the entire range of the initial pH of 3–10, the pH value in the equilibrium solutions was near 4.1, while for
DIT-Vin-PA, this value was much lower and amounted to 3.1–3.6. This could be attributed to the fact that the phosphonic functional groups on the surfaces of
DIT-PA, DIT-Vin-PAcov, and
DIT-Vin-PAin were able to form stable chelates with U(VI). It is clear that the sorption process was scarcely influenced at all the pH values, suggesting that the dominant mechanism is inner-sphere surface complexation rather than outer-sphere surface complexation or ion exchange [
31,
50]. The highest adsorption capacity in the entire tested pH range was found for the
DIT-Vin-PAcov and
DIT-Vin-PAin samples.
The pH effect on the U(VI) ion sorption could be explained by the surface characteristics of the adsorbents and the speciation of the metal forms in the solute. The curves representing the change in U(VI) adsorption percentage with pH were calculated with MINTEQ 3.1 (
Figure 11).
The existence of uranyl ion (UO
22+) is possible only at pH values ≤ 2.5 (
Figure 11). As the solution pH was increased, the amounts of UO
22+ substantially decreased with the increasing pH due to the processes of hydrolysis and complexation. The complex products with carbonate ions, such as UO
2CO
3, UO
2(CO
3)
22−, and UO
2(CO
3)
34− species, were formed. However, U(VI) ions were present in the real water supplies as anionic carbonate complexes, UO
2(CO
3)
2−2, and UO
2(CO
3)
3−4 at 5.0·mmol/L of HCO
3−/CO
32− ions in the real aqueous solution because of the shift in the carbon dioxide balance. Thus, under standard environmental water (pH 7–7.5) and wastewater (pH 8–8.5) conditions, uranium typically occurs in anionic carbonate forms. Hence, the solution pH is a crucial parameter for the removal of U(VI) ions.
Thus, when the pH value was lower, the surfaces of the P-containing adsorbents exhibited an acidic form, leading to the low adsorption ability of the adsorbents for the predominant positively charged forms of the U(VI) ions (
Figure 11). Along with the increase in the pH value, the surface of the adsorbent became negatively charged due to the deprotonation process, so that the attraction between the adsorbent and U(VI) likely strengthened the interaction between the two. However, with further increases in the pH value, the adsorption capacity remained unchanged. The removal of the U(VI) ions likely resulted from the formation of the different uranyl hydroxide and carbonate complexes that were negatively charged, resulting in the decrease in the pH suspension at the uptake of the U(VI) ions. Such a change in pH during the adsorption process provided a large share of the ion exchange reaction with the hydronium H
3O
+ ions and the interaction with OH
− ions as competing ions for the U(VI) ions.
To investigate the maximum adsorption capacities of the adsorbents, the isotherm adsorptions of U(VI) ions were studied at pH 5.5. In addition, the influence of the temperature (293 K and 323 K) changes in the concentration of the U(VI) ions on the obtained adsorbents was investigated (
Figure 12). Equilibrium experiments at the isotherm conditions are considered to be an effective process to understand the adsorption mechanisms in the purification processes [
10,
15].
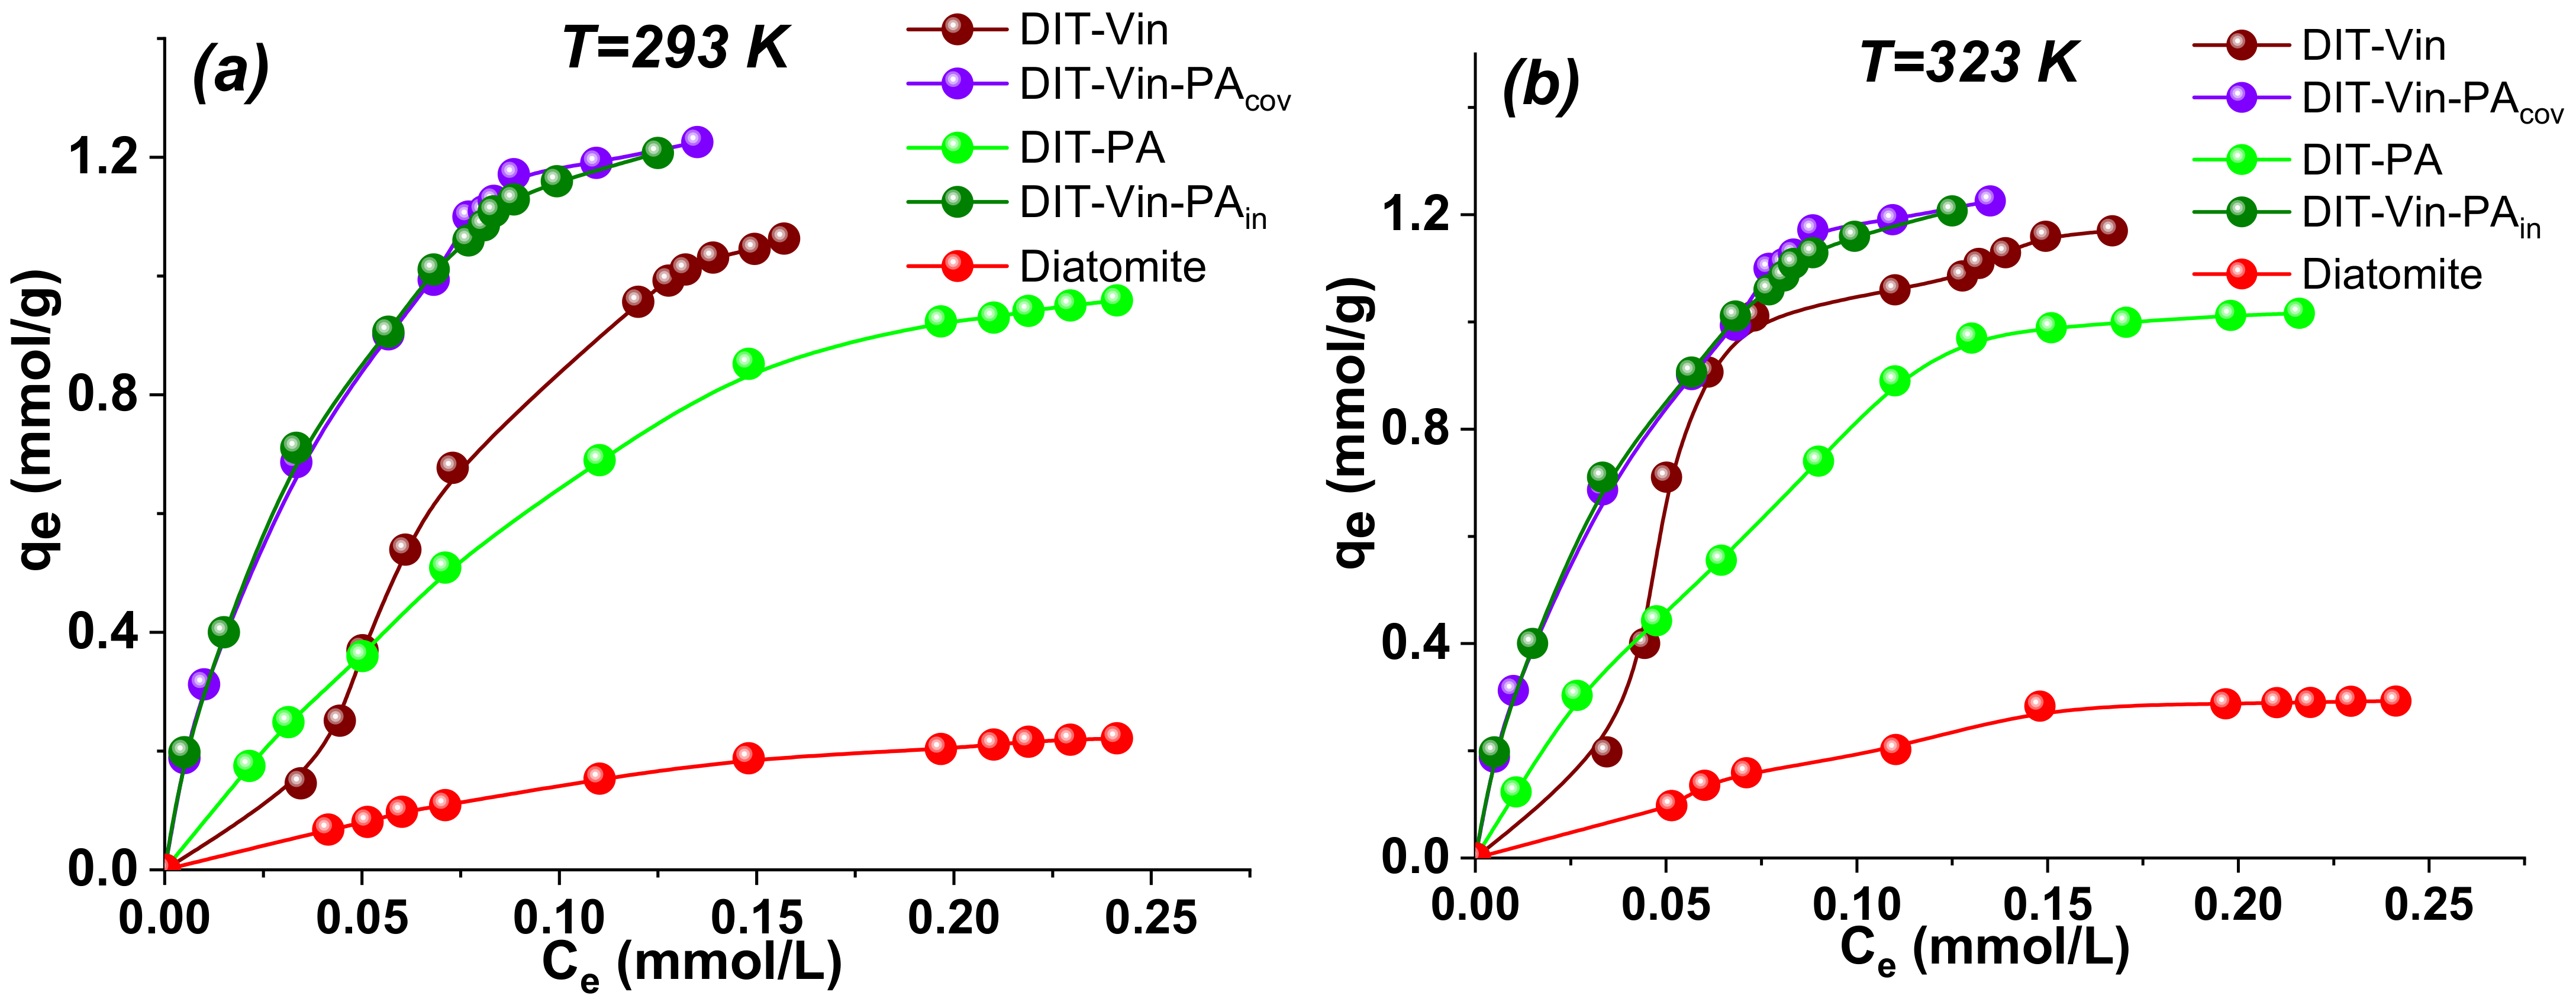
The results of
Figure 12 demonstrated that the adsorption capacity of obtained materials increased with the increasing equilibrium concentration of the U(VI) ions, progressively saturating all the studied adsorbents. The sorption characteristics of the modified samples were much higher as compared with those for the pristine diatomite. At the same time, the adsorption isotherm of the U(VI) ions on the
DIT-Vin was σ-shaped, with an asymmetrically convex shape; thus, this was an
S2-type isotherm according to the Giles classification [
52]. In contrast, the adsorption isotherms of the U(VI) ions on the
DIT-Vin-PAcov and
DIT-Vin-PAin samples were
L2-type and symmetrically convex throughout the concentration range, confirming the chemisorption mechanism removal of the analyte. A preliminary estimation of the initial part of the isotherm slopes—because these are largely determined by the affinity of the adsorbate for the adsorbent, and accordingly, the
DIT-Vin-PAcov and
DIT-Vin-PAin samples—showed the highest affinity toward the U(VI) ions and the lowest affinity toward the natural diatomite.
In addition, the adsorption capacities of the adsorbents at room temperature increased after the modification of the natural diatomite (
Figure 12a). For instance, the adsorption capacities of the raw diatomite,
DIT-Vin,
DIT-PA,
DIT-Vin-PAcov, and
DIT-Vin-PAin toward the U(VI) ions were 0.22 mmol/g (59.4 mg/g), 1.02 mmol/g (275.4 mg/g), 0.96 mmol/g (256.83 mg/g), 1.22 mmol/g (325.7 mg/g), and 1.21 mmol/g (323.0 mg/g), respectively, indicating the highest adsorption capacities for the
DIT-Vin-PAcov sample. In fact, the adsorption performance of
DIT-Vin-PAcov was close to that of
DIT-Vin-PAin, indicating that using an initiator during the synthetic process did not significantly increase the adsorption capacity of the adsorbents toward the U(VI) ions. The adsorption capacity of the phosphoric acid chemically modified diatomite samples was more than 5-fold greater than that on the natural diatomite, demonstrating that the silylation of the diatomite significantly increased its adsorption capacity. At the same time, the phosphoric acid activated diatomite (
DIT-PA sample) had the advantages of availability of the reagents, simple synthesis, and good adsorption capacity. In addition, the radionuclide-saturated DIT-PA sample could be transformed into ceramics at temperatures up to 1000 °C for subsequent long-term burial.
Additionally, the maximum adsorption capacity of the samples toward the U(VI) ions reached the concentration of the functional groups of samples according to the titrations data (
Figure 8). In this case, there was one phosphonic group for every uranyl ion, so the ratio was 1:1. According to the Lewis acid–base theory, uranium(VI) tends to chelate and coordinate with oxygen-containing anions to form stable coordination bonds [
1,
39]. According to this theory, we can conclude that the oxygen atoms in the phosphonic groups of diatomite chelated with the U(VI) ions.
On the basis of the obtained experimental data and the results presented in the literature, we could assume the possibility of complex formation of different compositions for the considered metals by analogy to the solutions, i.e., with other coordination numbers of the central atom. In this regard, using the model of the chemical reactions [
50], the stability constants of some complexes were calculated. The equilibrium data used in the calculation of these constants are presented in
Table 4.
From the calculations, it follows that under the conditions of the experiment, complexes of these metals in a ratio of 1:1 are formed, and at the least, their concentrations are not more than two orders of magnitude lower than the error. For the uranyl(VI) ions, the most probable was the formation of complexes of a 1:1 composition because, in the case of complexes of composition ML
2 and ML
3, the error was quite significant. Overall, the complex formation based on the equilibrium calculations agreed well with the isotherm adsorption data (
Figure 12a).
From
Figure 12b, the value of the adsorption capacity of the samples toward the U(VI) ions increased (near 10%) with the increasing solution temperature, suggesting that increasing the temperature from 298 K to 323 K favoured the adsorption. This could also confirm the noticeably greater influence of the temperature on the adsorption process for these adsorbents.
To optimize the design of an adsorption system for the target ions, the relationship between the equilibrium concentration (
Ce, mmol/L) and the adsorption capacity (
QS, mmol/g) could be characterized by essential isothermal models, including the Langmuir, Freundlich, and Dubinin–Radusckevich models [
53,
54,
55]. These are the most frequently used models to describe adsorption isotherms to predict the adsorption mechanism. The Langmuir, Freundlich, and Dubinin–Radushkevich equations are expressed in linear forms:
where
Ce is the concentration of the analyte solution at equilibrium (mmol/L);
QS is the corresponding amount of the analyte adsorbed on the adsorbent at equilibrium (mmol/g);
Qmax (mmol/g) and
KL (L/mmol) are constants related to the maximum adsorption capacity and energy of adsorption, respectively;
KF is the Freundlich constant (mmol
1−1/n L
1/n/g);
n is a constant, which measures the intensity;
KD-R is the Dubinin–Radushkevich constant (mol
2/kJ
2); and
ɛ is the Polanyi element. The energy of adsorption
E can be calculated from the formula: E = 1/(2 × K
D-R)
0.5.
The linearized forms and the corresponding fitting parameters of the adsorption isotherms of U(VI) ions on the obtained sorbents according to various models are listed in
Figure S3 and
Table 5, respectively.
Studies on the parameters of the isotherms and coefficients of correlation (
Table 5) show that the Langmuir and Freundlich models are the best for describing the U(VI) adsorption on the natural diatomite. From
Table 5, it can be observed that the correlation coefficients for the Freundlich isotherm model for the
DIT-Vin sample (R
2 = 0.927) were higher compared with those for the Langmuir (R
2 = 0.44) model. The Freundlich isotherm assumes the existence of multilayer sorption and the presence of energetically differentiated active sites on the adsorbent surface. An important parameter is the 1/n ratio, which is an indicator of the variation in free enthalpy associated with the sorption from the solution by the various components of the heterogeneous sorbent. In the case of the
DIT-Vin-PAcov,
DIT-PA, DIT-Vin-PAin, and raw diatomite adsorbents, when 1/n < 1, the isotherm had a convex shape, which indicated that the added U(VI) ions reacted with the centres with less and less free enthalpy. While 1/n > 1, for the
DIT-Vin sorbent, the isotherm had an increasing concave course, from which it could be concluded that the greater amount of uranium ions on the surface increased the free enthalpy of the process. In this case, the best fit of the experimental results was obtained from the Freundlich model (R
2 = 0.927).
The adsorption isotherms of the
DIT-PA,
DIT-Vin-PAcov, and
DIT-Vin-PAin samples fit the Langmuir model well (R
2 = 0.977, 0.99, and 0.993). The Langmuir theory has basic assumptions—the surface containing the adsorbing sites on which the adsorption occurs is a perfectly flat plane with no folds, and each site can hold at most one molecule of adsorbent (mono-layer coverage only). These assumptions suggest that the U(VI) ions were adsorbed in the form of monolayer coverage on the surface of the
DIT-PA, DIT-Vin-PAcov, and
DIT-Vin-PAin samples. Additionally, the maximum adsorption capacity of the samples towards the U(VI) ions was higher than the adsorption capacities of other the obtained adsorbents and the adsorbents alone in the literature (
Table 3).
The Dubinin–Radushkevich isotherm equation was used to estimate the adsorption energy [
55].
Table 5 shows that the values of the adsorption energy for the
DIT-Vin-PAcov,
DIT-PA, and
DIT-Vin-PAin adsorbents were in the range of 8–9 kJ/mol, which may suggest a mixed (i.e., both physical and chemical) adsorption mechanism. The adsorption energy was increased with the increasing temperature for all diatomite-based adsorbents, which was characteristic for chemisorption. Chemical adsorption usually requires high activation energy and is a relatively slow process. Its speed can be increased by increasing the temperature. The heat of adsorption is of the same order as the chemical reactions and usually amounts to several kJ/mol. It decreases as the degree of coverage of the adsorbent surface increases. There were different adsorption centres in the case of the
DIT-PA and
DIT-Vin-PAin adsorbents. One of them was based on the weak van der Waals interaction of the adsorbate with the adsorbent. This was responsible for the desorption of the U(VI) ions from the surface of the sample. On the other hand, for other adsorption sites which required more adsorption energy, the adsorbent and the adsorbate interacted by a chemical reaction.
The temperature dependence of the adsorption process was associated with changes in several thermodynamic parameters, such as the standard Gibbs free energy change (ΔG°), standard enthalpy change (ΔH°), and standard entropy change (ΔS°) of adsorption, which were calculated using the following equations:
where R is the gas constant (8.314 J/mol K) and T is the temperature (K).
The parameters calculated via the thermodynamic equations are shown in
Figure S4 and
Table 6.
The values of ΔG° were found to be from −3.40 to −9.05 kJ/mol. The negative value of ΔG° indicated that the adsorption reaction was spontaneous. The Gibbs free energy decreased with the increase in the temperature, which suggested that the higher temperature may have facilitated the adsorption uranium (VI) ions on the obtained samples due to a greater driving force of the adsorption.
The positive value of ΔH° showed the endothermic nature of the adsorption process. It is well known that adsorption processes are, in most cases, exothermic [
15], and generally, an exothermic adsorption process signifies either physi- or chemisorption. The positive ΔS° values displayed the affinity of adsorbents toward U(VI) ions, incarnating some structural changes.


 ,
, 


