Article

Deterioration of Cement-Based Materials in Low-Temperature Seawater

by
Mari Kobayashi
1,*,
Keisuke Takahashi
1 and
Yuichiro Kawabata
2
1
Mitsubishi UBE Cement Corporation, 1-6 Okinoyama, Yamaguchi 755-8633, Japan
2
Port and Airport Research Institute, 3-1-1 Nagase, Kanagawa 239-0826, Japan
*
Author to whom correspondence should be addressed.
Materials 2023, 16(15), 5278; https://doi.org/10.3390/ma16155278
Submission received: 27 June 2023 / Revised: 21 July 2023 / Accepted: 25 July 2023 / Published: 27 July 2023
(This article belongs to the Section Construction and Building Materials)

Abstract

:
Cementitious materials have potential for infrastructure development in low-temperature marine environments, including in seawater at high latitudes and in deep-sea environments (water depths of >1000 m). Although the marine deterioration of cementitious materials has been widely investigated, the influence of seawater temperature has not been elucidated. In this study, to determine the effects of low-temperature seawater on the durability of cementitious materials, cement paste specimens were immersed in a seawater tank at room temperature and 2 °C for 433 days. The specimen immersed in low-temperature seawater exhibited significant deterioration with a partially collapsed surface, whereas the specimen immersed in room-temperature seawater maintained its original shape. Following low-temperature immersion, Ca dissolution was more pronounced and dissolved portlandite, decalcified calcium (alumino)silicate hydrate (C–(A-)S–H), magnesium (alumino)silicate hydrate (M–(A-)S–H), and thaumasite were observed on the collapsed surface. Such significant deterioration can be attributed to the increased solubility of portlandite under low-temperature conditions, which could promote Ca dissolution and subsequently lead to C–(A-)S–H decalcification and the formation of M–(A-)S–H and thaumasite. These insights are expected to contribute to the successful construction and maintenance of cementitious structures in low-temperature seawater.

1. Introduction

The marine deterioration of cementitious materials has been studied extensively [1,2,3,4,5,6,7,8,9,10,11] because the variety of potentially aggressive ions present in seawater results in marine concrete structures having much shorter lifetimes than land-based structures [12]. Numerous ions are present in seawater, including chloride (Cl), sodium (Na+), magnesium (Mg2+), sulfate (SO42−), calcium (Ca2+), and carbonate and bicarbonate ions (CO32− and HCO3). The ingress of Cl into reinforced concrete structures can cause severe cracks, resulting in the corrosion of steel reinforcements and a short service life [13]. In addition, the ion concentration gradient at the interface between concrete and seawater can act as a driving force for diffusion, causing the ions in seawater to diffuse into the concrete, whereas Ca2+ and hydroxide ions (OH) in the concrete are leached out. The leaching of Ca2+ and OH leads to damage via the dissolution of portlandite and the decalcification of calcium (alumino)silicate hydrate (C–(A-)S–H), which are the main components of cement hydrates. Moreover, the ions originating from seawater can interact with the cement hydrates to form noncementitious hydrates, resulting in gradual degradation.
Upon diffusion into hardened cement specimens, Cl can substitute SO42− in the monosulfate to form Friedel’s salt (3CaO·Al2O3·CaCl2·10H2O) or Kuzel’s salt (3CaO·Al2O3·0.5CaCl2·0.5CaSO4·10H2O) [14,15,16]. Cl can also be adsorbed on C–(A-)S–H [17,18,19]. These processes are believed to be harmful to binders.
Following ingress, Mg2+ from seawater can react with OH in the pore solution (pH > 9.4) to form brucite (Mg(OH)2) [2], which consumes OH and lowers the alkalinity of the pore solution, thereby promoting the dissolution of portlandite and decalcification of the C–(A-)S–H phase [20,21]. When the brucite phase becomes undersaturated at lower pH values, Mg2+ can precipitate by reacting with decalcified C–S–H or amorphous silica derived from Ca-deficient C–S–H [22,23], leading to the formation of magnesium silicate hydrate (M–S–H). The M–S–H phase has a weak talc-like structure, which can cause the collapse of specimen surfaces [24,25].
SO42− from seawater can form ettringite (3CaO·Al2O3·3CaSO4·32H2O) and gypsum (CaSO4·2H2O). However, owing to the low SO42− concentration in seawater, no or negligible gypsum formation occurs [11,26]. Furthermore, ettringite formation does not typically lead to serious SO42− attack on concrete exposed to seawater. Even with SO42− enrichment and ettringite formation, a lack of damage, such as cracking and spalling, has been reported [9,27]. Degradation resulting from ettringite formation during SO42− attack is generally ascribed to the crystallization pressure from a supersaturated solution [28,29]. Although the reason for the lack of deterioration in the sulfur-rich zone remains unclear, other ions in seawater may affect the solubility or supersaturation of ettringite [9].
HCO3 and CO32− from seawater can react with Ca2+ ions in the pore solution to form calcium carbonate. At temperatures below 15 °C, the presence of reactive silica derived from decalcified C–(A-)S–H, SO42−, and HCO3 and CO32− induce the formation of thaumasite (CaSiO3·CaCO3·CaSO4·15H2O) [8,30]. This process transforms the matrix into a soft mass without any binding capacity [30].
The durability of cementitious materials has been investigated in various marine environments, as exemplified in Table 1. Previous studies have been conducted in shallow sea areas or laboratories, and most provided no information on the temperature of the test area. Table 1 lists the minimum and maximum seawater temperatures near the test area, as obtained from a database [31]. Although certain studies have investigated the deterioration of concrete under harsh testing conditions [1,7,9,10], the durability of cementitious materials has not yet been measured at constant low temperature. Moreover, the property changes measured in these studies were combined with those measured for freeze-thaw deterioration. The temperature of the surface layer varies naturally with the season, even in the same area, and relatively low temperatures occur at high latitudes. As temperature influences the diffusion of ions from seawater into concrete, the durability of concrete structures is expected to be affected by temperature. Furthermore, the stability and solubility of the hydrates constituting cementitious materials are expected to depend on temperature, which could also affect durability. Reports on sulfate attack have suggested that low temperatures can accelerate deterioration. Kobayashi et al. and Takahashi et al., who investigated the durability of cement mortars under deep-sea conditions at 2–4 °C, found that that deterioration of cementitious materials was significantly promoted [32,33]. Although the mechanisms of severe deterioration are not fully understood, low temperatures may play an important role. However, no studies have focused on the effects of low temperatures on the marine degradation of cementitious materials. An improved understanding of and experimental data related to the influence of low-temperature seawater on the durability of cementitious materials would facilitate the successful construction and subsequent maintenance of cement-based concrete structures under very low-temperature conditions, such as in deep seas and Antarctica.
In this study, the effects of low-temperature seawater on the durability of cementitious materials were investigated. Cement paste specimens were immersed in water tanks controlled at 2 °C or room temperature for 433 days. After immersion, changes in the hydrate phases of the specimens were analyzed using X-ray diffraction (XRD), scanning electron microscopy–energy-dispersive X-ray spectroscopy (SEM-EDS), 29Si nuclear magnetic resonance (NMR) spectroscopy, and electron probe microanalysis (EPMA). In addition, the differences in the durability of cementitious materials due to varying seawater temperatures are discussed.

2. Experimental Method

2.1. Materials and Sample Preparation

Portland cement (PC) was used for the paste specimens. The chemical composition of the PC was determined by X-ray fluorescence (XRF) (Simultix 14, Rigaku Corporation, Tokyo, Japan) analysis according to the JIS R 5204 standard [34] (Table 2). The paste mix was originally designed for antiwashout underwater concrete. The mix proportions of the paste specimens are listed in Table 3. The paste had a water-to-cement ratio of 0.6 and contained a polycarboxylic ether (PCE) superplasticizer (BASF Construction Additives GmbH, Trostberg, Germany), hydroxypropyl methylcellulose (HPMC) thickener (Shin-Etsu Chemical Co., Ltd., Tokyo, Japan), and defoamer (ADEKA CORPORATION, Tokyo, Japan). The paste was mixed using a mechanical mixer at 700 rpm for 2 min and cast into a 40 × 40 × 160 mm3 mold. The specimens were then sealed and cured at 20 °C for 28 days before seawater immersion.

2.2. Laboratory Immersion Tests

Two water tanks with volumes of 216 L were prepared for specimen immersion in room-temperature seawater and in low-temperature seawater. Room-temperature seawater consisted of seawater in a laboratory where the room temperature was not precisely controlled. The temperature of the seawater was monitored over 1 year, and the maximum and minimum recorded temperatures were 27 and 10 °C, respectively. The temperature of the low-temperature seawater was controlled at 2 ± 1 °C using a thermocontroller. Fresh seawater from the Kurihama Bay was supplied to each tank at a flow rate of 150 mL/min, and the seawater in the tank was replaced approximately every 24 h. The specimens were immersed in the tanks for 433 days.

2.3. Characterization Methods

After the immersion test, each specimen was sliced into two pieces with a thickness of 10 mm using a table bench saw with liquid paraffin, as shown in Figure 1. For EPMA, one sample was impregnated with epoxy resin, polished, and coated with carbon. After EPMA, the sample was cut into 20 × 20 × 10 mm3 pieces and polished again for SEM-EDS analysis. The other sample was cut using a low-speed cutter (IsoMet Cutter, Buhler, Lake Bluff, IL, USA) into 2 mm slices from the surface to a depth of 10 mm, and the remaining sample was denoted as the bulk sample. Mashy collapsed areas on the surface of the specimen immersed in low-temperature seawater were collected directly and denoted as the collapsed surface sample. Each piece was crushed to pass through a 5 mm sieve and treated with isopropanol to stop hydration. For the dehydration process, the samples were immersed in isopropanol and the solvent was changed after 6 h and again after 24 h. Then, after immersion for 7 days, the samples were dried in a thermostatic bath at 35 °C for 1 h. Finally, the samples were ground into a powder of less than 90 μm.

2.3.1. XRD Analysis

XRD patterns were collected using a D2 PHASER diffractometer (Bruker AXS GmbH, Karlsruhe, Germany) in a θ–2θ configuration with Cu-Kα radiation (λ = 1.54 Å) at a voltage of 30 kV and current of 10 mA with steps of 0.02° and a speed of 2.4°/min in the 2θ range of 5–70°. Phase identification was performed using the TOPAS software (DIFFRAC. TOPAS, Version 5).

2.3.2. EPMA

EPMA allows for the quantitative analysis of the atomic distribution in a cross-sectional area [35]. Elemental mapping was obtained based on the characteristic X-ray intensity measured for each element, where the mass percentages were converted using the ZAF correction. The EPMA samples consisted of 10 mm thick slices, as shown in Figure 1, which were dried for 2 weeks under vacuum conditions and then embedded in epoxy resin. After the epoxy resin hardened, the surface was dry polished using #120–#4000 grit SiC grinding paper. The polished surface was then sputter coated with a conductive carbon layer.
EPMA was performed using a JXA-8200 instrument (JEOL, Ltd., Tokyo, Japan). SO3, Cl, MgO, Al2O3, and CaO were measured using a wavelength-dispersive spectrometer with an acceleration voltage of 15 kV, probe diameter of 50 µm, unit measurement time of 40 ms/point, pixel size of 100 µm, and beam current of 200 nA.

2.3.3. SEM-EDS Analysis

SEM-EDS measurements were performed using a scanning electron microscope equipped with a backscattering electron detector and an X-ray energy-dispersive spectrometer (JSM-IT-300, JEOL, Ltd., Tokyo, Japan). An accelerating voltage of 15 kV and working distance of 10.0 mm were used. A high-resolution set of backscattered electron (BSE) images was acquired to analyze the macro–micro information. An SEM montage was constructed by electronically stitching together 92 BSE images obtained at a magnification of 200×. The area and amount of microcracks in the sections of the SEM montage were calculated using the ImageJ software (Version v1.54d, National Institutes of Health, Bethesda, MD, USA), and the result of this calculation was defined as the porosity.
For EDS measurements, a volume of paste comprising a mixture of phases was examined while avoiding cracks and aggregates. The EDS point analysis results are presented as atomic ratios in dot plots and are compared with the theoretical compositions of typical hydrate and mineral phases that were considered to form in the paste (Appendix A and Appendix B). The mixture of phases in the paste volume observed by EDS analysis falls within the theoretical composition of these phases.

2.3.4. Magic-Angle Spinning (MAS) NMR Spectroscopy

Solid-state 29Si MAS NMR measurements were performed on an ECA 400 spectrometer (magnetic field: 9.2 T, JEOL Resonance) using the powdered collapsed surface sample employed for XRD analysis. Before loading, the sample was packed in a 4.0 mm zirconia rotor. 29Si MAS NMR spectra were acquired by collecting more than 3360 scans at a spinning speed of 16 kHz, 90° pulse duration of 3.8 μs, and relaxation delay of 40 s without 1H decoupling. The 29Si MAS NMR chemical shifts were referenced to those of an external tetramethylsilane (TMS) sample (δ29Si = 0.0 ppm). The 29Si NMR signals were analyzed using the Qn classification, in which a Si tetrahedron is connected to n Si tetrahedrons with n varying from 0 to 4.

3. Results

3.1. Visual Changes

Figure 2 shows the paste specimens after immersion in seawater in the laboratory for 433 days. The specimen immersed in room-temperature seawater was not significantly damaged, although the surface was covered with white precipitates of brucite. In contrast, the specimen immersed in low-temperature seawater exhibited significant surface deterioration. The specimen was partially collapsed, did not maintain its original shape, and had a fragile and mashy structure.

3.2. Elemental Mapping by EPMA

Elemental maps of each specimen were obtained to analyze ion diffusion from seawater and the associated dissolution of ions from the cement hydrate (Figure 3). For the specimen immersed in room-temperature seawater, changes in the chemical composition only occurred on the surface. However, the specimen immersed in low-temperature seawater showed changes in the chemical composition at greater depths. For example, Ca dissolution and SO42− diffusion fronts were present inside the low-temperature specimen. In addition, the corner area where the specimen collapsed had significantly lower Ca concentrations and higher Mg concentrations. This area of high Mg concentrations suggests the formation of a Mg phase, which is discussed in detail based on the EDS results. Overall, elemental mapping by EPMA revealed that specimen degradation was promoted by immersion in low-temperature seawater.
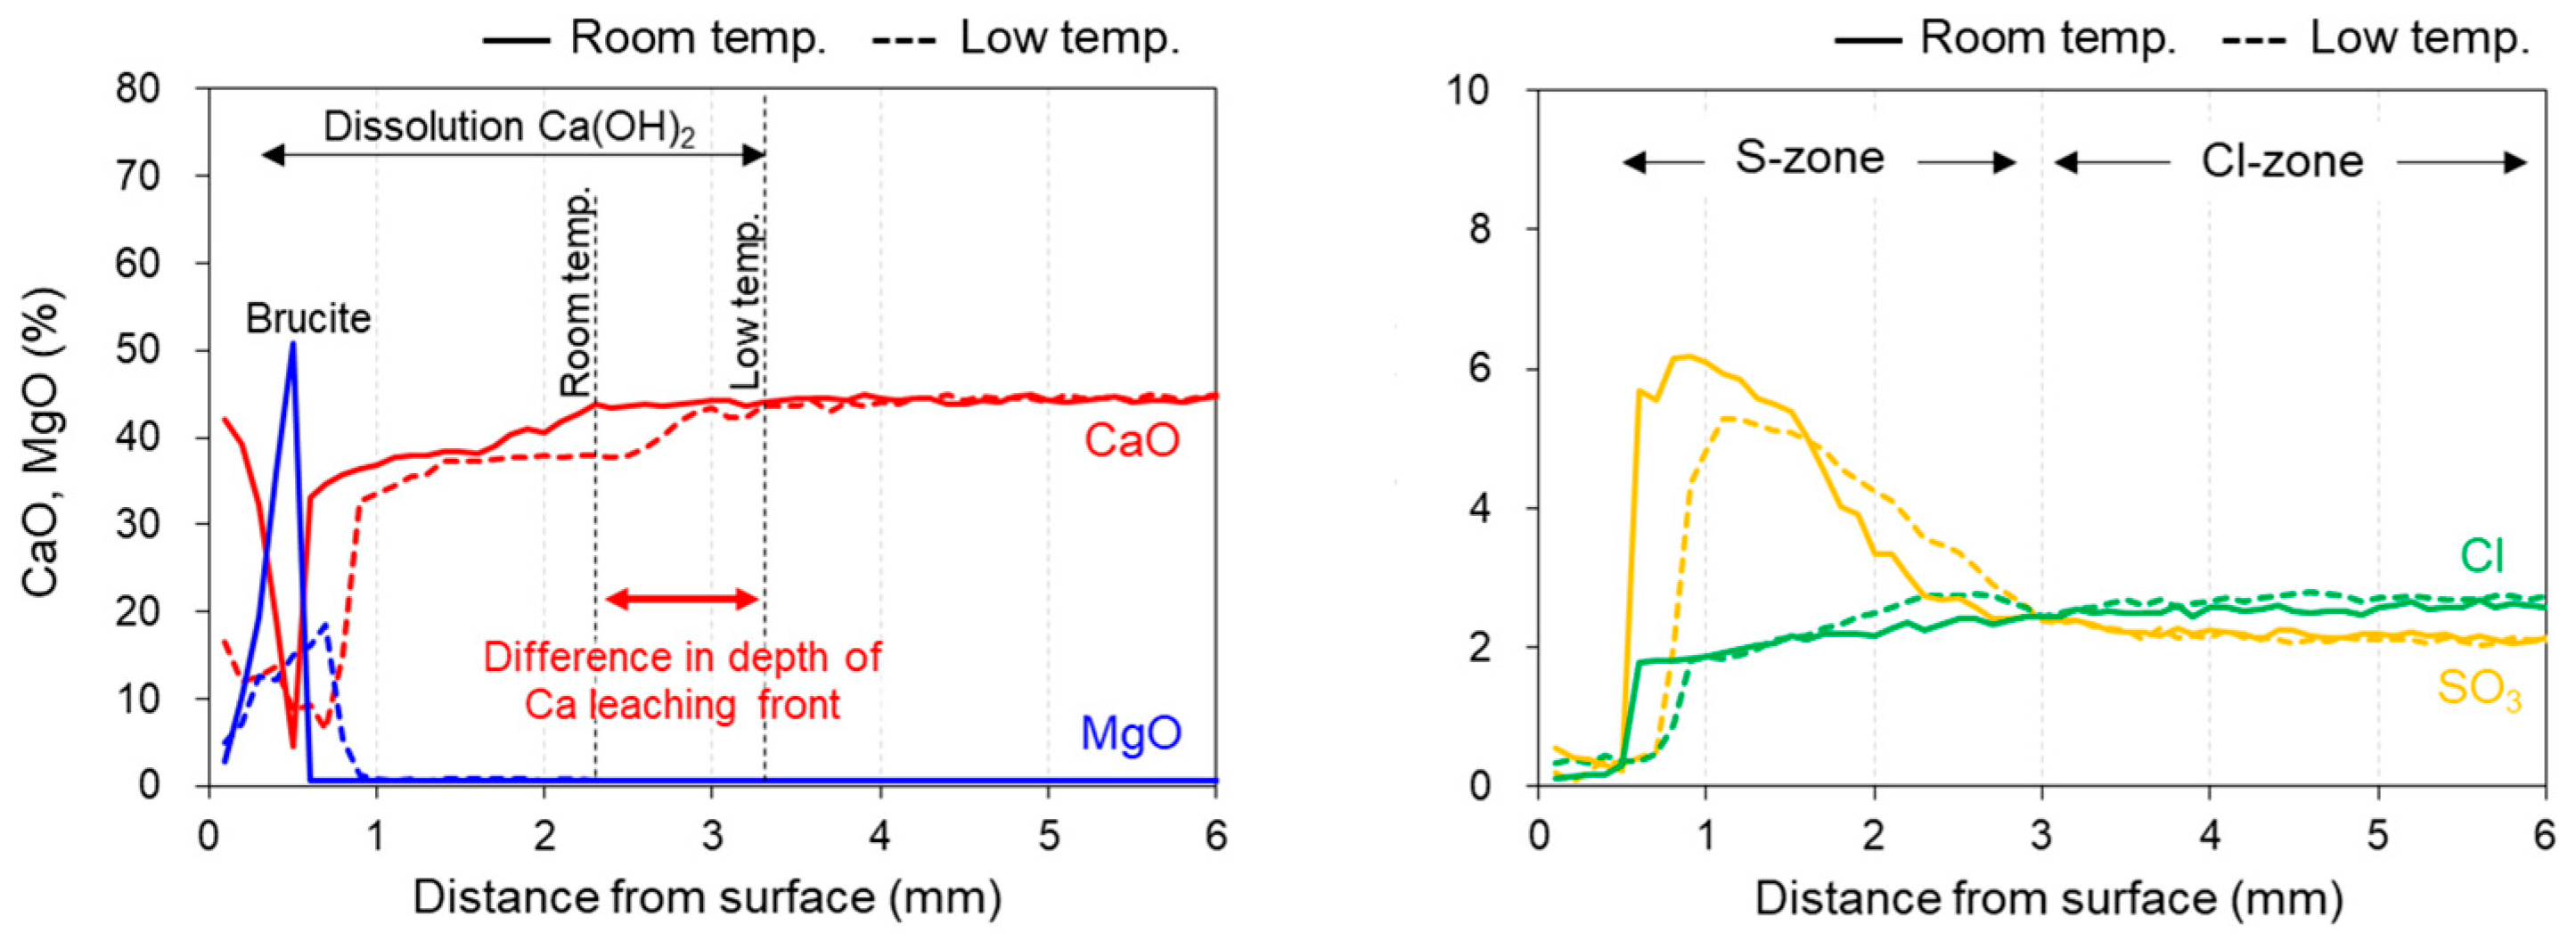
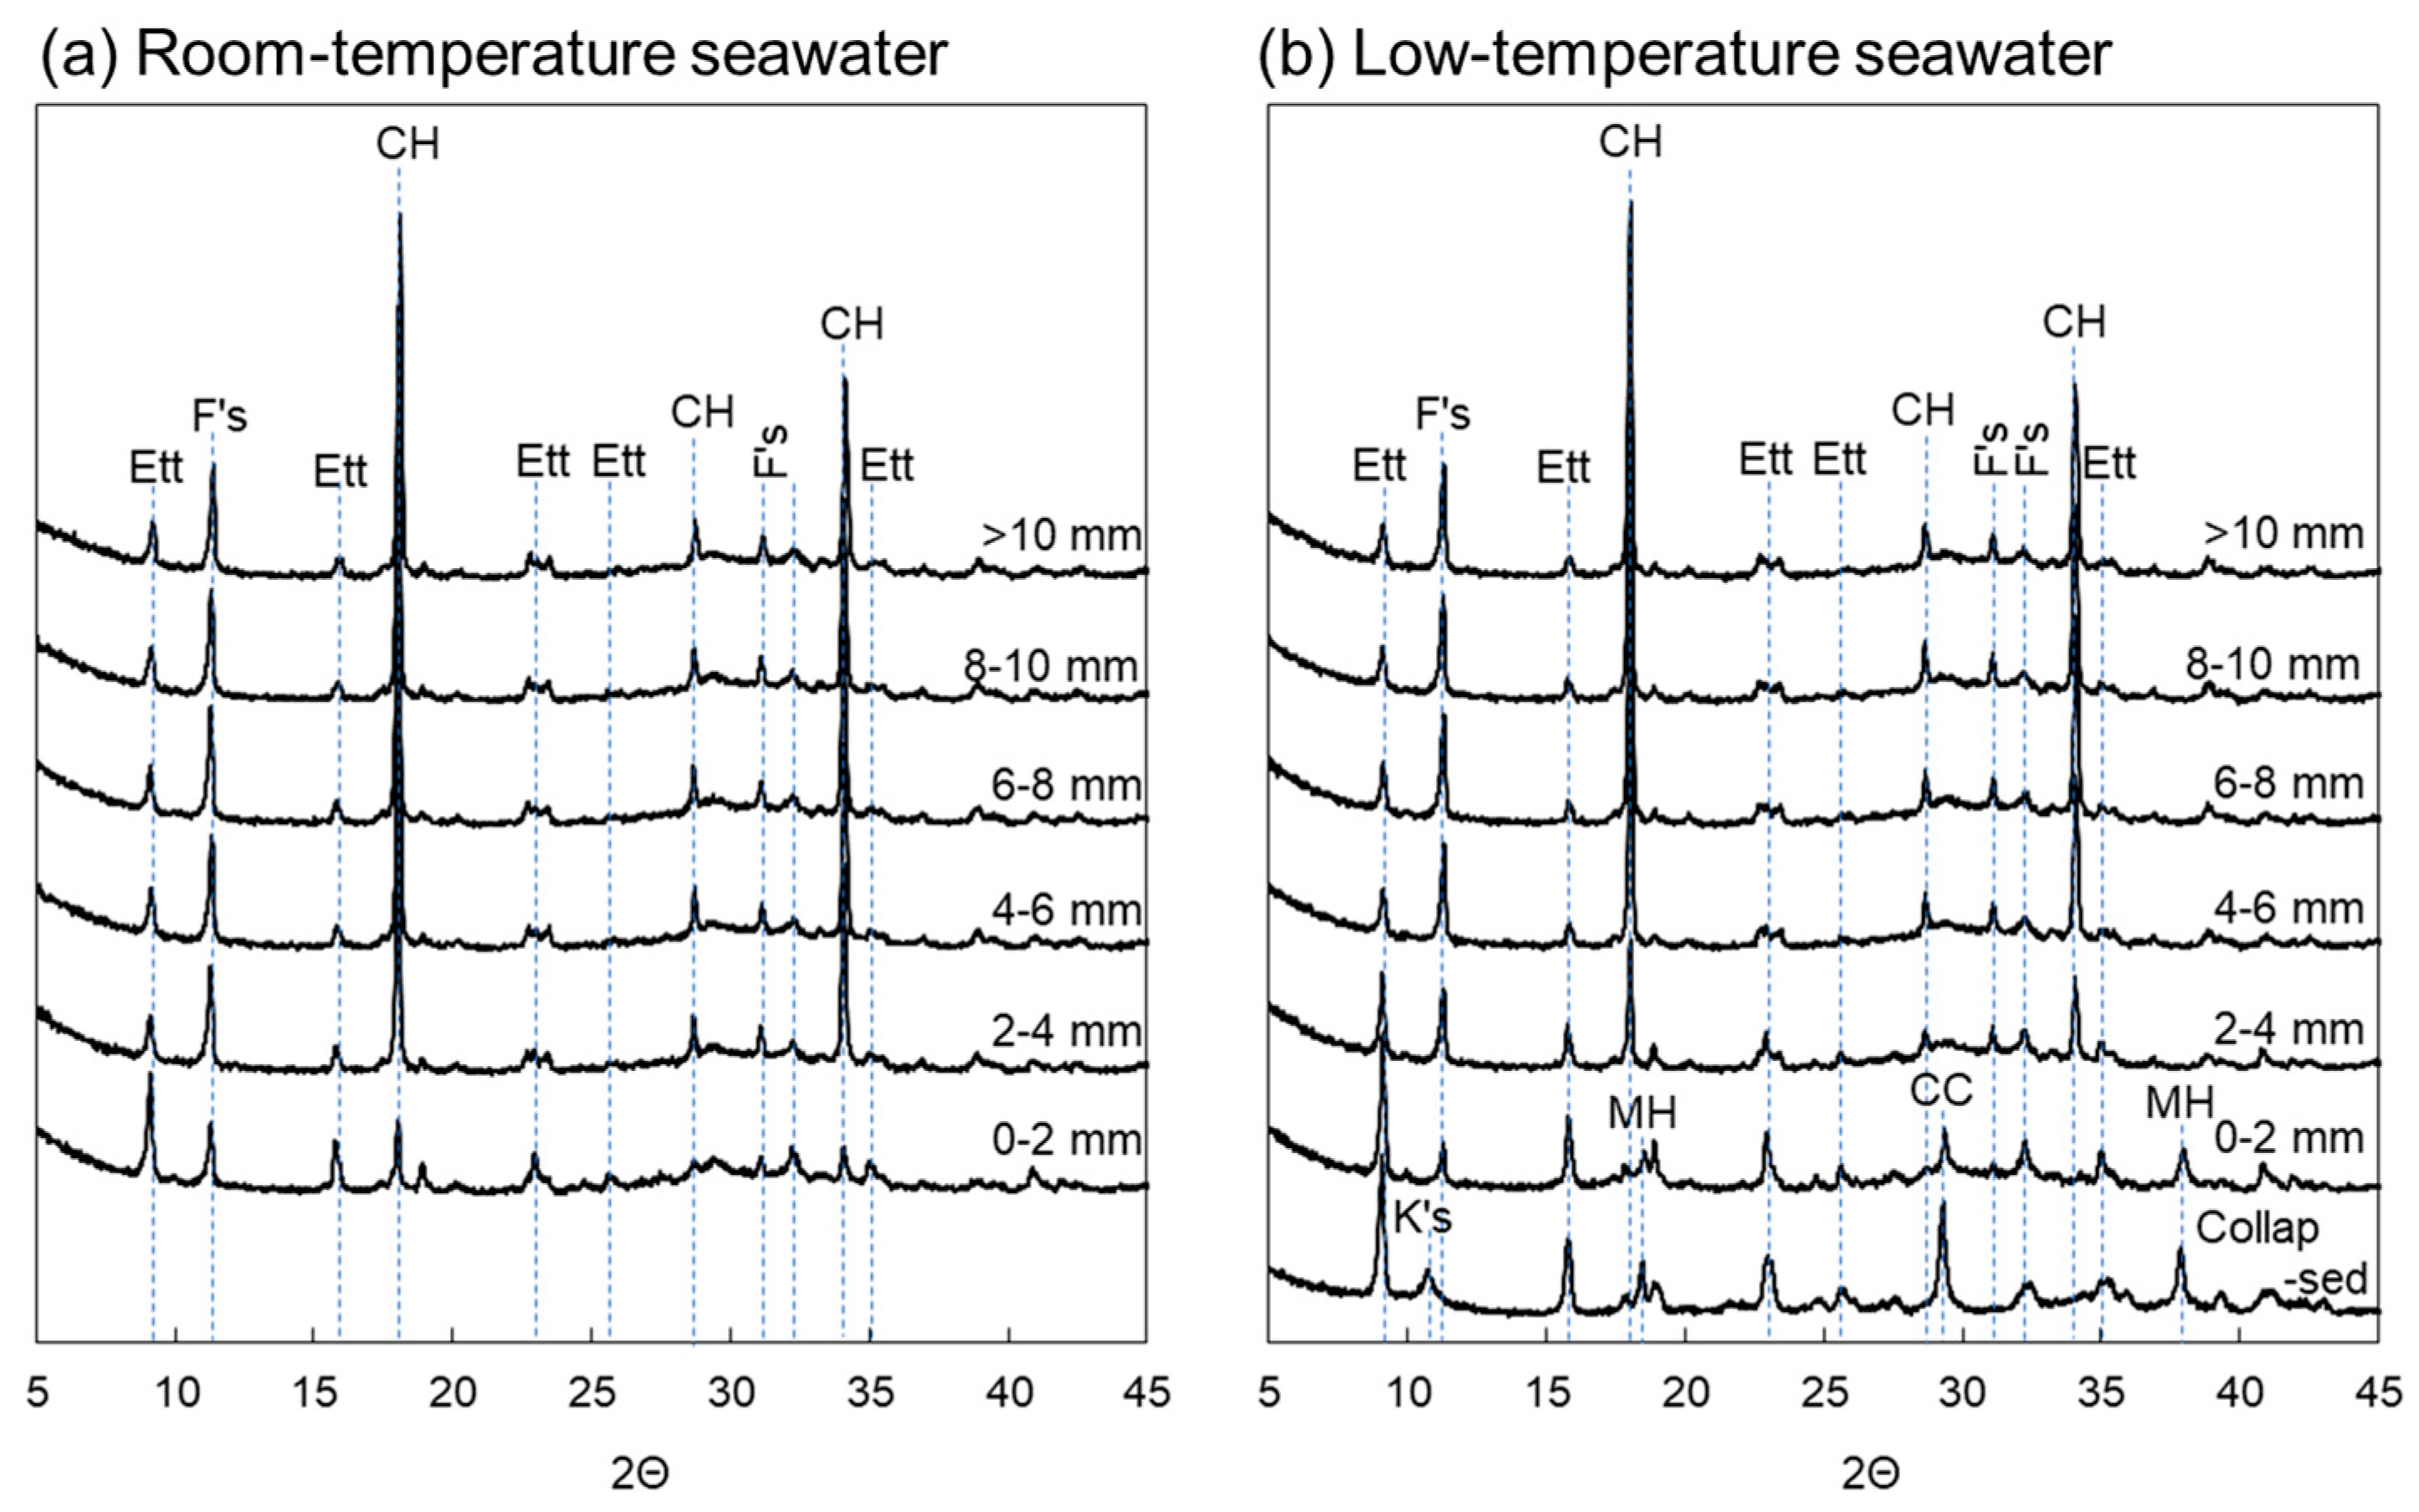
The concentration profile of each element was analyzed from the surface (0 mm) to the interior (20 mm) within the area enclosed by the red square in the cross-sectional photographs in Figure 3a,b. The profiles from the surface to a depth of 6 mm are shown in Figure 4. The concentrations were averaged every 100 µm. These results in combination with the XRD results at each depth (Figure 5) allow predictions of the types of hydrate that form or dissolve to induce changes in the element concentrations.

3.3. XRD Analysis

The Ca dissolution fronts were located at approximately 2 and 3 mm for the samples immersed in room-temperature and low-temperature seawater, respectively (Figure 4). The XRD patterns of the sample immersed in room-temperature seawater at a depth of 0–2 mm and those of the sample immersed in low-temperature seawater depths of 0–2 and 2–4 mm, which correspond to the Ca leaching area, exhibited very small portlandite peaks. This result indicates that portlandite was dissolved and smaller amounts of portlandite remained in these areas. Thus, portlandite dissolution was enhanced by immersing the specimens in low-temperature seawater. As shown in Figure 4, SO42− diffused further into the interior of the specimen immersed in low-temperature seawater compared with the specimen immersed in room-temperature seawater. The XRD patterns in Figure 5 show pronounced ettringite peaks at a depth of 0–2 mm for the specimen immersed in room-temperature seawater. The specimen immersed in low-temperature seawater also shows a prominent ettringite peak at 0–2 mm, and the peak intensity at 2–4 mm is higher than that further within the specimen (depth > 4 mm), indicating that ettringite formation in this area could involve SO42− from seawater. The XRD results indicate that ettringite also formed inside the specimen. Based on the EPMA results (Figure 3), Cl diffused into the center of the specimens during both room- and low-temperature seawater immersion because of its relatively high diffusion coefficient [36]. Consequently, Friedel’s salt was formed, as shown in Figure 5. Upon the formation of Friedel’s salt from the monosulfate by Cl substitution, SO42− is released into the solution in the pores, which promotes the simultaneous formation of ettringite [37]. Thaumasite could also form in the collapsed surface sample following immersion in low-temperature seawater. It has been reported that thaumasite forms in mortar specimens exposed to deep-sea conditions [32]. However, it is difficult to confirm the formation of thaumasite using XRD because of the similar structures of thaumasite and ettringite, both of which exhibit characteristic peaks at 2θ = 9°, 16°, and 23° [35,38]. Therefore, the possibility of thaumasite formation is discussed based on the 29Si NMR results.
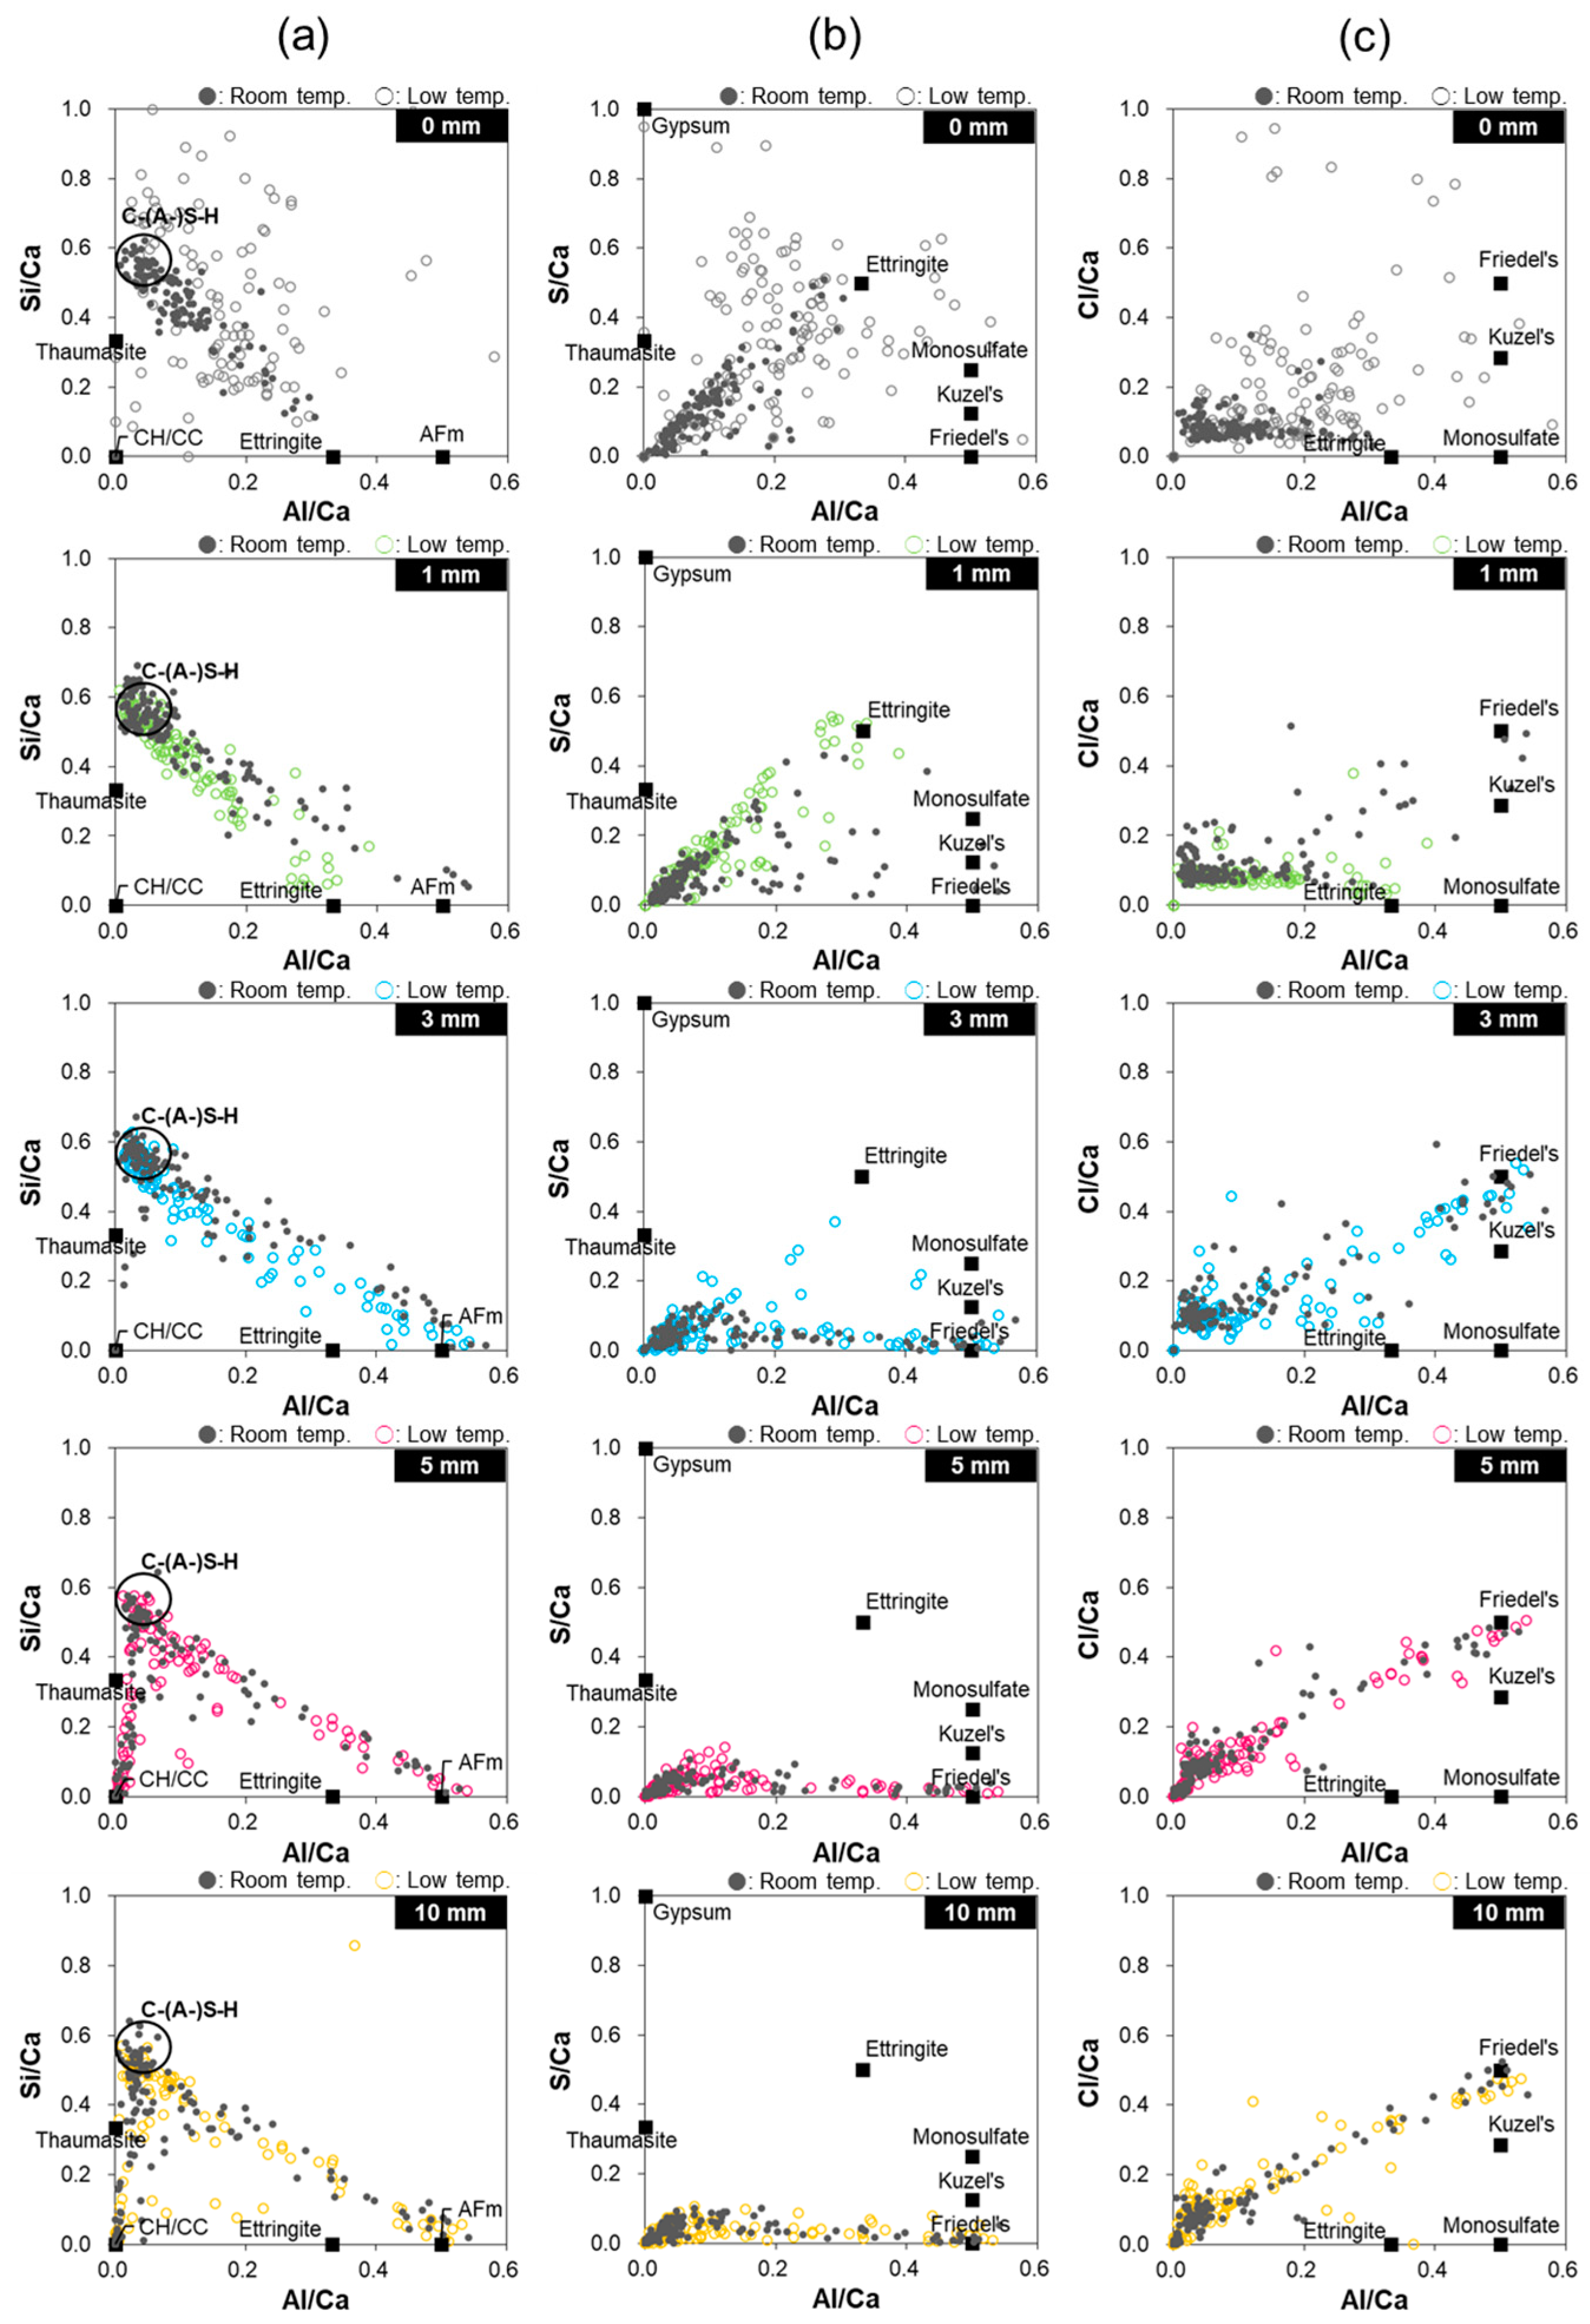
Although the degree of deterioration varied with seawater temperature, the trends observed for ion diffusion into and out of the specimens were consistent with those previously reported for marine degradation [7,9,11,26]. Additionally, the trends identified by XRD for the crystalline hydrate phases at each depth agreed with the EDS point analysis results (Appendix B). However, the types of hydrates formed in fragile microstructures on the collapsed surfaces of the specimen immersed in low-temperature seawater could not be confirmed using XRD. Previous reports suggest that C–(A-)S–H decalcification as well as M–S–H and thaumasite formation can occur [26,30,32]. Accordingly, SEM-EDS was used to investigate the type of hydrate phase formed in the fragile zone at the surface.

3.4. SEM Imaging

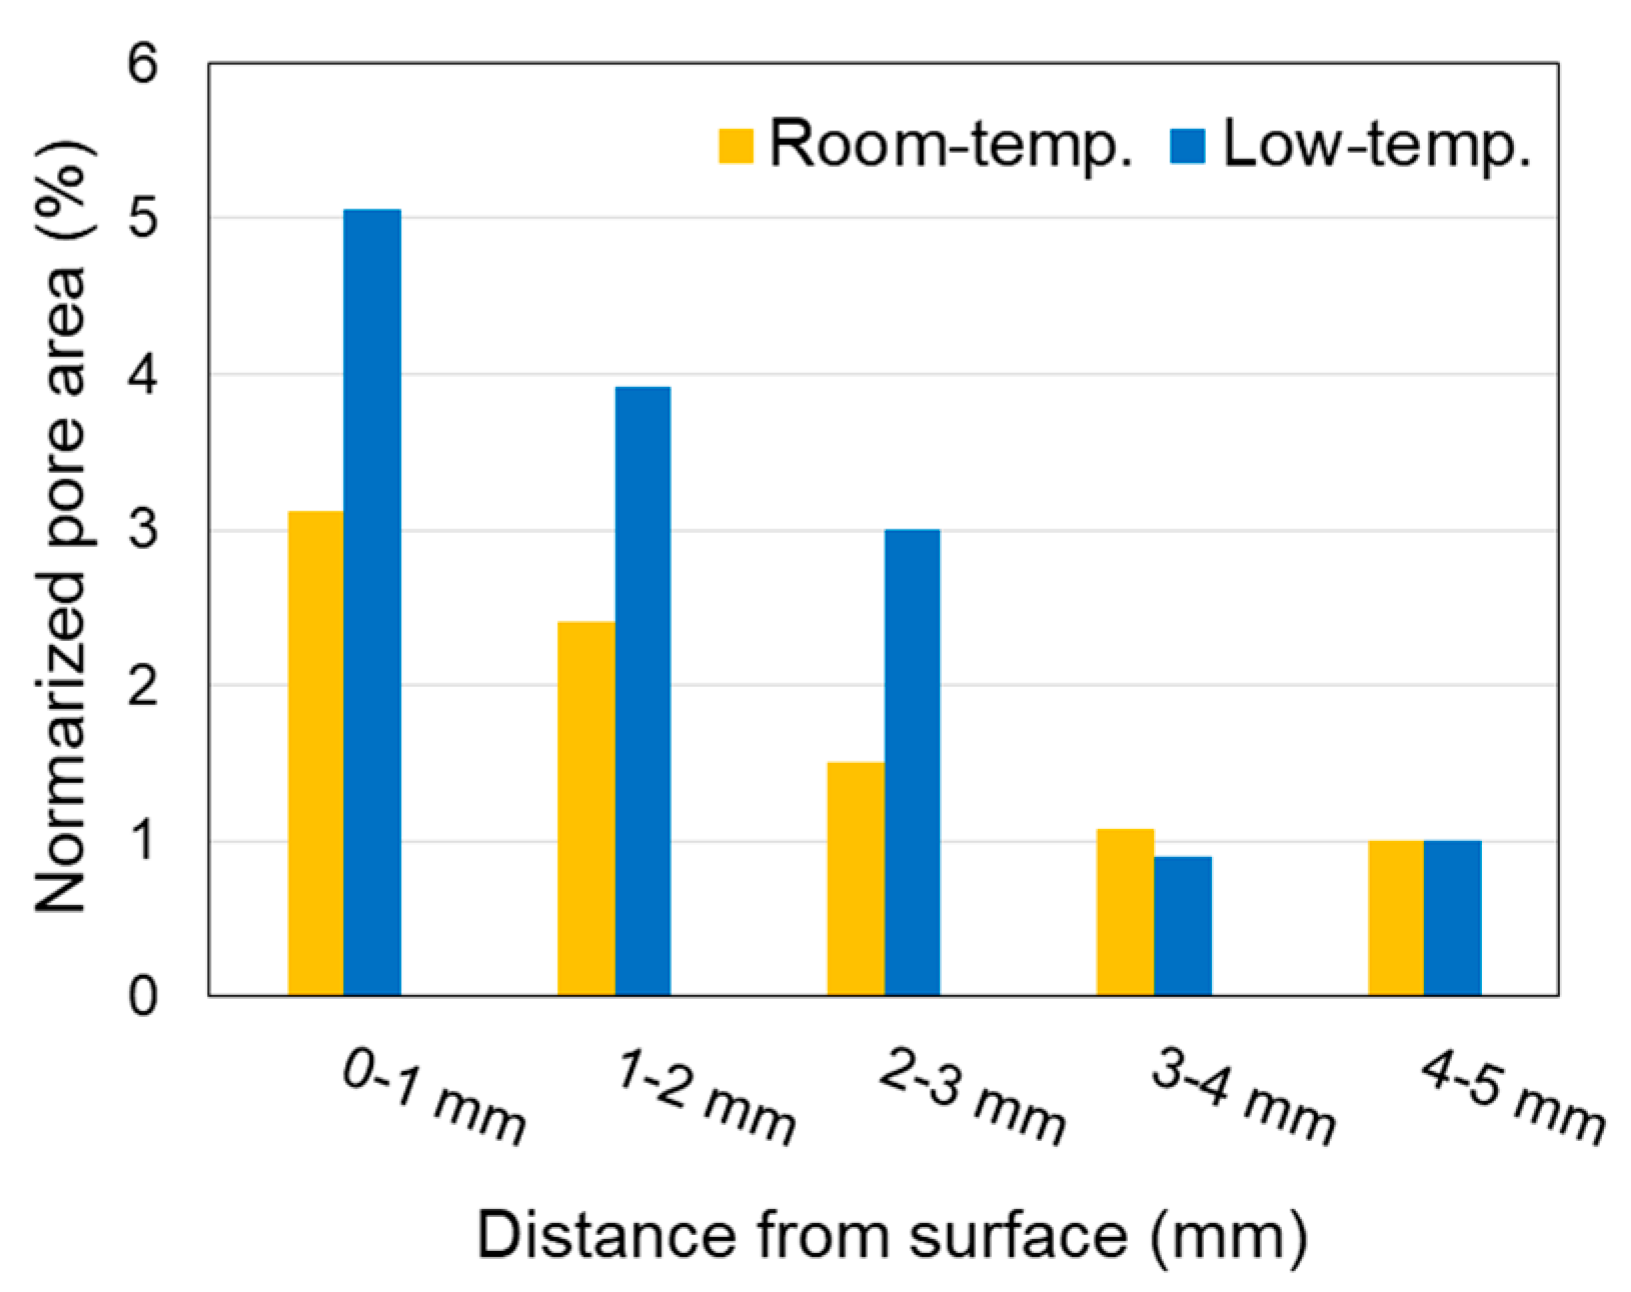
The SEM montages (Figure 6) reveal a grayscale change from the surface to the interior of each sample owing to hydrate dissolution. Each SEM montage image was analyzed in 1 mm sections from the surface to the interior of the specimen in the area surrounded by the red box, and the porosity (area %) was calculated by image processing (Figure 7). The threshold for binary images was set to 2 (min.) and 50 (max.) to exclude large cracks generated during sample preparation and entrapped/entrained pores. The porosity of each area was normalized to that at a depth of 4–5 mm. This analysis reveals that more pores existed close to the surface in both specimens. Compared with the specimen immersed in room-temperature seawater, that immersed in low-temperature seawater tended to have more pores and microcracks at the same depth, indicating that hydrate dissolution was more pronounced. Based on the EPMA and XRD results, the dissolved hydrate was mainly portlandite (Figure 3 and Figure 5).
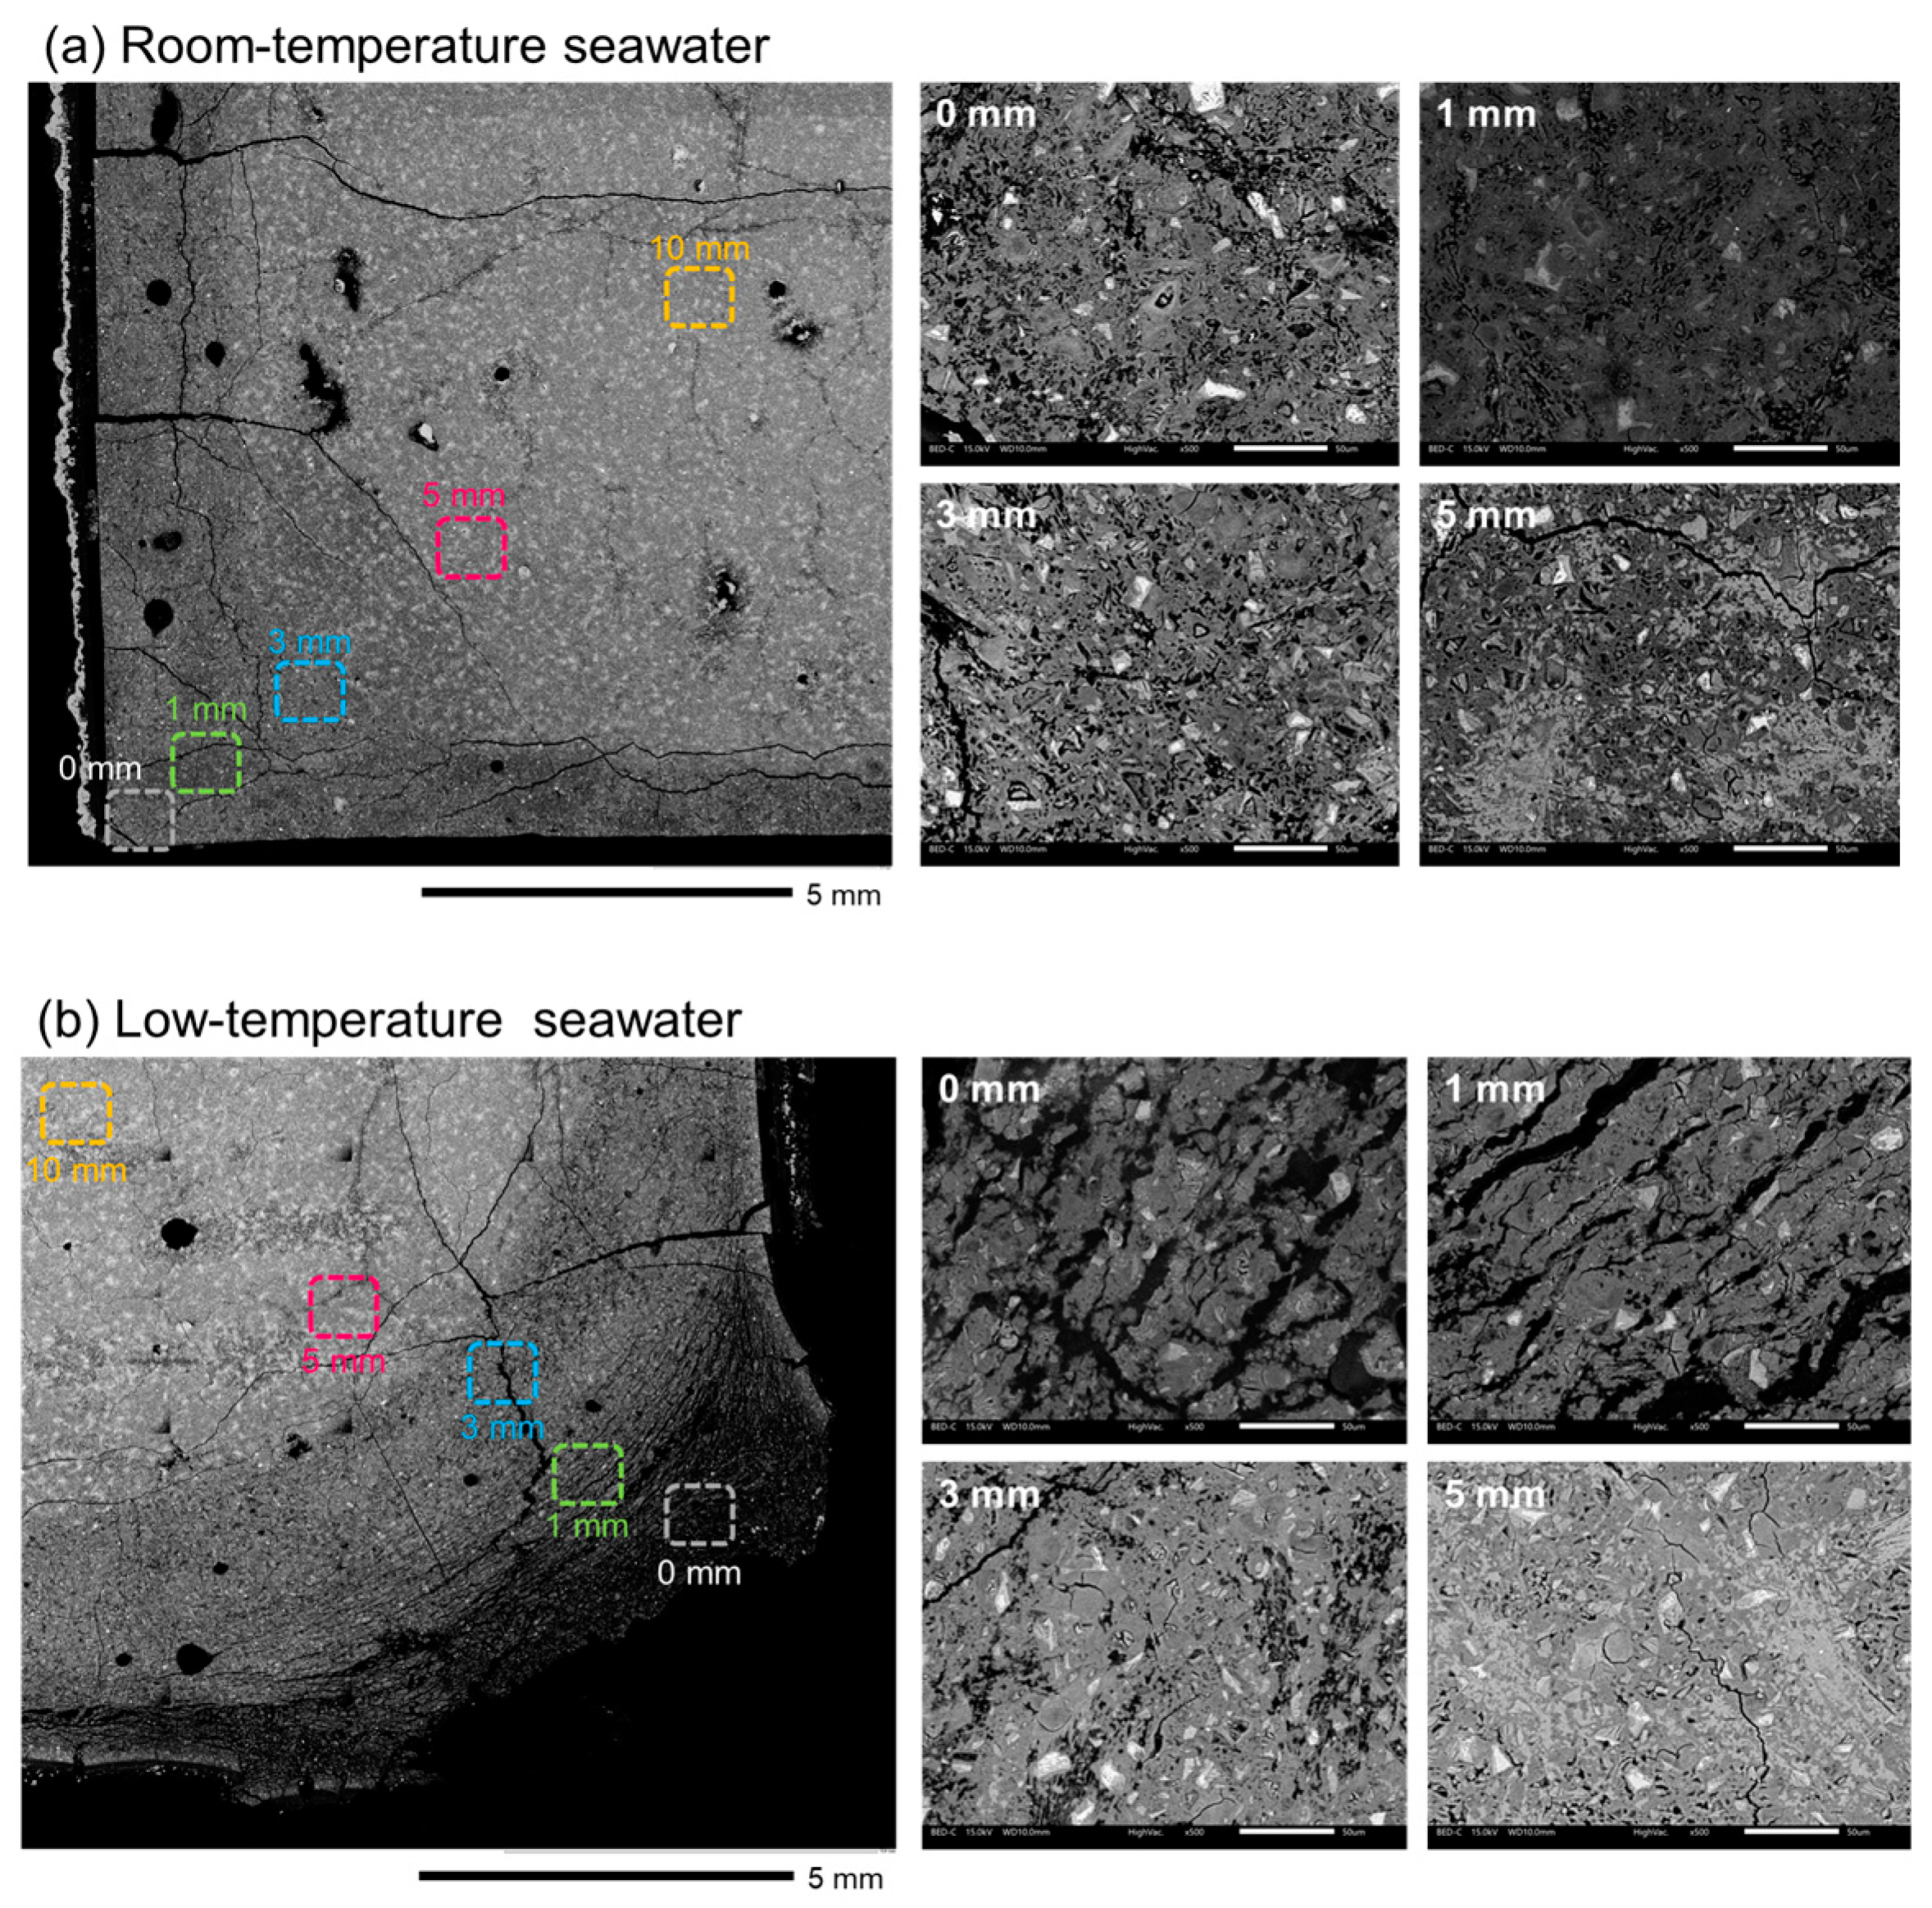
EPMA revealed remarkable Ca dissolution at the collapsed corner of the specimen immersed in low-temperature seawater, similar to the behavior observed in a previous study under deep-sea conditions [32], and new hydrates formed on most of the collapsed surface. In particular, the EPMA results revealed a high Mg concentration in the area marked as 0 mm in Figure 6b, indicating the formation of Mg-based hydrates. To further understand the hydrates formed in this area, EDS point analysis was performed. For the specimen immersed in low-temperature seawater, the hydrate phases were evaluated based on the EDS point analysis results at depths of 1 mm, where fine parallel cracks occurred from the surface to the interior of the specimen, and 3 mm (see Appendix A for detailed SEM images).

3.5. EDS Analysis

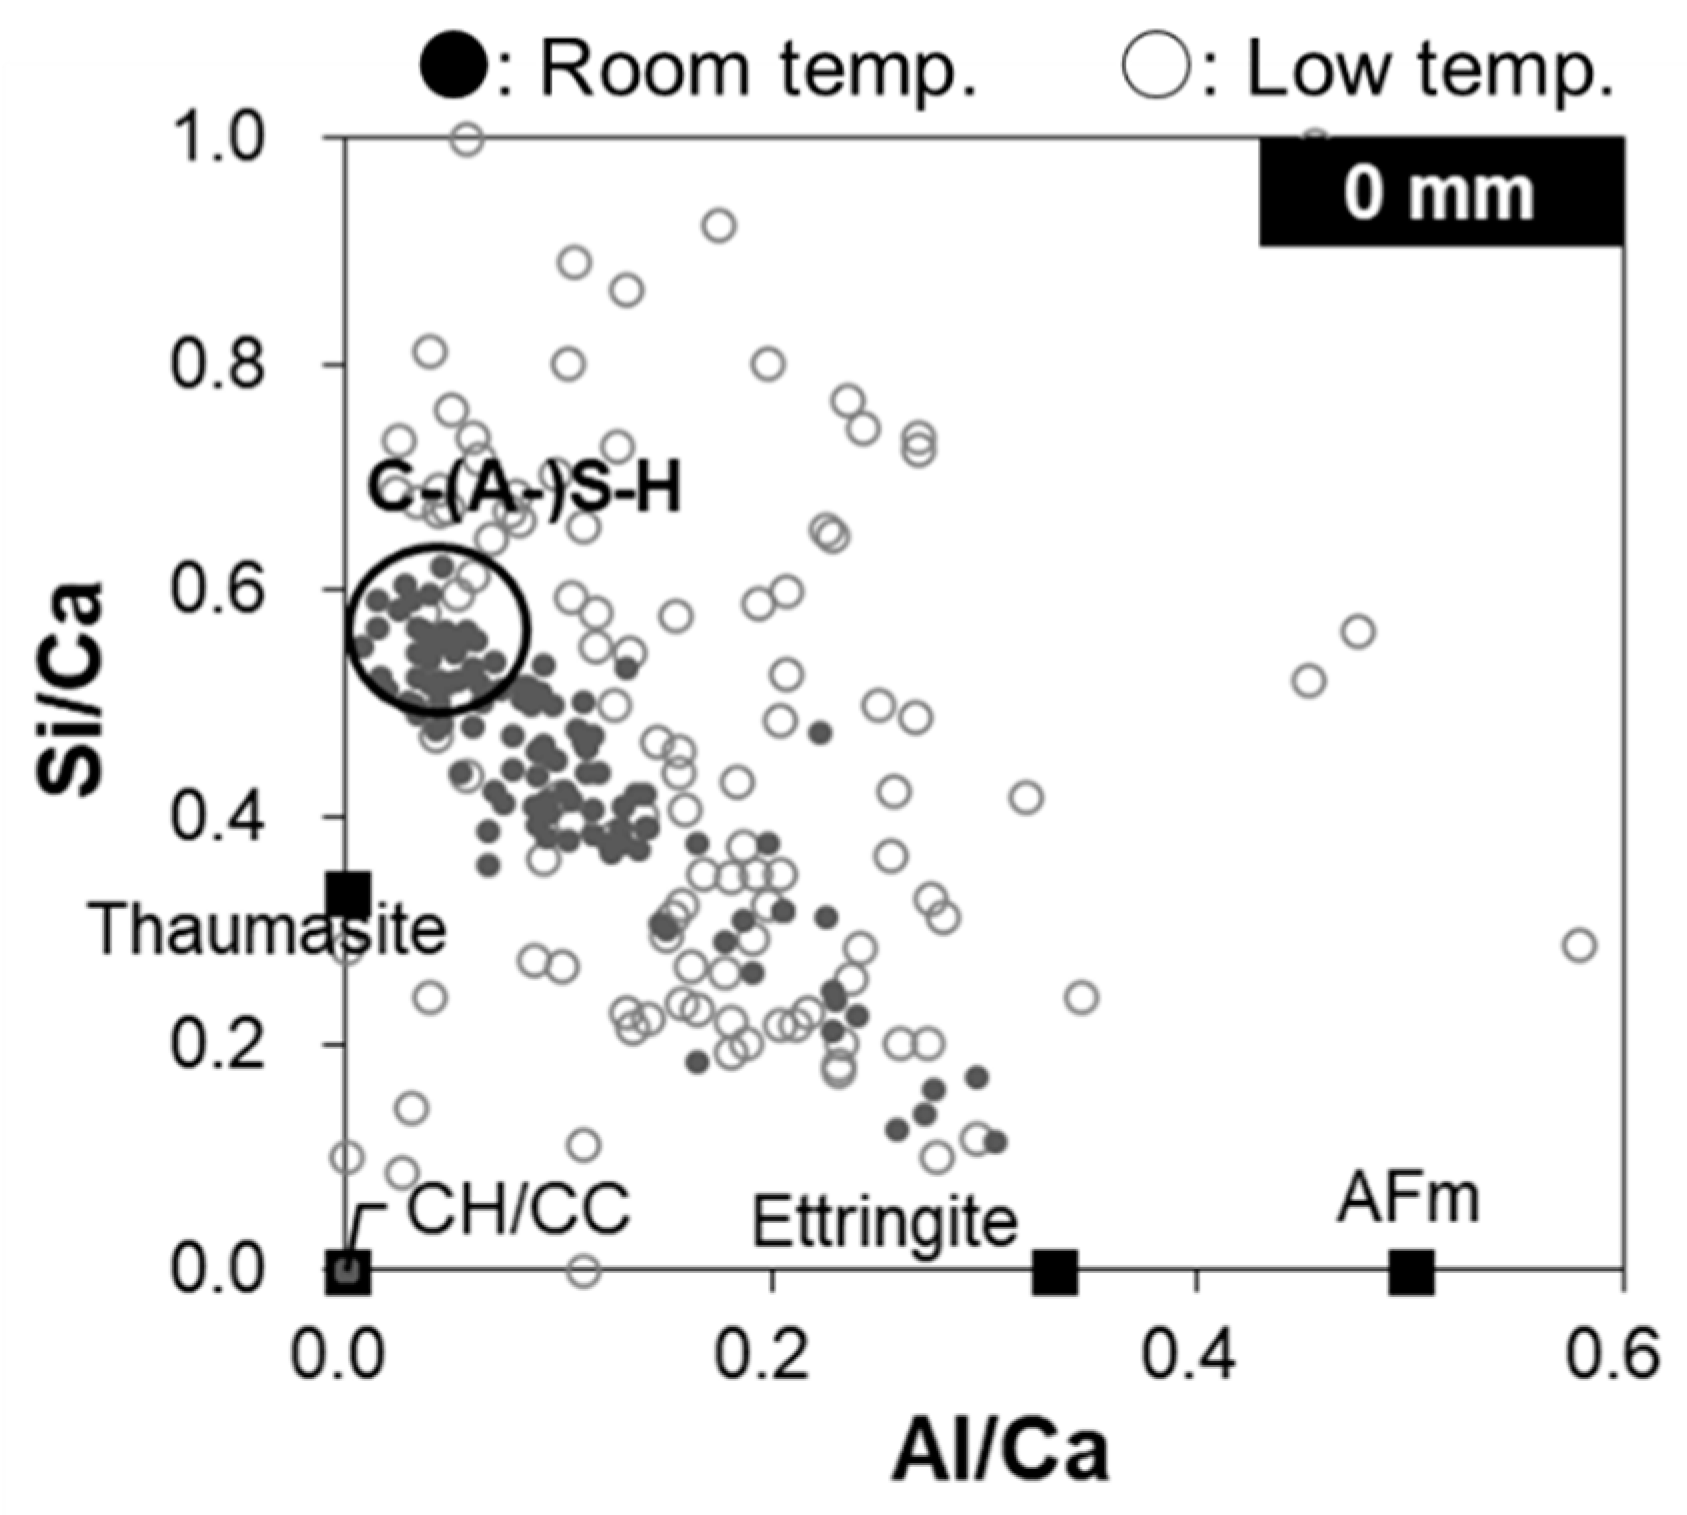
Figure 8 shows the Si/Ca ratio as a function of the Al/Ca ratio near the specimen surface (0 mm depth), as determined by EDS point analysis of the specimens immersed in room- and low-temperature seawater. The circle denotes the typical C–(A-)S–H composition of ordinary PC, which has been widely reported in the literature [7,39,40]. The results for the specimen immersed in room-temperature seawater suggest that portlandite was dissolved, as the absence of data points near the origin indicates the presence of portlandite/calcium carbonate. The data points are not scattered in the circled area corresponding to a typical C–(A-)S–H composition, which indicates that C–(A-)S–H has not yet been decalcified. In addition, the data points lie on a line toward the theoretical composition of ettringite, which indicates the presence of ettringite formed by SO42− derived from seawater. In contrast, for the specimen immersed in low-temperature seawater, the data points are quite scattered and are located outside the circle corresponding to a typical C–(A-)S–H composition, suggesting the occurrence of C–(A-)S–H decalcification or the precipitation of new hydrates, such as Mg-based hydrates. Furthermore, in combination with the XRD results (Figure 5), the presence of some data points near the origin indicates that calcite is precipitated instead of portlandite.
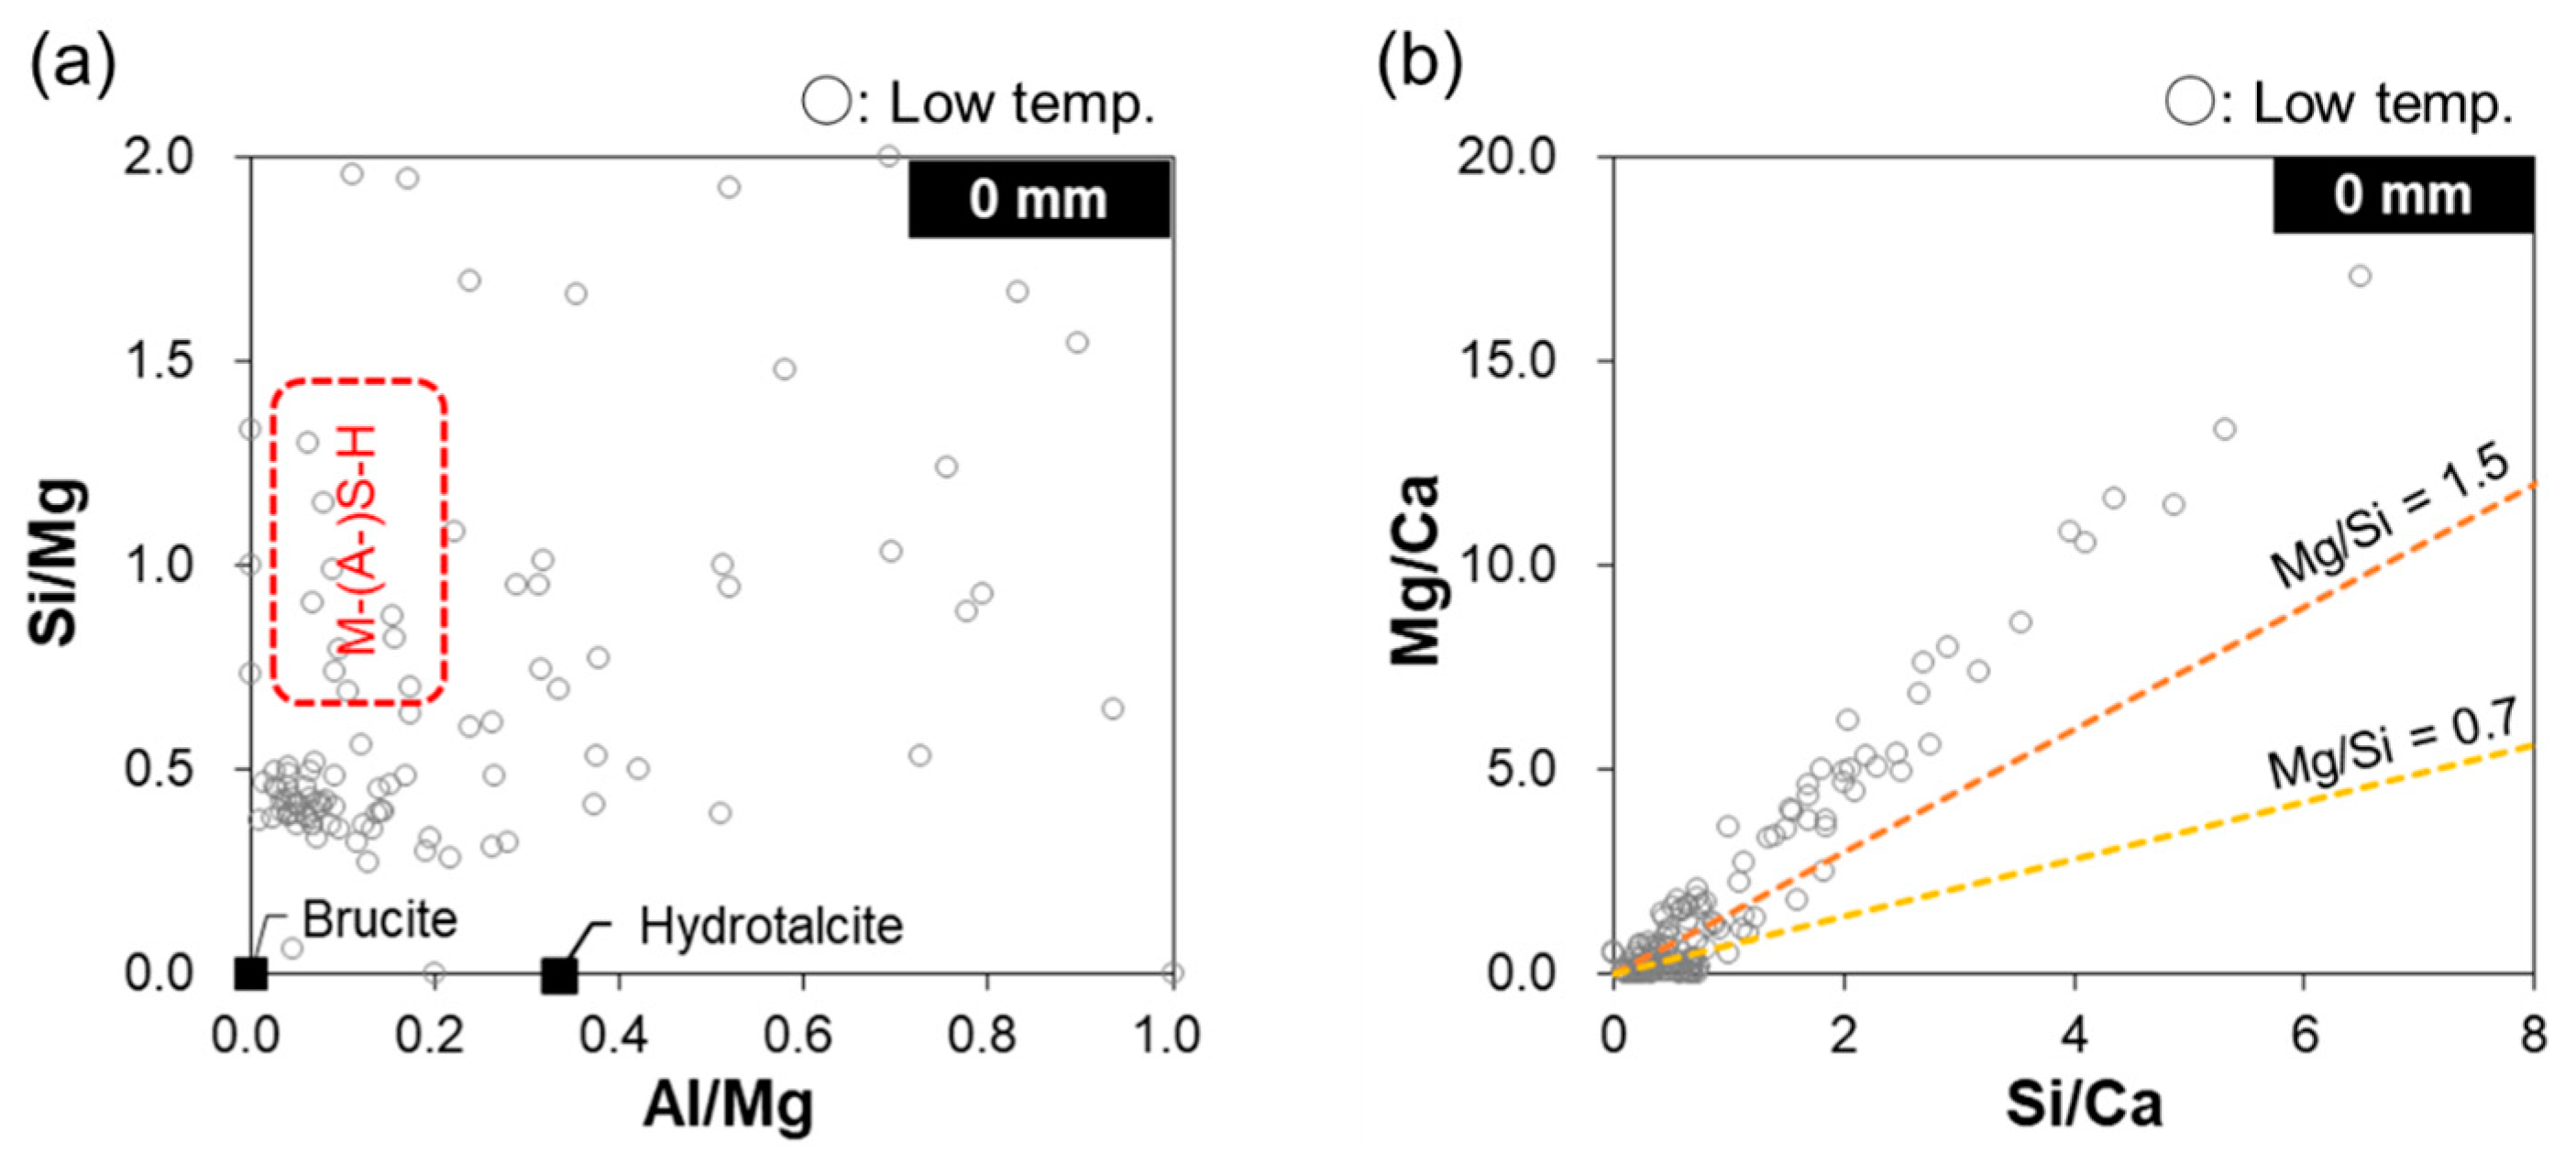
Figure 9a shows the relative Si and Al atomic ratios with respect to the Mg content at a depth of 0 mm. The area enclosed by the red dotted line indicates the range of possible M–S–H and magnesium aluminosilicate hydrate (M–A–S–H) compositions [41]. Some data points are located in this area, indicating the formation of M–S–H or M–A–S–H. However, a cluster also occurs outside this area, near Si/Mg = 0.5, suggesting the intermixing of M–(A-)S–H and other Mg phases (likely brucite based on the XRD results). Figure 9b shows the Mg/Ca ratio as a function of the Si/Ca ratio at a depth of 0 mm. The data points form a line because M–S–H has a constant Mg/Si ratio. The two dotted lines in Figure 9b represent the lower and upper limits of the Mg/Si ratio for synthesized M–S–H [20]. As the observed data points are located above the upper limit of Mg/Si = 1.5, the precipitated M–(A-)S–H was likely intermixed with brucite.
Upon Mg2+ ingress into a cement paste specimen, it reacts with OH in the pore solution at pH > 9.5, forming brucite [2]. As this reaction consumes OH, the pH of the pore solution decreases, which promotes further portlandite dissolution and eventually leads to the decalcification of C–(A-)S–H. At lower pH values, brucite becomes undersaturated and Mg2+ reacts with decalcified C–(A-)S–H to form M–S–H [9,11,26], which is stable at pH 7.5 [42]. However, as M–S–H possesses a weak talc-like structure [24,25], its formation causes surface collapse.
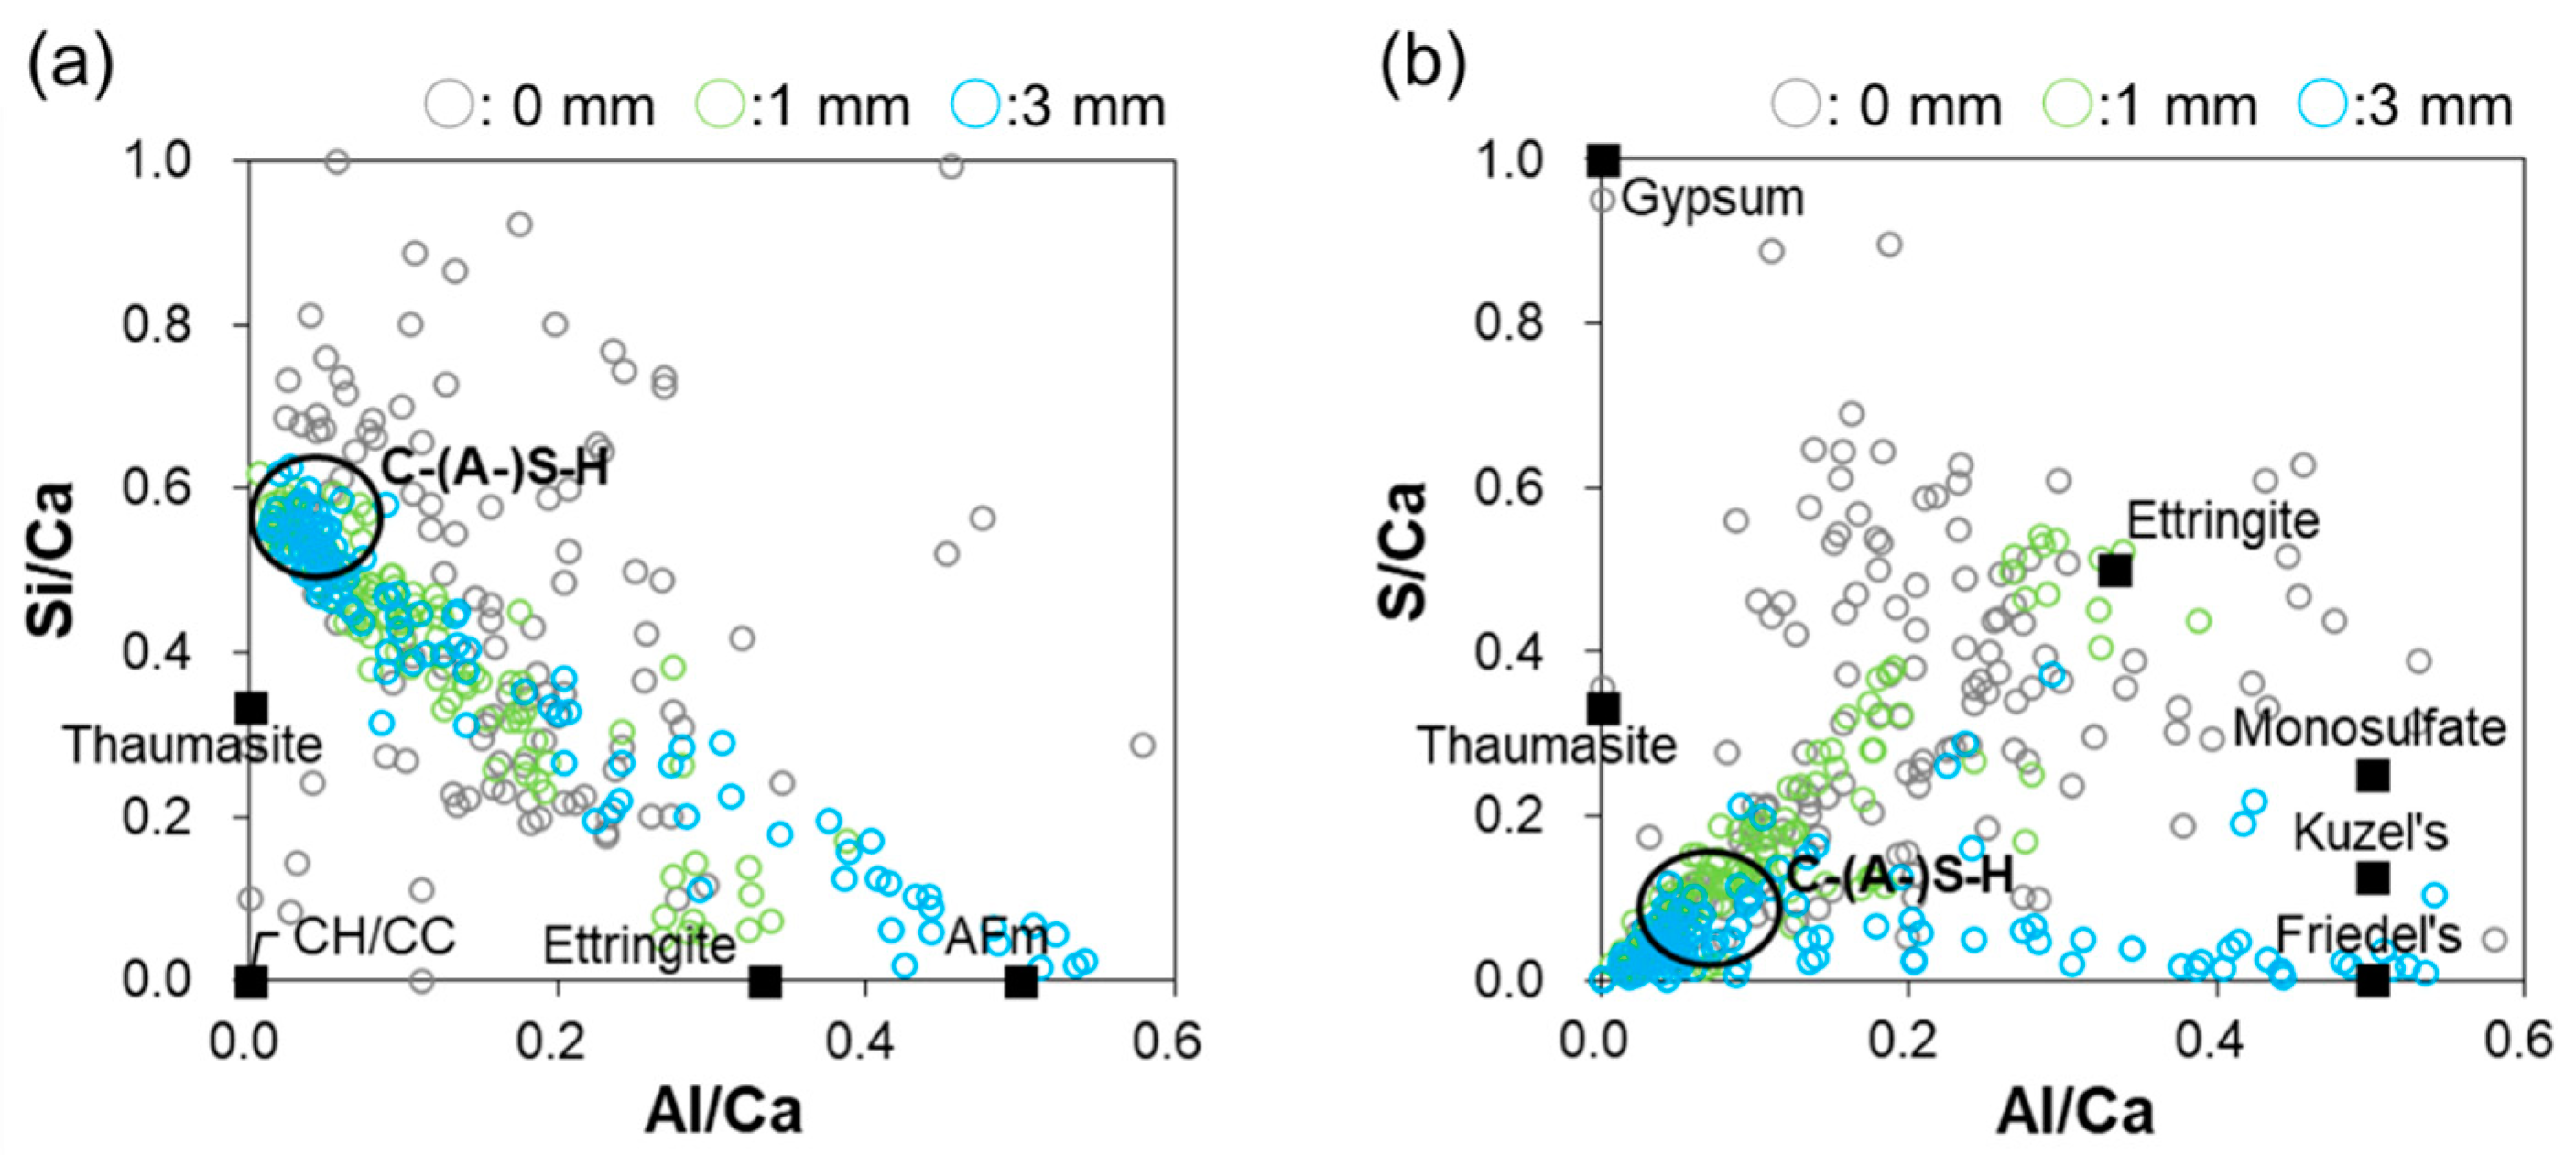
Figure 10a shows plots of the Si/Ca ratio as a function of the Al/Ca ratio at depths of 0, 1, and 3 mm for the specimen immersed in low-temperature seawater. Portlandite was dissolved at both 1 and 3 mm because no data points appeared near the origin, and the points near the origin at a depth of 0 mm correspond to the formation of calcite, as discussed above. At a depth of 0 mm, the decalcification of C–(A-)S–H is observed, whereas at depths of 1 and 3 mm, many data points are located in the C–(A-)S–H circle, indicating that C–(A-)S–H decalcification could not occur. At a depth of 1 mm, the data points lie on a line from the C–(A-)S–H cluster toward the ideal composition of ettringite. At a depth of 3 mm, the data points lie on a line toward the AFm phase, which indicates that C–(A-)S–H and ettringite were present at a depth of 1 mm, whereas AFm was present at a depth of 3 mm. Figure 10b shows the plots of the S/Ca ratio as a function of the Al/Ca ratio at depths of 0, 1, and 3 mm for the specimen immersed in low-temperature seawater. At a depth of 3 mm, the data points lie on a line from C–(A-)S–H to the ideal composition of Friedel’s salt, indicating that the AFm phase in Figure 10a is predominantly Friedel’s salt.

3.6. 29Si-NMR Analysis

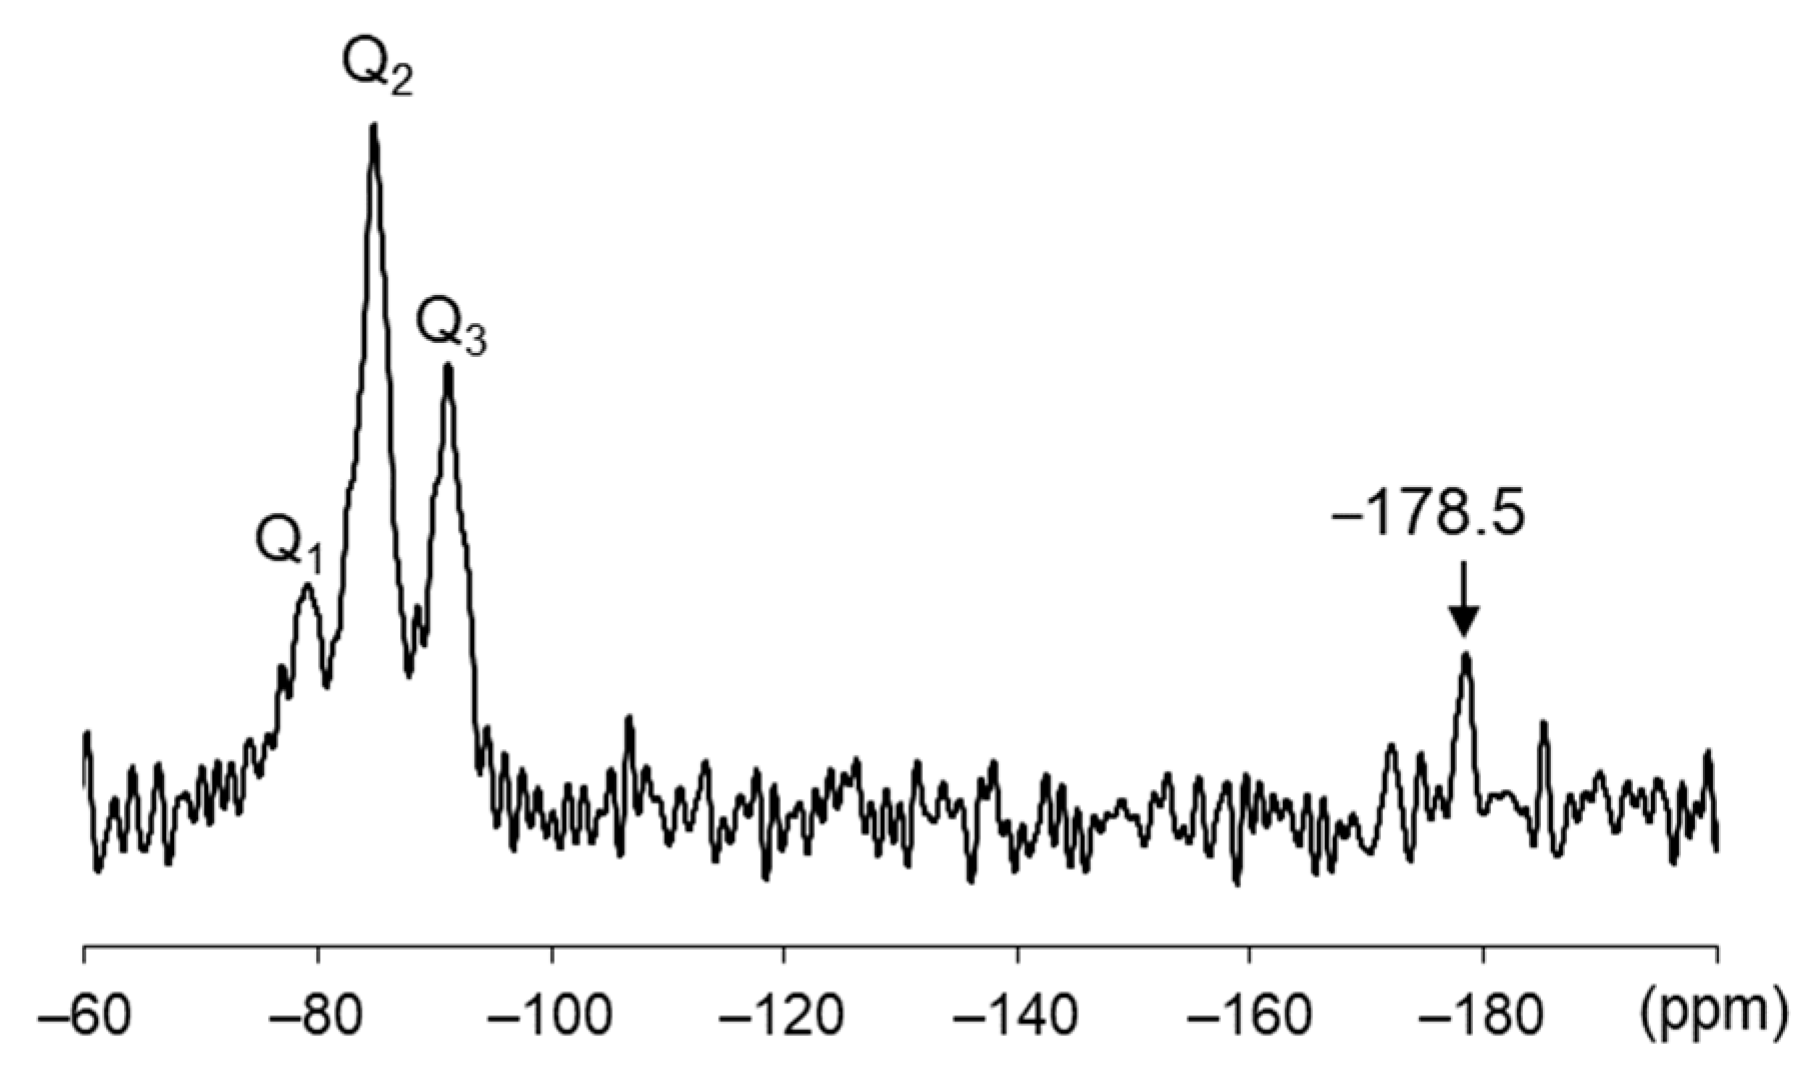
Figure 11 shows the 29Si MAS NMR spectrum of the collapsed surface sample for the specimen immersed in low-temperature seawater. Richardson and Andersen et al. reported that the 29Si MAS NMR spectra of C–S–H exhibit two resonances originating from the Si end of the Q1 chain between −78 and −81 ppm and the bridging pair of Si tetrahedra in the dreierketten Si chain structure (Q2) between −82 and −86 ppm [39,43,44]. Thus, the intense peak at −84.8 ppm was assigned to the Q2 resonance, and the small peak at −79.1 ppm was assigned to the Q1 resonance (Figure 11). The decalcification of C–(A-)S–H strongly affects the balance between the Q2 and Q1 resonances, as Ca2+ leaching increases the length of the Si chain and thus the Q2/Q1 ratio [45]. Furthermore, Ca2+ leaching promotes the three-dimensional bonding of Si tetrahedra with other silicate anions, leading to a small and broad Q3 resonance [21]. The Q3 resonance at −91.2 ppm (Figure 11) also indicates the formation of M–(A-)S–H [24,46,47,48]. Bernard et al. recently reported that the 29Si MAS NMR spectrum of synthesized M–(A-)S–H exhibits intense and sharp Q3 resonances between −92 and −97 ppm [41]. The 29Si-NMR results for the collapsed surface sample support the decalcification of C–(A-)S–H and M–(A-)S–H formation, as revealed by EDS.
The detection of Si atoms with octahedral coordination at −178.5 ppm indicates the formation of thaumasite, which is the only hydrate phase in cementitious systems that contains Si atoms with this coordination [49]. SiO6 groups exhibit a chemical shift between −170 and −220 ppm, and thaumasite exhibits a single resonance at −179.4 ± 0.1 ppm in the 29Si MAS NMR spectrum [49].

4. Discussion

The specimen immersed in low-temperature seawater showed more significant degradation than that immersed in room-temperature seawater. Temperature has been reported to affect the durability of cementitious materials; for example, SO42− attack is accelerated at low temperatures, which is often attributed to the increased solubility of portlandite at low temperatures and the weakening of the surface layer owing to thaumasite formation [50]. The solubility of portlandite in cement increases at lower temperatures [51]. The saturation concentration of Ca2+ in portlandite is 1.08 times higher at 2 °C than at 20 °C [52], and more portlandite can dissolve in low-temperature environments. A steeper Ca2+ concentration gradient between seawater and the pore solution could drive further Ca dissolution (Figure 3). As portlandite dissolves, the porosity increases, as shown in Figure 7. This behavior could promote the diffusion of ions in seawater into the specimen and increase portlandite dissolution, resulting in the specimen immersed in low-temperature seawater exhibiting a greater degree of deterioration than the specimen immersed in room-temperature seawater.
Although portlandite dissolution increased the porosity of the specimen, as shown in Figure 7, it did not result in a mashy structure or surface collapse. For the specimen exposed to room-temperature seawater, no other damage was observed despite the dissolution of portlandite in the surface layer. However, portlandite dissolution increases seawater permeability, thereby facilitating C–(A-)S–H decalcification and finally the formation of M–(A-)S–H and thaumasite. The formation of these hydrates is expected to cause the surface layer to collapse.
Furthermore, damage to the specimen near the surface can be caused by ettringite formation. A sulfur-rich zone was observed near the specimen surfaces owing to the formation of ettringite. In the specimen immersed in low-temperature seawater, this zone was located at a depth of approximately 1 mm, and fine parallel cracks appeared around this area (Figure 6), suggesting that the specimen began to collapse in this area. However, ettringite does not always lead to serious SO42− attack in concrete, with no cracking or spalling observed in sulfur-rich zones [9,53]. In addition, ettringite formation can generate expansive pressure. In particular, ettringite precipitation in smaller pores (typically < 20 nm) in the hydrated matrix can cause specimen expansion [54], and the pores must be supersaturated with respect to ettringite [54]. The solubility of ettringite decreases at lower temperatures [55], and its precipitation becomes more pronounced. As a result, ettringite formation may produce higher expansion pressure in a specimen immersed in low-temperature seawater than that immersed in room temperature seawater, which may damage the specimen. In addition, ettringite formation may exert expansion pressure at the area where SO42− penetrates the specimen from seawater; this expansion pressure may then act toward the relatively less constrained surface rather than the less damaged interior of the specimen, resulting in cracks parallel to the surface.
Is it contradictory to suggest that the formation of ettringite in a small pore could cause an expansion pressure in a saturation where the porosity is increasing due to the dissolution of portlandite? Maybe not. Portlandite is usually crystalline in nature, and its crystals are above a few microns in size. The SEM-EDS result at the depth of 1 mm (Figure 6 and Figure 10) suggest that C–(A-)S–H was not decalcified and appeared to be mixed with ettringite even after the dissolution of portlandite. Moreover, C–(A-)S–H may contain small pores such as gel pores (~10 nm [56]), and ettringite formation in such pores may produce expansion pressure [54]. Therefore, although ettringite formation in low-temperature seawater may have contributed to the collapse of the specimen, the deterioration of the specimen needs to be investigated further.

5. Conclusions

PC paste specimens were immersed in room- and low-temperature seawater for 433 days. The specimen immersed in low-temperature seawater underwent more pronounced deterioration than that immersed in room-temperature seawater. The deteriorated specimen immersed in low-temperature seawater exhibited the following characteristics:
  • The Ca dissolution front was deep within the sample, and portlandite dissolution was more pronounced than in the specimen immersed in room-temperature seawater;
  • The porosity of the specimen increased with the dissolution of portlandite;
  • On the collapsed mashy surface, C–(A-)S–H was decalcified and Mg-based hydrates (e.g., brucite and M–(A-)S–H) and thaumasite formed.
The increased solubility of portlandite at low temperatures led to significant Ca dissolution and subsequent deterioration via C–(A-)S–H decalcification and the formation of M–(A-)S–H and thaumasite, resulting in the weakening and collapse of the surface. Although few reports on the marine durability of cementitious materials have focused on the seawater temperature, it is necessary to consider this parameter when evaluating the durability of offshore and deep-sea infrastructure.

Author Contributions

Conceptualization, M.K.; methodology, M.K. and Y.K.; image analysis, K.T.; investigation, M.K.; writing—original draft preparation, M.K.; writing—review and editing, K.T.; supervision, Y.K. All authors have read and agreed to the published version of the manuscript.

Funding

This research received no external funding.

Institutional Review Board Statement

Not applicable.

Informed Consent Statement

Not applicable.

Data Availability Statement

The data presented in this study are available in the article.

Conflicts of Interest

The authors declare no conflict of interest.

Appendix A

Figure A1 shows the SEM montage images of the specimens immersed in room- and low-temperature seawater. The dotted squares in each montage image indicate where EDS point analysis was performed. Selected BSE images at depths of 0, 1, 3, and 5 mm are also shown. For the specimen immersed in low-temperature seawater, porous regions (black-colored areas in Figure 2b) are particularly abundant at depths of 0 and 1 mm.
Figure A1. SEM montage images of the PC paste specimens immersed in (a) room-temperature seawater and (b) low-temperature seawater.
Materials 16 05278 g0a1

Appendix B

Figure A2 shows the EDS point analysis results at each depth for the specimens immersed in room- and low-temperature seawater shown in Figure A1. The Si/Ca, S/Ca, and Cl/Ca atomic ratios are plotted as functions of the Al/Ca atomic ratio.
Figure A2. EDS point analysis at various depths for the specimens immersed in room- and low-temperature seawater shown in Figure A1: (a) Si/Ca, (b) S/Ca, and (c) Cl/C atomic ratios as functions of the Al/Ca atomic ratio.
Materials 16 05278 g0a2

References

  1. Gjorv, O.E. Long-time durablity of concrete in seawater. J. Proc. 1971, 68, 60–67. [Google Scholar] [CrossRef]
  2. Buenfeld, N.R.; Newman, J.B. The development and stability of surface layers on concrete exposed to sea-water. Cem. Concr. Res. 1986, 16, 721–732. [Google Scholar] [CrossRef]
  3. O’Farrell, M.; Wild, S.; Sabir, B.B. Resistance to chemical attack of ground brick–PC mortar: Part II. Synthetic seawater. Cem. Concr. Res. 2000, 30, 757–765. [Google Scholar] [CrossRef]
  4. Mohammed, T.U.; Hamada, H.; Yamaji, T. Marine durability of 30-year old concrete made with different cements. J. Adv. Concr. Technol. 2003, 1, 63–75. [Google Scholar] [CrossRef] [Green Version]
  5. Ganjian, E.; Pouya, H.S. Effect of magnesium and sulfate ions on durability of silica fume blended mixes exposed to the seawater tidal zone. Cem. Concr. Res. 2005, 35, 1332–1343. [Google Scholar] [CrossRef]
  6. Shekarchi, M.; Rafiee, A.; Layssi, H. Long-term chloride diffusion in silica fume concrete in harsh marine climates. Cem. Concr. Compos. 2009, 31, 769–775. [Google Scholar] [CrossRef]
  7. De Weerdt, K.; Justnes, H.; Geiker, M.R. Changes in the phase assemblage of concrete exposed to sea water. Cem. Concr. Compos. 2014, 47, 53–63. [Google Scholar] [CrossRef]
  8. Ragab, A.M.; Elgammal, M.A.; Hodhod, O.A.; Ahmed, T.E. Evaluation of field concrete deterioration under real conditions of seawater attack. Constr. Build. Mater. 2016, 119, 130–144. [Google Scholar] [CrossRef]
  9. Jakobsen, U.H.; De Weerdt, K.; Geiker, M.R. Elemental zonation in marine concrete. Cem. Concr. Res. 2016, 85, 12–27. [Google Scholar] [CrossRef] [Green Version]
  10. Moffatt, E.G.; Thomas, M.D.A. Performance of 25-year-old silica fume and fly ash lightweight concrete blocks in a harsh marine environment. Cem. Concr. Res. 2018, 113, 65–73. [Google Scholar] [CrossRef]
  11. De Weerdt, K.; Lothenbach, B.; Geiker, M.R. Comparing chloride ingress from seawater and NaCl solution in Portland cement mortar. Cem. Concr. Res. 2019, 115, 80–89. [Google Scholar] [CrossRef]
  12. Val, D.V.; Stewart, M.G. Life-cycle cost analysis of reinforced concrete structures in marine environments. Struct. Saf. 2003, 25, 343–362. [Google Scholar] [CrossRef]
  13. Jin, Z.; Zhao, X.; Zhao, T.; Liu, Y. Corrosion behavior of steel bar and corrosive cracking of concrete induced by magnesium-sulfate-chloride ions. J. Adv. Concr. Technol. 2016, 14, 172–182. [Google Scholar] [CrossRef] [Green Version]
  14. Glasser, F.P.; Kindness, A.; Stronach, S.A. Stability and solubility relationships in AFm phases: Part I. Chloride, sulfate and hydroxide. Cem. Concr. Res. 1999, 29, 861–866. [Google Scholar] [CrossRef]
  15. Yuan, Q.; Shi, C.; De Schutter, G.; Audenaert, K.; Deng, D. Chloride binding of cement-based materials subjected to external chloride environment—A review. Constr. Build. Mater. 2009, 23, 1–13. [Google Scholar] [CrossRef]
  16. Balonis, M.; Lothenbach, B.; Le Saout, G.; Glasser, F.P. Impact of chloride on the mineralogy of hydrated Portland cement systems. Cem. Concr. Res. 2010, 40, 1009–1022. [Google Scholar] [CrossRef]
  17. Mesbah, A.; Rapin, J.-P.; François, M.; Cau-dit-Coumes, C.; Frizon, F.; Leroux, F.; Renaudin, G. Crystal structures and phase transition of cementitious bi-anionic AFm-(Cl, CO32−) compounds. J. Am. Ceram. Soc. 2011, 94, 261–268. [Google Scholar] [CrossRef] [Green Version]
  18. De Weerdt, K.; Orsáková, D.; Geiker, M.R. The impact of sulphate and magnesium on chloride binding in Portland cement paste. Cem. Concr. Res. 2014, 65, 30–40. [Google Scholar] [CrossRef]
  19. De Weerdt, K.; Colombo, A.; Coppola, L.; Justnes, H.; Geiker, M.R. Impact of the associated cation on chloride binding of Portland cement paste. Cem. Concr. Res. 2015, 68, 196–202. [Google Scholar] [CrossRef]
  20. Bernard, E.; Lothenbach, B.; Le Goff, F.; Pochard, I.; Dauzères, A. Effect of magnesium on calcium silicate hydrate (C-S-H). Cem. Concr. Res. 2017, 97, 61–72. [Google Scholar] [CrossRef] [Green Version]
  21. Jia, S.; Richardson, I.G. Micro- and nano-structural evolutions in white Portland cement/pulverized fuel ash cement pastes due to deionized-water leaching. Cem. Concr. Res. 2018, 103, 191–203. [Google Scholar] [CrossRef]
  22. Bonen, D. Composition and appearance of magnesium silicate hydrate and its relation to deterioration of cement-based materials. J. Am. Ceram. Soc. 1992, 75, 2904–2906. [Google Scholar] [CrossRef]
  23. Kurdowski, W. The protective layer and decalcification of C-S-H in the mechanism of chloride corrosion of cement paste. Cem. Concr. Res. 2004, 34, 1555–1559. [Google Scholar] [CrossRef]
  24. Roosz, C.; Grangeon, S.; Blanc, P.; Montouillout, V.; Lothenbach, B.; Henocq, P.; Giffaut, E.; Vieillard, P.; Gaboreau, S. Crystal structure of magnesium silicate hydrates (M-S-H): The relation with 2:1 Mg–Si phyllosilicates. Cem. Concr. Res. 2015, 73, 228–237. [Google Scholar] [CrossRef]
  25. Bernard, E.; Lothenbach, B.; Chlique, C.; Wyrzykowski, M.; Dauzères, A.; Pochard, I.; Cau-Dit-Coumes, C. Characterization of magnesium silicate hydrate (M-S-H). Cem. Concr. Res. 2019, 116, 309–330. [Google Scholar] [CrossRef]
  26. De Weerdt, K.; Justnes, H. The effect of sea water on the phase assemblage of hydrated cement paste. Cem. Concr. Compos. 2015, 55, 215–222. [Google Scholar] [CrossRef]
  27. Hewlett, P.C. Lea’s Chemistry of Cement and Concrete; Arnold: London, UK, 1998. [Google Scholar]
  28. Kunther, W.; Lothenbach, B.; Scrivener, K.L. On the relevance of volume increase for the length changes of mortar bars in sulfate solutions. Cem. Concr. Res. 2013, 46, 23–29. [Google Scholar] [CrossRef]
  29. Bizzozero, J.; Gosselin, C.; Scrivener, K.L. Expansion mechanisms in calcium aluminate and sulfoaluminate systems with calcium sulfate. Cem. Concr. Res. 2014, 56, 190–202. [Google Scholar] [CrossRef]
  30. Sibbick, T.; Fenn, D.; Crammond, N. The occurrence of thaumasite as a product of seawater attack. Cem. Concr. Compos. 2003, 25, 1059–1066. [Google Scholar] [CrossRef]
  31. Sea Temperature Info. Available online: https://seatemperature.info/new-brunswick-water-temperature.html (accessed on 24 May 2023).
  32. Kobayashi, M.; Takahashi, K.; Kawabata, Y. Physicochemical properties of the Portland cement-based mortar exposed to deep seafloor conditions at a depth of 1680 m. Cem. Concr. Res. 2021, 142, 106335. [Google Scholar] [CrossRef]
  33. Takahashi, K.; Kawabata, Y.; Iwanami, M.; Kobayashi, M.; Kasaya, T.; Yamanaka, T.; Nomura, S.; Makita, H. In-situ deep-sea monitoring of cement mortar specimen at a depth of 3515 m and changes in mechanical properties after exposure to deep sea condition. J. Adv. Concr. Technol. 2022, 20, 254–266. [Google Scholar] [CrossRef]
  34. JIS R 5204; Chemical analysis method of cement by X-ray fluorescence. Japanese Standards Association (JSA): Tokyo, Japan, 2019.
  35. Liu, Z.; Deng, D.; De Schutter, G.; Yu, Z. The effect of MgSO4 on thaumasite formation. Cem. Concr. Compos. 2013, 35, 102–108. [Google Scholar] [CrossRef]
  36. Hosokawa, Y.; Yamada, K.; Johannesson, B.; Nilsson, L.-O. Development of a multi-species mass transport model for concrete with account to thermodynamic phase equilibriums. Mater. Struct. 2011, 44, 1577–1592. [Google Scholar] [CrossRef]
  37. Kobayashi, M.; Takahashi, K.; Kawabata, Y.; Bier, T.A. Physicochemical properties of Portland cement/calcium aluminate cement/calcium sulfate ternary binder exposed to long-term deep-sea conditions. Mater. Struct. 2022, 55, 182. [Google Scholar] [CrossRef]
  38. van Aardt, J.H.P.; Visser, S. Thaumasite formation: A cause of deterioration of Portland cement and related substances in the presence of sulphates. Cem. Concr. Res. 1975, 5, 225–232. [Google Scholar] [CrossRef]
  39. Richardson, I.G. The nature of C-S-H in hardened cements. Cem. Concr. Res. 1999, 29, 1131–1147. [Google Scholar] [CrossRef]
  40. Faucon, P.; Delagrave, A.; Richet, C.; Marchand, J.M.; Zanni, H. Aluminum incorporation in calcium silicate hydrates (C–S–H) depending on their Ca/Si ratio. J. Phys. Chem. B 1999, 103, 7796–7802. [Google Scholar] [CrossRef]
  41. Bernard, E.; Lothenbach, B.; Cau-Dit-Coumes, C.; Pochard, I.; Rentsch, D. Aluminum incorporation into magnesium silicate hydrate (M-S-H). Cem. Concr. Res. 2020, 128, 105931. [Google Scholar] [CrossRef]
  42. San Román, M.S.; Holgado, M.J.; Jaubertie, C.; Rives, V. Synthesis, characterisation and delamination behaviour of lactate-intercalated Mg,Al-hydrotalcite-like compounds. Solid State Sci. 2008, 10, 1333–1341. [Google Scholar] [CrossRef]
  43. Andersen, M.D.; Jakobsen, H.J.; Skibsted, J. Characterization of white Portland cement hydration and the C-S-H structure in the presence of sodium aluminate by 27Al and 29Si MAS NMR spectroscopy. Cem. Concr. Res. 2004, 34, 857–868. [Google Scholar] [CrossRef]
  44. Richardson, I.G. Model structures for C-(A)-S-H(I). Acta Crystallogr. Sect. B Struct. Sci. Cryst. Eng. Mater. 2014, 70, 903–923. [Google Scholar] [CrossRef] [PubMed] [Green Version]
  45. Haga, K.; Shibata, M.; Hironaga, M.; Tanaka, S.; Nagasaki, S. Silicate anion structural change in calcium silicate hydrate gel on dissolution of hydrated cement. J. Nucl. Sci. Technol. 2002, 39, 540–547. [Google Scholar] [CrossRef]
  46. Brew, D.R.M.; Glasser, F.P. Synthesis and characterisation of magnesium silicate hydrate gels. Cem. Concr. Res. 2005, 35, 85–98. [Google Scholar] [CrossRef]
  47. Nied, D.; Enemark-Rasmussen, K.; L’Hopital, E.; Skibsted, J.; Lothenbach, B. Properties of magnesium silicate hydrates (M-S-H). Cem. Concr. Res. 2016, 79, 323–332. [Google Scholar] [CrossRef]
  48. Bernard, E.; Lothenbach, B.; Rentsch, D.; Pochard, I.; Dauzères, A. Formation of magnesium silicate hydrates (M-S-H). Phys. Chem. Earth Parts A/B/C 2017, 99, 142–157. [Google Scholar] [CrossRef]
  49. Skibsted, J.; Hjorth, L.; Jakobsen, H.J. Quantification of thaumasite in cementitious materials by 29Si {1H} cross-polarization magic-angle spinning NMR spectroscopy. Adv. Cem. Res. 1995, 7, 69–83. [Google Scholar] [CrossRef]
  50. Rahman, M.M.; Bassuoni, M.T. Thaumasite sulfate attack on concrete: Mechanisms, influential factors and mitigation. Constr. Build. Mater. 2014, 73, 652–662. [Google Scholar] [CrossRef]
  51. Boynton, R.S. Chemistry and Technology of Lime and Limestone, 2nd ed.; Wiley-Interscience: New York, NY, USA, 1980. [Google Scholar]
  52. ChemBK. Calcium Hydroxide. Available online: https://www.chembk.com/en/chem/Calcium%20hydroxide (accessed on 27 June 2023).
  53. Santhanam, M.; Cohen, M.; Olek, J. Differentiating seawater and groundwater sulfate attack in Portland cement mortars. Cem. Concr. Res. 2006, 36, 2132–2137. [Google Scholar] [CrossRef]
  54. Flatt, R.J.; Scherer, G.W. Thermodynamics of crystallization stresses in DEF. Cem. Concr. Res. 2008, 38, 325–336. [Google Scholar] [CrossRef]
  55. Lothenbach, B.; Matschei, T.; Möschner, G.; Glasser, F. Thermodynamic modelling of the effect of temperature on the hydration and porosity of Portland cement. Cem. Concr. Res. 2008, 38, 1–18. [Google Scholar] [CrossRef] [Green Version]
  56. Maruyama, I.; Ohkubo, T.; Haji, T.; Kurihara, R. Dynamic microstructural evolution of hardened cement paste during first drying monitored by 1H NMR relaxometry. Cem. Concr. Res. 2019, 122, 107–117. [Google Scholar] [CrossRef]
Figure 1. Preparation of paste specimens for analysis following seawater immersion. The dotted lines indicate the cutting planes.
Materials 16 05278 g001
Figure 2. Paste specimens after immersion in (a) room-temperature seawater and (b) low-temperature seawater for 433 days.
Materials 16 05278 g002
Figure 3. EPMA elemental maps of the PC paste specimens immersed in (a) room-temperature seawater and (b) low-temperature seawater. The area enclosed by the red square in the cross-sectional photographs indicate the area where the concentration profile analysis was performed for each element.
Materials 16 05278 g003
Figure 4. Concentration profiles of elements in the specimens immersed in room- and low-temperature seawater plotted from the surface (0 mm) to a depth of 6 mm within the area enclosed by the red square in Figure 3.
Materials 16 05278 g004
Figure 5. XRD patterns of the specimens obtained after immersion in (a) room-temperature seawater and (b) low-temperature seawater. Ett: ettringite, F’s: Friedel’s salt, K’s: Kuzel’s salt, CH: portlandite, CC: calcite, MH: brucite.
Materials 16 05278 g005
Figure 6. SEM montage images of the specimens after immersion in (a) room-temperature seawater and (b) low-temperature seawater. The areas surrounded by the red box indicate the area whose porosity (area %) was calculated by image processing.
Materials 16 05278 g006
Figure 7. Porosity (area %) of the specimens immersed in room- and low-temperature seawater.
Materials 16 05278 g007
Figure 8. Si/Ca ratio as a function of the Al/Ca ratio at a depth of 0 mm for the specimens immersed in room- and low-temperature seawater.
Materials 16 05278 g008
Figure 9. (a) Si/Mg ratio as a function of the Al/Mg ratio and (b) Mg/Ca ratio as a function of the Si/Ca ratio at a depth of 0 mm for the specimen immersed in low-temperature seawater.
Materials 16 05278 g009
Figure 10. (a) Si/Ca ratio as a function of the Al/Ca ratio and (b) S/Ca ratio as a function of the Al/Ca ratio at depths of 0, 1, and 3 mm for the specimen immersed in low-temperature seawater.
Materials 16 05278 g010
Figure 11. 29Si MAS-NMR spectrum of the collapsed surface sample from the specimen immersed in low-temperature seawater.
Materials 16 05278 g011
Table 1. Previous studies of the marine deterioration of hardened cement materials.
SiteZoneSeawater Temp
(°C)
Time
Period
Specimen
Kish Island, Iran [5]Tidal zone22–33 aup to 180 daysPaste and concrete, w/b c 0.2–0.4, mixed with SF and BFS
North coast of the Mediterranean Sea [8]Splash zone15–25 a4 to >60 yearsConcrete, w/c c 0.34–0.65
Kurihama, Japan [4]In seawater15–28 a30 yearsConcrete, w/c 0.52–0.55, with five different cements
Trondheim, Norway [1]In seawater5–15 aup to 30 yearsConcrete, 2500 different mixes
Trondheim, Norway [7]Tidal zone5–15 a10 yearsConcrete, w/b 0.4
Nine different locations in Norway and Denmark [9]Mainly in seawaterminimum 5–15 a2–34 yearsConcrete with 21 different mixes
Treat Island, USA [10]In seawaterminimum −3 a24–25 yearsConcrete, w/b 0.26–0.6, FA and SF containing lightweight blocks
Bandar-Abbas [6]Tidal zone 3 yearsConcrete, w/c 0.35, 0.40, 0.45, and 0.50, SF mixed with 5%, 7.5, 10, and 12.5%
Lab [3]In seawater b20560 daysMortar, w/b 0.5, mixed with ground brick
Lab [2]In seawater b2033 weeksConcrete, w/c 0.4
a From Sea Temperature Info database [31]. b Seawater renewed every 28 days. c Water/binder ratio (w/b), water/cement ratio (w/c).
Table 2. Composition of Portland cement determined by X-ray fluorescence (unit: %).
SiO2Al2O3Fe2O3CaOMgOSO3Na2OK2OLOI a
20.295.312.7265.201.202.900.230.291.03
a Loss on ignition.
Table 3. Paste mix proportions.
ComponentAmount (g)
Portland cement (PC)1200
Polycarboxylic ether (PCE)9.6
Hydroxypropyl methylcellulose (HPMC)5.8
Defoamer2.4
Tap water720
Disclaimer/Publisher’s Note: The statements, opinions and data contained in all publications are solely those of the individual author(s) and contributor(s) and not of MDPI and/or the editor(s). MDPI and/or the editor(s) disclaim responsibility for any injury to people or property resulting from any ideas, methods, instructions or products referred to in the content.