Article

Research on the Fatigue Crack Growth Behavior of a Zr/Ti/Steel Composite Plate with a Crack Normal to the Interface

1
Engineering Technology Training Center, Nanjing Vocational University of Industry Technology, Nanjing 210023, China
2
State Key Laboratory of Organic Electronics and Information Displays & Institute of Advanced Materials (IAM), Nanjing 210023, China
3
School of Mechanical and Power Engineering, Nanjing Tech University, Nanjing 211816, China
4
Technology Research and Development Department, Nanjing Boiler and Pressure Vessel Inspection Institute, Nanjing 210028, China
*
Author to whom correspondence should be addressed.
Materials 2023, 16(15), 5282; https://doi.org/10.3390/ma16155282
Submission received: 5 July 2023 / Revised: 21 July 2023 / Accepted: 25 July 2023 / Published: 27 July 2023

Abstract

:
The current work reveals the influence of loading parameters on the crack growth behavior of a Zr/Ti/steel composite plate with a crack normal to the interface by using an experiment and the finite element method. The Chaboche model was first used to study cyclic plastic evolution in composite materials. The results reveal that an increase in Fmax, Fm, and Fa can promote da/dN; meanwhile, an increase in R will reduce da/dN. The plastic strain accumulation results indicate that Fm mainly contributes to the tensile strain and compressive stress after the first cycle. Additionally, Fa increases the stress range and compression stress and greatly improves the plastic strain accumulation degree in subsequent loading cycles. The Fmax can significantly increase the stress amplitude and plastic strain accumulation level. When R increases, the plastic strain accumulation increases a little, but the stress amplitude and compression stress decrease greatly. Furthermore, it is also found that the elastic–plastic mismatch also affects the plastic evolution, that is, strengthening or weakening the effect of the loading parameters.

1. Introduction

A Zr/Ti/steel composite plate uses zirconium as the cladding material, steel as the base material, and titanium as the transition layer [1,2]. A Zr/Ti/steel composite plate has excellent corrosion resistance, high strength, and certain plasticity; that is to say, it has good comprehensive performance and reduces the cost of manufacturing pure zirconium/titanium equipment. Therefore, it is widely used in the salt-making, metallurgy, chemical, and pharmaceutical industries [3].
There are generally differences in the elastic, plastic, and thermodynamic properties of materials composed of composite plates, which complicate the crack growth behavior in composites [4]. At present, the propagation behavior of cracks normal to the interface in composite material plates is receiving increasing attention. It is generally believed that when cracks propagate from one side of the material to the other, property mismatch will significantly affect their propagation behavior [5,6,7]. For an elastic mismatch, many scholars have put forward a variety of expressions for the K of this type of crack. Cirello [8] proposed the actual dimensionless K for sandwich materials. Zhong [9] used the interface layer model to establish a more accurate mechanical model by giving specific geometric dimensions to non-uniform thin layers and assuming that the material properties inside the layers are continuously changing. However, these expressions are limited to specific structural forms and various assumptions, resulting in the application scenarios being limited. Therefore, the finite element method has become the most widely used method to obtain K. For plastic mismatches, the inhomogeneous term method is used by Sistaninia [10], which can clarify the influence of elastic and plastic mismatches on far-field and near-field driving forces at the crack tip. Unfortunately, it is difficult to establish a relationship with da/dN; therefore, its application is limited.
The influence of the loading parameters on da/dN has been widely researched [11]. Based on the linear elastic fracture theory, the crack is modulated by K. Therefore, the effect of the loading parameters can be studied by their influence on K [12]. The peak load Fmax increases the tensile strain and the static damage degree. The bending fatigue test results of Corigliano [13] showed that, with an increase in Fmax, cracks start from the aluminum alloy side and propagate towards the pure aluminum intermediate layer along the thickness direction. After reaching the interface, some cracks propagate in a different direction, resulting in delamination at the interface; meanwhile, another part continues to propagate towards the steel side through the interface. The stress amplitude directly increases K, and the load ratio R is mainly related to the crack closure effect [14]. Chandran [15] found that although mean load Fm does not change K, it changes R and has a resulting closure effect. Zhang [16] studied the fatigue cracks in forged Ti-Al-4V composite plates, with a focus on the effects of residual stress. It was found that the residual stress contributes to Fmax, which determines the initial crack initiation position and the propagation direction. Mayer [17] studied the damage mechanism, i.e., microstructure characteristics after failure, and analyzed the influence of Fm. It is one-sided to explain the influence of the parameters on the crack growth behavior based on linear elastic fracture theory. In fact, with the help of the finite element method, considering cyclic loading, Li [18] studied the plastic deformation characteristics, damage accumulation, and energy-change process of materials under cyclic loading and analyzed the influence of four kinds of working conditions on crack growth.
So far, the influence of loading parameters on the plastic deformation behavior of single materials has been clarified; this effect is clearly different in composite materials, which has aroused our interest. In this paper, by using the finite element method and considering static and cyclic loading, the influence of loading parameters on the monotonic plastic deformation and cyclic plastic deformation damage of a Zr/Ti/steel composite plate is analyzed. In addition, the Chaboche model, considering cyclic plastic behavior, is first used to study composite materials, and the difference between crack tip deformation in single homogeneous materials and composite materials is discussed, clarifying the influence of property mismatch on cyclic characteristics.

2. Materials and Methods

2.1. Materials

A Zr/Ti/steel explosive welding composite plate was used in this study, in which zirconium and titanium were commercially pure, whereas the brand of steel was Q345R. Table 1 lists the basic mechanical properties of the three component materials, which were obtained via the tensile testing of the component materials. The elastic modulus of titanium and zirconium were very close, whereas their tensile strengths were very different. The thicknesses of each of the layers of the Zr/Ti/steel composite plate were 2, 1.8, and 8.2 mm, respectively. The composite plate was subjected to post-weld heat treatment; thus, residual stress was not considered in this study.

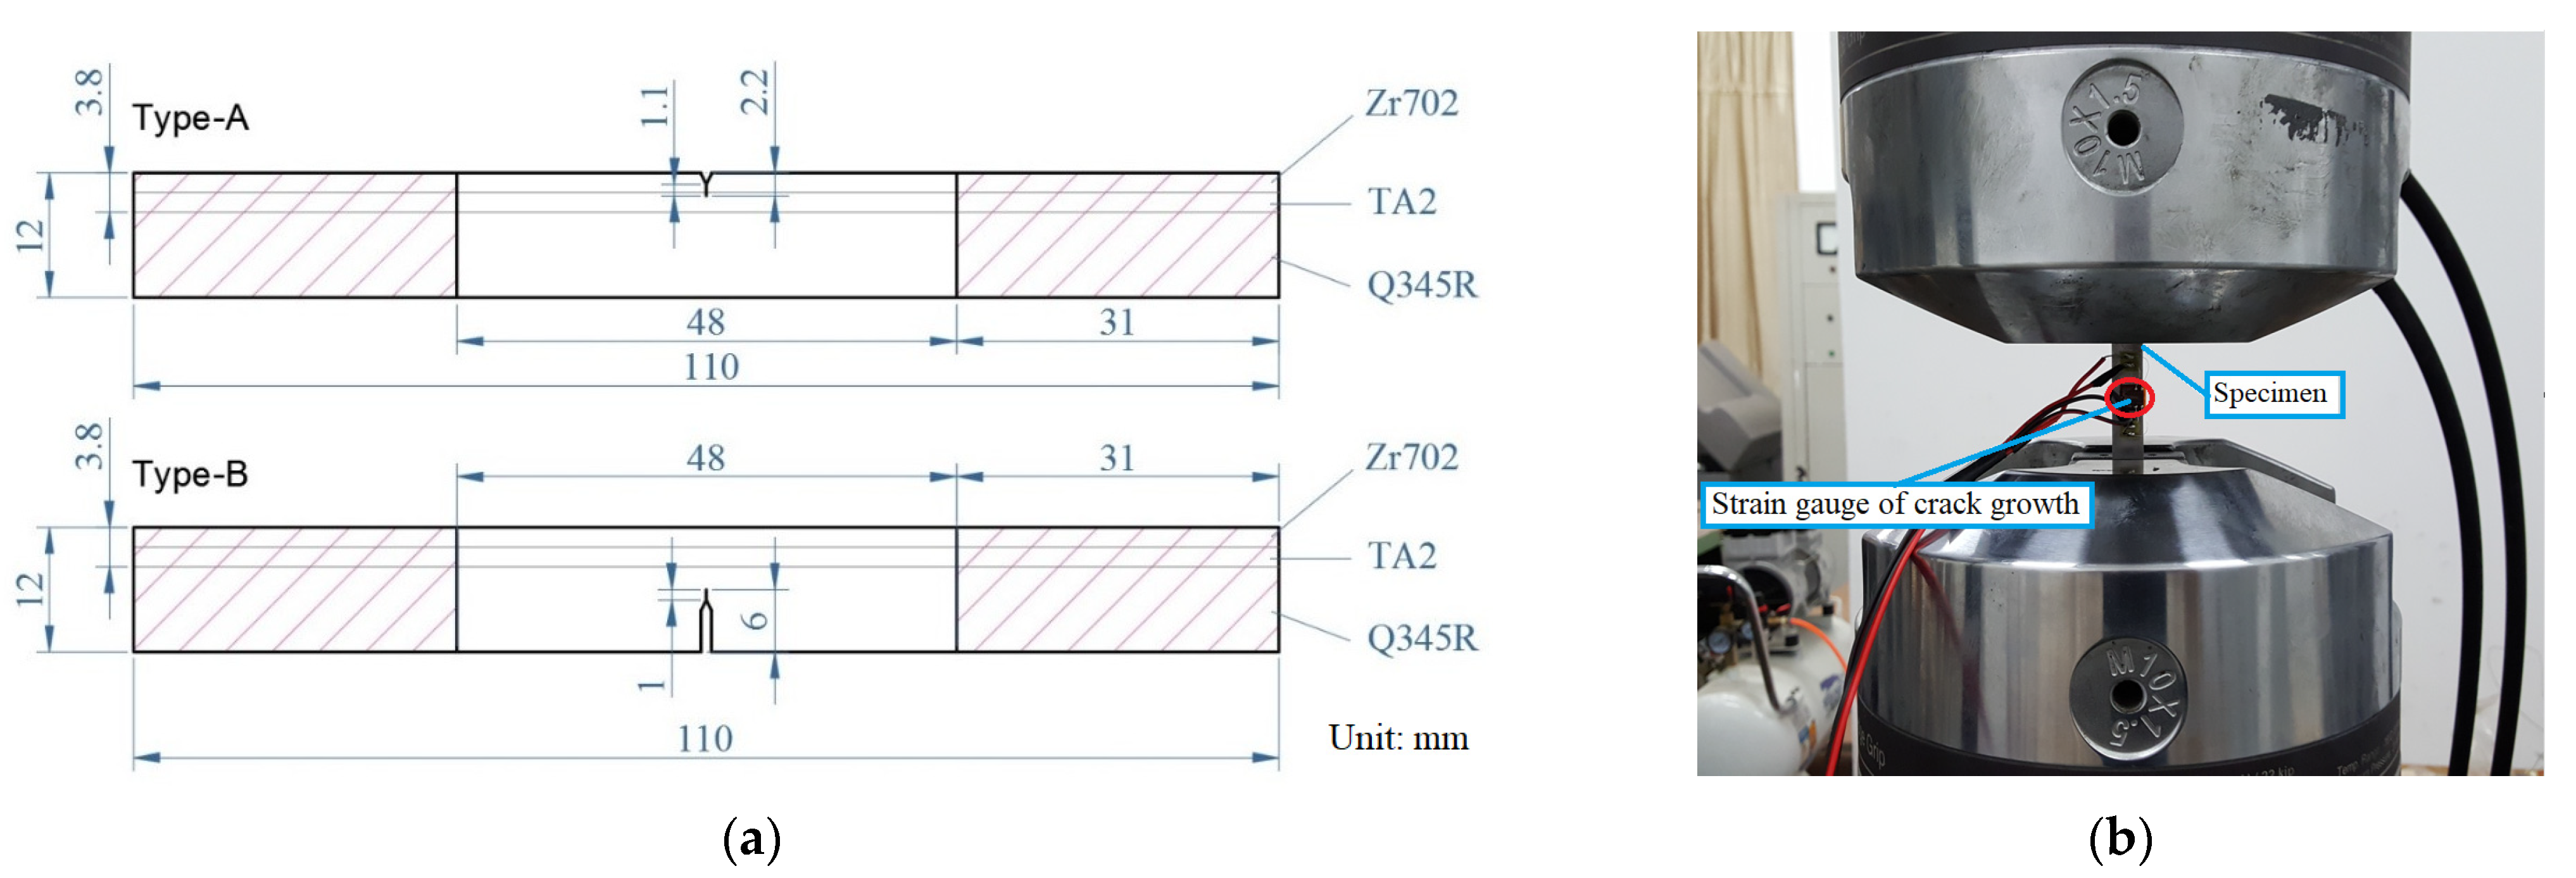
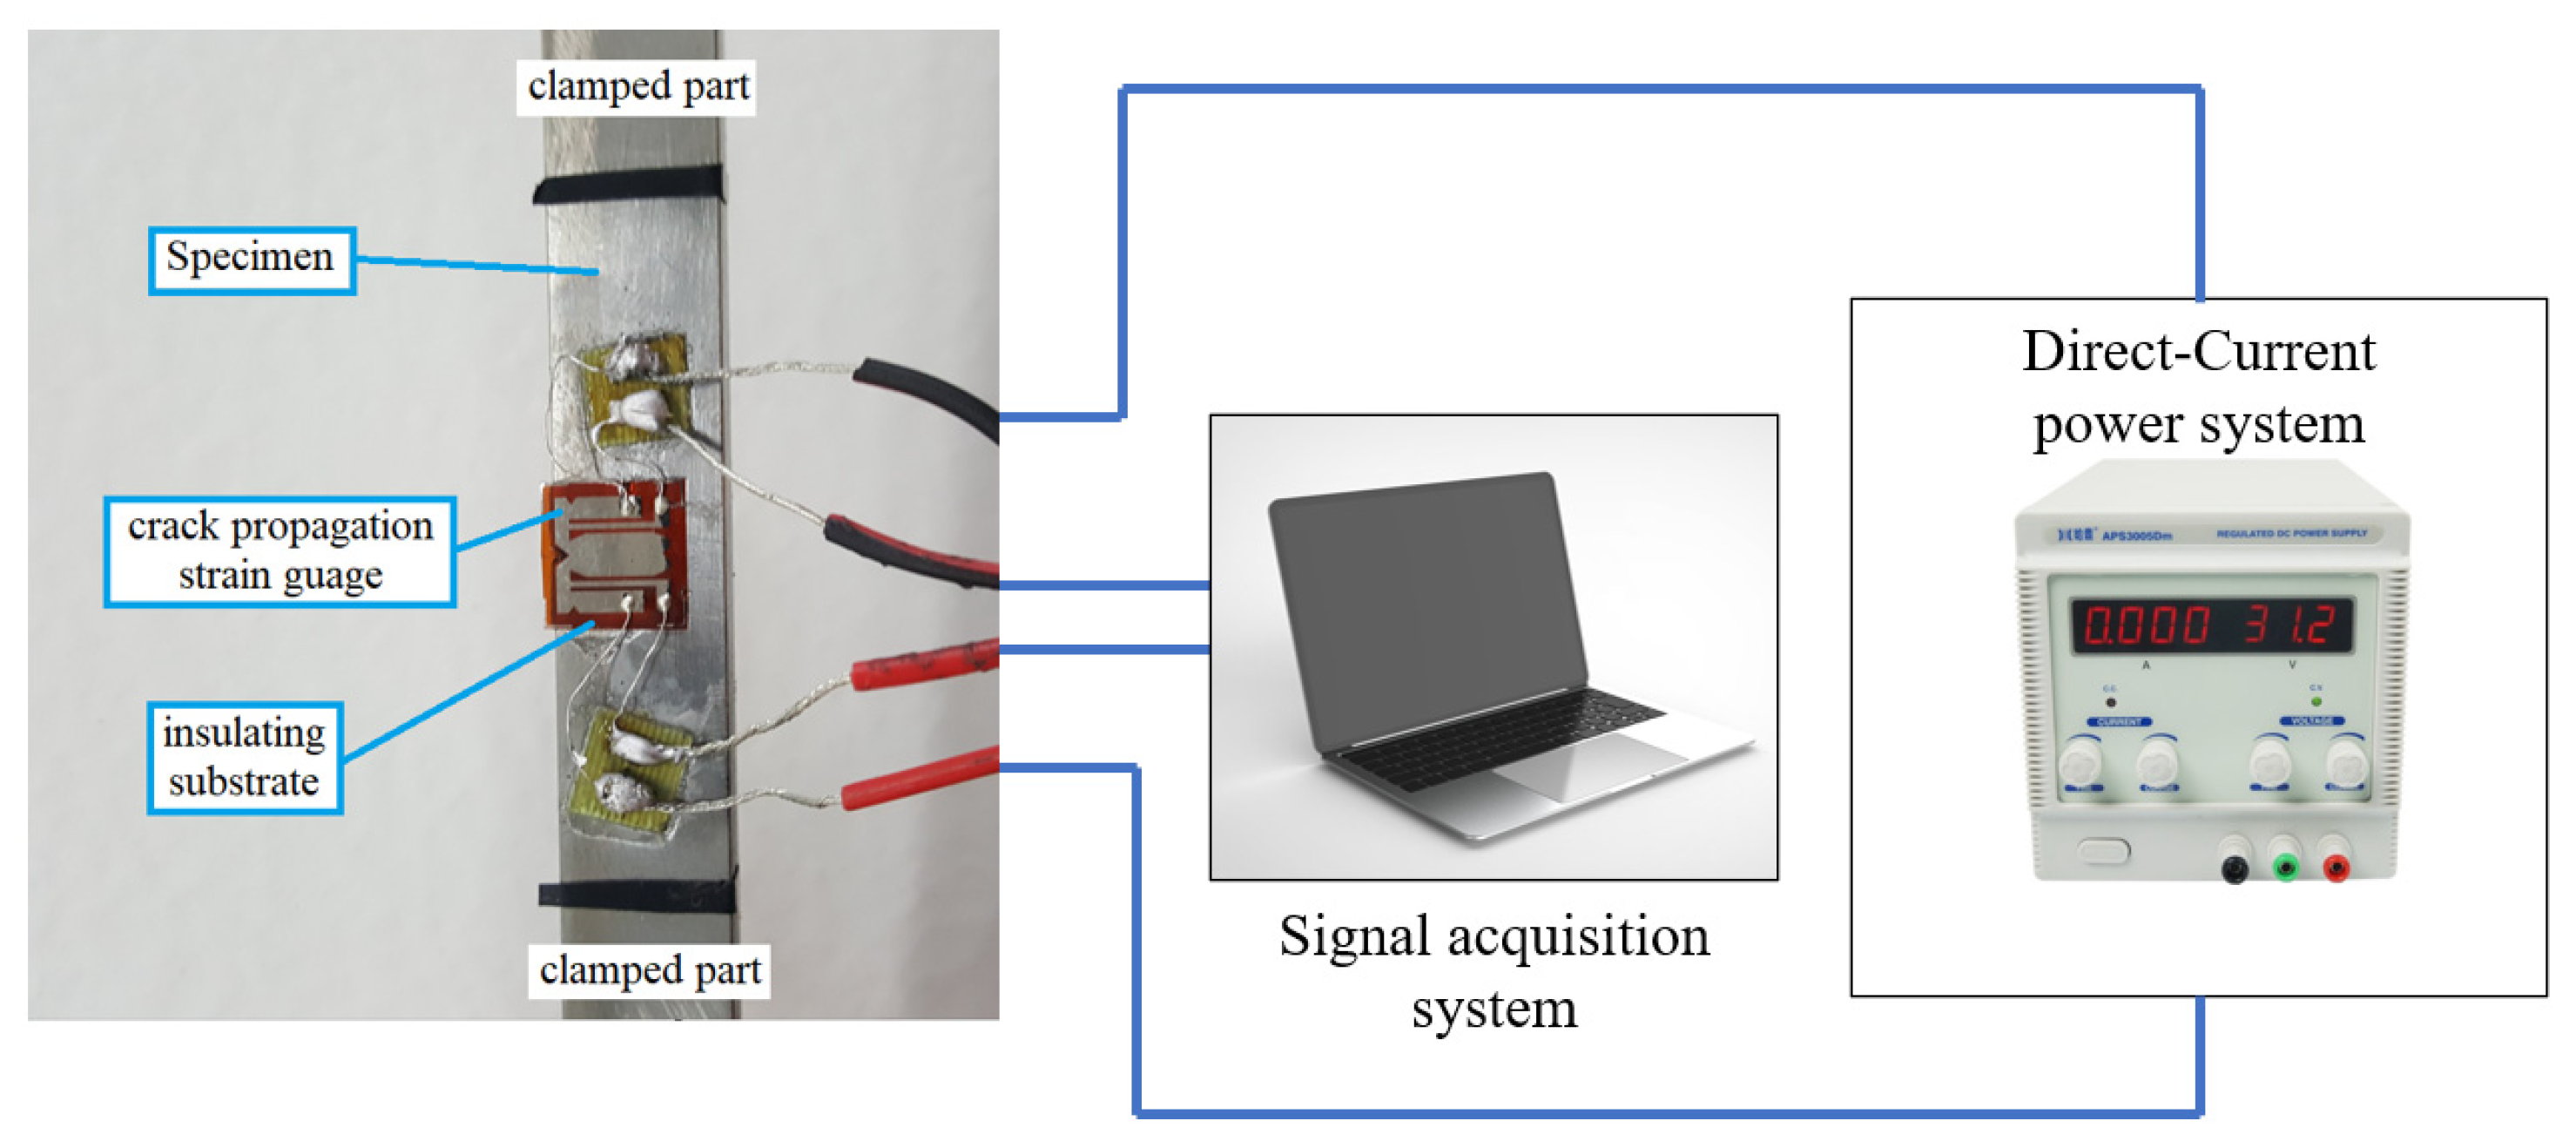
2.2. Fatigue Crack Growth Test

Considering the difference in the crack initiation location, two specimen types were considered, as shown in Figure 1a; the thicknesses of the Zr702, TA2, and Q345R layers were 2, 1.8, and 8.2 mm, respectively. The crack of the Type-A specimen propagated from ‘soft’ material to ‘hard’ material, whereas the crack of the Type-B specimen propagated from ‘hard’ material to ‘soft’ material. According to ASTM E647 [19], which requires the size of a SENT (single edge notch specimen), the specimen thickness is half of its width, i.e., 6 mm. Prior to the formal crack growth test, an initial crack prefabrication test was carried out on the specimens under fatigue loading. For the Type-A specimen, the crack length after prefabrication was 2.2 mm, whereas that of the Type-B specimen was 6 mm, as shown in Figure 1a. The initial crack prefabrication test was conducted according to ASTM E647, and its load was much smaller than that of the formal crack growth test. The test was carried out on MTS809 hydraulic testing machine at ambient temperature, as shown in Figure 1b. The shaded part of the sample (as shown in Figure 1) was clamped and subjected to stress-controlled fatigue testing. A formal crack growth test was carried out at 8 Hz, and a triangular wave was used. The specific loading parameters are shown in Table 2. As shown in Table 2, there were 9 groups for Type-A and 9 groups for Type-B.
Figure 2 shows that the direct current potential method [20] was used to measure the crack length. At the same time, the corresponding number of loading cycles was recorded. During the test, the load was automatically controlled and recorded by the MTS809 machine. After the test, the seven points polynomial method [21] was used to obtain the da/dN data.

2.3. Finite Element Method

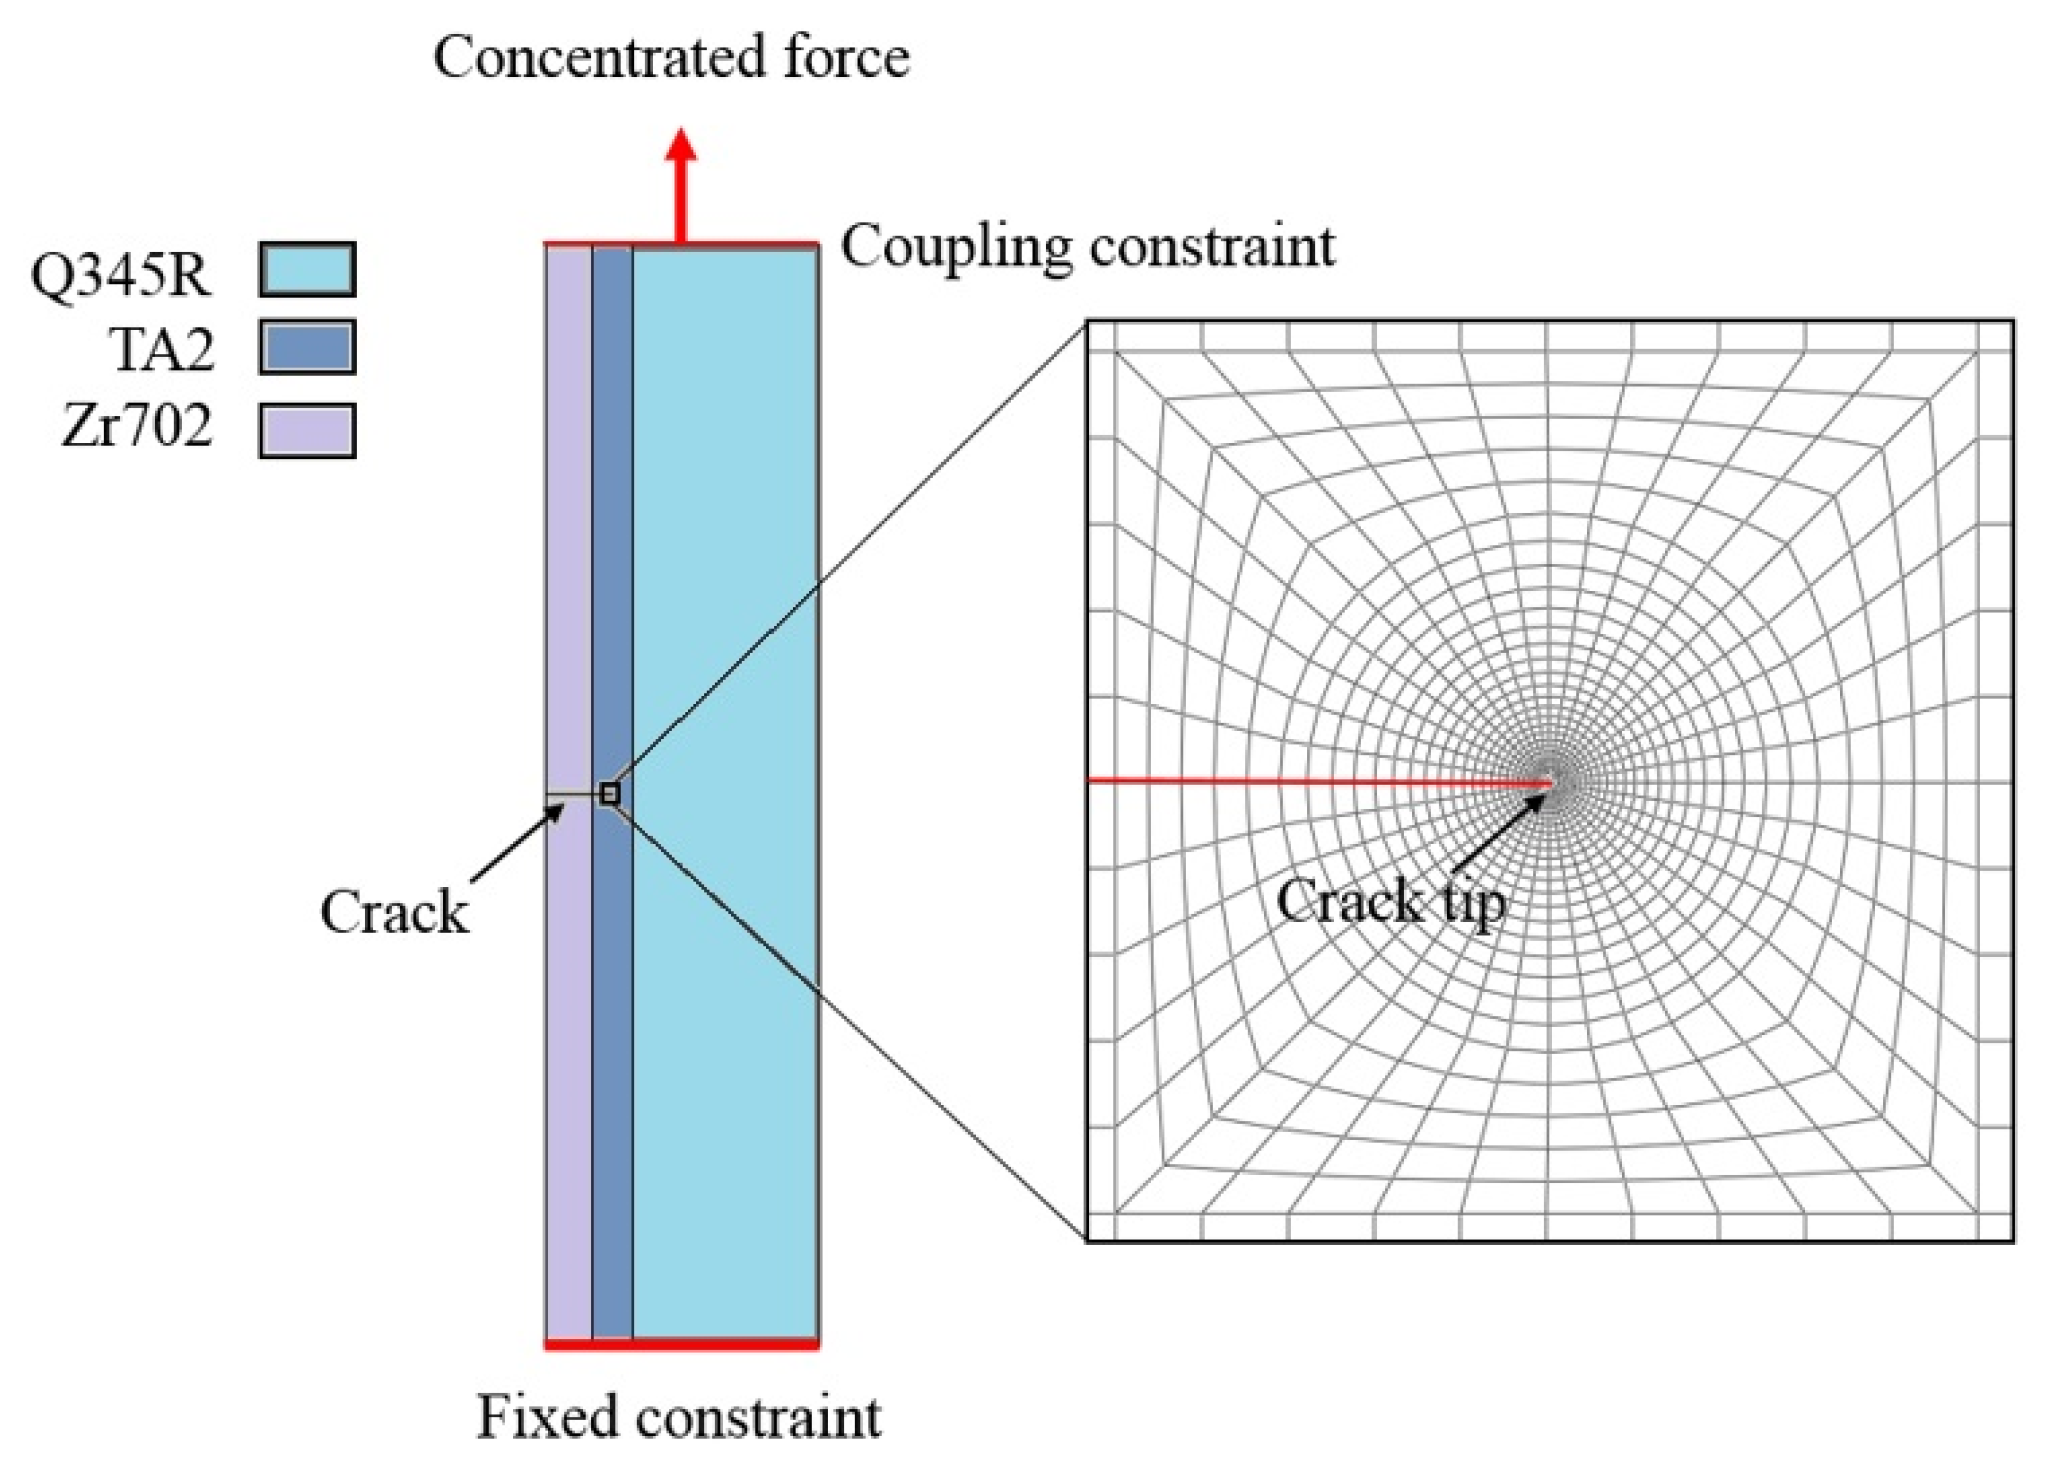
2.3.1. Static Finite Element Method

The finite element software, ABAQUS, was used to obtain the monotonic plastic zone size of the crack tip. A two-dimensional finite element model was adopted here, and the element type was a plane strain element (CPE4). The material properties are defined in Table 1, and the boundary conditions and finite elements are shown in Figure 3 (Type-A crack as an example).
As shown in Figure 3, one side of the specimen was set as a fixed constraint, the other side was a binding constraint, and a concentrated load was applied. At the same time, the other degrees of freedom of this side were limited, except in the direction of the concentrated force. The mesh of the crack tip was refined using linearized mesh generation in order to measure the size of the plastic zone conveniently. The minimum size was 0.001 mm and the maximum size was 0.01 mm. In this paper, the plastic zone was defined as the region in which the plastic strain was more than 10−4.

2.3.2. The Finite Element Method Considering Cyclic Loading by Using the Chaboche Model

In order to describe the plastic deformation behavior of materials under cyclic loading, follow-up strengthening was considered [21]. By using the Chaboche model, which combines the criteria of follow-up strengthening and isotropic strengthening, ABAQUS was used to study the cyclic response, plastic deformation, and strain accumulation under cyclic loading in this study.
According to the von Mises yield criterion, the yield surface of the Chaboche model is expressed as follows [22]:
f σ α , k = 2 3 s a · s a k = 0
In the above equation, σ is the stress tensor; α is the back stress tensor, i.e., the center of yield surface; s is the partial stress tensor; a is the partial back stress tensor; k is the yield surface size.
To describe the plastic flow direction, the plastic strain increment is expressed as follows:
d ε p = λ f σ
where λ is the plastic multiplier. The following hardening law of the model is expressed as follows:
d α = i = 1 M d α i
d α i = 2 3 C i d ε p γ i α i d p
Here, C i and γ i are material parameters; d p is the cumulative plastic strain. The material parameters of each component material were obtained via uniaxial tensile testing of each homogeneous material, and the strengthening parameters were obtained via a low-cycle fatigue test. The parameters of the component materials and the data of isotropic strengthening were applied to the Chaboche model, whereas boundary conditions and constraints similar to those of the static finite element method were adopted. The parameters of the Chaboche model for each component are shown in Table 3. The parameters of the Chaboche model and the equivalent plastic strength–strain curve of the corresponding component material were obtained via basic tensile tests and low-cycle fatigue tests of the specimen.
The experimental data used for finite element analysis in this study consisted of two parts: the first part was quasi-static data, which included the elastic and plastic results in the tensile stress–strain curve used for the quasi-static deformation simulation of finite element analysis. The second part was a low-cycle fatigue test in order to obtain the Chaboche model parameters and equivalent plastic strength–strain curve for dynamic fatigue simulation.

3. Results and Discussion

3.1. The Influence of Loading Parameters on Fatigue Crack Growth Behavior

3.1.1. The Influence of Loading Parameters on da/dN

Figure 4a,c show that the crack in the Type-A specimen is hindered by the property mismatch. An elastic mismatch results in a decrease in the driving force of the crack tip, further leading to a decrease in da/dN near the interface. The da/dN of the crack tip increases with Fmax, which is consistent with the variation pattern in homogeneous materials. Obviously, when Fmax increases, ΔK increases, thus increasing da/dN. Figure 4b,d show that da/dN decreases with an increase in R. In Figure 4b, the da/dN results under different R values are similar at the interface, but the gap gradually increases as the crack continues to expand at the Q345R side. The results show that the da/dN of each side decreases with an increase in R, so it can be considered that ΔK is the main factor affecting da/dN. Secondly, due to the significant differences in the properties and resistance to crack growth of component materials, the variation in ΔK affected by the elastic mismatch and the propagation characteristics of cracks in homogeneous single materials should be considered in da/dN analysis near the interface.
The influence of Fm and the load amplitude Fa on da/dN is shown in Figure 5. Figure 5a,c show that the da/dN of Type-A and Type-B cracks increases with Fm, but this increase is limited. Actually, Fm does not affect the driving force of the crack, and its effect on da/dN is mainly achieved by improving the damage degree of the crack tip. In the same way, due to the elastic–plastic mismatch of the Type-A specimen, the results of the da/dN under different Fm values first decrease and then increase near the interface. In contrast, the change in da/dN at the interface of the Type-B specimen can be ignored. Figure 5b,d show that an increase in Fa can greatly promote da/dN. This is because Fa directly determines the driving force, ΔK, to improve da/dN.

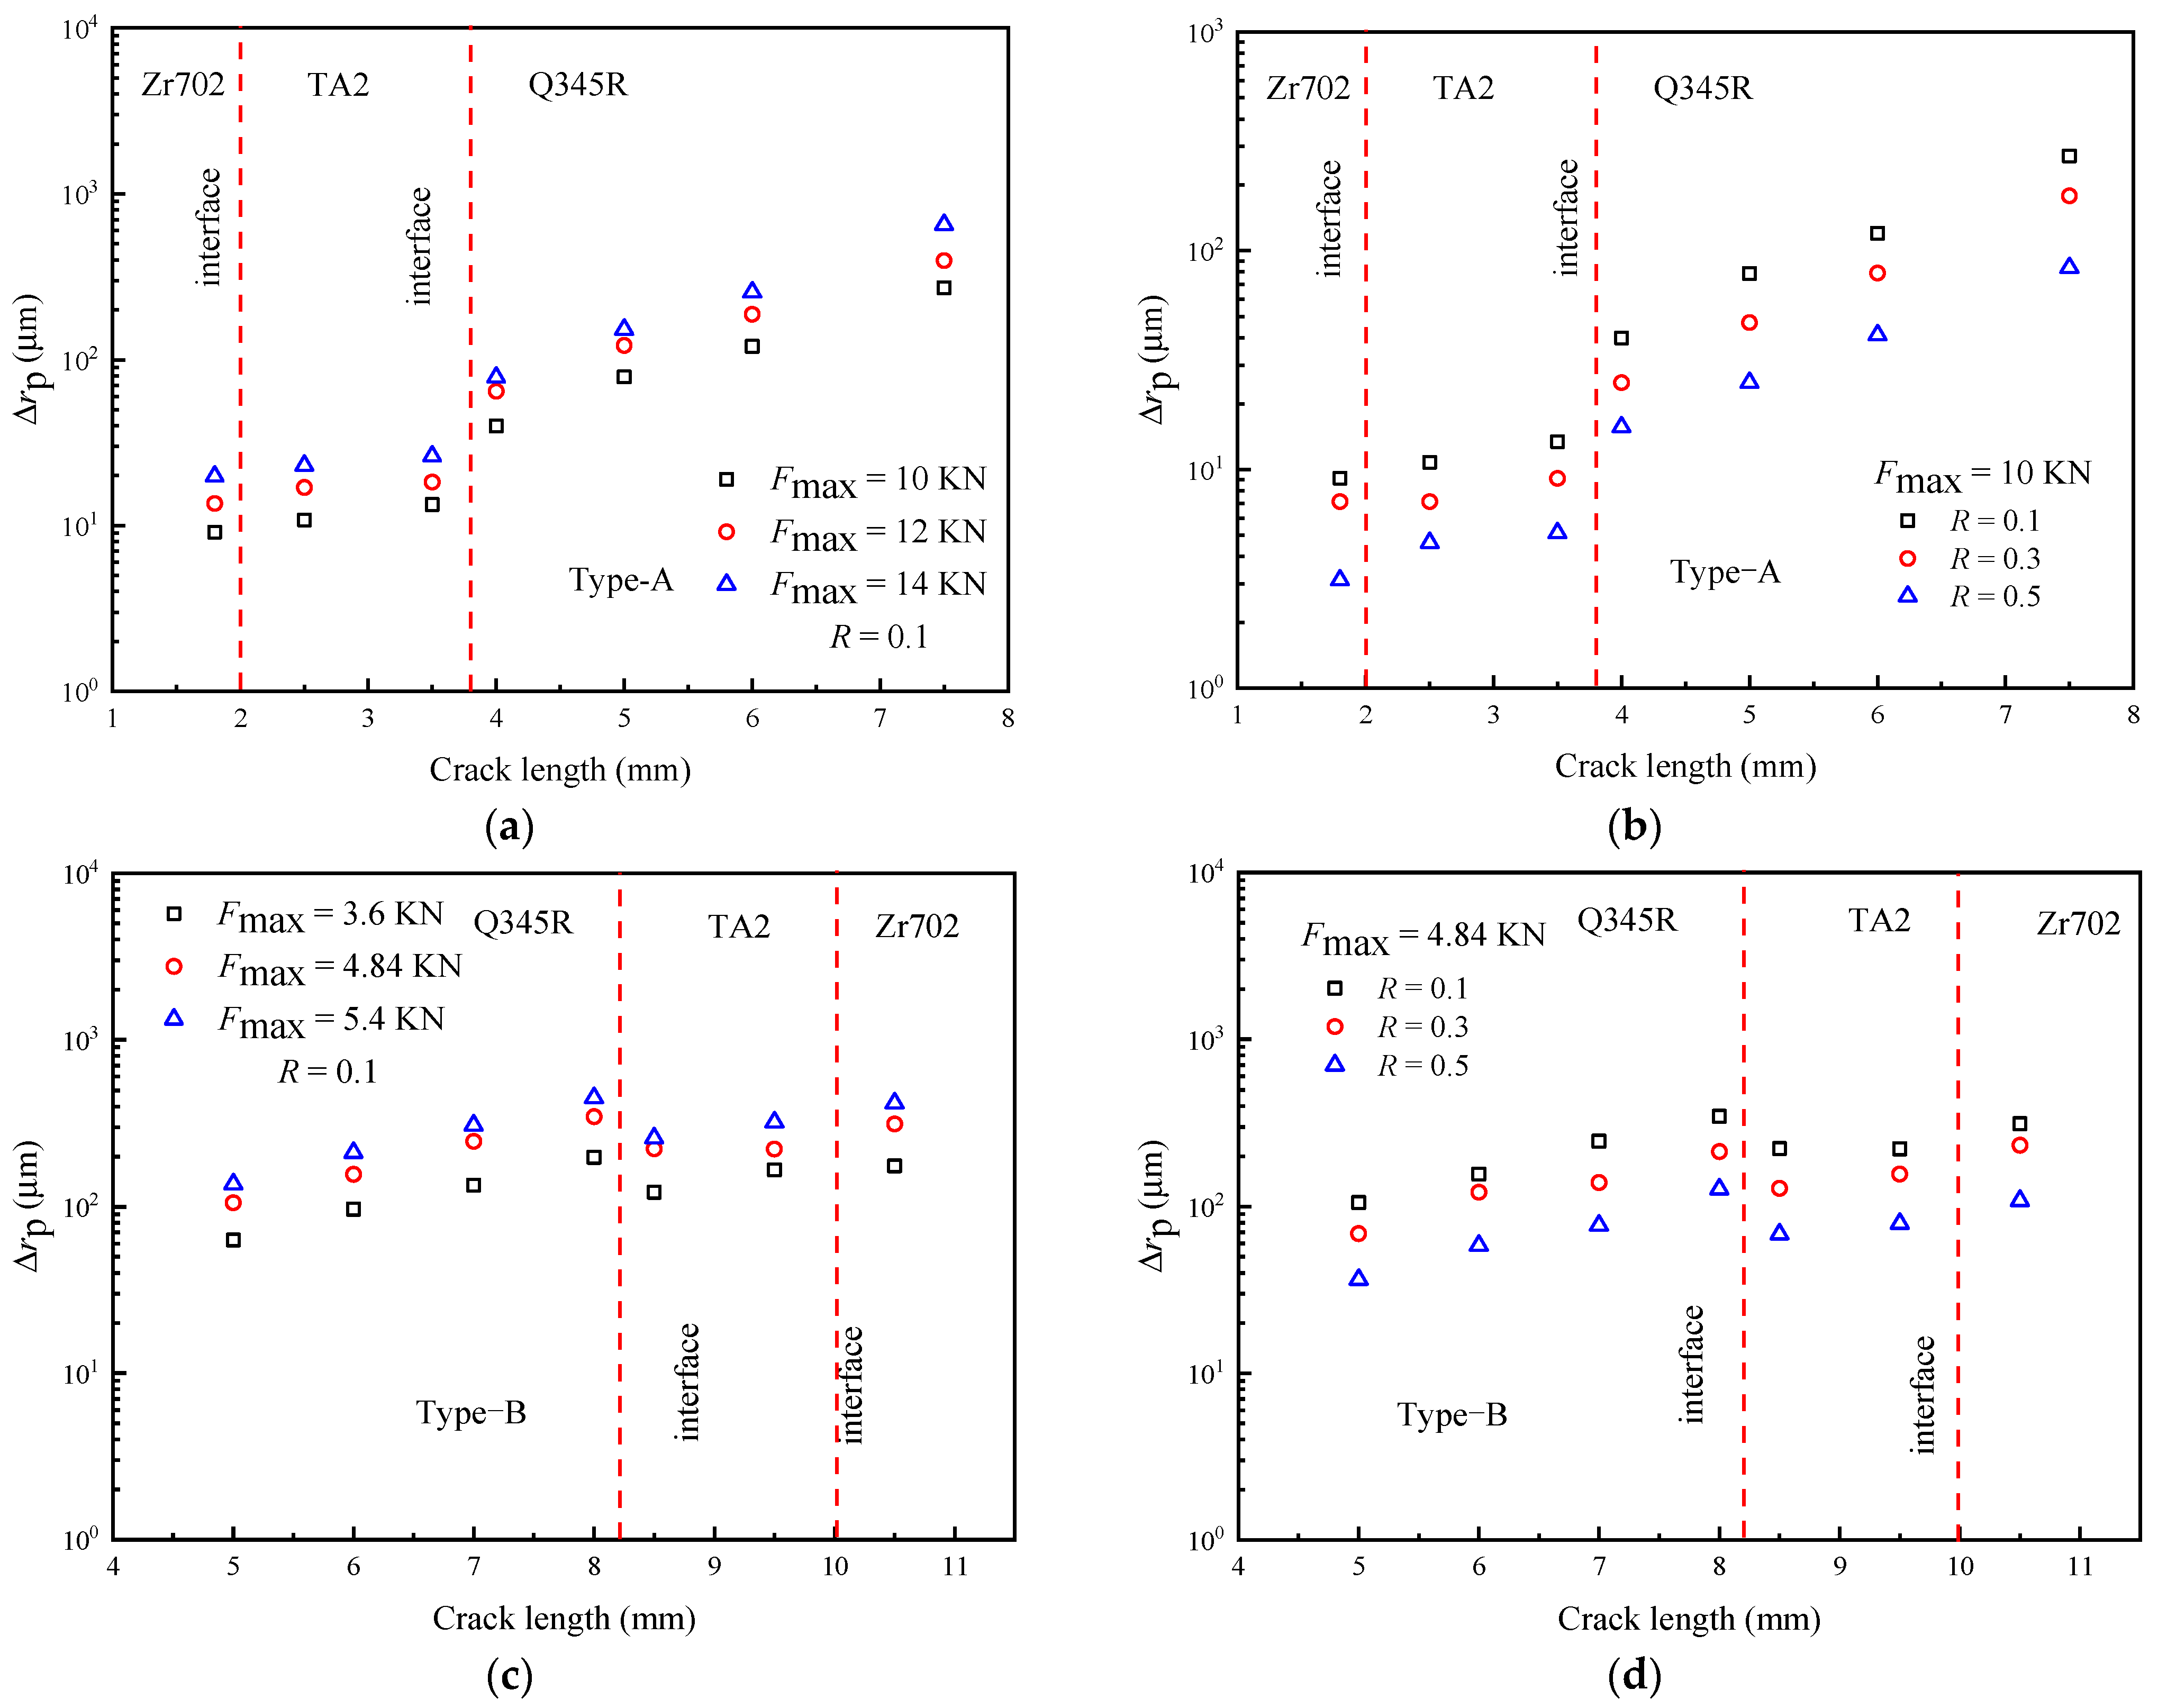
3.1.2. The Influence of Loading Parameters on the Plastic Zone of Crack Tip

There are two main types of damage in the process of fatigue crack growth: static damage and cyclic damage [18]. The static damage is controlled by the maximum stress intensity factor Kmax, whereas the cyclic damage is controlled by ΔK. In view of the linear elastic fracture mechanics, the monotonic plastic zone can be determined by Kmax, whereas ΔK under cyclic loading depends on Fa. Therefore, for a monotonic plastic zone under cyclic loading, Fa is the most critical parameter. Because the quasi-static model cannot consider the plastic strain accumulation of the crack tip, this section mainly studies the influence of loading parameters on the monotonic damage degree by studying the change in the monotonic plastic zone.
Figure 6 shows the influence of Fmax and R on the monotonic plastic zone change for Type-A and Type-B specimens. Figure 6a,c show that when R is fixed, plastic deformation increases with Fmax. At this time, Fmax leads to the synchronous rise of Fm and Fa, so the crack tip bears a higher stress level, thus improving the plastic deformation degree. As shown in Figure 6b,d, when Fmax is fixed, the monotonic plastic deformation decreases significantly with an increase of R. At this time, because Fmax is constant, Fa decreases with an increase in R. Relative to Fm, Fa plays a dominant role in monotonic plastic deformation, and the changing trend of the monotonic plastic deformation level at the crack tip is consistent with that of Fa.
Figure 7 shows the influence of Fm and Fa on monotonic plastic zone change. As shown in Figure 7a,c, the static finite element simulation results show that an increase in Fm does not change the monotonic plastic deformation. In the static finite element method, Fa is the same under different Fm values, so the monotonic plastic zone change is the same. It can be seen that using the static finite element to describe the influence of Fm on crack growth behavior has limitations because the influence of Fm needs to be analyzed by considering the cyclic deformation characteristics of the finite element considering cyclic loading. The monotonic plastic zone change results under different Fa values (Figure 7b,d) show that when Fm remains unchanged, Fa significantly improves the plastic deformation ability of the crack tip.

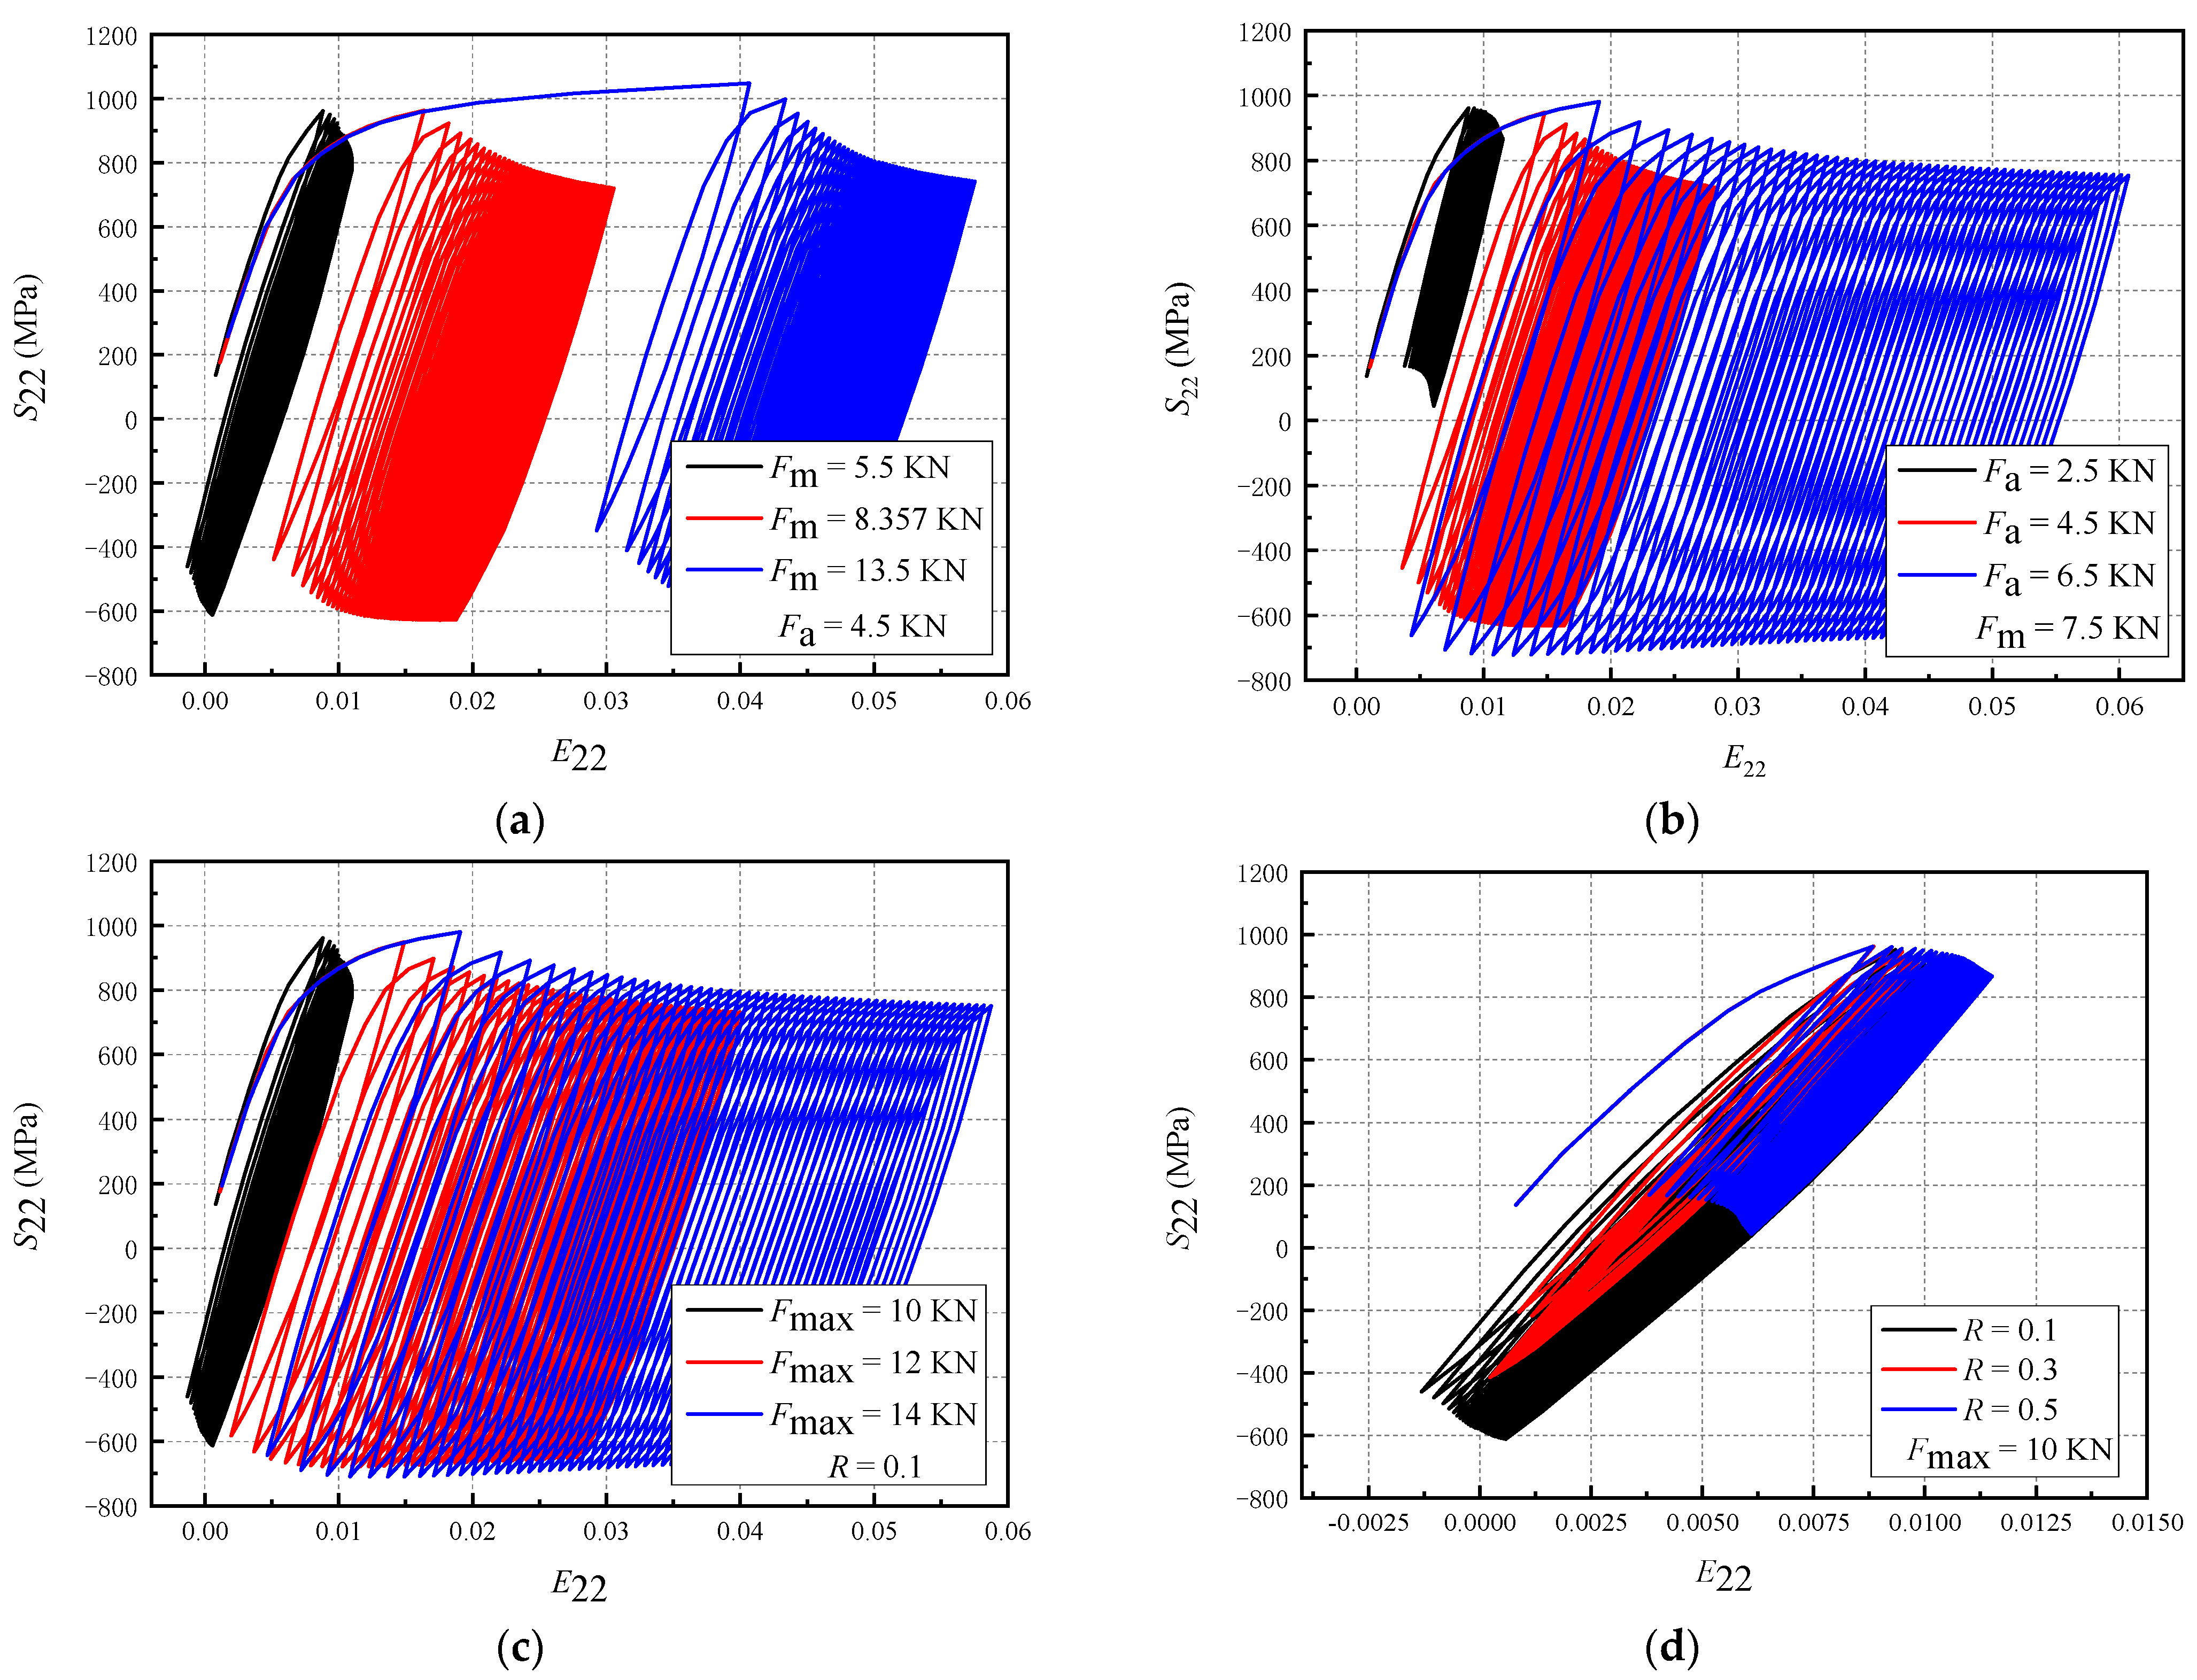
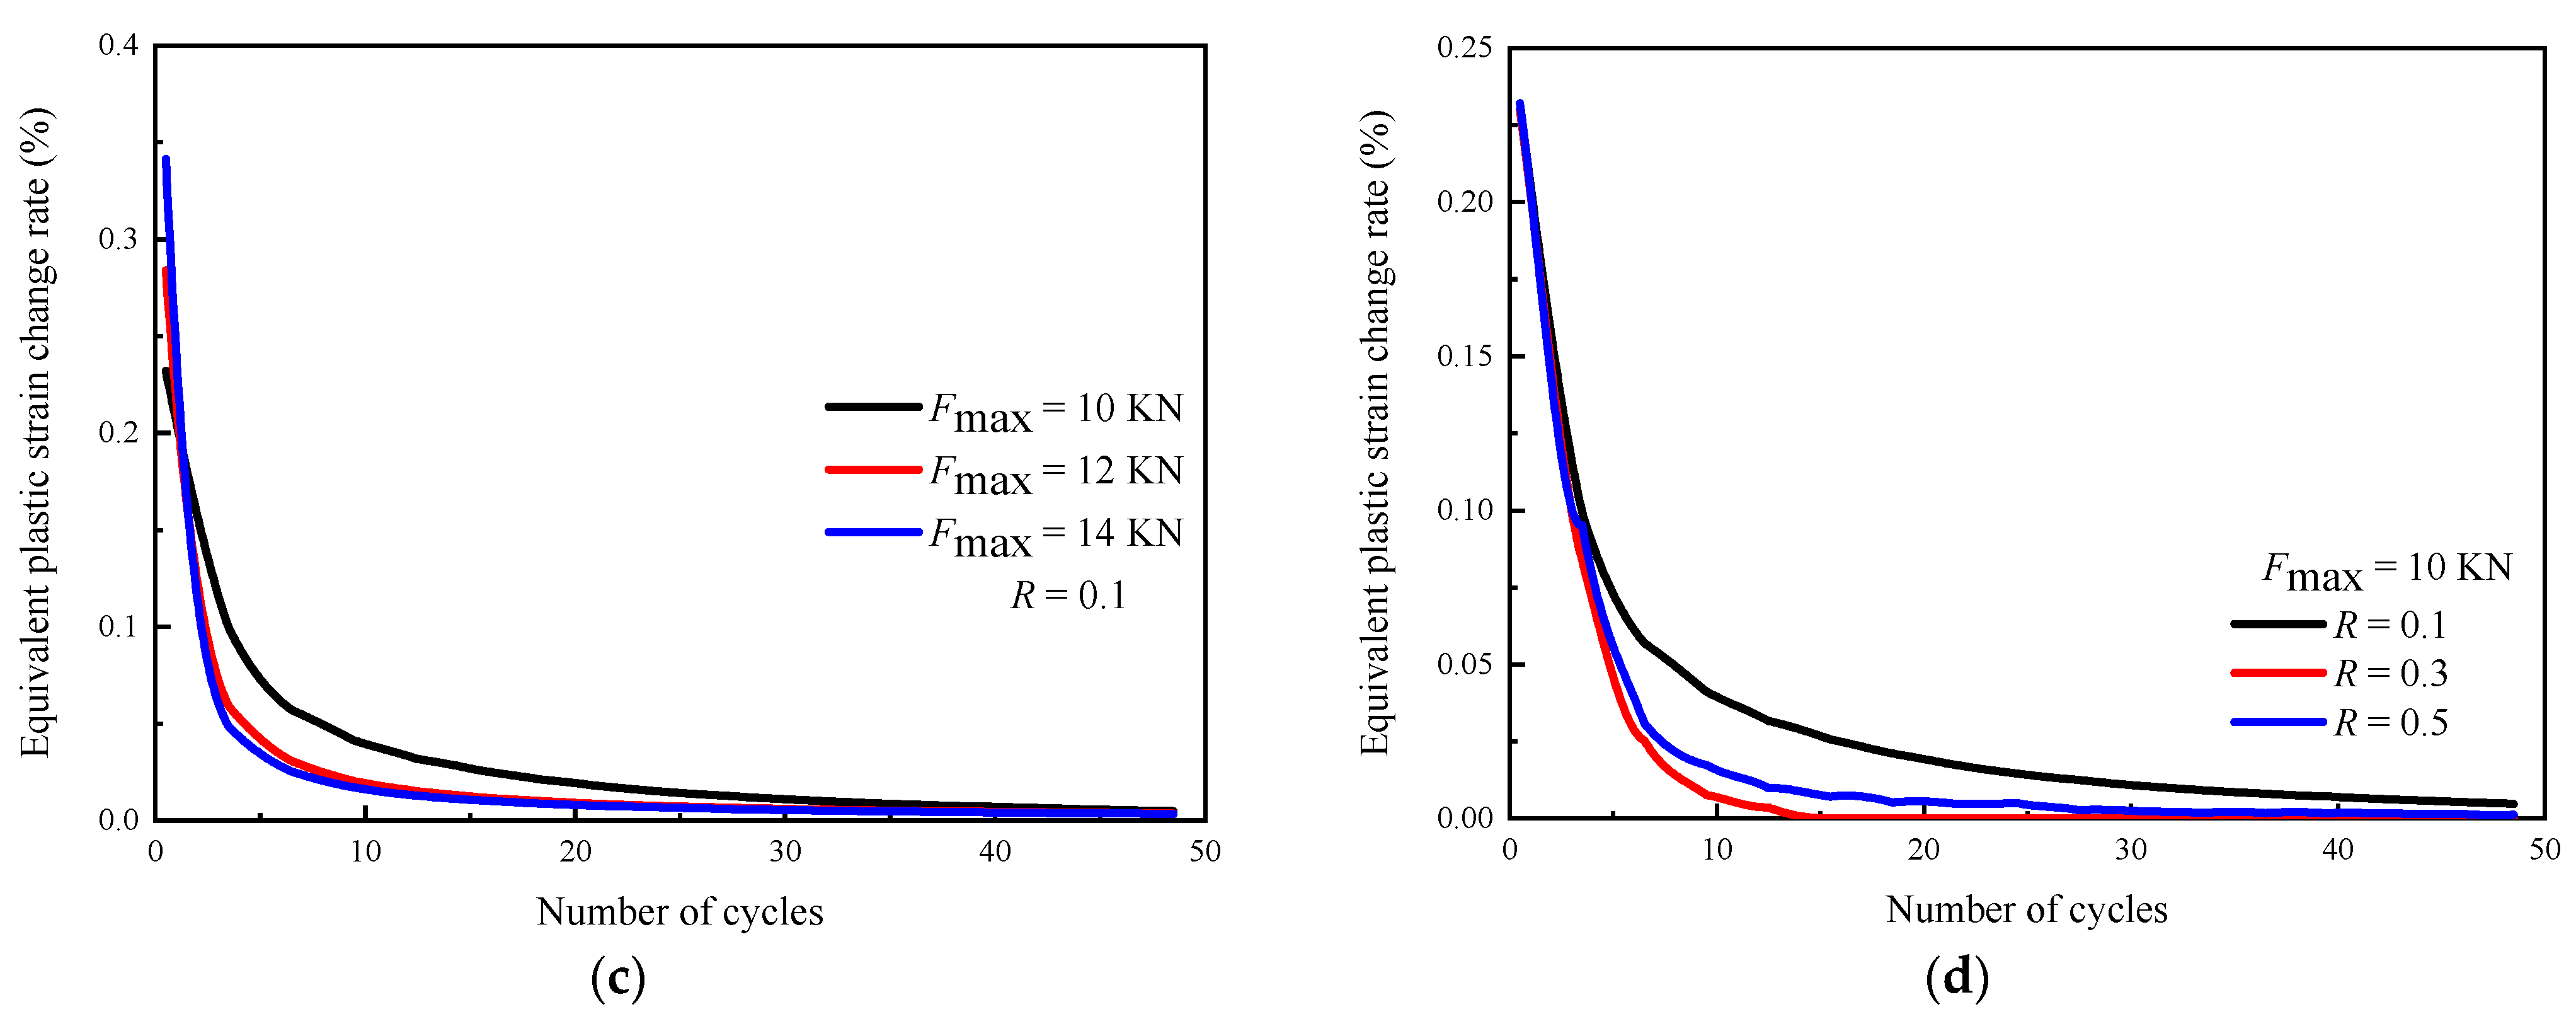
3.2. The Influence of Loading Parameters on Cyclic Plastic Deformation

The influence of the loading parameters on the crack growth behavior can be studied from the cyclic deformation [23]. In this section, the hysteresis curve is used to describe the cyclic deformation behavior and to explore the influence of the loading parameters on plastic deformation.
For a composite structure, the cyclic deformation behavior is affected by the properties mismatch of the component materials. Therefore, a single homogeneous material was studied first. Figure 8 shows the influence of the loading parameters on the cyclic deformation behavior. The size of the homogeneous material specimen studied here is the same as that of the composite plate specimen. Material TA2 is taken, and the crack length is 3.5 mm; meanwhile, the response curves of stress S22 and strain E22 under 50 cycles are taken 5 μm away from the crack tip.
The non-zero mean stress exists in the material under asymmetrical load, which leads to plastic strain accumulation and ratcheting deformation. Figure 8a shows that the tensile strain after the first cycle of loading increases significantly with Fm, whereas the strain accumulation under the subsequent loading cycle is also affected by Fm. Therefore, Fm mainly affects the tensile strain after the first loading cycle. In Figure 8b, when Fm is constant, the stress range and the compression stress increase with Fa, and the accumulation degree of plastic strain increases significantly in the subsequent periods. Figure 8c shows that when R is constant and Fmax is increased, Fm and Fa also increase, thereby increasing the stress amplitude and the accumulated tensile strain. Additionally, with an increase in Fmax, the compressive stress also increases. When Fmax is the same and R is different, Fm increases and Fa decreases with an increase in R. It can be seen from Figure 8d that the increase in R leads to a significant decrease in the stress amplitude and compression stress and a significant decrease in the strain accumulation. Compared with the decrease in the cumulative plastic strain caused by Fa, the effect of Fm on the hysteresis curve is not significant. Therefore, da/dN is greatly reduced.
Therefore, the influence of loading parameters on the cyclic stress–strain behavior of a single homogeneous material can be summarized as follows: (1) Fm will significantly increase the tensile strain and reduce the compressive stress after the first loading cycle, and increase the plastic stress accumulation during the subsequent loading cycles; (2) Fa will increase the stress amplitude and the compressive stress, and significantly increase the following cumulative degree of cyclic plastic strain; (3) Fmax will increase the level of stress amplitude and the plastic strain accumulation, and its contribution to the crack growth has the characteristics of Fm and Fa; (4) R will lead to a decrease in Fa and an increase in Fm. Compared to the increase in Fm, the decrease in cumulative plastic strain caused by the decrease in Fa has a stronger effect on crack growth. In order to consider the effect of property mismatch, this paper also studied the cyclic deformation behavior of composite materials. Here, the Type-A specimen was considered, and the crack length was 3.5 mm. The response curves of stress S22 and strain E22 in 50 cycles at 5 μm from the crack tip are shown in Figure 9.
By comparing the cyclic deformation results of a single homogeneous material and the composite material, the following conclusions can be drawn. (1) Due to the elastic mismatch, the actual stress level of the Type-A specimen is lower than that of a single homogeneous material under the corresponding load when the crack does not pass the TA2/Q345R interface, so the stress amplitude decreases. (2) Under the same load level, the strain accumulation and the plastic deformation level are greatly reduced. When a crack propagates from the ‘soft’ component to the ‘hard’ component, a property mismatch will lead to a significant reduction in the plastic strain accumulation and damage level, thus further reducing da/dN. (3) The influence of the loading parameters on the cyclic deformation behavior of the composite material is similar to that of a single homogeneous material, but the degree of influence is affected by the property mismatch.
Based on the above conclusion, the following reasonable assumptions were made: by adding a composite coating to a single substrate, the crack propagation problem in a single material becomes the crack propagation problem in the composite material. In addition, by cleverly utilizing the differences in material properties, the driving force for the crack propagation can be effectively reduced, and the accumulation of plastic damage at the crack tip can be reduced to achieve the purpose of protecting the base material.

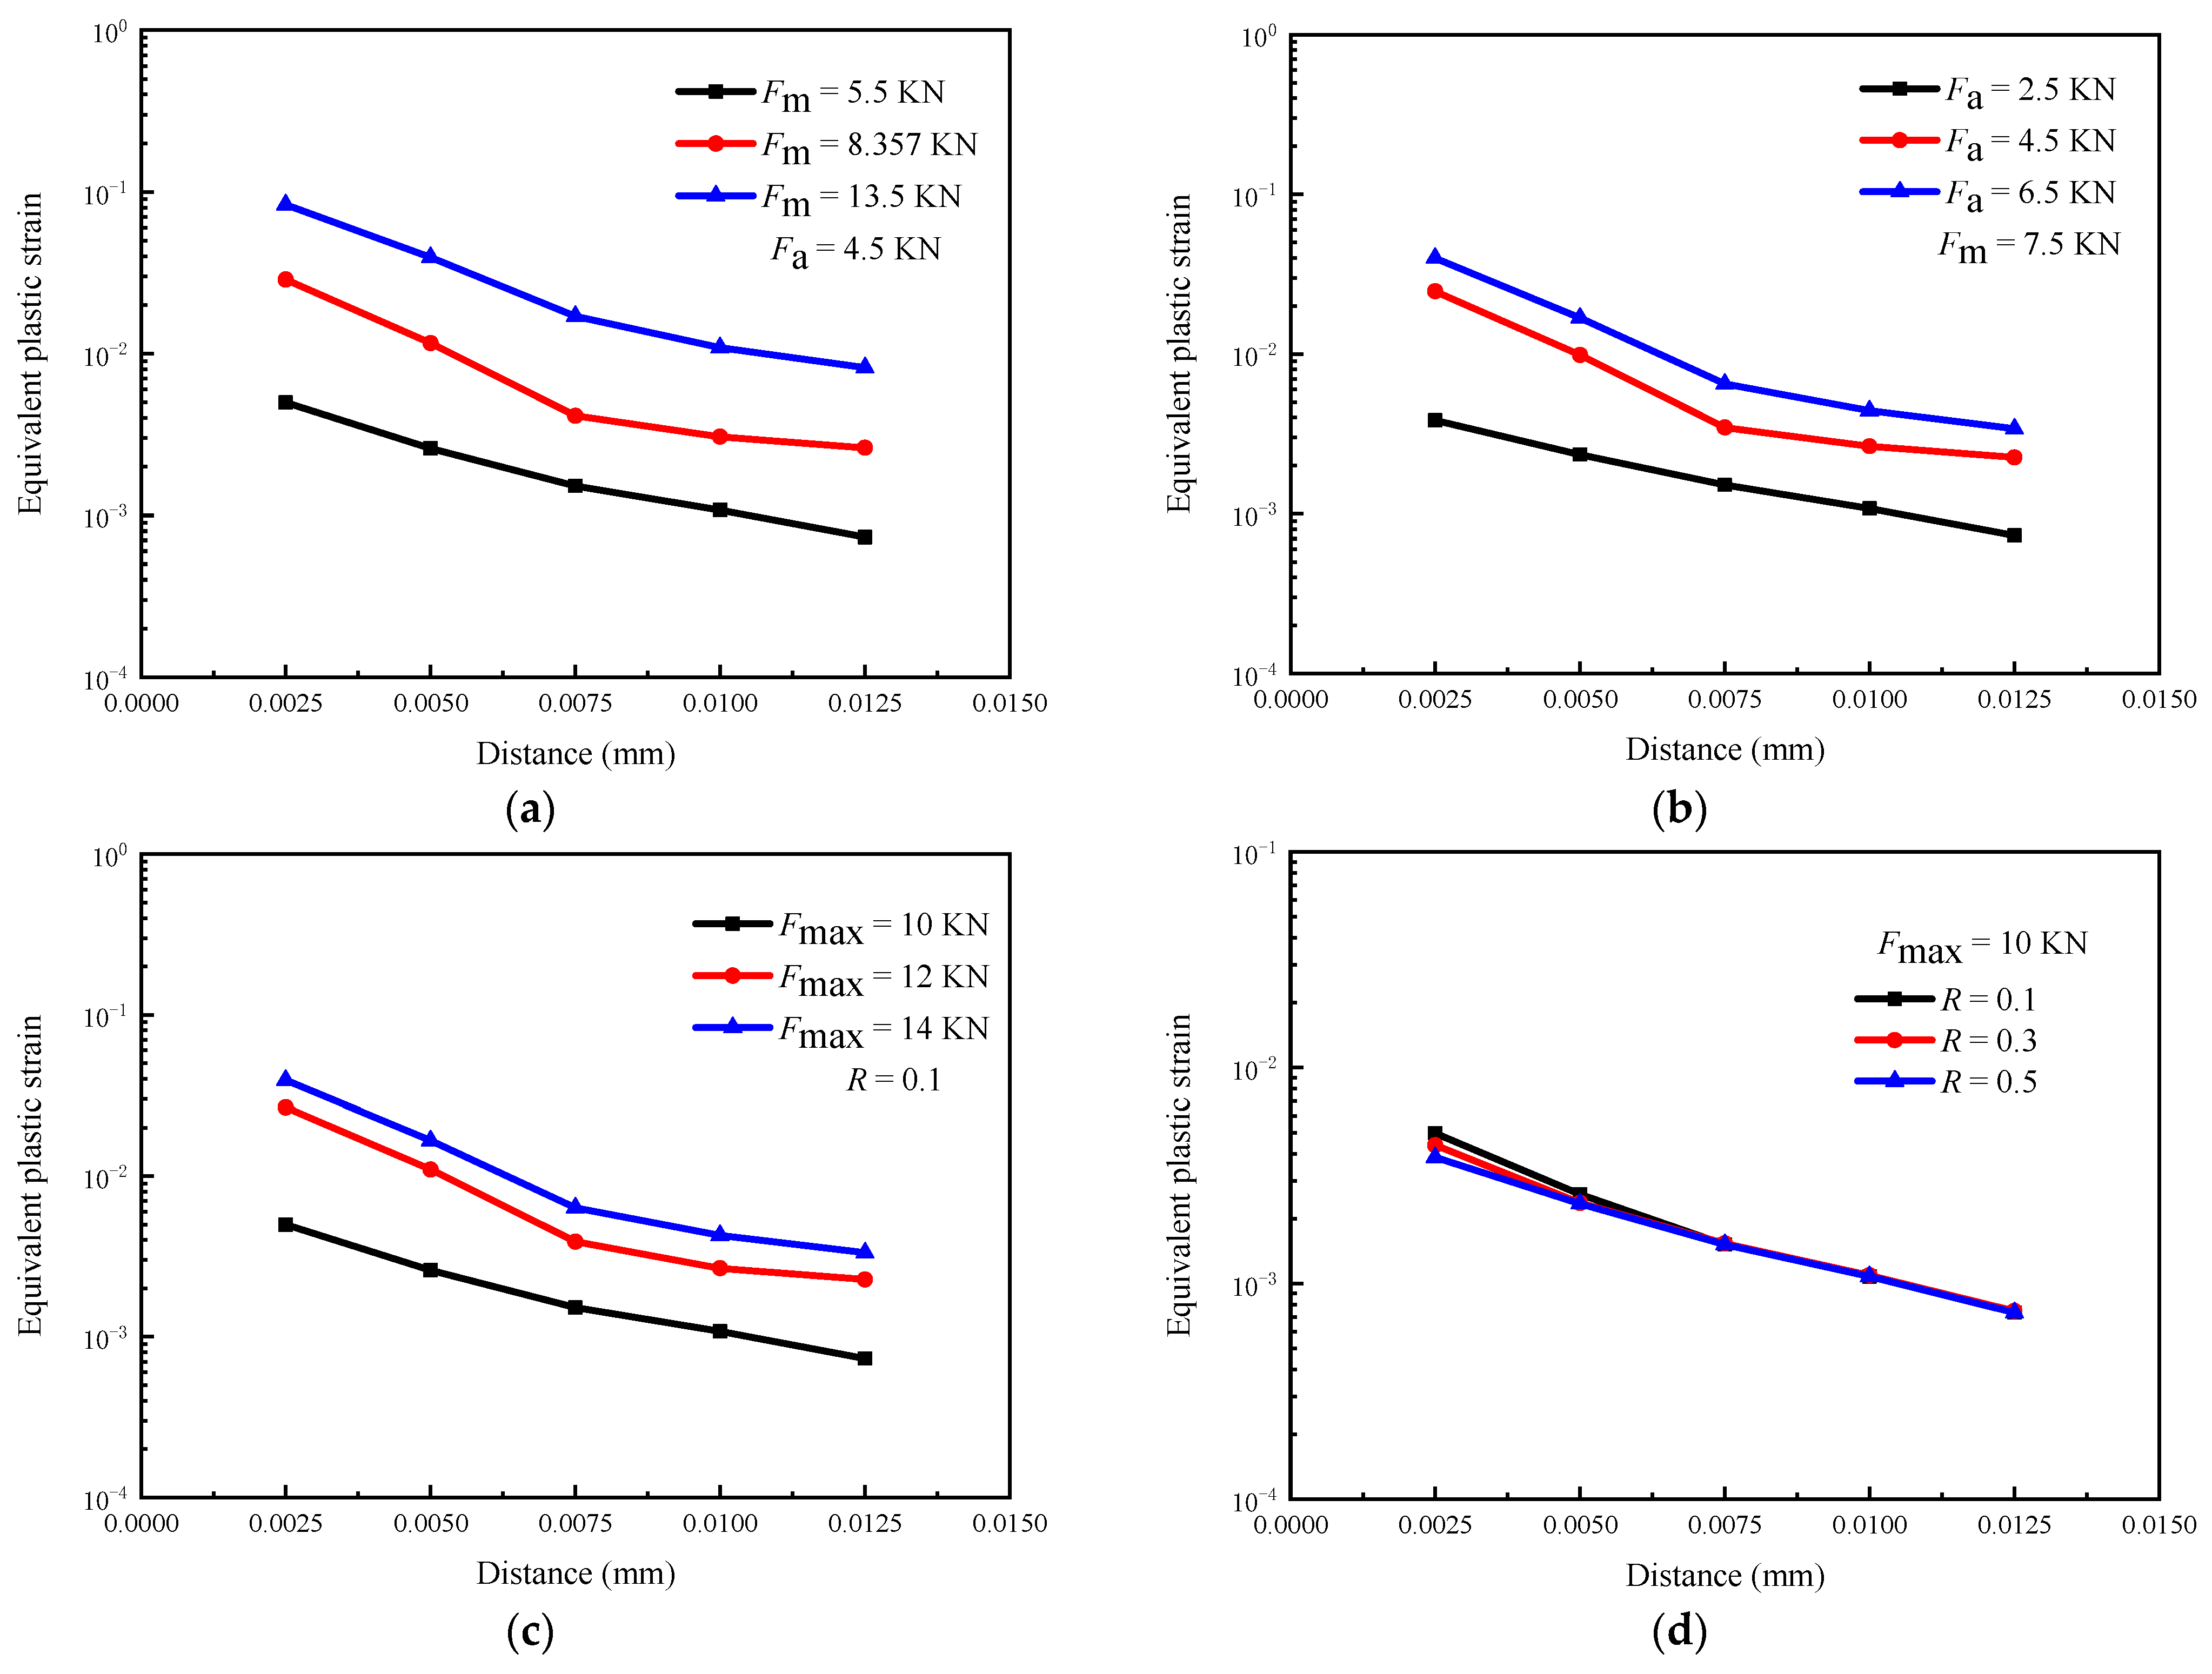
3.3. The Effect of Loading Parameters on Equivalent Plastic Strain

Figure 10 shows the equivalent plastic strain of the first 50 cycles at 5 μm from the crack tip. It can be seen that the equivalent plastic strain keeps accumulating with the cycle number, and the accumulation speed shows a trend of changing from fast to slow under different loading parameters, but there are significant differences. Considering the changing trend of the hysteresis loop under different loading parameters, the influence of Fm and Fa on the equivalent plastic strain is analyzed. Figure 10a shows that the equivalent plastic strain increases rapidly in the first loading cycle with Fm, especially when Fm is 13.5 kN, which is consistent with the change rule of E22 (Figure 8a). The last 20 loading cycles show that the effect of Fm on the equivalent plastic strain under subsequent loading cycles is limited, and the accumulation rate of the equivalent plastic strain under different Fm values is close. Figure 10b shows that an increase in Fa causes the accumulation of plastic strain under each loading cycle, and the accumulation speed of the plastic strain increases with the loading cycle. This is different from Fm, which mainly affects the tensile plastic strain under the first cycle.
In Figure 10c, Fmax has the same effect on the equivalent plastic strain during the whole loading process, and its effect on the plastic strain accumulation in the subsequent loading cycle is significantly lower than that of Fa. The increase in Fmax increases Fm and Fa, so its influence on the plastic strain should have the characteristics of Fm and Fa. Accordingly, it can be seen from Figure 10d that an increase in R greatly reduces plastic strain accumulation. Although Fm increases, the decrease in Fa results in a decrease in the plastic strain accumulation at each loading cycle. In addition, the results of R = 0.3 and R = 0.5 are similar, which shows that the influence of Fa and Fm on plastic deformation is interactive.
By comparing the change rate of the equivalent plastic strain, the influence of the loading parameters on the cumulative rate of plastic deformation is more obvious, as shown in Figure 11. It can be seen from Figure 11a that Fm greatly improves the plastic strain accumulation rate under the first loading cycle. As the loading proceeds, the plastic strain accumulation rate decreases with Fm, and the influence of Fm is smaller. Figure 11b shows that the plastic strain accumulation of the first loading cycle is slightly increased by Fa. With the increase in loading cycles, the plastic strain accumulation rate decreases with Fa, and the plastic strain accumulation rate under different Fa values is similar. As shown in Figure 11c, the plastic strain accumulation rate under the first loading cycle increases with Fmax and then decreases with the loading cycles. In addition, the higher the Fmax, the lower the plastic strain accumulation rate under the subsequent loading cycle. When Fm, Fa, and Fmax increase, the plastic deformation change after the first loading is the largest, and the subsequent plastic deformation ability of the material decreases, so the plastic strain accumulation rate is reduced under the subsequent loading cycle. Figure 11d shows the effect of R on the change rate of the equivalent plastic strain 5 μm from the crack tip. It can be seen from Figure 11a,b that the increase in Fm and Fa reduces the plastic strain change rate under the subsequent loading cycle. When R increases, Fm also increases while Fa decreases. Therefore, the influences of Fm and Fa on the plastic strain change rate under the subsequent loading cycle interact with each other. In this case, Fm and Fa change within the same range. The results show that when R increases, the influence of Fm and Fa on the plastic strain rate of change under the first loading cycle is mutually offset, so the plastic strain rate change is constant. In the subsequent loading cycle, the results of R = 0.5 and R = 0.3 are lower than R = 0.1, which shows that the decrease in the plastic strain rate due to the increase in Fm is greater than the increase in the plastic strain rate due to the decrease in Fa.
The plastic strain accumulation in the first loading cycle is determined by Fmax. When Fmax is fixed, the plastic strain accumulation in the first loading cycle is fixed. Then, in the subsequent cyclic loading, the increase in Fa and Fm increases the accumulation degree of the plastic strain. However, due to the premature consumption of the plastic deformation ability, the accumulation rate of the plastic strain decreases under the subsequent loading cycle.
Figure 12 shows the effect of the loading parameters on the equivalent plastic strain distribution near the crack tip after the first loading cycle. Figure 12a–c show that the plastic deformation level increases with Fm, Fa, and Fmax, and decreases with the distance from the crack tip. In addition, the influence of these loading parameters on plastic deformation is not significantly related to the distance from the crack tip. Figure 12d shows that the plastic deformation level of the crack tip decreases with R, and the effect decreases with the increasing distance from the crack tip.

4. Conclusions

In this study, the Chaboche model is first used to study cyclic plastic evolution during crack propagation in composite materials. Based on the experimental results, the influence of the loading parameters on the crack propagation behavior of a Zr/Ti/steel composite plate is studied in detail, and the effect of property mismatch is investigated. The specific conclusions are as follows:
(1) An increase in Fmax, Fm, and Fa can promote da/dN, whereas an increase in R can reduce da/dN.
(2) An increase in Fm is mainly due to the tensile strain and compressive stress after the first cycle. Fa increases the stress range and compression stress and greatly improves the plastic strain accumulation degree of the subsequent loading cycles. Additionally, the Fmax can significantly increase the stress amplitude and the plastic strain accumulation level. When R increases, the plastic strain accumulation increases a little, but the stress amplitude and the compression stress decrease greatly.
(3) The influence of the loading parameters on the cyclic deformation behavior of the composite material is similar to that of a single homogeneous material. In addition, the elastic–plastic mismatch also affects the plastic evolution, that is, strengthening or weakening the effect of the loading parameters.
It can be confirmed that the influence of loading parameters on the crack tip damage is influenced by the degree of difference between material properties, while this paper only studied the Type-A cracks (cracks from ‘soft’ materials to ‘hard’ materials), with a single property difference. Further research on the combination of different material property differences urgently needs to be carried out. We firmly believe that by cleverly utilizing the differences in material properties, the driving force for the crack propagation can be effectively reduced, and the accumulation of plastic damage at the crack tip can be reduced to achieve the purpose of protecting the base material.

Author Contributions

Conceptualization, B.Z. (Binbin Zhou) and J.Y.; methodology, B.Z. (Binbin Zhou) and J.Y.; software, B.Z. (Binbin Zhou); validation, C.Y. and B.Z. (Bojun Zhang); formal analysis, J.Y.; investigation, B.Z. (Binbin Zhou) and J.Y.; resources, C.Y. and B.Z. (Bojun Zhang); data curation, B.Z. (Binbin Zhou); writing—original draft preparation, B.Z. (Binbin Zhou) and J.Y.; writing—review and editing, B.Z. (Binbin Zhou), H.S., L.Z., L.C. and C.Z.; visualization, C.Y. and B.Z. (Bojun Zhang); supervision, B.Z. (Binbin Zhou); project administration, B.Z. (Binbin Zhou); funding acquisition, B.Z. (Binbin Zhou), H.S., L.Z., L.C. and C.Z. All authors have read and agreed to the published version of the manuscript.

Funding

This research was funded by the National Natural Science Foundation of China, grant numbers 51975271, 51675260, and 51905260; the Natural Science Foundation of the Jiangsu Higher Education Institutions of China, grant number 22KJB410003; the excellent scientific and technological innovation team of provincial universities in 2021 (intelligent equipment and precision manufacturing technology), grant number 21CXTD-01; the Open Research Fund of State Key Laboratory of Organic Electronics and Information Displays, no grant number; the Starting Research Fund of Nanjing Vocational University of Industry Technology, grant number YK20-14-05.

Institutional Review Board Statement

Not applicable.

Informed Consent Statement

Not applicable.

Data Availability Statement

Not applicable.

Conflicts of Interest

The authors declare that they have no conflict of interest. The authors declare that they do not have any commercial or associative interest that represents a conflict of interest in connection with the work submitted.

References

  1. Ning, J.; Zhang, L.J.; Xie, M.X.; Yang, H.X.; Yin, X.Q.; Zhang, J.X. Microstructure and property inhomogeneity investigations of bonded Zr/Ti/steel trimetallic sheet fabricated by explosive welding. J. Alloys Compd. 2017, 698, 835–851. [Google Scholar] [CrossRef]
  2. Karolczuk, A.; Kowalski, M.; Banski, R.; Żok, F. Fatigue phenomena in explosively welded steel-titanium clad components subjected to push-pull loading. Int. J. Fatigue 2013, 48, 101–108. [Google Scholar] [CrossRef]
  3. Chu, Q.; Zhang, M.; Li, J.; Yan, C. Experimental and numerical investigation of microstructure and mechanical behavior of titanium/steel interfaces prepared by explosive welding. Mater. Sci. Eng. A 2017, 689, 323–331. [Google Scholar] [CrossRef]
  4. Tsybanev, G.V.; Gopkalo, A.P.; Kurash, Y.P.; Novikov, A.I. Study of Fatigue Crack Growth Rate in Steels in Relation to Crack-Tip Plastic Deformation and Fracture. Part 1. Test Methods and Results for 10GN2MFA Steel. Int. J. Fract. 2020, 52, 228–234. [Google Scholar] [CrossRef]
  5. Fouda, S.M.; Ellakany, P.; Gad, M.M. Fracture Strength of Composite Rest Seats: An In Vitro Comparative Study of Different Composite versus Amalgam Restorations. Materials 2023, 16, 4830. [Google Scholar] [CrossRef]
  6. Pippan, R.; Riemelmoser, F.O. Fatigue of bimaterials. Investigation of the plastic mismatch in case of cracks normal to the interface. Comput. Mater. Sci. 1998, 13, 108–116. [Google Scholar] [CrossRef]
  7. Fu, W.G.; Ma, J.C.; Liao, Z. New Numerical Method Based on Linear Damage Evolution Law for Predicting Mechanical Properties of TiB2/6061Al. Materials 2023, 16, 4786. [Google Scholar] [CrossRef] [PubMed]
  8. Cirello, A.; Zuccarello, B. On the effects of a crack propagating toward the interface of a bimaterial system. Eng. Fract. Mech. 2006, 73, 1264–1277. [Google Scholar] [CrossRef]
  9. Zhang, X.C.; Li, X.F.; Lee, K.Y. Analysis of a mode-I crack normal to an imperfect interface. Int. J. Solids Struct. 2009, 46, 1456–1463. [Google Scholar] [CrossRef] [Green Version]
  10. Sistaninia, M.; Kolednik, O. Effect of a single soft interlayer on the crack driving force. Eng. Fract. Mech. 2014, 130, 21–41. [Google Scholar] [CrossRef]
  11. Sheafi, E.M.; Tanner, K.E. Relationship between fatigue parameters and fatigue crack growth in PMMA bone cement. Int. J. Fatigue 2019, 120, 319–328. [Google Scholar] [CrossRef]
  12. Chang, L.; Miao, Z.H.; Zhou, B.B.; Zhou, C.; He, X. Understanding the anisotropic tensile deformation behavior of commercially pure titanium by experiments and crystal plasticity simulations. Mater. Lett. 2023, 339, 134095. [Google Scholar] [CrossRef]
  13. Corigliano, P.; Crupi, V.; Guglielmino, E. Non linear finite element simulation of explosive welded joints of dissimilar metals for shipbuilding applications. Ocean Eng. 2018, 160, 346–353. [Google Scholar] [CrossRef]
  14. Zhang, P.; Xie, L.Q.; Zhou, C.Y.; Li, J.; He, X.H. Two new models of fatigue crack growth rate based on driving force parameter and crack closure method at negative load ratios. Theor. Appl. Fract. Mech. 2019, 103, 102315. [Google Scholar] [CrossRef]
  15. Chandran, R.K.S. A new approach to the mechanics of fatigue crack growth in metals: Correlation of mean stress (stress ratio) effects using the change in net-section strain energy. Acta Mater. 2017, 135, 201–214. [Google Scholar] [CrossRef]
  16. Zhang, J.; Wang, X.; Paddea, S.; Zhang, X. Fatigue crack propagation behaviour in wire+arc additive manufactured Til: Effects of microstructure and residual stress. Mater. Des. 2016, 90, 551–561. [Google Scholar] [CrossRef]
  17. Mayer, H.; Schuller, R.; Karr, U. Mean stress sensitivity and crack initiation mechanisms of spring steel for torsional and axial VHCF loading. Int. J. Fatigue 2016, 93, 309–317. [Google Scholar] [CrossRef]
  18. Li, J.; Su, C.Y.; Lu, L.; Zhang, P.; Chang, L.; Miao, X.T.; Zhou, B.B.; He, X.H.; Zhou, C.Y. Investigation on fatigue crack growth behavior for commercial pure titanium at different crack tip plastic deformed levels. Theor. Appl. Fract. Mech. 2018, 100, 1–13. [Google Scholar] [CrossRef]
  19. ASTM E 647-15; ASTM Standard Test Method for Measurement of Fatigue Crack Growth Rates: Designation. ASTM: West Conshohocken, PA, USA, 2015.
  20. Zhou, B.B.; Zhou, C.Y.; Yu, X.C.; Chang, L.; Li, J.; Miao, X.; Ye, C.; Zhang, B. Investigation on the fatigue crack behavior of Zr702/TA2/Q345R composite plate with a crack normal to interface. Fatigue Fract. Eng. Mater. Struct. 2020, 43, 20–35. [Google Scholar] [CrossRef]
  21. Chang, L.; Zhou, B.B.; Ma, T.H.; Li, J.; He, X.H.; Zhou, C.Y. Comparisons of low cycle fatigue behavior of CP-Ti under stress and strain-controlled modes in transverse direction. Mater. Sci. Eng. A 2019, 746, 27–40. [Google Scholar] [CrossRef]
  22. Basan, R.; Franulovic, M.; Prebil, I.; Kunc, R. Study on Ramberg-Osgood and Chaboche models for 42CrMo4 steel and some approximations. J Constr. Steel Res. 2017, 136, 65–74. [Google Scholar] [CrossRef]
  23. Paul, S.K. Numerical models to determine the effect of soft and hard inclusions on different plastic zones of a fatigue crack in a C(T) specimen. Eng. Fract. Mech. 2016, 159, 90–97. [Google Scholar] [CrossRef]
Figure 1. (a) Schematic diagram of Type-A and Type-B specimens; (b) fatigue crack growth test.
Materials 16 05282 g001
Figure 2. Schematic diagram of the direct current potential method.
Materials 16 05282 g002
Figure 3. Finite element model of Type-A specimen.
Materials 16 05282 g003
Figure 4. The effect of Fmax and R on the da/dN (experimental results): (a,b) Type-A; (c,d) Type-B.
Materials 16 05282 g004
Figure 5. The effect of Fm and Fa on da/dN (experimental results): (a,b) Type-A; (c,d) Type-B.
Materials 16 05282 g005
Figure 6. The effect of Fmax and R on the change of plastic zone (simulation results): (a,b) Type-A; (c,d) Type-B.
Materials 16 05282 g006
Figure 7. The effect of Fm and Fa on the change of plastic zone (simulation results): (a,b) Type-A; (c,d) Type-B.
Materials 16 05282 g007
Figure 8. The effect of loading parameters on the cyclic plastic deformation (single homogeneous material, simulation results): (a) Fm; (b) Fa; (c) Fmax; (d) R.
Materials 16 05282 g008
Figure 9. The effect of loading parameters on cyclic plastic deformation (Type-A crack, simulation results): (a) Fm; (b) Fa; (c) Fmax; (d) R.
Materials 16 05282 g009
Figure 10. The effect of loading parameters on equivalent plastic strain (simulation results): (a) Fm; (b) Fa; (c) Fmax; (d) R.
Materials 16 05282 g010
Figure 11. The effect of loading parameters on equivalent plastic strain change rate (simulation results): (a) Fm; (b) Fa; (c) Fmax; (d) R.
Materials 16 05282 g011aMaterials 16 05282 g011b
Figure 12. The effect of loading parameters on equivalent plastic strain distribution near the crack tip (simulation results): (a) Fm; (b) Fa; (c) Fmax; (d) R.
Materials 16 05282 g012
Table 1. Comparison of mechanical properties of Zr702, TA2, and Q345R.
MaterialElastic Modulus
[GPa]
Poisson RatioYield Strength
[MPa]
Tensile Strength
[MPa]
Zr70290.30.33314499
TA2900.34330383
Q345R2030.3352522
Table 2. Fatigue crack growth test.
NumberFmax [kN]RFm [kN]Fa [kN]
A-1100.15.54.5
A-2120.16.65.4
A-3140.17.76.3
A-4100.36.53.5
A-5100.57.52.5
A-612.8570.38.3574.5
A-7180.513.54.5
A-8120.257.54.5
A-9141/147.56.5
B-13.60.11.981.62
B-24.840.12.6622.178
B-35.40.12.972.43
B-44.840.33.1461.694
B-54.840.53.631.21
B-64.630.33.011.62
B-76.480.54.861.62
B-85.840.24323.632.21
B-96.840.06143.633.21
Table 3. Chaboche model parameters of the component materials.
Materialσ0C1γ1C2γ2
Zr7023141759199175818
TA2330206726176524
Q345R35217522020717
Disclaimer/Publisher’s Note: The statements, opinions and data contained in all publications are solely those of the individual author(s) and contributor(s) and not of MDPI and/or the editor(s). MDPI and/or the editor(s) disclaim responsibility for any injury to people or property resulting from any ideas, methods, instructions or products referred to in the content.

