

Anisotropy in Additively Manufactured Concrete Specimens under Compressive Loading—Quantification of the Effects of Layer Height and Fiber Reinforcement

Abstract
:1. Introduction

| Source | Nozzle Dimensions | Layer Height | Layer Width | Specimen Size | Key Inferences |
|---|---|---|---|---|---|
| Liu et al. [31] | 30 mm dia. | 15 mm | 31.5 mm | 100 × 100 × 100 mm | Compressive strength (CS) highest in the D3 * direction while it was similar in the D1 * and D2 * directions. |
| Ye et al. [43] | 10 × 50 mm | 10 mm | 50 mm | 50 × 50 × 100 mm | Significant anisotropy reported in CS results and it varied with the fiber content. D3 direction had lowest CS. |
| Xiao et al. [32] | -- | 10 mm | 50 mm | 100 × 100 × 100 mm | CS highest in D2 direction and lowest in D3 direction. |
| Zahabizadeh et al. [49] | 60 × 12 mm | 10 mm | 50 mm | 50 × 50 × 100 mm | No anisotropy observed in CS results. |
| Arunothayan et al. [23] | 30 × 15 mm | 15 mm | 30 mm | 25 × 25 × 25 mm | Highest CS reported in the D1 direction for plain and fiber-reinforced mortars, followed by D2 and D3 directions. |
| Ding et al. [33] | 30 mm dia. | 15 mm | 30 mm | 70.7 × 70.7 × 70.7 mm | CS highest in D2 direction, and lowest in D3 direction. |
| Ma et al. [36] | 12 mm dia. | 5 mm | 20 mm | 50 × 50 × 50 mm | CS similar in D1 and D3 directions and lower in the D2 direction. |
| Rahul et al. [34] | 30 × 30 mm | 30 mm | 30 mm | 50 × 50 × 50 mm | No anisotropy observed in CS, but CS lower by 12–22% compared to cast specimens. |
| Wolfs et al. [29] | -- | 9.5 mm | 50 mm | 40 × 40 × 40 mm | No anisotropy observed. |
| Zhang et al. [50] | 20 mm dia. | 12–15 mm | 22–24 mm | 100 × 100 × 100 mm | Highest CS reported in D2 direction, followed by D3 and D1 directions. |
| Nematollahi et al. [45] | 25 × 15 mm | 15 mm | 25 mm | 50 × 25 × 30 mm | (i) No anisotropy in CS of plain geopolymer mortars. (ii) For fiber-reinforced geopolymer mortars, highest CS in the D2 direction followed by D1 and D3 directions. |
| Sanjayan et al. [35] | 25 × 15 mm | 15 mm | 25 mm | 50 × 25 × 30 mm | Highest and lowest CS in D1 and D3 directions, respectively. |
| Panda et al. [44] | 40 × 10 mm | 40 mm | 40 mm | 40 × 40 × 40 mm | Highest CS in D1 direction followed by D2 and D3 directions, for chopped glass fiber-reinforced samples. |
| Feng et al. [14] | 9 mm dia. | 0.0875 mm | 70.7 × 70.7 × 70.7 mm | Specimens loaded in D1 direction showed highest CS. | |
| 50 × 50 × 50 mm |
2. Experimental Program
2.1. Materials
2.2. 3D Printing of Mortars
2.3. Compression Testing
2.4. Digital Image Correlation (DIC) Analysis
3. Results and Discussions
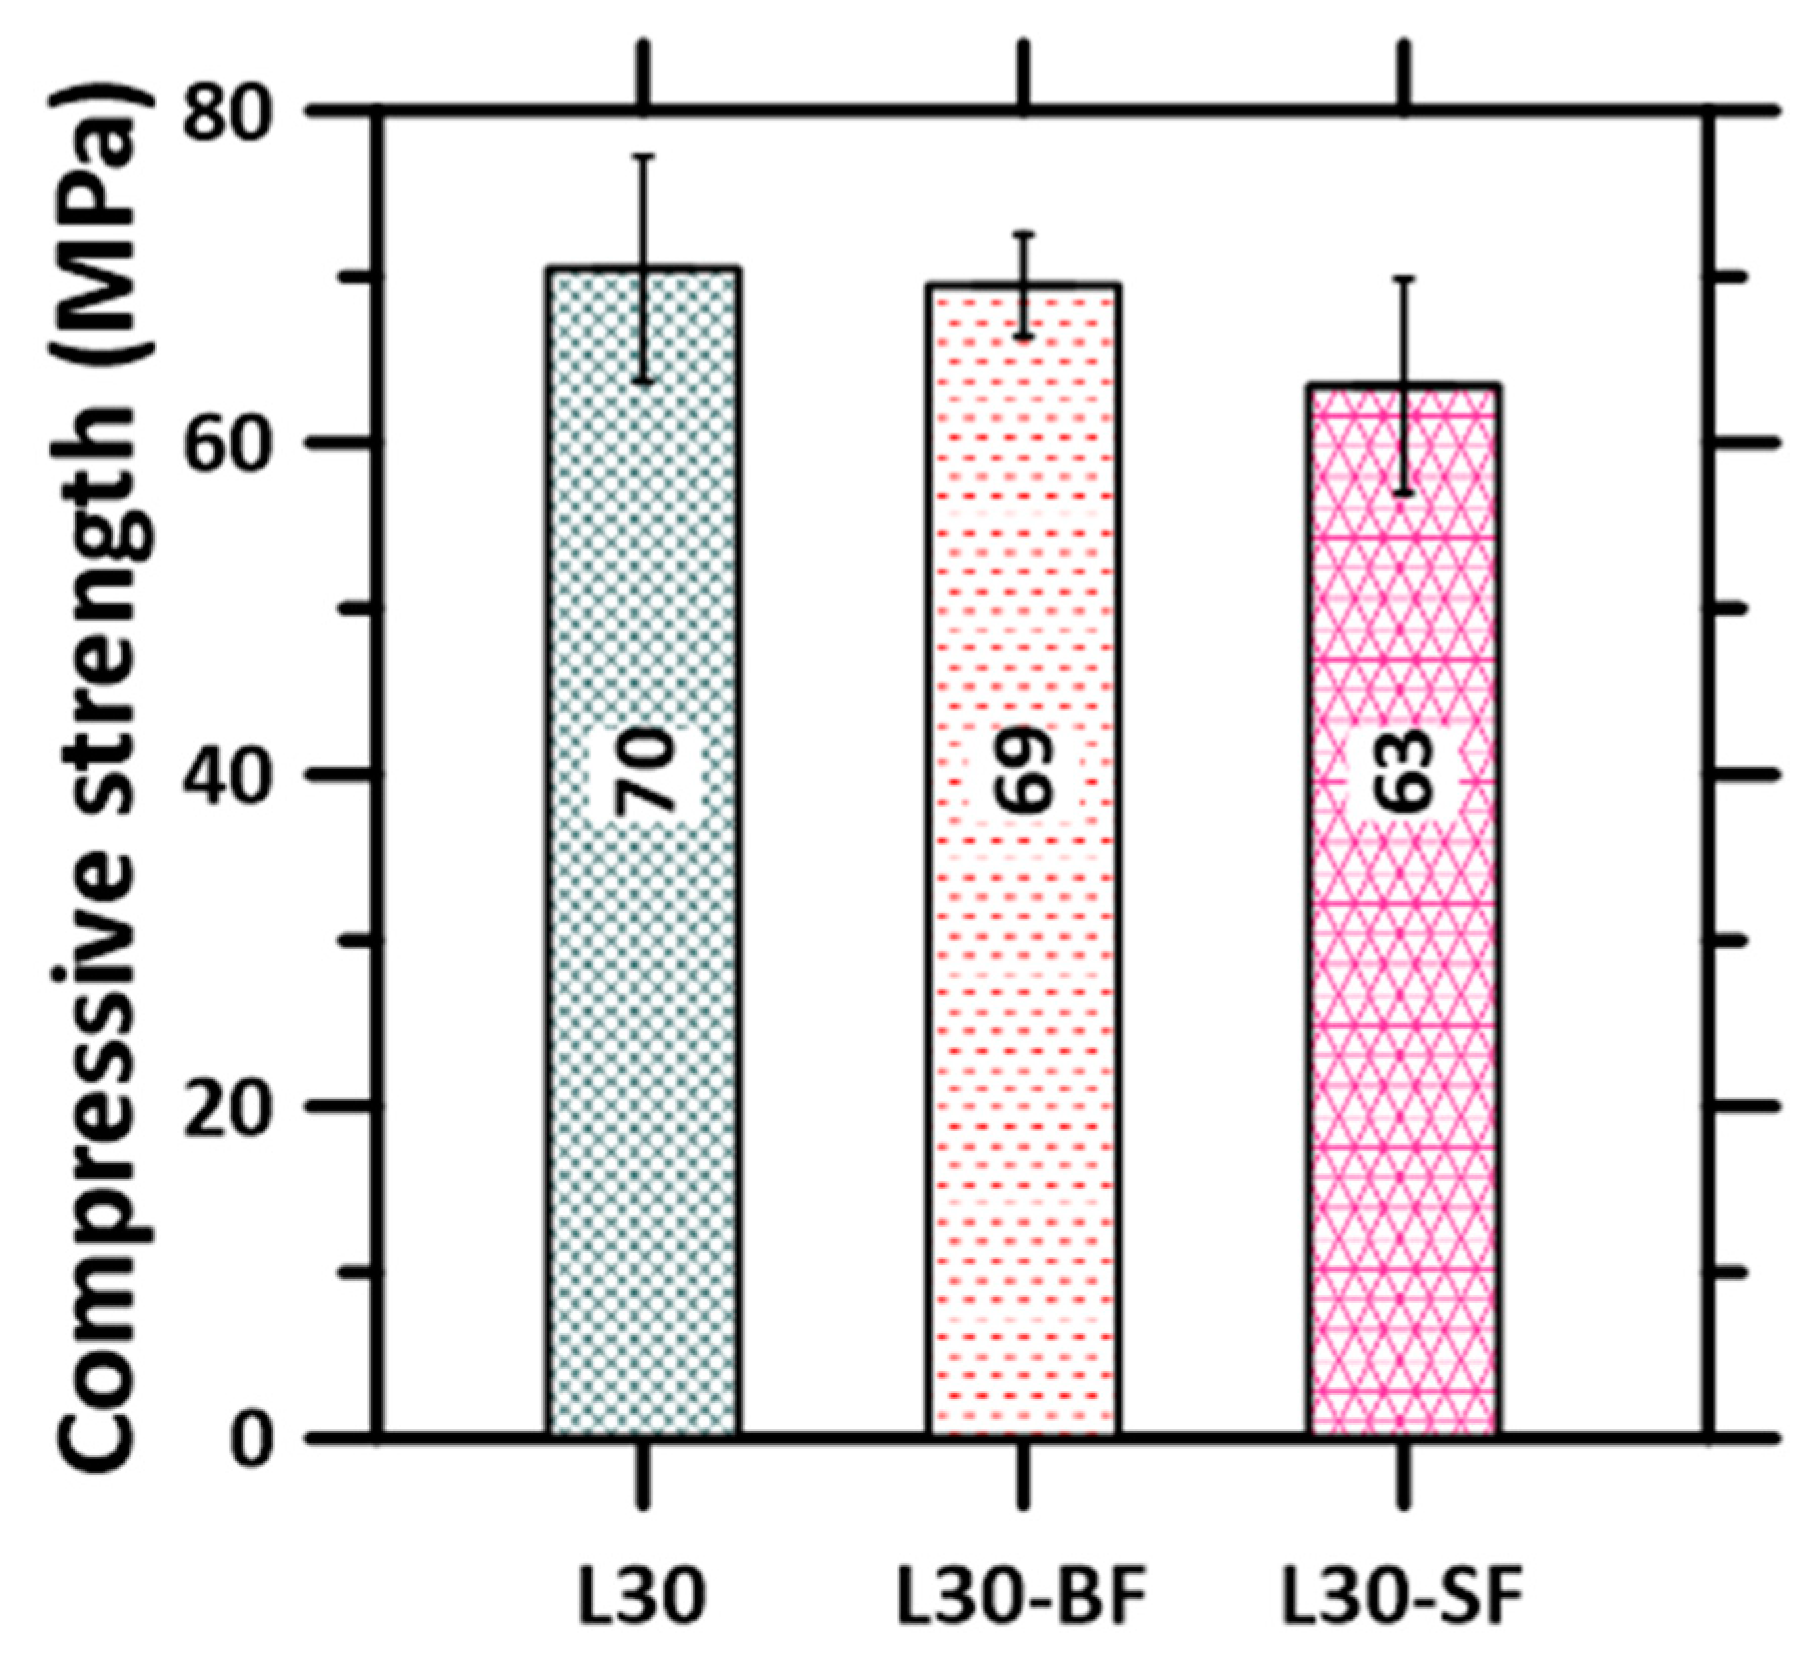
3.1. Compressive Strength of Mold-Cast Specimens
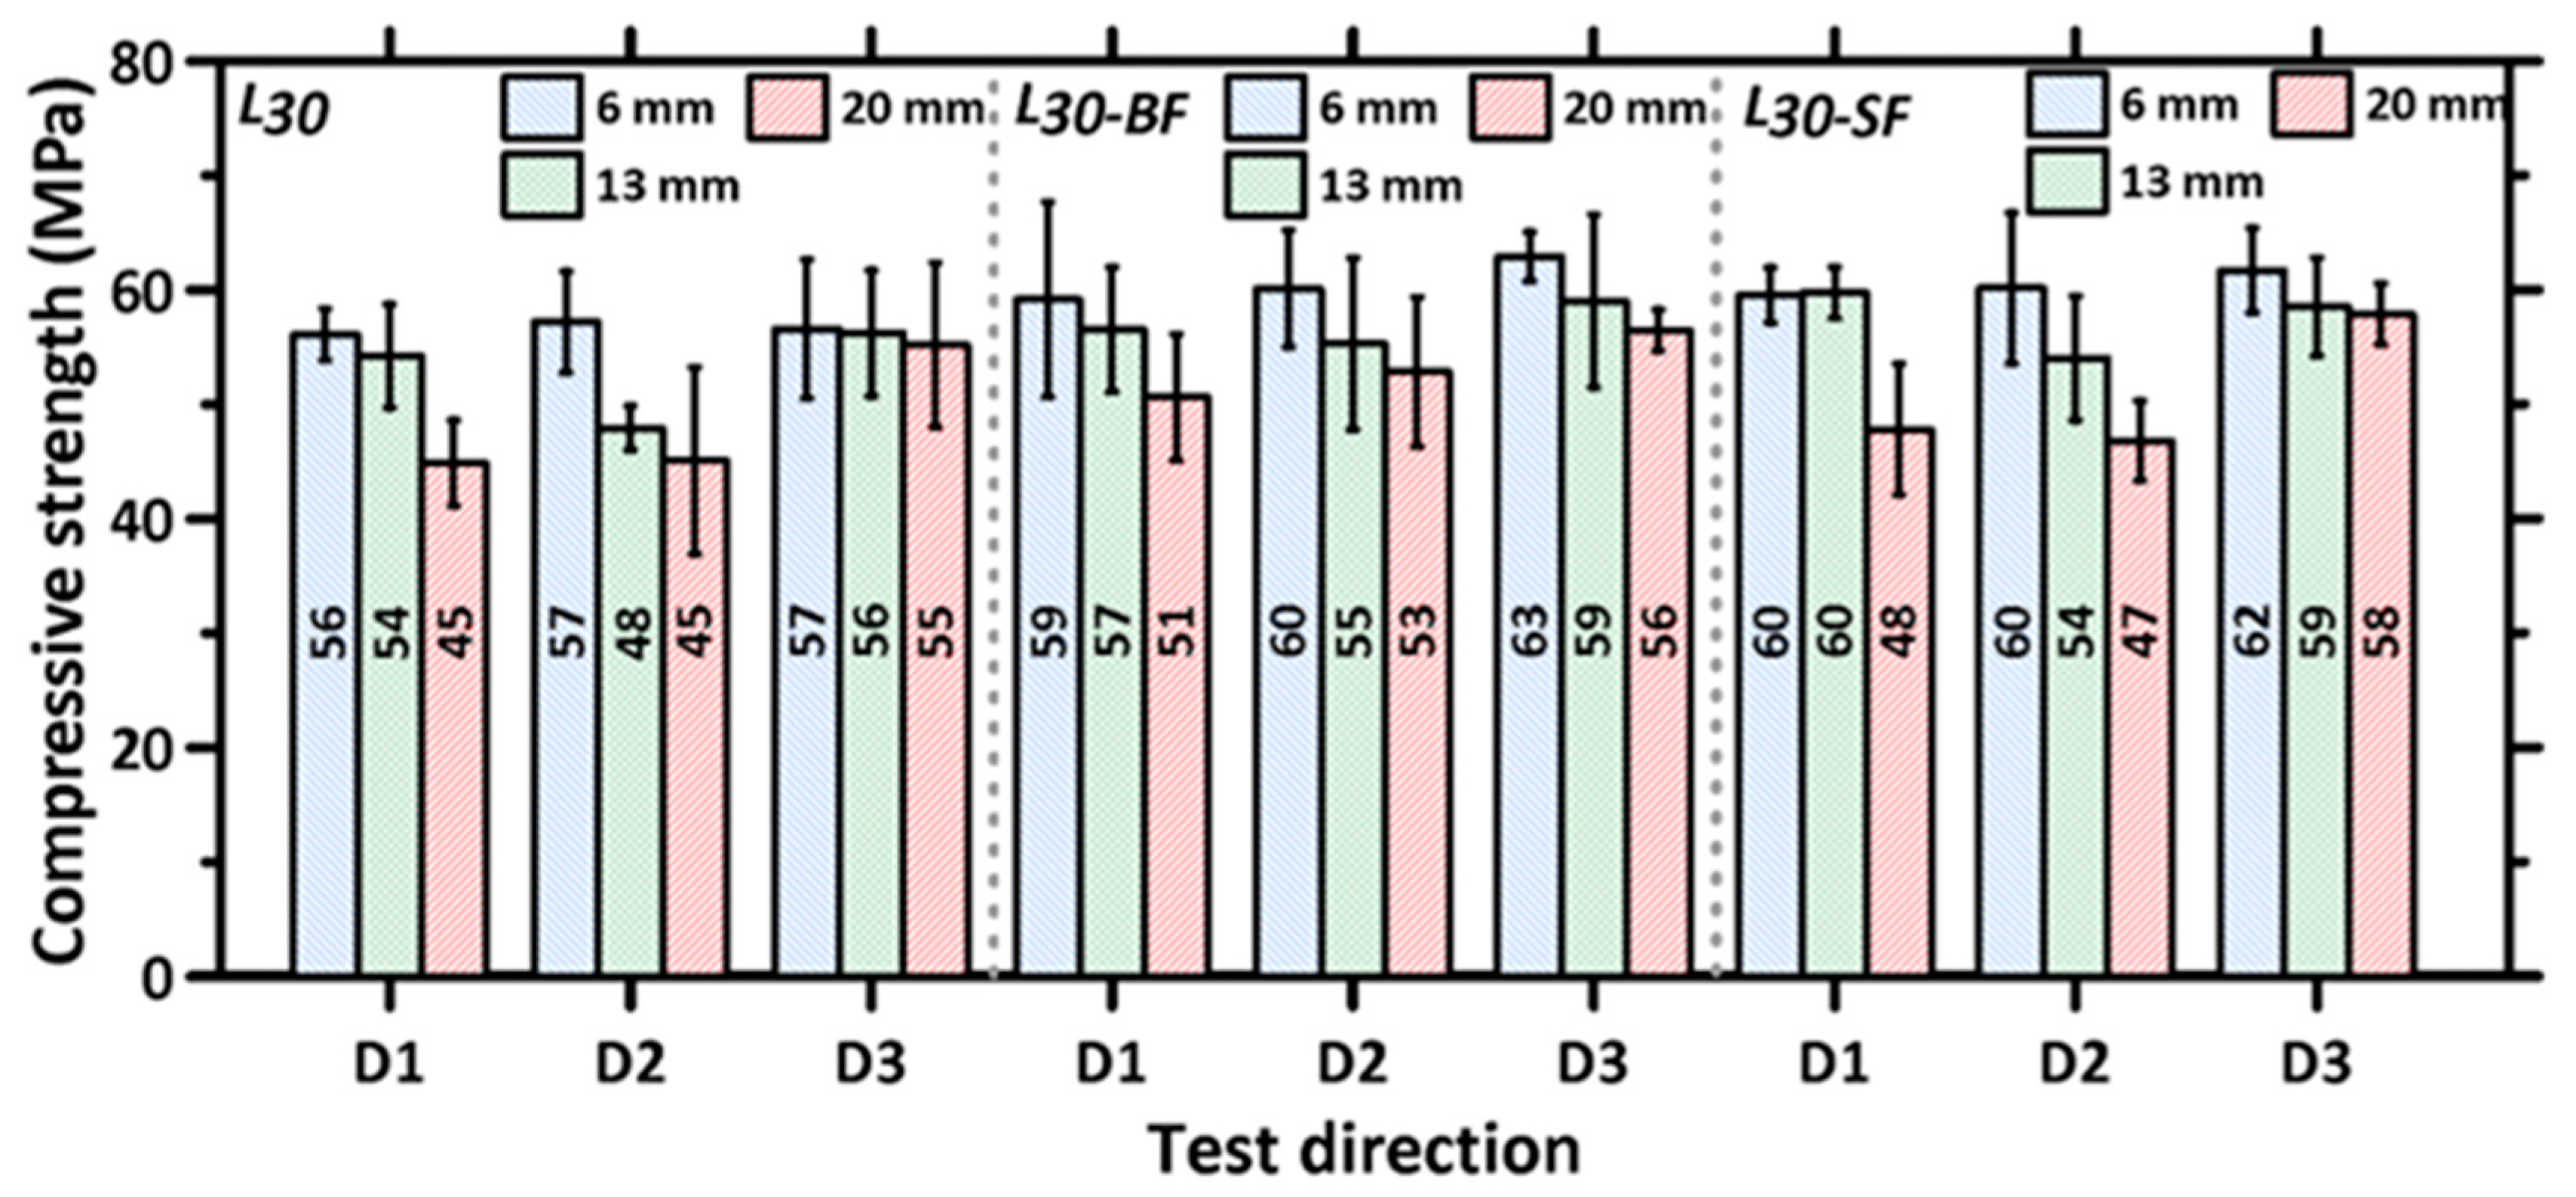
3.2. Directional and Layer Height Dependence of Compressive Strength of 3D Printed Specimens
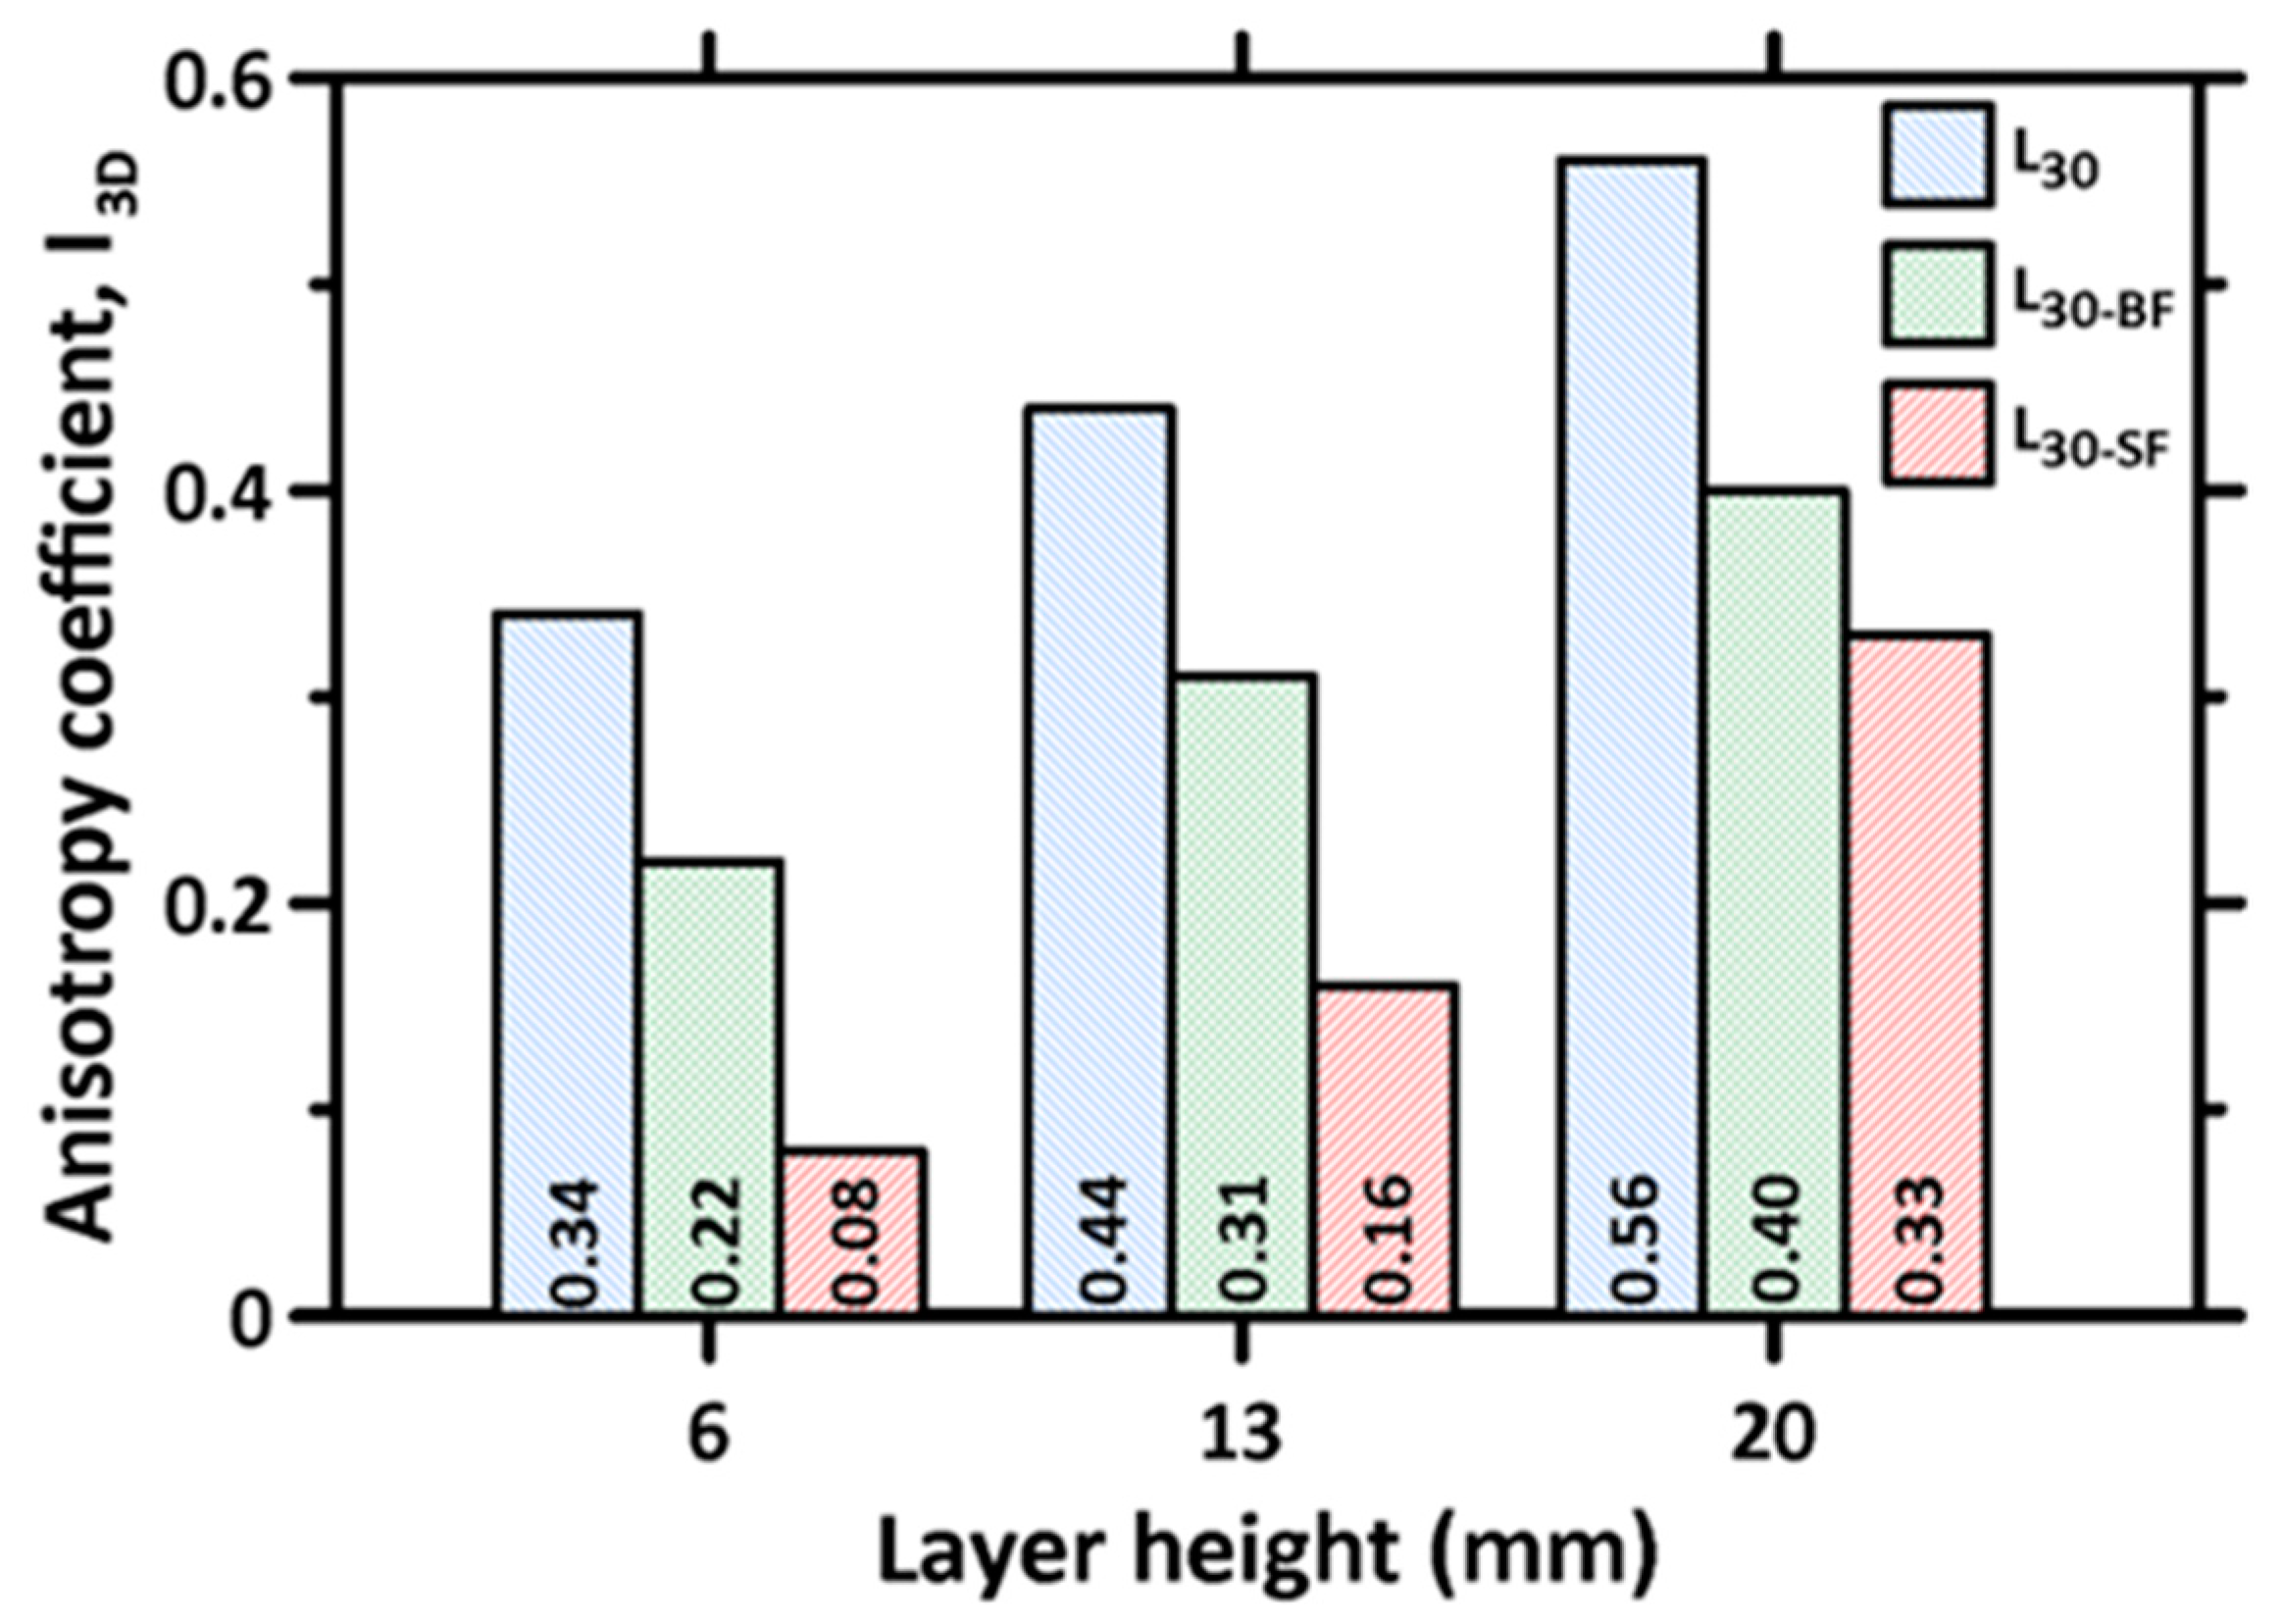
3.3. Anisotropy Quantification and Layer Size Effects
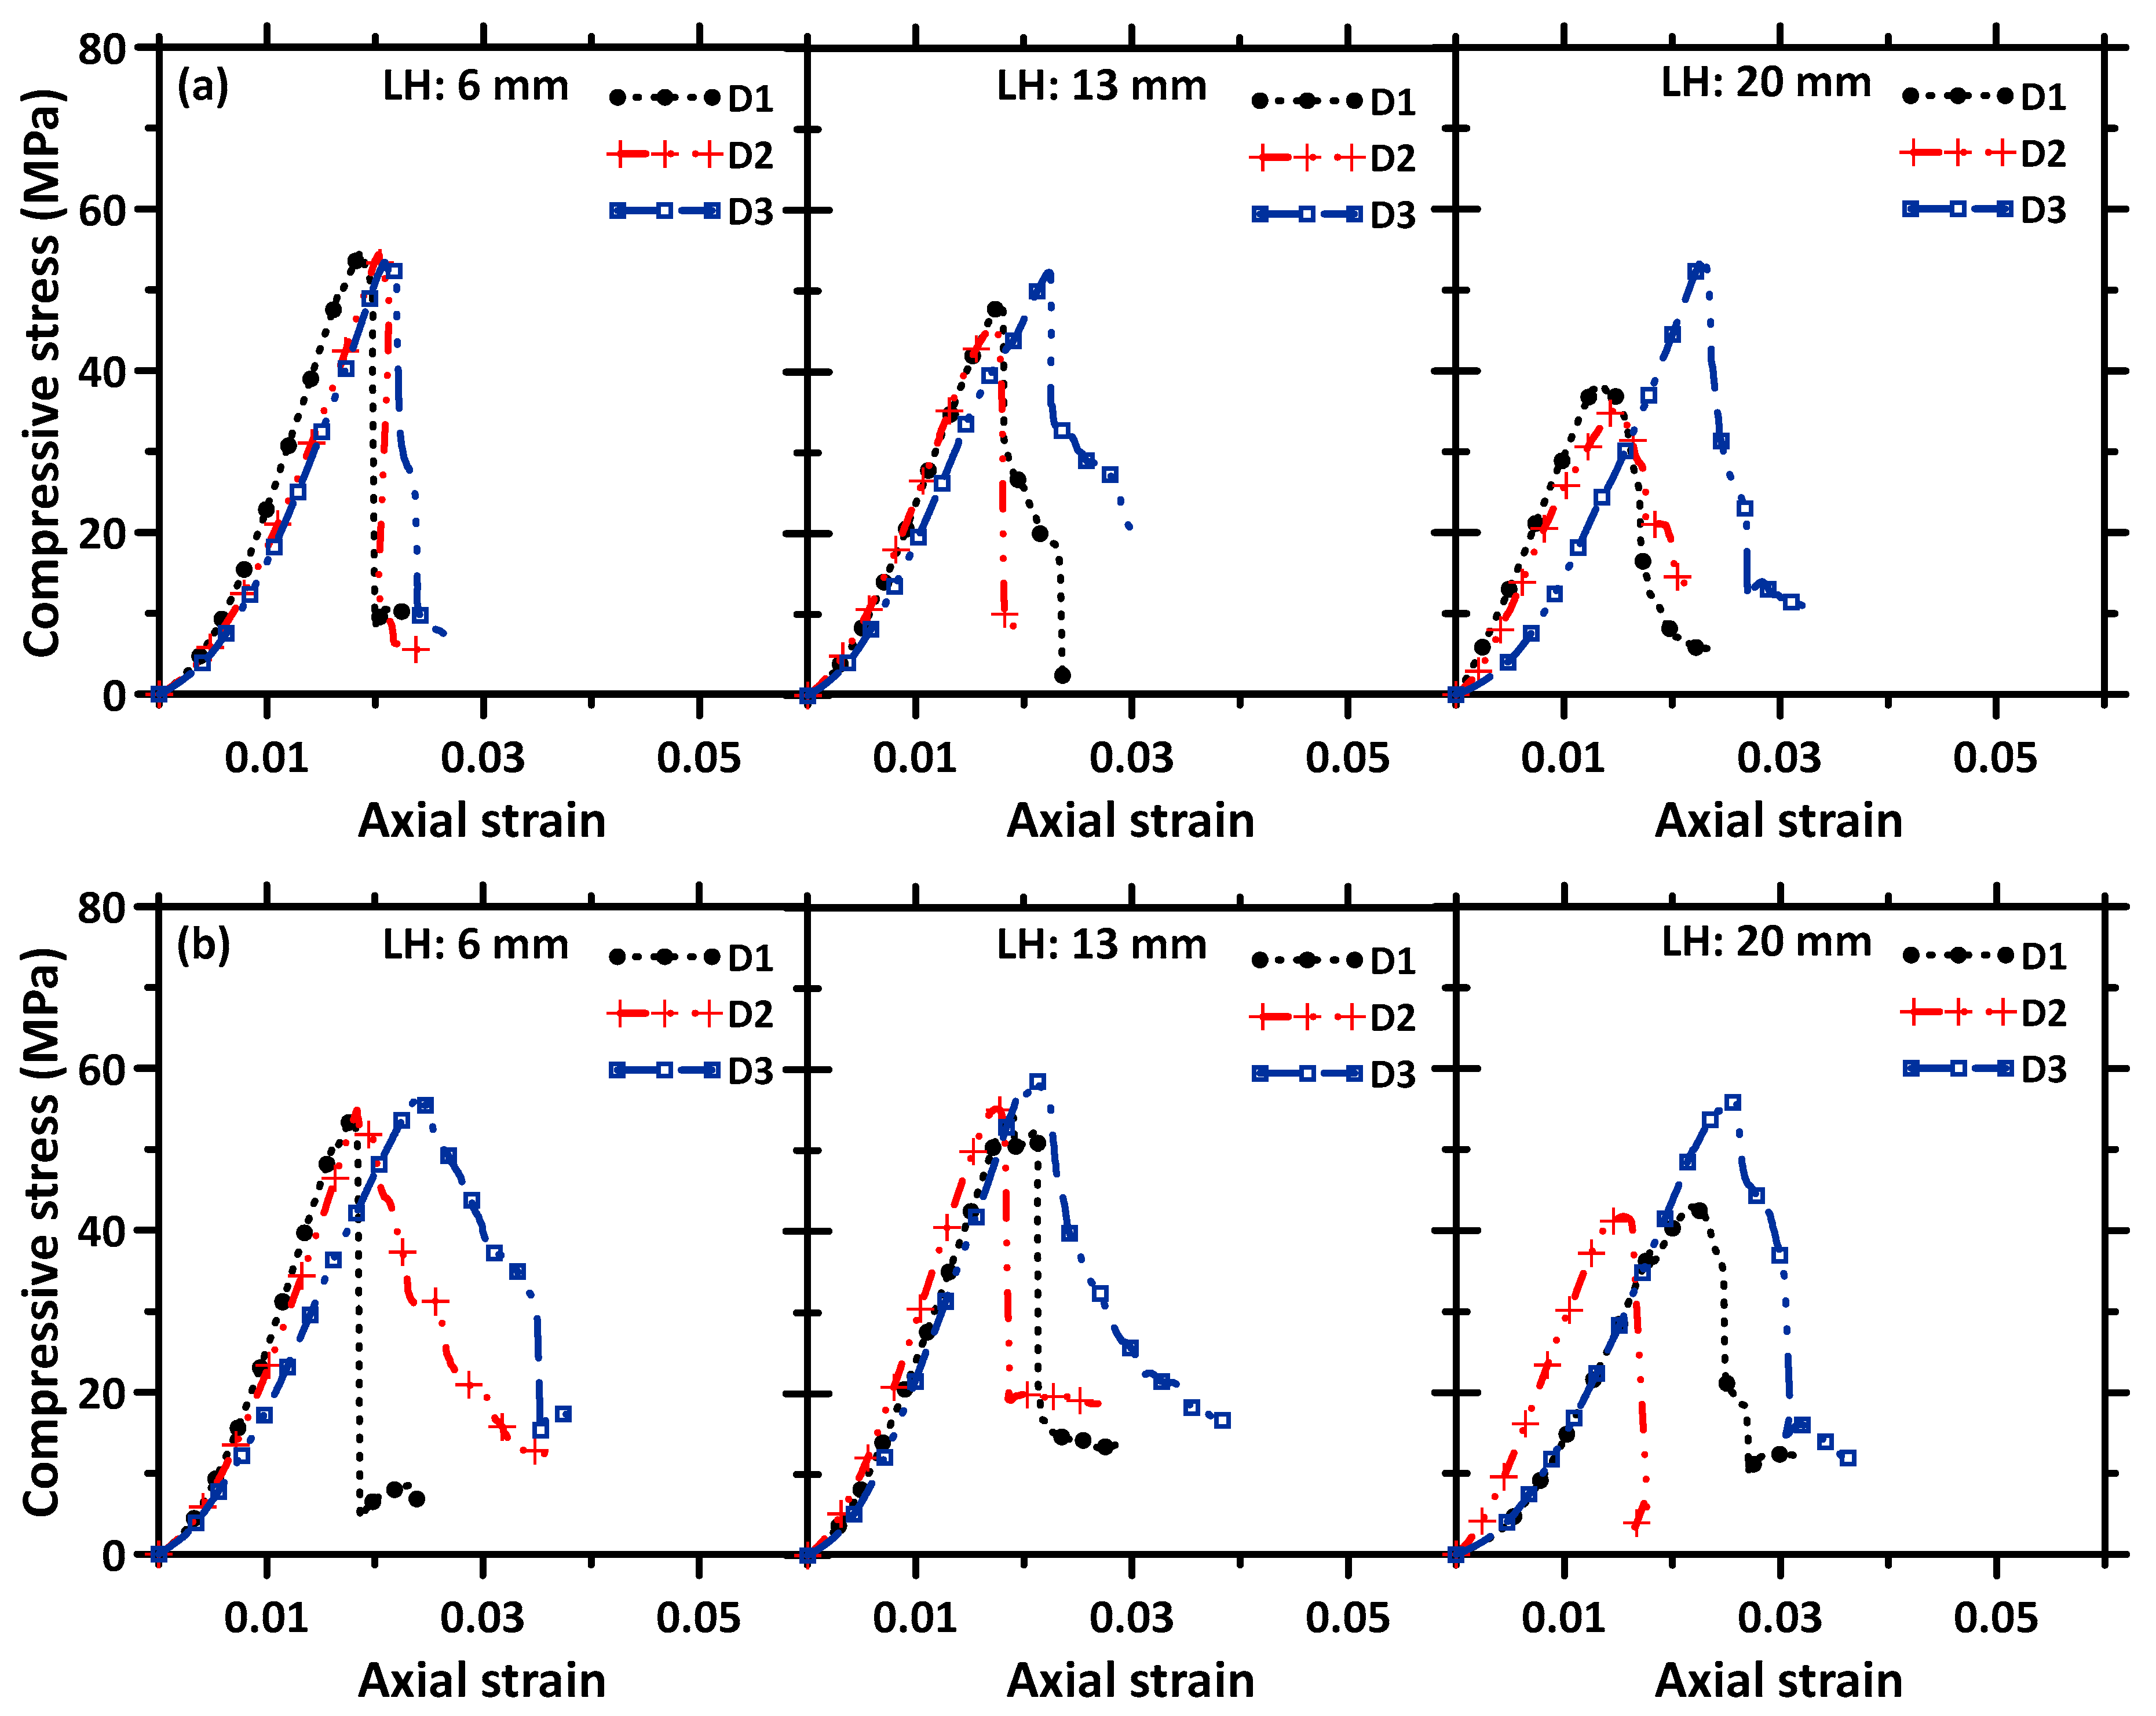
3.4. Stress–Strain Response in Compression
4. Conclusions
- The direction-dependent compressive strengths of the 3D printed specimens were lower than those of conventionally cast samples for all layer heights considered; this observation was invariant of fiber type. The presence of interfacial defects (both inter-layer and inter-filament) reduced the compressive strengths in the case of 3D printed samples, which are layered systems, with an increase in layer height increasing the magnitude of strength reduction.
- The use of fiber reinforcement was observed to reduce the strength loss in 3D printed specimens compared to the conventionally cast mixtures, with the use of steel fiber and a lower layer height, resulting in the least strength disparity.
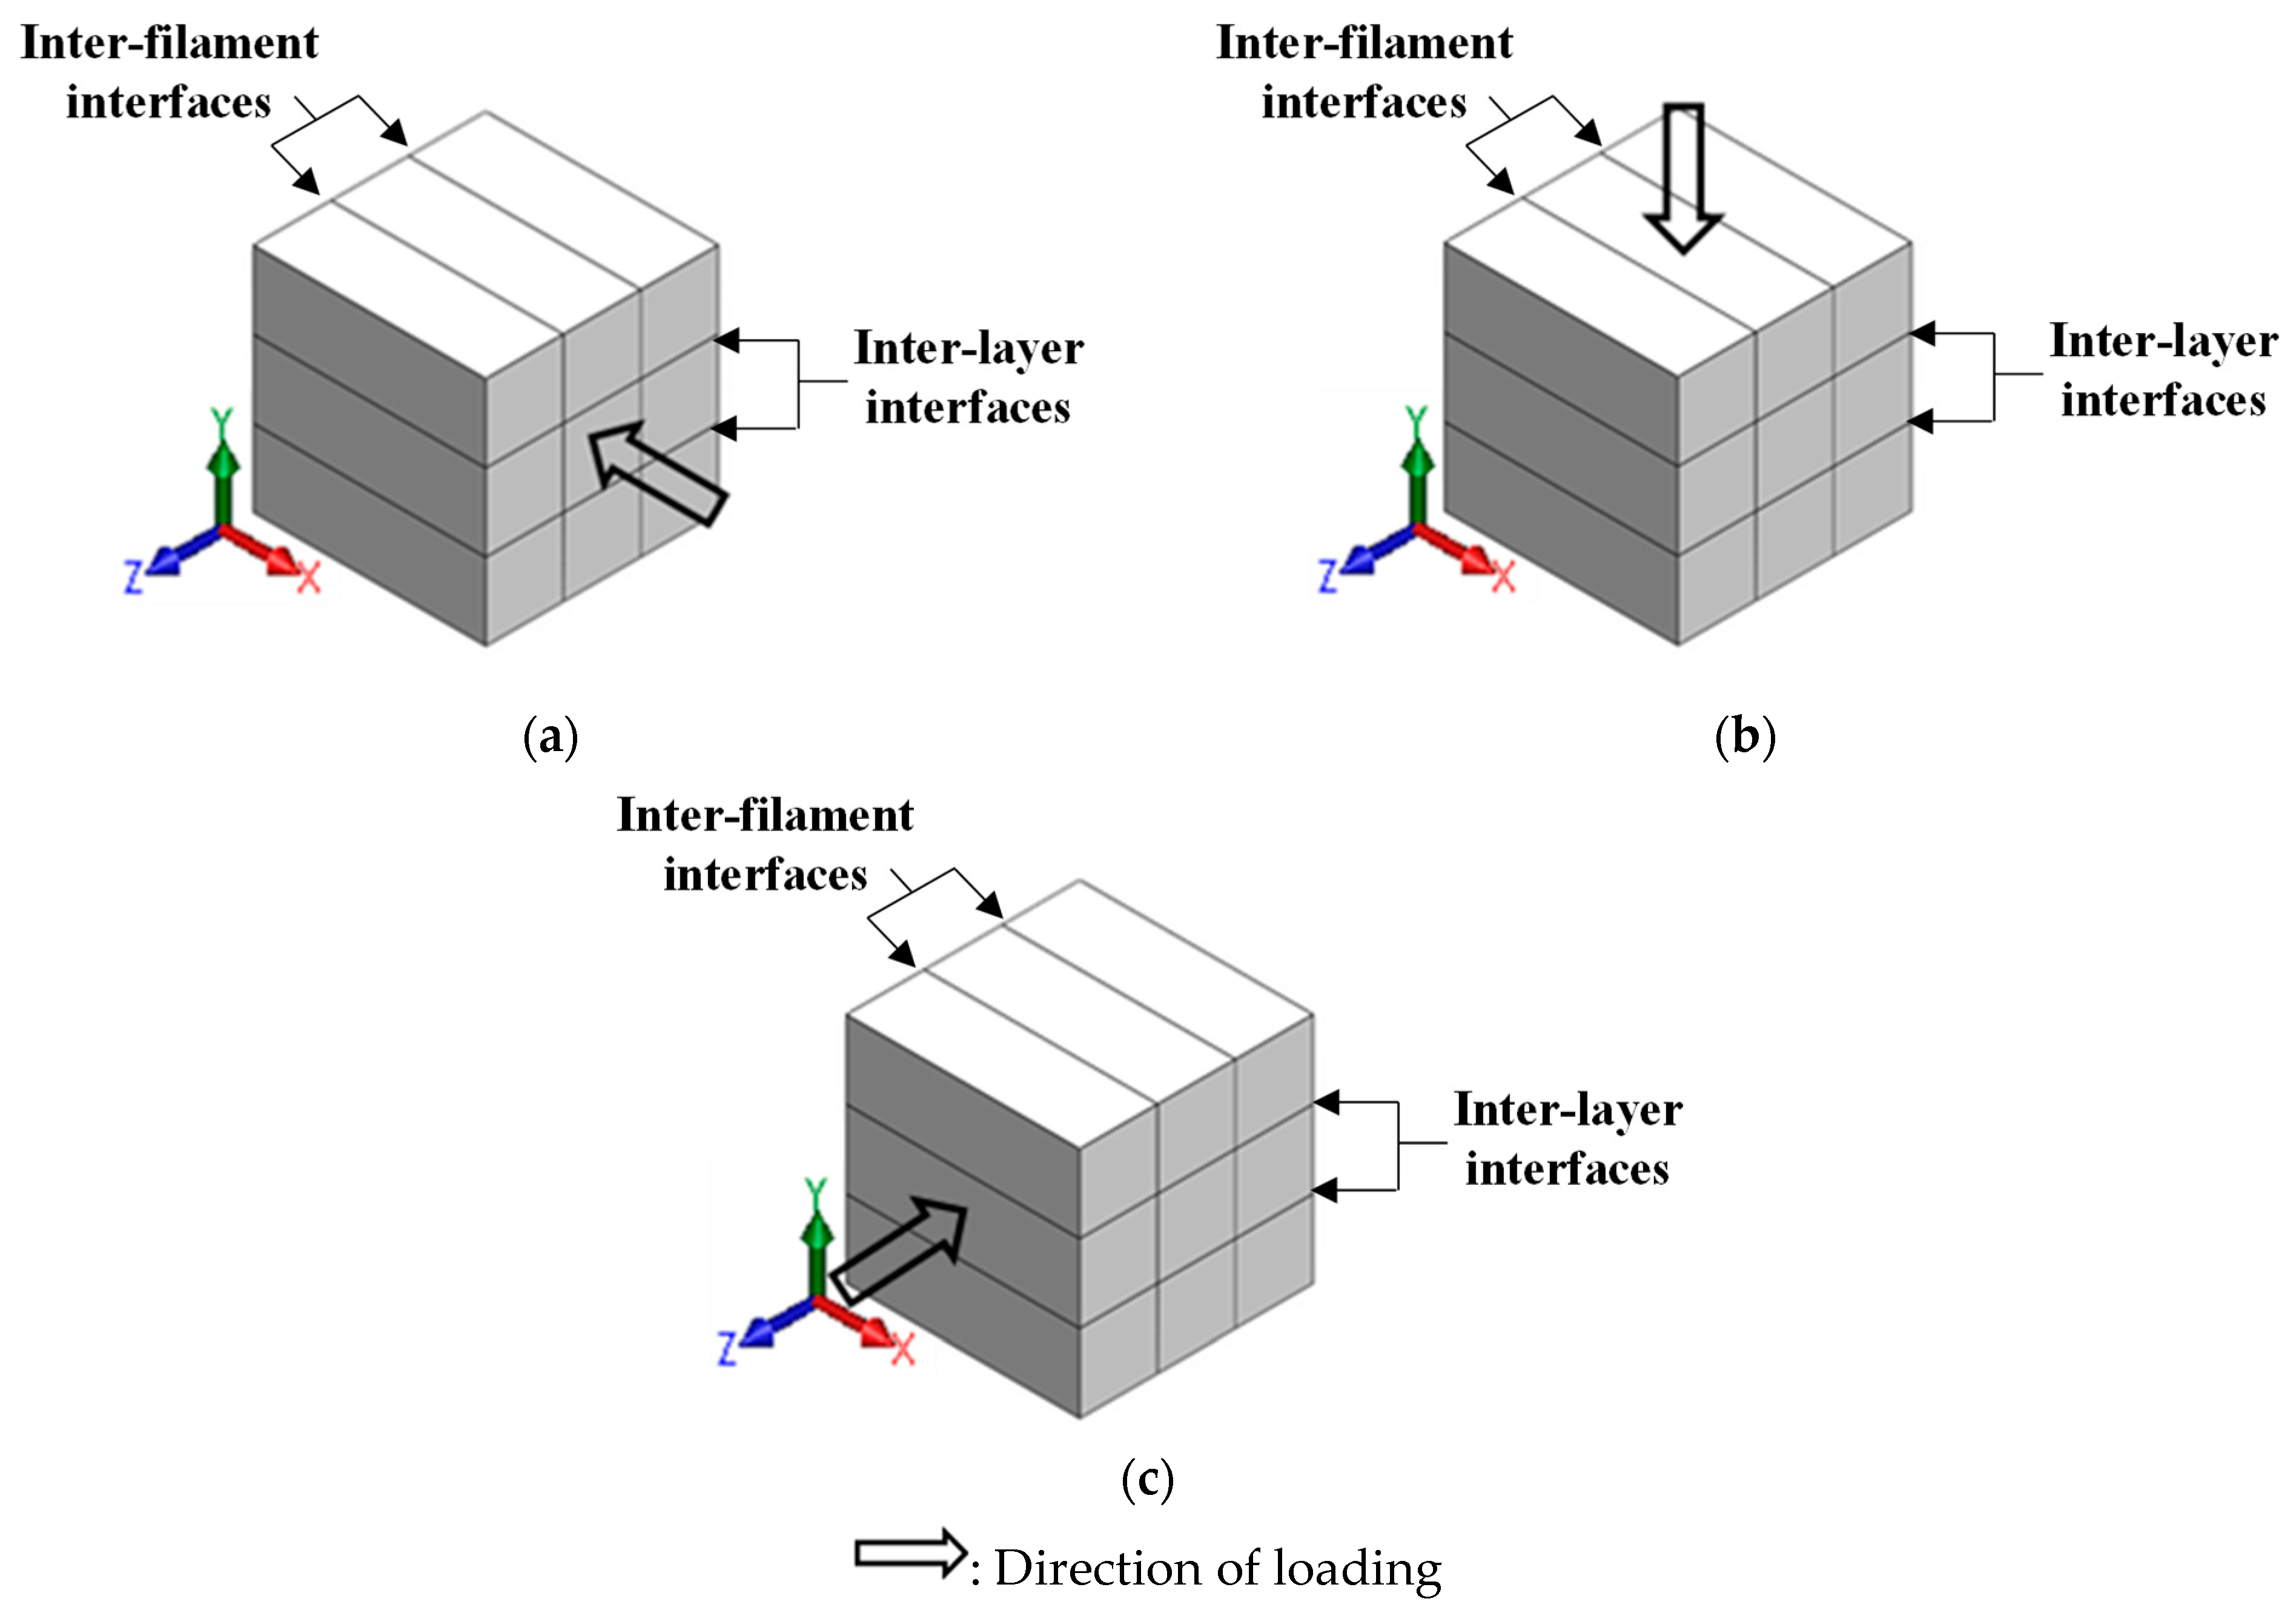
- The effect of print layer heights on the compressive strengths was also quantified for each test direction. The interfacial (inter-layer or inter-filament) contacts parallel to the stress direction were found to be more significant in compression, resulting in interface-parallel cracking to be the major failure mechanism. Thus, when the stress path was perpendicular to the weaker inter-filament interfaces, as in the case of direction D3, the strengths were less dependent on the layer height.
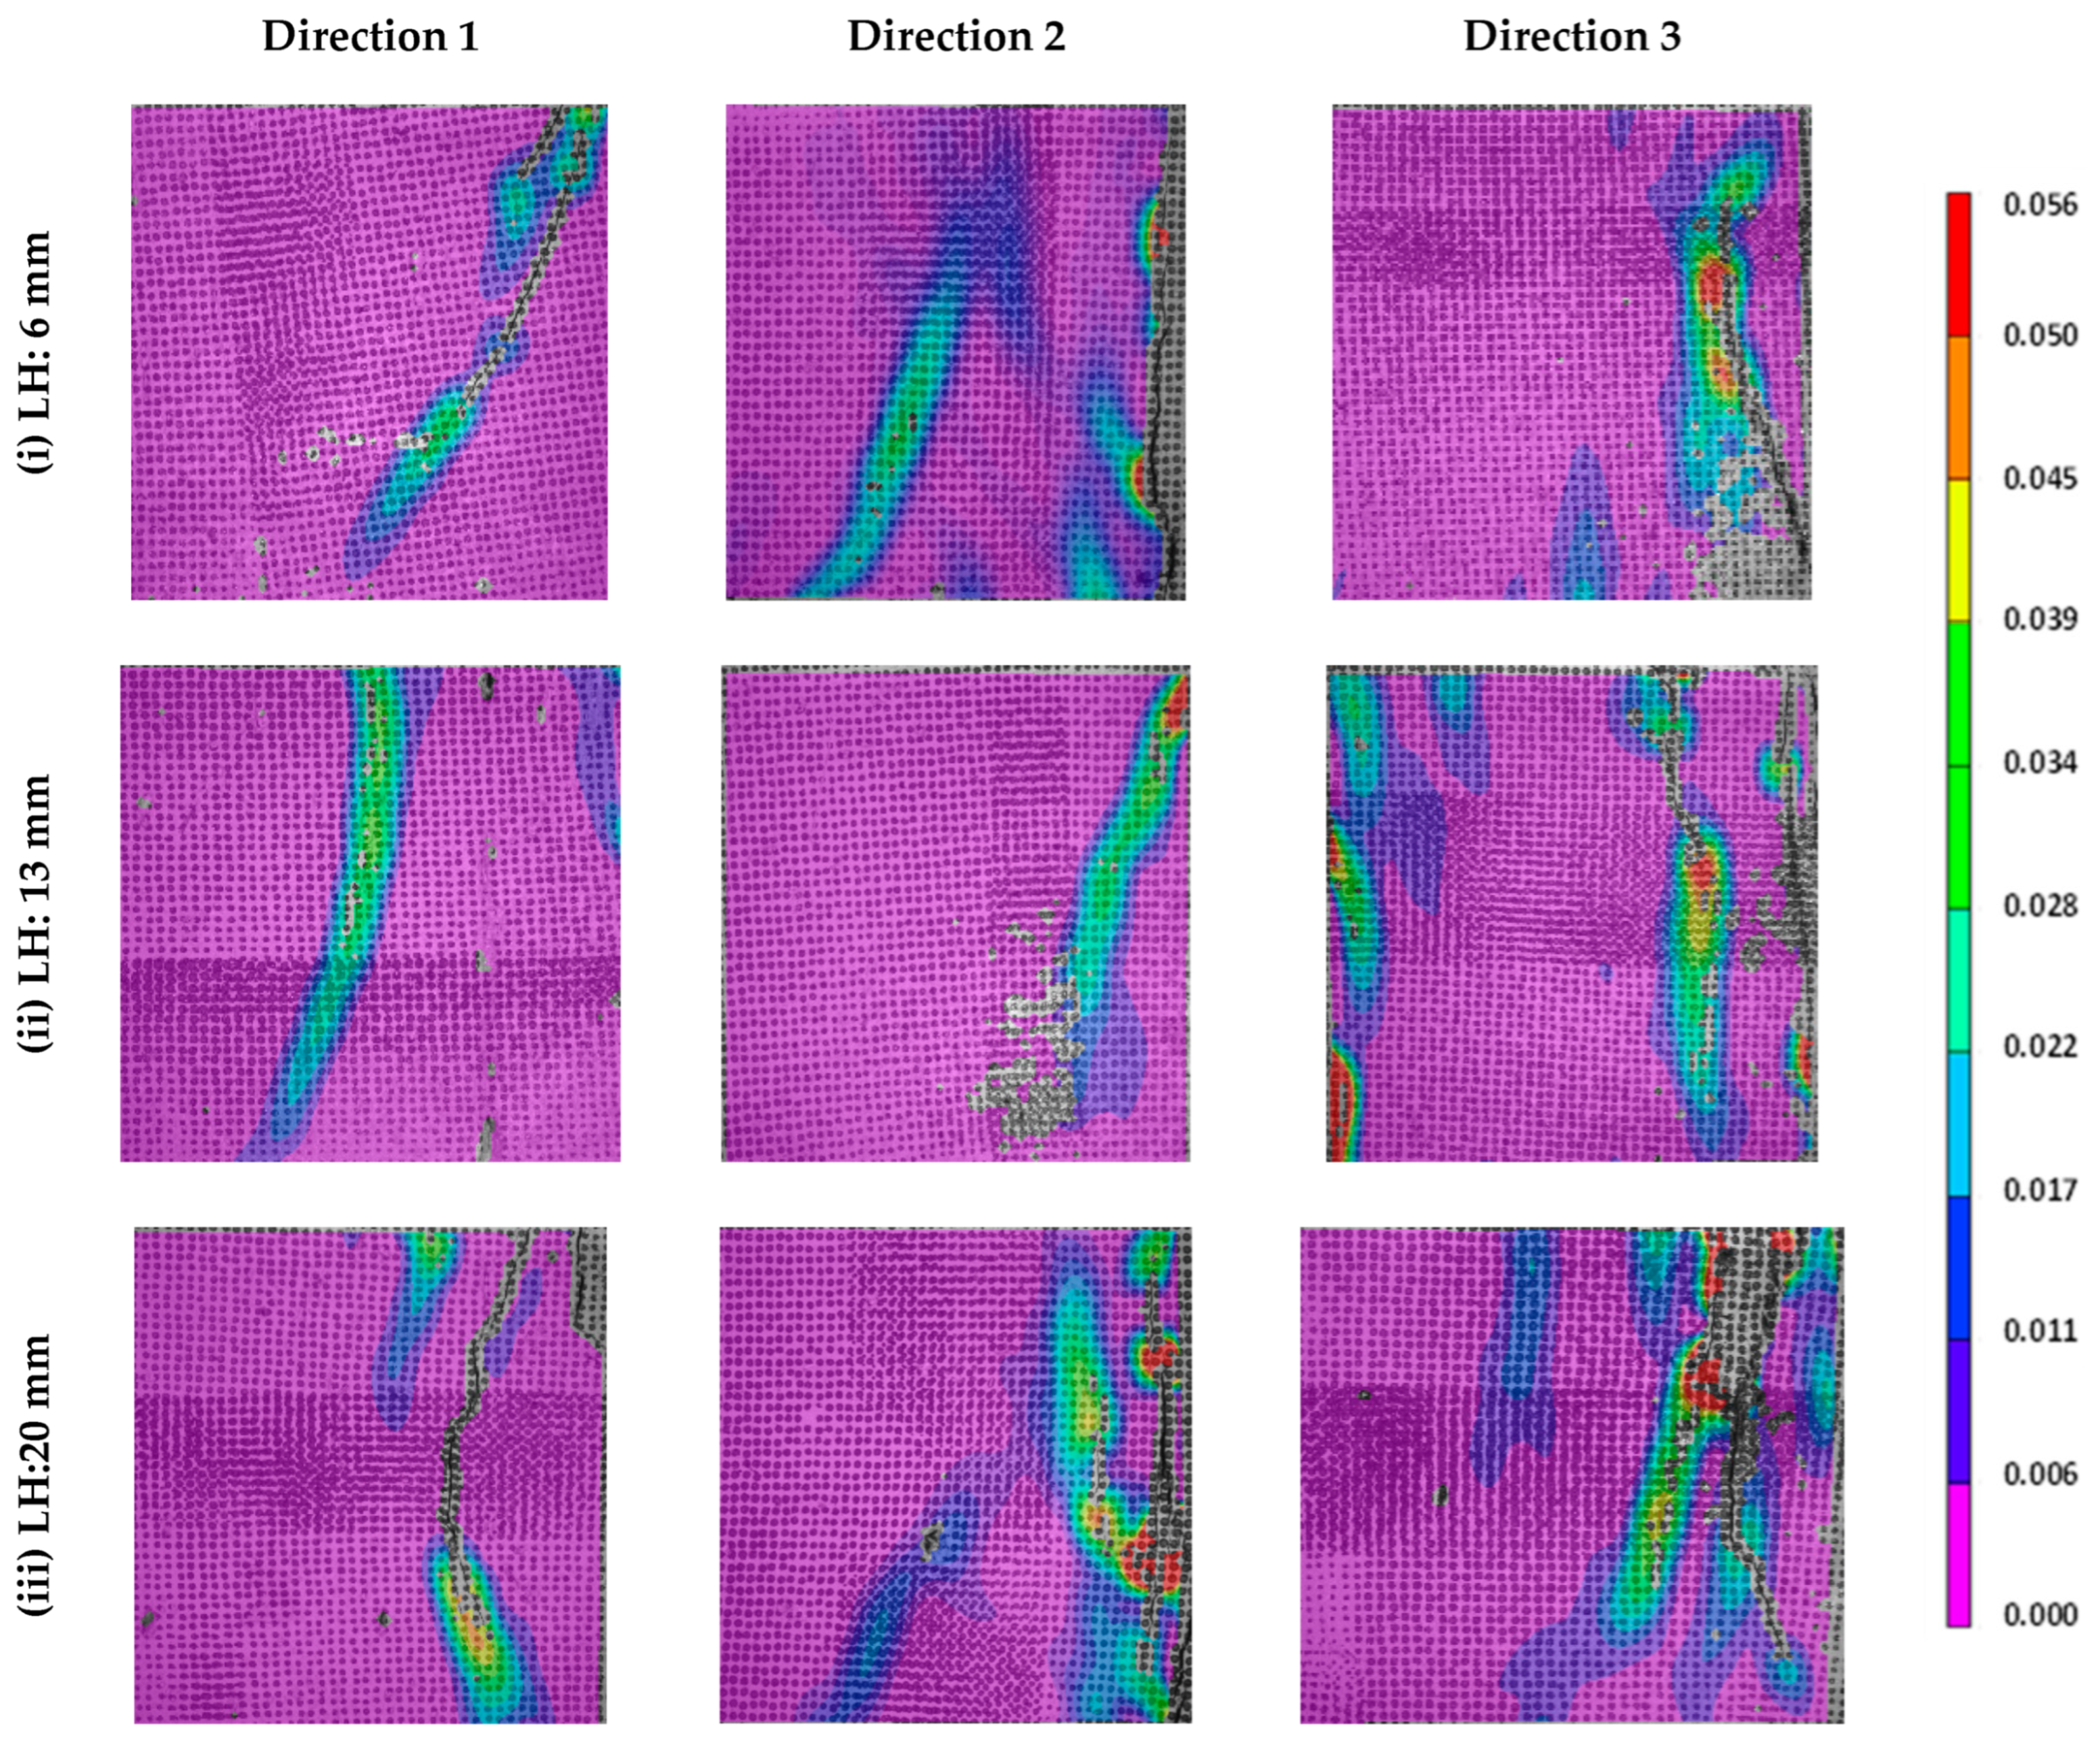
- In the D1 direction, both the inter-layer and inter-filament interfaces influenced the failure under compressive loading since they are both parallel to the load path, while in the D2 direction, the weaker inter-filament interfaces, alone, are parallel to the load path, thus exacerbating interface-parallel cracking. In direction D3, the crack paths faced interference by the inter-filament interfaces, which resulted in a somewhat notable post-peak toughness in the D3 direction as compared to the other two directions of testing, an observation which was corroborated by principal strains obtained from DIC as well. The maximum principal strains, determined using DIC, were also found to increase with layer heights in all the three directions.
- Using the directional compressive strengths and the principal strains at the peak stress (determined from DIC), stress and strain-based anisotropy coefficients were developed. The stress and strain-based anisotropy coefficients were found to be linearly related, even though the peak strain-based coefficients were slightly lower, because of the strain drop when cracking initiated. The lower the anisotropy coefficient, the lower the demonstrated anisotropy, as observed for specimens with a smaller layer height or when fibers (steel fibers in particular) were introduced to the mixture. The anisotropy coefficient increased with an increase in the print layer height, reflecting the influence of rather heterogeneous interfacial characteristics as the layer height increased.
- It has been conclusively shown that, by introducing fiber reinforcement in the mixture, the mechanical anisotropy in 3D printed specimens can be minimized. Stiff fibers such as steel fibers, when used appropriately, improve the mechanical response and reduce the anisotropy while ensuring that a higher print layer height can be chosen, yet reducing the weaker interfaces and, thereby, enhancing the speed of construction.
- Minimizing anisotropy is critical in ensuring that conventional design strategies (that consider the material to be homogeneous and isotropic) can be applied to 3D printed concrete elements as well.
Author Contributions
Funding
Data Availability Statement
Acknowledgments
Conflicts of Interest
References
- Bos, F.; Wolfs, R.; Ahmed, Z.; Salet, T. Additive manufacturing of concrete in construction: Potentials and challenges of 3D concrete printing. Virtual Phys. Prototyp. 2016, 11, 209–225. [Google Scholar] [CrossRef] [Green Version]
- Labonnote, N.; Rønnquist, A.; Manum, B.; Rüther, P. Additive construction: State-of-the-art, challenges and opportunities. Autom. Constr. 2016, 72, 347–366. [Google Scholar] [CrossRef]
- Ford, S.; Despeisse, M. Additive manufacturing and sustainability: An exploratory study of the advantages and challenges. J. Clean. Prod. 2016, 137, 1573–1587. [Google Scholar] [CrossRef]
- Kruger, J.; du Plessis, A.; van Zijl, G. An investigation into the porosity of extrusion-based 3D printed concrete. Addit. Manuf. 2021, 37, 101740. [Google Scholar] [CrossRef]
- De Schutter, G.; Lesage, K.; Mechtcherine, V.; Nerella, V.N.; Habert, G.; Agusti-Juan, I. Vision of 3D printing with concrete—Technical, economic and environmental potentials. Cem. Concr. Res. 2018, 112, 25–36. [Google Scholar] [CrossRef]
- Lloret, E.; Shahab, A.R.; Linus, M.; Flatt, R.J.; Gramazio, F.; Kohler, M.; Langenberg, S. Complex concrete structures: Merging existing casting techniques with digital fabrication. Comput. Des. 2015, 60, 40–49. [Google Scholar] [CrossRef]
- Marchment, T.; Sanjayan, J.G.; Nematollahi, B.; Xia, M. Chapter 12—Interlayer Strength of 3D Printed Concrete: Influencing Factors and Method of Enhancing. In 3D Concrete Printing Technology; Sanjayan, J.G., Nazari, A., Nematollahi, B., Eds.; Butterworth-Heinemann: Oxford, UK, 2019; pp. 241–264. [Google Scholar] [CrossRef]
- Buswell, R.; Soar, R.; Gibb, A.; Thorpe, A. Freeform Construction: Mega-Scale Rapid Manufacturing for construction. Autom. Constr. 2007, 16, 224–231. [Google Scholar] [CrossRef] [Green Version]
- Gosselin, C.; Duballet, R.; Roux, P.; Gaudillière, N.; Dirrenberger, J.; Morel, P. Large-scale 3D printing of ultra-high performance concrete—A new processing route for architects and builders. Mater. Des. 2016, 100, 102–109. [Google Scholar] [CrossRef] [Green Version]
- Cesaretti, G.; Dini, E.; De Kestelier, X.; Colla, V.; Pambaguian, L. Building components for an outpost on the Lunar soil by means of a novel 3D printing technology. Acta Astronaut. 2014, 93, 430–450. [Google Scholar] [CrossRef]
- Rael, R.; Fratello, V.S. Developing Concrete Polymer Building Components for 3D Printing. In Proceedings of the 31st Annual Conference of the Association for Computer Aided Design in Architecture, (ACADIA 11), Banff, AB, Canada, 13–16 October 2011; pp. 152–157. Available online: https://www.semanticscholar.org/paper/Developing-Concrete-Polymer-Building-Components-for-Rael-Fratello/4550f312f4094f2e7eca52d004f3d1774ee069db (accessed on 12 May 2022).
- Xia, M.; Sanjayan, J.G. Methods of enhancing strength of geopolymer produced from powder-based 3D printing process. Mater. Lett. 2018, 227, 281–283. [Google Scholar] [CrossRef]
- Xia, M.; Sanjayan, J. Method of formulating geopolymer for 3D printing for construction applications. Mater. Des. 2016, 110, 382–390. [Google Scholar] [CrossRef]
- Feng, P.; Meng, X.; Chen, J.-F.; Ye, L. Mechanical properties of structures 3D printed with cementitious powders. Constr. Build. Mater. 2015, 93, 486–497. [Google Scholar] [CrossRef] [Green Version]
- Kazemian, A.; Yuan, X.; Cochran, E.; Khoshnevis, B. Cementitious materials for construction-scale 3D printing: Laboratory testing of fresh printing mixture. Constr. Build. Mater. 2017, 145, 639–647. [Google Scholar] [CrossRef]
- Le, T.T.; Austin, S.A.; Lim, S.; Buswell, R.A.; Law, R.; Gibb, A.G.F.; Thorpe, T. Hardened properties of high-performance printing concrete. Cem. Concr. Res. 2012, 42, 558–566. [Google Scholar] [CrossRef] [Green Version]
- Ji, G.; Ding, T.; Xiao, J.; Du, S.; Li, J.; Duan, Z. A 3D Printed Ready-Mixed Concrete Power Distribution Substation: Materials and Construction Technology. Materials 2019, 12, 1540. [Google Scholar] [CrossRef] [Green Version]
- Van den Heever, M.; Bester, F.A.; Kruger, P.J.; van Zijl, G.P.A.G. Effect of silicon carbide (SiC) nanoparticles on 3D printability of cement-based materials. In Advances in Engineering Materials, Structures and Systems: Innovations, Mechanics and Applications; CRC Press: Boca Raton, FL, USA, 2019. [Google Scholar]
- Cho, S.; Kruger, J.; van Rooyen, A.; Zeranka, S.; van Zijl, G. Rheology of 3D Printable Lightweight Foam Concrete Incorporating Nano-Silica. In Rheology and Processing of Construction Materials; Mechtcherine, V., Khayat, K., Secrieru, E., Eds.; RILEM Book Series; Springer: Cham, Switzerland, 2020; pp. 373–381. [Google Scholar] [CrossRef]
- Panda, B.; Unluer, C.; Tan, M.J. Extrusion and rheology characterization of geopolymer nanocomposites used in 3D printing. Compos. Part B Eng. 2019, 176, 107290. [Google Scholar] [CrossRef]
- Panda, B.; Ruan, S.; Unluer, C.; Tan, M.J. Investigation of the properties of alkali-activated slag mixes involving the use of nanoclay and nucleation seeds for 3D printing. Compos. Part B Eng. 2020, 186, 107826. [Google Scholar] [CrossRef]
- Nematollahi, B.; Xia, M.; Sanjayan, J.; Vijay, P. Effect of Type of Fiber on Inter-Layer Bond and Flexural Strengths of Extrusion-Based 3D Printed Geopolymer. Mater. Sci. Forum 2018, 939, 155–162. [Google Scholar] [CrossRef]
- Arunothayan, A.R.; Nematollahi, B.; Ranade, R.; Bong, S.H.; Sanjayan, J. Development of 3D-printable ultra-high performance fiber-reinforced concrete for digital construction. Constr. Build. Mater. 2020, 257, 119546. [Google Scholar] [CrossRef]
- Kim, K.K.; Yeon, J.; Lee, H.J.; Yeon, J.H. Dimensional Stability of SBR-Modified Cementitious Mixtures for Use in 3D Additive Construction. Appl. Sci. 2019, 9, 3386. [Google Scholar] [CrossRef] [Green Version]
- Tay, Y.W.D.; Qian, Y.; Tan, M.J. Printability region for 3D concrete printing using slump and slump flow test. Compos. Part B Eng. 2019, 174, 106968. [Google Scholar] [CrossRef]
- Liu, Z.; Li, M.; Weng, Y.; Wong, T.N.; Tan, M.J. Mixture Design Approach to optimize the rheological properties of the material used in 3D cementitious material printing. Constr. Build. Mater. 2019, 198, 245–255. [Google Scholar] [CrossRef]
- Casagrande, L.; Esposito, L.; Menna, C.; Asprone, D.; Auricchio, F. Effect of testing procedures on buildability properties of 3D-printable concrete. Constr. Build. Mater. 2020, 245, 118286. [Google Scholar] [CrossRef]
- Wolfs, R.J.M.; Bos, F.P.; Salet, T.A.M. Triaxial compression testing on early age concrete for numerical analysis of 3D concrete printing. Cem. Concr. Compos. 2019, 104, 103344. [Google Scholar] [CrossRef]
- Wolfs, R.J.M.; Bos, F.P.; Salet, T.A.M. Hardened properties of 3D printed concrete: The influence of process parameters on interlayer adhesion. Cem. Concr. Res. 2019, 119, 132–140. [Google Scholar] [CrossRef]
- Ding, T.; Xiao, J.; Zou, S.; Zhou, X. Anisotropic behavior in bending of 3D printed concrete reinforced with fibers. Compos. Struct. 2020, 254, 112808. [Google Scholar] [CrossRef]
- Liu, C.; Zhang, R.; Liu, H.; He, C.; Wang, Y.; Wu, Y.; Liu, S.; Song, L.; Zuo, F. Analysis of the mechanical performance and damage mechanism for 3D printed concrete based on pore structure. Constr. Build. Mater. 2022, 314, 125572. [Google Scholar] [CrossRef]
- Xiao, J.; Liu, H.; Ding, T. Finite element analysis on the anisotropic behavior of 3D printed concrete under compression and flexure. Addit. Manuf. 2020, 39, 101712. [Google Scholar] [CrossRef]
- Ding, T.; Xiao, J.; Zou, S.; Wang, Y. Hardened properties of layered 3D printed concrete with recycled sand. Cem. Concr. Compos. 2020, 113, 103724. [Google Scholar] [CrossRef]
- Rahul, A.V.; Santhanam, M.; Meena, H.; Ghani, Z. Mechanical characterization of 3D printable concrete. Constr. Build. Mater. 2019, 227, 116710. [Google Scholar] [CrossRef]
- Sanjayan, J.G.; Nematollahi, B.; Xia, M.; Marchment, T. Effect of surface moisture on inter-layer strength of 3D printed concrete. Constr. Build. Mater. 2018, 172, 468–475. [Google Scholar] [CrossRef]
- Ma, G.; Li, Z.; Wang, L.; Wang, F.; Sanjayan, J. Mechanical anisotropy of aligned fiber reinforced composite for extrusion-based 3D printing. Constr. Build. Mater. 2019, 202, 770–783. [Google Scholar] [CrossRef]
- Nerella, V.N.; Hempel, S.; Mechtcherine, V. Effects of layer-interface properties on mechanical performance of concrete elements produced by extrusion-based 3D-printing. Constr. Build. Mater. 2019, 205, 586–601. [Google Scholar] [CrossRef]
- Van Der Putten, J.; Azima, M.; Heede, P.V.D.; Van Mullem, T.; Snoeck, D.; Carminati, C.; Hovind, J.; Trtik, P.; De Schutter, G.; Van Tittelboom, K. Neutron radiography to study the water ingress via the interlayer of 3D printed cementitious materials for continuous layering. Constr. Build. Mater. 2020, 258, 119587. [Google Scholar] [CrossRef]
- Van Der Putten, J.; Deprez, M.; Cnudde, V.; De Schutter, G.; Van Tittelboom, K. Microstructural Characterization of 3D Printed Cementitious Materials. Materials 2019, 12, 2993. [Google Scholar] [CrossRef] [Green Version]
- Ji, G.; Xiao, J.; Zhi, P.; Wu, Y.-C.; Han, N. Effects of extrusion parameters on properties of 3D printing concrete with coarse aggregates. Constr. Build. Mater. 2022, 325, 126740. [Google Scholar] [CrossRef]
- Panda, B.; Paul, S.C.; Mohamed, N.A.N.; Tay, Y.W.D.; Tan, M.J. Measurement of tensile bond strength of 3D printed geopolymer mortar. Measurement 2018, 113, 108–116. [Google Scholar] [CrossRef]
- Chen, Y.; Jansen, K.; Zhang, H.; Rodriguez, C.R.; Gan, Y.; Çopuroğlu, O.; Schlangen, E. Effect of printing parameters on interlayer bond strength of 3D printed limestone-calcined clay-based cementitious materials: An experimental and numerical study. Constr. Build. Mater. 2020, 262, 120094. [Google Scholar] [CrossRef]
- Ye, J.; Cui, C.; Yu, J.; Yu, K.; Dong, F. Effect of polyethylene fiber content on workability and mechanical-anisotropic properties of 3D printed ultra-high ductile concrete. Constr. Build. Mater. 2021, 281, 122586. [Google Scholar] [CrossRef]
- Panda, B.; Paul, S.C.; Tan, M.J. Anisotropic mechanical performance of 3D printed fiber reinforced sustainable construction material. Mater. Lett. 2017, 209, 146–149. [Google Scholar] [CrossRef]
- Nematollahi, B.; Vijay, P.; Sanjayan, J.; Nazari, A.; Xia, M.; Nerella, V.; Naidu Mechtcherine, V. Effect of Polypropylene Fibre Addition on Properties of Geopolymers Made by 3D Printing for Digital Construction. Materials 2018, 11, 2352. [Google Scholar] [CrossRef] [Green Version]
- Prasittisopin, L.; Pongpaisanseree, K.; Jiramarootapong, P.; Snguanyat, C. Thermal and Sound Insulation of Large-Scale 3D Extrusion Printing Wall Panel. In Second RILEM International Conference on Concrete and Digital Fabrication; Bos, F.P., Lucas, S.S., Wolfs, R.J.M., Salet, T.A.M., Eds.; RILEM Book Series; Springer: Cham, Switzerland, 2020; pp. 1174–1182. [Google Scholar] [CrossRef]
- Nair, S.A.O.; Alghamdi, H.; Arora, A.; Mehdipour, I.; Sant, G.; Neithalath, N. Linking fresh paste microstructure, rheology and extrusion characteristics of cementitious binders for 3D printing. J. Am. Ceram. Soc. 2019, 102, 3951–3964. [Google Scholar] [CrossRef]
- Tripathi, A.; Nair, S.A.; Neithalath, N. A comprehensive analysis of buildability of 3D-printed concrete and the use of bi-linear stress-strain criterion-based failure curves towards their prediction. Cem. Concr. Compos. 2022, 128, 104424. [Google Scholar] [CrossRef]
- Zahabizadeh, B.; Pereira, J.; Gonçalves, C.; Pereira, E.N.B.; Cunha, V.M.C.F. Influence of the printing direction and age on the mechanical properties of 3D printed concrete. Mater. Struct. 2021, 54, 73. [Google Scholar] [CrossRef]
- Zhang, Y.; Zhang, Y.; She, W.; Yang, L.; Liu, G.; Yang, Y. Rheological and harden properties of the high-thixotropy 3D printing concrete. Constr. Build. Mater. 2019, 201, 278–285. [Google Scholar] [CrossRef]
- ASTM International. Standard Specification for Portland Cement; ASTM International: West Conshohocken, PA, USA, 2021; Available online: https://www.astm.org/c0150_c0150m-20.html (accessed on 3 June 2023).
- ASTM International. Standard Specification for Limestone Dimension Stone; ASTM International: West Conshohocken, PA, USA, 2022; Available online: https://www.astm.org/c0568_c0568m-22.html (accessed on 25 October 2022).
- Surehali, S.; Tripathi, A.; Nimbalkar, A.S.; Neithalath, N. Anisotropic chloride transport in 3D printed concrete and its dependence on layer height and interface types. Addit. Manuf. 2023, 62, 103405. [Google Scholar] [CrossRef]
- Nair, S.A.; Tripathi, A.; Neithalath, N. Examining layer height effects on the flexural and fracture response of plain and fiber-reinforced 3D-printed beams. Cem. Concr. Compos. 2021, 124, 104254. [Google Scholar] [CrossRef]
- Das, S.; Kizilkanat, A.; Neithalath, N. Crack propagation and strain localization in metallic particulate-reinforced cementitious mortars. Mater. Des. 2015, 79, 15–25. [Google Scholar] [CrossRef]
- Koksal, F.; Kocabeyoglu, E.T.; Gencel, O.; Benli, A. The effects of high temperature and cooling regimes on the mechanical and durability properties of basalt fiber reinforced mortars with silica fume. Cem. Concr. Compos. 2021, 121, 104107. [Google Scholar] [CrossRef]
- Bayraktar, O.Y.; Kaplan, G.; Gencel, O.; Benli, A.; Sutcu, M. Physico-mechanical, durability and thermal properties of basalt fiber reinforced foamed concrete containing waste marble powder and slag. Constr. Build. Mater. 2021, 288, 123128. [Google Scholar] [CrossRef]
- Zeng, Y.; Zhou, X.; Tang, A.; Sun, P. Mechanical Properties of Chopped Basalt Fiber-Reinforced Lightweight Aggregate Concrete and Chopped Polyacrylonitrile Fiber Reinforced Lightweight Aggregate Concrete. Materials 2020, 13, 1715. [Google Scholar] [CrossRef] [Green Version]
- Niu, D.; Su, L.; Luo, Y.; Huang, D.; Luo, D. Experimental study on mechanical properties and durability of basalt fiber reinforced coral aggregate concrete. Constr. Build. Mater. 2020, 237, 117628. [Google Scholar] [CrossRef]
- Larrard, F.D. Concrete Mixture Proportioning: A Scientific Approach; CRC Press: London, UK, 2014. [Google Scholar] [CrossRef]
- Zhao, C.; Wang, Z.; Zhu, Z.; Guo, Q.; Wu, X.; Zhao, R. Research on different types of fiber reinforced concrete in recent years: An overview. Constr. Build. Mater. 2023, 365, 130075. [Google Scholar] [CrossRef]
- Guler, S.; Akbulut, Z.F. Effect of freeze-thaw cycles on strength and toughness properties of new generation 3D/4D/5D steel fiber-reinforced concrete. J. Build. Eng. 2022, 51, 104239. [Google Scholar] [CrossRef]
- Alghamdi, H.; Nair, S.A.; Neithalath, N. Insights into material design, extrusion rheology, and properties of 3D-printable alkali-activated fly ash-based binders. Mater. Des. 2019, 167, 107634. [Google Scholar] [CrossRef]
- Nair, S.A.; Panda, S.; Santhanam, M.; Sant, G.; Neithalath, N. A critical examination of the influence of material characteristics and extruder geometry on 3D printing of cementitious binders. Cem. Concr. Compos. 2020, 112, 103671. [Google Scholar] [CrossRef]
- Zhou, Y.; Jiang, D.; Sharma, R.; Xie, Y.M.; Singh, A. Enhancement of 3D printed cementitious composite by short fibers: A review. Constr. Build. Mater. 2023, 362, 129763. [Google Scholar] [CrossRef]
- Chen, Y.; He, S.; Gan, Y.; Çopuroğlu, O.; Veer, F.; Schlangen, E. A review of printing strategies, sustainable cementitious materials and characterization methods in the context of extrusion-based 3D concrete printing. J. Build. Eng. 2022, 45, 103599. [Google Scholar] [CrossRef]
- Perrot, A.; Rangeard, D.; Pierre, A. Structural built-up of cement-based materials used for 3D-printing extrusion techniques. Mater. Struct. 2016, 49, 1213–1220. [Google Scholar] [CrossRef]
- Singh, A.; Liu, Q.; Xiao, J.; Lyu, Q. Mechanical and macrostructural properties of 3D printed concrete dosed with steel fibers under different loading direction. Constr. Build. Mater. 2022, 323, 126616. [Google Scholar] [CrossRef]
- Shakor, P.; Nejadi, S.; Paul, G. A Study into the Effect of Different Nozzles Shapes and Fibre-Reinforcement in 3D Printed Mortar. Materials 2019, 12, 1708. [Google Scholar] [CrossRef] [PubMed] [Green Version]
- Cao, X.; Yu, S.; Wu, S.; Cui, H. Experimental study of hybrid manufacture of printing and cast-in-process to reinforce 3D-printed concrete. Constr. Build. Mater. 2023, 362, 129763. [Google Scholar] [CrossRef]
- Arora, A.; Almujaddidi, A.; Kianmofrad, F.; Mobasher, B.; Neithalath, N. Material design of economical ultra-high performance concrete (UHPC) and evaluation of their properties. Cem. Concr. Compos. 2019, 104, 103346. [Google Scholar] [CrossRef]
- Tawfek, A.M.; Ge, Z.; Yuan, H.; Zhang, N.; Zhang, H.; Ling, Y.; Guan, Y.; Šavija, B. Influence of fiber orientation on the mechanical responses of engineering cementitious composite (ECC) under various loading conditions. J. Build. Eng. 2023, 63, 105518. [Google Scholar] [CrossRef]


| Components of the Binders | Chemical Composition (% by Mass) | d50 (μm) | Specific Gravity | ||||||
|---|---|---|---|---|---|---|---|---|---|
| SiO2 | Al2O3 | Fe2O3 | CaO | MgO | SO3 | LOI * | |||
| OPC | 19.60 | 4.09 | 3.39 | 63.21 | 3.37 | 3.17 | 2.54 | 10.4 | 3.15 |
| Limestone(L) | CaCO3 > 99% | 1.5 | 2.70 | ||||||
| Medium Sand (M) | SiO2 > 99% | 200 | 2.40 | ||||||
| Type of Fiber | Diameter (mm) | Length (mm) | Specific Gravity | Tensile Strength (GPa) | Young’s Modulus (GPa) |
|---|---|---|---|---|---|
| Chopped Basalt Fiber (BF) | 0.04–0.06 | 15 | 2.36 | 0.28 | 18 |
| Chopped Steel Fiber (SF) | 0.20 | 13 | 6.8 | 3.0 | 210 |
| Mixture ID | Mass Fraction of Ingredients | Chopped Steel Fiber (SF) + | Chopped Basalt Fiber (BF) + | Water-to-Binder Ratio (w/b) by Mass | SP to Binder Ratio (SP%) by Mass of the Binder | ||
|---|---|---|---|---|---|---|---|
| OPC | Limestone (L) | Sand (M) | |||||
| L30 | 0.35 | 0.15 | 0.5 | - | - | 0.35 | 0.35 |
| L30-BF | 0.35 | 0.15 | 0.5 | - | 0.28 | 0.35 | 0.35 |
| L30-SF | 0.35 | 0.15 | 0.5 | 0.28 | - | 0.35 | 0.35 |
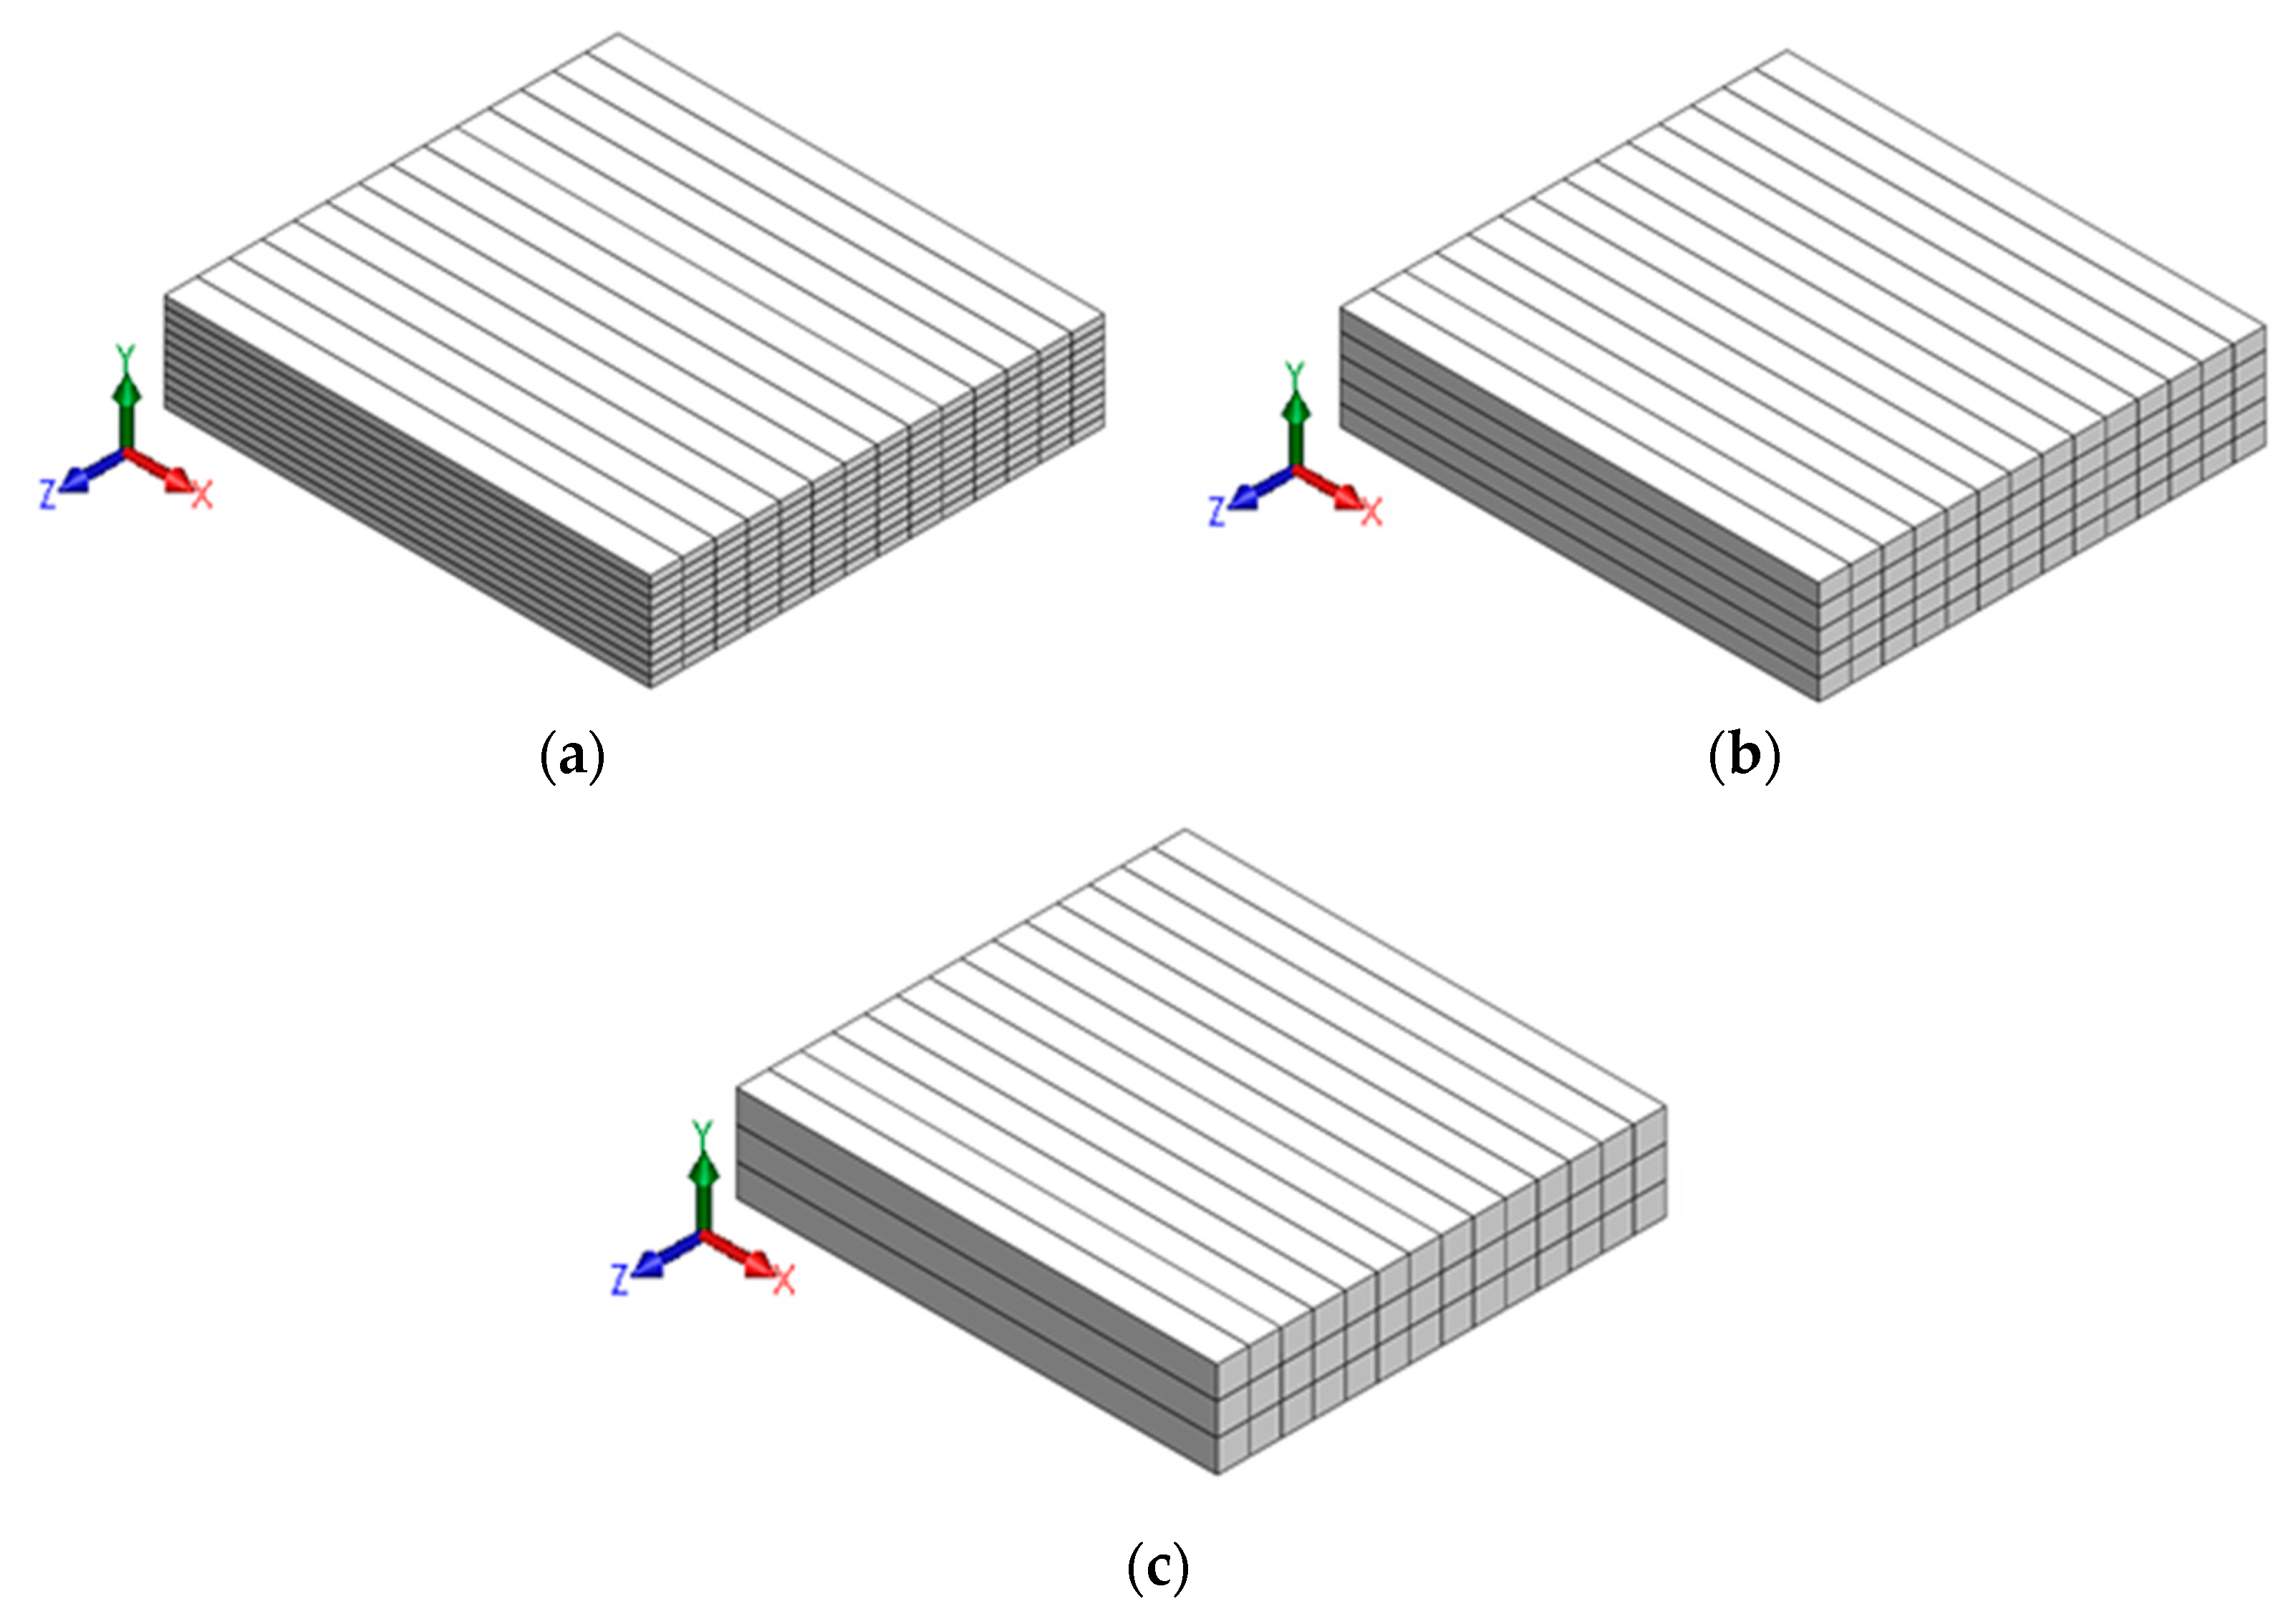
| Layer Height | No. of Inter-Layer Interfaces | No. of Inter-Filament Interfaces |
|---|---|---|
| 6 mm | 8 | 2 |
| 13 mm | 3 | 2 |
| 20 mm | 2 | 2 |
Disclaimer/Publisher’s Note: The statements, opinions and data contained in all publications are solely those of the individual author(s) and contributor(s) and not of MDPI and/or the editor(s). MDPI and/or the editor(s) disclaim responsibility for any injury to people or property resulting from any ideas, methods, instructions or products referred to in the content. |
© 2023 by the authors. Licensee MDPI, Basel, Switzerland. This article is an open access article distributed under the terms and conditions of the Creative Commons Attribution (CC BY) license (https://creativecommons.org/licenses/by/4.0/).
Share and Cite
Surehali, S.; Tripathi, A.; Neithalath, N. Anisotropy in Additively Manufactured Concrete Specimens under Compressive Loading—Quantification of the Effects of Layer Height and Fiber Reinforcement. Materials 2023, 16, 5488. https://doi.org/10.3390/ma16155488
Surehali S, Tripathi A, Neithalath N. Anisotropy in Additively Manufactured Concrete Specimens under Compressive Loading—Quantification of the Effects of Layer Height and Fiber Reinforcement. Materials. 2023; 16(15):5488. https://doi.org/10.3390/ma16155488
Chicago/Turabian StyleSurehali, Sahil, Avinaya Tripathi, and Narayanan Neithalath. 2023. "Anisotropy in Additively Manufactured Concrete Specimens under Compressive Loading—Quantification of the Effects of Layer Height and Fiber Reinforcement" Materials 16, no. 15: 5488. https://doi.org/10.3390/ma16155488