

Analysis of Structural Parameters of Steel–NC–UHPC Composite Beams

Abstract
:1. Introduction
2. The Bonding Performance of the Interface
2.1. Materials
2.2. Interface Tests
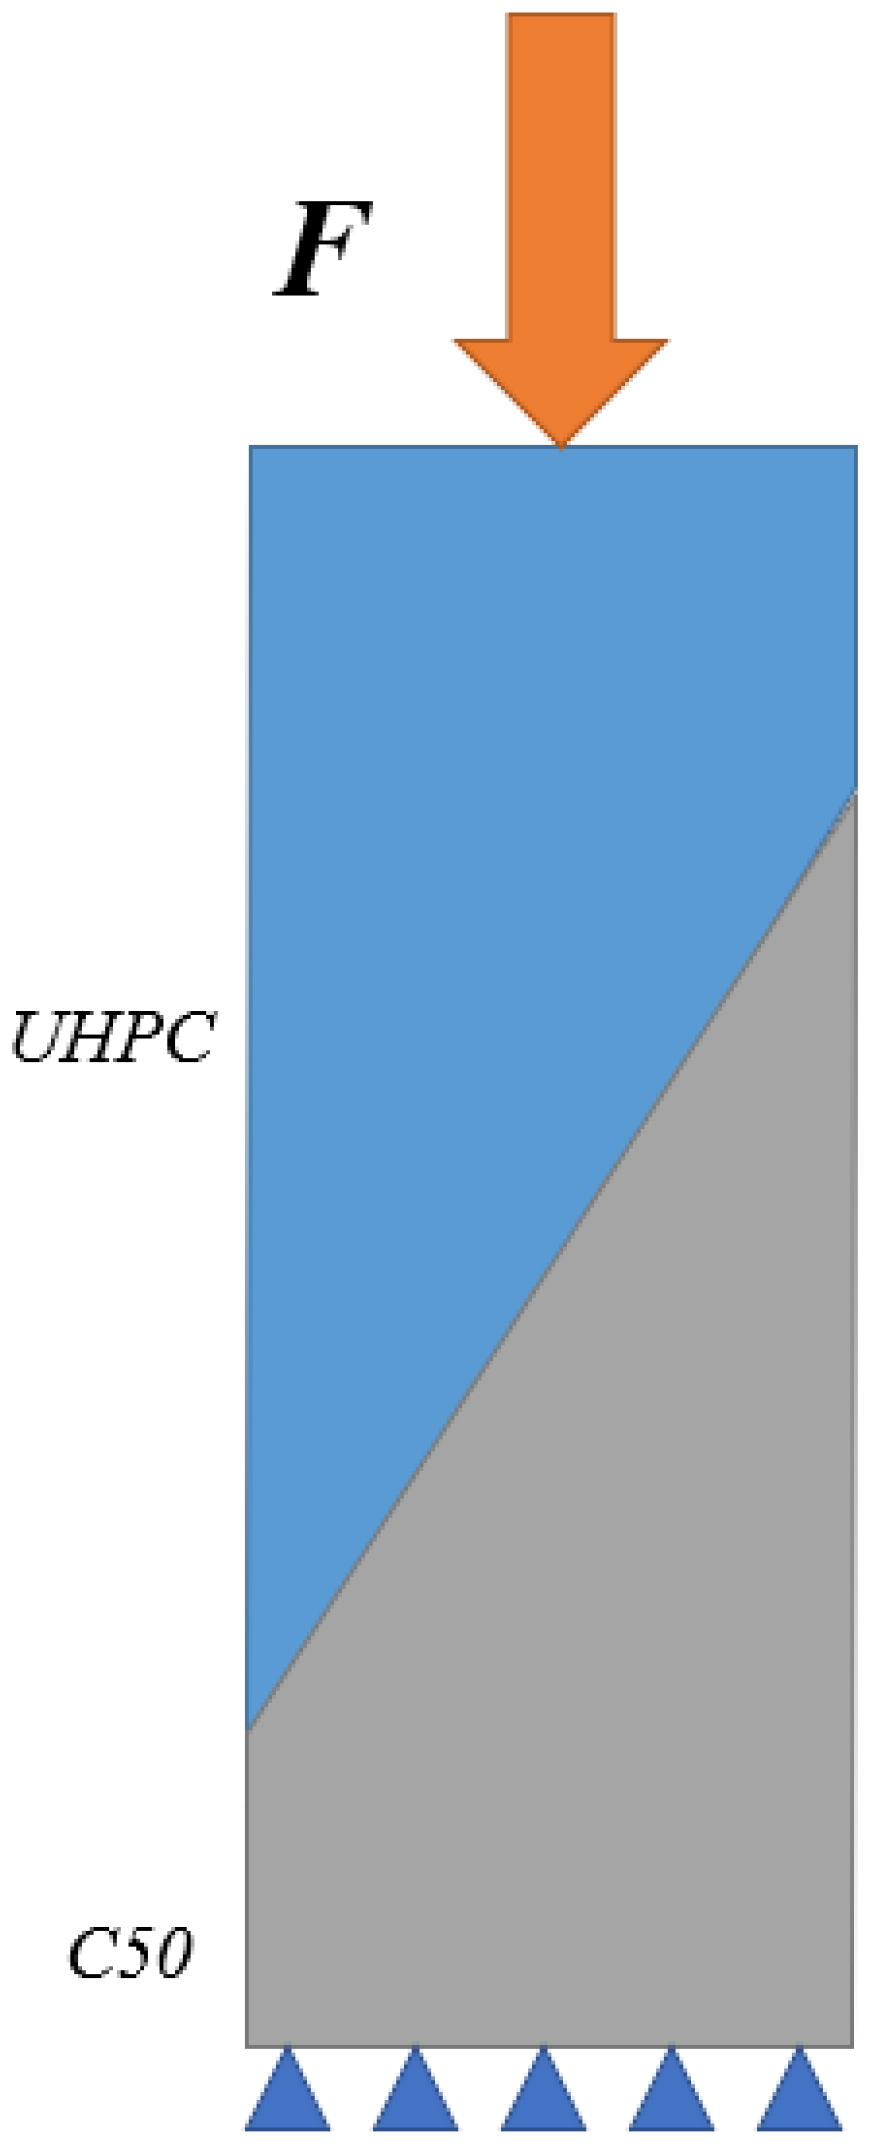
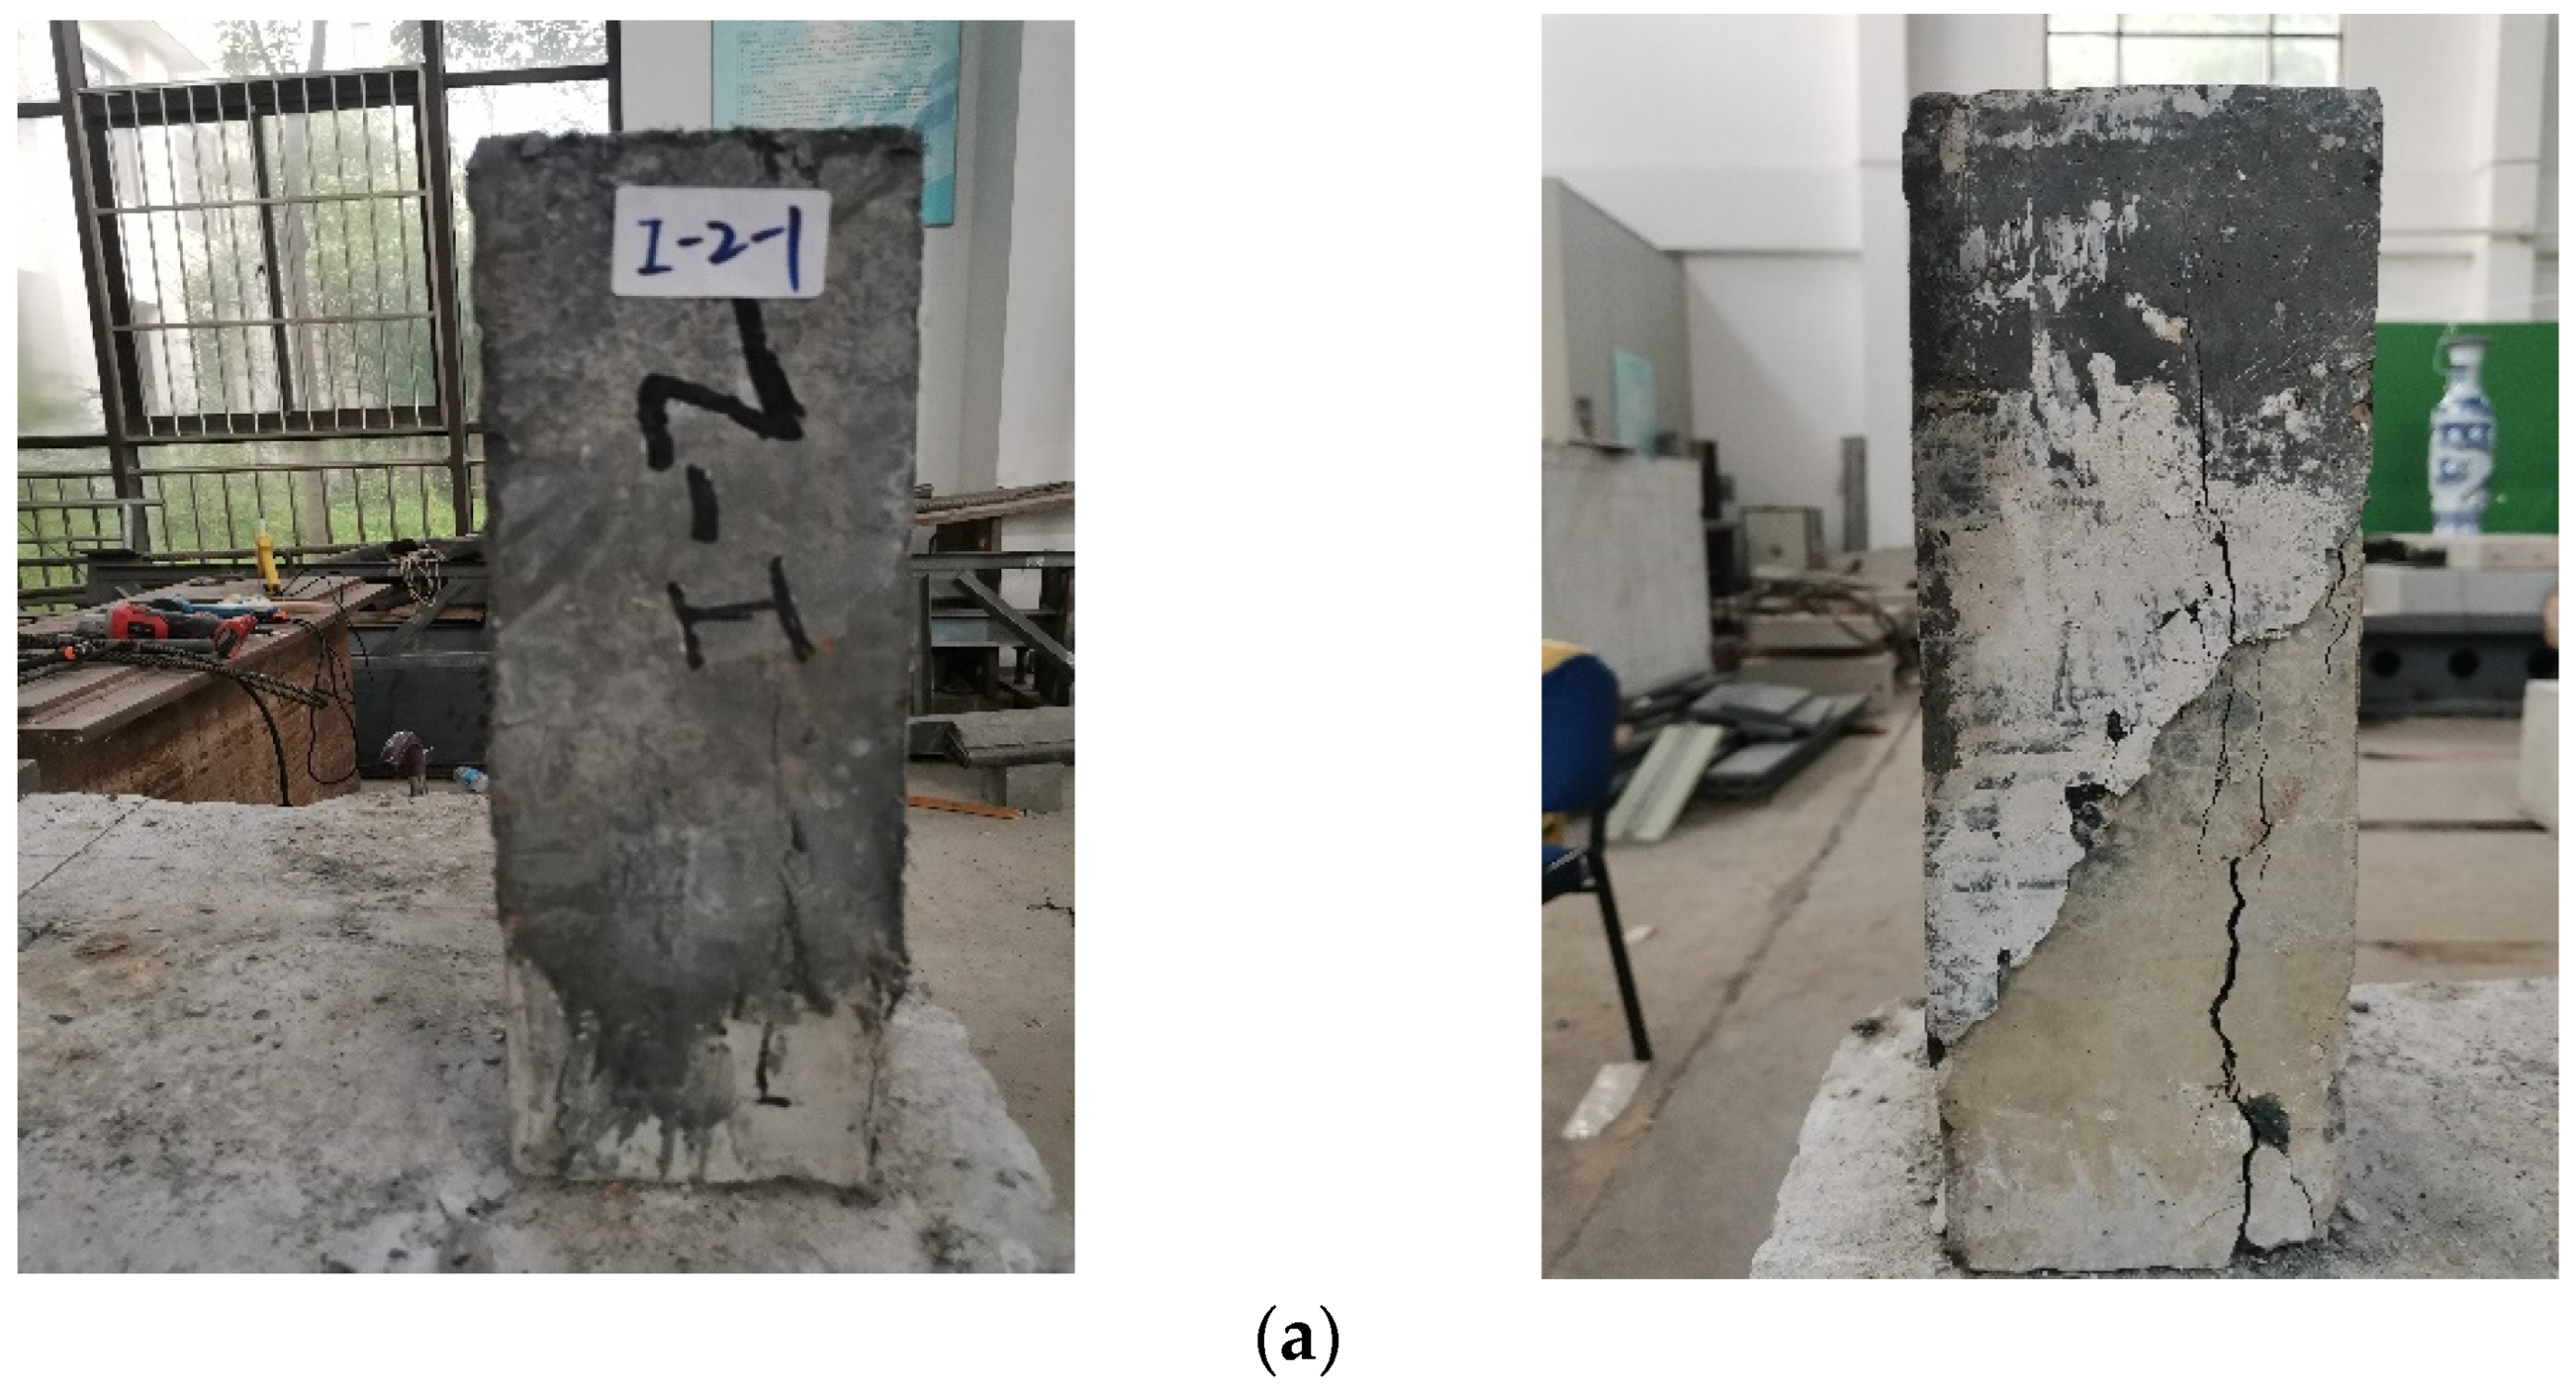
2.2.1. Slant Shear Tests
Specimen Design
Fabrication
Load
Failure Type
- (1)
- A: interface of concrete and UHPC is invalid, concrete is intact;
- (2)
- B: interface of concrete and UHPC is invalid, there is a slight damage to concrete;
- (3)
- C: interface of concrete and UHPC has slight damage, concrete is crushed.
Slant Shear Strength
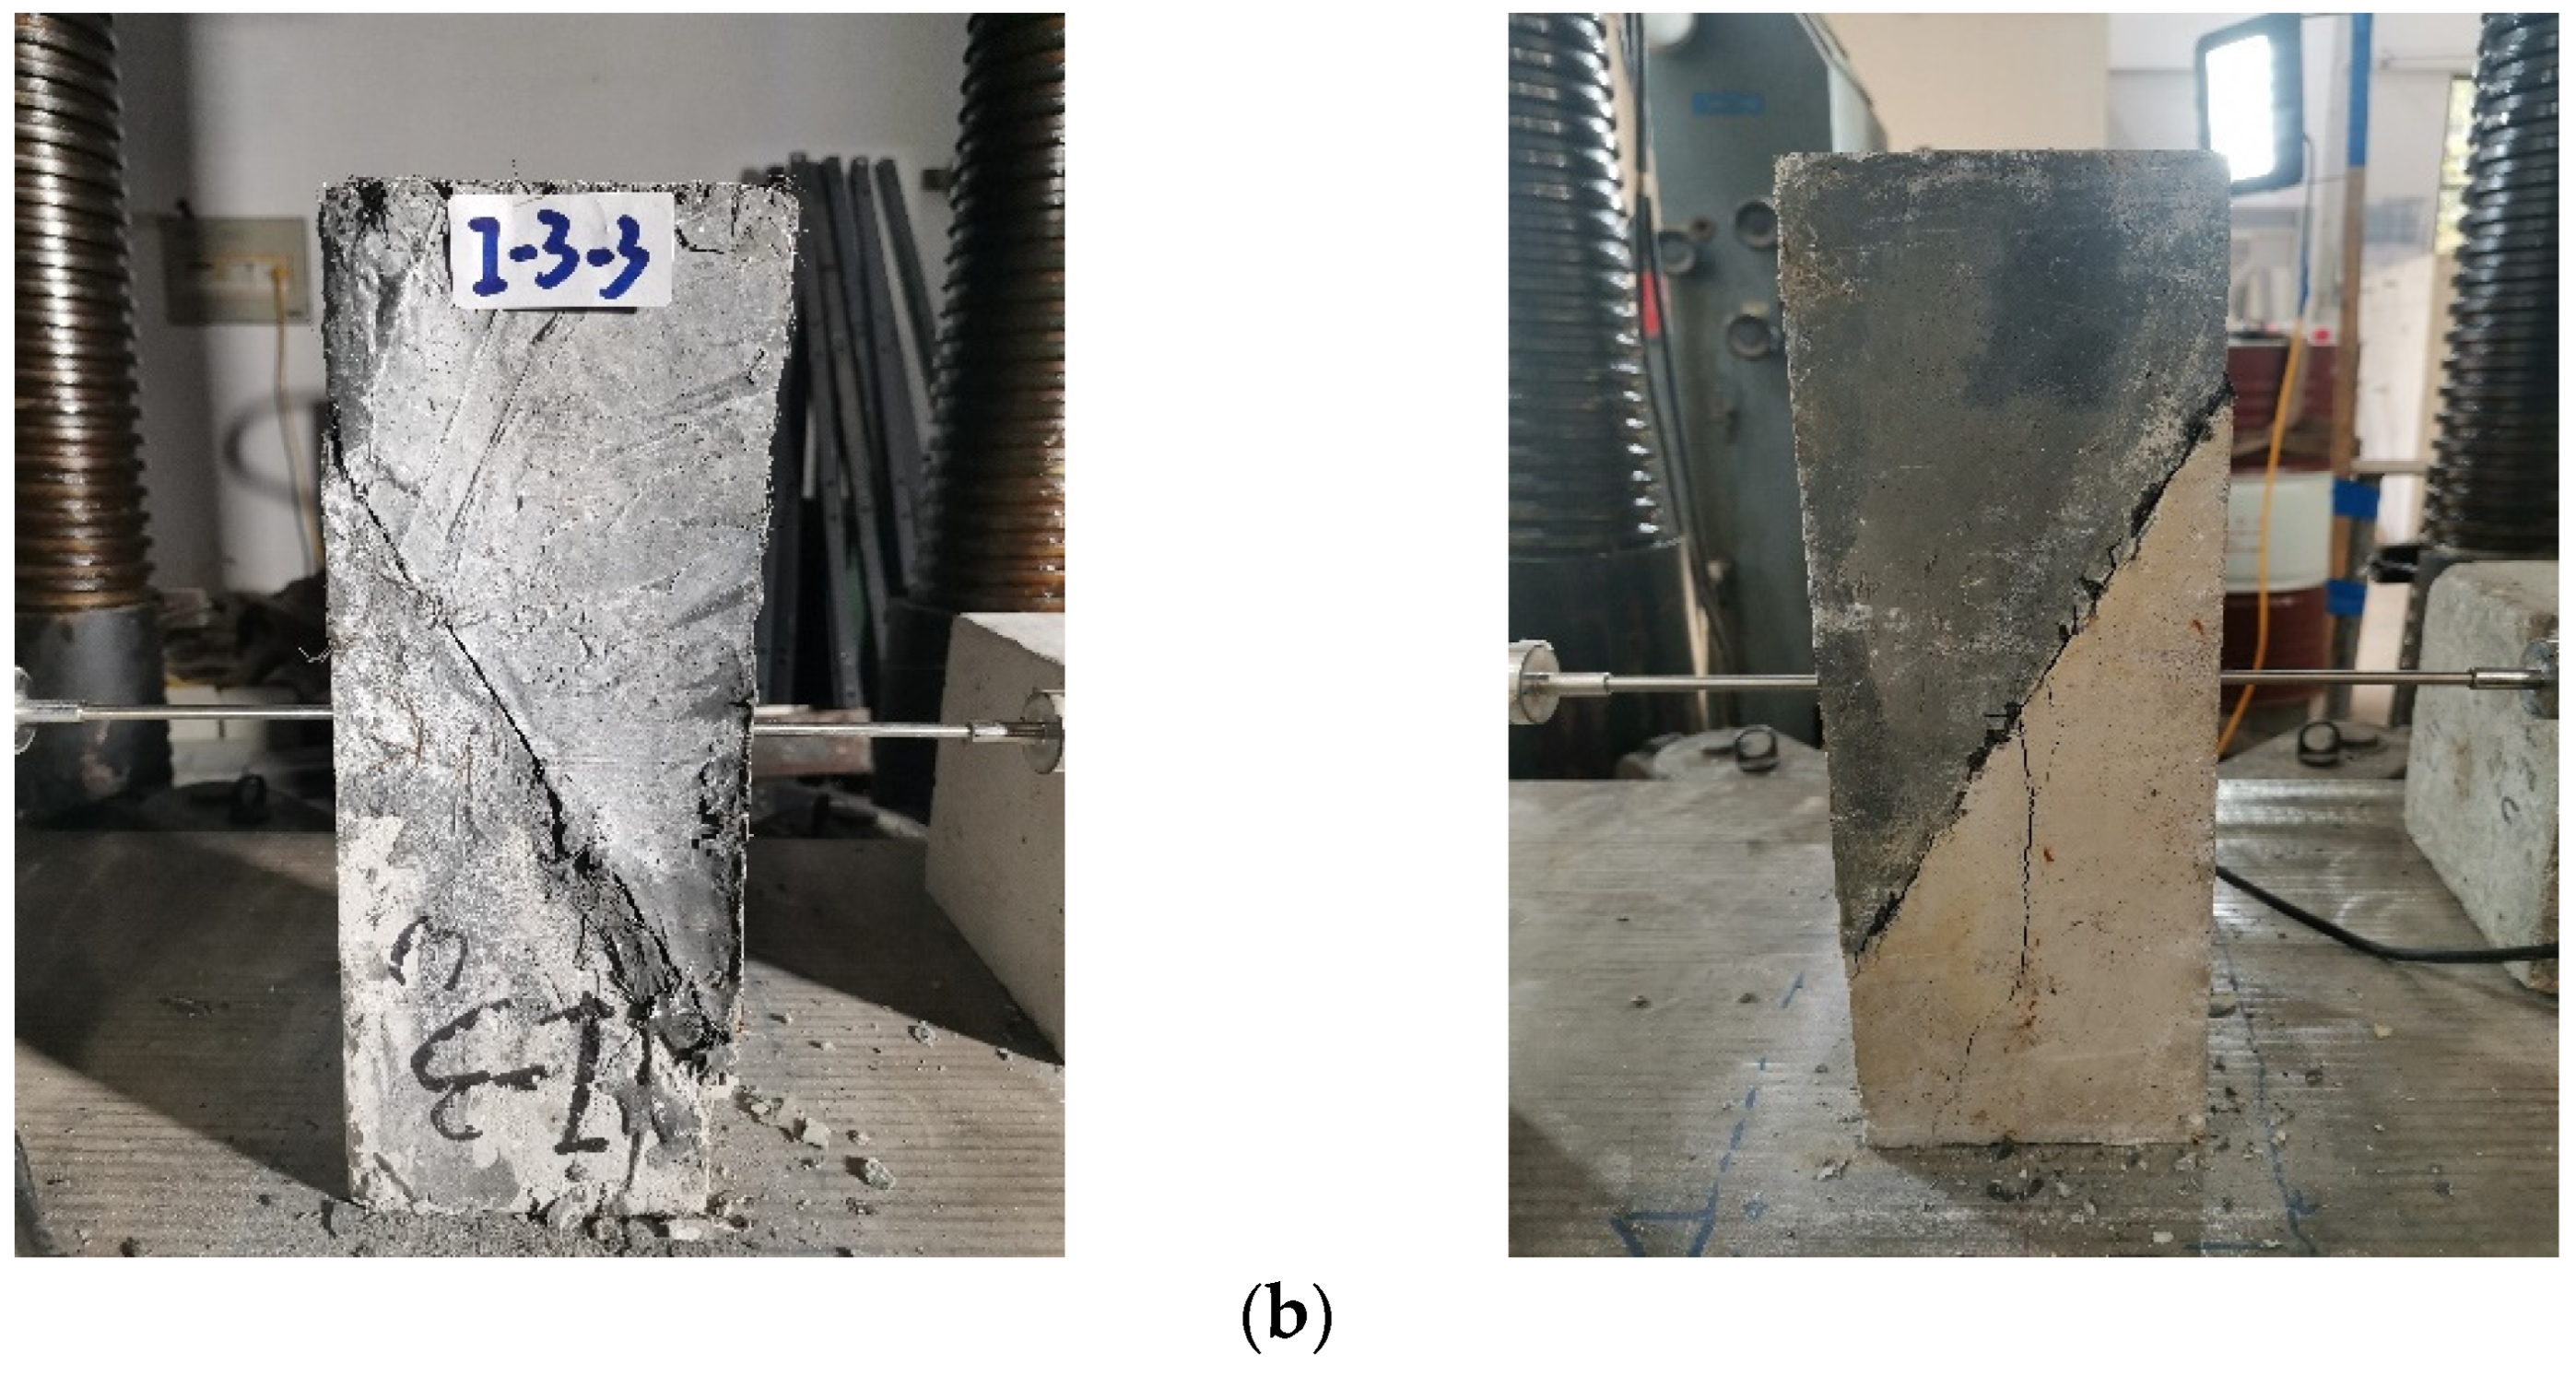
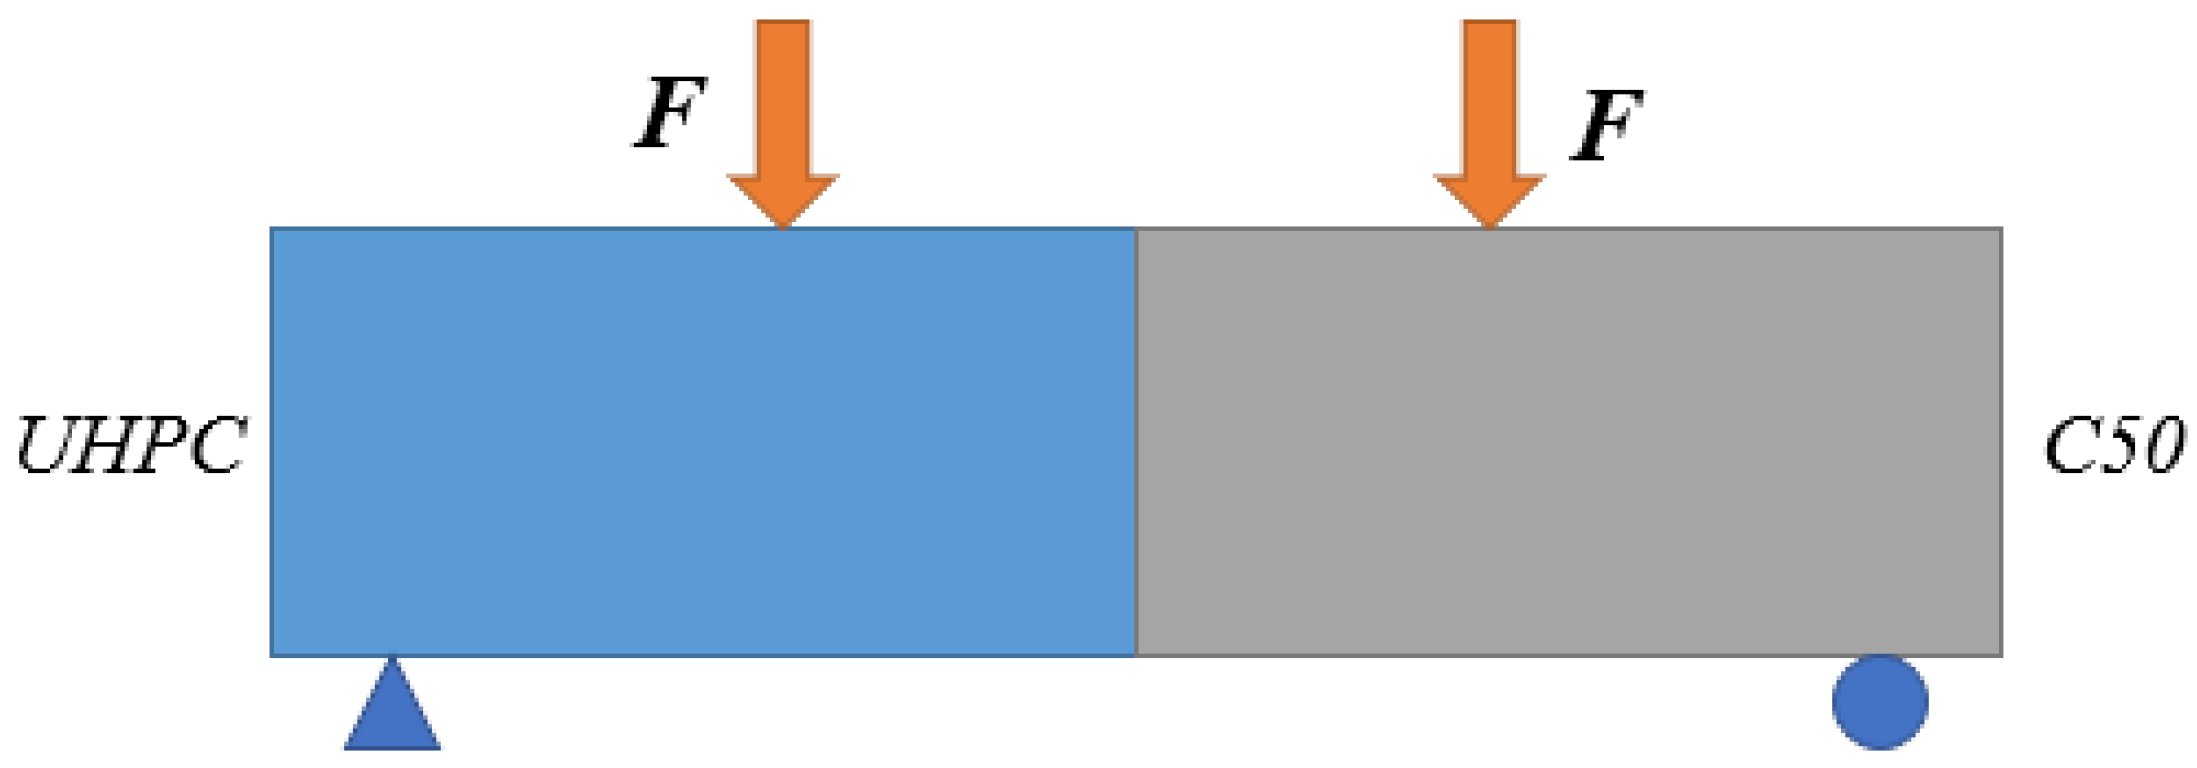
2.2.2. Flexural Tensile Tests
Specimen Design
Load
Failure Type
| Number | Failure type |
| I | flexural tensile failure of UHPC side |
| II | flexural tensile failure of interface |
| III | flexural tensile failure of concrete side |
Flexural Tensile Strength
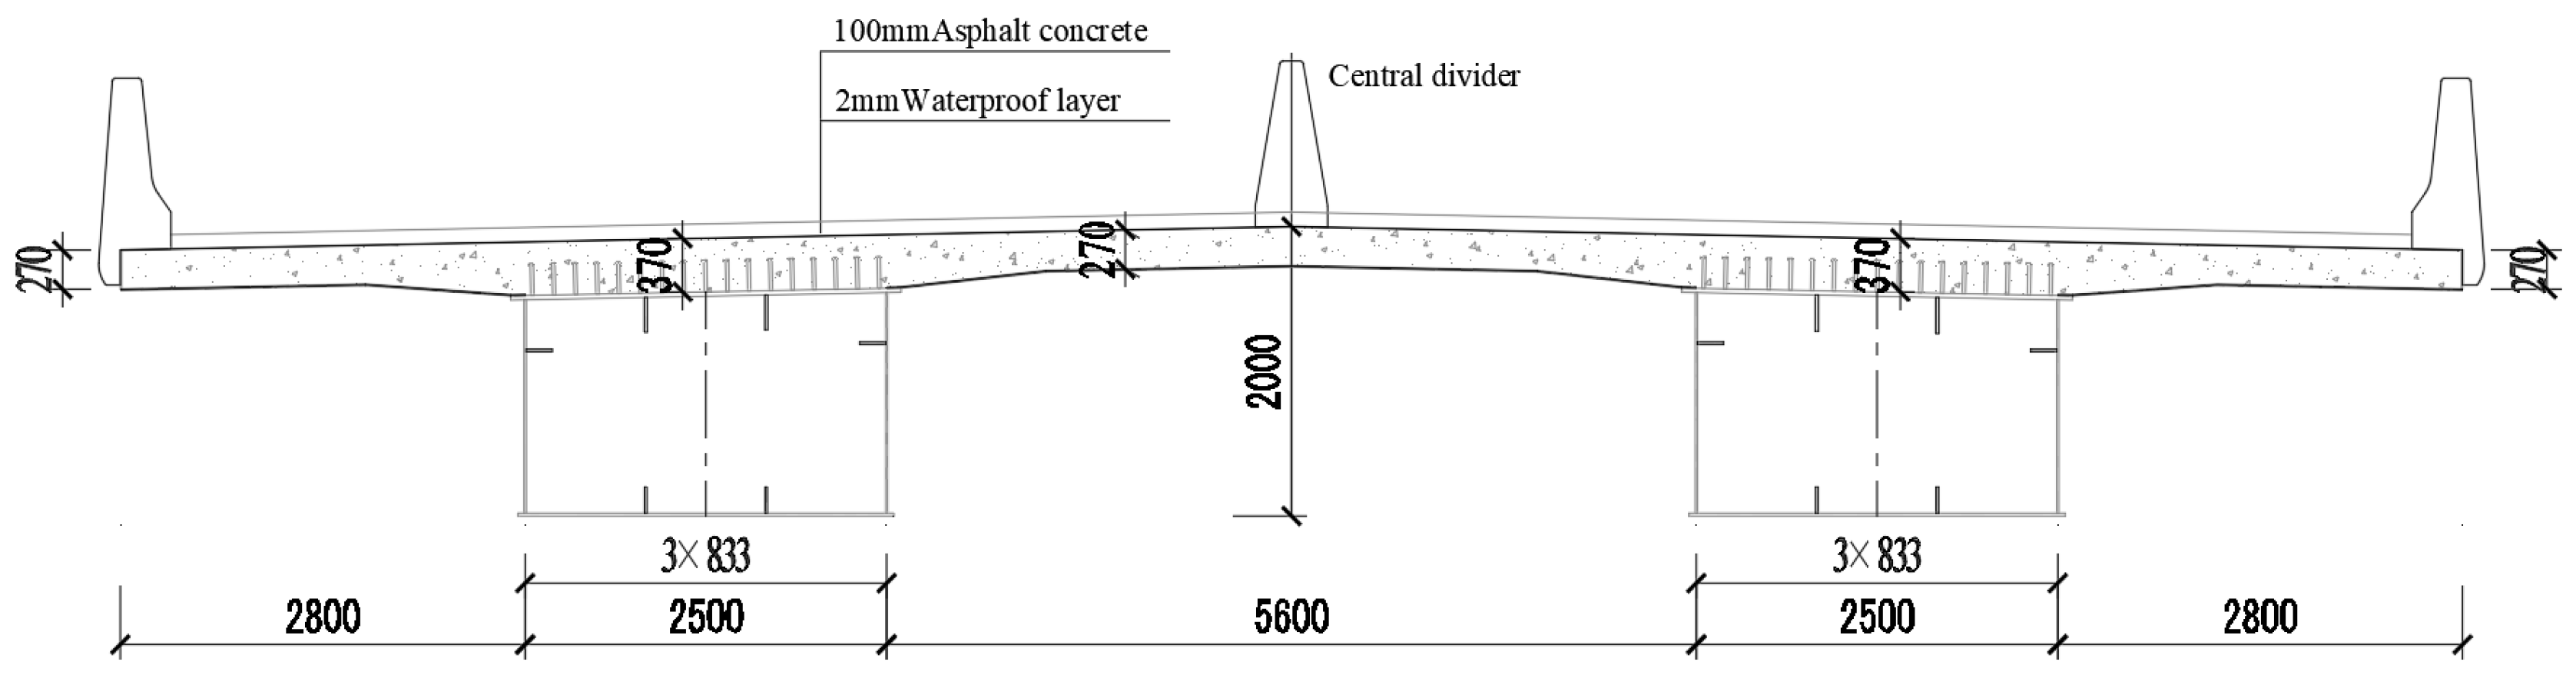
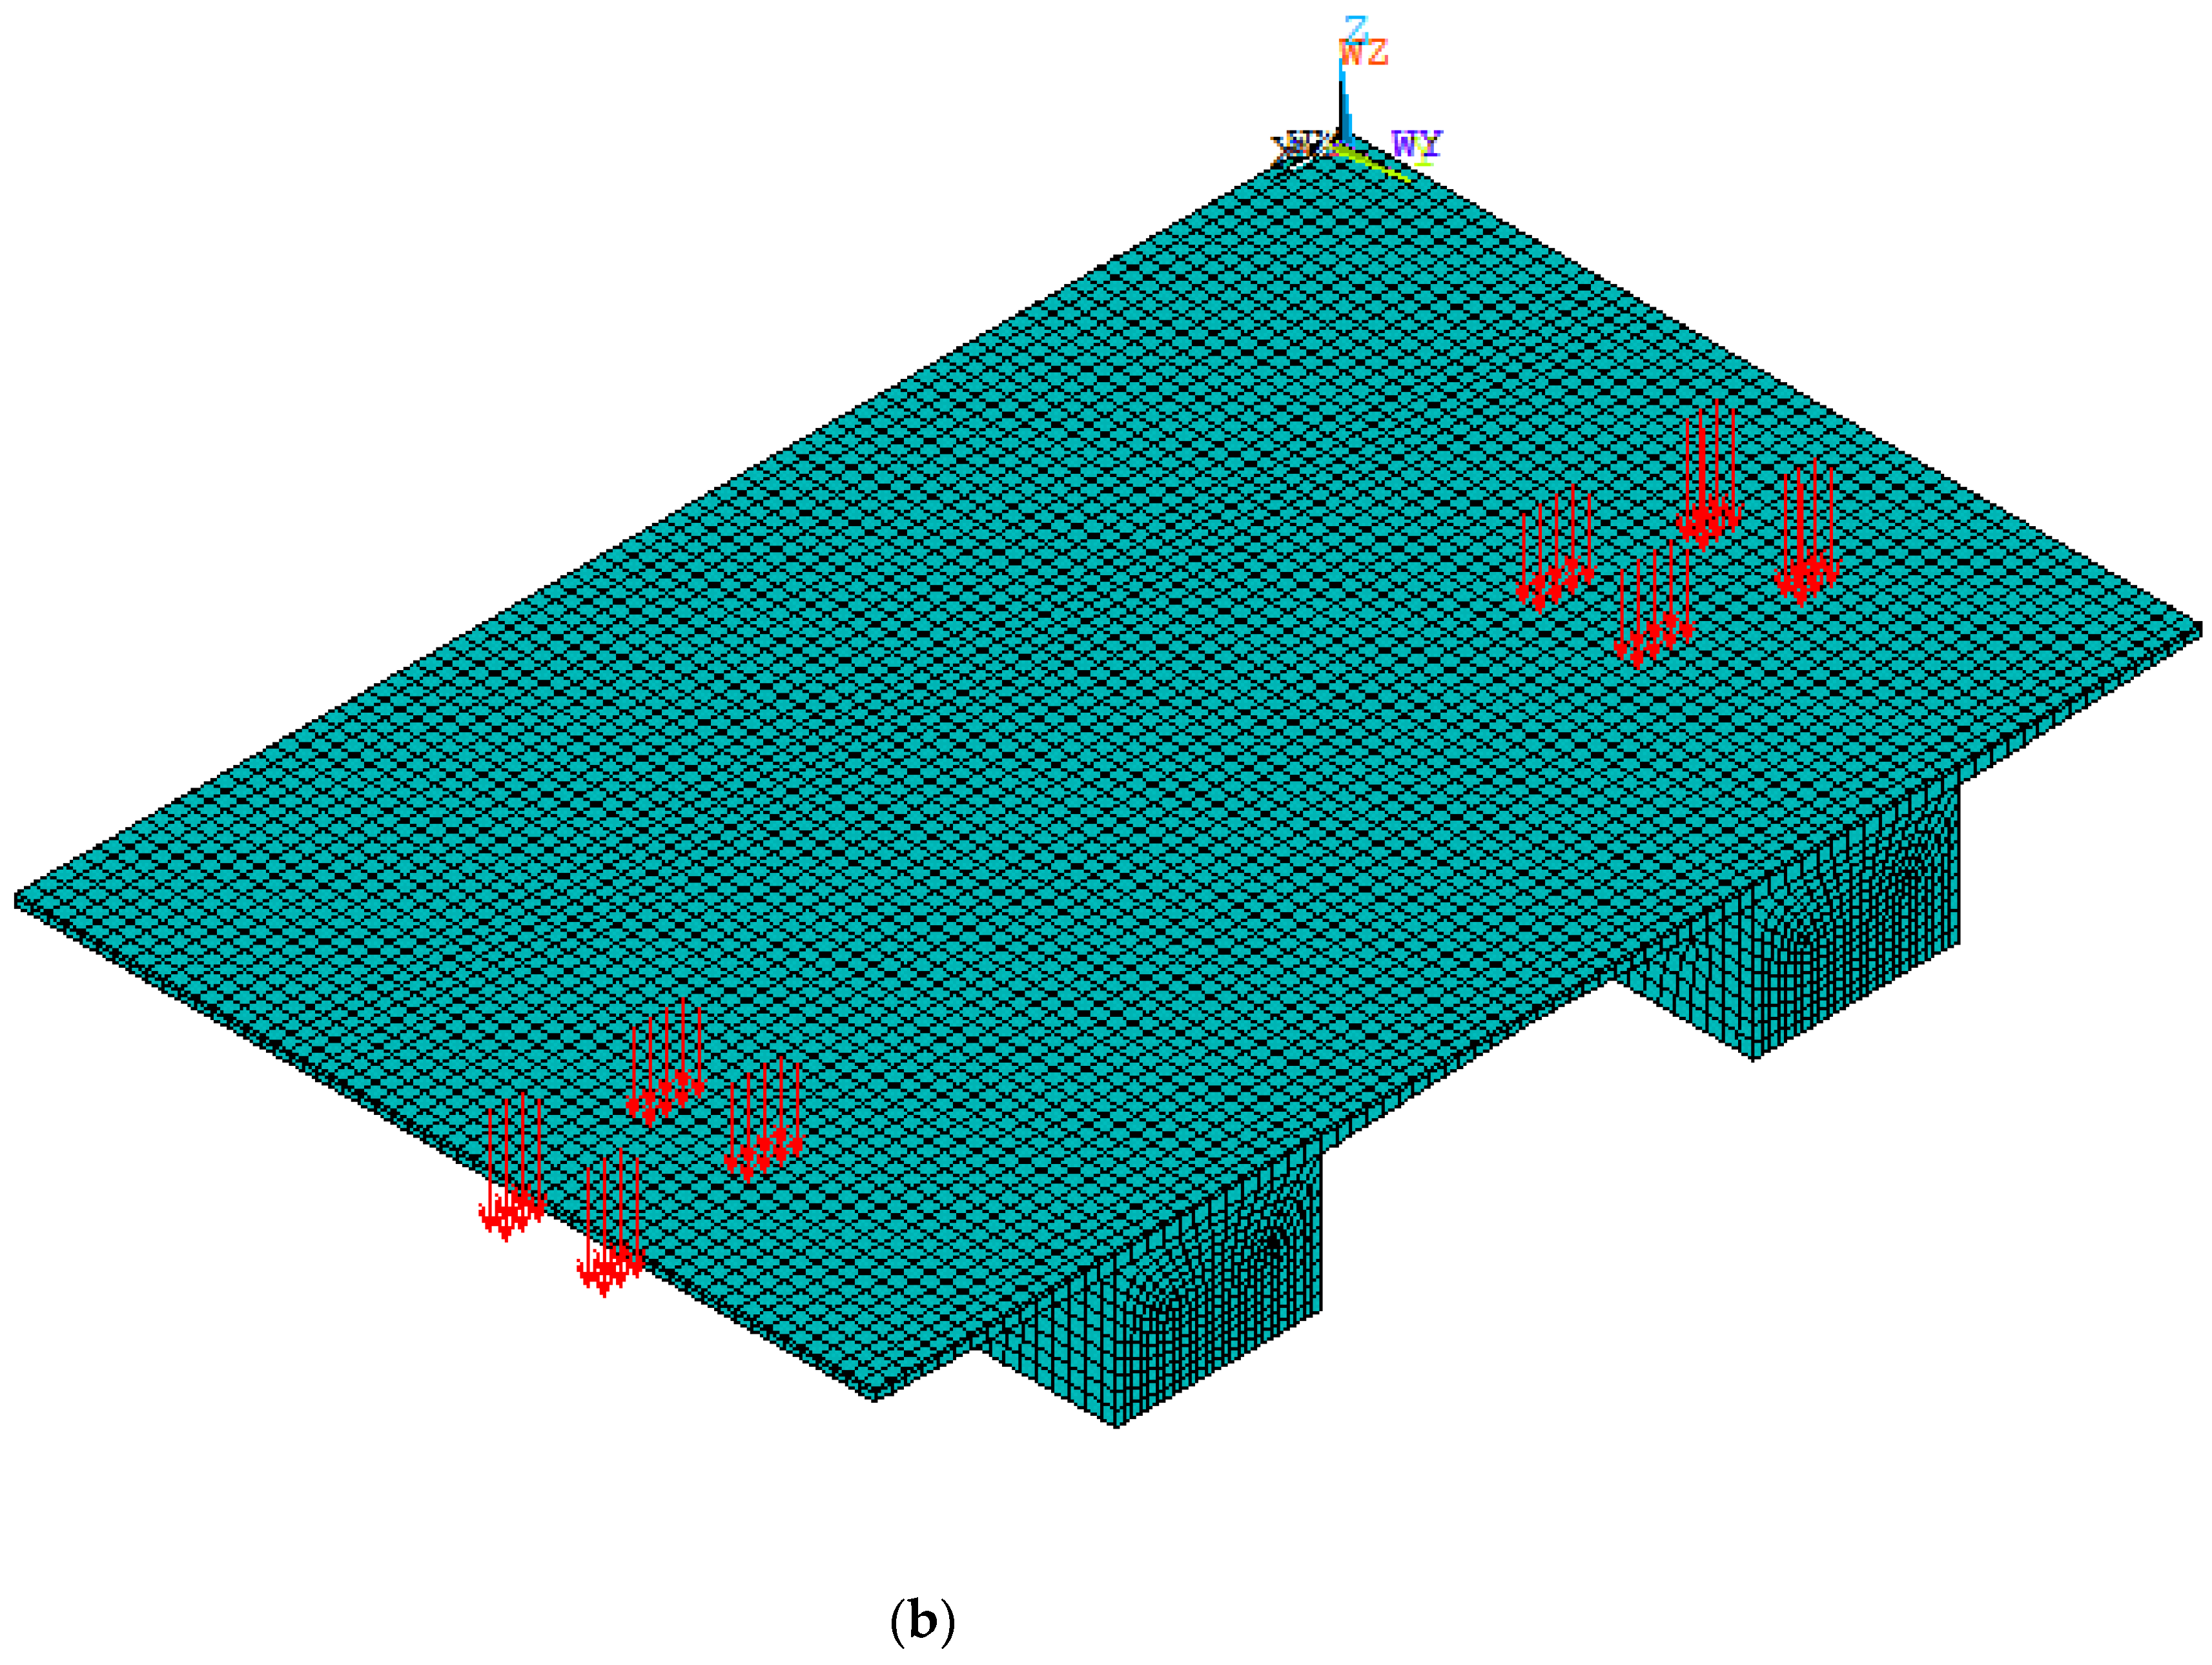
3. Finite Model
3.1. Specimen Design
3.2. Element Election
3.3. Materials
3.4. Interface
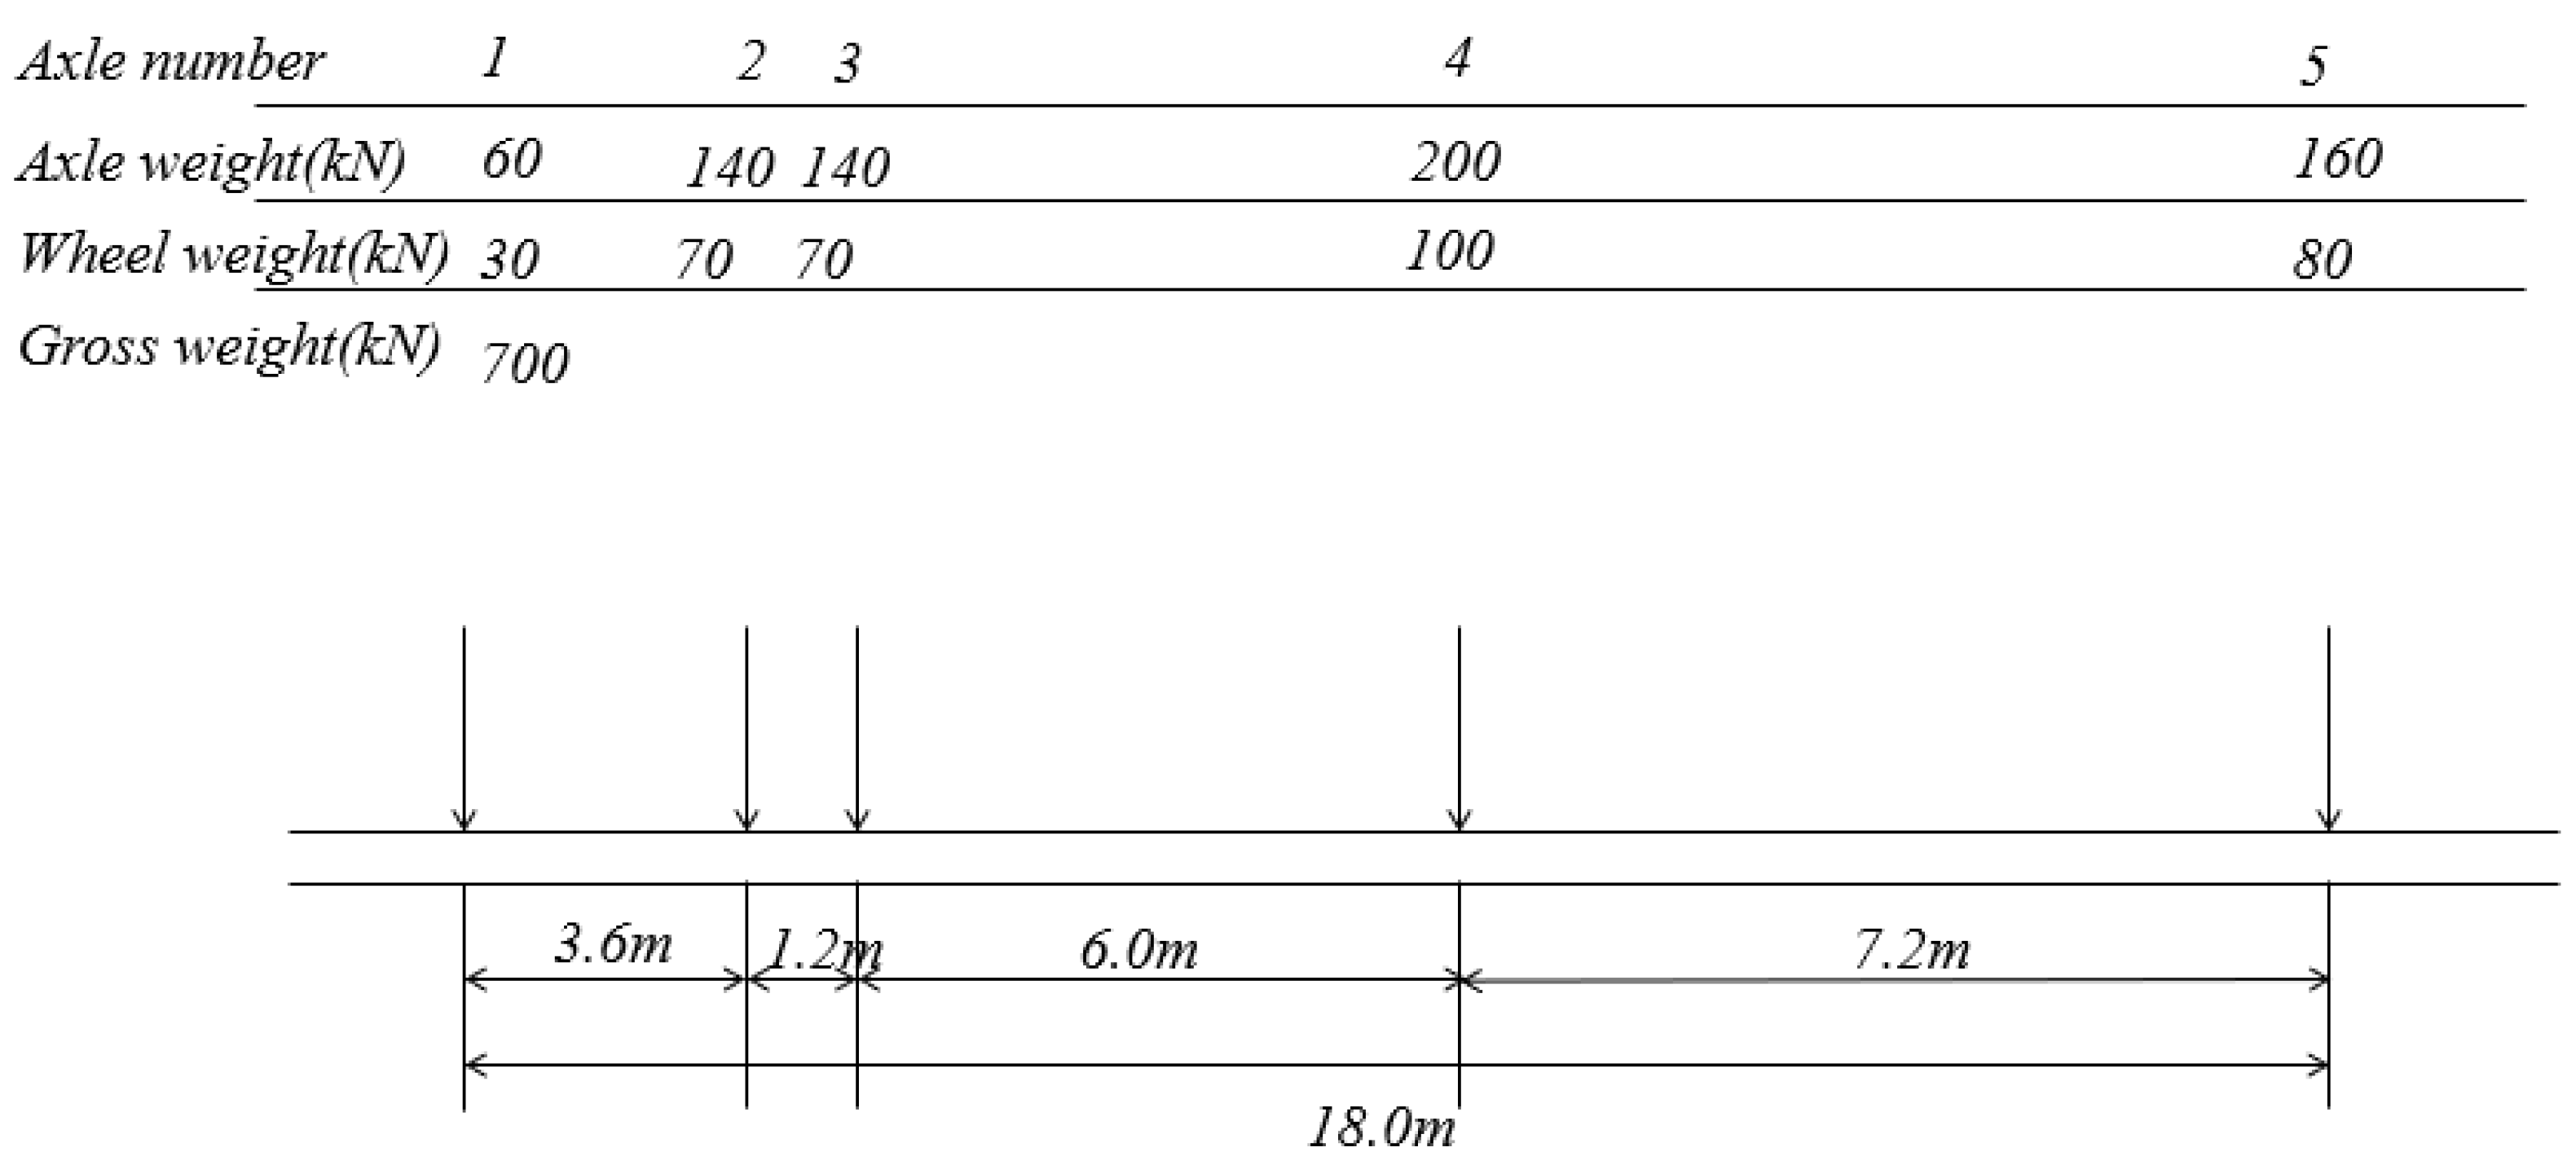
3.5. Load
4. Parametric Analysis
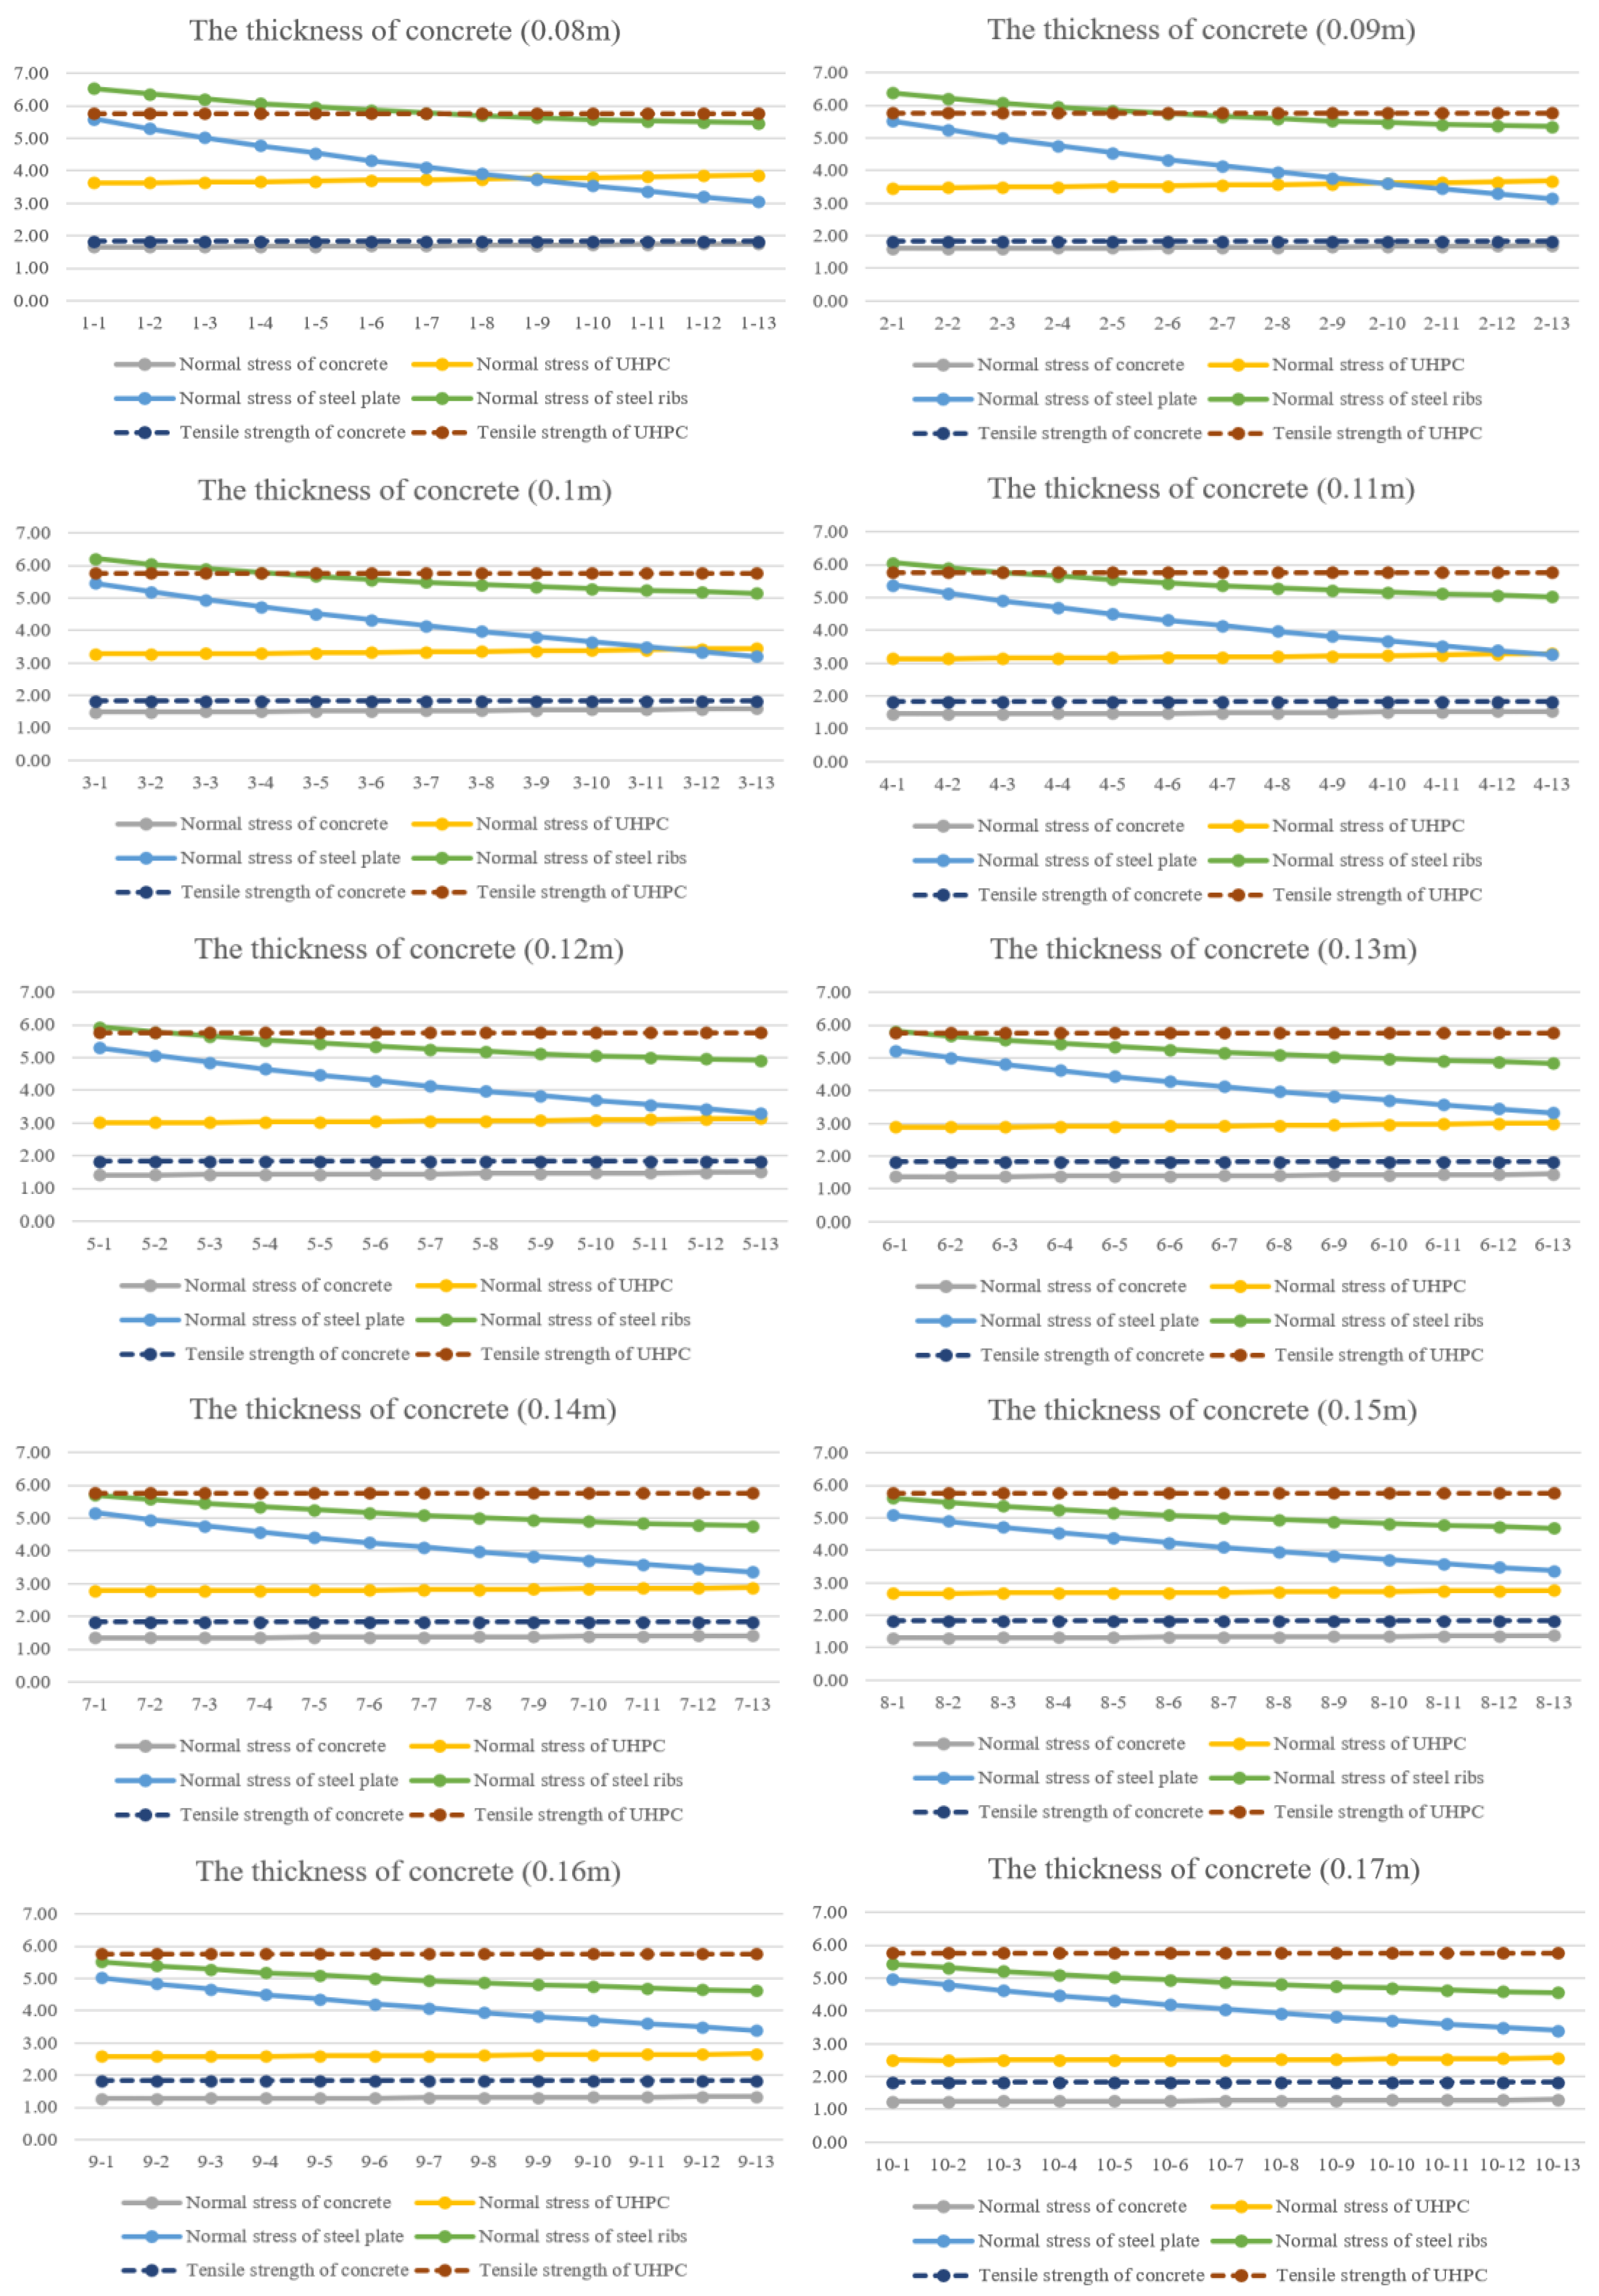
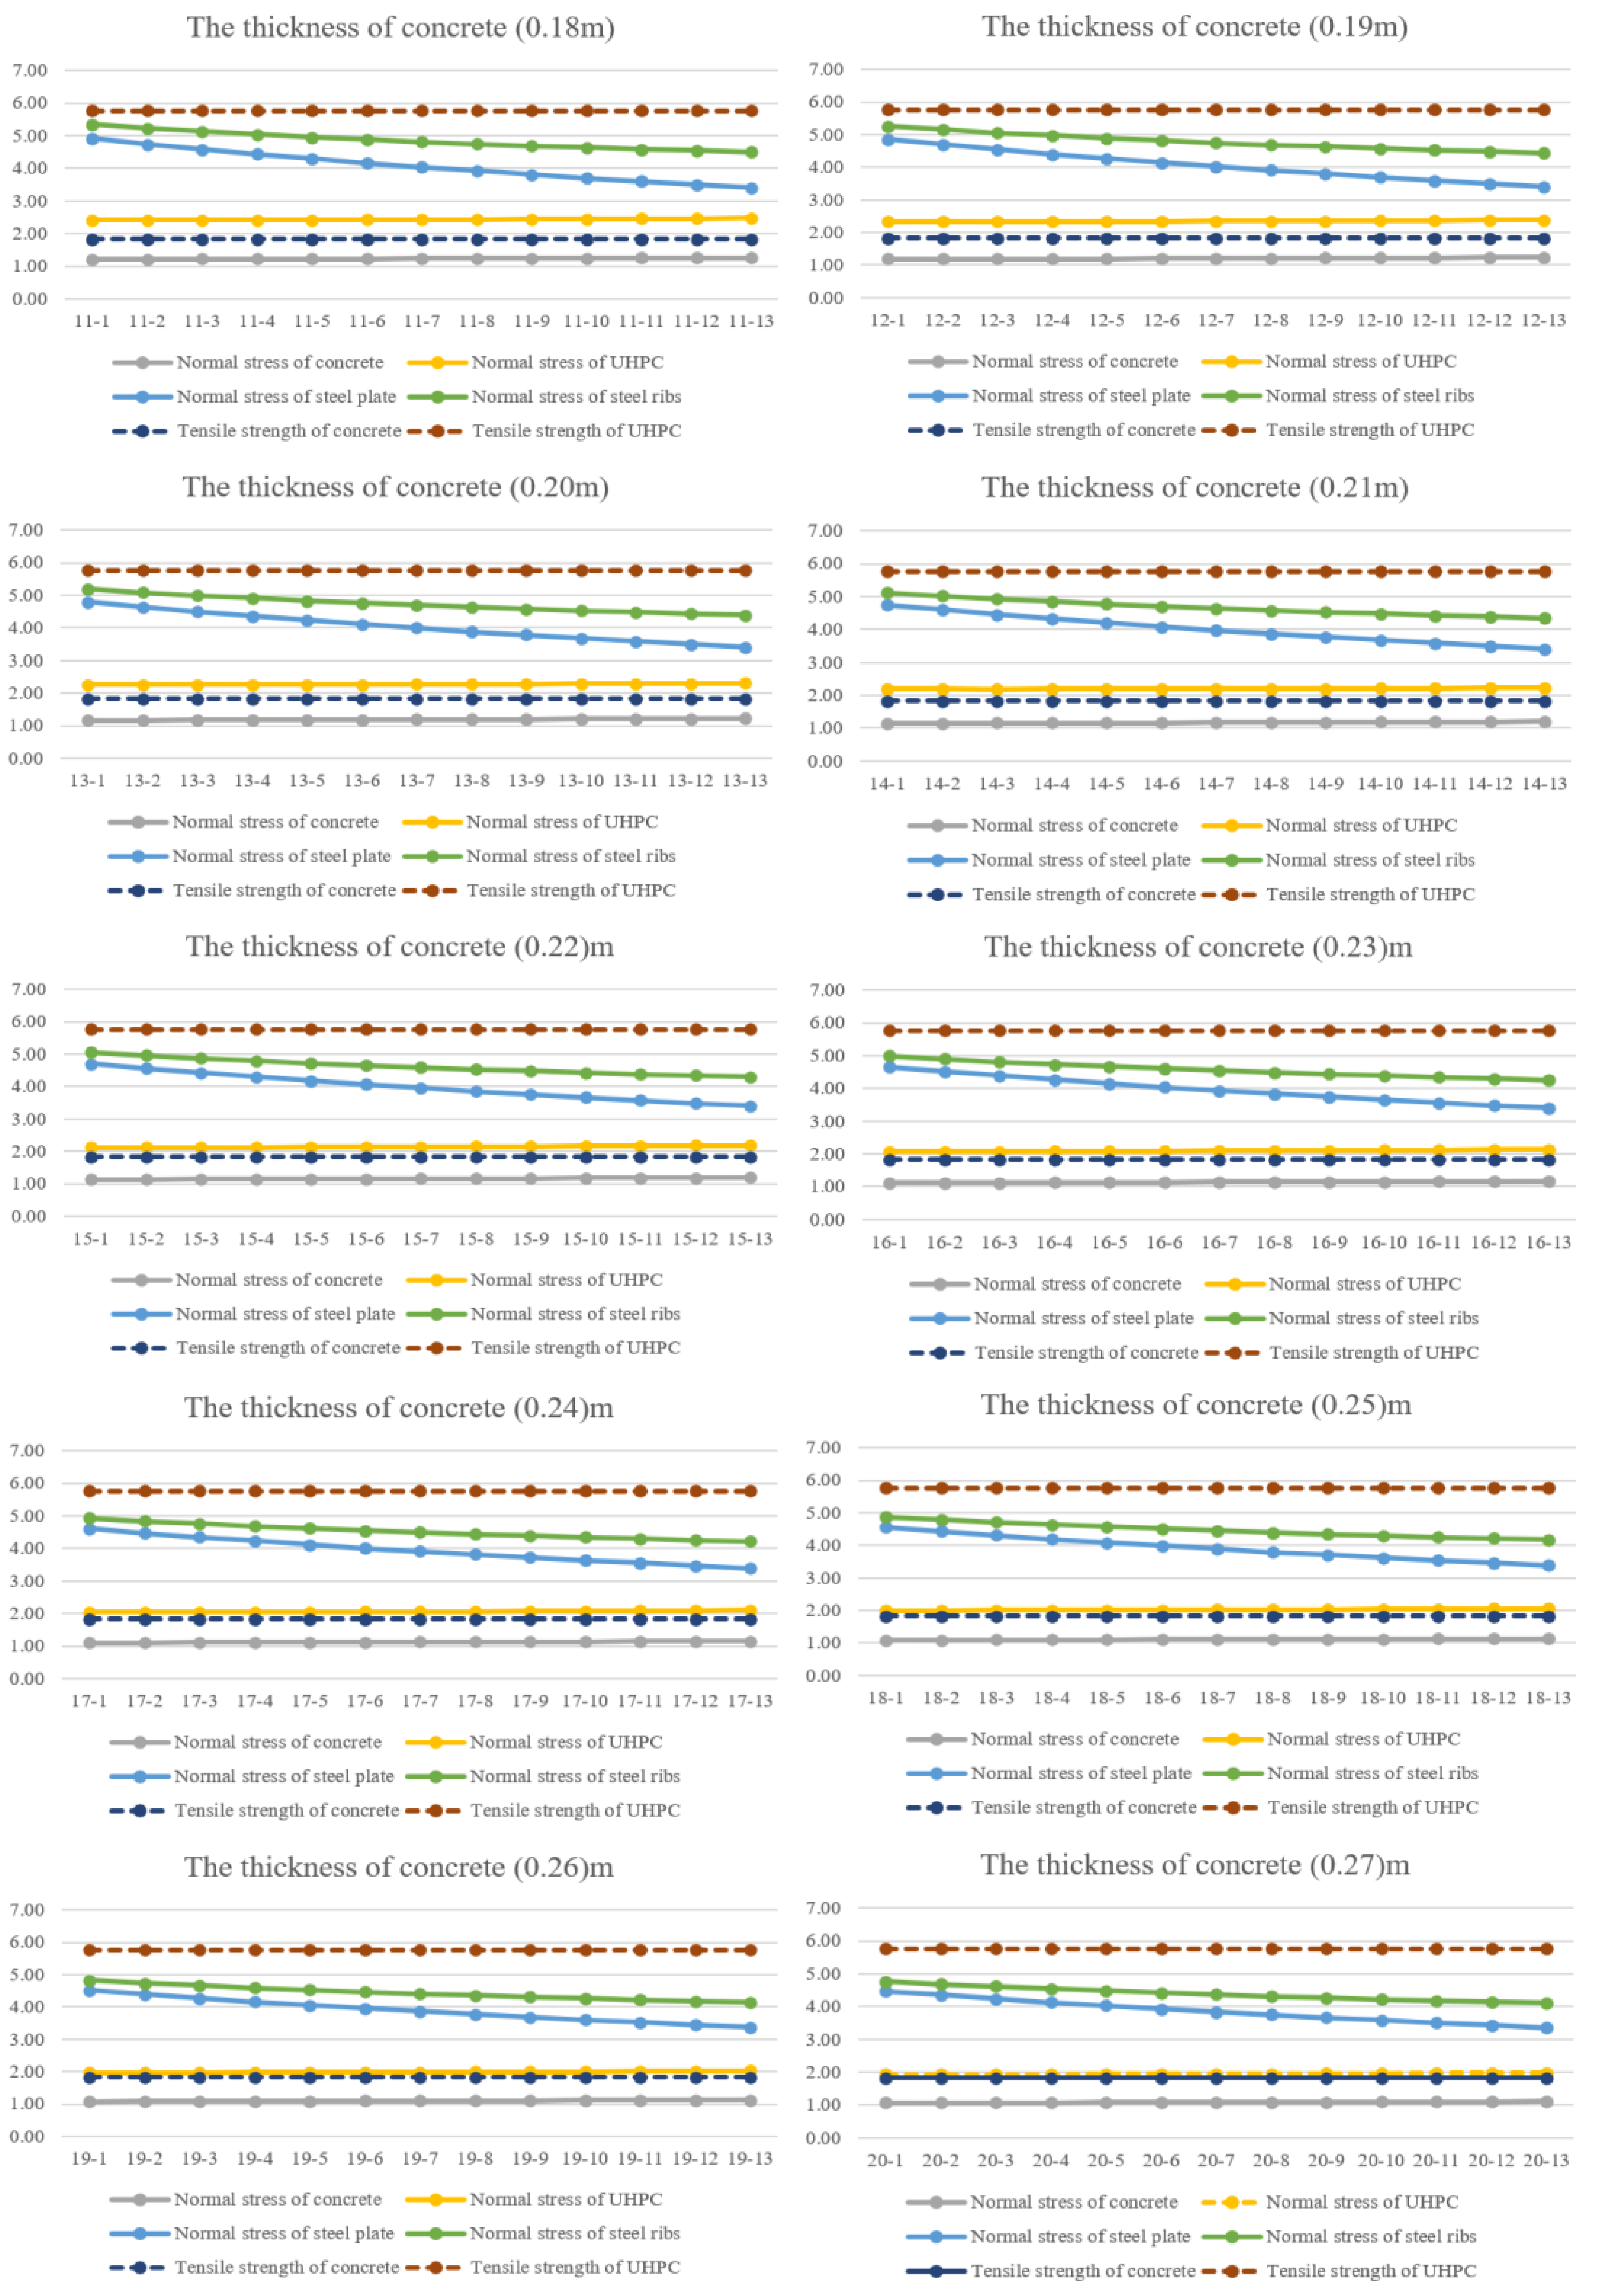
4.1. Concrete
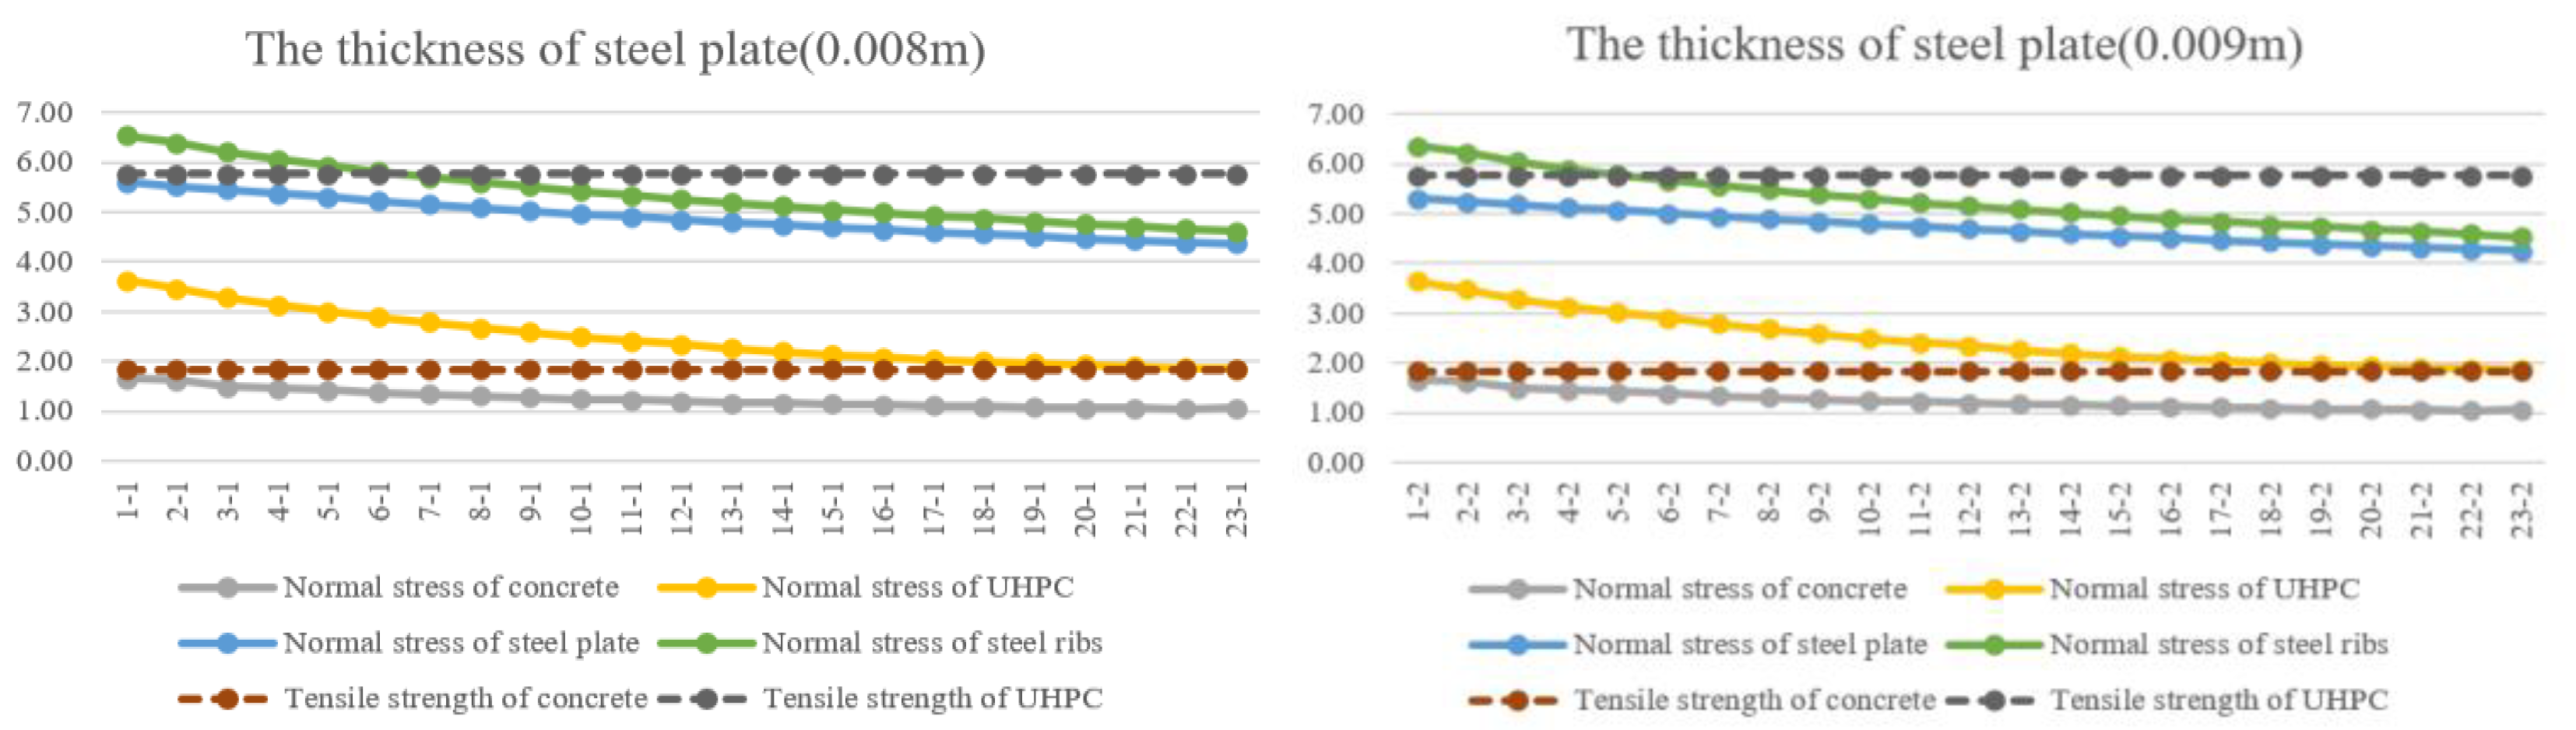
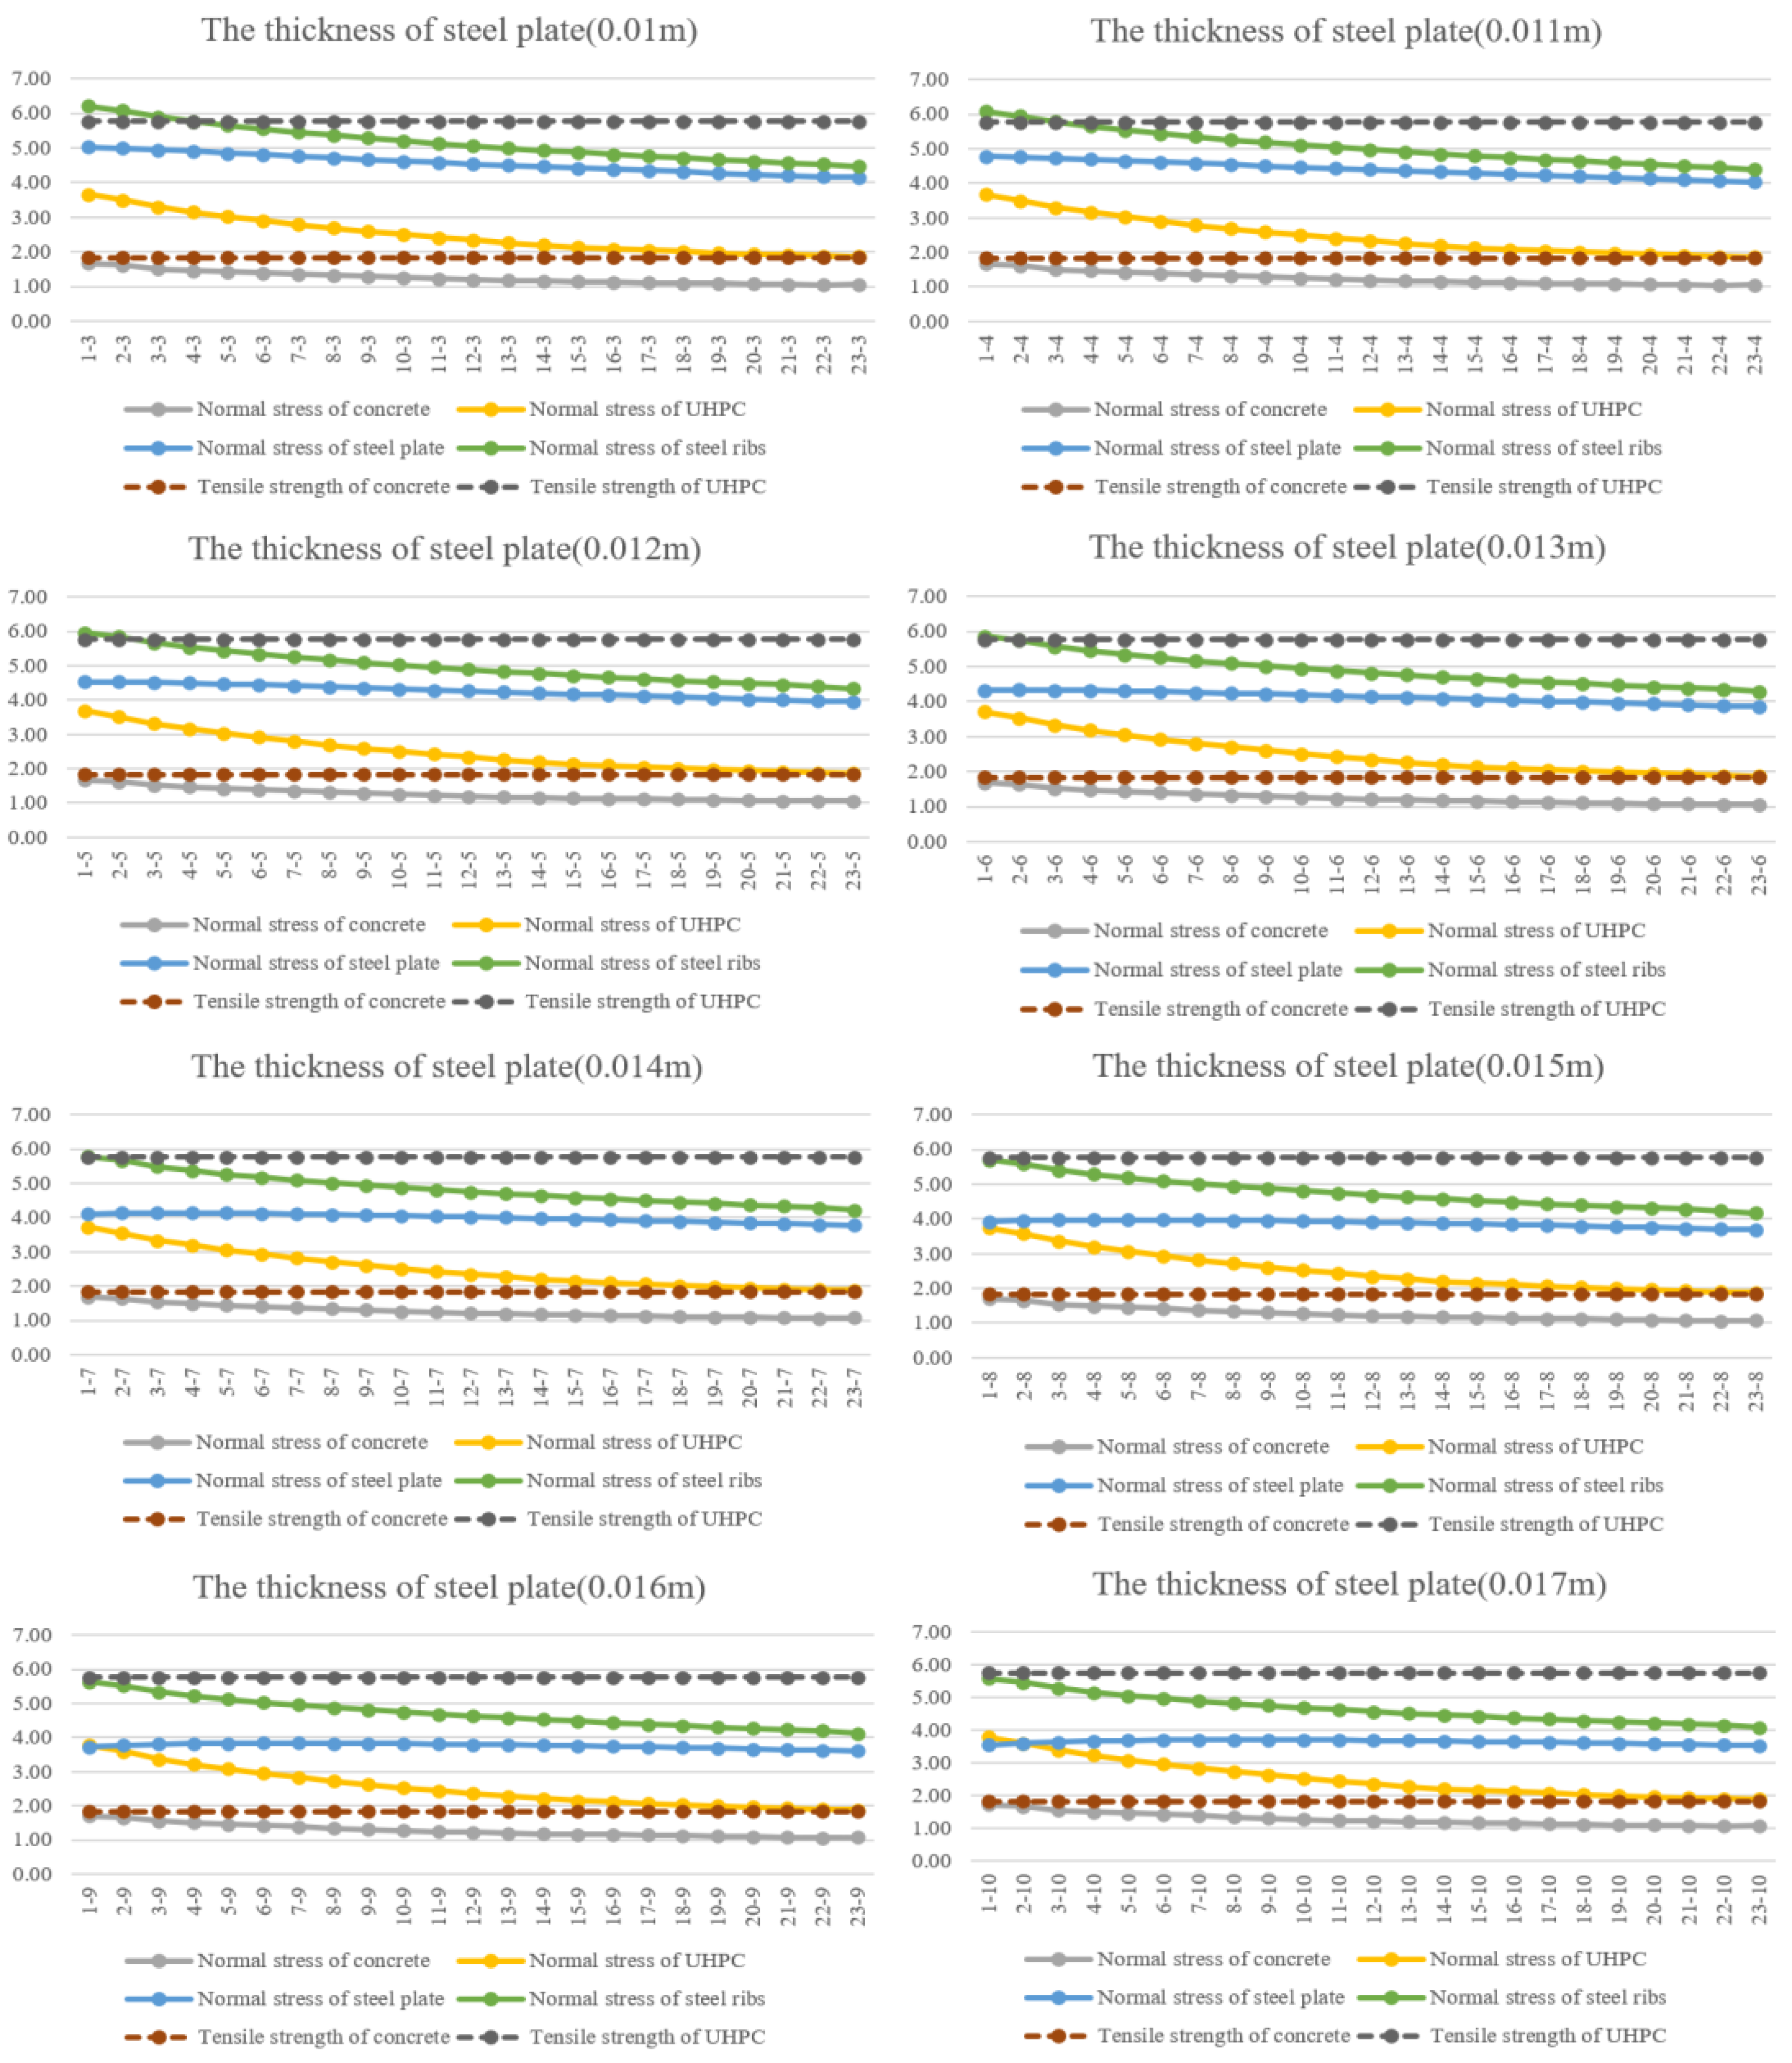
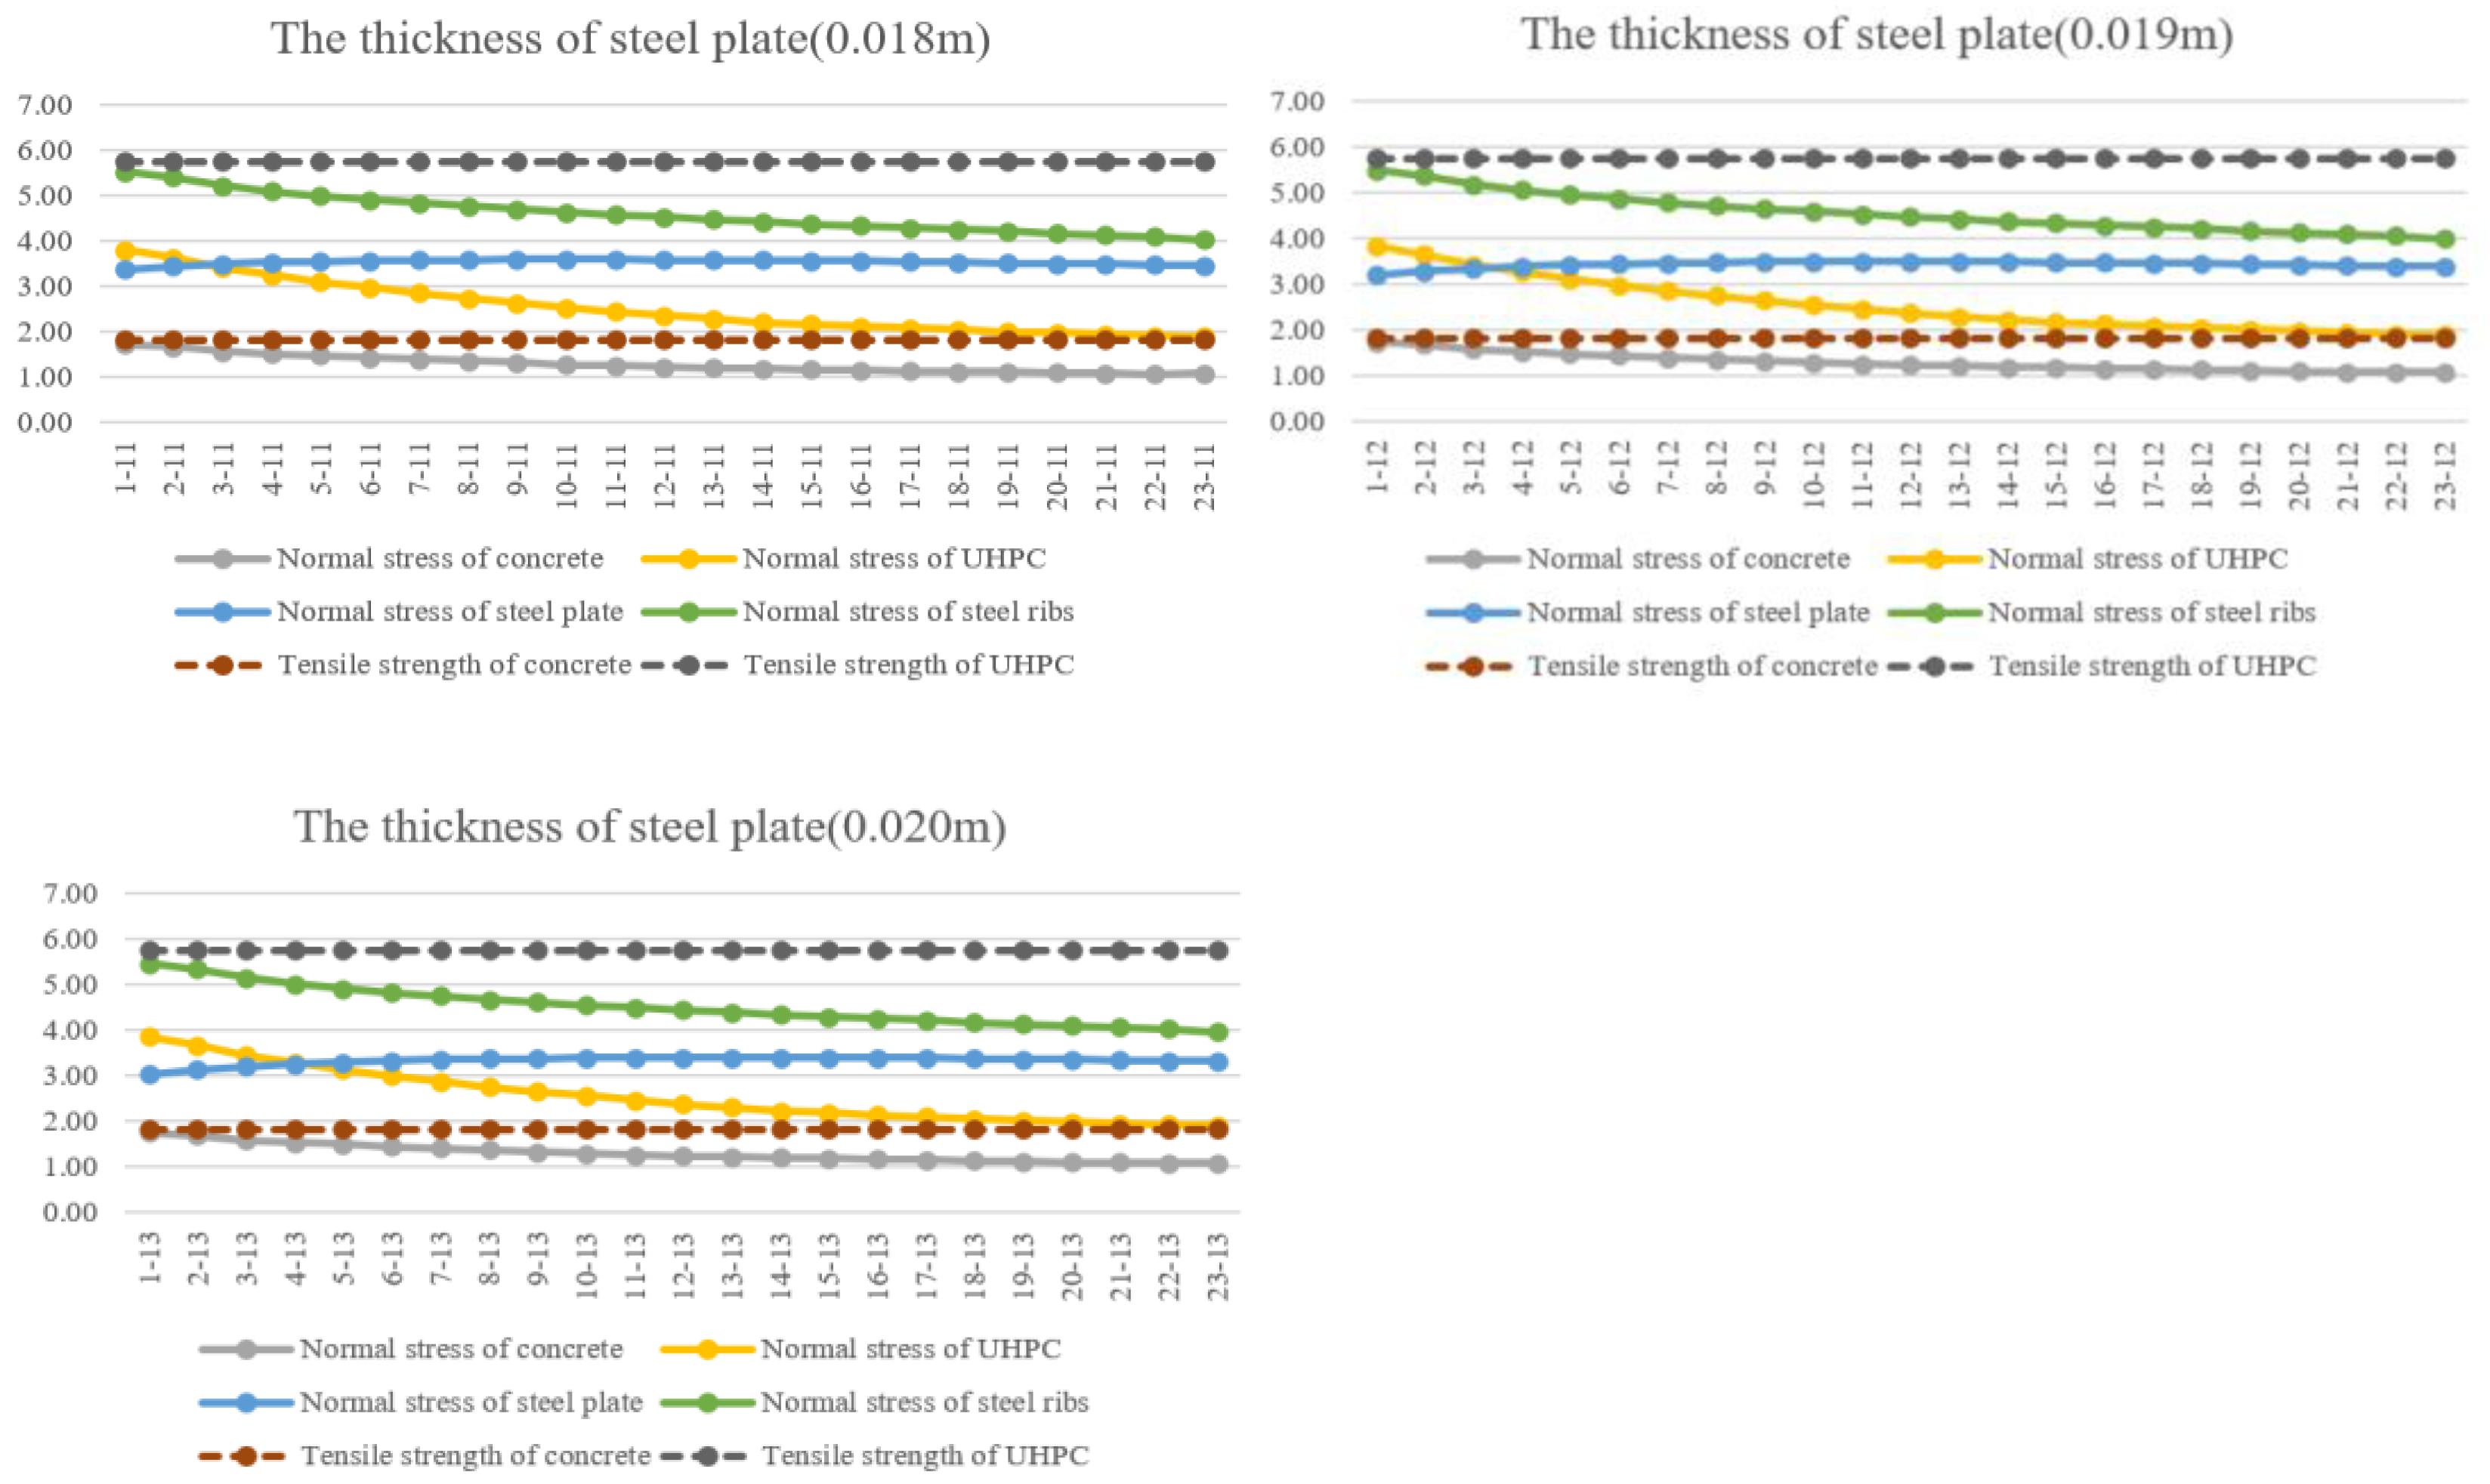
4.2. Steel Plate
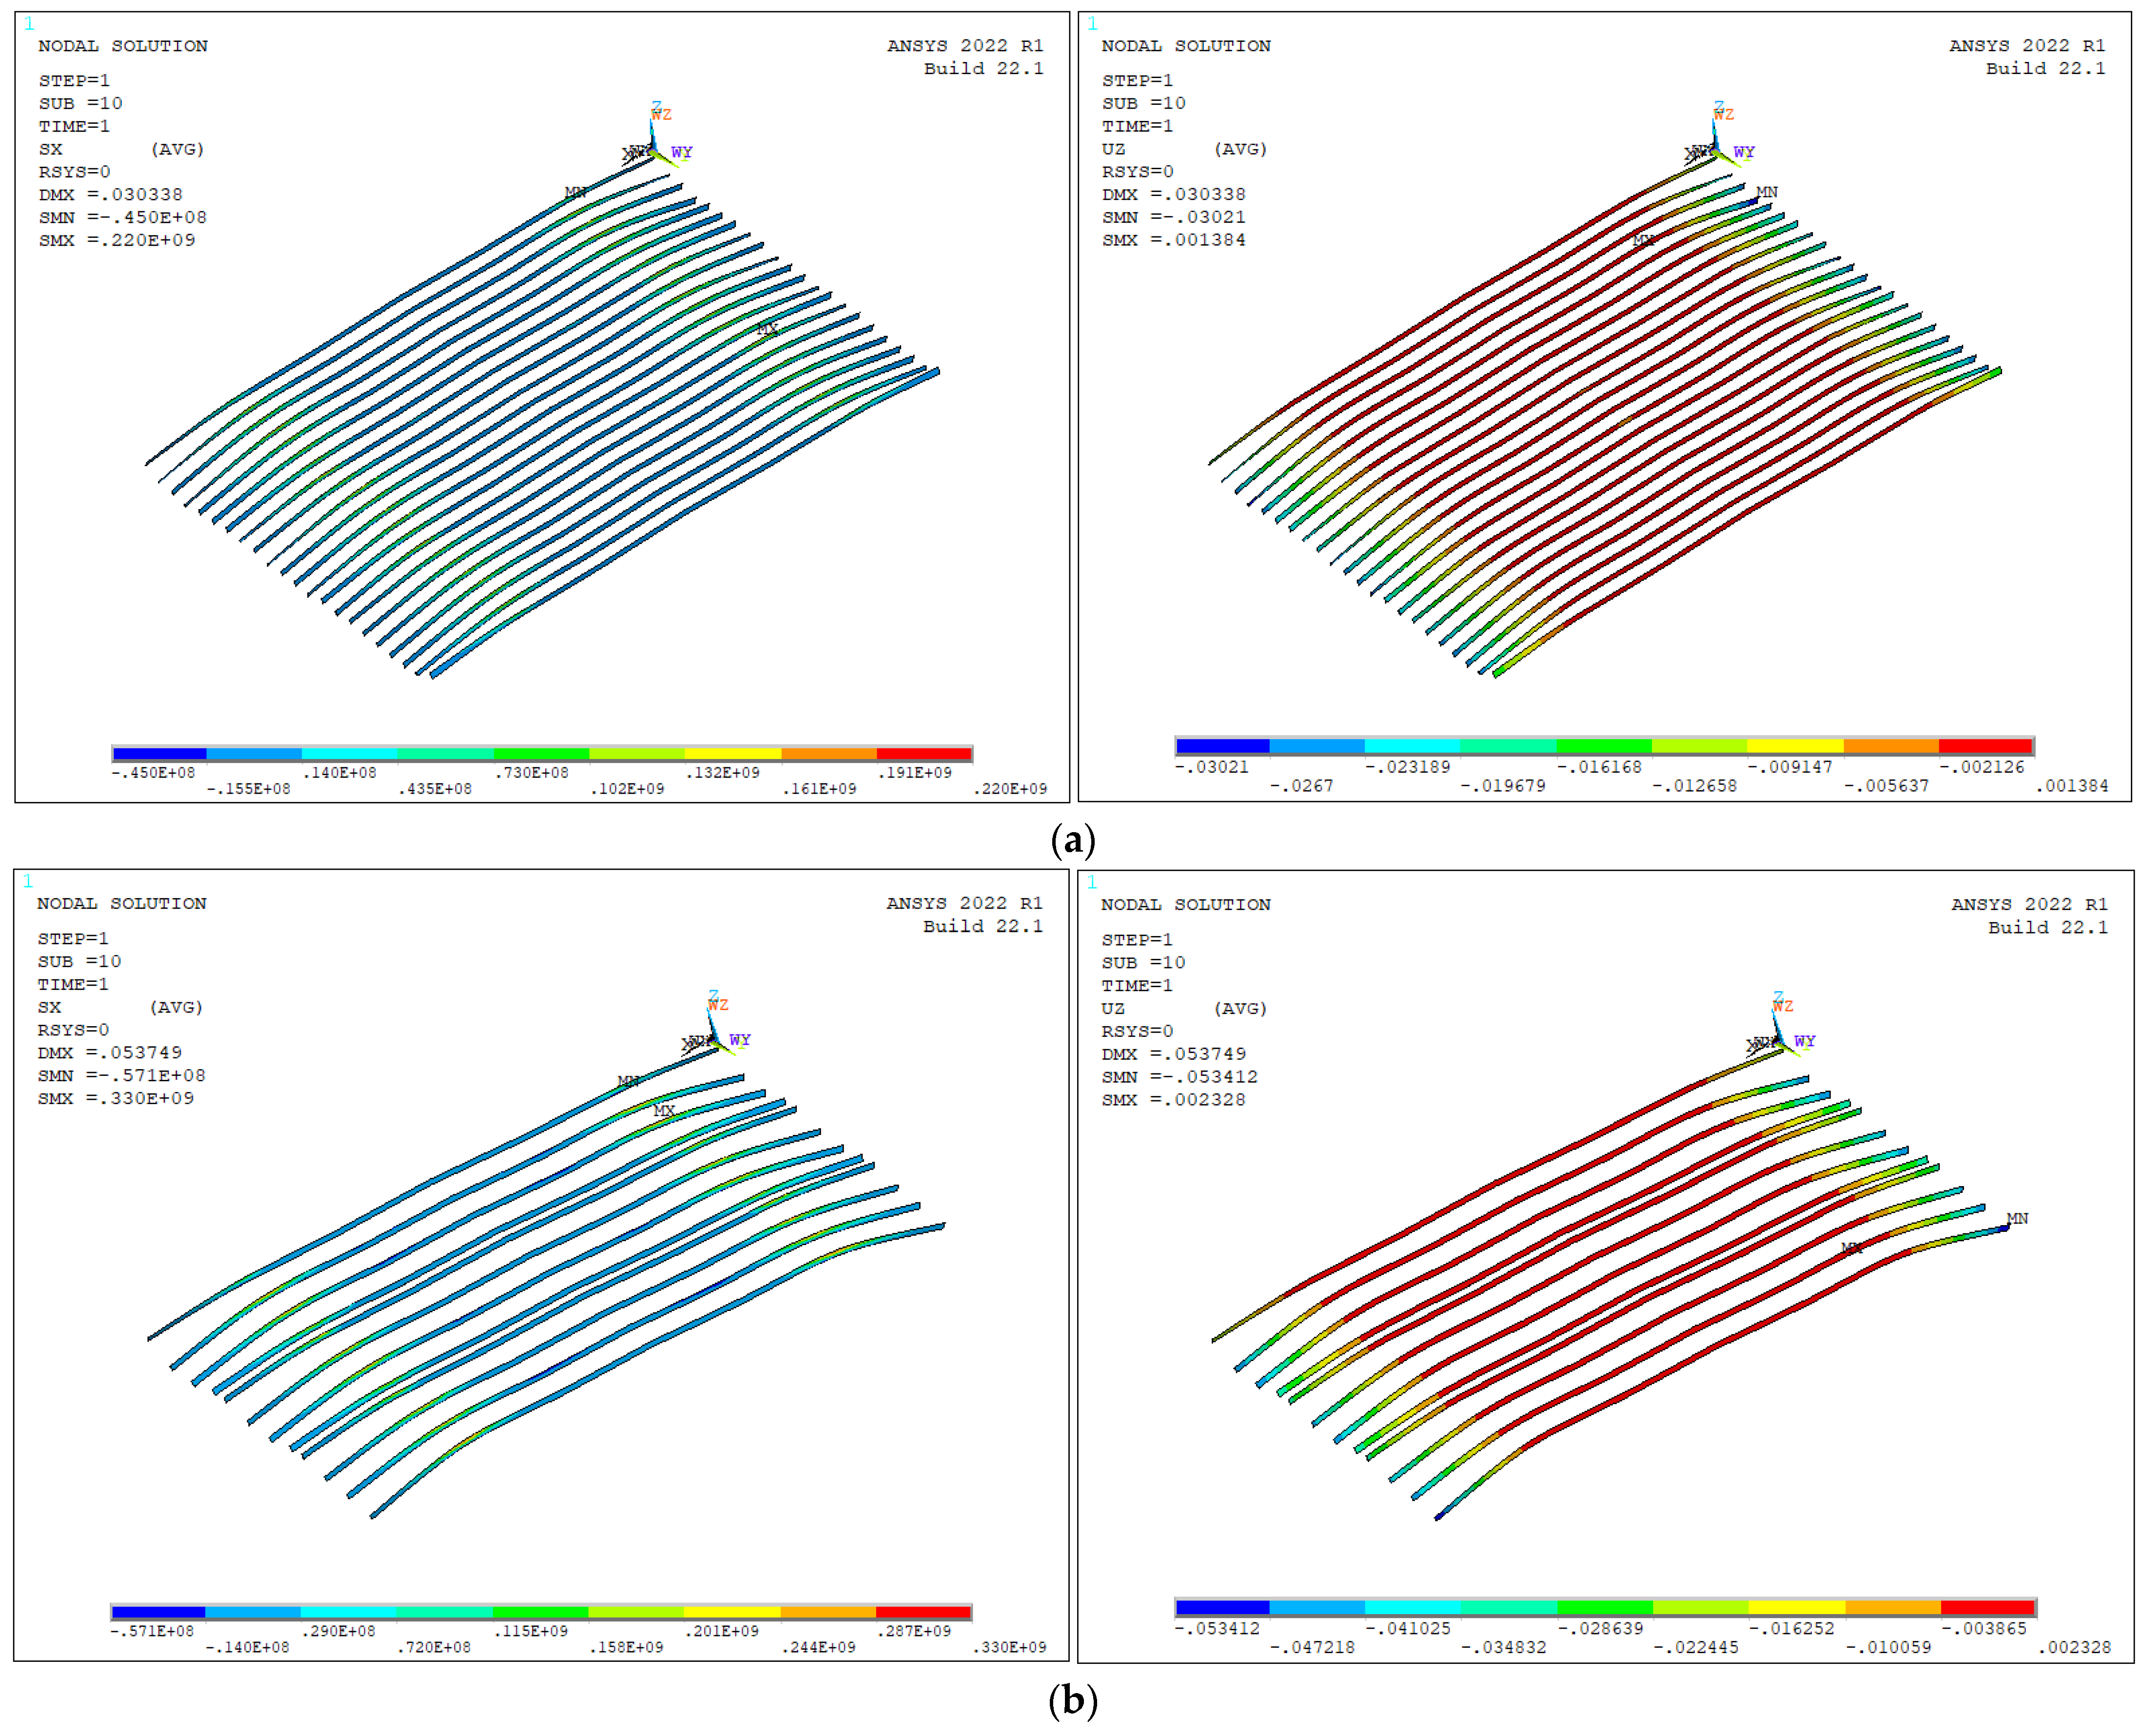
4.3. The Interval of Steel Ribs
5. Conclusions and Suggestions
- (1)
- Chiseling interface prohibits the occurrence of interface failure and can be applied in the engineering. There is only slight interface damage to the chiseling surface based on the results of slant shear tests and flexural shear tests, which meets the needs of physical engineering.
- (2)
- The phenomenon in the slant shear tests and flexural tensile tests is similar, which can reflect the interface bonding performance. Compared with direct shear tests and pull-out tests, it is easy to conduct slant shear tests and flexural tensile tests.
- (3)
- The thickness of concrete, steel plate has a huge influence on the normal use of composite slabs. The normal stress of UHPC, concrete and steel plate will decrease with the increase in the thickness of concrete and steel plate. Besides, reducing the interval of steel ribs can effectively improve the flexural performance and decrease the stress of UHPC, concrete and steel plate.
Author Contributions
Funding
Institutional Review Board Statement
Informed Consent Statement
Data Availability Statement
Acknowledgments
Conflicts of Interest
References
- Zhao, H.; Yuan, Y. Experimental studies on composite beams with high-strength steel and concrete. Steel Compos. Struct. 2010, 10, 373–383. [Google Scholar] [CrossRef]
- Fragiacomo, M.; Amadio, C.; Macorini, L. Finite-Element Model for Collapse and Long-Term Analysis of Steel–Concrete Composite Beams. J. Struct. Eng. 2004, 130, 489–497. [Google Scholar] [CrossRef]
- Wille, K.; Naaman, A.E.; El-Tawil, S.; Parra-Montesinos, G.J. Ultra-high performance concrete and fiber reinforced concrete: Achieving strength and ductility without heat curing. Mater. Struct. 2012, 45, 309–324. [Google Scholar] [CrossRef]
- Amran, M.; Huang, S.-S.; Onaizi, A.M.; Makul, N.; Abdelgader, H.S.; Ozbakkaloglu, T. Recent trends in ultra-high performance concrete (UHPC): Current status, challenges, and future prospects. Constr. Build. Mater. 2022, 352, 129029. [Google Scholar] [CrossRef]
- Azmee, N.M.; Shafiq, N. Ultra-high performance concrete: From fundamental to applications. Case Stud. Constr. Mater. 2018, 9, e00197. [Google Scholar] [CrossRef]
- Schmidt, M.; Fehling, E. Ultra-high-performance concrete: Research, development and application in Europe. ACI Spec. Publ. 2005, 228, 51–78. [Google Scholar]
- Bajaber, M.; Hakeem, I. UHPC evolution, development, and utilization in construction: A review. J. Mater. Res. Technol. 2021, 10, 1058–1074. [Google Scholar] [CrossRef]
- Ambily, P.S.; Ravisankar, K.; Umarani, C.; Dattatreya, J.K.; Iyer, N.R. Development of ultra-high-performance geopolymer concrete. Mag. Concr. Res. 2014, 66, 82–89. [Google Scholar] [CrossRef]
- Bouchard, D.; Sanchez, T.; Sorelli, L.; Conciatori, D. Development of Eco-Efficient UHPC and UHPFRC by Recycling Granite Waste Powder (GWP). In Fibre Reinforced Concrete: Improvements and Innovations II: X RILEM-fib International Symposium on Fibre Reinforced Concrete (BEFIB) 2021; Springer: Berlin/Heidelberg, Germany, 2022. [Google Scholar]
- von Werder, J.; Simon, S.; Gardei, A.; Fontana, P.; Meng, B. Thermal and hydrothermal treatment of UHPC: Influence of the process parameters on the phase composition of ultra-high performance concrete. Mater. Struct. 2021, 54, 44. [Google Scholar] [CrossRef]
- Alsalman, A.; Dang, C.N.; Martí-Vargas, J.R.; Hale, W.M. Mixture-proportioning of economical UHPC mixtures. J. Build. Eng. 2019, 27, 100970. [Google Scholar] [CrossRef]
- Meng, W.; Valipour, M.; Khayat, K.H. Optimization and performance of cost-effective ultra-high performance concrete. Mater. Struct. 2017, 50, 29. [Google Scholar] [CrossRef]
- Xue, J.; Briseghella, B.; Huang, F.; Nuti, C.; Tabatabai, H.; Chen, B. Review of ultra-high performance concrete and its application in bridge engineering. Constr. Build. Mater. 2020, 260, 119844. [Google Scholar] [CrossRef]
- Haber, Z.B. Improving Bridge Preservation With UHPC. Public Roads 2021, 84, 4. [Google Scholar]
- Gunes, O.; Yesilmen, S.; Gunes, B.; Ulm, F.-J. Use of UHPC in Bridge Structures: Material Modeling and Design. Adv. Mater. Sci. Eng. 2012, 2012, 319285. [Google Scholar] [CrossRef] [Green Version]
- Yang, J.; Xia, J.; Cheng, C.; Wang, J.; Zhang, J.; Wang, G. Research on the Bonding Performance of UHPC–NC Interfaces with Different Sizes of Grooves. Front. Mater. 2022, 9, 859717. [Google Scholar] [CrossRef]
- Zhang, Y.; Zhu, P.; Wang, X.; Wu, J. Shear properties of the interface between ultra-high performance concrete and normal strength concrete. Constr. Build. Mater. 2020, 248, 118455. [Google Scholar] [CrossRef]
- Feng, S.; Xiao, H.; Ma, M.; Zhang, S. Experimental study on bonding behaviour of interface between UHPC and concrete substrate. Constr. Build. Mater. 2021, 311, 125360. [Google Scholar] [CrossRef]
- Zhang, B.; Yu, J.; Chen, W.; Liu, H.; Li, H.; Guo, H. Experimental Study on Bond Performance of NC-UHPC Interfaces with Different Roughness and Substrate Strength. Materials 2023, 16, 2708. [Google Scholar] [CrossRef]
- Zhao, Y.-C.; Lei, H.-G.; Guo, L.-K.; Lu, G.-Y. Experimental Investigation on Interface Performance of UHPC-Strengthened NC Structure through Push-Out Tests. Materials 2023, 16, 1766. [Google Scholar] [CrossRef] [PubMed]
- ACI 546R-14; Guide to Concrete Repair. American Concrete Institutue: Farmington Hills, MI, USA, 2014.
- G.T. Standard for Test Methods of Concrete Physical and Mechanical Properties; China Architecture & Building Press: Beijing, China, 2019.
- Nascimbene, R. Penalty partial reduced selective integration: A new method to solve locking phenomena in thin shell steel and concrete structures. Curved Layer. Struct. 2022, 9, 352–364. [Google Scholar] [CrossRef]


| Materials | Cement | Mineral Powder | Fly Ash | Water | Sand | Rock | Admixture |
|---|---|---|---|---|---|---|---|
| Specification/Grade/Model | P.O42.5 | S95 | CII | / | medium sand | 5–25 mm | ZWL-A-1X |
| mix ratio | 1 | 0.2 | 0.09 | 0.45 | 1.69 | 2.88 | 0.013 |
| Materials | Water (kg) | Premix (kg) | Steel Fiber (kg) | Admixture (kg) |
|---|---|---|---|---|
| UHPC/m3 | 177.3 | 2221.65 | 200 | 19.5 |
| Number | Type | Value |
|---|---|---|
| 1 | Tensile strength (MPa) | 2967 |
| 2 | Length (mm) | 12.99 |
| 3 | Equivalent diameter (mm) | 0.2 |
| 4 | Length/equivalent diameter (mm) | 65 |
| Number | Interface Handling | Peak Load (kN) | Nominal Shear Stress (MPa) | Shear Stress (MPa) | Normal Stress (MPa) | Failure Type |
|---|---|---|---|---|---|---|
| I-1-1 | Chiselling | 212.00 | 10.60 | 9.18 | 5.30 | C |
| I-1-2 | 269.34 | 13.47 | 11.66 | 6.73 | C | |
| I-1-3 | 231.83 | 11.59 | 10.04 | 5.80 | C | |
| I-2-1 | Smooth | 151.72 | 7.59 | 6.57 | 3.79 | B |
| I-2-2 | 159.00 | 7.95 | 6.88 | 3.98 | B | |
| I-2-3 | 170.00 | 8.50 | 7.36 | 4.25 | B |
| Number | Interface Handling | Peak Load (kN) | Average Flexural Tensile Strength (MPa) | Failure Type |
|---|---|---|---|---|
| I-11-1 | Chiselling | 14.12 | 1.93 | III |
| I-11-2 | 12.82 | III | ||
| I-11-3 | 16.50 | III | ||
| I-21-1 | Smooth | 12.00 | 1.58 | II |
| I-21-2 | 12.20 | II | ||
| I-21-2 | 11.10 | II |
| Number-Concrete | Thickness of Concrete (m) | Thickness of UHPC Layer (m) |
|---|---|---|
| 1 | 0.08 | 0.05 |
| 2 | 0.09 | 0.05 |
| 3 | 0.1 | 0.05 |
| 4 | 0.11 | 0.05 |
| 5 | 0.12 | 0.05 |
| 6 | 0.13 | 0.05 |
| 7 | 0.14 | 0.05 |
| 8 | 0.15 | 0.05 |
| 9 | 0.16 | 0.05 |
| 10 | 0.17 | 0.05 |
| 11 | 0.18 | 0.05 |
| 12 | 0.19 | 0.05 |
| 13 | 0.2 | 0.05 |
| 14 | 0.21 | 0.05 |
| 15 | 0.22 | 0.05 |
| 16 | 0.23 | 0.05 |
| 17 | 0.24 | 0.05 |
| 18 | 0.25 | 0.05 |
| 19 | 0.26 | 0.05 |
| 20 | 0.27 | 0.05 |
| 21 | 0.28 | 0.05 |
| 22 | 0.29 | 0.05 |
| 23 | 0.3 | 0.05 |
| Number-Steel Plate | Thickness of Steel Plate (m) |
|---|---|
| 1 | 0.008 |
| 2 | 0.009 |
| 3 | 0.01 |
| 4 | 0.011 |
| 5 | 0.012 |
| 6 | 0.013 |
| 7 | 0.014 |
| 8 | 0.015 |
| 9 | 0.016 |
| 10 | 0.017 |
| 11 | 0.018 |
| 12 | 0.019 |
| 13 | 0.02 |
Disclaimer/Publisher’s Note: The statements, opinions and data contained in all publications are solely those of the individual author(s) and contributor(s) and not of MDPI and/or the editor(s). MDPI and/or the editor(s) disclaim responsibility for any injury to people or property resulting from any ideas, methods, instructions or products referred to in the content. |
© 2023 by the authors. Licensee MDPI, Basel, Switzerland. This article is an open access article distributed under the terms and conditions of the Creative Commons Attribution (CC BY) license (https://creativecommons.org/licenses/by/4.0/).
Share and Cite
Zhang, D.; Ma, X.; Shen, H.; Guo, S.; Liu, C. Analysis of Structural Parameters of Steel–NC–UHPC Composite Beams. Materials 2023, 16, 5586. https://doi.org/10.3390/ma16165586
Zhang D, Ma X, Shen H, Guo S, Liu C. Analysis of Structural Parameters of Steel–NC–UHPC Composite Beams. Materials. 2023; 16(16):5586. https://doi.org/10.3390/ma16165586
Chicago/Turabian StyleZhang, Dawei, Xiaogang Ma, Huijie Shen, Songsong Guo, and Chao Liu. 2023. "Analysis of Structural Parameters of Steel–NC–UHPC Composite Beams" Materials 16, no. 16: 5586. https://doi.org/10.3390/ma16165586
APA StyleZhang, D., Ma, X., Shen, H., Guo, S., & Liu, C. (2023). Analysis of Structural Parameters of Steel–NC–UHPC Composite Beams. Materials, 16(16), 5586. https://doi.org/10.3390/ma16165586