Abstract
In the current study, the transient flow characteristics on the top surface of a steel slab continuous casting strand were numerically investigated using a large eddy simulation combined with volume of fluid (LES + VOF) model. The validation of numerical simulation was verified via nail board measurement in the industrial continuous casting mold. The effects of casting speed on the top surface level profile and the instantaneous distribution of vortex were discussed. The level variation profile migrated after a period of time, moving from one side of the wide face of the mold to the other. The wave height and transient variation degree of the standing wave increased with an increase in the casting speed. The region near the SEN was more likely to promote the formation of vortices. The vortex generation became easier when the vorticity peaks were concentrated on the outer edge of the low-speed confluence area near the submerged entry nozzle. In addition, the effect of surface velocity on the instantaneous level fluctuation was analyzed. The frequency of level fluctuations was highest at 3~4 mm, and the high-frequency range of velocity fluctuation was 20~60 mm/s at 0.9 m/min casting speed for a 1500 mm × 200 mm caster section. The linear relationship between the level fluctuation and surface velocity magnitude was obtained. The present work aimed at evaluating the dynamic problem of the standing wave at the liquid powder–molten steel interface on the top surface of the mold, which is helpful in optimizing the casting parameters for regular casting practice and improving the quality of the steel slabs.
1. Introduction
The flow of molten steel on the top surface of a steel slab continuous casting (CC) mold is complex, with strong heat transfer, mass transfer, and transient variation [1]. In addition, the molten steel flow on the top surface is covered with a liquid slag layer of mold powder, which can be regarded as a multi-phase and multi-physical field coupling flow of high-temperature stratified melt. The transient flow characteristics of the slag–steel interface, such as strong surface velocity, top surface level profile (TSLP) [2,3], standing wave height [4,5], instantaneous distribution of vortex [6,7,8], and instantaneous level fluctuation [9,10], directly affect the occurrence of slag entrainment and the quality of the steel slabs [11]. Therefore, understanding the transient variation characteristics of molten steel flow on the top surface of a mold is essential and indispensable for industrial engineers.
During the CC process, there are obvious peaks and troughs on the top surface of the mold on both sides of the submerged entry nozzle (SEN) [5]. Peaks and troughs are approximately symmetrical in time with the SEN as the center, and this surface waveform is the standing wave (SW) [12,13]. In addition, there are fluctuations and disturbances in the wave surface under the influence of different factors [5,13,14]. Under the double-roll flow (DRF) pattern [15,16], the trough is at the 1/4 mold width, where the liquid level is the lowest [17,18]. The level fluctuation of the top surface of the mold is caused by the superposition effect of the SW formed by the slag–steel interface and the transient disturbance of the liquid level, which is dominated by the casting speed, argon flow rate, submergence depth of the SEN, geometric structure of the SEN, width–thickness ratio of casting section, melt physical properties, etc. [19]. The level fluctuation of the top surface of the mold is considered to be the result of the combined action of the impact of the molten steel flow on the liquid level and the bulging of the steel slab. Recent studies on the level fluctuation of the top surface of the CC mold are summarized in Table 1. Most works have studied causes of level fluctuation on the top surface of the CC mold, including the impact of molten steel flow, bias flow, argon blowing, static pressure change in molten steel, disturbance of the stopper rod, fluid flow pattern in the mold, etc. However, the transient flow characteristics on the top surface were rarely studied, especially the dynamic problem of the SW and the relationship between level fluctuation and surface velocity magnitude under different casting speeds of the CC mold. The analysis of the transient flow characteristics on the top surface of the CC mold is helpful to optimize the casting parameters for regular casting practice.

Table 1.
Investigations on the level fluctuation of the top surface in the CC mold.
In the current work, the transient flow characteristics on the top surface of the mold at different casting speeds were investigated using a large eddy simulation combined with volume of fluid (LES + VOF) model. The nail board measurement was adopted to validate the accuracy of the numerical method. Then, the effects of casting speed on the TSLP and instantaneous distribution of vortex were discussed. In addition, the effect of surface flow velocity on instantaneous level fluctuation was studied. This work was used to qualitatively evaluate the dynamic problem of the SW at the liquid slag–molten steel interface on the top surface of the mold as well as the relationships between the relevant characteristic parameters, which is helpful in optimizing casting parameters and improving the product quality.
2. Computational Models
2.1. Assumptions
In the mathematical model, assumptions are specified as follows:
- The molten steel is treated as incompressible Newtonian fluids, and the process of solidification and heat transfer in the mold are ignored;
- The physical properties of molten steel and mold powder are set as constants;
- The computational domain extends from the mold to the bending zone, and its direction is simplified to vertical downward;
- The molten steel flow at the outlet of calculation domain is assumed to be fully developed turbulence.
2.2. Continuity Equations
For the mixed melt composed of molten steel and mold powder, the continuity and momentum equations are written as follows:
Continuity equation:
where ρ is density of the mixed melt in kg/m3, t is time in s, and ui is the velocity in m/s, respectively.
The mixed melt density is defined as:
where f is the volume fraction, and the subscripts s and f denote the mold powder phase and molten steel phase, respectively.
Momentum equation:
where P is the pressure in Pa, μ is the dynamic viscosity in Pa·s, μt is the turbulent viscosity in Pa·s, g is the gravity acceleration in m/s2, and Sσi is the surface tension force in N/m3, respectively.
The surface tension force is defined as [31]:
where σsf is the surface tension coefficient in N/m, and κ is the curvature in m−2.
The curvature is calculated as:
where is the surface normal, , .
2.3. LES Model
For the LES model, the large eddies are resolved directly, and the small eddies are modeled, respectively. The turbulent viscosity in the Smagorinsky–Lilly subgrid-scale model is calculated as [32]:
where Ls is the mixing length for subgrid-scales in m, and S is the average deformation rate tensor in s−1.
The mixing length for subgrid-scales and the average deformation rate tensor are calculated as:
where κ is the von Kármán constant, d is the distance to the closest wall in m, CS is the Smagorinsky constant and equals to 0.1, and V is the volume of the computational cell in m3.
2.4. Volume of Fluid Model
The interface between the steel and slag phase is tracked and calculated using the VOF model [33]. This method of the tracing inter-phase boundary was achieved by solving one set of momentum equations for the mixture of phases, and one equation for the volume fraction of a fluid.
The volume fraction of the slag and molten steel phase is given by
where fs is the volume fraction of mold powder phase, and ff is the volume fraction of molten steel phase, respectively.
2.5. Numerical Details
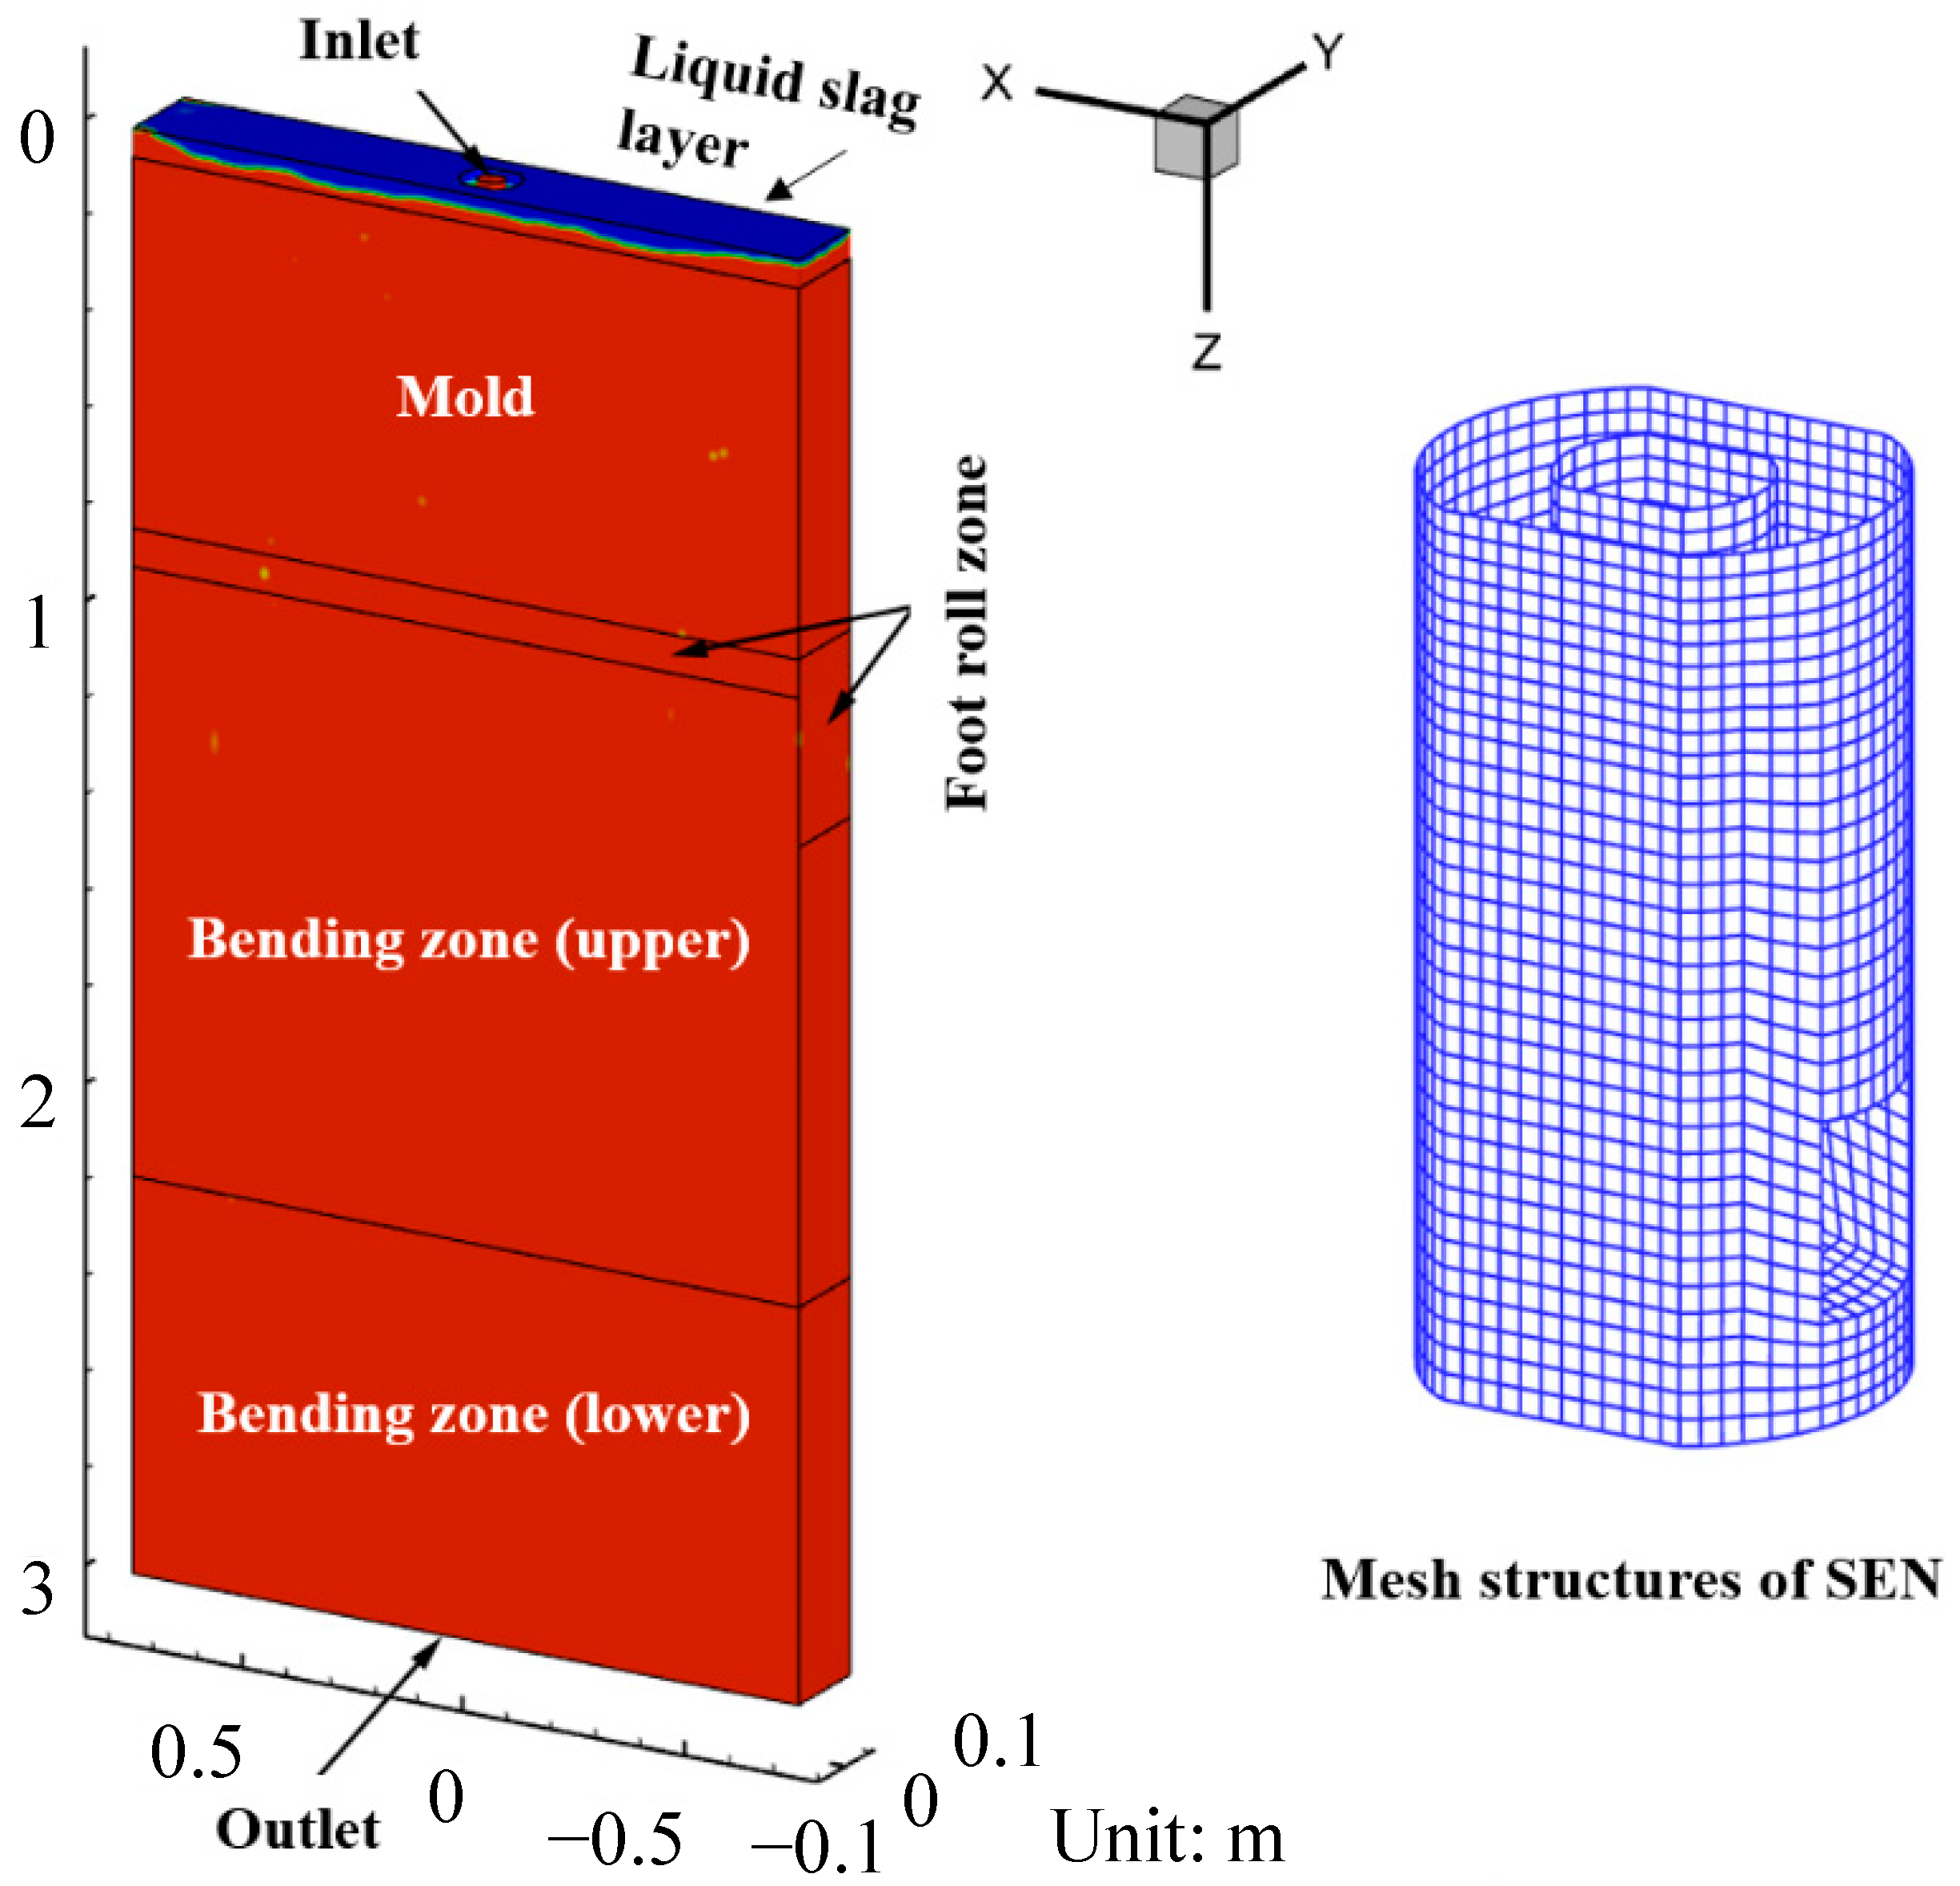
In order to investigate the transient flow characteristics on the top surface of the mold, a fluid flow mathematical model for an actual steel slab CC strand was established. A full-size scale model was modeled based on the actual mold. The length of the calculation domain was 3 m to eliminate the influence of the molten steel flow circulation zone in the CC process. The total number of structured mesh cells for the large eddy simulation was approximate 1.4 million, and the fine graded mesh was adopted near the wall surface. Figure 1 shows the schematic of the calculation domain and mesh. The inlet boundary condition was velocity inlet based on the mass conservation. The outlet boundary condition was pressure outlet, and the normal gradients of all dependent variables were set to zero. The top surface of the mold was supposed to be flat and insulated using a free-slip condition. Other dimensions and physics parameters used in the numerical simulation are given in Table 2. Simulations were carried out on the software platform of CFD code ANSYS-Fluent 2021. The pressure–velocity coupling was solved using the SIMPLE algorithm. The discretization of the momentum equation was solved using the Bounded Central Differencing scheme. The convergence criteria was set to 1 × 10⁻⁴ for the residuals of all transport equations. Time step was set as 5 × 10⁻⁴ s. The total calculation time was approximately 200 s to obtain the quasi-steady state.
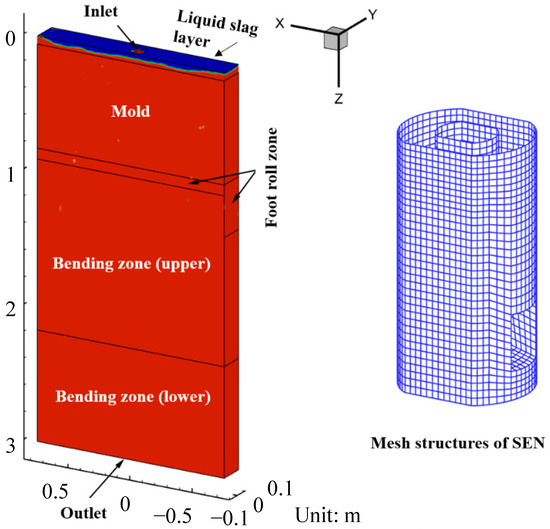
Figure 1.
Schematic of the calculation domain and mesh.

Table 2.
Casting parameters in the numerical simulation.
3. Nail Board Measurements
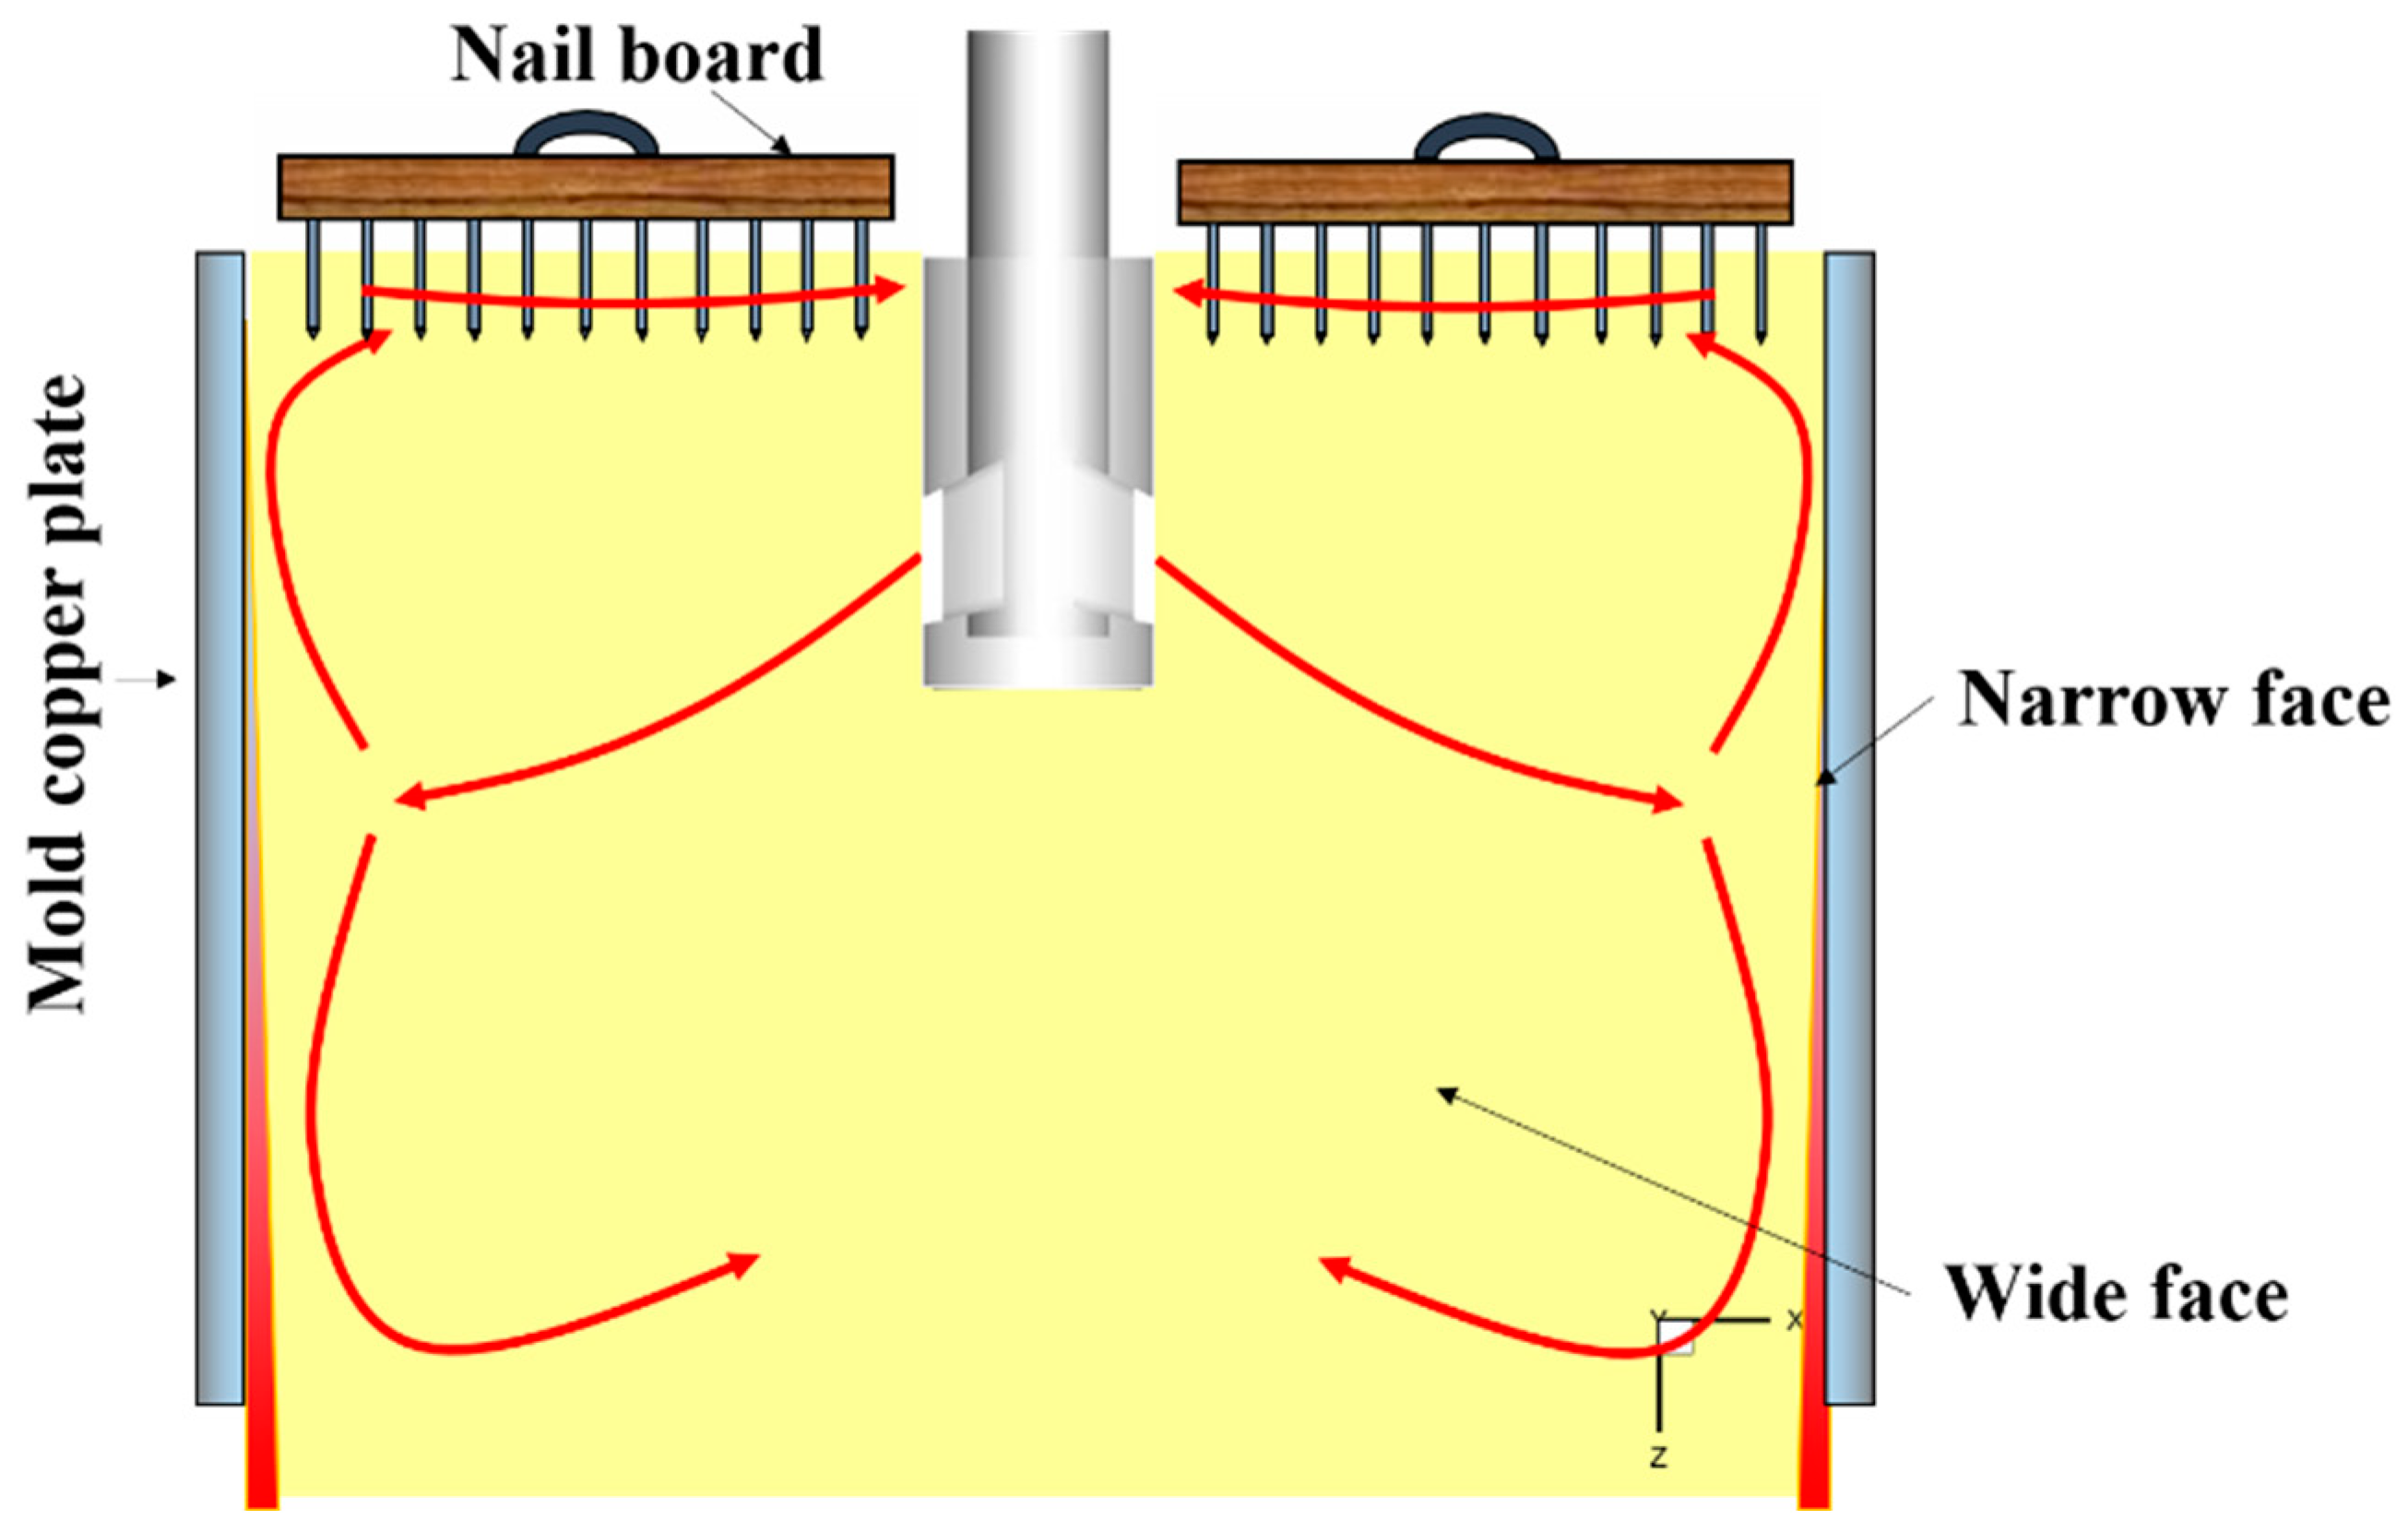
In order to validate the accuracy of the numerical method, the nail board measurement was adopted to measure the surface velocity of the molten steel in the industrial CC mold [34,35,36]. Figure 2 shows the schematic of the nail board measurement. In the experiment, the nail board was inserted into the molten steel vertically through the mold powder layer, and it stayed for 3~5 s before being pulled out. The depth of the steel nail inserted into the molten steel was in the range of 40~60 mm. The nail board measurement was carried out simultaneously on both sides of the SEN. The surface velocity of molten steel can be calculated by measuring the height difference between the incoming direction and the de-flow direction of the molten steel, and the diameter of the solidified lump at the lowest point of the de-flow direction. The calculation equation of the surface velocity is as follows [25]:
where Vs is the steel surface velocity in m/s, φlump is the lump diameter in mm, and hlump is the difference in lump height in mm.
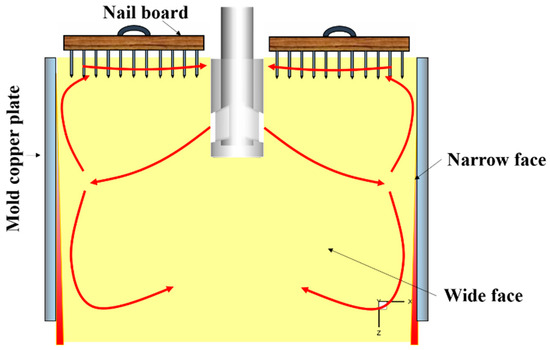
Figure 2.
Schematic of the nail board measurement.
Casting parameters in industrial trials are the same as in the numerical simulation and given in Table 2. The compositions of the steel are listed in Table 3. The compositions of the original mold powder are given in Table 4.

Table 3.
Chemical composition of steel (wt%).

Table 4.
Chemical composition of original mold flux (wt%).
4. Results and Discussion
4.1. Numerical Simulation Validation
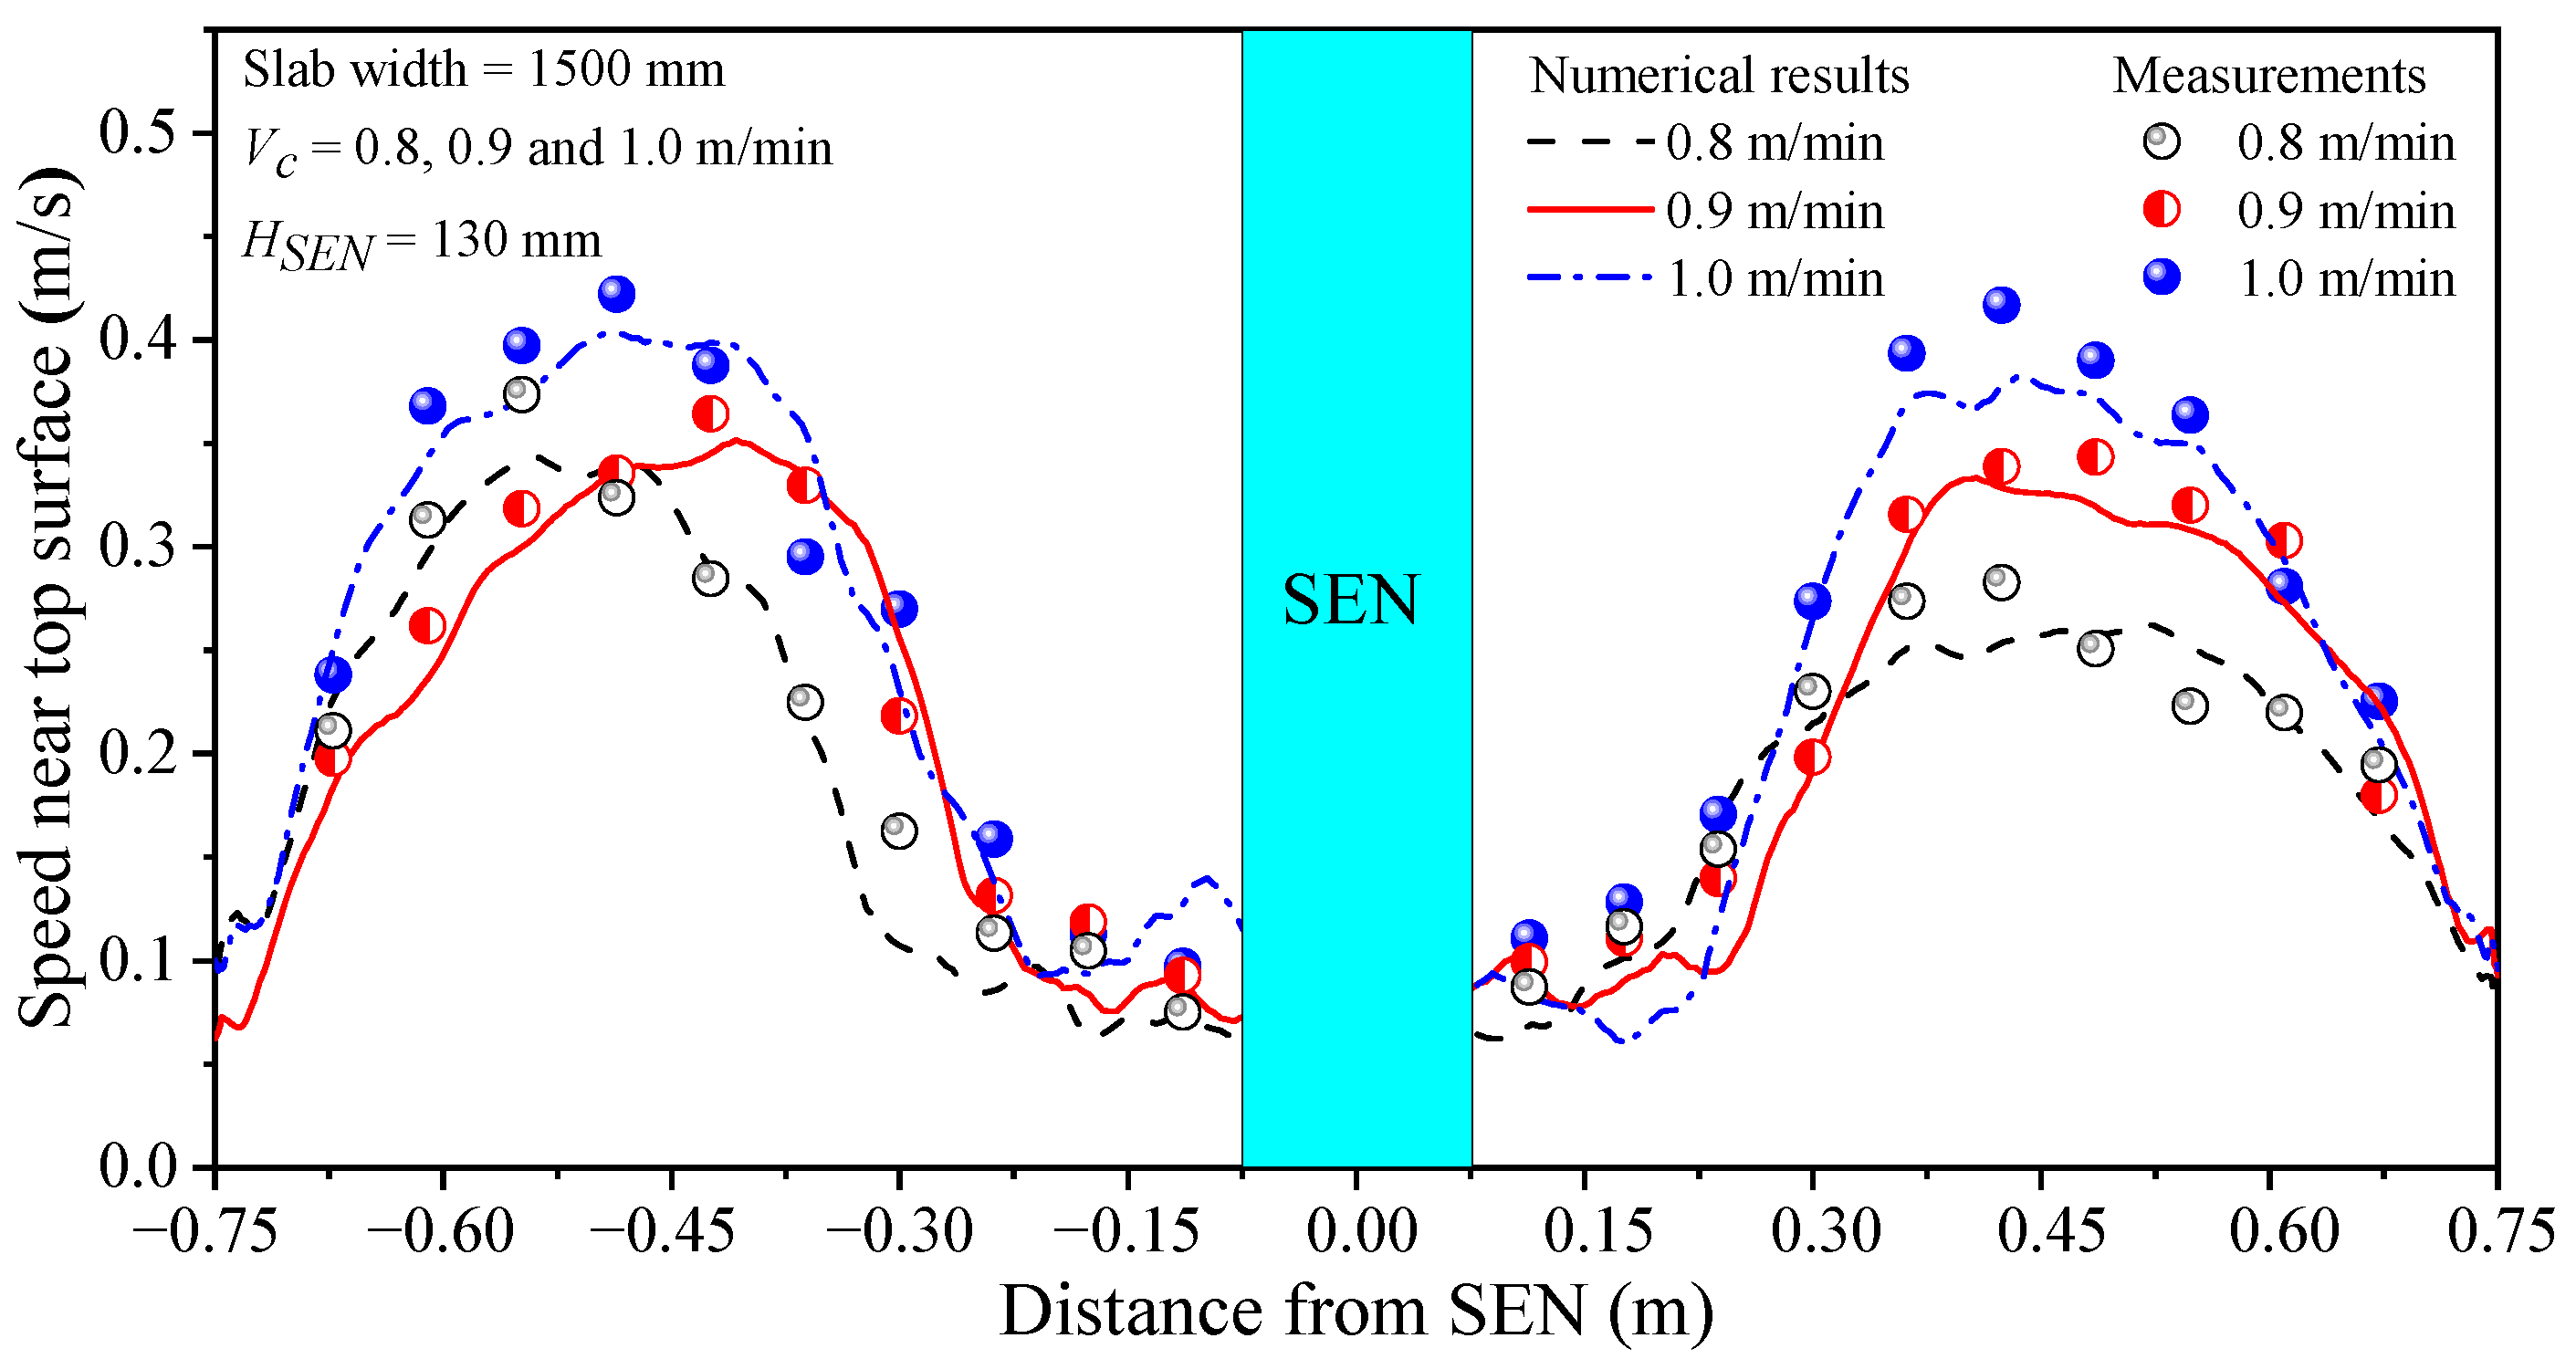
In order to verify the accuracy of the mathematical model, the measured and calculated speed of molten steel along the thickness center line of the top surface of the mold are compared, as shown in Figure 3. The numerical simulation results were in good agreement with the measured values. Therefore, the fluid flow mathematical model established in the current study can be used to predict the molten steel flow in the mold.
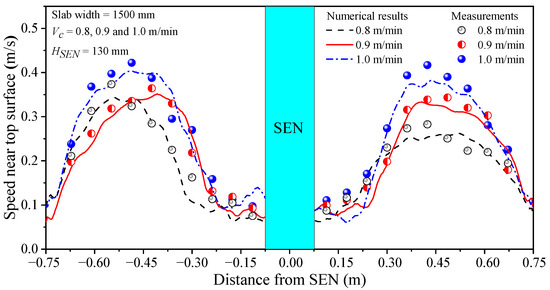
Figure 3.
Comparison of calculated and measured speed of molten steel near the surface.
4.2. Effect of Casting Speed on Top Surface Level Profile
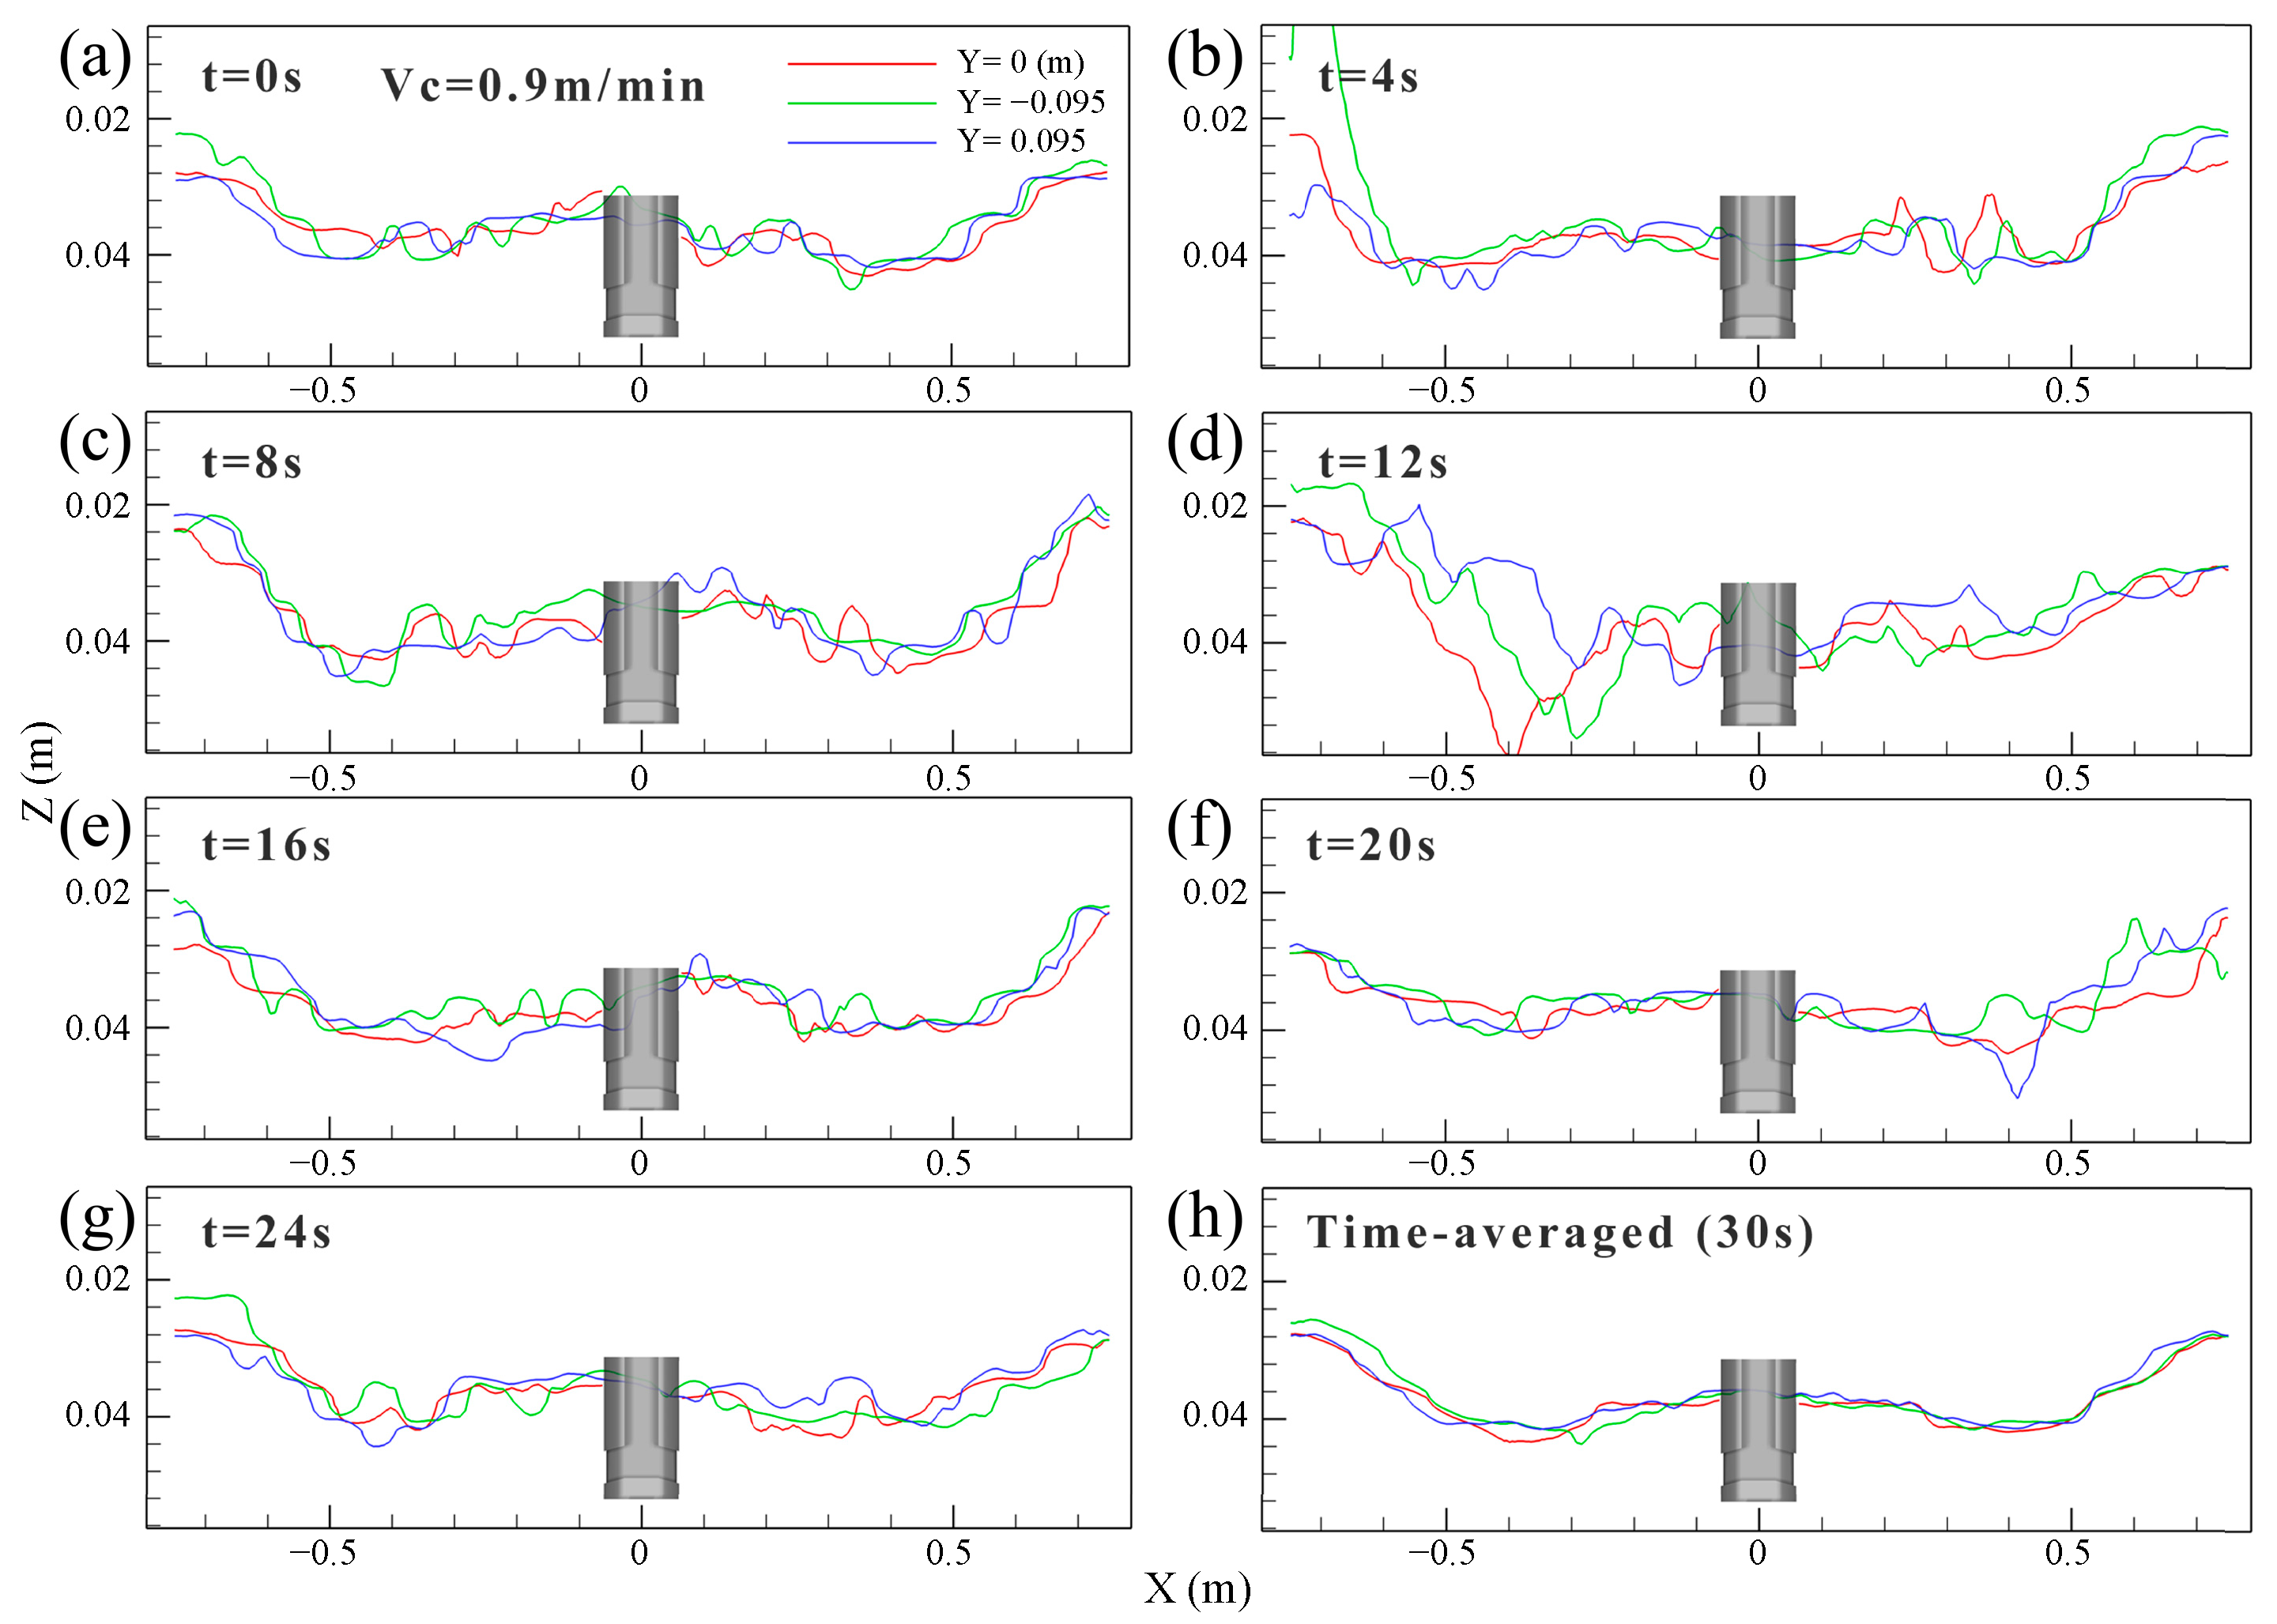
Figure 4 shows the transient and time-averaged distribution of top surface level profile at the interface between the molten steel and slag layer in the mold within 30 s and at 0.9 m/min casting speed. The TSLP was taken from the slag phase volume fraction of 0.9, and its standing wave profile was characterized by the three characteristic lines at different positions. The red line was the center line of the liquid surface (Y = 0 m ), the green line was located at 0.005 m (Y = −0.095 m ) from the fixed face, and the blue line was located at 0.005 m (Y = 0.095 m ) from the loose face of the mold, respectively. The level profile of the mold showed significant level fluctuation at different times, as shown in Figure 4a–g. The characteristic line shows a tortuous and uneven shape, indicating the liquid level changed greatly, as shown in Figure 4c–d, which made it easy to induce the slag entrainment. However, this sudden variation in the shape of the level profile migrated after a period of time, moving from one wide face of the mold to the other side. Although the level fluctuation degree at different positions varied, it did not significantly change the position of the peak and the trough of the TSLP. As shown in Figure 4h, the wave peak of the level profile was near the SEN and the narrow face, while the trough was close to the 1/4 wide face, which was generally symmetrical with the SEN as the center. The above results showed that the instantaneous top level profile continues to oscillate periodically, although the time-averaged velocity distribution was in good symmetricity.
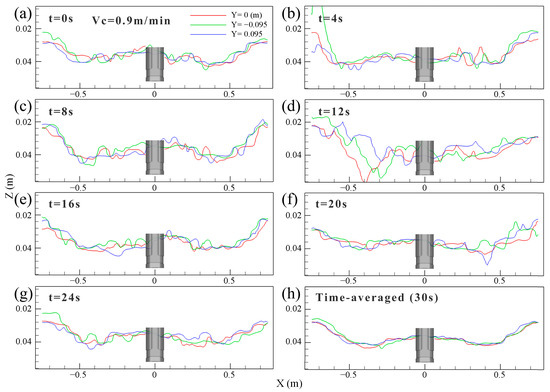
Figure 4.
Transient and time-averaged distribution of top surface level profile of the mold. (a) t = 0 s. (b) t = 4 s. (c) t = 8 s. (d) t = 12 s. (e) t = 16 s. (f) t = 20 s. (g) t = 24 s. (h) t = 30 s.
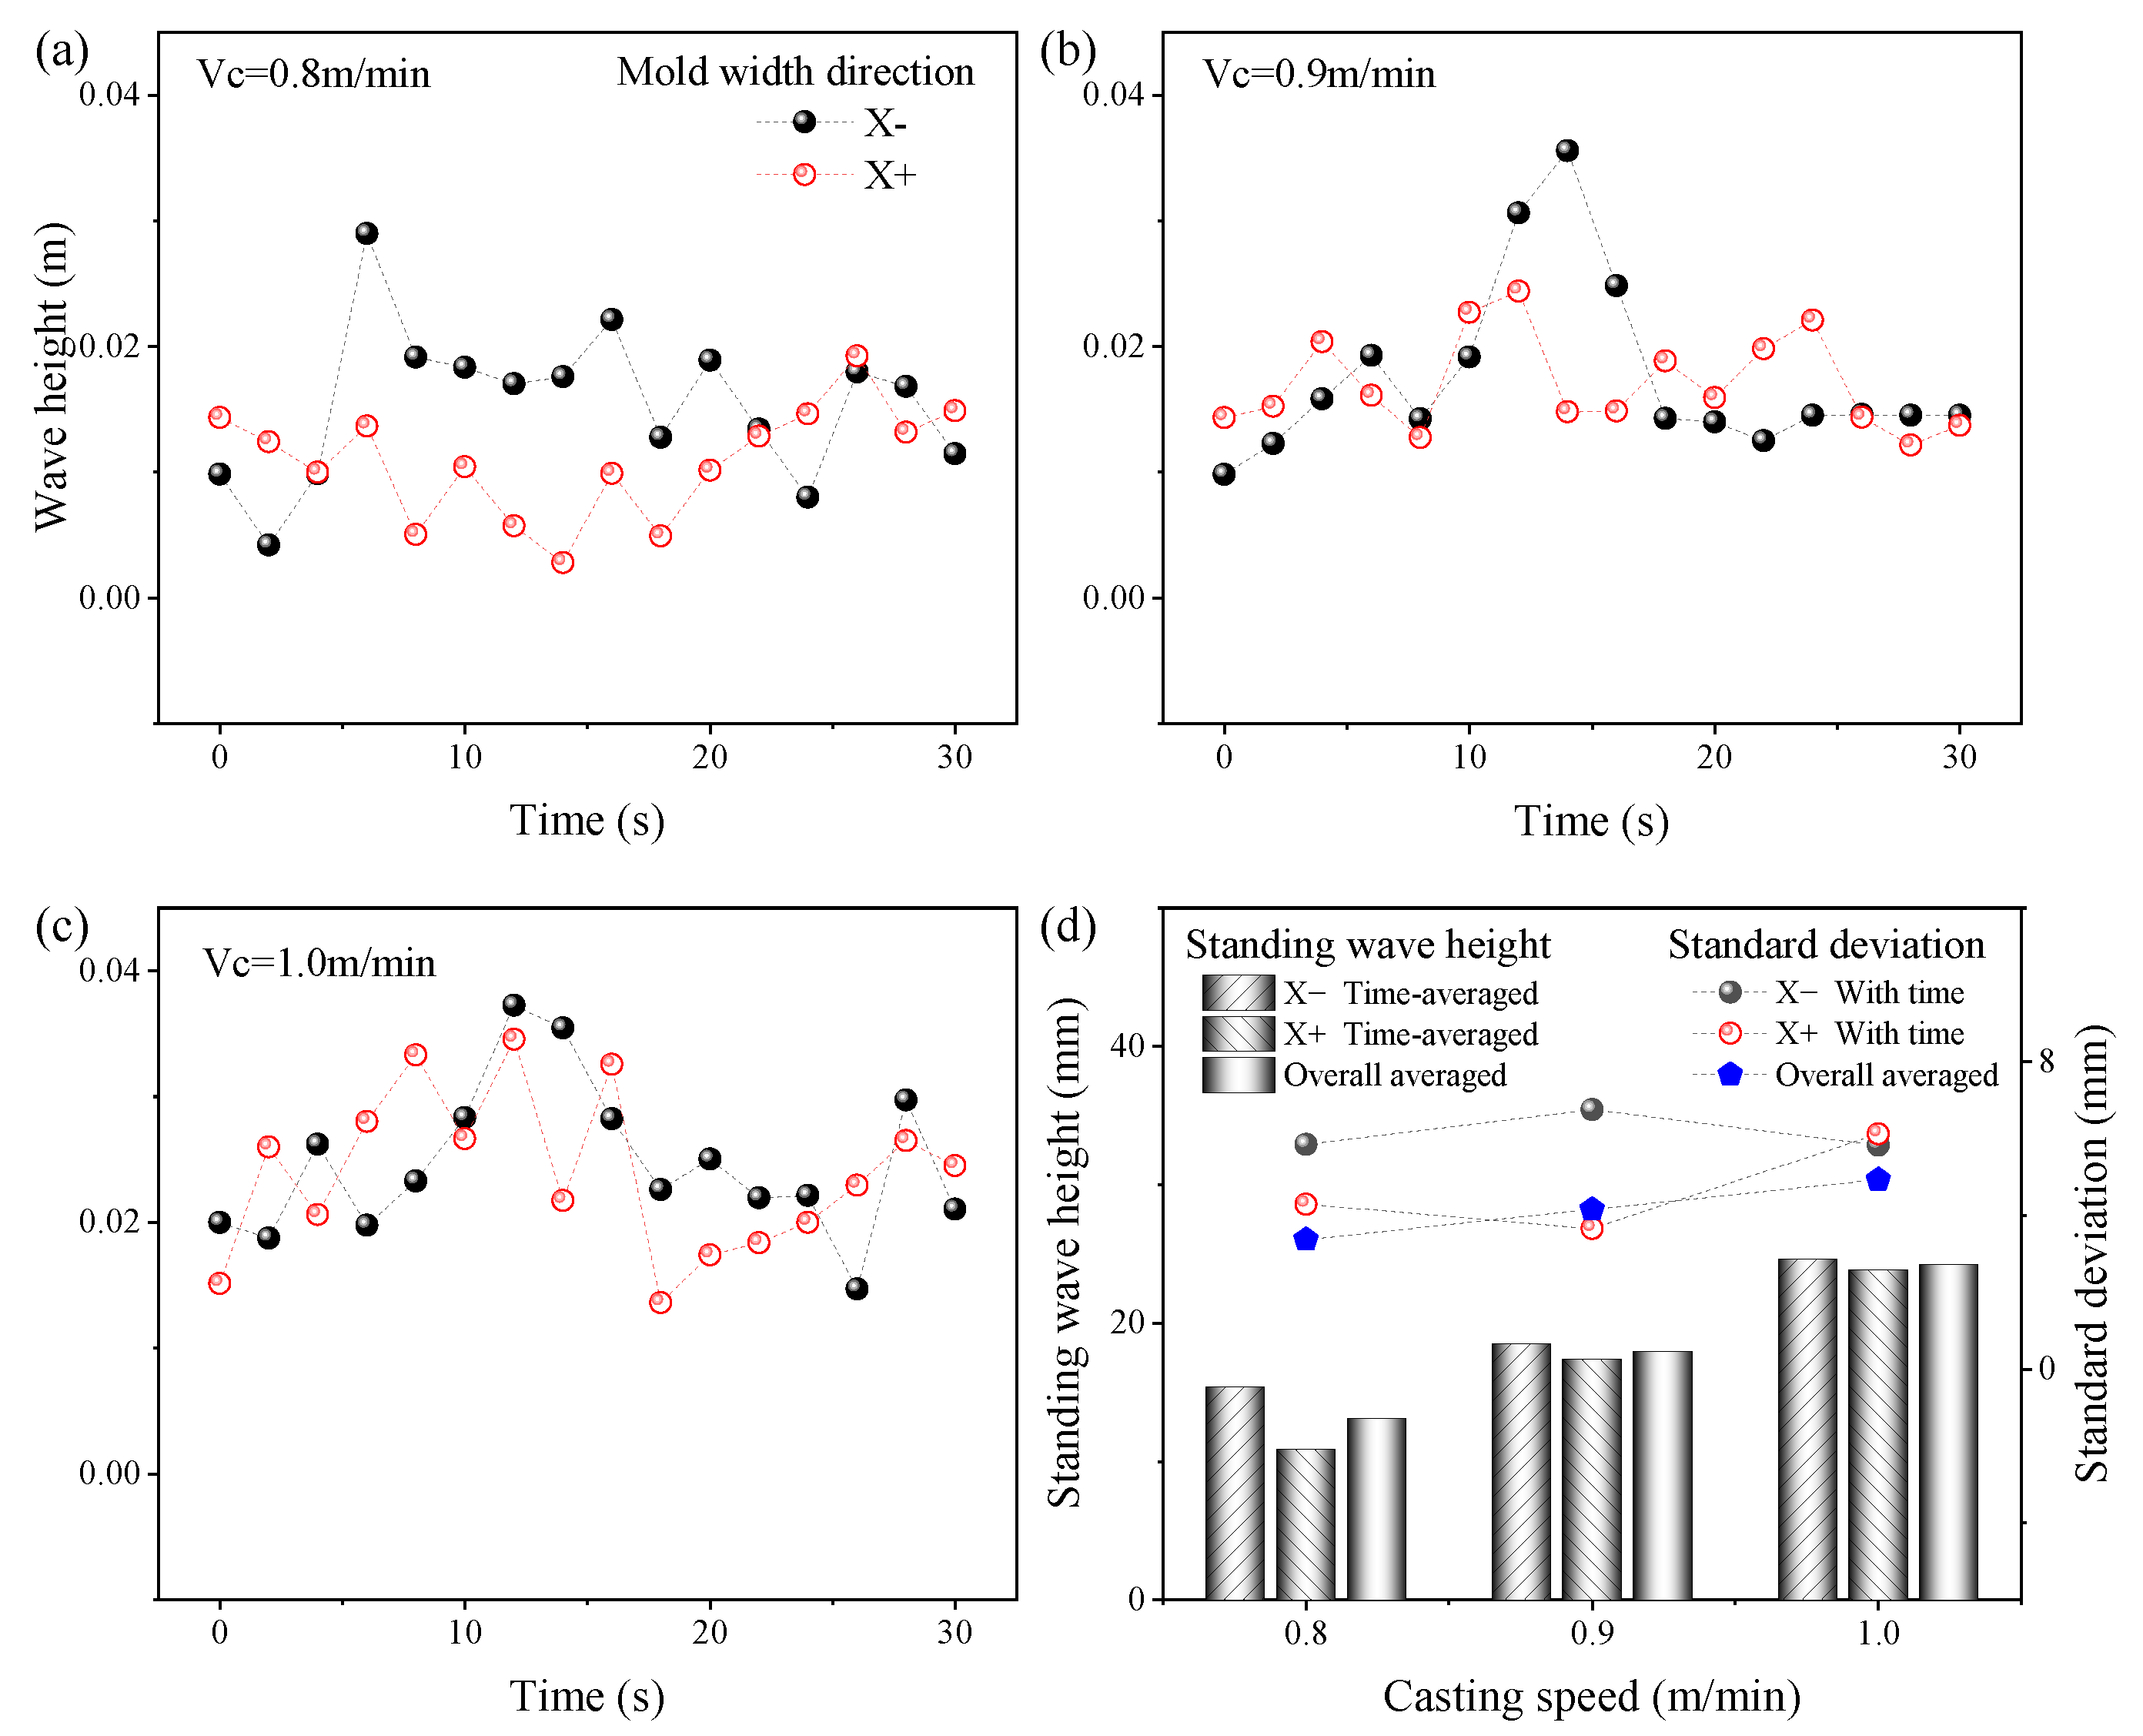
The variation in standing wave height with time at different casting speeds is shown in Figure 5. The symbols X− and X+ denote the negative and positive directions along the mold width with the SEN as the center, respectively. From Figure 5a–c, the height of the SW was transient, but the transient degree of the top surface wave height on both sides of the SEN along the mold width was not synchronized. The magnitude of the standing wave height and the degree of transient expressed by the standard deviation at 30 s time-averaged condition are shown in Figure 5d. The time-averaged wave height and the transient degree of the SW increased with the increase in the casting speed. The increasing tendency of the SW was explained by the following mechanism. With the increase in the casting speed, a shorter time was needed for the molten steel moved from the SEN to the narrow face, which led to an increase in the momentum of upward movement of molten steel after impact on the narrow face. The increase in the height amplitude of the SW was attributed to an increase in the casting speed. At 0.8 m/min casting speed, the SW height on both sides of the mold width was quite different. This difference gradually decreased as the casting speed increased.
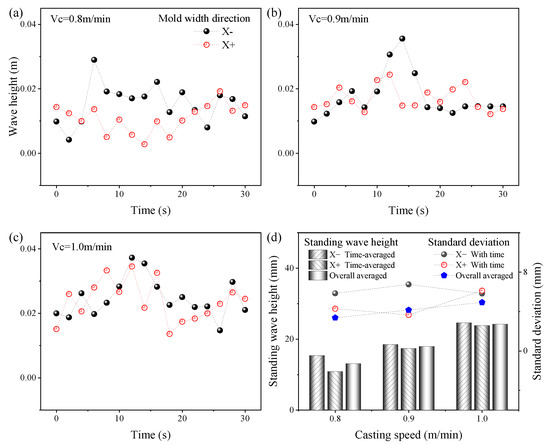
Figure 5.
Variation in standing wave height with time at different casting speeds. (a) Vc = 0.8 m/min; (b) Vc = 0.9 m/min; (c) Vc = 1.0 m/min; (d) Standing wave height and standard deviation.
4.3. Effect of Casting Speed on Vortex Distribution
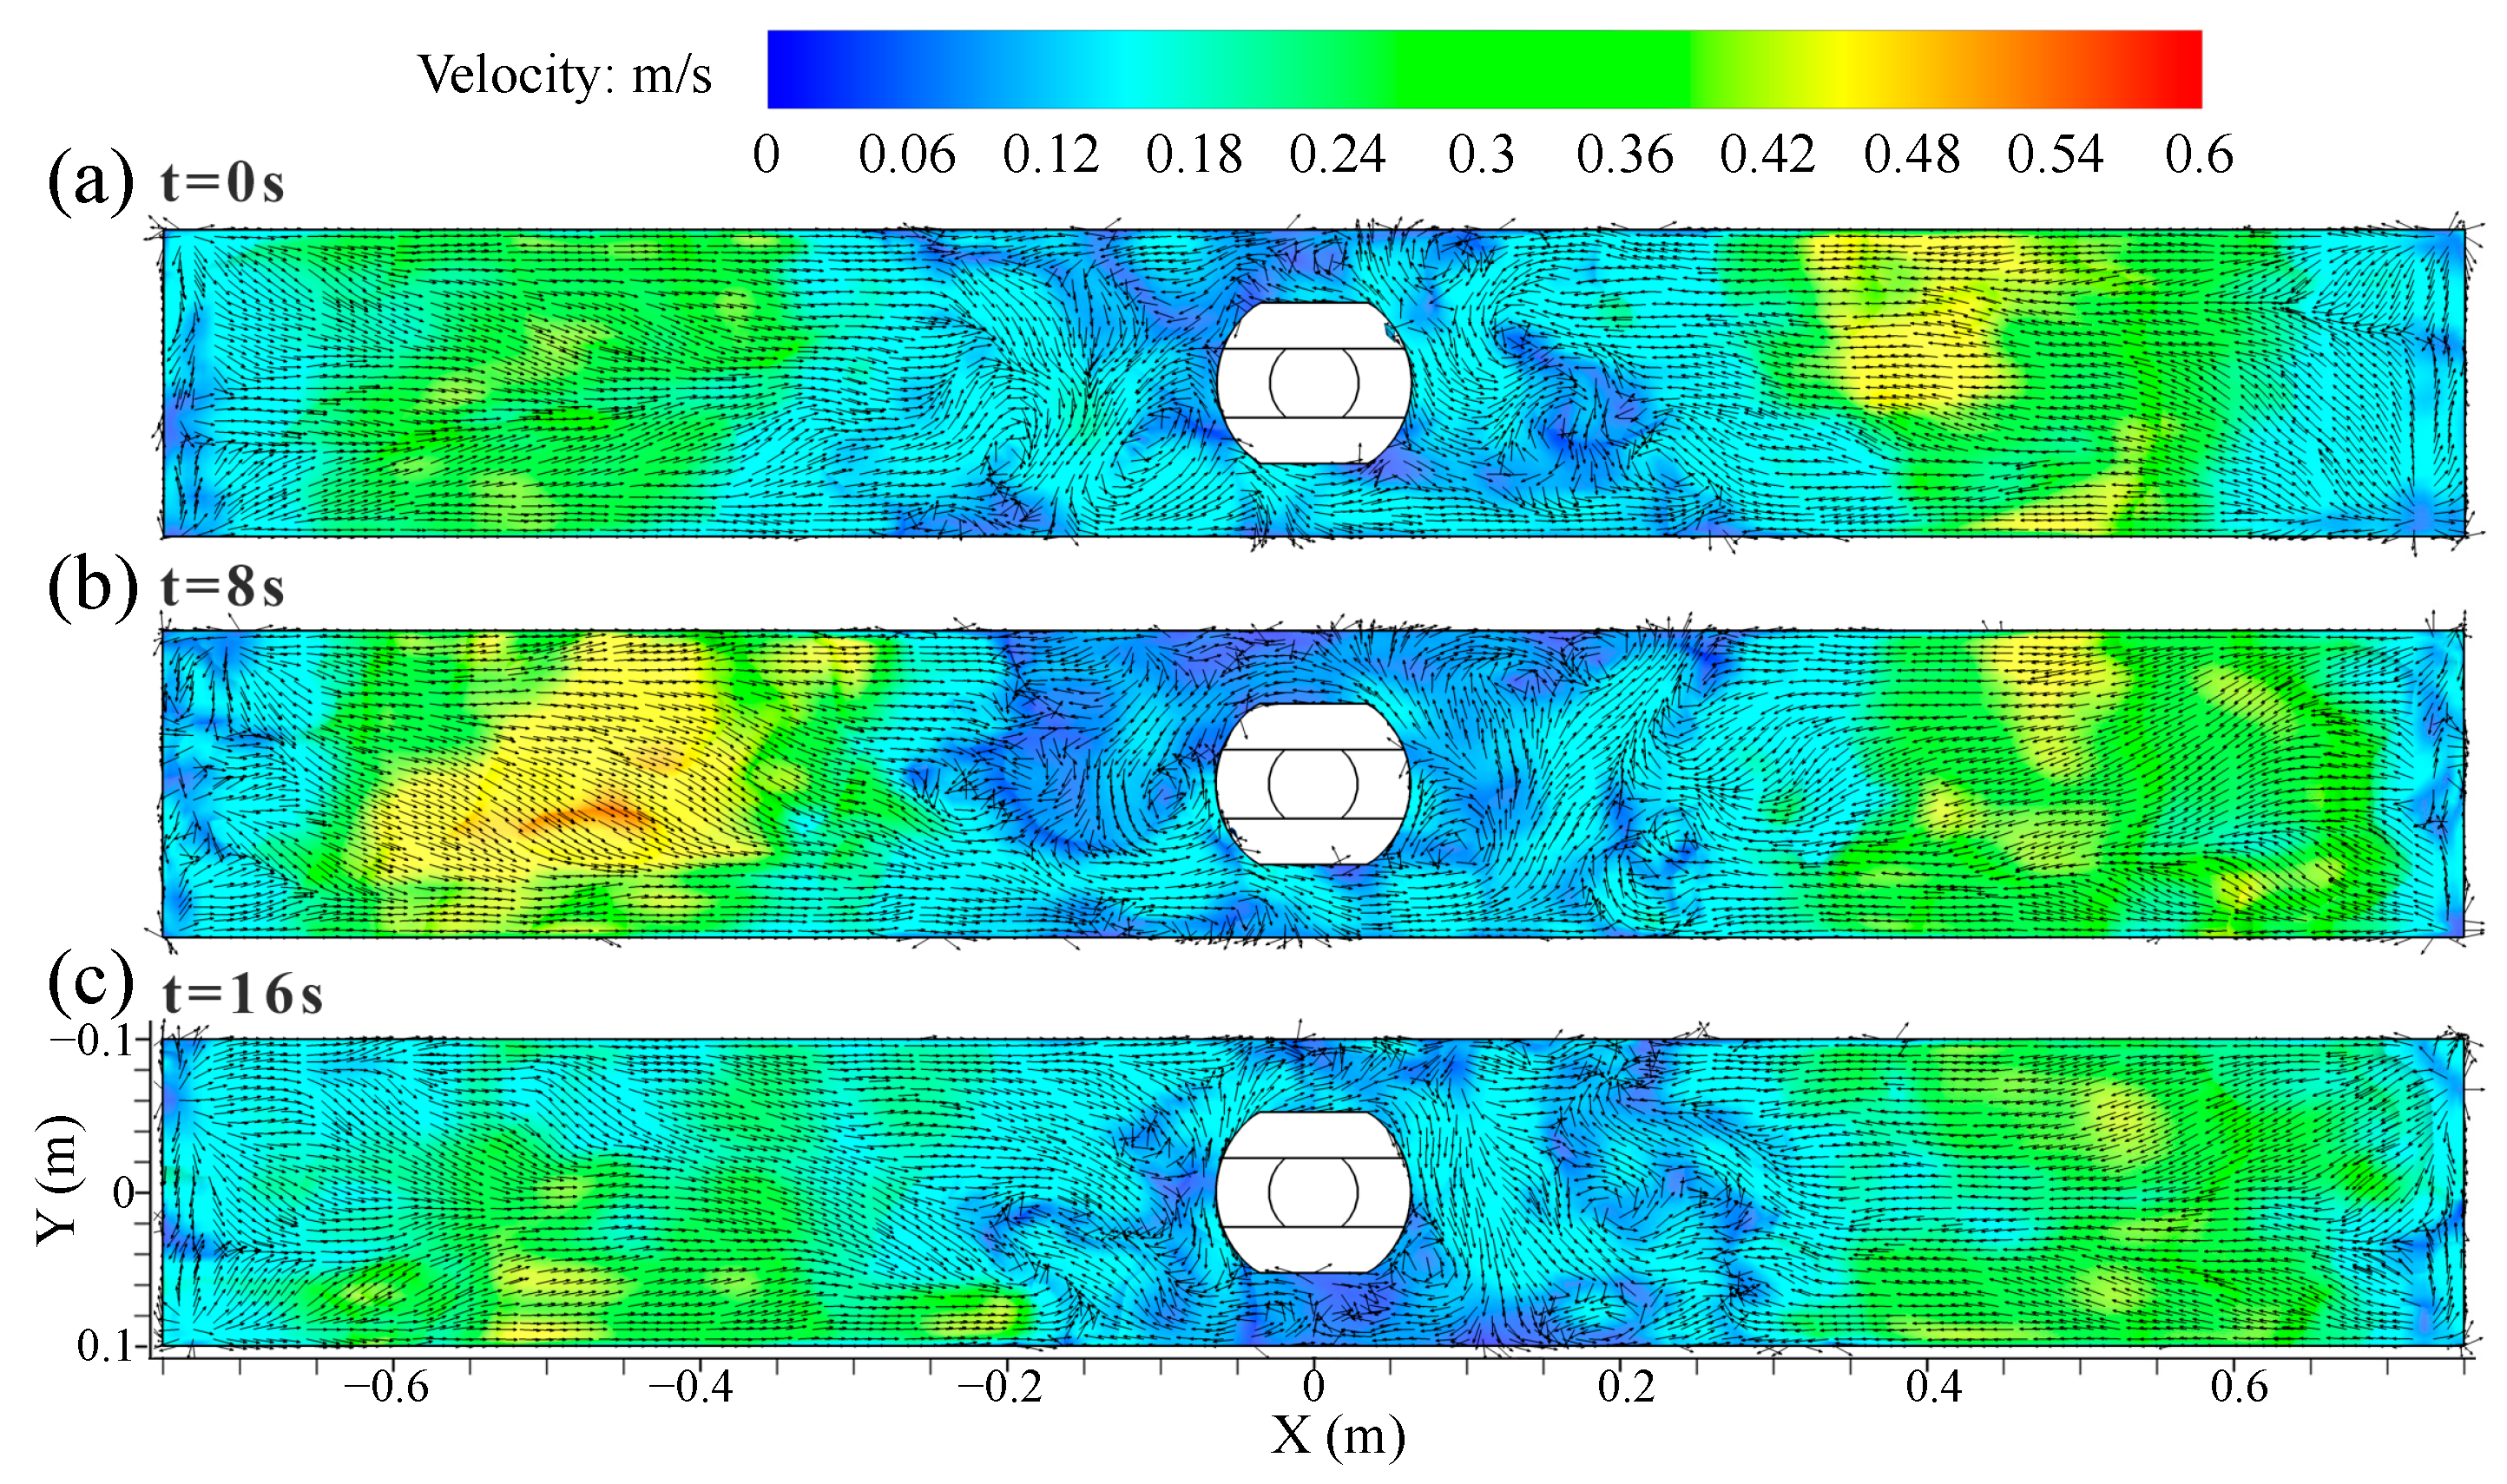
Figure 6 illustrates the transient velocity and vortex distribution on the top surface of the mold at 0.9 m/min casting speed. The surface velocity showed a clear asymmetric distribution under transient conditions. The velocity had a significant peak, and the value of the peak varied with the casting time. The peak value of the surface velocity appeared on the right side of the SEN at t = 0 s and on the left side of the SEN at t = 8 s along the mold width, as shown in Figure 6a,b, respectively. In Figure 6c, the peak value decreased, and the velocity distribution tended to be moderate at t = 16 s.
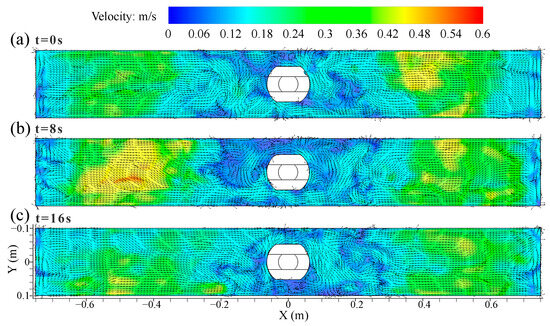
Figure 6.
Transient velocity and vortex distribution on the top surface of the mold at casting speed of 0.9 m/min. (a) t = 0 s. (b) t = 8 s. (c) t = 16 s.
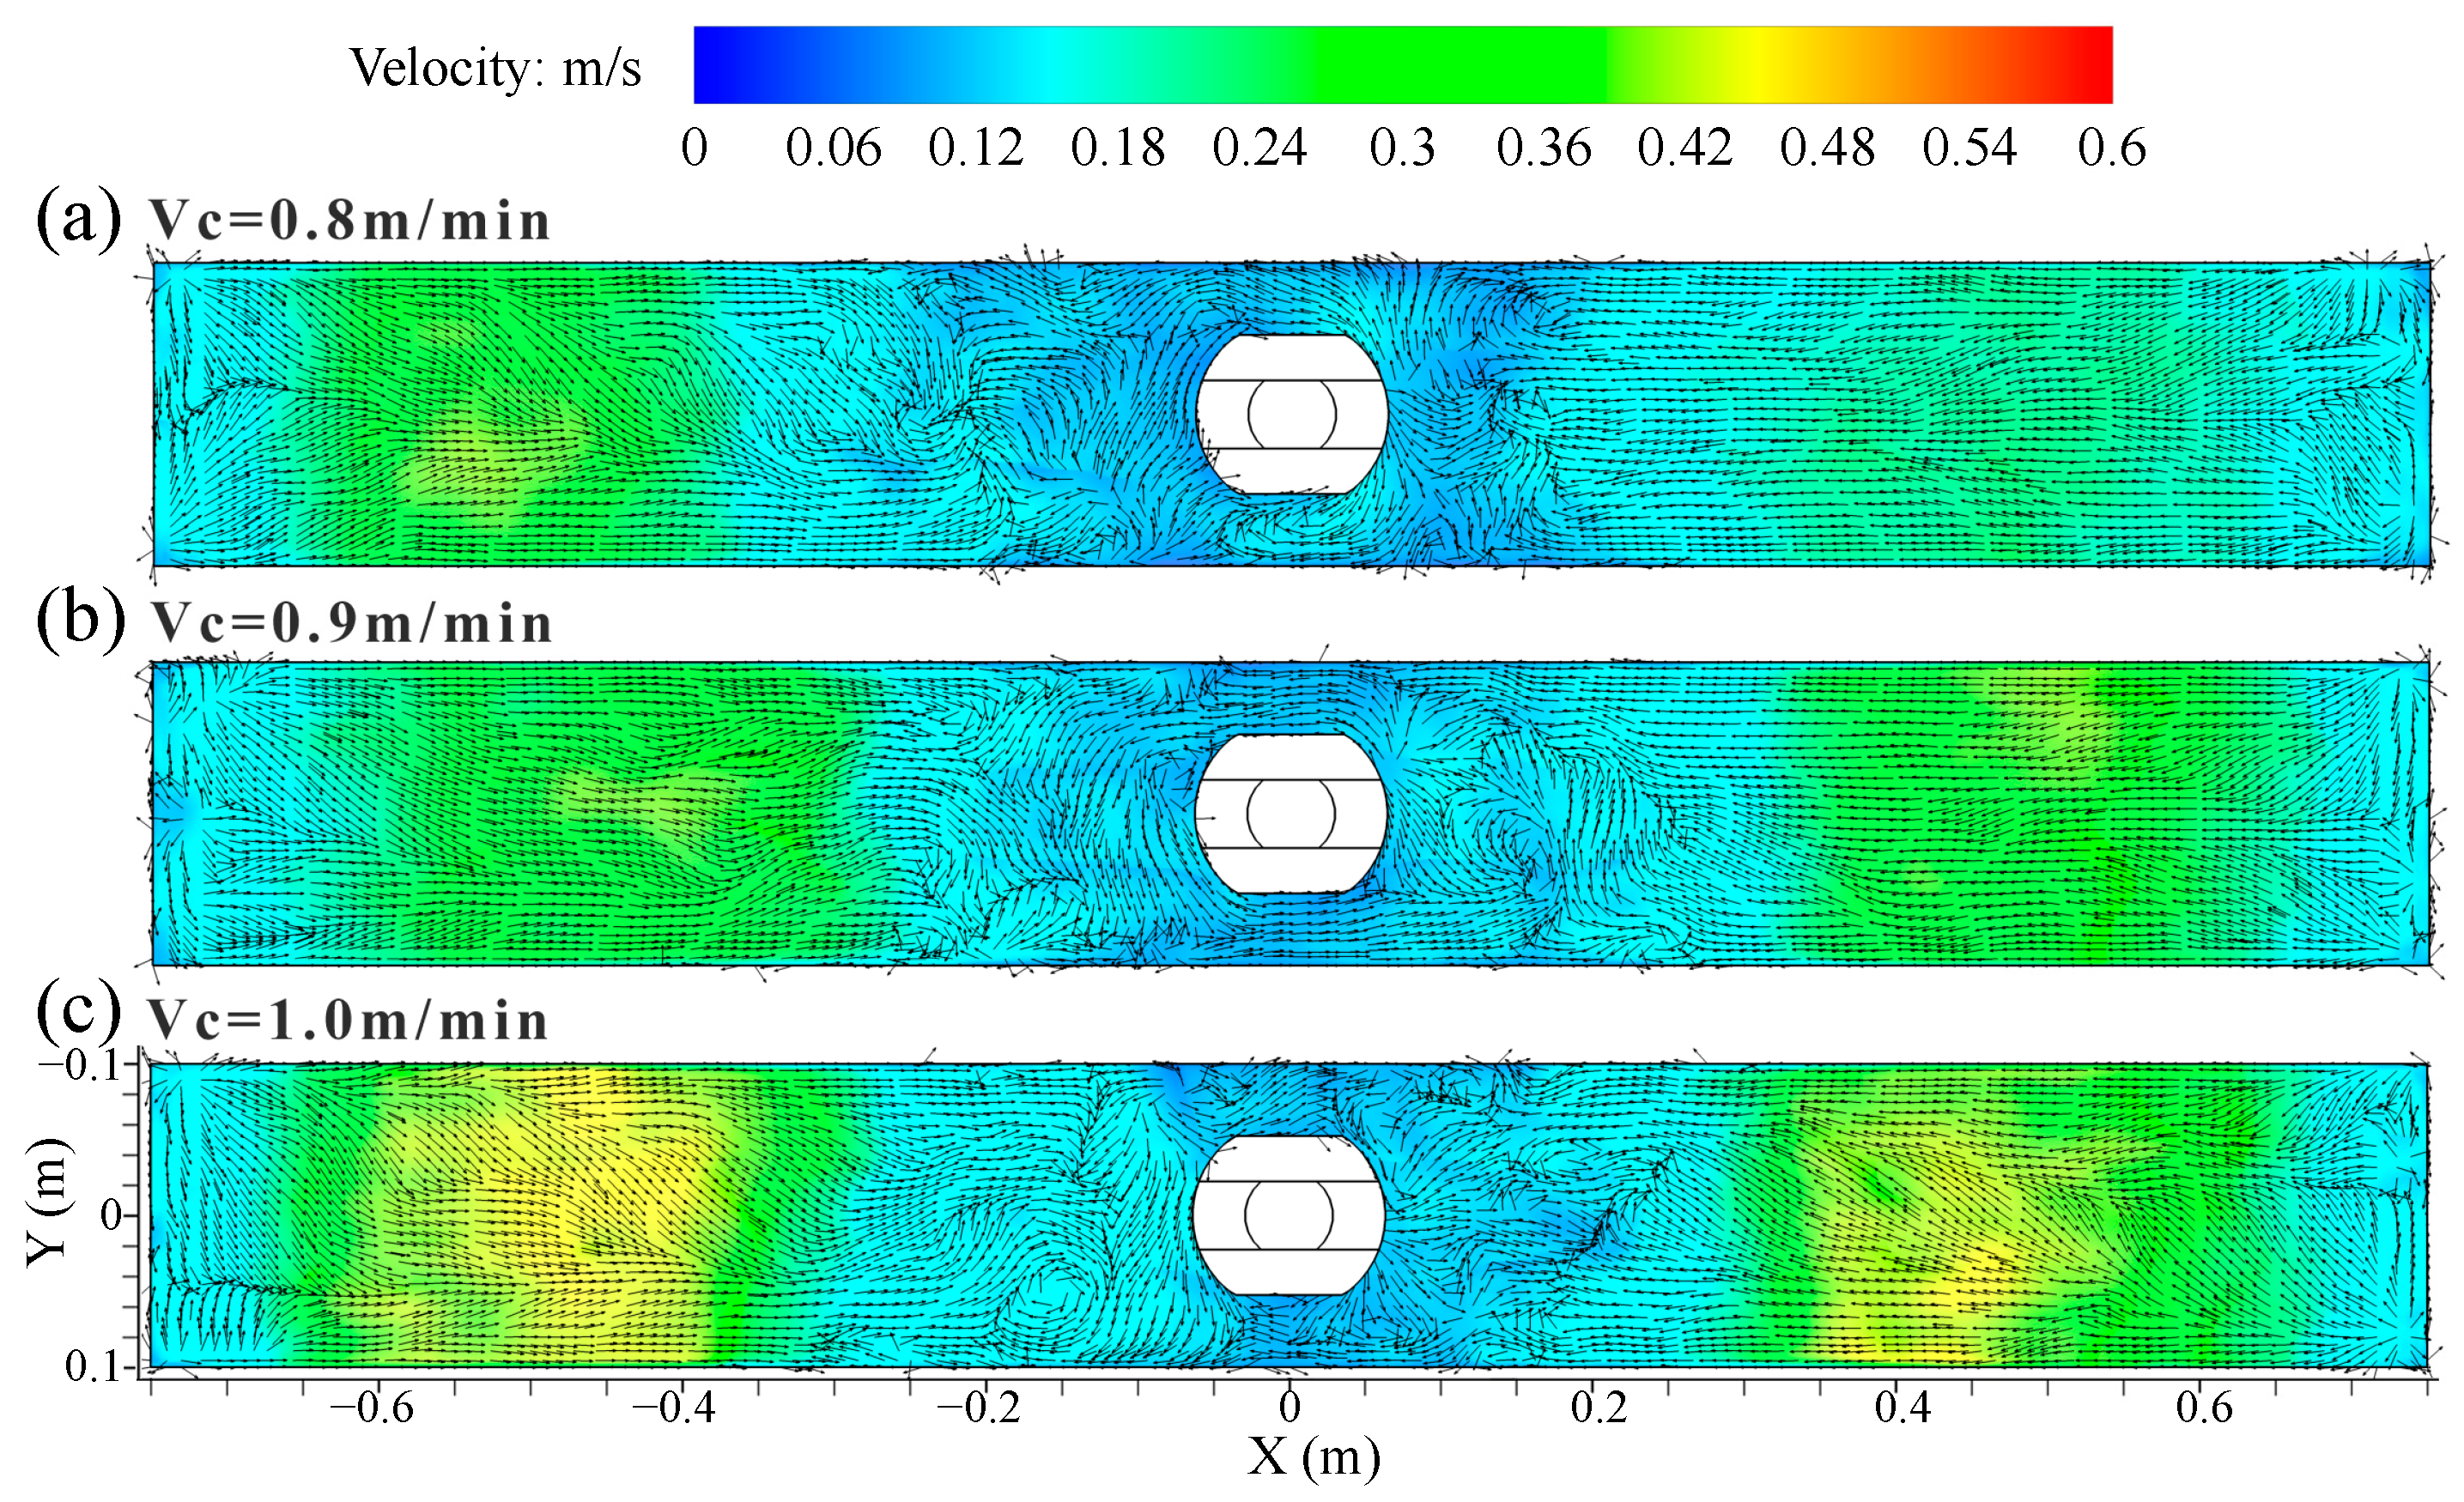
Figure 7 shows the distribution of time-averaged velocity and vortex distribution on the top surface of the mold at different casting speeds. The surface velocity was symmetrical with the SEN as the center, and it had the largest value at the 1/4 mold width, while the velocity near the SEN and the narrow face was smaller. The steel flow from the narrow face converged near the vicinity of the SEN under the DRF pattern, forming a low-speed confluence zone. There were many vortices of different sizes and shapes in the low-speed confluence area, and their number and position varied with the casting time. The region near the SEN was more likely to promote the formation of vortices. The meniscus vortices was also reported to largely occur near the SEN and it was moved far from the SEN [6]. These structures resembled the vortex shedding around a circular cylinder [7]. The vortexing flow on the top surface of the mold was an important factor for the slag entrainment [37].
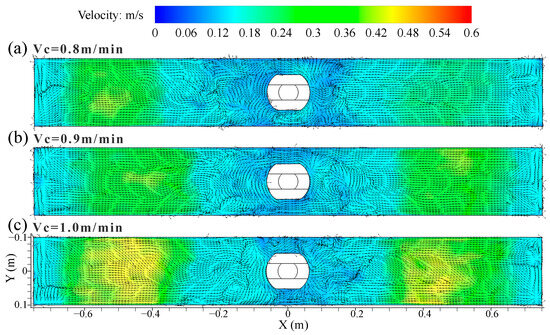
Figure 7.
Distribution of time-averaged (30 s) velocity and vortex distribution on the top surface of the mold at different casting speeds. (a) Vc = 0.8 m/min; (b) Vc = 0.9 m/min; (c) Vc = 1.0 m/min.
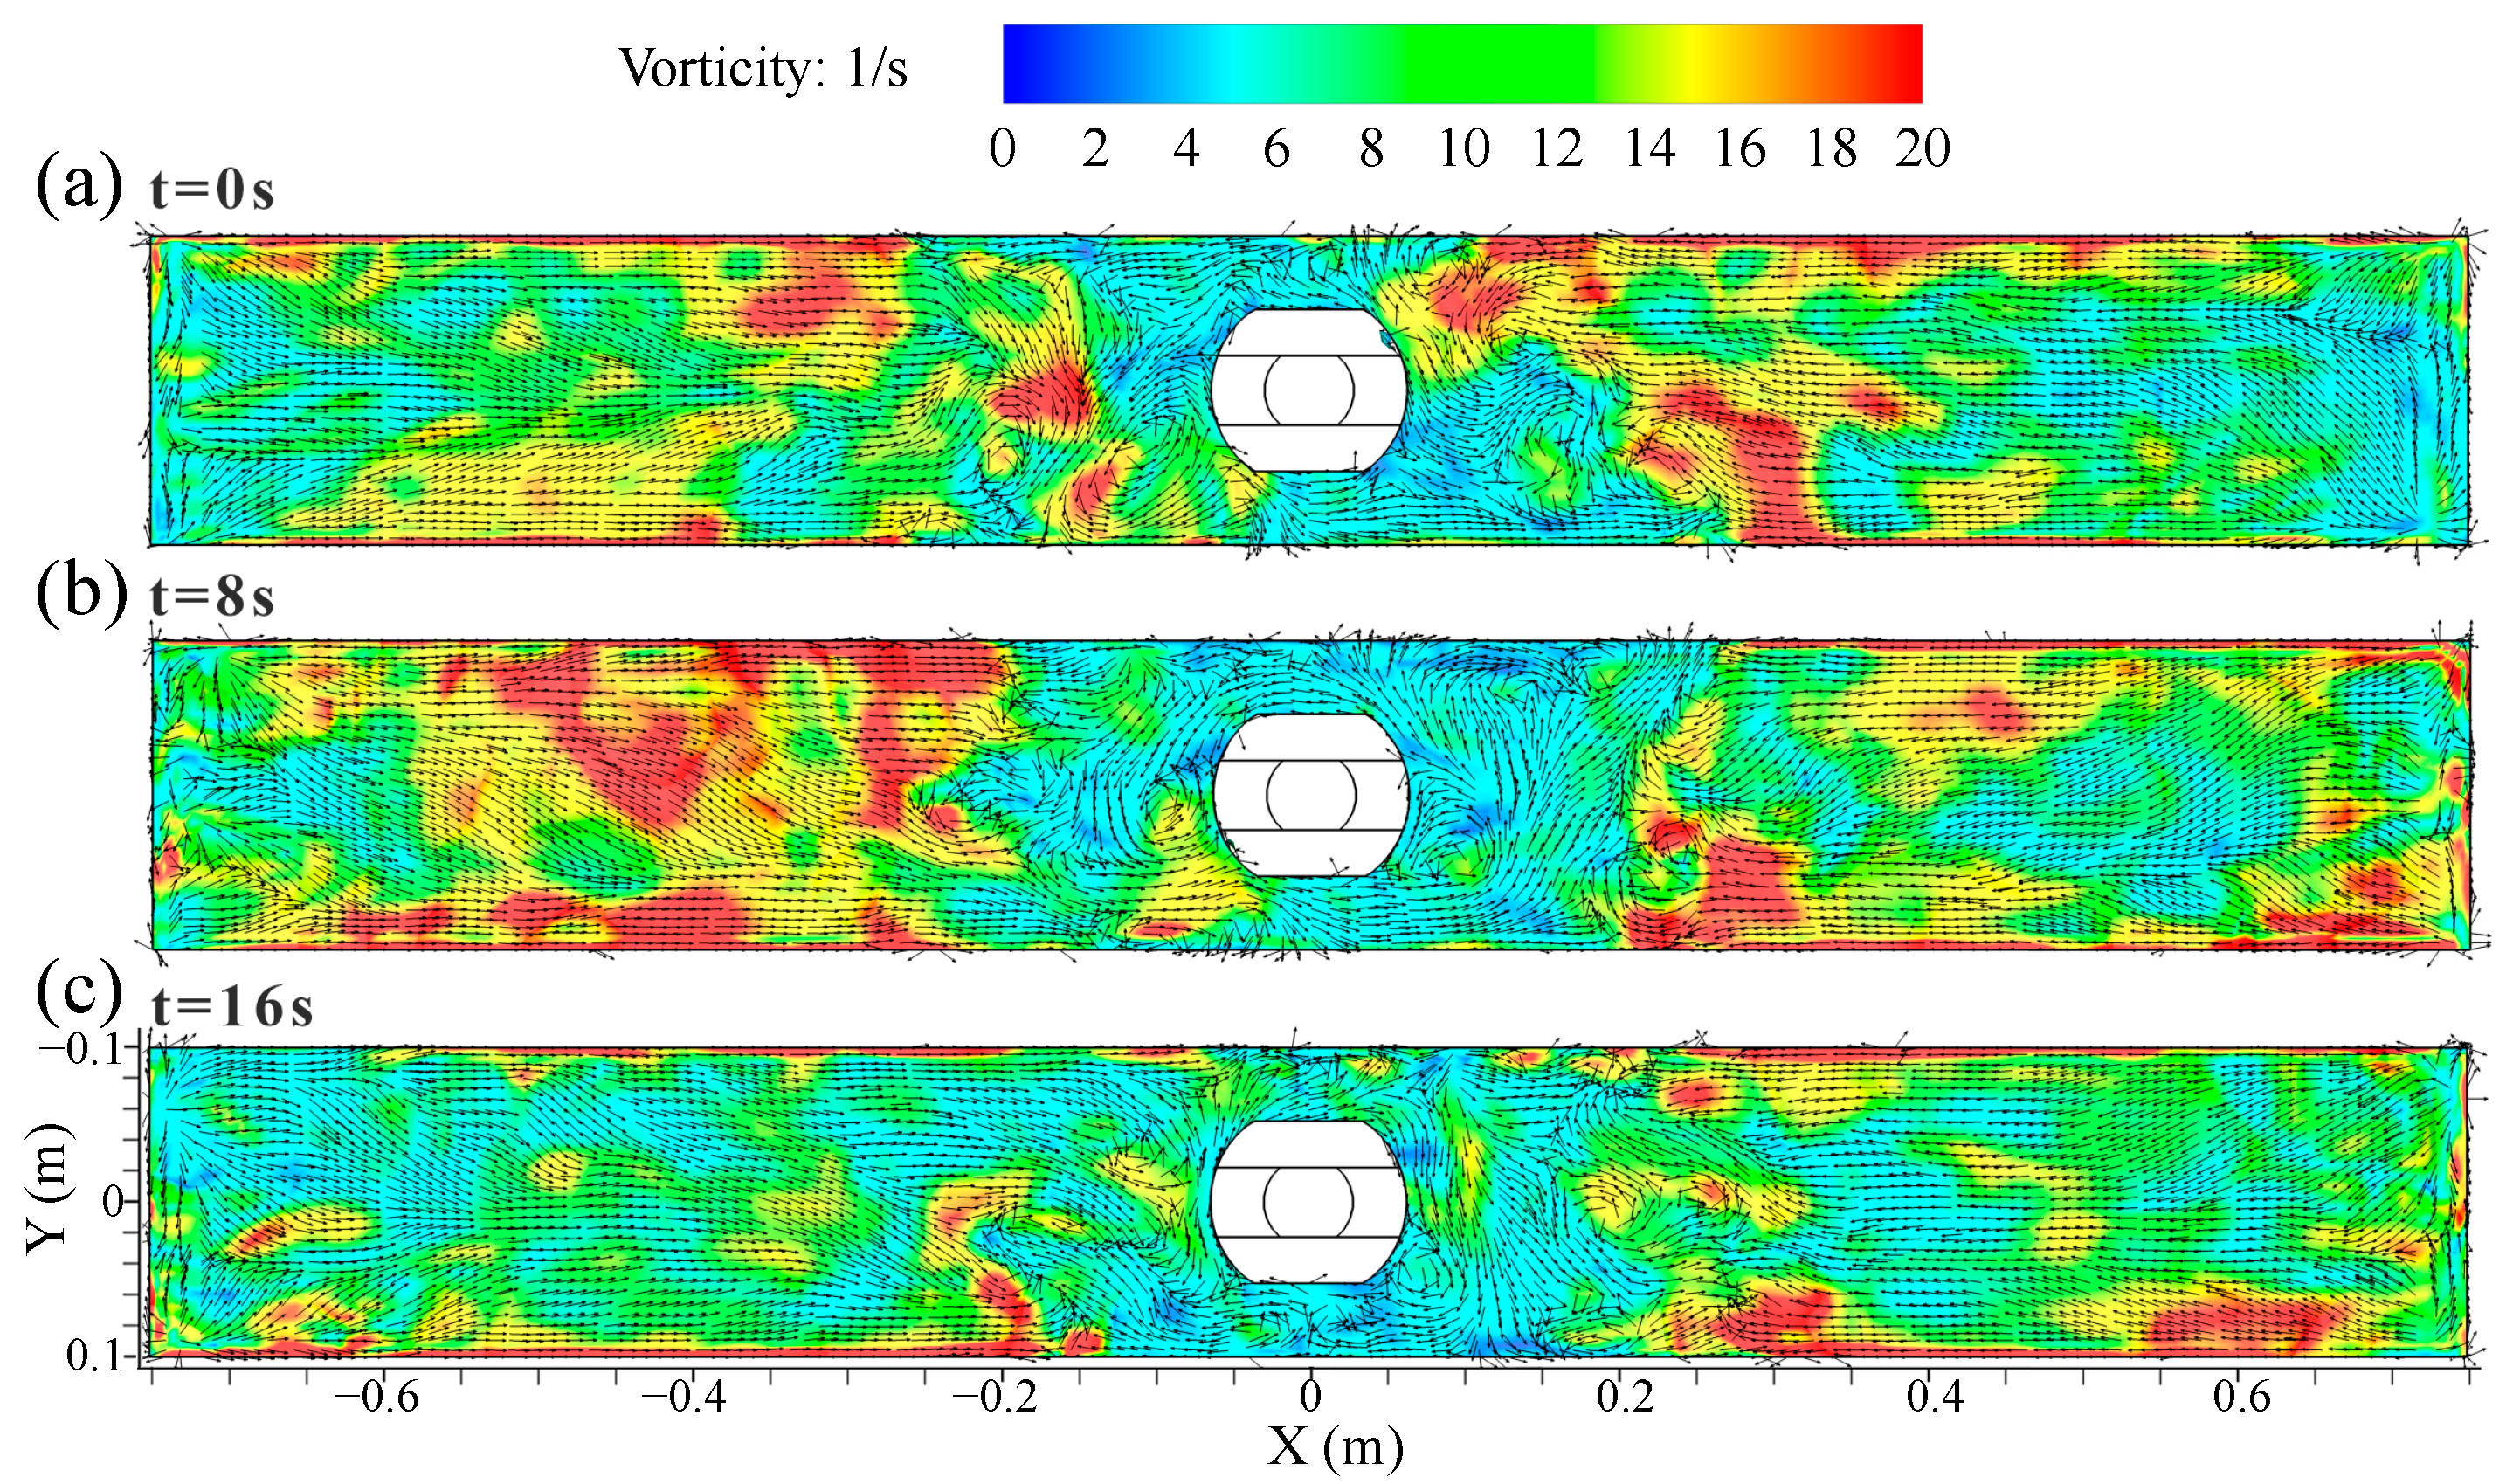
Figure 8 shows the distribution of the transient vorticity and vortex on the top surface of the mold at casting speed of 0.9 m/min. In Figure 8a–c, the vorticity had a large peak value at a certain time. When these peaks were concentrated on the outer edge of the low-speed confluence area near the SEN, it was beneficial to promote the formation of the vortex. The asymmetric vorticity distribution on the top surface of the mold was achieved via the effect of the turbulent instability.
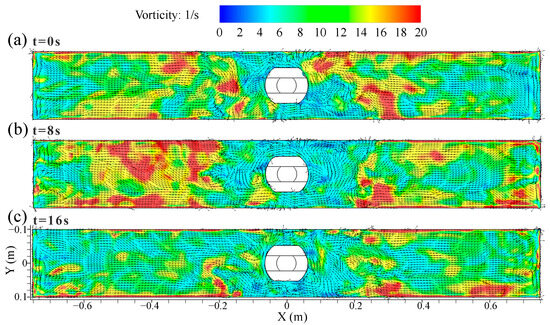
Figure 8.
Distribution of transient vorticity and vortex on the top surface of the mold at casting speed of 0.9 m/min. (a) t = 0 s. (b) t = 8 s. (c) t = 16 s.
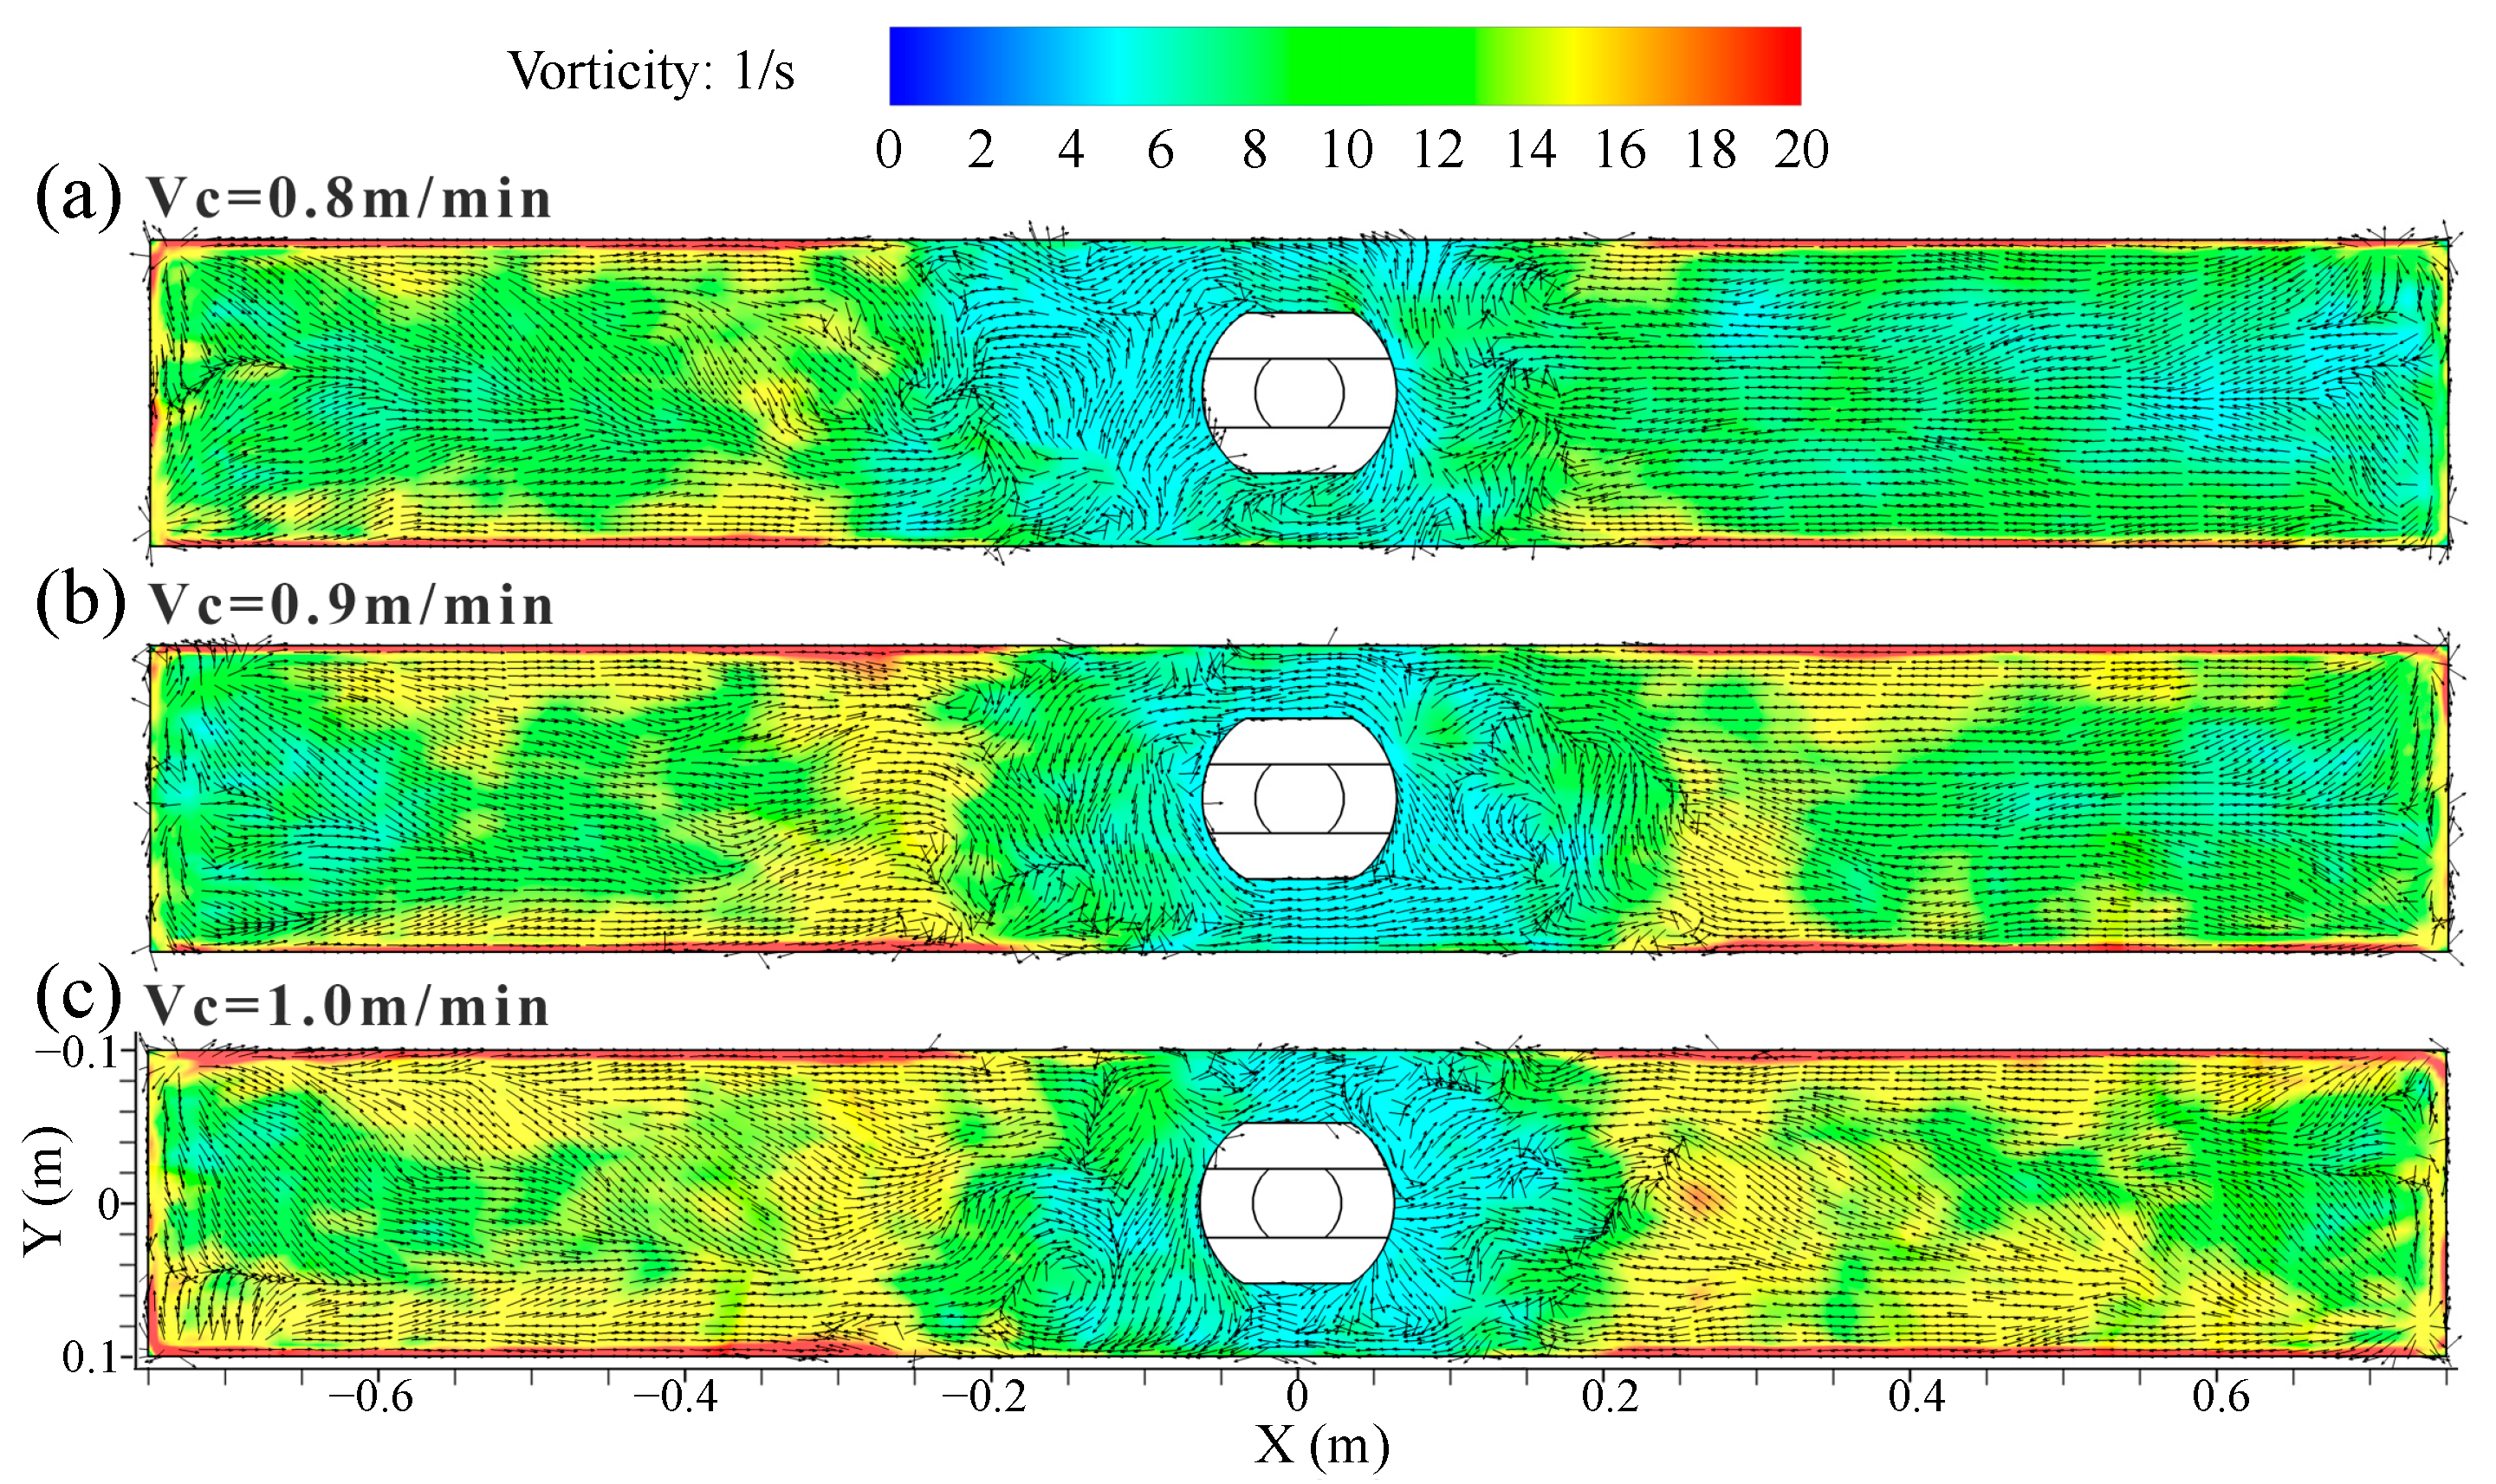
Figure 9 illustrates the distribution of time-averaged vorticity and vortex on the top surface of the mold at different casting speeds. The vorticity was mainly distributed on the edge of the low-speed confluence area of the SEN towards the narrow face, and there was also a concentrated distribution of vorticity on the circumferential edge of the mold at an average time of 30 s. The reason for this phenomenon was that vortices were made near the border of the two streams approaching from the opposite sides.
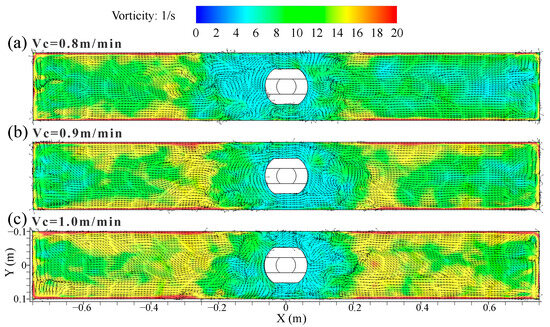
Figure 9.
Distribution of time-averaged vorticity and vortex on the top surface of the mold at different casting speeds. (a) Vc = 0.8 m/min; (b) Vc = 0.9 m/min; (c) Vc = 1.0 m/min.
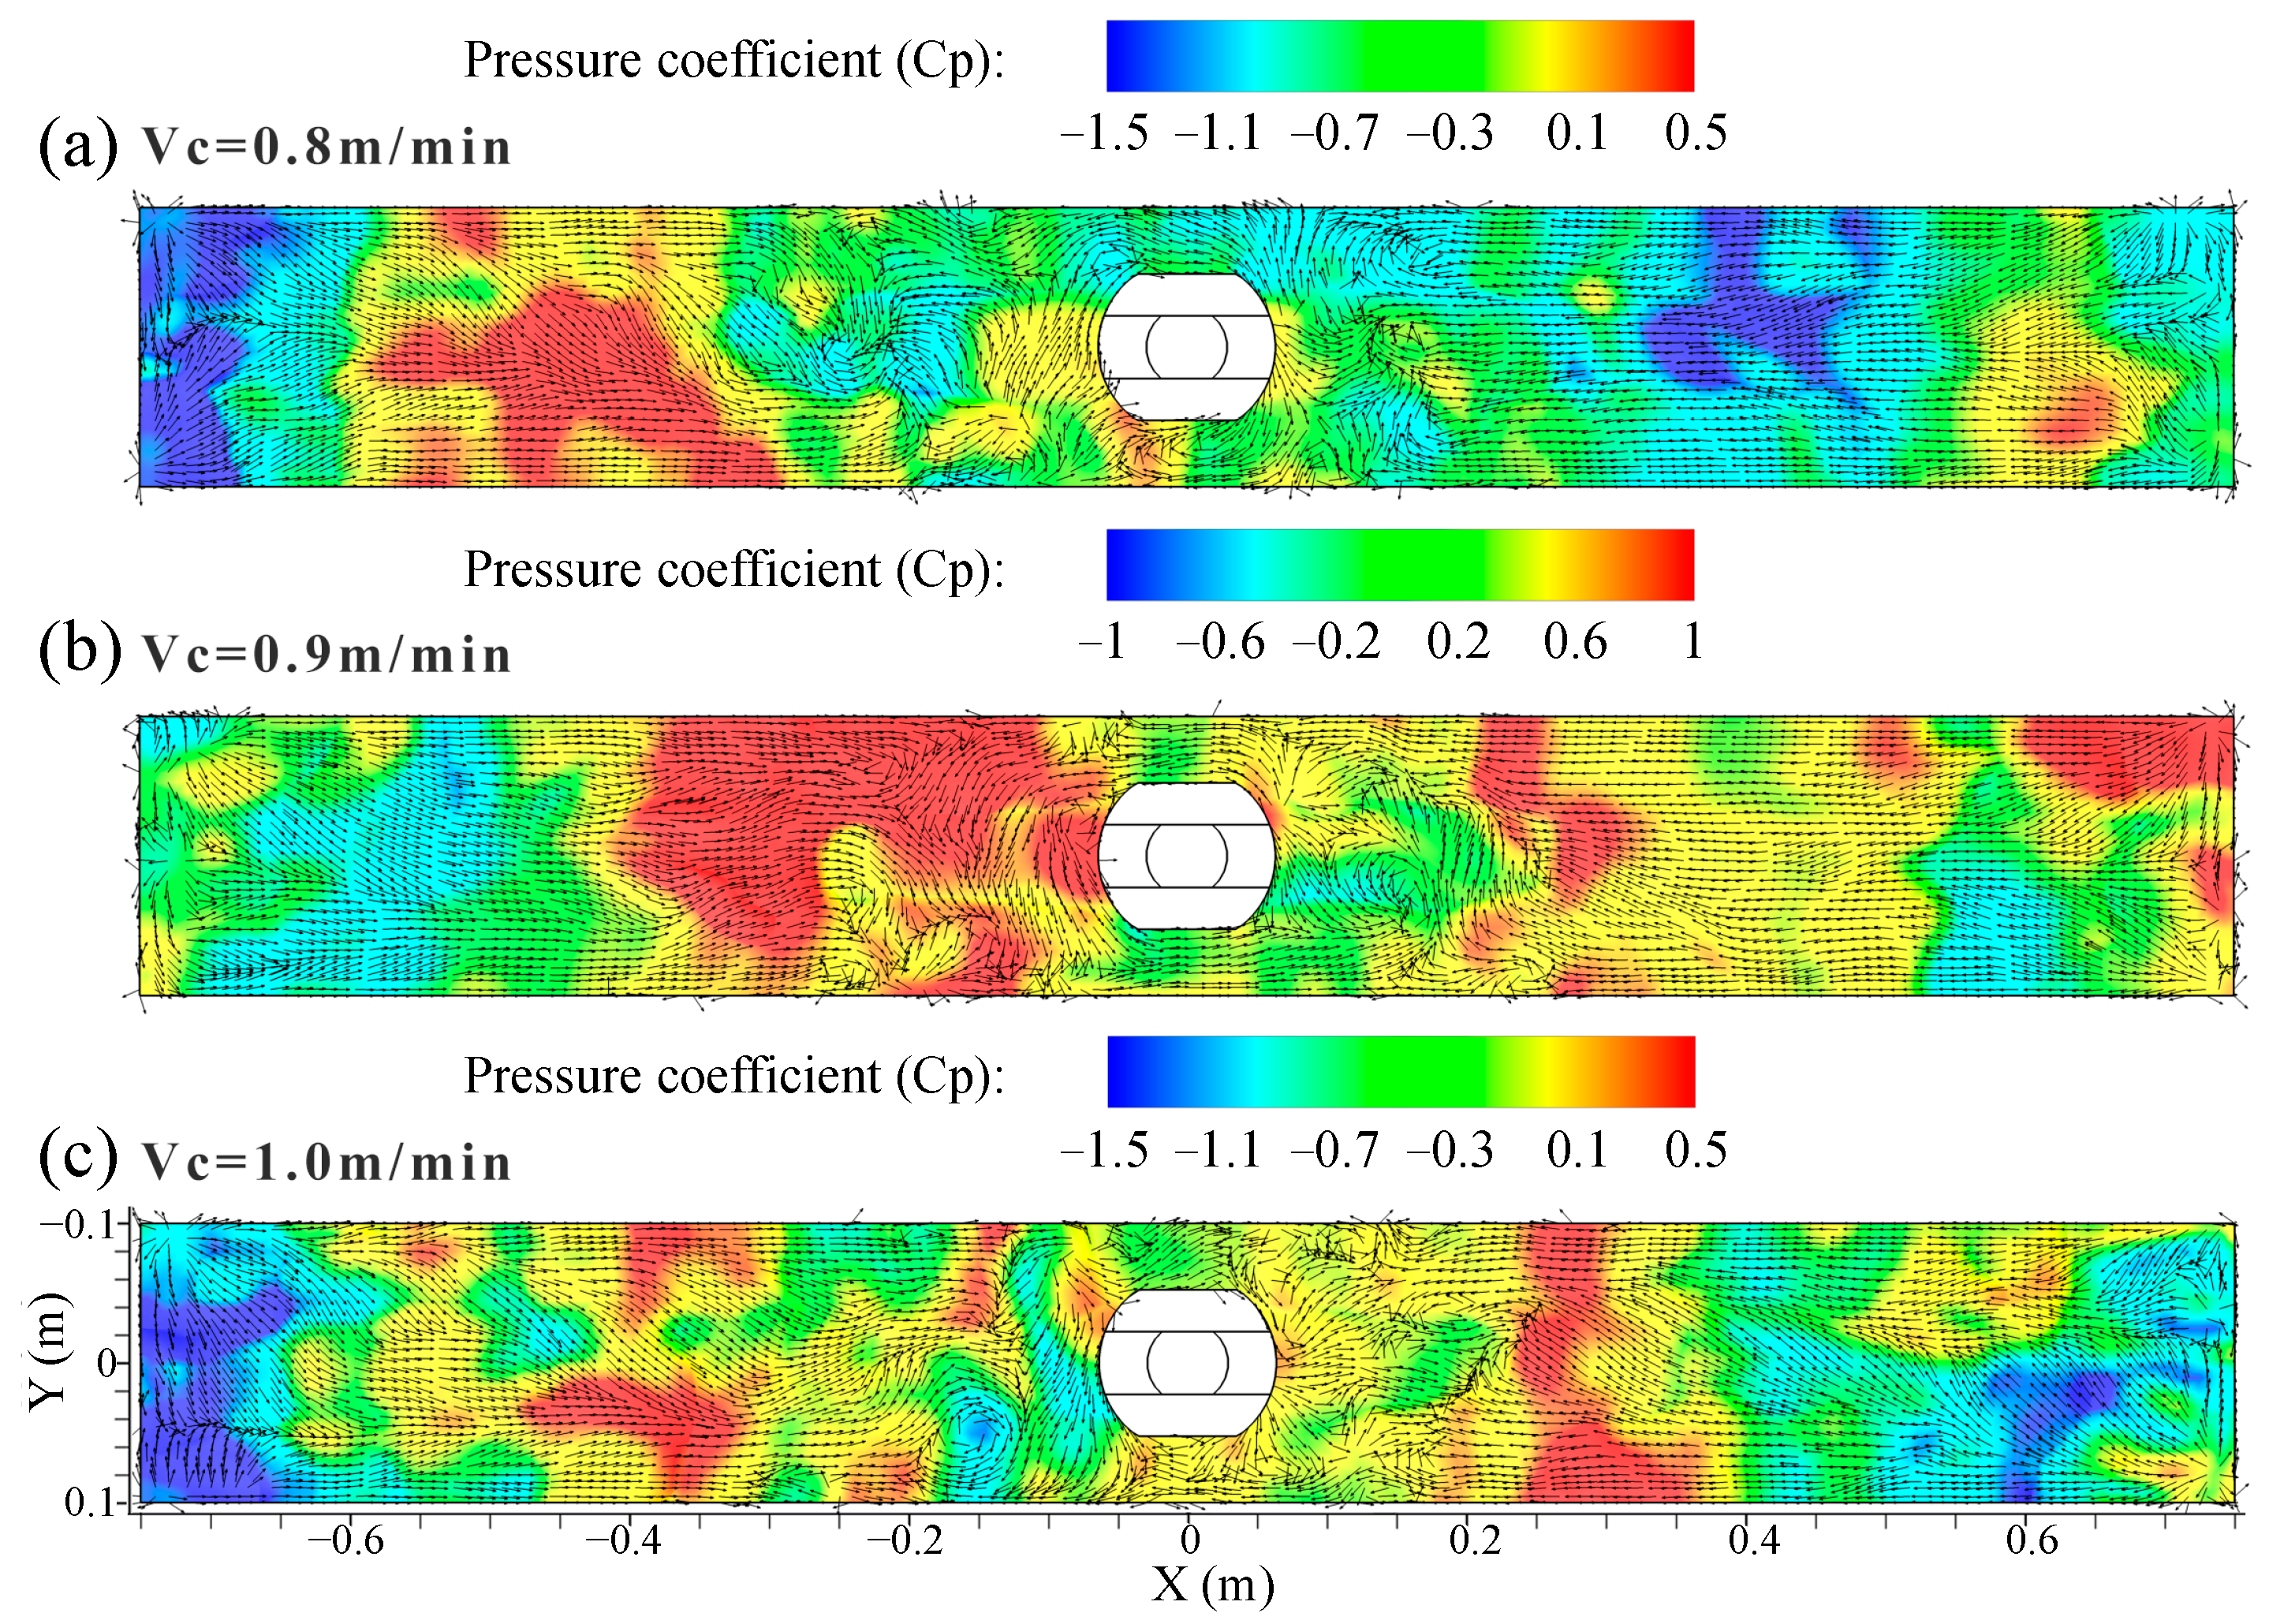
The distribution of time-averaged pressure coefficient on the top surface of the mold at different casting speeds is shown in Figure 10. The relative pressure of the top surface is expressed by the pressure coefficient, Cp, and the equation is given by
where Px is the local static pressure of top surface in Pa, P0 is the reference static pressure in Pa, and Pd is the dynamic pressure in Pa.
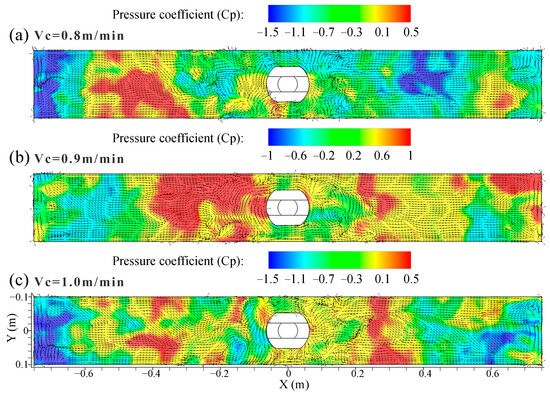
Figure 10.
Distribution of time-averaged pressure coefficient on the top surface of the mold at different casting speeds. (a) Vc = 0.8 m/min; (b) Vc = 0.9 m/min; (c) Vc = 1.0 m/min.
The dynamic pressure is calculated as:
where ρ is the density of the mixed melt in kg/m3, and is the velocity of the mixed melt in m/s, respectively.
From Figure 10a–c, there is a low pressure zone near the narrow face of the mold, and the pressure in the low-speed confluence zone close to the SEN is higher than that near the narrow face. The pressure in the vortex center was obviously lower, which was more obvious on the left side of the SEN along the mold width at 1.0 m/min casting speed. Overall, the area where the relative pressure of the top surface was low can appear near the narrow face or close to the 1/4 mold width.
4.4. Effect of Surface Flow Velocity on Instantaneous Level Fluctuation
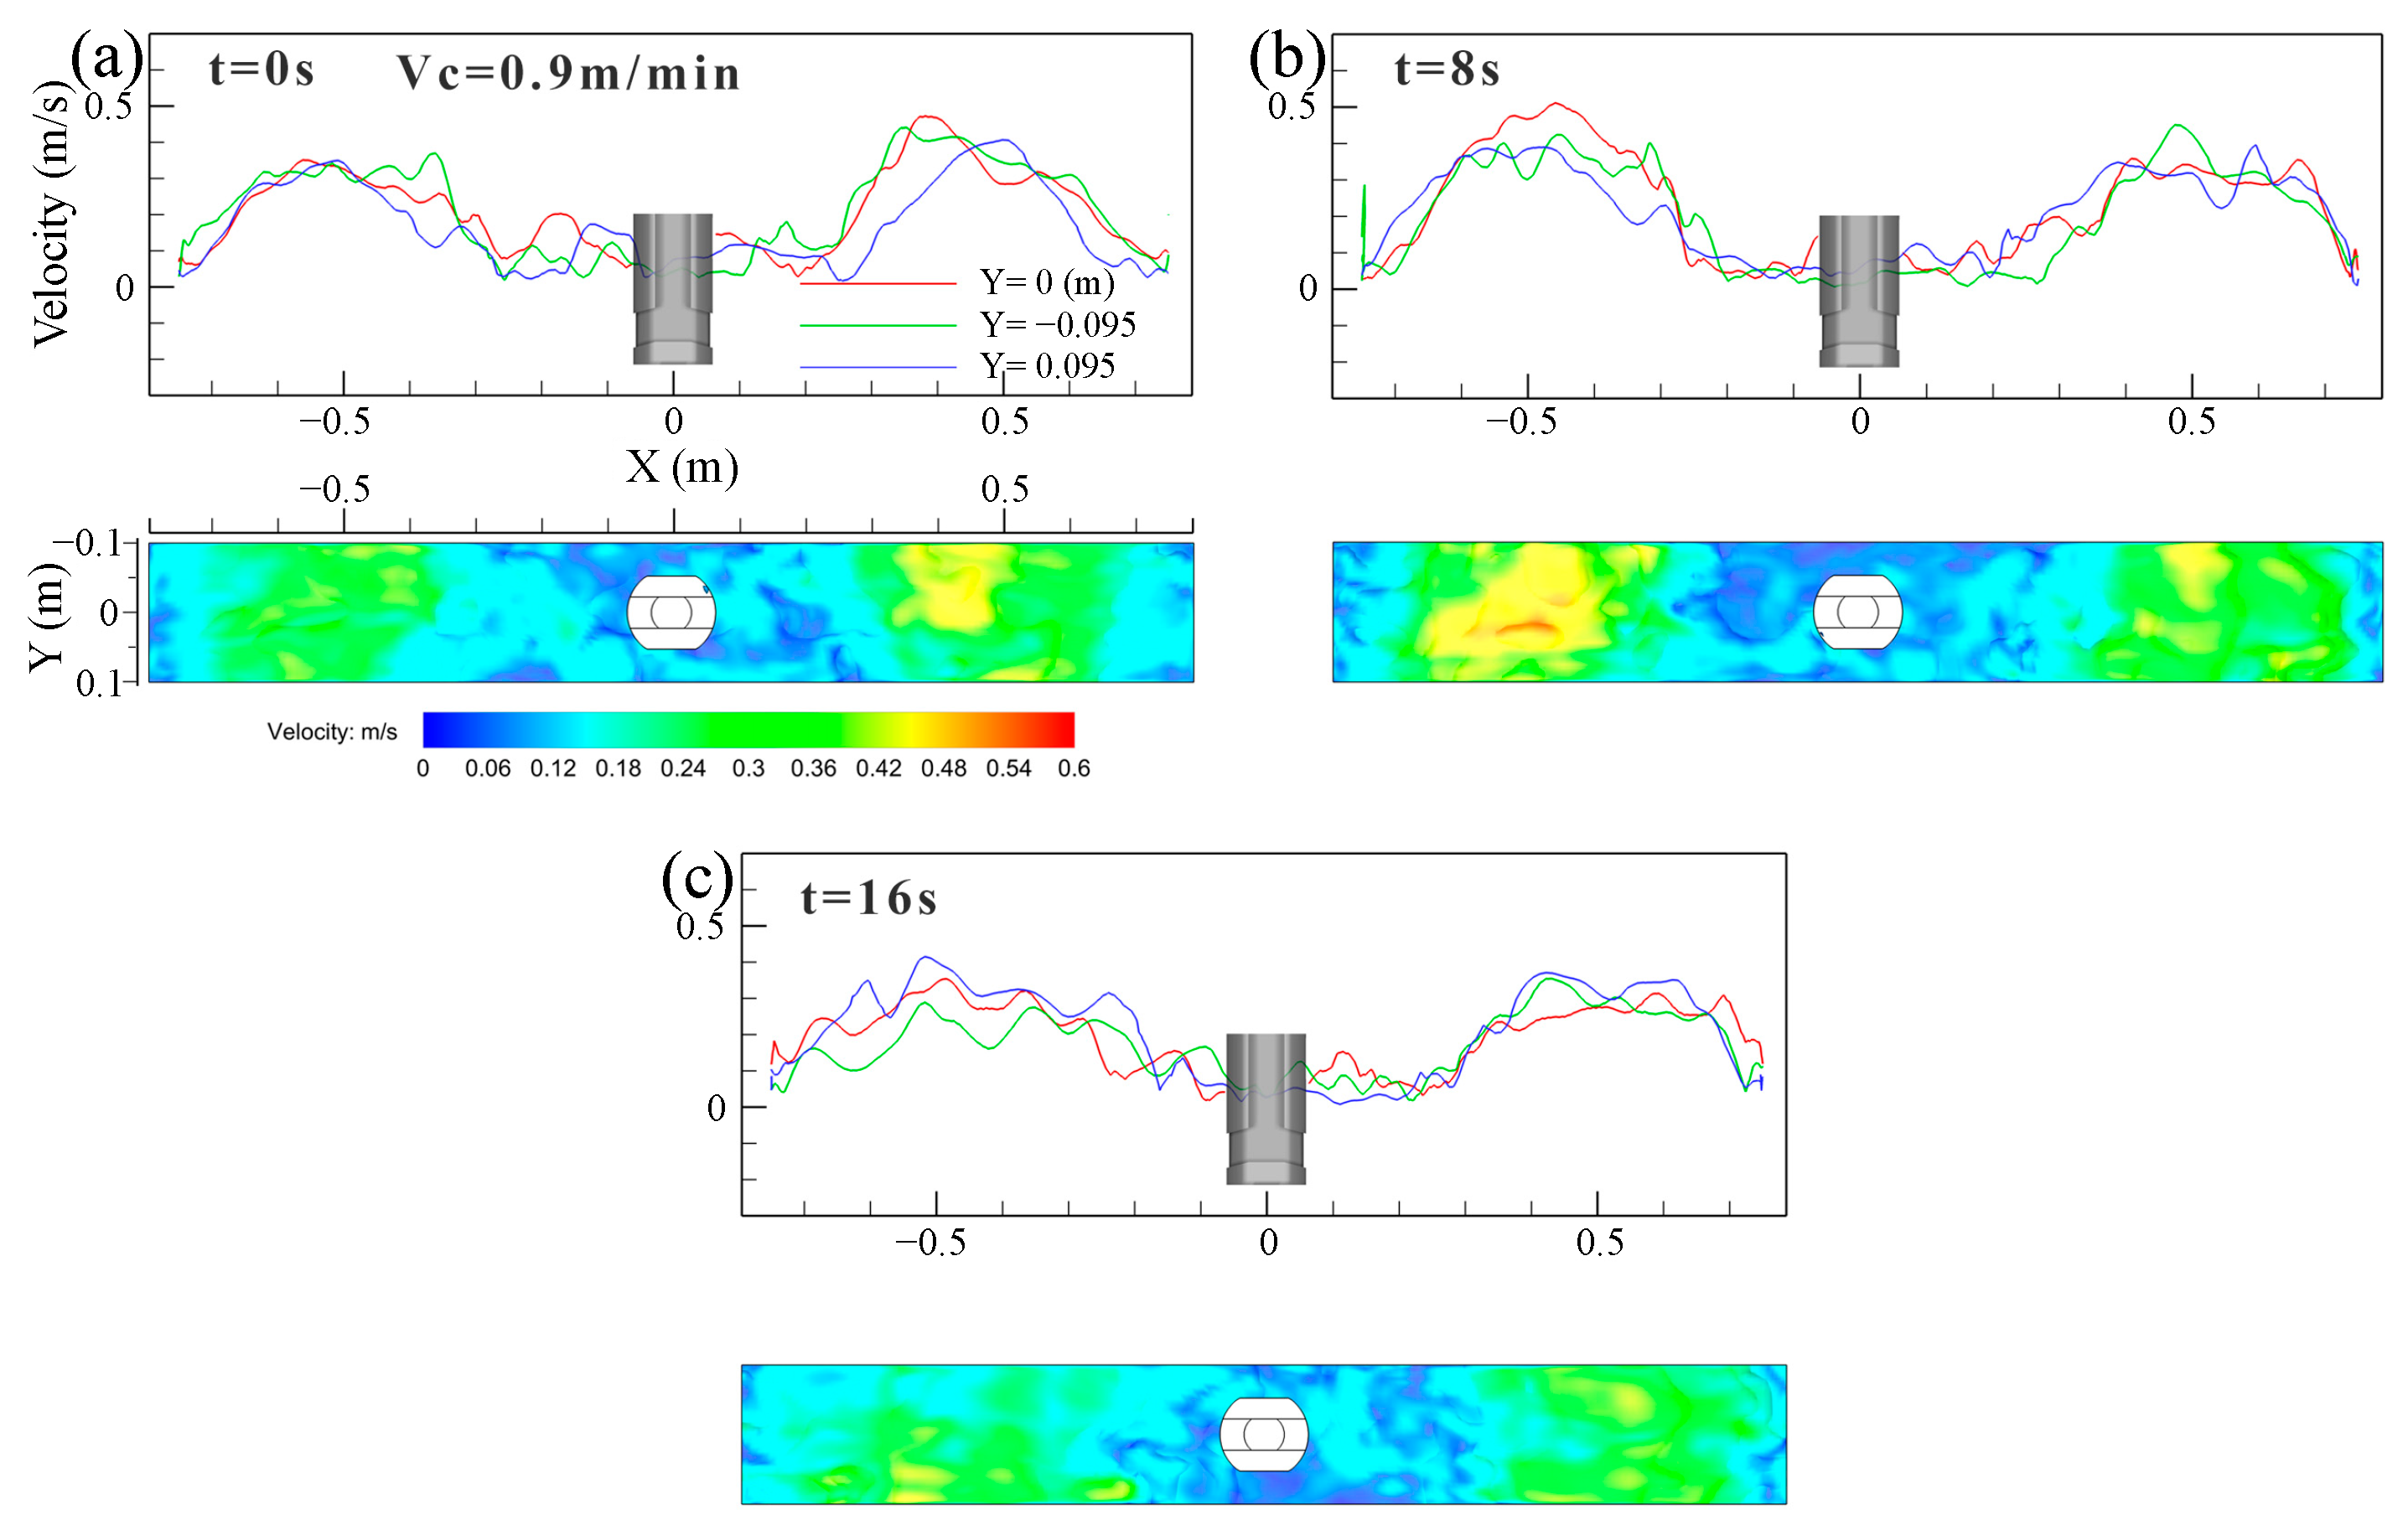
The transient velocity of molten steel near the top surface of the mold at casting speed of 0.9 m/min is shown in Figure 11. In Figure 11a–c, the transient velocity of the molten steel near the top surface shows a saw-tooth level fluctuation, which changes with the casting time, and the symmetry of the top surface on both sides of the SEN disappears. The results shown that the fluctuation of the transient surface velocity on both sides of the SEN was disordered and violent.
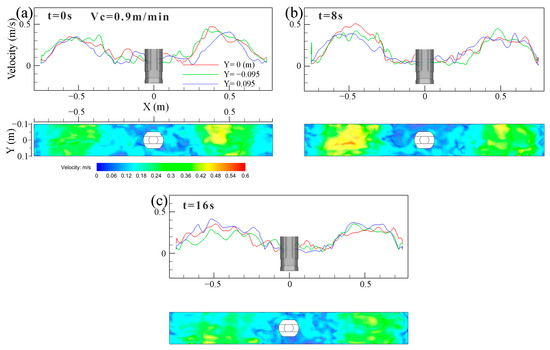
Figure 11.
Transient velocity distribution of molten steel near the top surface of the mold at casting speed of 0.9 m/min. (a) t = 0 s. (b) t = 8 s. (c) t = 16 s.
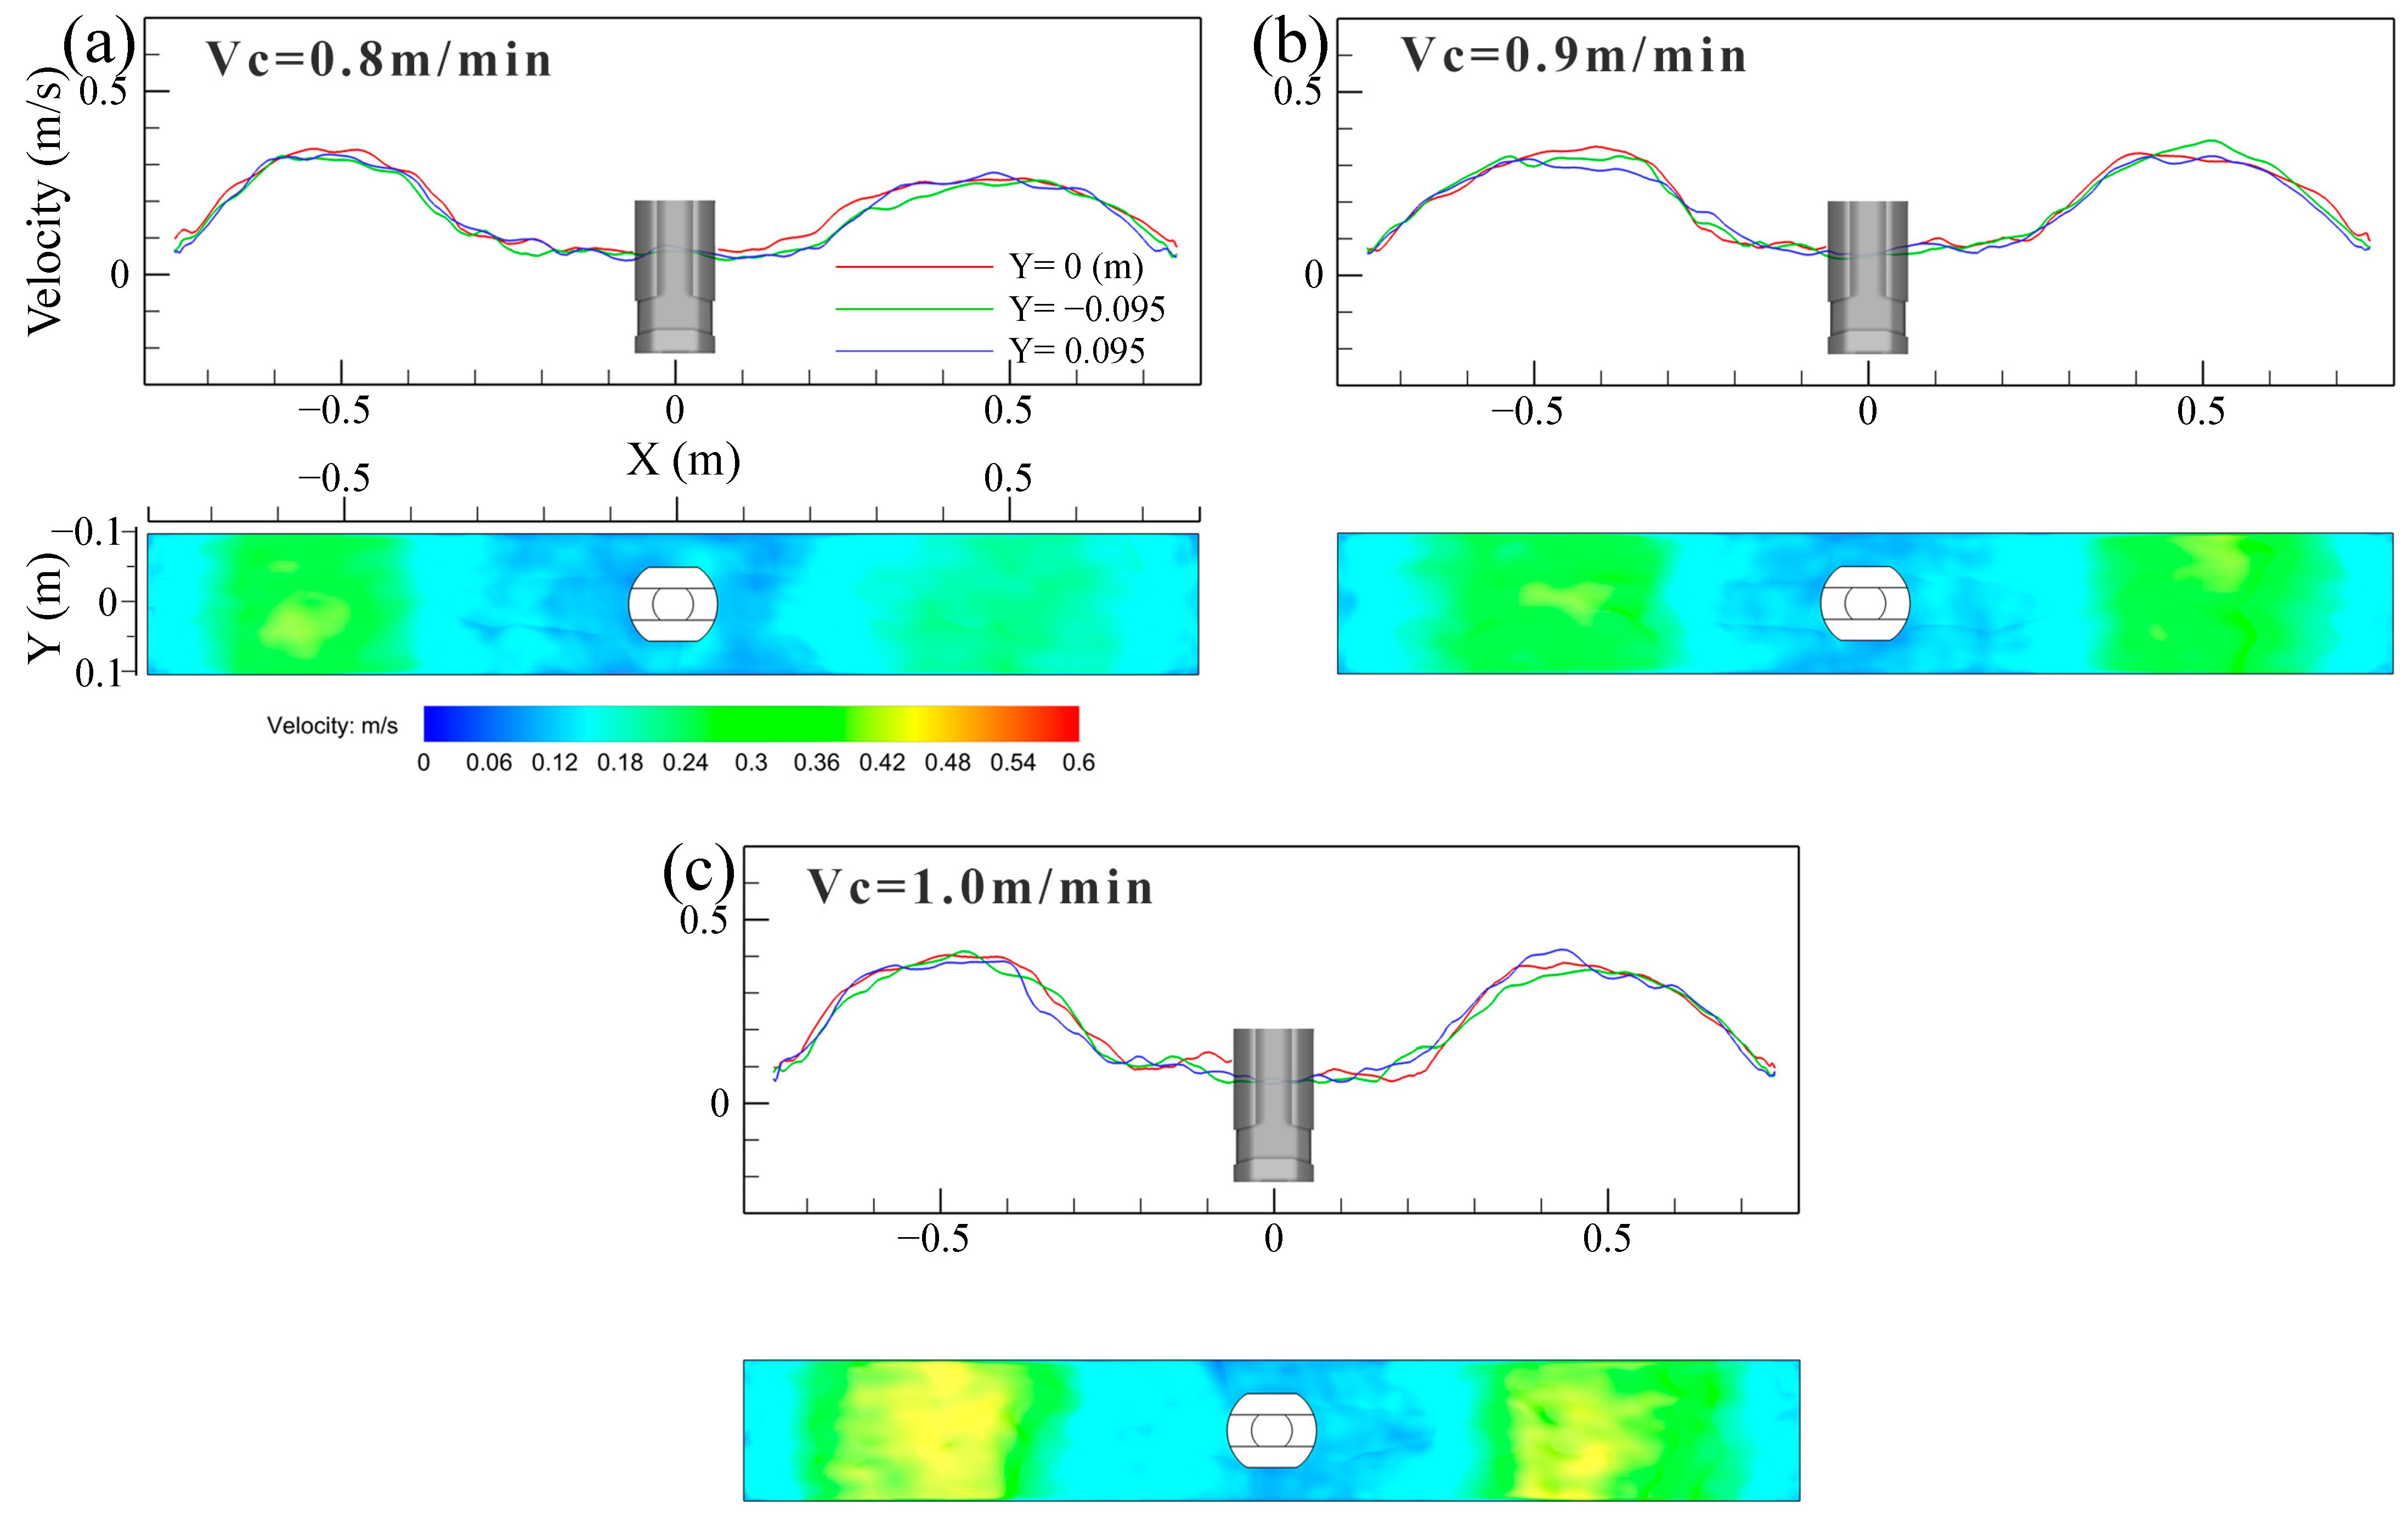
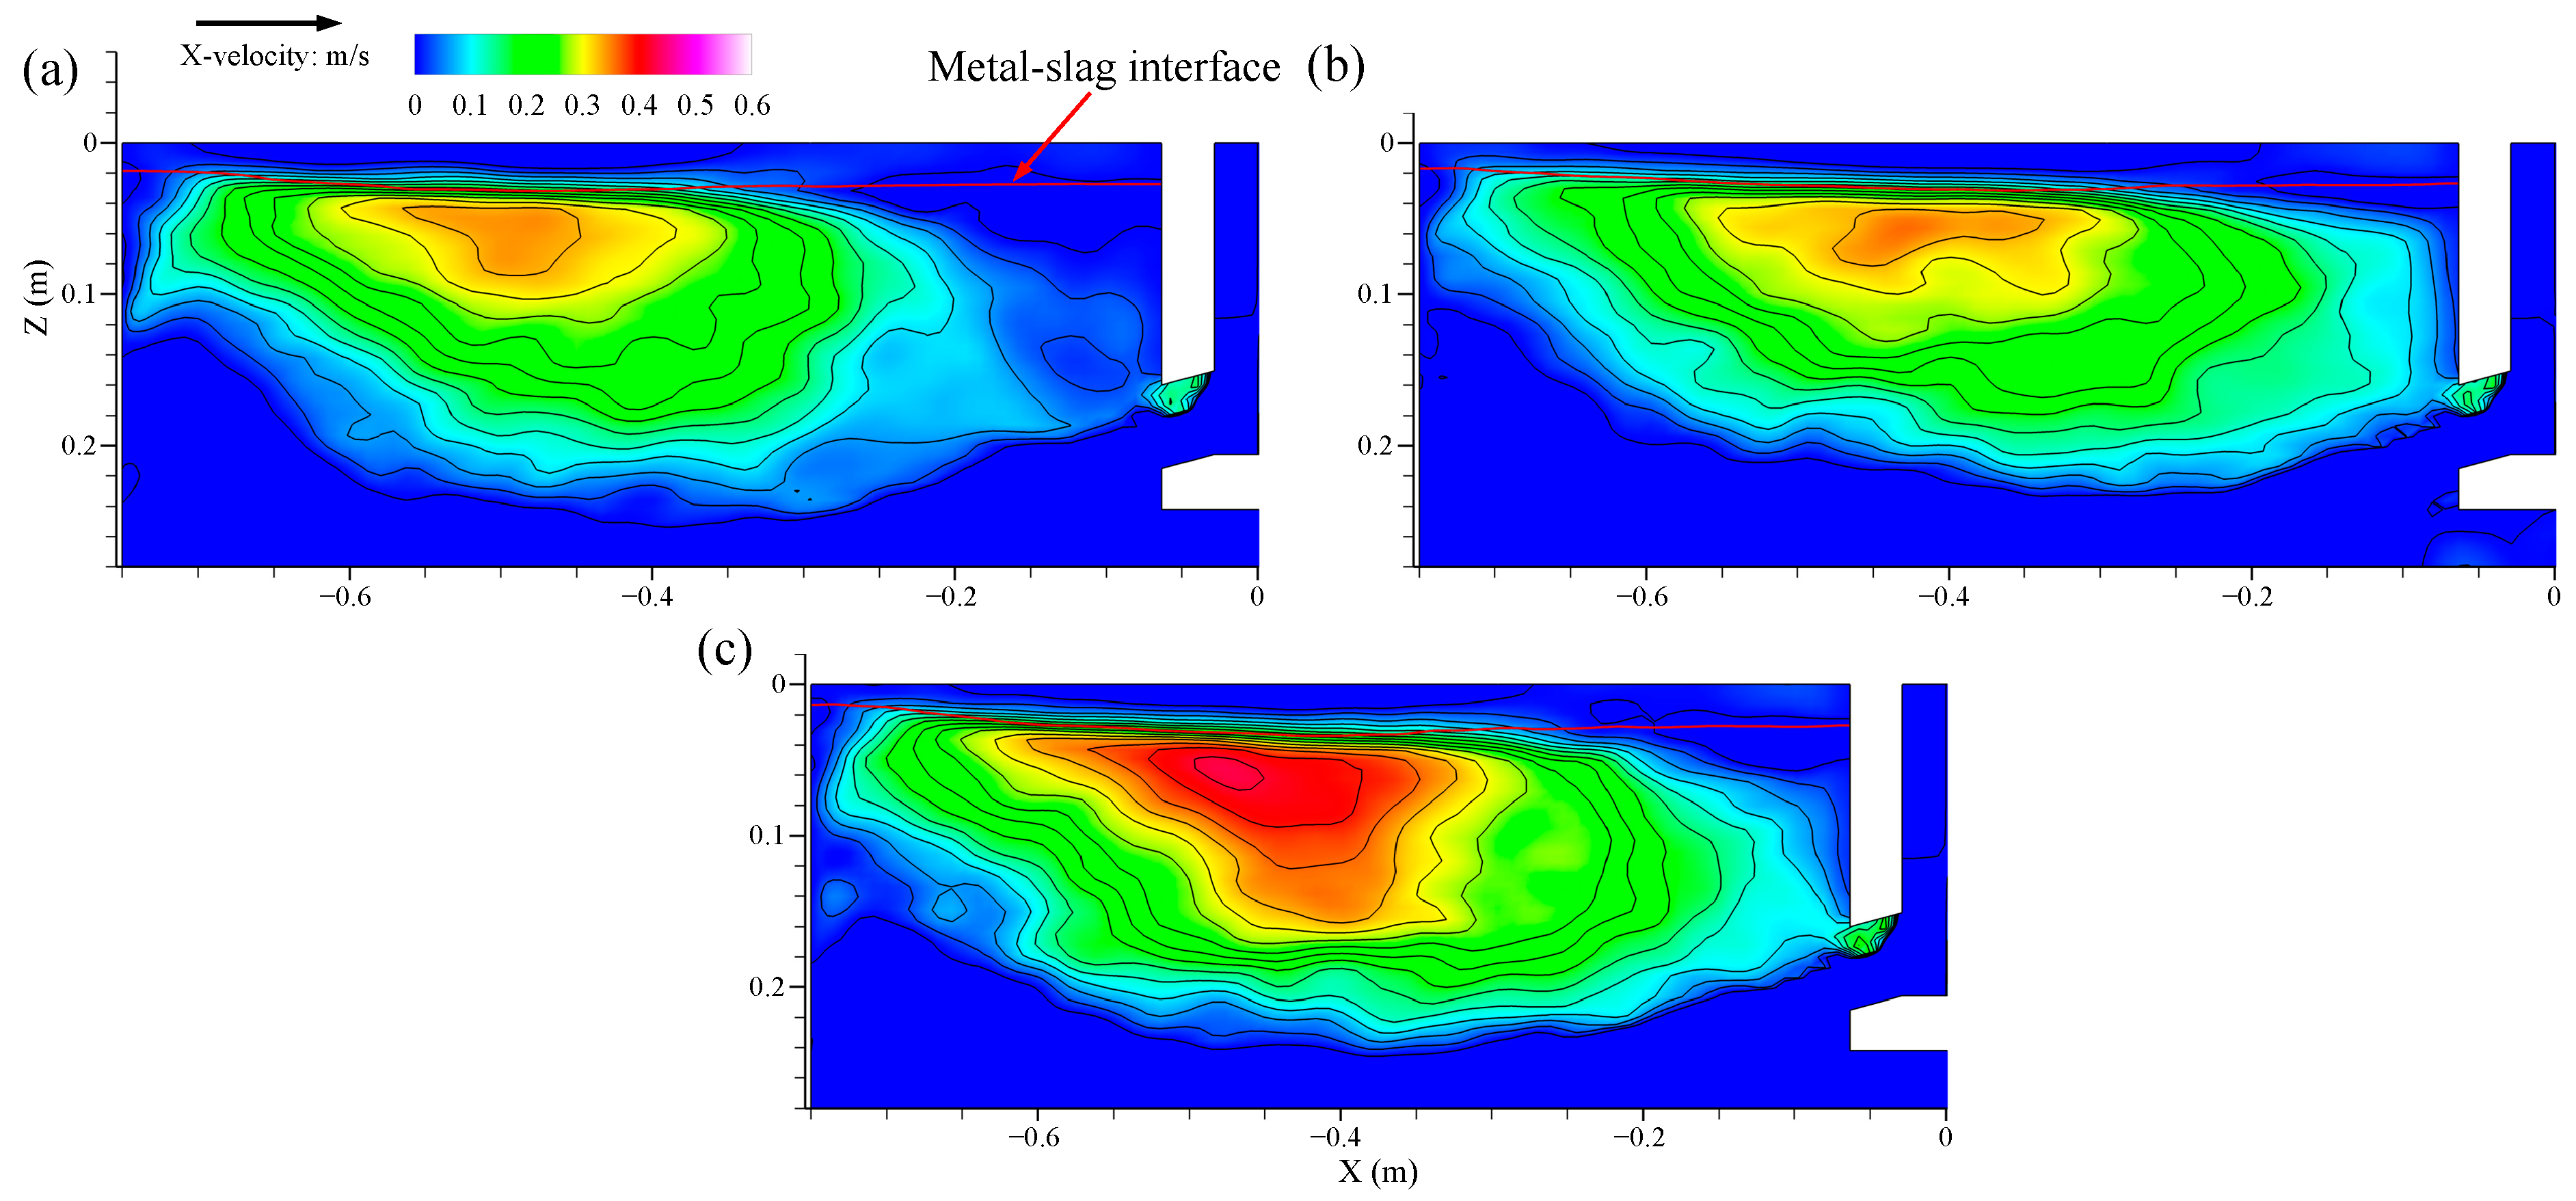
Figure 12 illustrates the distribution of time-averaged (30 s) velocity of the molten steel near the top surface of the mold at different casting speeds. The time-averaged velocity of molten steel distribution on both sides of the SEN is approximately symmetrical. The velocity was high at the 1/4 mold width, while it was low close to the narrow face and the SEN. As a whole, the surface velocity was derived from the impinged effect of the upper roll flow. If the casting speed was large, the upper roll flow had a larger momentum and velocity, and a larger impact on the meniscus resulted in a larger velocity.
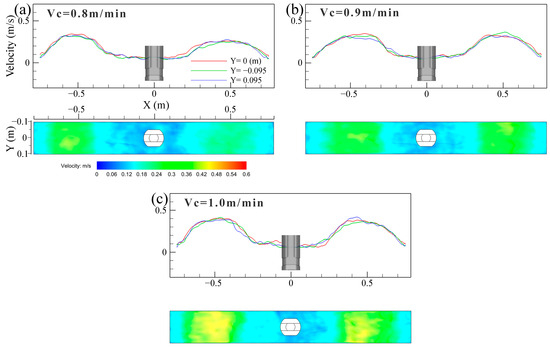
Figure 12.
Distribution of time-averaged (30 s) velocity of molten steel near the top surface of the mold at different casting speeds. (a) Vc = 0.8 m/min; (b) Vc = 0.9 m/min; (c) Vc = 1.0 m/min.
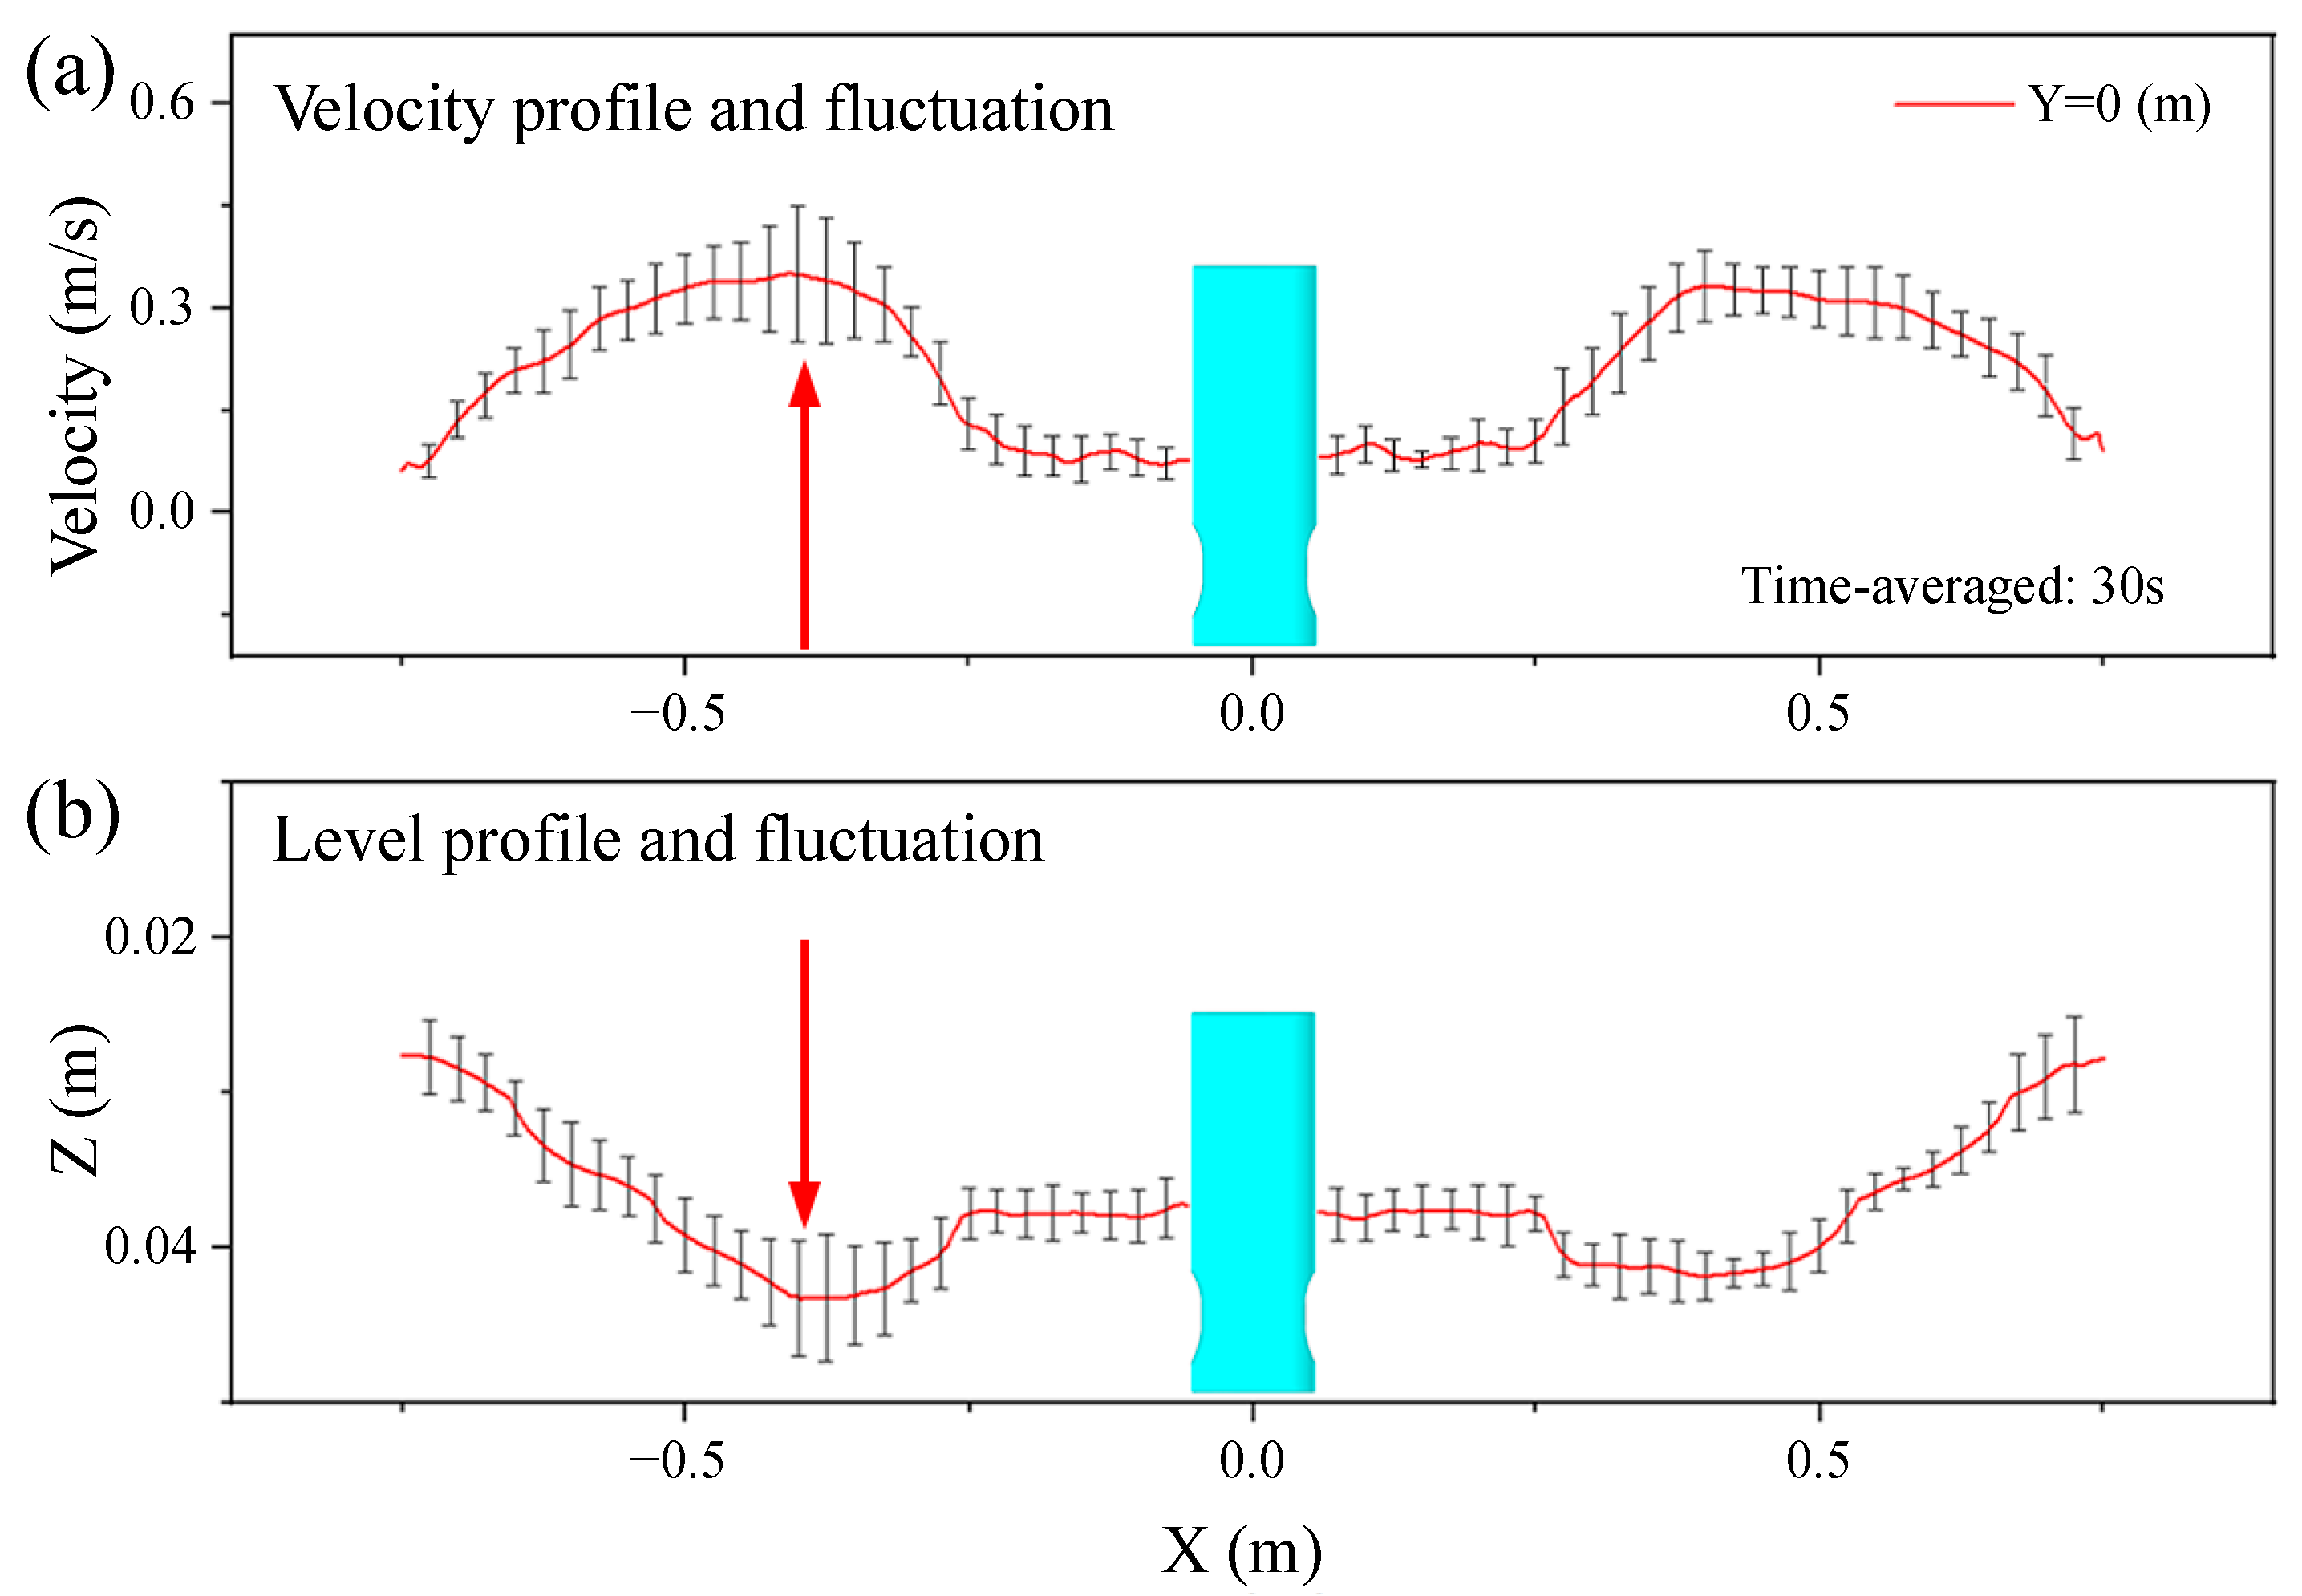
Figure 13 shows the distribution of velocity profile, level profile, and level fluctuation on the top surface along the mold thickness center at 0.9 m/min casting speed. The distribution of the centerline velocity and the corresponding level fluctuation of the top surface are shown in Figure 13a. The velocity fluctuation was larger at the 1/4 mold width, and it was smaller at the low speed zone near the narrow face and the SEN. The strong surface velocity and its fluctuation made it easy to cause the slag entrainment [38,39]. The distribution of the centerline level profile and the corresponding fluctuation of the top surface is shown in Figure 13b. The top surface level was the largest at the 1/4 mold width, which was consistent with the change trend of the velocity fluctuation. The liquid level fluctuation near the narrow surface was larger than that near the SEN.
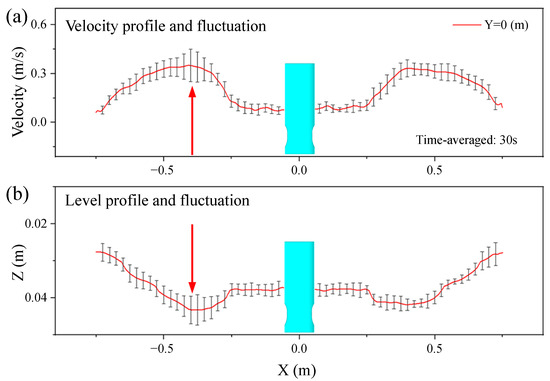
Figure 13.
Distribution of velocity profile, level profile, and fluctuation on the top surface along the mold thickness center. (a) Velocity profile and fluctuation; (b) Level profile and fluctuation.
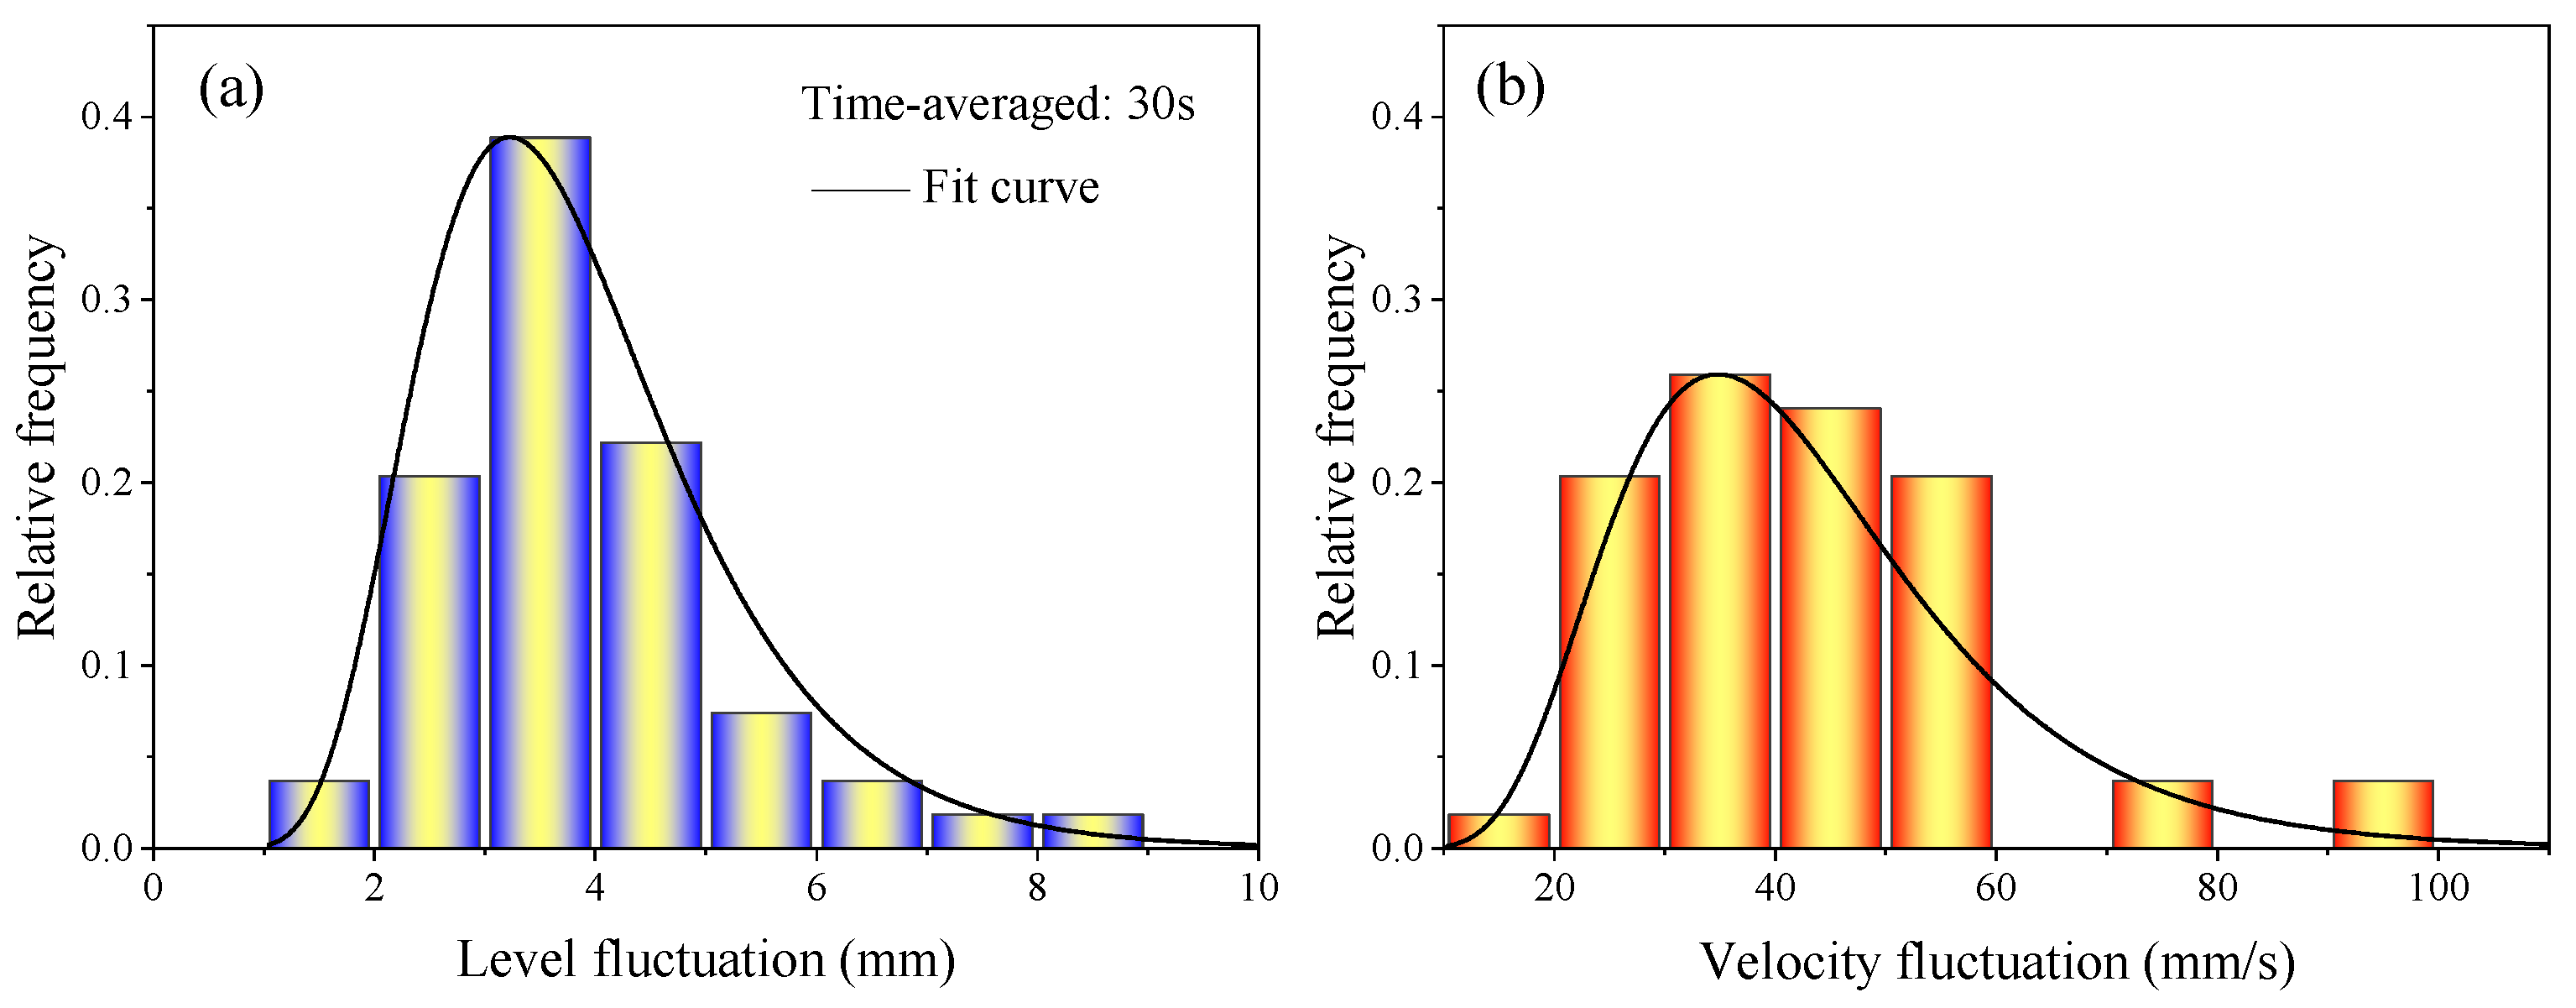
The relative frequency distribution of the liquid level fluctuation and the velocity fluctuation magnitude on the top surface of the mold at 0.9 m/min casting speed is shown in Figure 14. The frequency of the level fluctuation at 2~6 mm was higher, and the level fluctuation at 3~4 mm was the highest frequency, which occupied the main position, as shown in Figure 14a. The high frequency range of velocity fluctuations was 20~60 mm/s, of which 30~40 mm/s occupied the main position, as shown in Figure 14b.
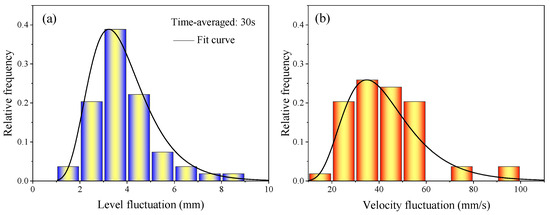
Figure 14.
Relative frequency distribution of liquid level fluctuation and velocity fluctuation magnitude on the top surface of the mold. (a) Liquid level fluctuation; (b) velocity fluctuation.
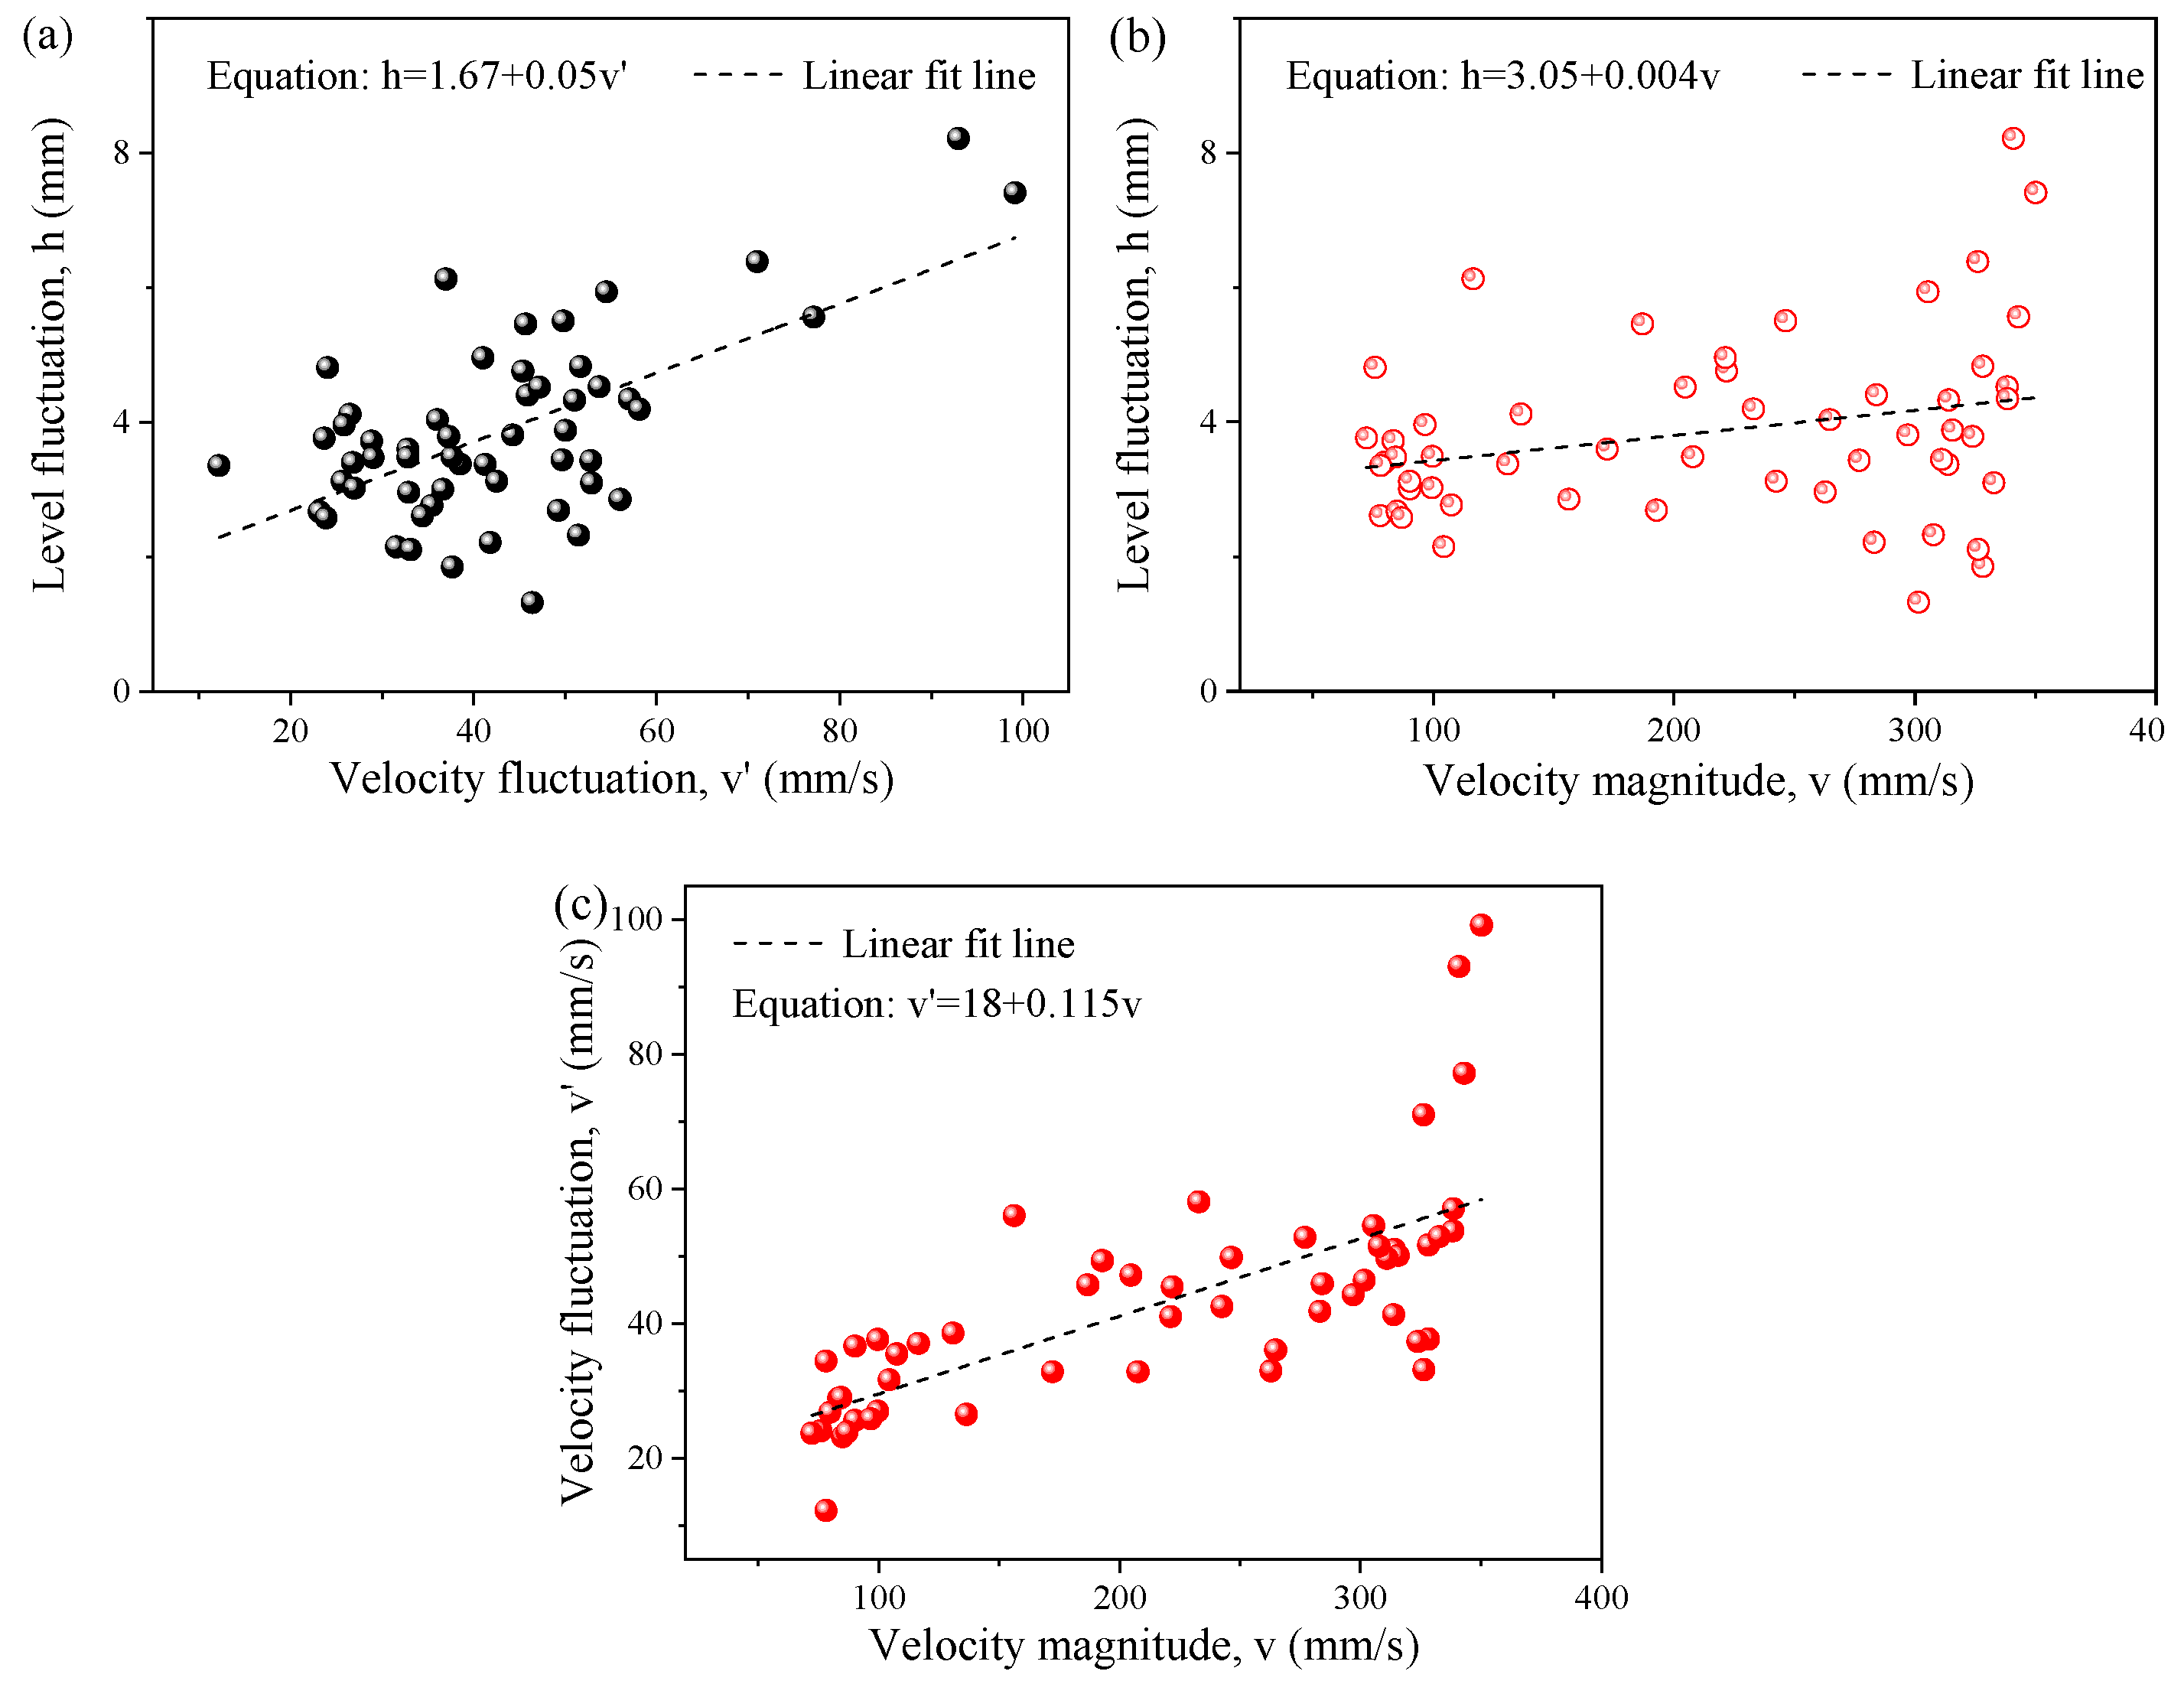
Figure 15 shows the relationship between the surface velocity, surface velocity fluctuation, and liquid level fluctuation. The level fluctuation increased with an increase in the velocity fluctuation, as shown in Figure 15a, and the velocity fluctuation also increased with the increase in velocity magnitude, as shown in Figure 15c, which indicated that there was a positive correlation between the level fluctuation and the surface velocity magnitude, as shown in Figure 15b. Therefore, the level fluctuation can be controlled by adjusting the surface velocity magnitude. The greater the surface velocity, the stronger the trend of the shearing slag entrainment. The fitting relationship between the level fluctuation and the surface velocity magnitude was:
where h is the magnitude of the level fluctuation in mm, and v is the surface velocity magnitude in mm/s, respectively.
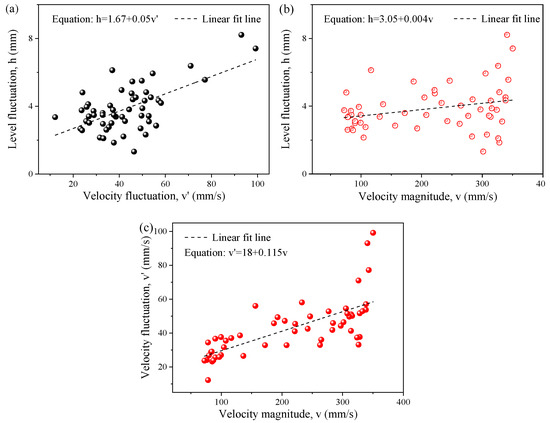
Figure 15.
Relationship between the surface velocity, surface velocity fluctuation, and liquid level fluctuation. (a) Velocity fluctuation and level fluctuation; (b) velocity magnitude and level fluctuation; (c) velocity magnitude and velocity fluctuation.
Figure 16 shows the comparison of the velocity gradient at the X-axis of the slag–steel interface at different casting speeds. The horizontal velocity along the mold width increased with the increase in the casting speed. The magnitude of the surface velocity in the X direction directly affected the magnitude of the shear force. The horizontal velocity gradient at the 1/4 mold width was larger, indicating that the shear force was stronger, which meant it was easier to induce the slag entrainment [27].
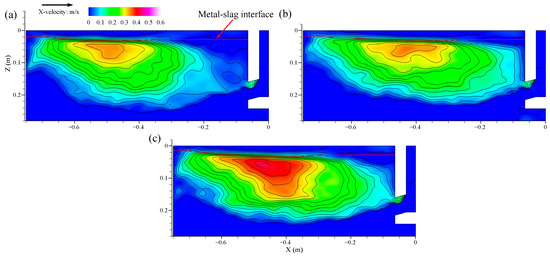
Figure 16.
Comparison of the velocity gradient at the X-axis of slag–steel interface at different casting speeds. (a) Vc = 0.8 m/min; (b) Vc = 0.9 m/min; (c) Vc = 1.0 m/min.
5. Conclusions
In the current study, the transient flow characteristics on the top surface of a steel slab CC strand was studied using a LES + VOF model. The simulation results of the molten steel speed along the thickness center line of the top surface of the mold matched well with the nail board measurements. The effects of casting speeds on TSLP and instantaneous distribution of vortex were discussed. In addition, the effects of surface flow velocity on instantaneous level fluctuations were analyzed, and quantitative research has been conducted on the relationship between the velocity of the surface flow and level fluctuations of the slab mold. This work is helpful in optimizing the casting parameters for regular casting practices in a steel plant, contributing to the production of defect-free continuous cast slabs, and improving the production efficiency. Our conclusions are summarized as follows:
- The level variation profile migrated after a period of time, moving from one width side of the mold to the other side. Under the DRF pattern, with the increase in the casting speed, the SW height of the top surface increased, and the transient fluctuation degree of the wave height increased.
- The vortex on the top surface of the mold was easy to generate in the low-speed confluence area near the SEN. The velocity, vorticity, and relative pressure of the vortex center were small, while the velocity and vorticity of the edge were large. When the vorticity peak was concentrated on the outer edge of the low-speed confluence zone close to the SEN, it was beneficial to promote the formation of the vortex.
- The surface velocity fluctuation was larger at the 1/4 mold width, and it was smaller at the low-speed zone near the narrow face and the SEN. The level fluctuation increased with an increase in the velocity fluctuation, and the velocity fluctuation increased with the increase in velocity magnitude. The level fluctuation as a function of the surface velocity magnitude was predicted. The results of this study are expected to help us develop and preliminarily verify various ideas for suppress the slag entrainment.
6. Future Work
In this study, we primarily discussed the effects of casting speed on the top surface flow characteristics for a 1500 mm × 200 mm mold in a steel plant under constant submergence depth conditions. However, in the actual production, the submergence depth of the SEN was subject to change, especially in the case of the sequence casting. Therefore, it was essential to investigate the effects of different submergence depths on the top surface flow. This not only serves as a supplement to our study but also provides vital evidence for further optimizing the continuous casting process parameters.
Moreover, the effects of superheat on the top surface flow of the mold was not considered in this research. However, in the practical continuous casting production, the superheat of the tundish varied by approximately 10~20 °C. Therefore, exploring the effects of the thermal convection caused by changes in tundish temperature on the flow of the top surface of the steel slab mold was of great significance and value.
Author Contributions
Conceptualization, Y.T.; Methodology, Y.T. and S.Q.; Software, R.Z.; Validation, H.Z.; Formal analysis, Y.T. and L.X.; Investigation, G.W.; Data curation, Y.T. and S.Q.; Writing—original draft preparation, Y.T.; Writing—review and editing, Y.T. and H.Z. All authors have read and agreed to the published version of the manuscript.
Funding
This research was funded by the National Natural Science Foundation of China (Grant No. 52074024).
Institutional Review Board Statement
Not applicable.
Informed Consent Statement
Not applicable.
Data Availability Statement
Not applicable.
Acknowledgments
The authors are grateful for support from the Natural Science Foundation of China (Grant No. 52074024). We deeply appreciate the University of Science and Technology Beijing (USTB), Central Iron and Steel Research Institute (CISRI), and Shougang Group Co., Ltd. for giving their permission to publish this paper. We are also thankful for the useful technical discussions of Lei Liu and Jiaqi Liu at CISRI, Beijing, China.
Conflicts of Interest
No potential conflicts of interest were reported by the authors.
References
- Zhang, L. Non-Metallic Inclusions in Steels: Industrial Practice; Metallurgical Industry Press: Beijing, China, 2019; pp. 63–70. (In Chinese) [Google Scholar]
- Kalter, R.; Tummers, M.; Kenjereš, S.; Righolt, B.; Kleijn, C. Oscillations of the fluid flow and the free surface in a cavity with a submerged bifurcated nozzle. Int. J. Heat Fluid Flow 2013, 44, 365–374. [Google Scholar] [CrossRef]
- Asad, A.; Kratzsch, C.; Schwarze, R. Numerical investigation of the free surface in a model mold. Steel Res. Int. 2016, 87, 181–190. [Google Scholar] [CrossRef]
- Teshima, T.; Kubota, J.; Suzuki, M.; Ozawa, K.; Masaoka, T.; Miyahara, S. Influence of casting conditions on molten steel flow in continuous casting mold at high speed casting of slabs. Tetsu-to-Hagane 1993, 79, 576–582. [Google Scholar] [CrossRef] [PubMed]
- Gupta, D.; Lahiri, A. Water-modeling study of the surface disturbances in continuous slab caster. Metall. Mater. Trans. B 1994, 25, 227–233. [Google Scholar] [CrossRef]
- Li, B.; Tsukihashi, F. Vortexing flow patterns in a water model of slab continuous casting mold. ISIJ Int. 2005, 45, 30–36. [Google Scholar] [CrossRef]
- Kasai, N.; Iguchi, M. Water-model experiment on melting powder trapping by vortex in the continuous casting mold. ISIJ Int. 2007, 47, 982–987. [Google Scholar] [CrossRef]
- Lee, J.; Han, S.; Cho, H.; Park, I. Numerical and experimental study of the meniscus vortex core in a water model of continuous casting mold. Metall. Mater. Trans. B 2021, 52, 178–189. [Google Scholar] [CrossRef]
- Zhang, K.; Liu, J.; Cui, H.; Xiao, C. Analysis of meniscus fluctuation in a continuous casting slab mold. Metall. Mater. Trans. B 2018, 49, 1174–1184. [Google Scholar] [CrossRef]
- Jiang, Z.; Su, Z.; Xu, C.; Chen, J.; He, J. Abnormal mold level fluctuation during slab casting of peritectic steels. J. Iron Steel Res. Int. 2020, 27, 160–168. [Google Scholar] [CrossRef]
- Cockcroft, S. Optimization of industrial casting processes. Metals 2020, 10, 360. [Google Scholar] [CrossRef]
- Panaras, G.; Theodorakakos, A.; Berggeles, G. Numerical investigation of the free surface in a continuous steel casting mold model. Metall. Mater. Trans. B 1998, 29, 1117–1126. [Google Scholar] [CrossRef]
- Smirnov, A.; Kuberskii, S.; Smirnov, E.; Verzilov, A.; Maksaev, E. Influence of meniscus fluctuations in the mold on crust formation in slab casting. Steel Transl. 2017, 47, 478–482. [Google Scholar] [CrossRef]
- Matsushita, A.; Isogami, K.; Temma, M.; Ninomiya, T.; Tsutsumi, K. Direct observation of molten steel meniscus in CC mold during casting. Trans. Iron Steel Inst. Jpn. 1988, 28, 531–534. [Google Scholar] [CrossRef]
- Zhang, T.; Yang, J.; Jiang, P. Measurement of molten steel velocity near the surface and modeling for transient fluid flow in the continuous casting mold. Metals 2019, 9, 36. [Google Scholar] [CrossRef]
- Huang, C.; Zhou, H.; Zhang, L.; Yang, W.; Zhang, J.; Ren, Y.; Chen, W. Effect of casting parameters on the flow pattern in a steel continuous casting slab mold: Numerical simulation and industrial trials. Steel Res. Int. 2022, 93, 2100350. [Google Scholar] [CrossRef]
- Cho, S.; Kim, S.; Thomas, B. Transient fluid flow during steady continuous casting of steel slabs: Part I. Measurements and modeling of two-phase flow. ISIJ Int. 2014, 54, 845–854. [Google Scholar] [CrossRef]
- Ren, L.; Zhang, L.; Wang, Q. Measurements of surface velocity and level fluctuation in an actual continuous wide slab casting mold. Metall. Res. Technol. 2018, 115, 102. [Google Scholar] [CrossRef]
- Li, Y.; Zhang, X.; Lan, P.; Zhang, J. Control of mould level fluctuation through the modification of steel composition. Int. J. Min. Met. Mater. 2013, 20, 138–145. [Google Scholar] [CrossRef]
- Hibbeler, L.; Thomas, B. Mold slag entrainment mechanisms in continuous casting molds. Iron Steel Technol. 2013, 10, 121–136. [Google Scholar]
- Thomas, B.; Huang, X.; Sussman, R. Simulation of argon gas flow effects in a continuous slab caster. Metall. Mater. Trans. B 1994, 25, 527–547. [Google Scholar] [CrossRef]
- Codur, Y.; Guvot, V.; Martin, J. Control of steel level in a continuous casting mould: Relation with withdrawal of the slab. Rev. Metall. Cah. Inf. Tech. 1994, 91, 1055–1061. [Google Scholar]
- Yoon, U.-S.; Bang, I.-W.; Rhee, J.H.; Kim, S.-Y.; Lee, J.-D.; Oh, K.H. Analysis of mold level hunching by unsteady bulging during thin slab casting. ISIJ Int. 2002, 42, 1103–1111. [Google Scholar] [CrossRef]
- Zhang, L.; Wang, Y.; Zuo, X. Flow transport and inclusion motion in steel continuous-casting mold under submerged entry nozzle clogging condition. Metall. Mater. Trans. B 2008, 39, 534–550. [Google Scholar] [CrossRef]
- Liu, R.; Thomas, B.; Sengupta, J.; Chung, S.; Trinh, M. Measurements of molten steel surface velocity and effect of stopper-rod movement on transient multiphase fluid flow in continuous casting. ISIJ Int. 2014, 54, 2314–2323. [Google Scholar] [CrossRef]
- Zhao, P.; Li, Q.; Kuang, S.; Zou, Z. LBM-LES simulation of the transient asymmetric flow and free surface fluctuations under steady operating conditions of slab continuous casting process. Metall. Mater. Trans. B 2017, 48, 456–470. [Google Scholar] [CrossRef]
- Zhu, X.; Li, D.; Wu, C.; Oleksandr, T.; Wang, Q. Influence of large-scale vortex movement in lower recirculation zone on instable flow field in the mold. ISIJ Int. 2018, 58, 1687–1694. [Google Scholar] [CrossRef]
- Cho, S.; Thomas, B.; Kim, S. Effect of nozzle port angle on transient flow and surface slag behavior during continuous steel-slab casting. Metall. Mater. Trans. B 2019, 50, 52–76. [Google Scholar] [CrossRef]
- Chen, W.; Ren, Y.; Zhang, L.; Scheller, P. Numerical simulation of steel and argon gas two-phase flow in continuous casting using LES + VOF + DPM model. JOM 2019, 71, 1158–1168. [Google Scholar] [CrossRef]
- Lei, H.; Liu, J.; Tang, G.; Zhang, H.; Jiang, Z.; Lv, P. Deep insight into mold level fluctuation during casting different steel grades. JOM 2023, 75, 914–919. [Google Scholar] [CrossRef]
- Brackbill, J.; Kothe, D.; Zemach, C. A continuum method for modeling surface tension. J. Comput. Phys. 1992, 100, 335–354. [Google Scholar] [CrossRef]
- Smagorinsky, J. General circulation experiments with the primitive equations: I. The basic experiment. Mon. Weather Rev. 1963, 91, 99–164. [Google Scholar] [CrossRef]
- Hirt, C.; Nichols, B. Volume of fluid (VOF) method for the dynamics of free boundaries. J. Comput. Phys. 1981, 39, 201–225. [Google Scholar] [CrossRef]
- Mcdavid, R.; Thomas, B. Flow and thermal behavior of the top surface flux/powder layers in continuous casting molds. Metall. Mater. Trans. B 1996, 27, 672–685. [Google Scholar] [CrossRef]
- Rietow, B.; Thomas, B. Using nail board experiments to quantify surface velocity in the CC mold. In Proceedings of the AISTech 2008 Steelmaking Conference, Pittsburgh, PA, USA, 5–8 May 2008. [Google Scholar]
- Zhou, H.; Zhang, L.; Chen, W.; Ren, Y.; Yang, W.; Jiang, R. Determination of transient flow pattern in steel continuous casting molds using nail board measurement and onsite top flux observation. Metall. Mater. Trans. B 2021, 52, 1106–1117. [Google Scholar] [CrossRef]
- Liu, Z.; Qi, F.; Li, B.; Jiang, M. Vortex flow pattern in a slab continuous casting mold with argon gas injection. J. Iron Steel Res. Int. 2014, 21, 1081–1089. [Google Scholar] [CrossRef]
- Thomas, B.; Yuan, Q.; Sivaramakrishnan, S.; Shi, T.; Vanka, S.; Assar, M. Comparison of four methods to evaluate fluid velocities in a continuous slab casting mold. ISIJ Int. 2001, 41, 1262–1271. [Google Scholar] [CrossRef]
- Chaudhary, R.; Lee, G.; Thomas, B.; Cho, S.; Kim, S.; Kwon, O. Effect of stopper-rod misalignment on fluid flow in continuous casting of steel. Metall. Mater. Trans. B 2011, 42, 300–315. [Google Scholar] [CrossRef]
Disclaimer/Publisher’s Note: The statements, opinions and data contained in all publications are solely those of the individual author(s) and contributor(s) and not of MDPI and/or the editor(s). MDPI and/or the editor(s) disclaim responsibility for any injury to people or property resulting from any ideas, methods, instructions or products referred to in the content. |
© 2023 by the authors. Licensee MDPI, Basel, Switzerland. This article is an open access article distributed under the terms and conditions of the Creative Commons Attribution (CC BY) license (https://creativecommons.org/licenses/by/4.0/).

