

Skin Friction: Mechanical and Tribological Characterization of Different Papers Used in Everyday Life


Abstract
:1. Introduction
2. Experimental
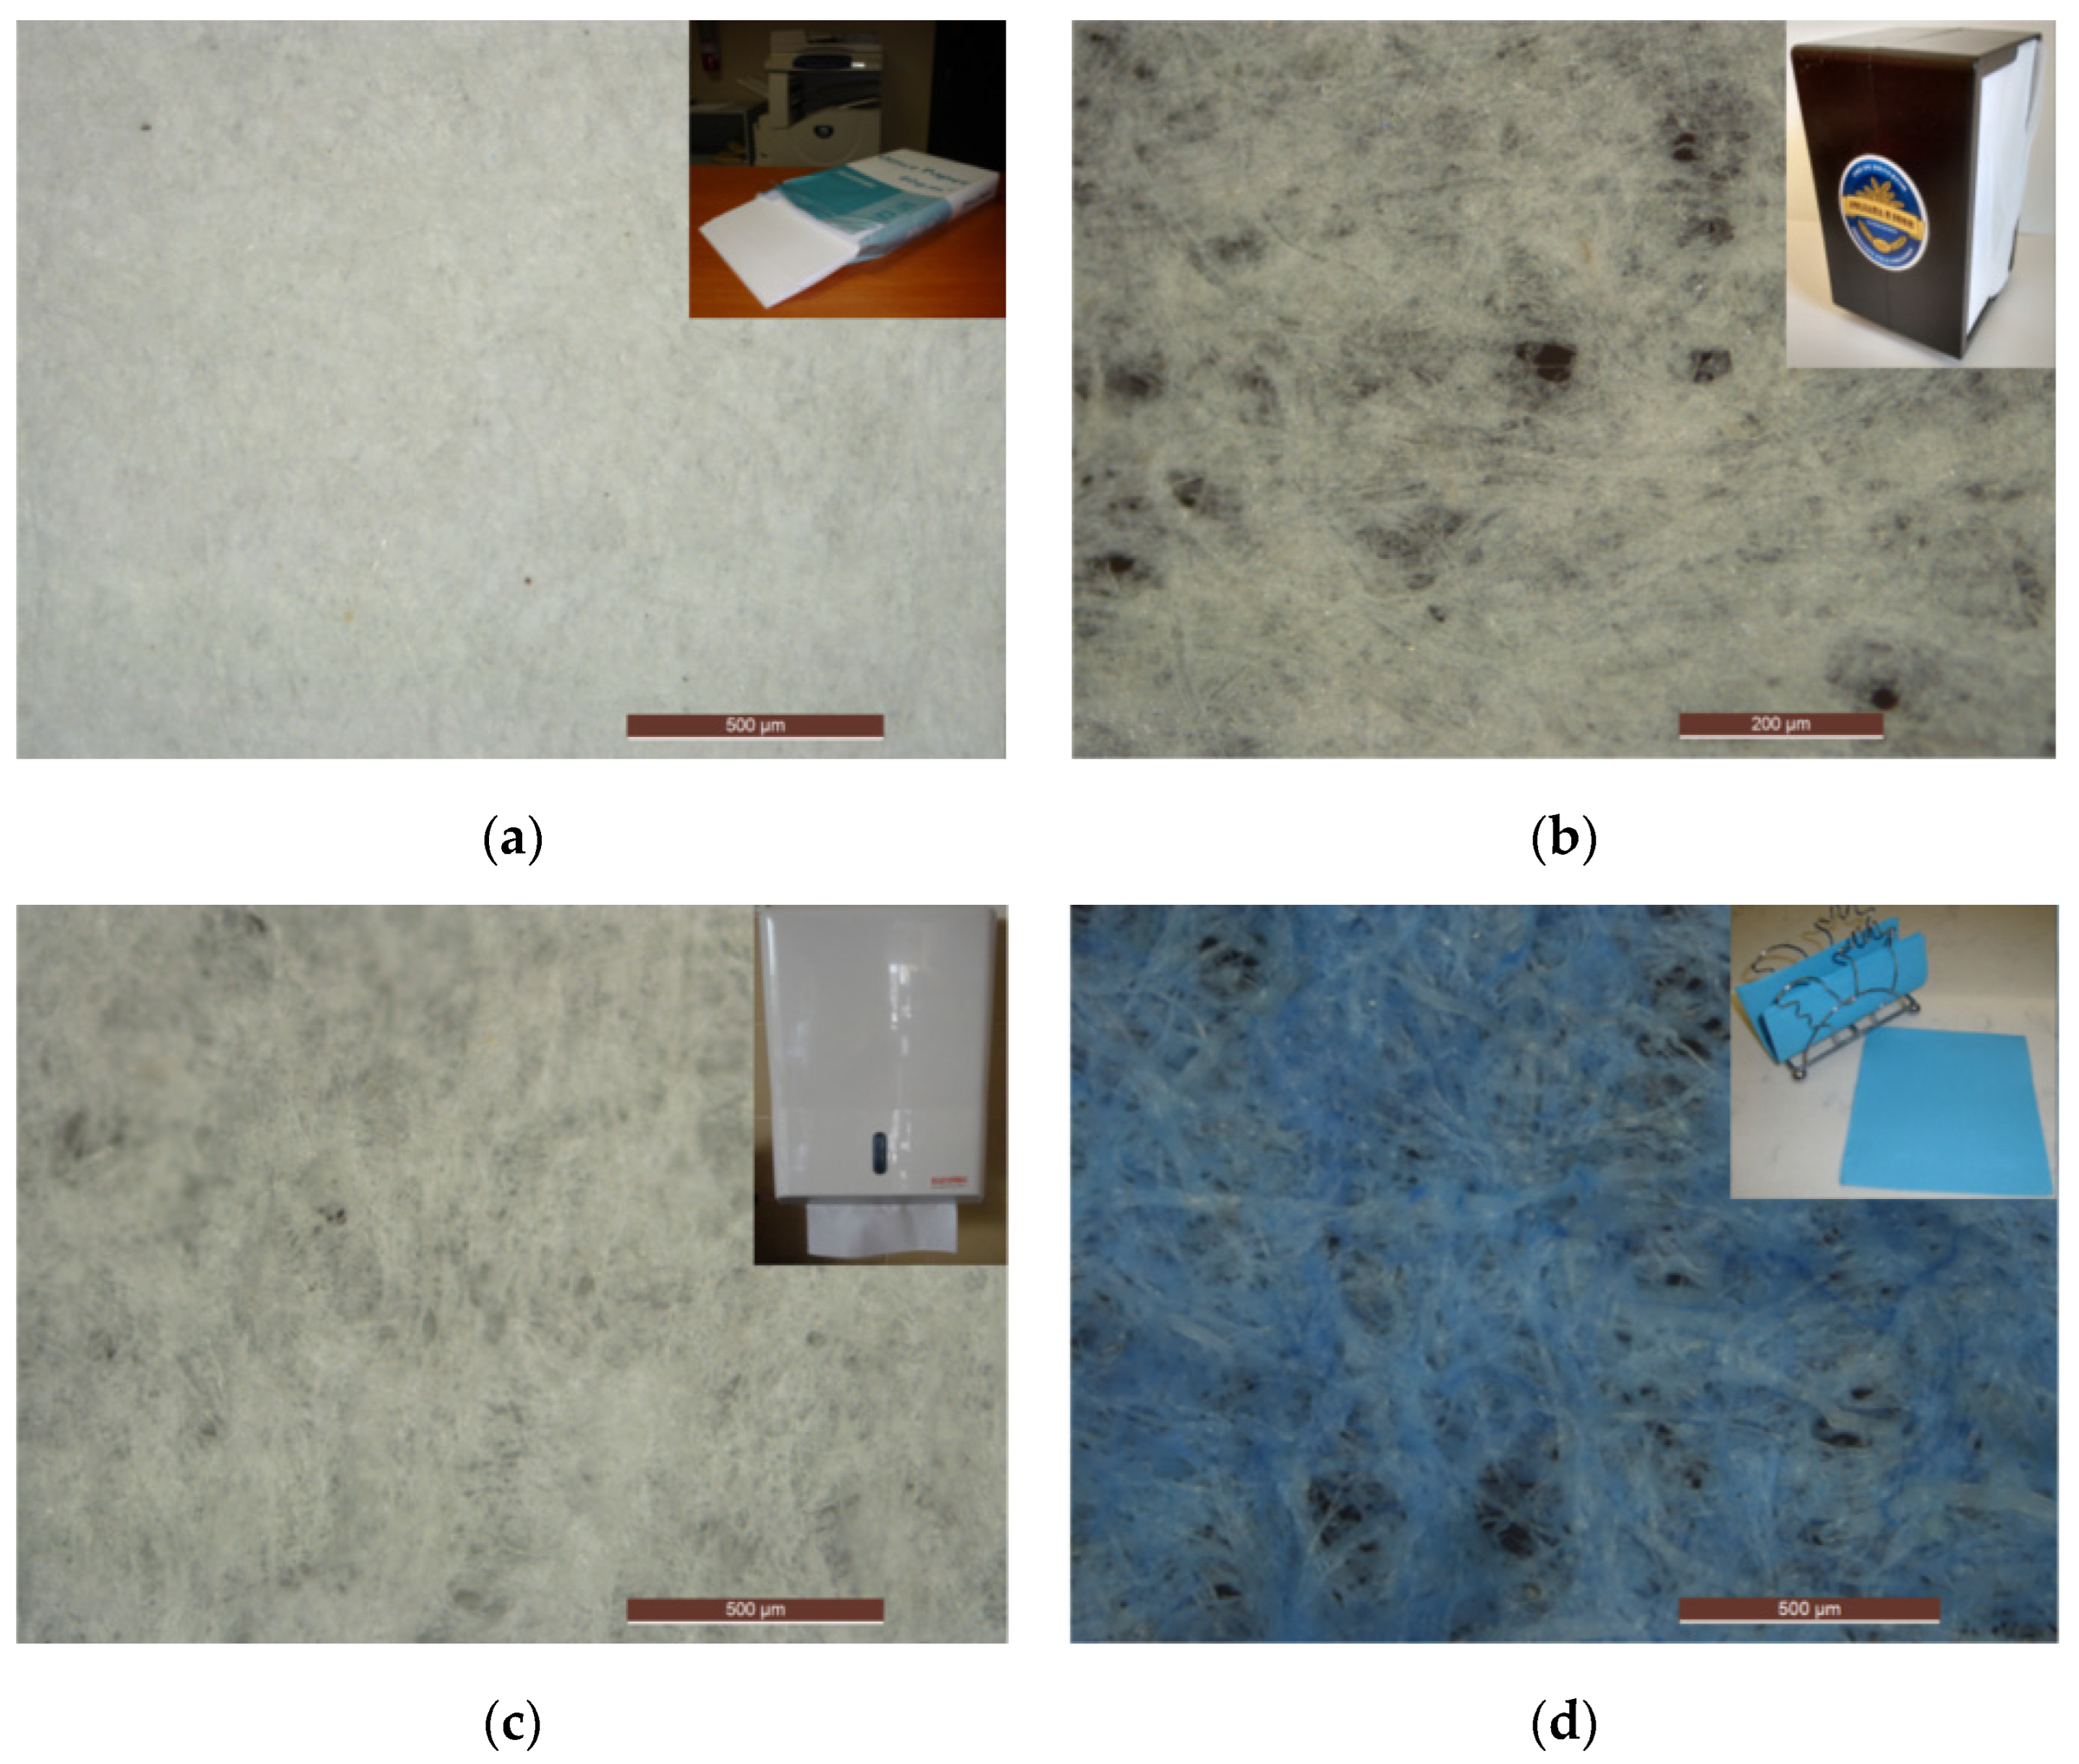
2.1. Specimens
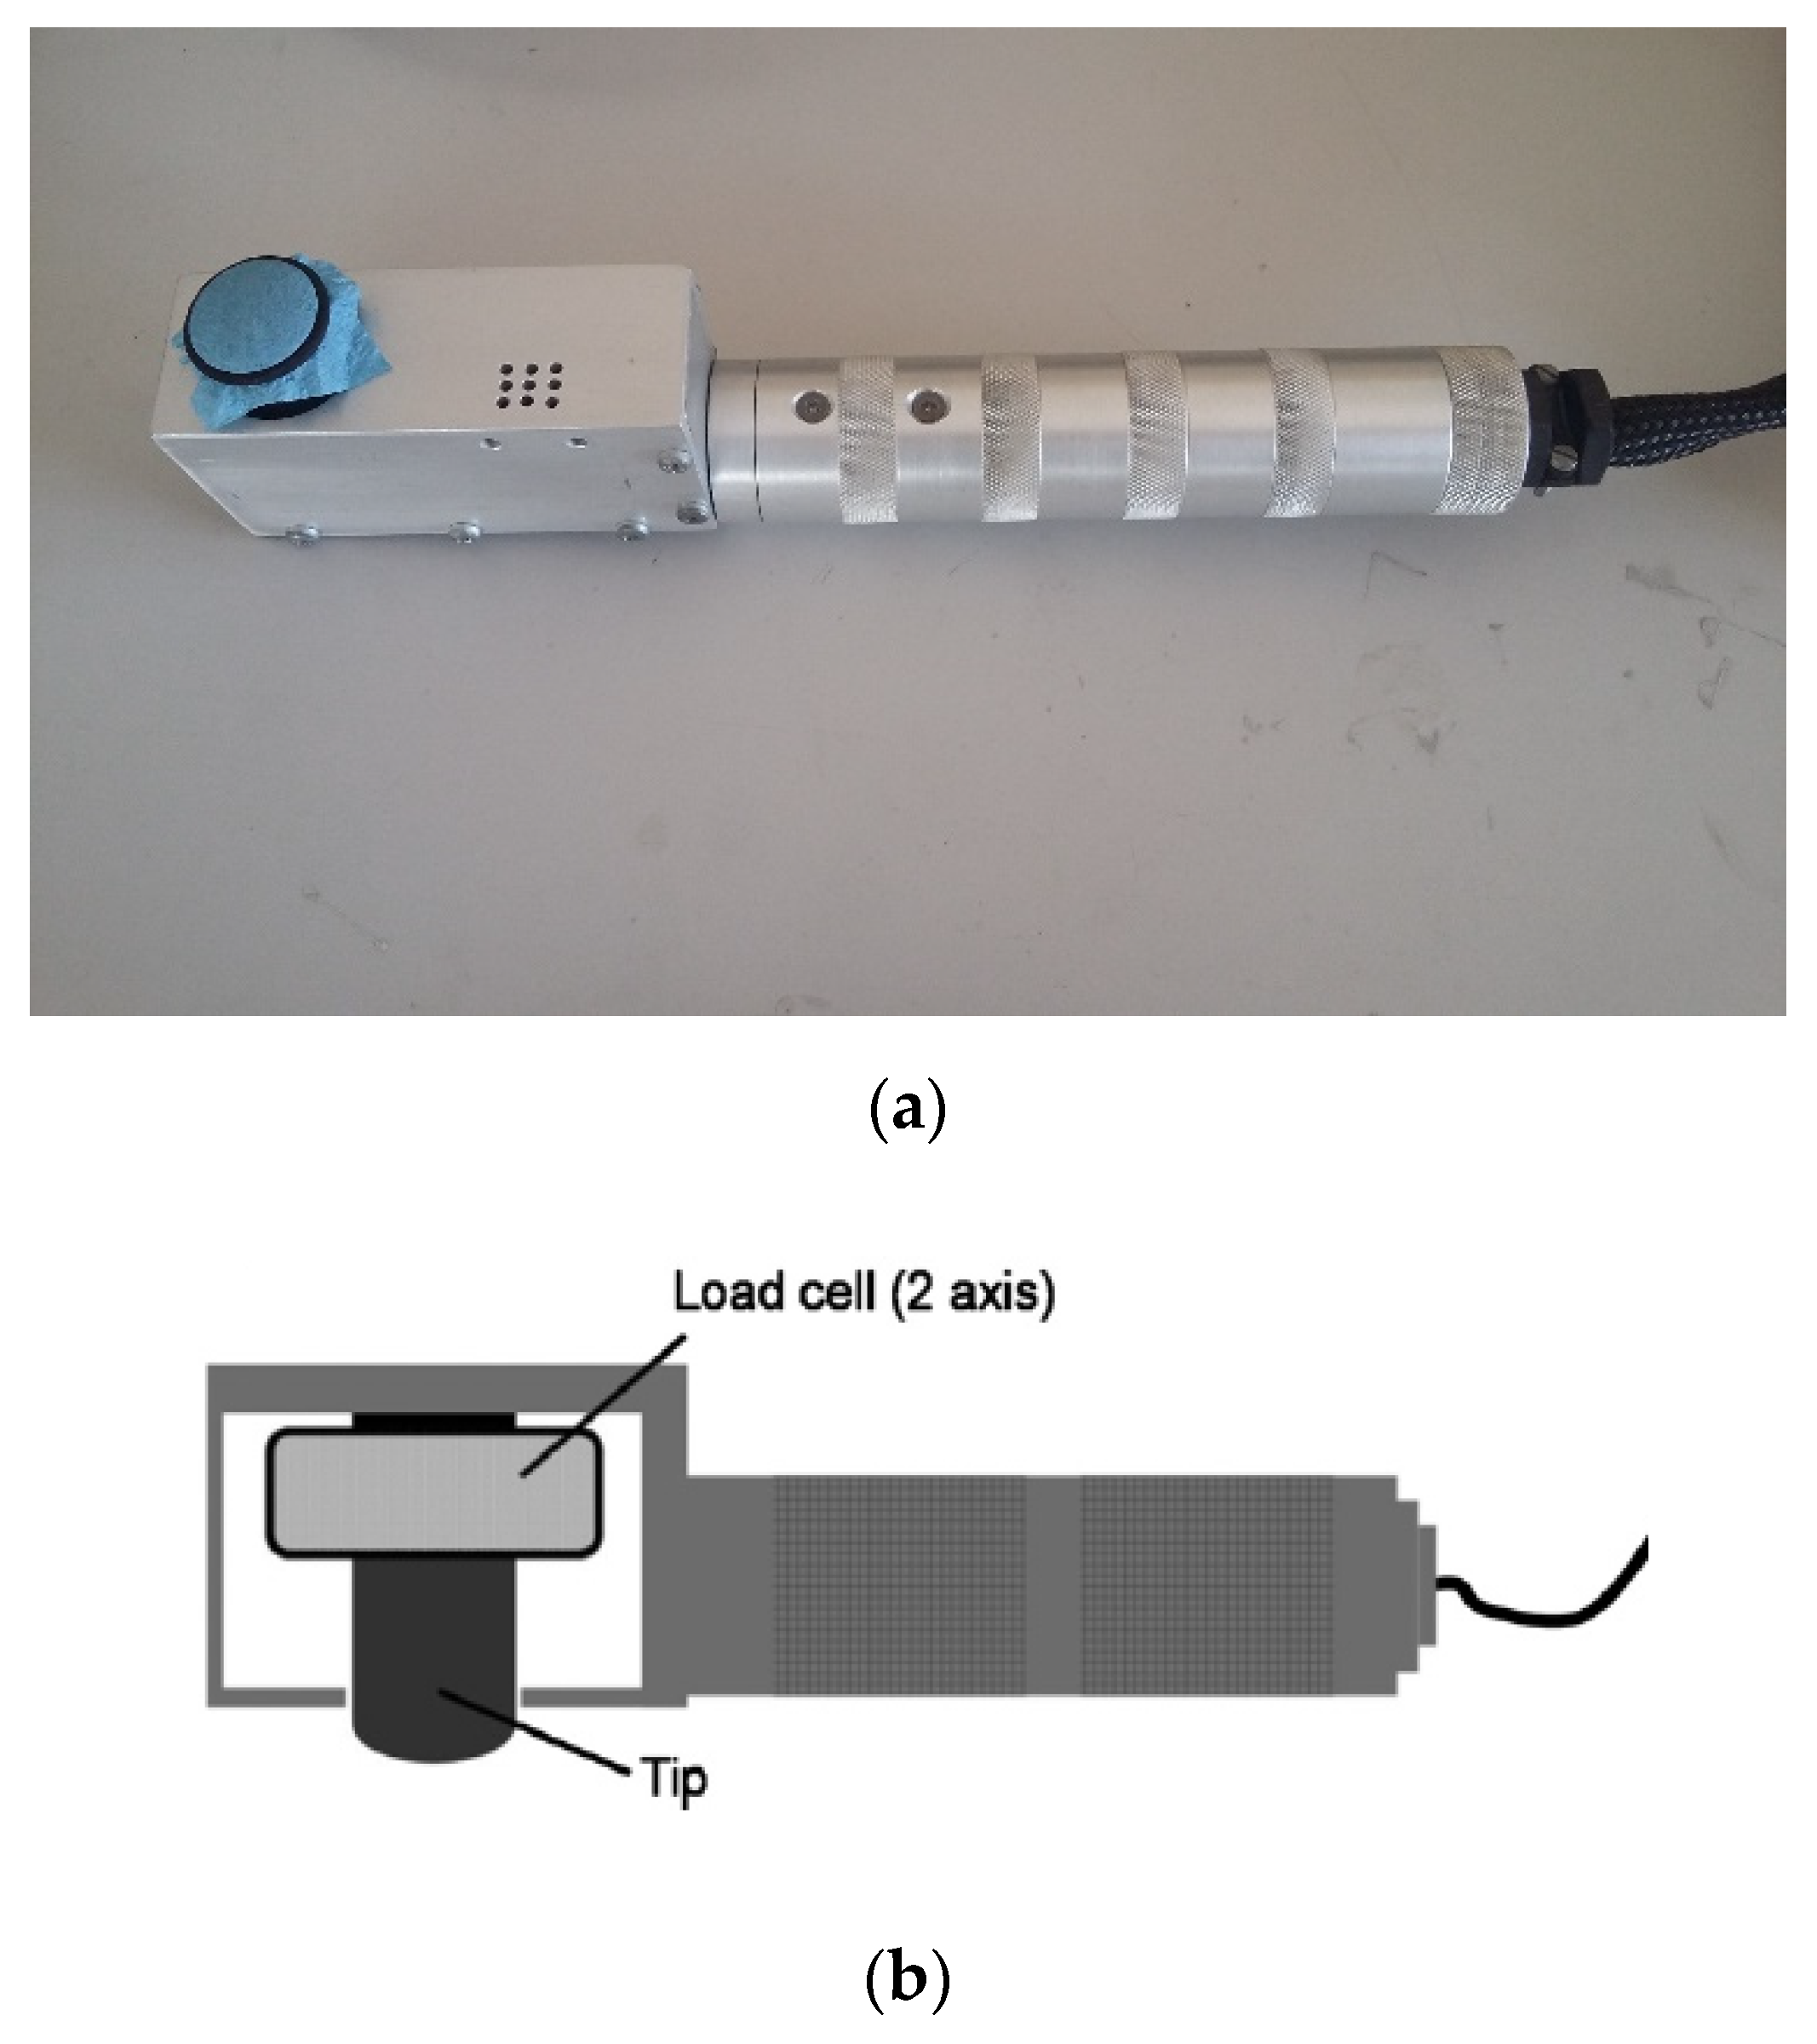
2.2. Mechanical and Tribological Characterization Tests
3. Results and Discussion
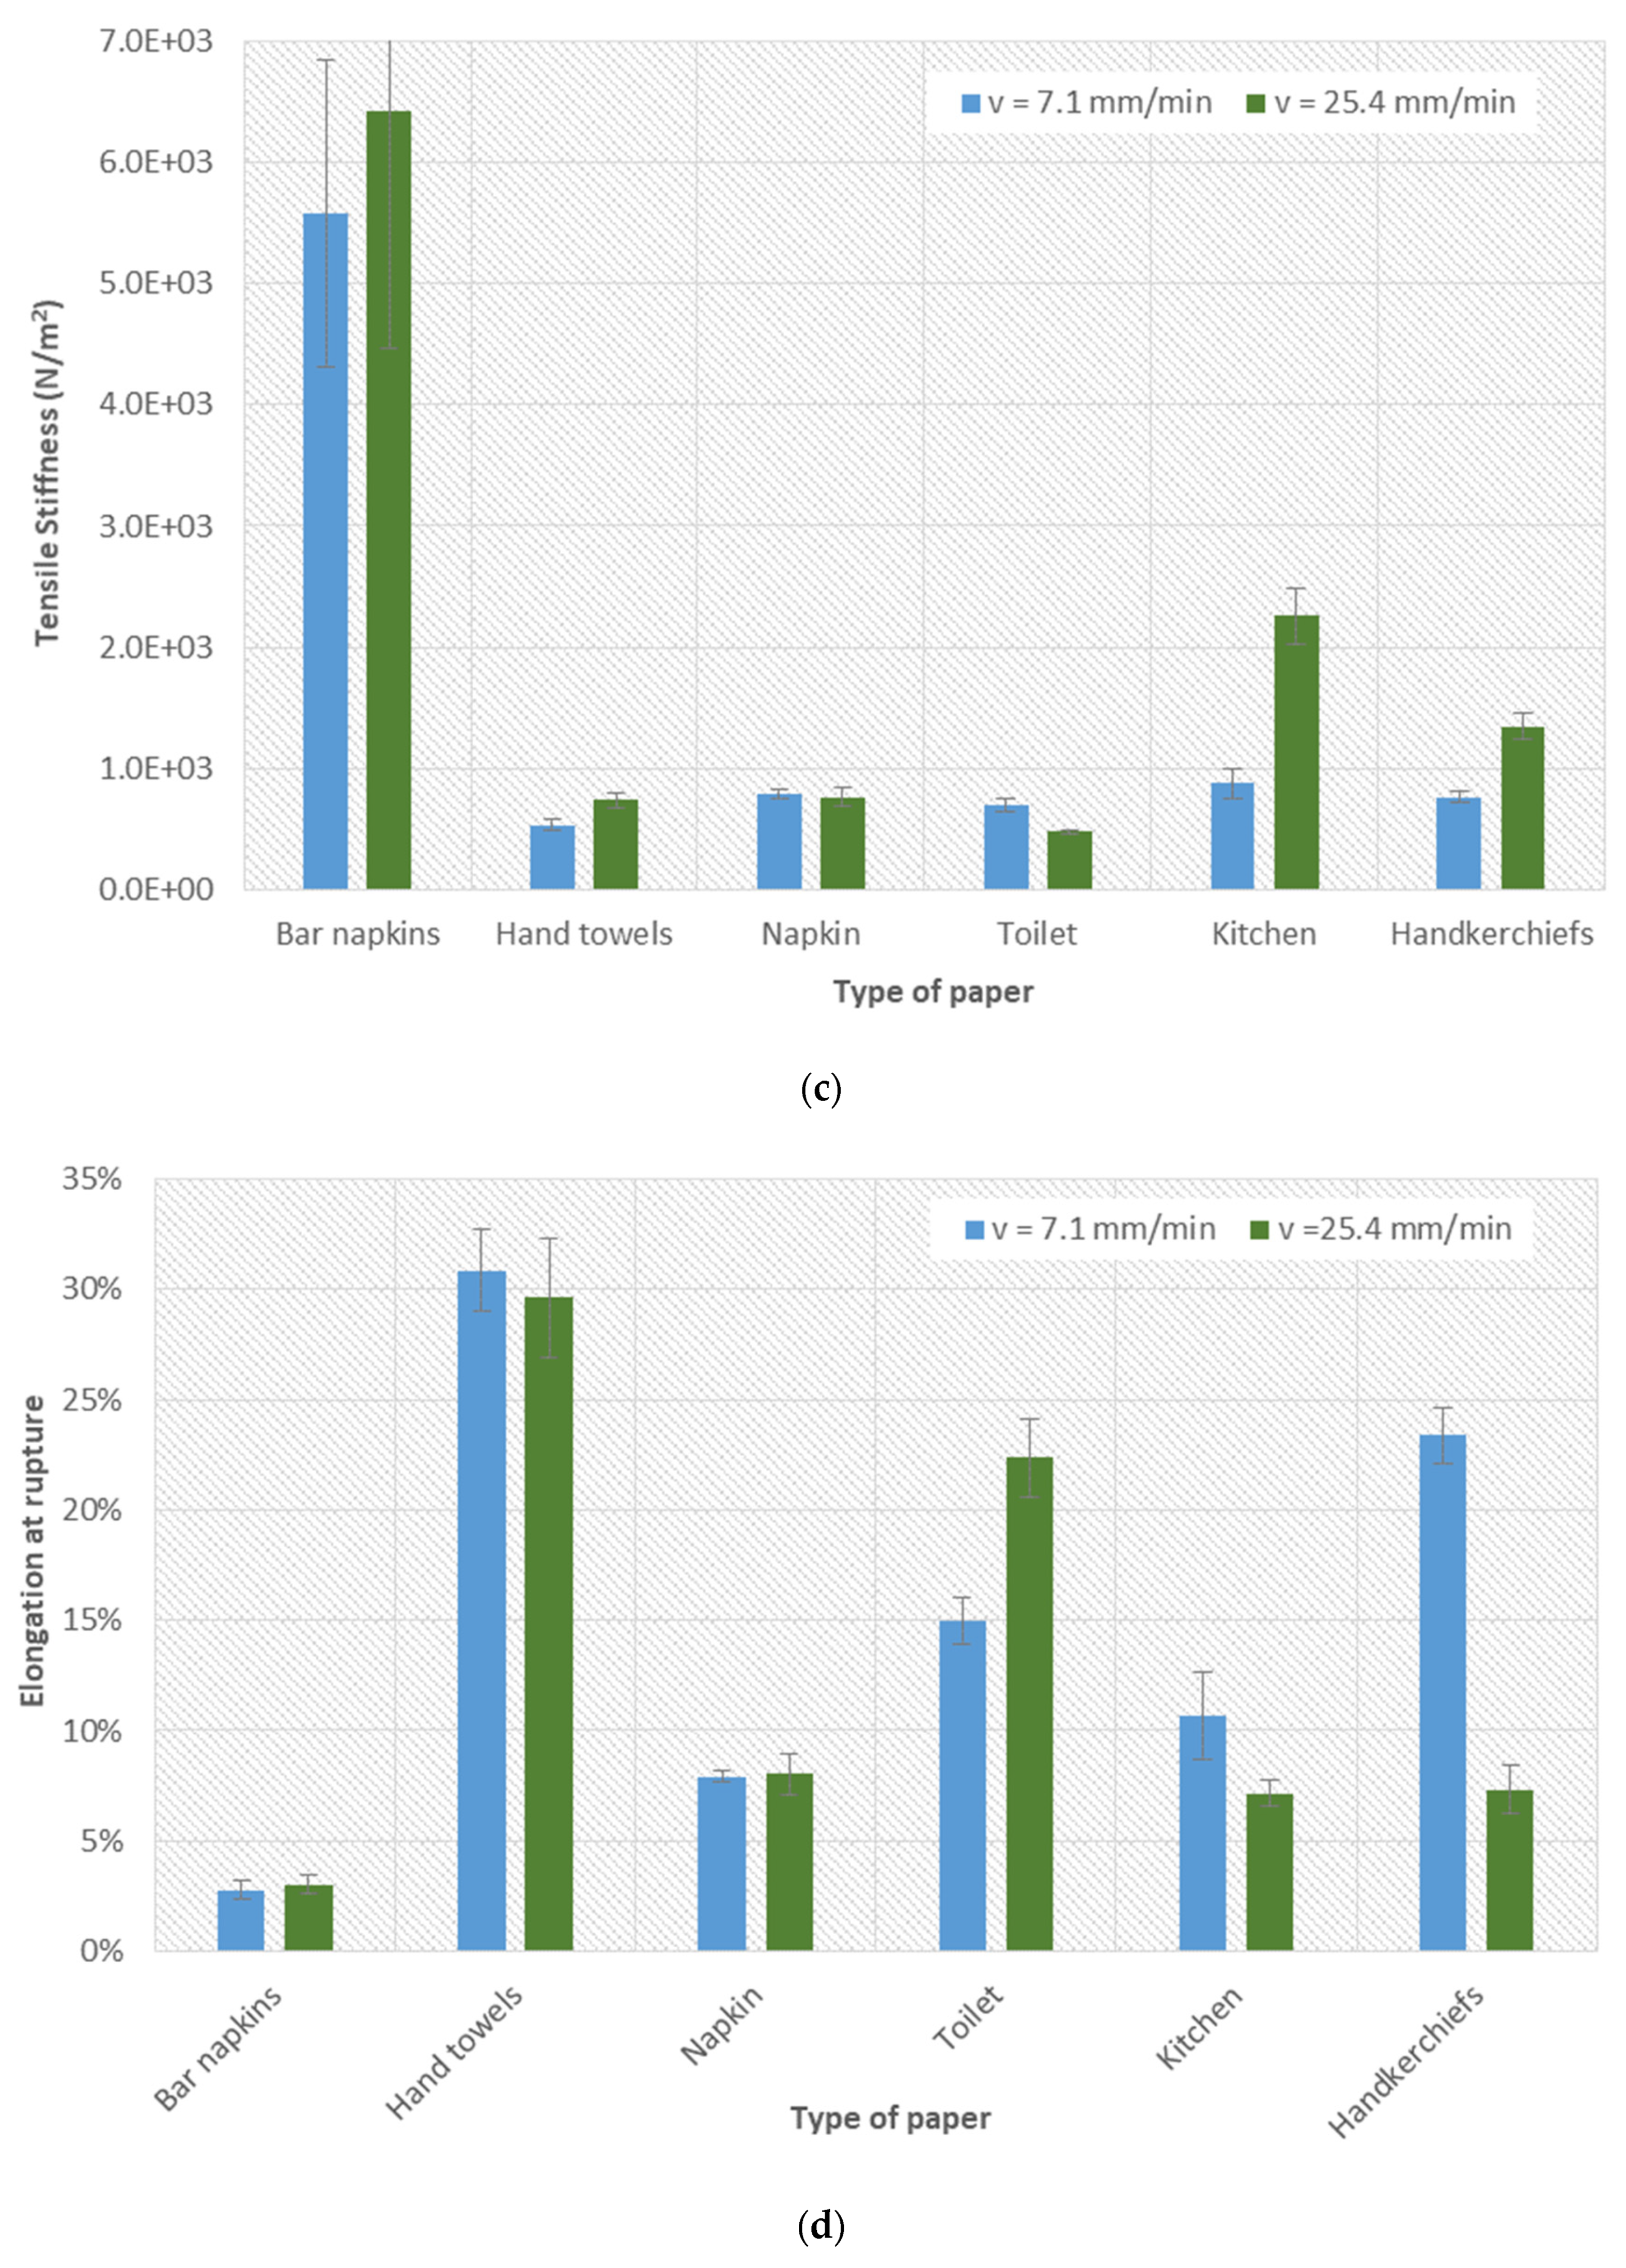
3.1. Tensile Tests
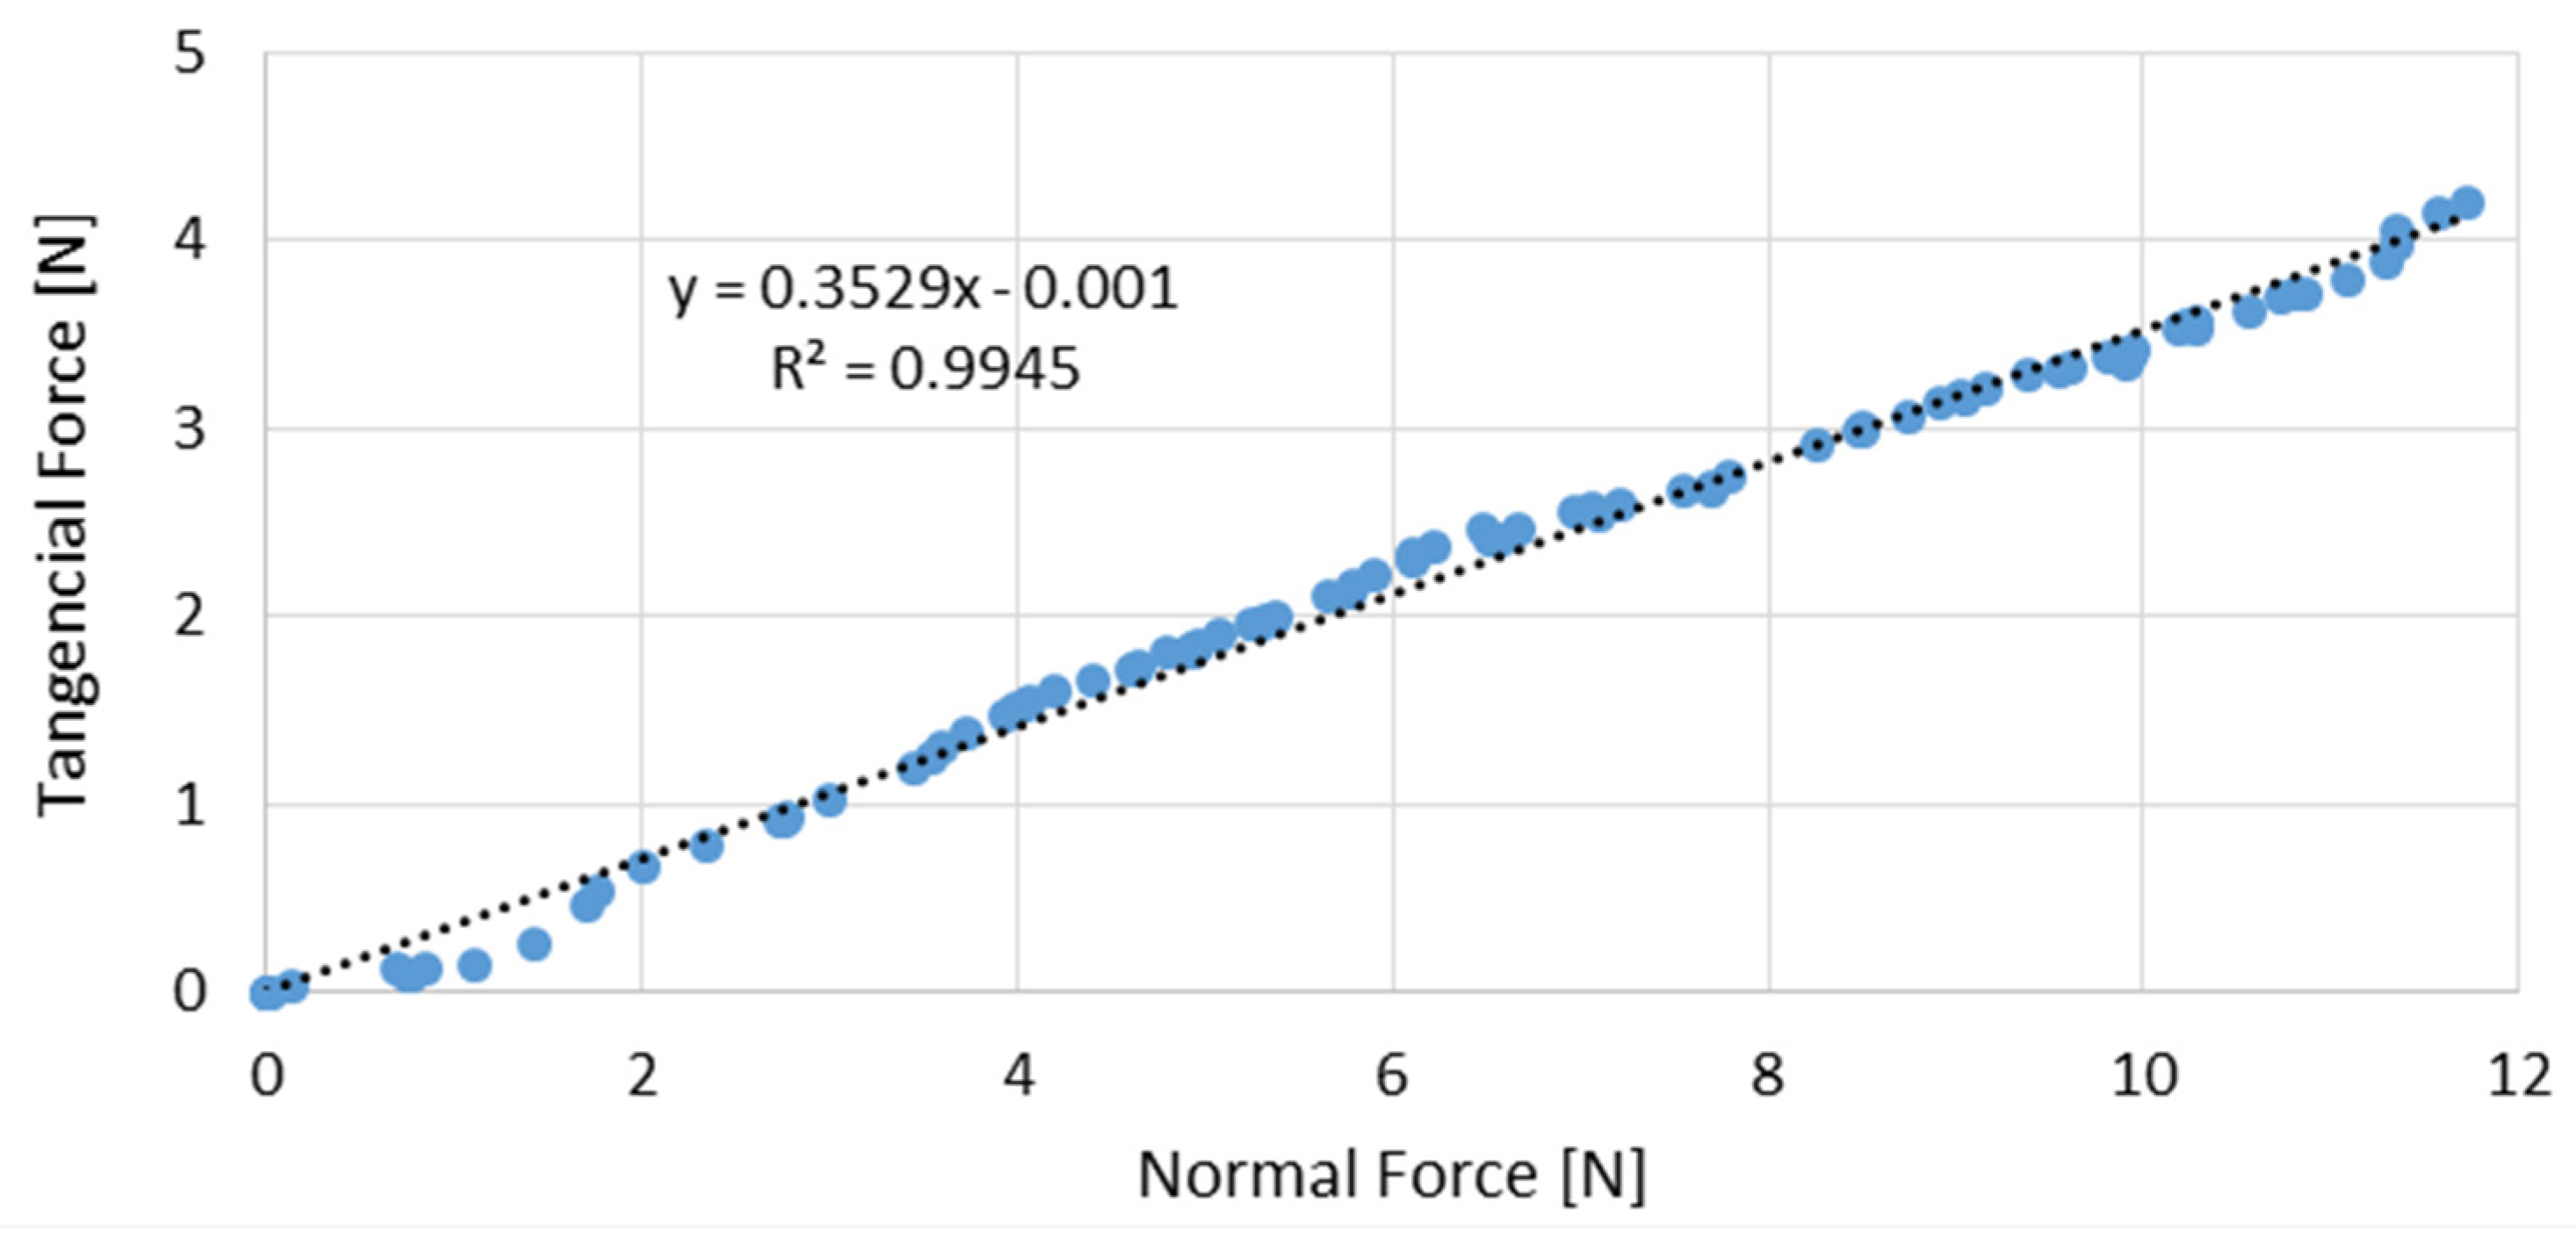
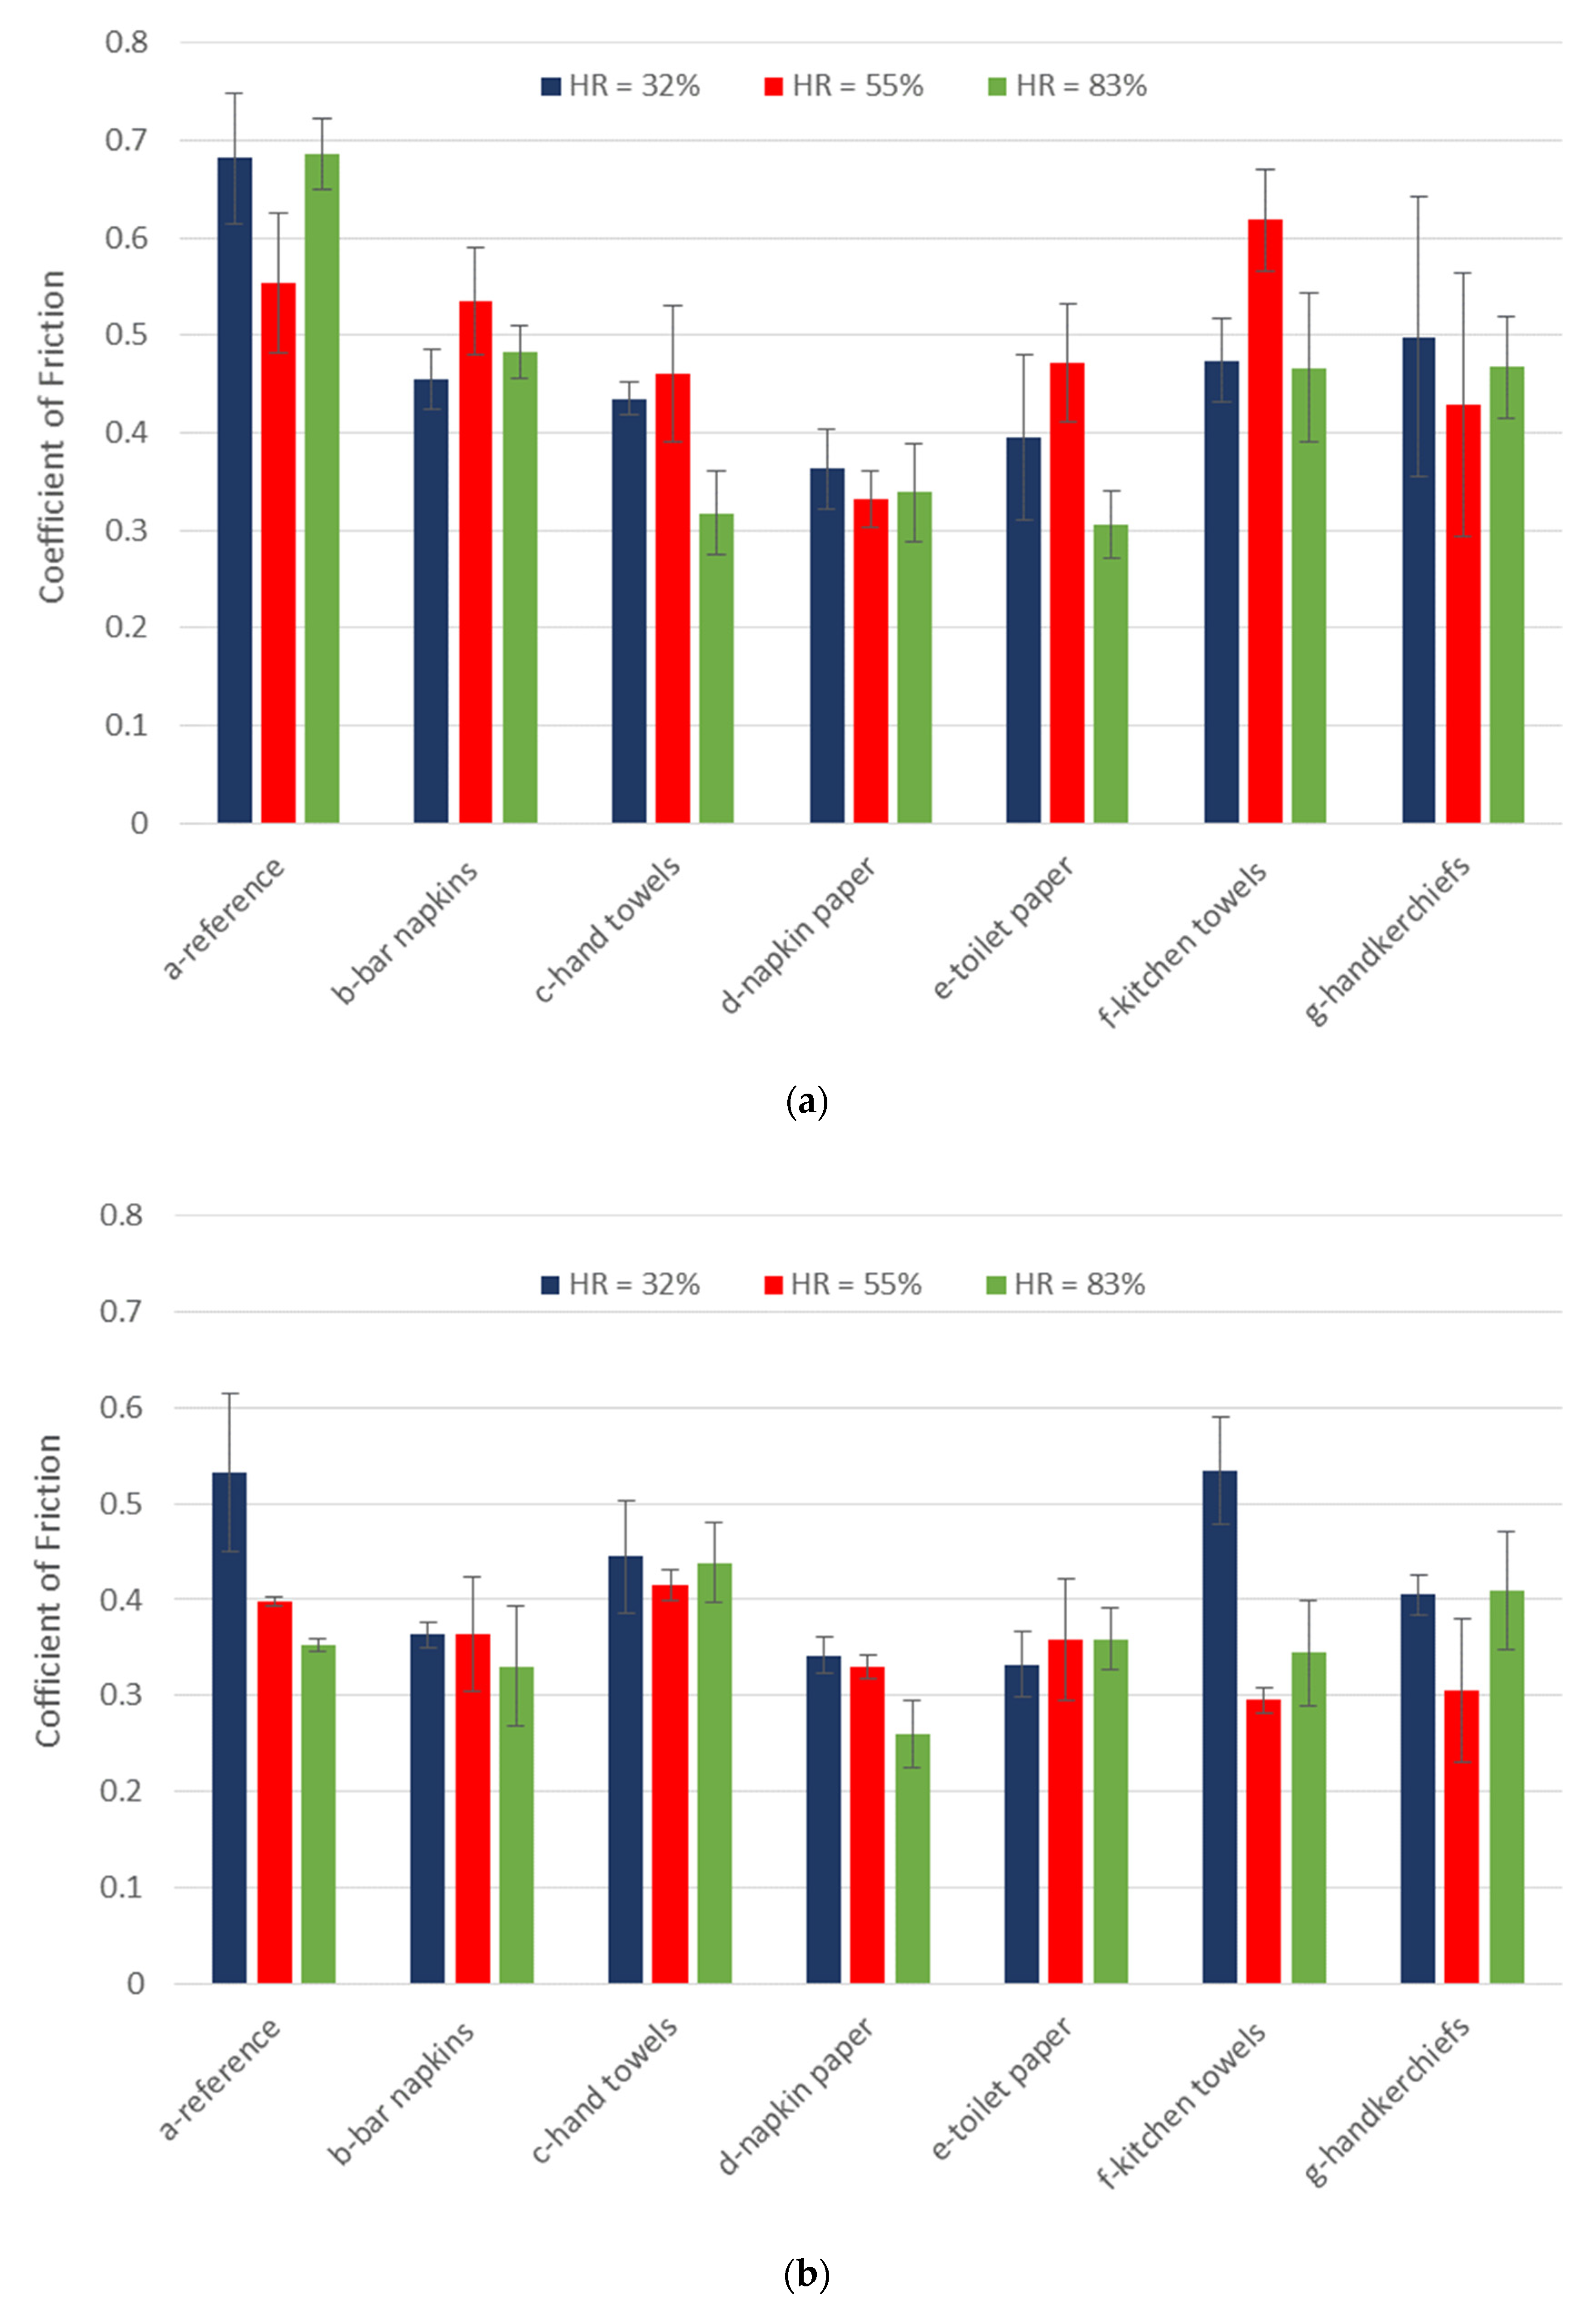
3.2. Tribological Tests
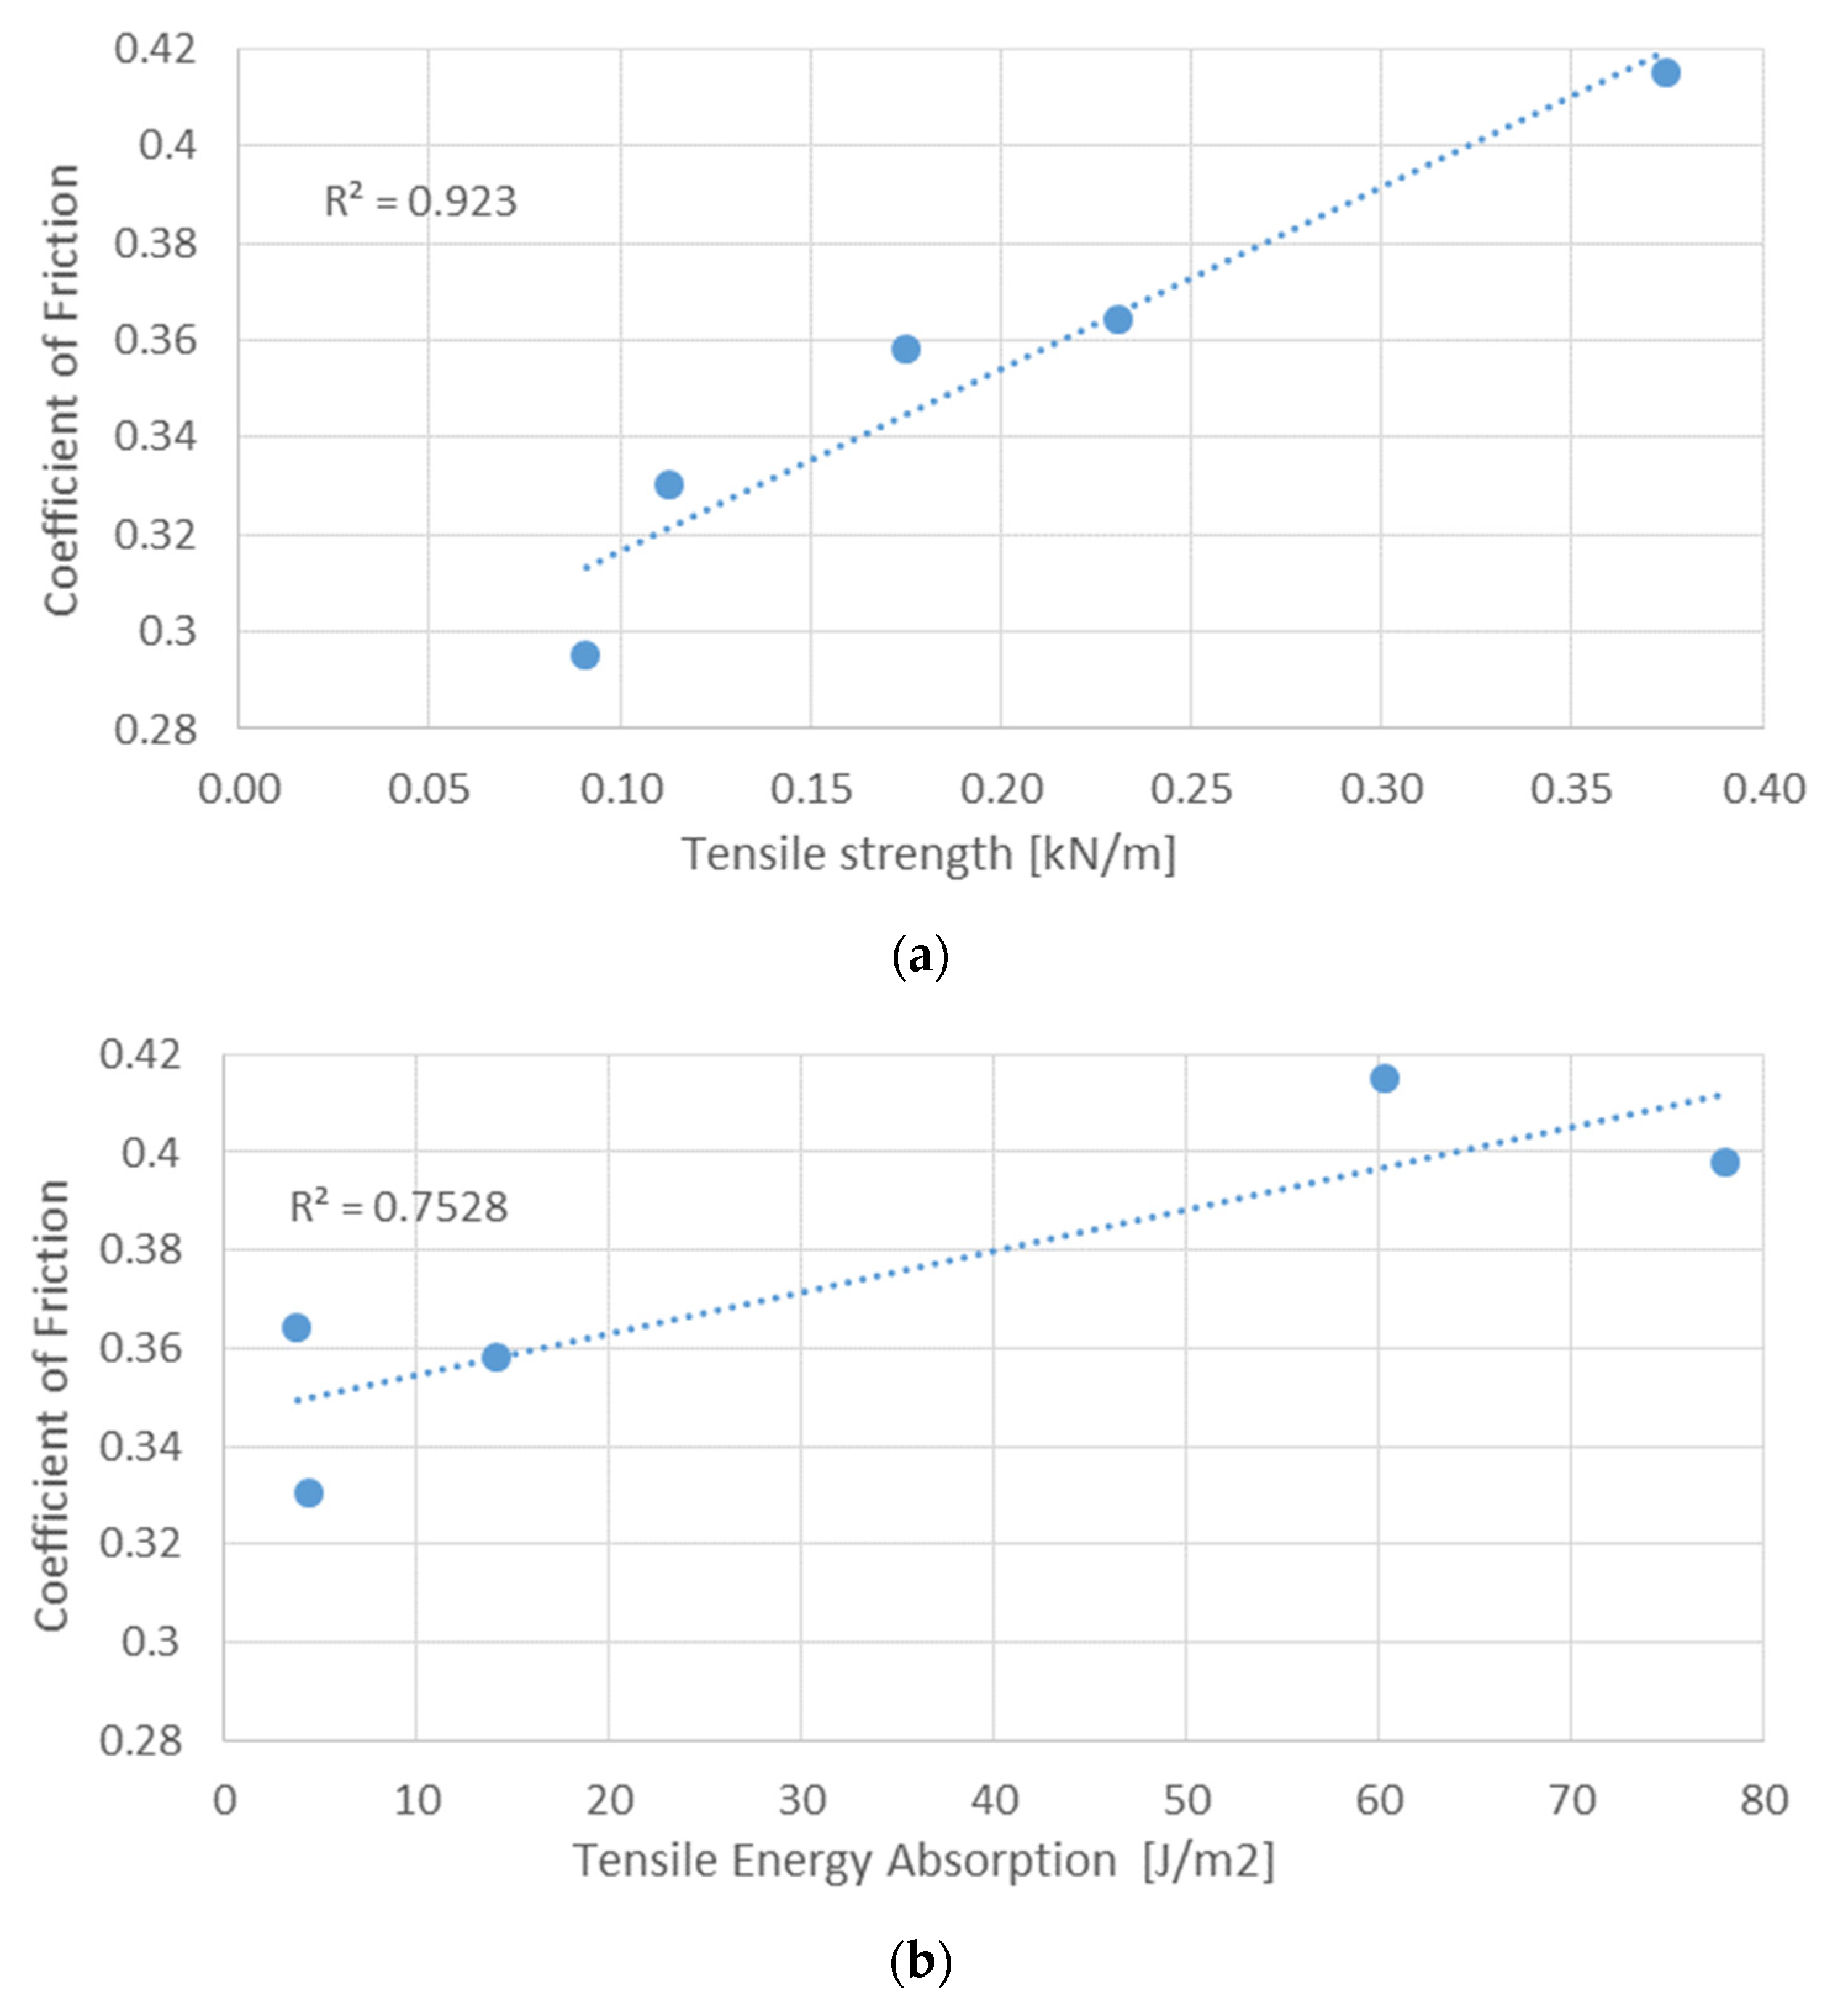
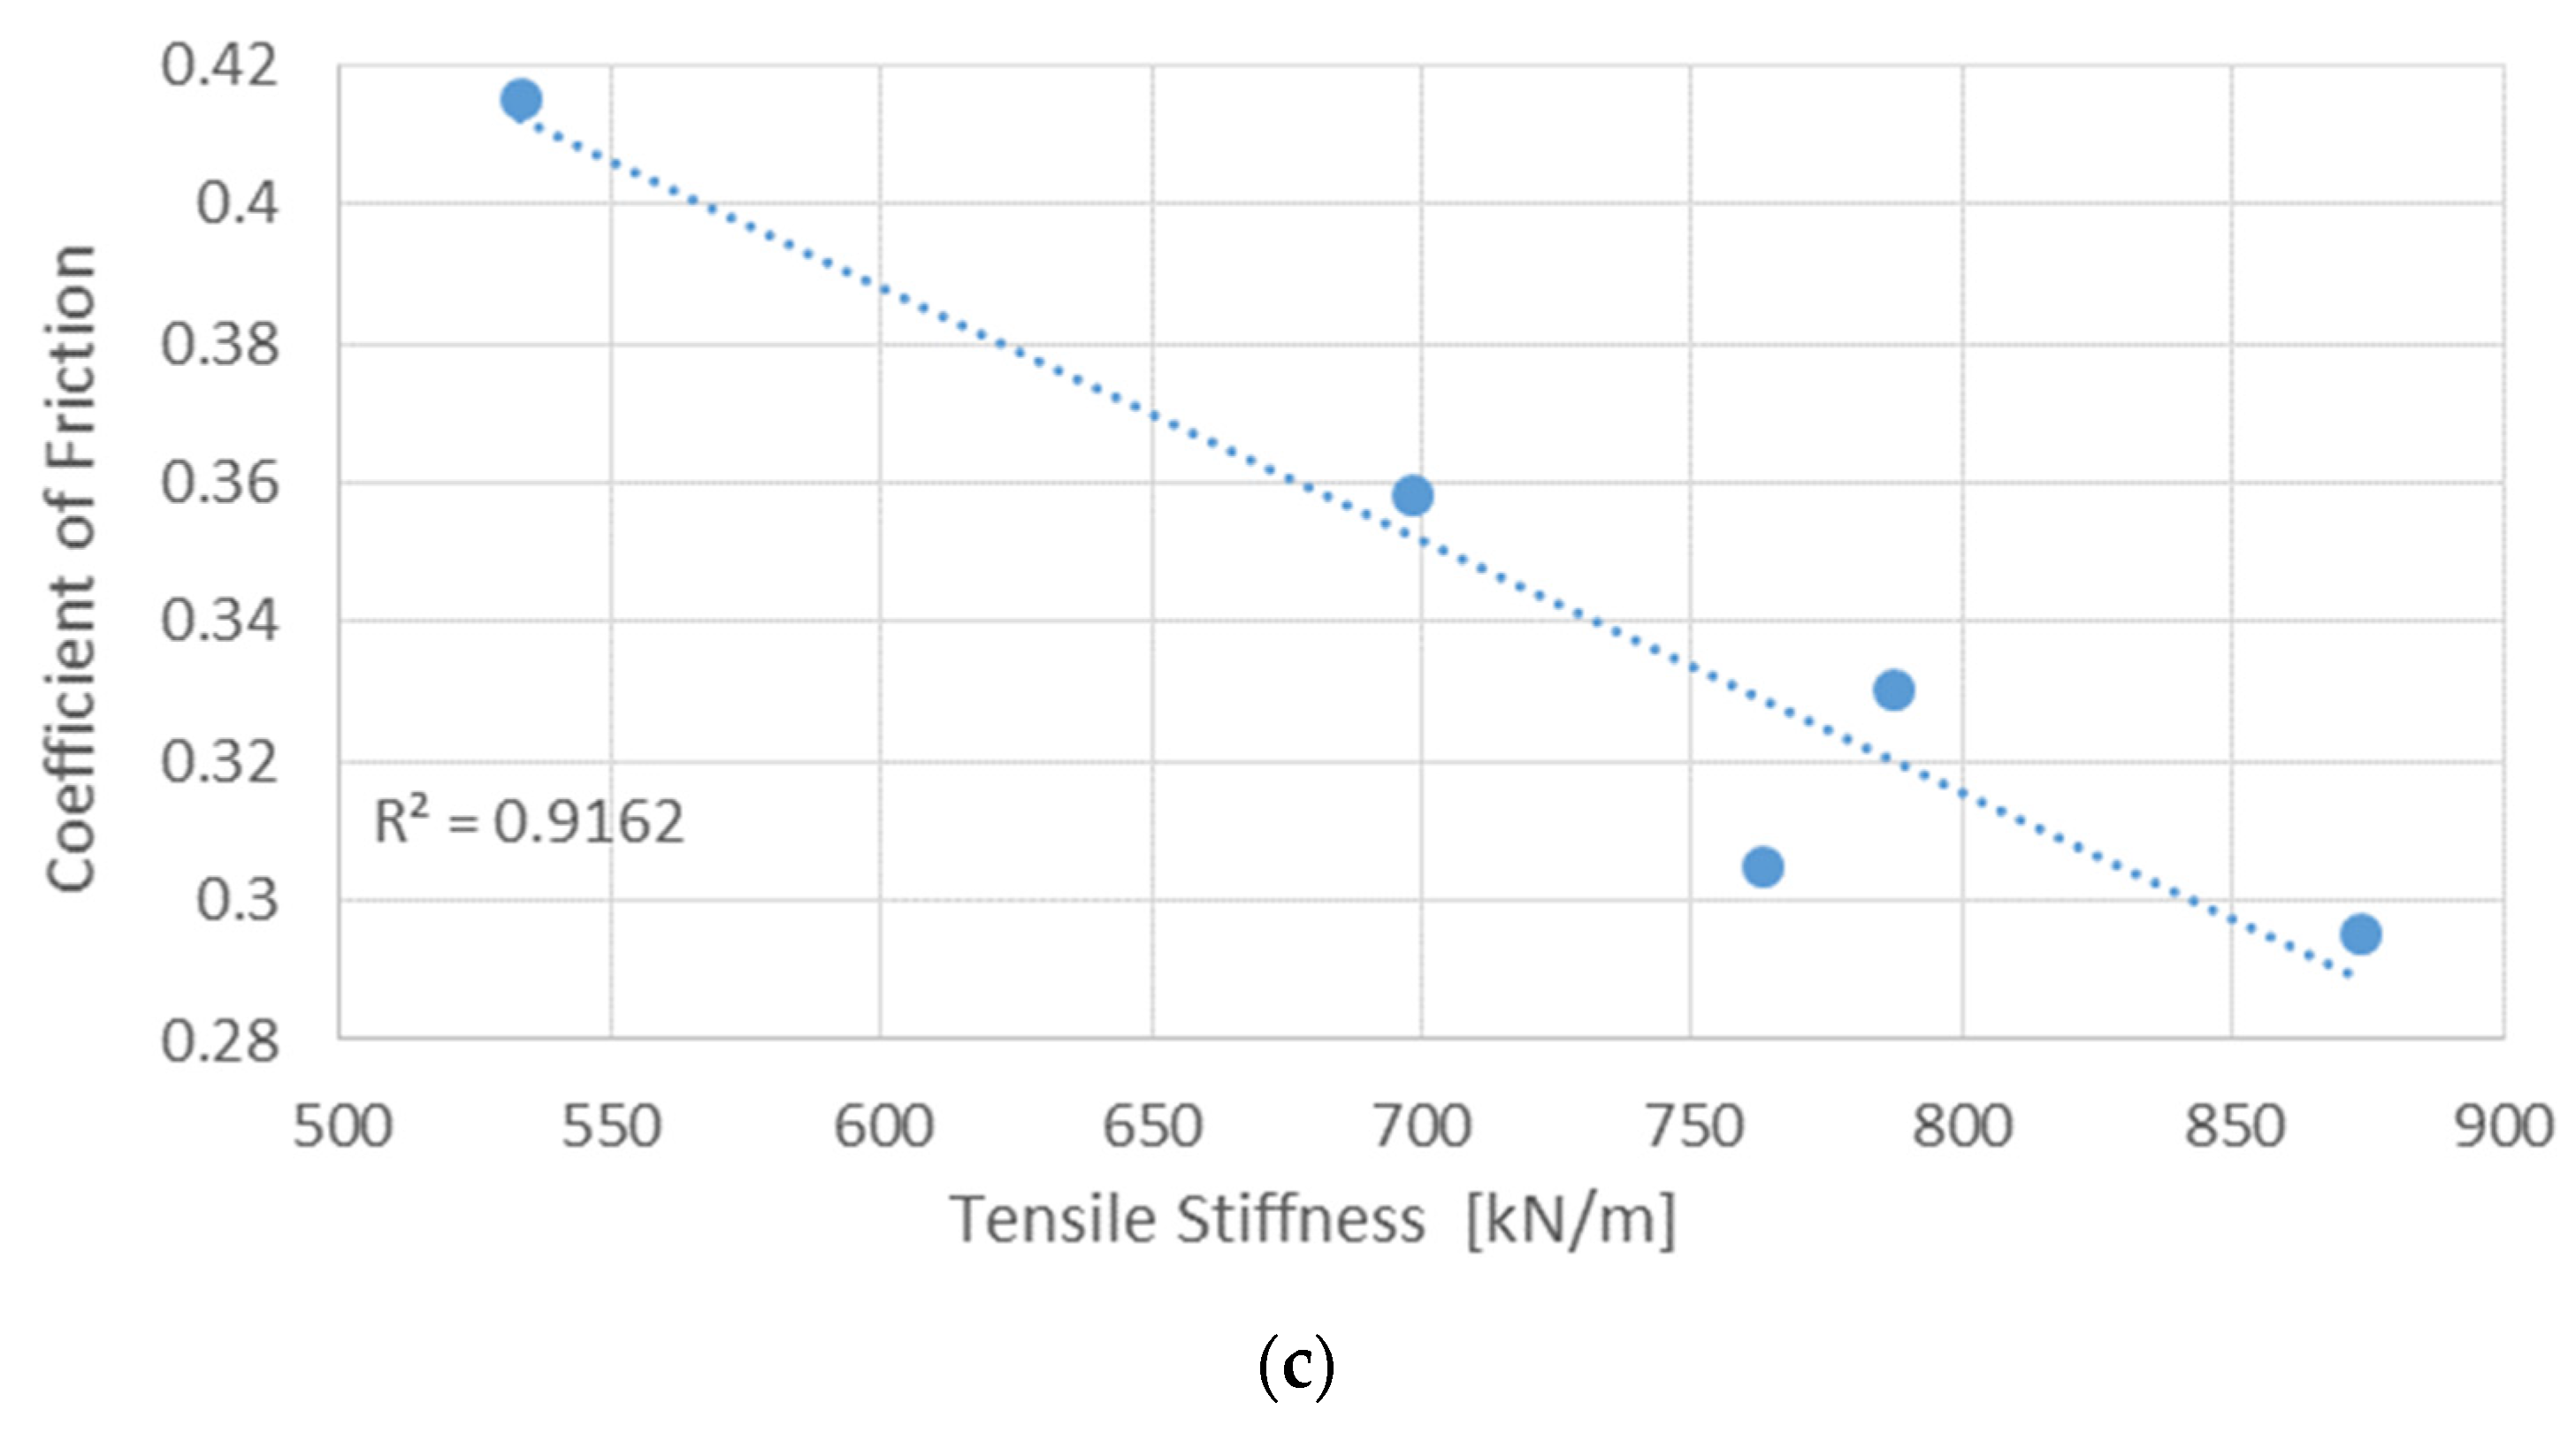
3.3. Correlation between Coefficient of Friction and Mechanical Properties
4. Conclusions
- It has been shown that the coefficient of friction is higher in the palm area when compared to the ventral surface of the forearm. On average, the coefficient of friction in the palm of the hand was 25% higher compared to the ventral surface of the forearm;
- The effect of the relative humidity on the coefficient of friction was not evident. This fact must be related to the thickness and moisture absorption capacity of the different tested papers.
- A strongly positive Spearman coefficient of 0.94 was obtained between the coefficient of friction and the tensile strength. The increase in tensile strength leads to an increase in the coefficient of friction;
- A strongly negative Spearman coefficient of −0.90 was obtained between the coefficient of friction and tensile stiffness. This means that with the increase in tensile rigidity. The coefficient of friction tends to decrease.
Author Contributions
Funding
Informed Consent Statement
Data Availability Statement
Acknowledgments
Conflicts of Interest
Appendix A

| Anova: Single Factor | ||||||
|---|---|---|---|---|---|---|
| SUMMARY | ||||||
| Groups | Count | Sum | Average | Variance | ||
| Printing | 5 | 0.277204 | 0.055441 | 3.72 × 10⁻⁵ | ||
| Bar napkins | 5 | 0.137902 | 0.02758 | 1.7 × 10⁻⁵ | ||
| Hand towels | 5 | 1.537188 | 0.307438 | 0.000268 | ||
| Napkin | 5 | 0.395608 | 0.079122 | 5.65 × 10⁻⁶ | ||
| Toilet | 5 | 0.748145 | 0.149629 | 0.000117 | ||
| Kitchen | 5 | 0.531785 | 0.106357 | 0.000392 | ||
| Handkerchiefs | 5 | 1.168416 | 0.233683 | 0.000165 | ||
| ANOVA | ||||||
| Source of Variation | SS | df | MS | F | p-value | F crit |
| Between Groups | 0.307348 | 6 | 0.051225 | 357.6672 | 4.05 × 10⁻²⁵ | 2.445259 |
| Within Groups | 0.00401 | 28 | 0.000143 | |||
| Total | 0.311358 | 34 |
| Anova: Single Factor | ||||||
|---|---|---|---|---|---|---|
| SUMMARY | ||||||
| Groups | Count | Sum | Average | Variance | ||
| Printing | 5 | 390.0481 | 78.00962 | 128.7637 | ||
| Bar napkins | 5 | 19.16648 | 3.833295 | 0.590042 | ||
| Hand towels | 5 | 301.9262 | 60.38524 | 33.56738 | ||
| Napkin | 5 | 22.20864 | 4.441729 | 0.377227 | ||
| Toilet | 5 | 70.82795 | 14.16559 | 2.028468 | ||
| Kitchen | 5 | 33.49638 | 6.699277 | 2.254712 | ||
| Handkerchiefs | 5 | 215.288 | 43.05759 | 31.36285 | ||
| ANOVA | ||||||
| Source of Variation | SS | df | MS | F | p-value | F crit |
| Between Groups | 27,651.06 | 6 | 4608.509 | 162.1537 | 2.05 × 10⁻²⁰ | 2.445259 |
| Within Groups | 795.7776 | 28 | 28.42063 | |||
| Total | 28,446.83 | 34 |
| Anova: Single Factor | ||||||
|---|---|---|---|---|---|---|
| SUMMARY | ||||||
| Groups | Count | Sum | Average | Variance | ||
| Printing | 5 | 9.761677 | 1.952335 | 0.007036 | ||
| Bar napkins | 5 | 1.154109 | 0.230822 | 0.001223 | ||
| Hand towels | 5 | 1.872931 | 0.374586 | 0.000328 | ||
| Napkin | 5 | 0.564382 | 0.112876 | 9.85 × 10⁻⁵ | ||
| Toilet | 5 | 0.874139 | 0.174828 | 0.000189 | ||
| Kitchen | 5 | 0.455905 | 0.091181 | 9.76 × 10⁻⁵ | ||
| Handkerchiefs | 5 | 1.561798 | 0.31236 | 0.000746 | ||
| ANOVA | ||||||
| Source of Variation | SS | df | MS | F | p-value | F crit |
| Between Groups | 13.23203 | 6 | 2.205338 | 1588.397 | 4.09 × 10⁻³⁴ | 2.445259 |
| Within Groups | 0.038875 | 28 | 0.001388 | |||
| Total | 13.2709 | 34 |
| Anova: Single Factor | ||||||
|---|---|---|---|---|---|---|
| SUMMARY | ||||||
| Groups | Count | Sum | Average | Variance | ||
| Printing | 5 | 302,802.2 | 60,560.43 | 16,617,676 | ||
| Bar napkins | 5 | 27,874.71 | 5574.942 | 1,611,219 | ||
| Hand towels | 5 | 2665.55 | 533.1099 | 1685.899 | ||
| Napkin | 5 | 3935.249 | 787.0499 | 1585.967 | ||
| Toilet | 5 | 3491.031 | 698.2062 | 2664.365 | ||
| Kitchen | 5 | 4368.631 | 873.7263 | 15,403.88 | ||
| Handkerchiefs | 5 | 3814.473 | 762.8946 | 1875.543 | ||
| ANOVA | ||||||
| Source of Variation | SS | df | MS | F | p-value | F crit |
| Between Groups | 1.5 × 10¹⁰ | 6 | 2.5 × 10⁹ | 960.5731 | 4.53 × 10⁻³¹ | 2.445259 |
| Within Groups | 73,008,442 | 28 | 2,607,444 | |||
| Total | 1.51 × 10¹⁰ | 34 |
References
- Dupuytren, G. Traite Theorique et Pratique des Blessures par Armes le Guerre; Bailliere et Fils: Paris, France, 1834; Volume 1, pp. 60–63. [Google Scholar]
- Langer, A.K. Zuranatomie und Physiologie der haut. Sber. Akad. Wiss. Wien 1861, 44, 19. [Google Scholar]
- Langer, K. On the Anatomy and Physiology of the Skin; The Imperial Academy of Science: Vienna, Austria, 1861; reprinted in Br. J. Plast. Surg. 1978, 17, 93–106. [Google Scholar]
- Fung, Y.C.B. Elasticity of soft tissues in single elongation. Am. J. Physiol. 1964, 213, 1532–1554. [Google Scholar] [CrossRef] [PubMed]
- Lanir, Y.; Fung, Y. Two-dimensional mechanical properties of rabbit skin—II. Experimental results. J. Biomech. 1974, 7, 171–182. [Google Scholar] [CrossRef] [PubMed]
- Alexander, H.; Cook, T. Accounting for natural tension in the mechanical testing of human skin. J. Investig. Dermatol. 1977, 69, 310–314. [Google Scholar] [CrossRef]
- Tong, P.; Fung, Y.-C. The stress-strain relationship for the skin. J. Biomech. 1976, 9, 649–657. [Google Scholar] [CrossRef]
- Johnson, S.; Gorman, D.; Adams, M.; Briscoe, B. The friction and lubrication of human stratum corneum. Tribol. Ser. 1993, 25, 663–672. [Google Scholar] [CrossRef]
- Comaish, S.; Bottoms, E. The skin and friction: Deviations from Amontons’ laws, and the effects of hydration and lubrication. Br. J. Dermatol. 1971, 84, 37–43. [Google Scholar] [CrossRef] [PubMed]
- Annaidh, A.N.; Bruyère, K.; Destrade, M.; Gilchrist, M.D.; Otténio, M. Characterising the Anisotropic Mechanical Properties of Excised Human Skin. J. Mech. Behav. Biomed. Mater. 2012, 5, 139–148. [Google Scholar] [CrossRef]
- Delalleau, A.; Josse, G.; Lagarde, J.M.; Zahouani, H.; Bergheau, J.M. A nonlinear elastic behavior to identify the mechanical parameters of human skin in vivo. Skin Res. Technol. 2008, 14, 152–164. [Google Scholar] [CrossRef]
- Wilkes, G.; Brown, I.; Wildnauer, R. The biomechanical properties of skin. CRC Crit. Rev. Bioeng. 1973, 1, 453–495. [Google Scholar]
- Van Der Heide, E.; Zeng, X.; Masen, M.A. Skin tribology: Science friction? Friction 2013, 1, 130–142. [Google Scholar] [CrossRef]
- Dowson, D. Tribology and the skin surface. In Bioengineering of the Skin: Skin Surface Imaging and Analysis; CRC Press: Boca Raton, FL, USA, 1997; pp. 159–179. [Google Scholar]
- Adams, M.J.; Briscoe, B.J.; Johnson, S.A. Friction and lubrication of human skin. Tribol. Lett. 2007, 26, 239–253. [Google Scholar] [CrossRef]
- Pailler-Mattei, C.; Nicoli, S.; Pirot, F.; Vargiolu, R.; Zahouani, H. A new approach to describe the skin surface physical properties in vivo. Colloids Surf. B Biointerfaces 2009, 68, 200–206. [Google Scholar] [CrossRef] [PubMed]
- Derler, S.; Gerhardt, L.-C. Tribology of Skin: Review and Analysis of Experimental Results for the Friction Coefficient of Human Skin. Tribol. Lett. 2011, 45, 1–27. [Google Scholar] [CrossRef]
- Thieulin, C.; Pailler-Mattei, C.; Vargiolu, R.; Lancelot, S.; Zahouani, H. Study of the tactile perception of bathroom tissues: Comparison between the sensory evaluation by a handfeel panel and a tribo-acoustic artificial finger. Colloids Surf. B Biointerfaces 2017, 150, 417–425. [Google Scholar] [CrossRef]
- Skedung, L.; Danerlöv, K.; Olofsson, U.; Johannesson, C.M.; Aikala, M.; Kettle, J.; Arvidsson, M.; Berglund, B.; Rutland, M.W. Tactile perception: Finger friction, surface roughness and perceived coarseness. Tribol. Int. 2011, 44, 505–512. [Google Scholar] [CrossRef]
- Gee, M.; Tomlins, P.; Calver, A.; Darling, R.; Rides, M. A new friction measurement system for the frictional component of touch. Wear 2005, 259, 1437–1442. [Google Scholar] [CrossRef]
- Skedung, L.; Danerlöv, K.; Olofsson, U.; Aikala, M.; Niemi, K.; Kettle, J.; Rutland, M.W. Finger Friction Measurements on Coated and Uncoated Printing Papers. Tribol. Lett. 2009, 37, 389–399. [Google Scholar] [CrossRef]
- Ramalho, A.; Silva, C.L.; Pais, A.A.C.C.; Sousa, J.J.S. In vivo Friction Study of Human Palmoplantar Skin against Glass. Tribologia 2006, 25, 14–23. [Google Scholar]
- Ramalho, A.; Silva, C.; Pais, A.; Sousa, J. In vivo friction study of human skin: Influence of moisturizers on different anatomical sites. Wear 2007, 263, 1044–1049. [Google Scholar] [CrossRef]
- Gerhardt, L.L.-C.; Strässle, V.; Lenz, A.; Spencer, N.; Derler, S. Influence of epidermal hydration on the friction of human skin against textiles. J. R. Soc. Interface 2008, 5, 1317–1328. [Google Scholar] [CrossRef] [PubMed]
- Hendriks, C.P.; Franklin, S.E. Influence of Surface Roughness, Material and Climate Conditions on the Friction of Human Skin. Tribol. Lett. 2009, 37, 361–373. [Google Scholar] [CrossRef]
- Nacht, S.; Close, J.-A.; Yeung, D.; Gans, E.H. Skin friction coefficient: Changes induced by skin hydration and emollient application and correlation with perceived skin feel. J. Soc. Cosmet. Chem. 1981, 32, 55–65. [Google Scholar]
- Denda, M. Dry Skin and Moisturizers: Chemistry and Function; LodeA, M., Maibach, N.H., Eds.; CRC Press: Boca Raton, FL, USA, 2000; pp. 147–153. [Google Scholar]
- Wolfram, L.J. Friction of skin. J. Soc. Cosmet. Chem. 1983, 34, 465–476. [Google Scholar]
- Hills, R.J.; Unsworth, A.; Ive, F.A. A comparative study of the frictional properties of emollient bath additives using porcine skin. Br. J. Dermatol. 1994, 130, 37–41. [Google Scholar] [CrossRef]
- Vilhena, L.; Ramalho, A. Friction of Human Skin against Different Fabrics for Medical Use. Lubricants 2016, 4, 6. [Google Scholar] [CrossRef]
- Vilhena, L.M.; Ramalho, A. Friction Behavior of Human Skin Rubbing against Different Textured Polymeric Materials Obtained by a 3D Printing Microfabrication Technique. Tribol. Trans. 2019, 62, 324–336. [Google Scholar] [CrossRef]
- ASTM-D828; Standard Test Method for Tensile Properties of Paper and Paperboard Using Constant-Rate-of-Elongation Apparatus. ASTM International: West Conshohocken, PA, USA, 2022.
- Fernandes, E.F.d.M. Estudo das Condições de Contacto Com Atrito Envolvendo a Pele Humana; Universidade de Coimbra, Estudo geral, repositório científico da UC: Coimbra, Portugal, 2018. [Google Scholar]
- Ramalho, A. Influence of Environmental Humidity on the Friction of Human Skin Against Textiles. In Proceedings of the 17th International Conference on Wear of Materials, Edinburgh, UK, 27–31 July 2009; Ludema, K.C., Shaffer, S.J., Eds.; Elsevier: Las Vegas, NV, USA, 2009; Volume 267, pp. 1–682. [Google Scholar]
- Tomlinson, S.E.; Lewis, R.; Liu, X.; Texier, C.; Carre, M. Understanding the Friction Mechanisms Between the Human Finger and Flat Contacting Surfaces in Moist Conditions. Tribol. Lett. 2010, 41, 283–294. [Google Scholar] [CrossRef]


| Type of Paper | Designation | Grammage (g/m2) | Thickness (mm) | Density (g/cm3) |
|---|---|---|---|---|
| Printing paper (sheet) | a | 84.22 | 0.23 | 0.37 |
| Bar type napkins (dispenser) | b | 18.64 | 0.06 | 0.31 |
| Hand towels paper (dispenser) | c | 34.44 | 0.16 | 0.22 |
| Napkin paper | d | 20.37 | 0.16 | 0.12 |
| Toilet paper | e | 32.31 | 0.27 | 0.12 |
| kitchen towels paper | f | 42.82 | 0.65 | 0.07 |
| Handkerchiefs paper | g | 62.63 | 0.23 | 0.27 |
| Elongation Speed (mm/min) | Tensile Strength (kN/m) | Tensile Energy Absorption (J/m2) | Tensile Stiffness (N/m2) | Elongation at Rupture (%) |
|---|---|---|---|---|
| 7.1 | 1.95 ± 0.08 | 78.01 ± 11.35 | 60.56 ± 4.08 | 5.5 ± 0.6 |
| 25.4 | 4.52 ± 3.02 | 122.67 ± 27.78 | 151.49 ± 95.56 | 4.9 ± 1.7 |
Disclaimer/Publisher’s Note: The statements, opinions and data contained in all publications are solely those of the individual author(s) and contributor(s) and not of MDPI and/or the editor(s). MDPI and/or the editor(s) disclaim responsibility for any injury to people or property resulting from any ideas, methods, instructions or products referred to in the content. |
© 2023 by the authors. Licensee MDPI, Basel, Switzerland. This article is an open access article distributed under the terms and conditions of the Creative Commons Attribution (CC BY) license (https://creativecommons.org/licenses/by/4.0/).
Share and Cite
Vilhena, L.; Afonso, L.; Ramalho, A. Skin Friction: Mechanical and Tribological Characterization of Different Papers Used in Everyday Life. Materials 2023, 16, 5724. https://doi.org/10.3390/ma16165724
Vilhena L, Afonso L, Ramalho A. Skin Friction: Mechanical and Tribological Characterization of Different Papers Used in Everyday Life. Materials. 2023; 16(16):5724. https://doi.org/10.3390/ma16165724
Chicago/Turabian StyleVilhena, Luís, Luís Afonso, and Amílcar Ramalho. 2023. "Skin Friction: Mechanical and Tribological Characterization of Different Papers Used in Everyday Life" Materials 16, no. 16: 5724. https://doi.org/10.3390/ma16165724
APA StyleVilhena, L., Afonso, L., & Ramalho, A. (2023). Skin Friction: Mechanical and Tribological Characterization of Different Papers Used in Everyday Life. Materials, 16(16), 5724. https://doi.org/10.3390/ma16165724