
Mechanical Properties and Microstructure of Dissimilar S355/AA6061-T6 FSW Butt Joints
 , , ,
, , ,  and
and 
Abstract
:1. Introduction
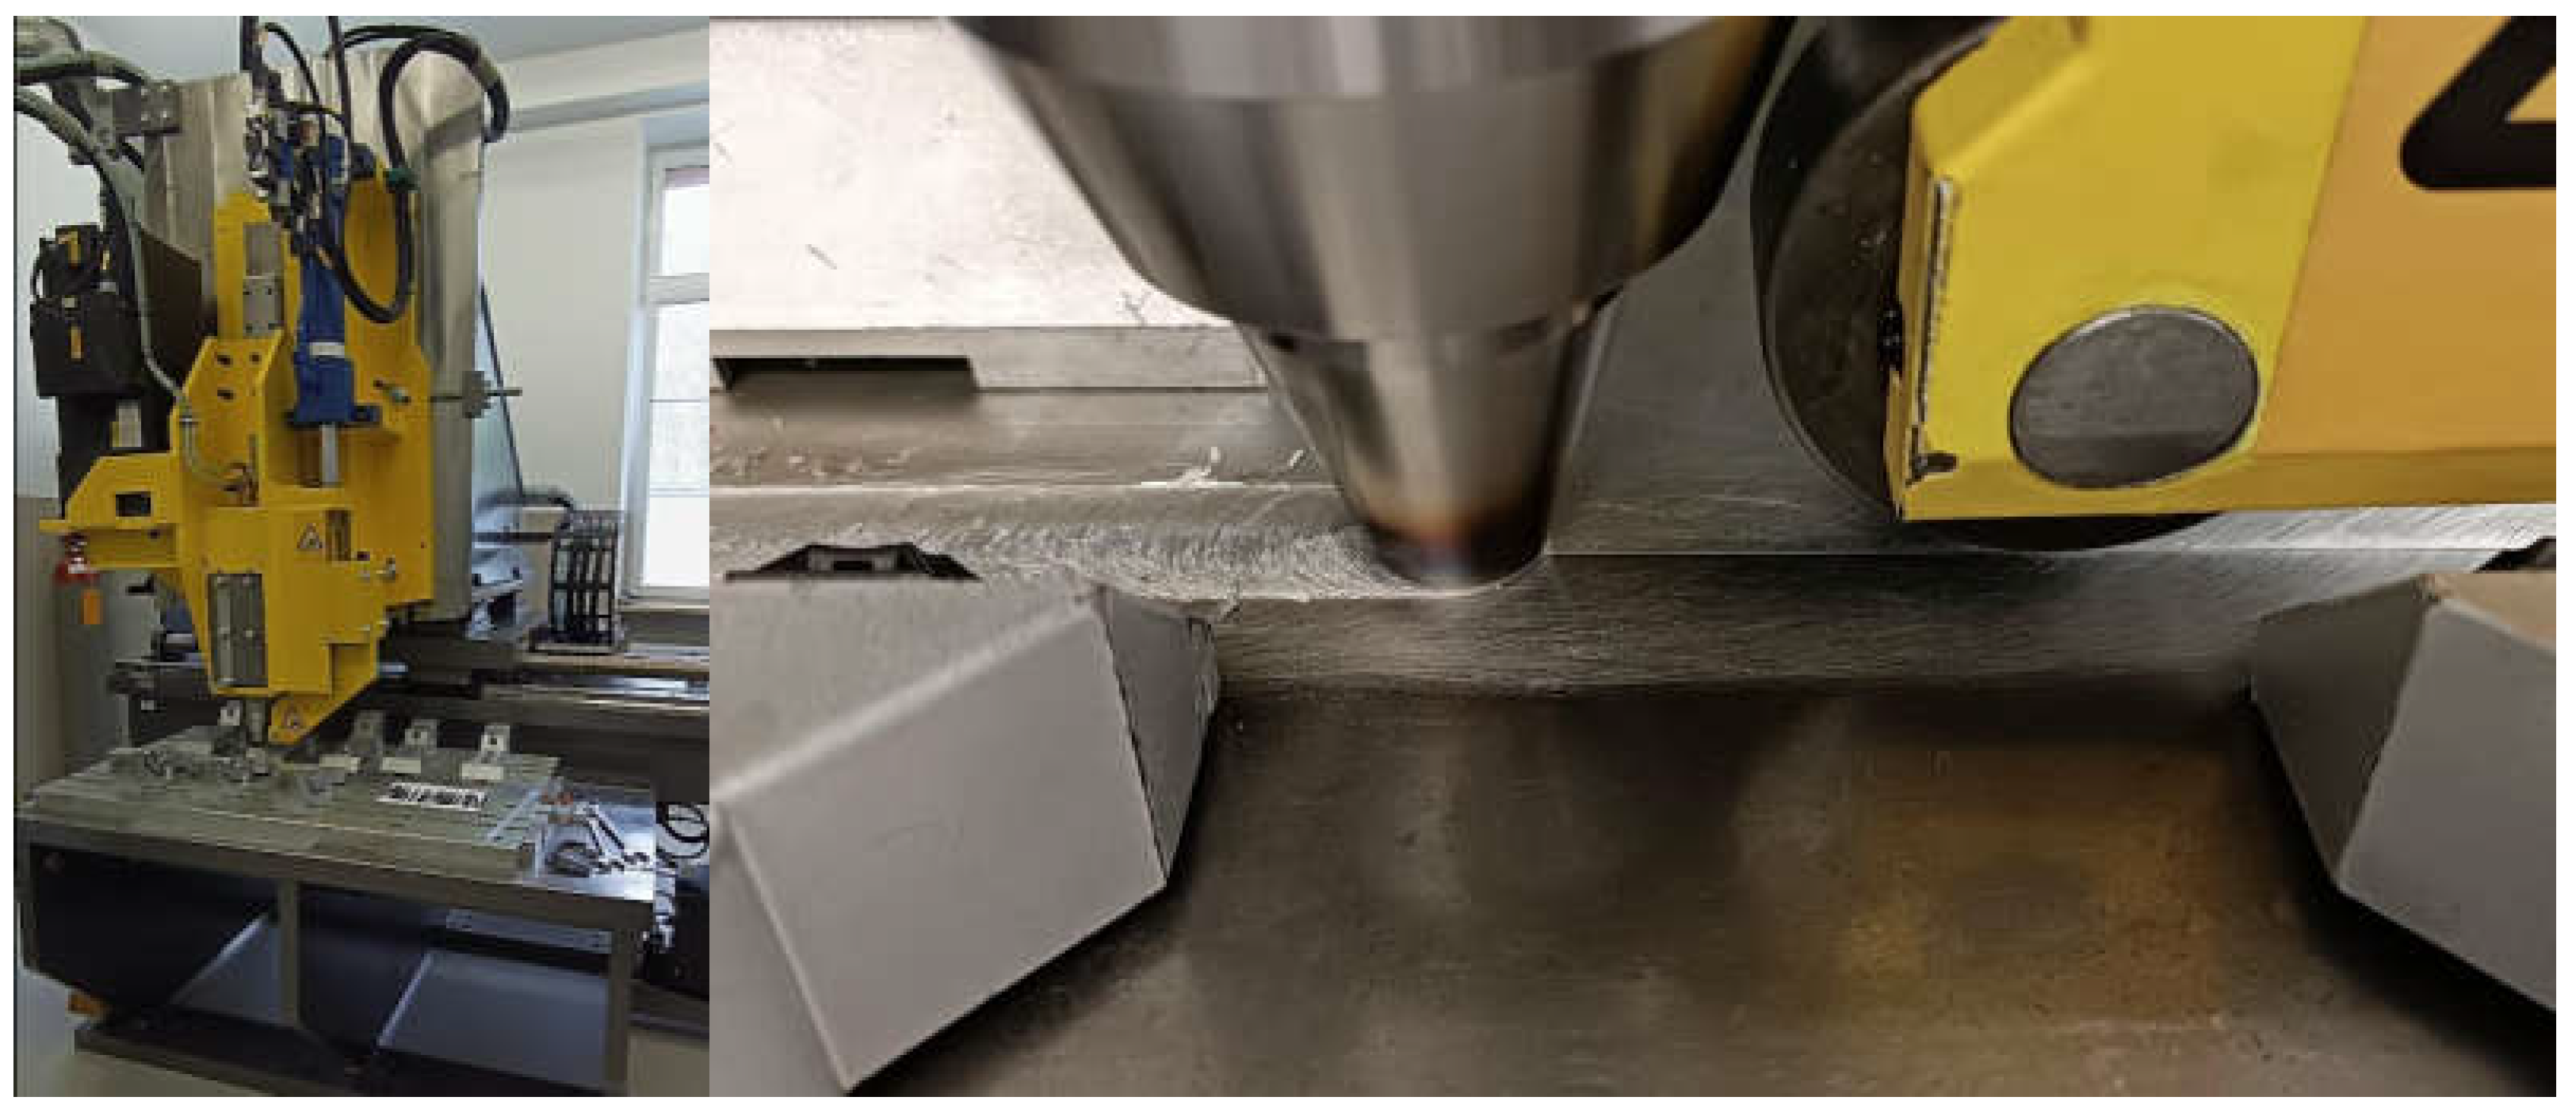
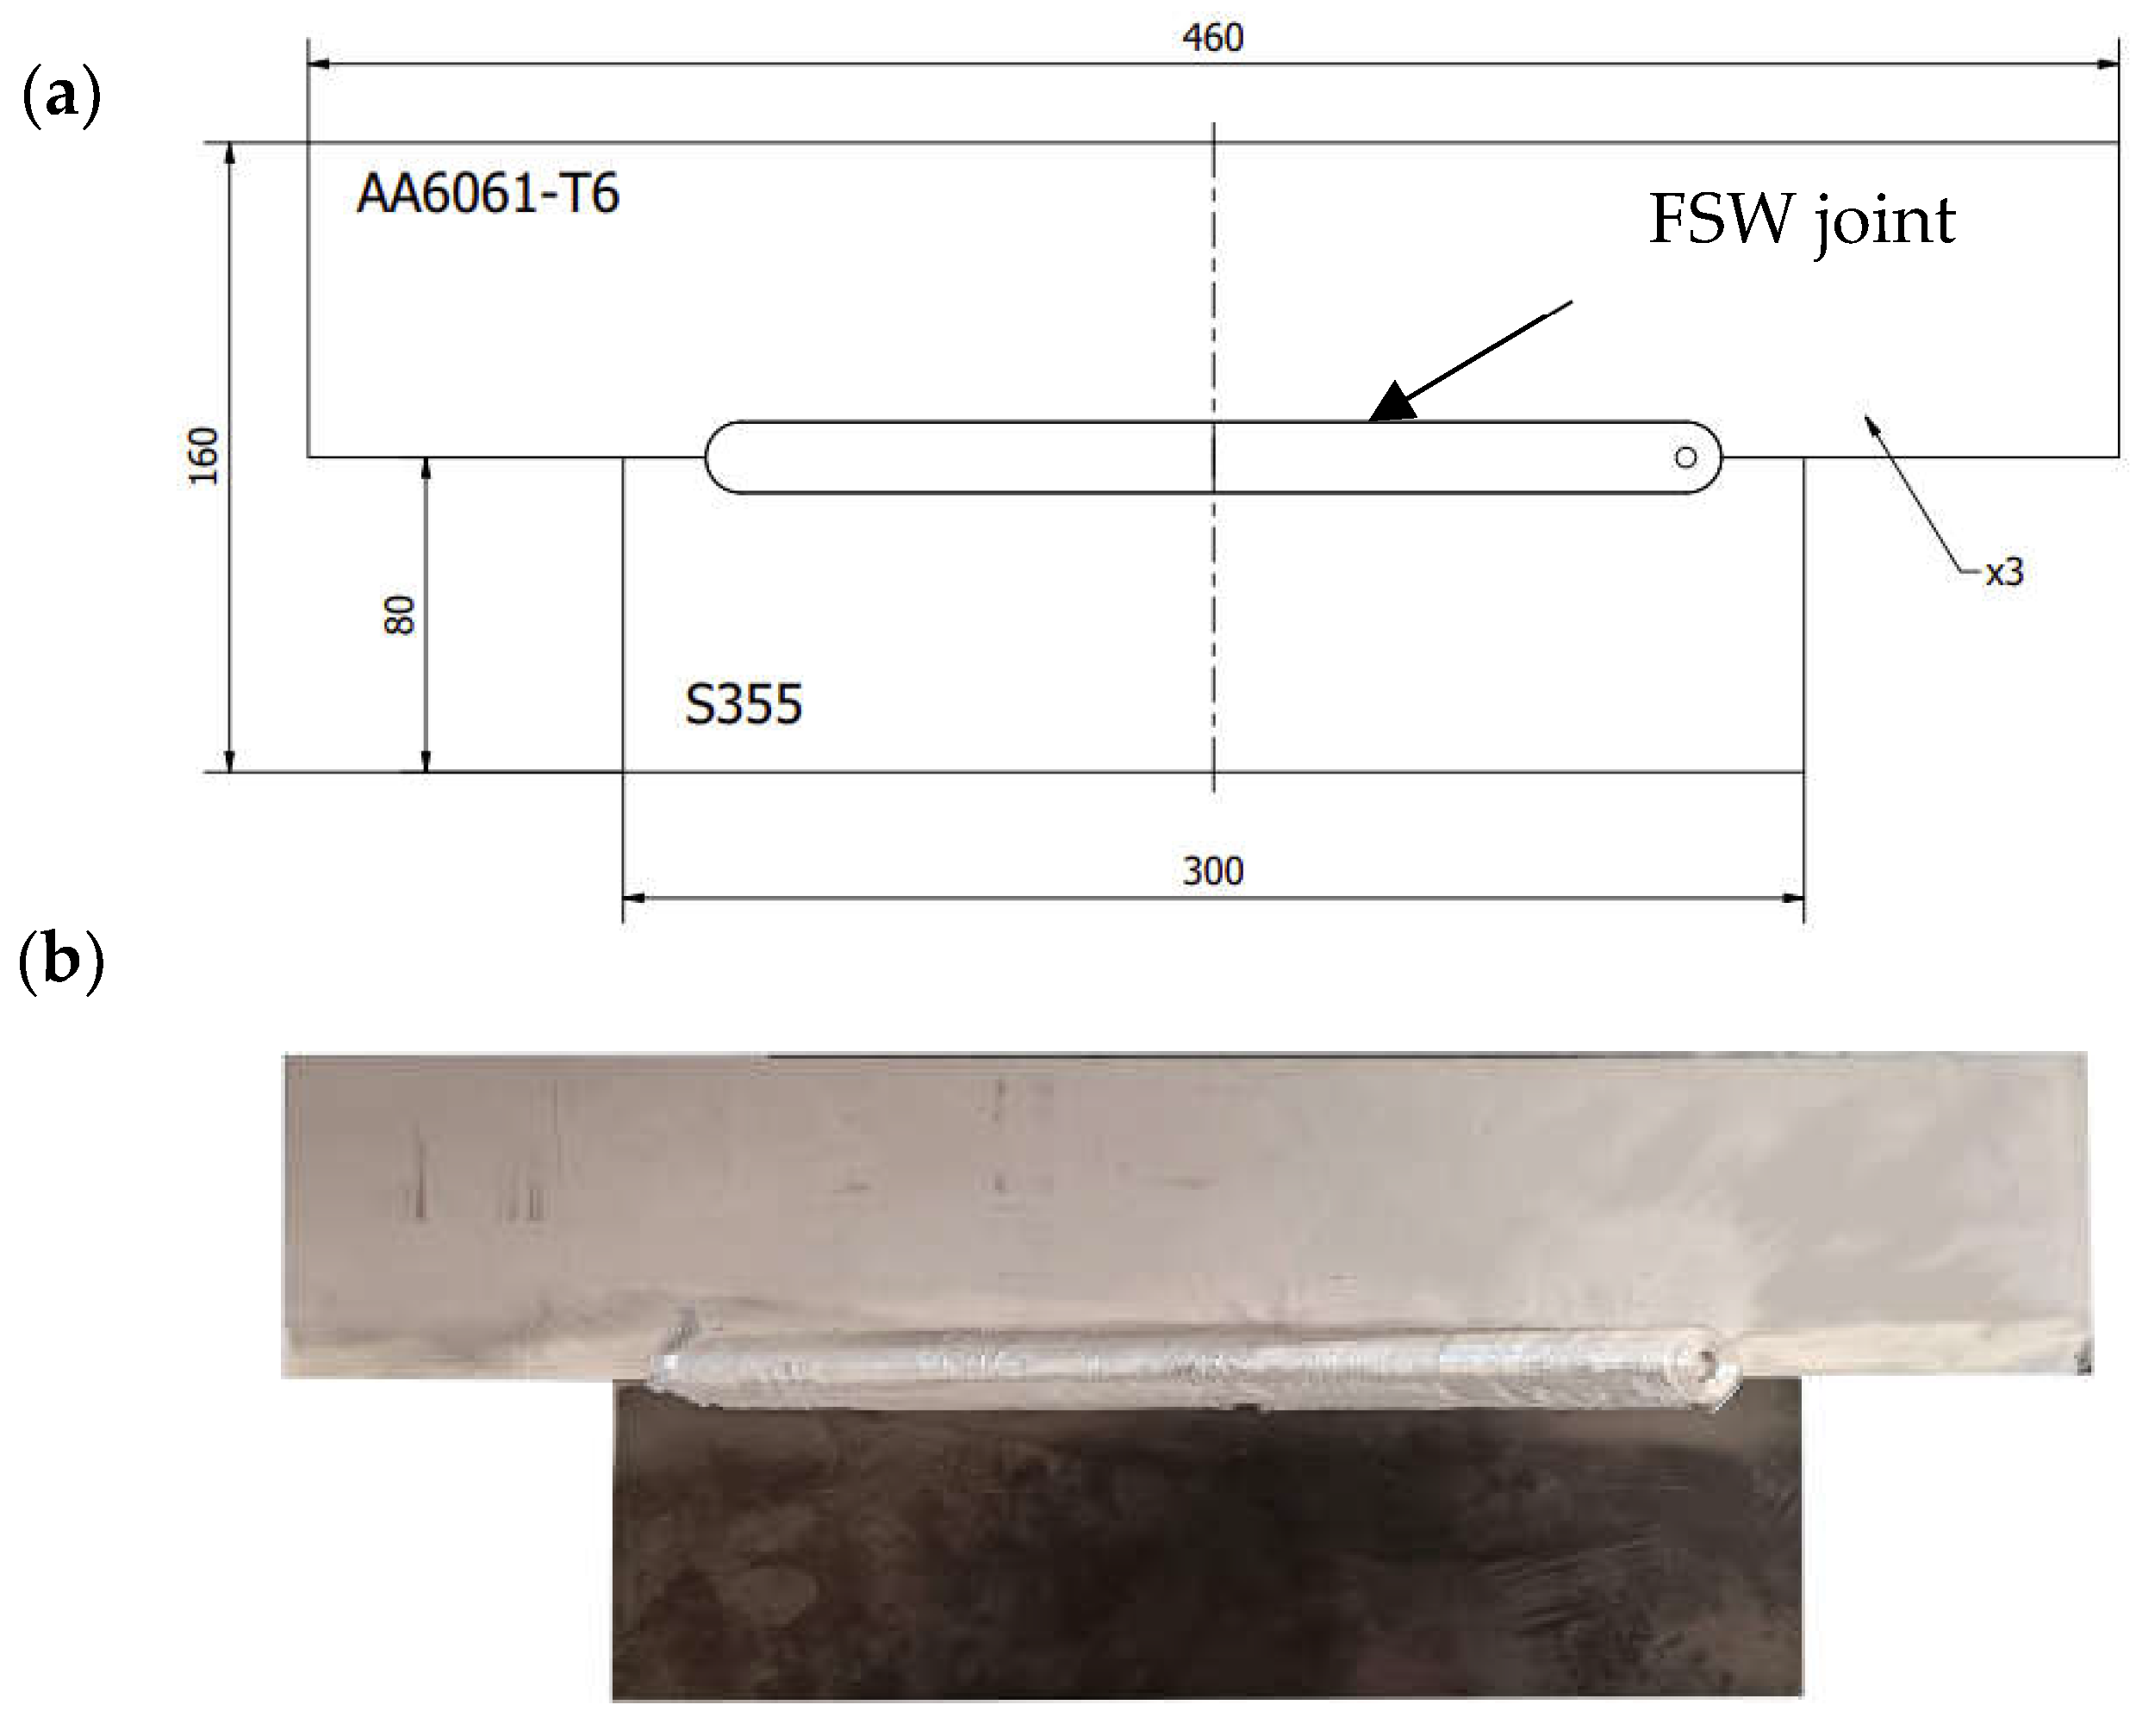
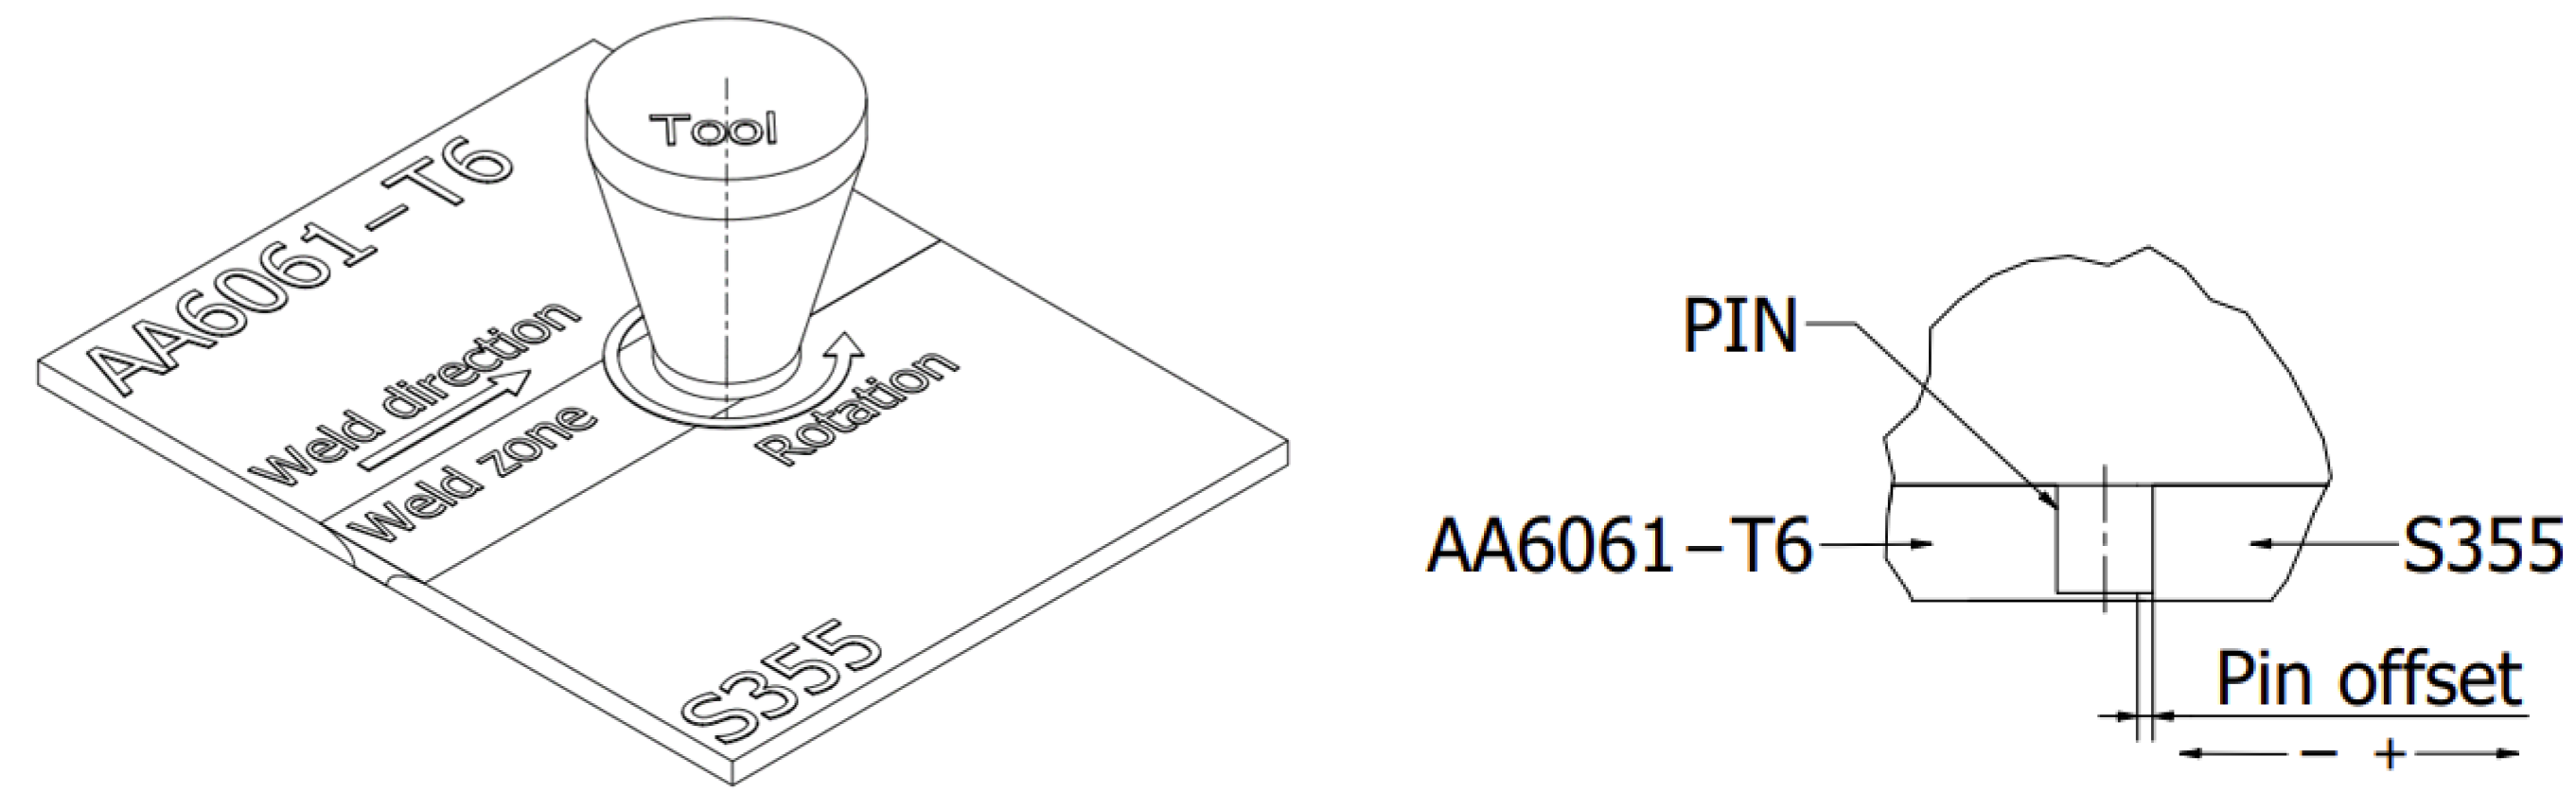
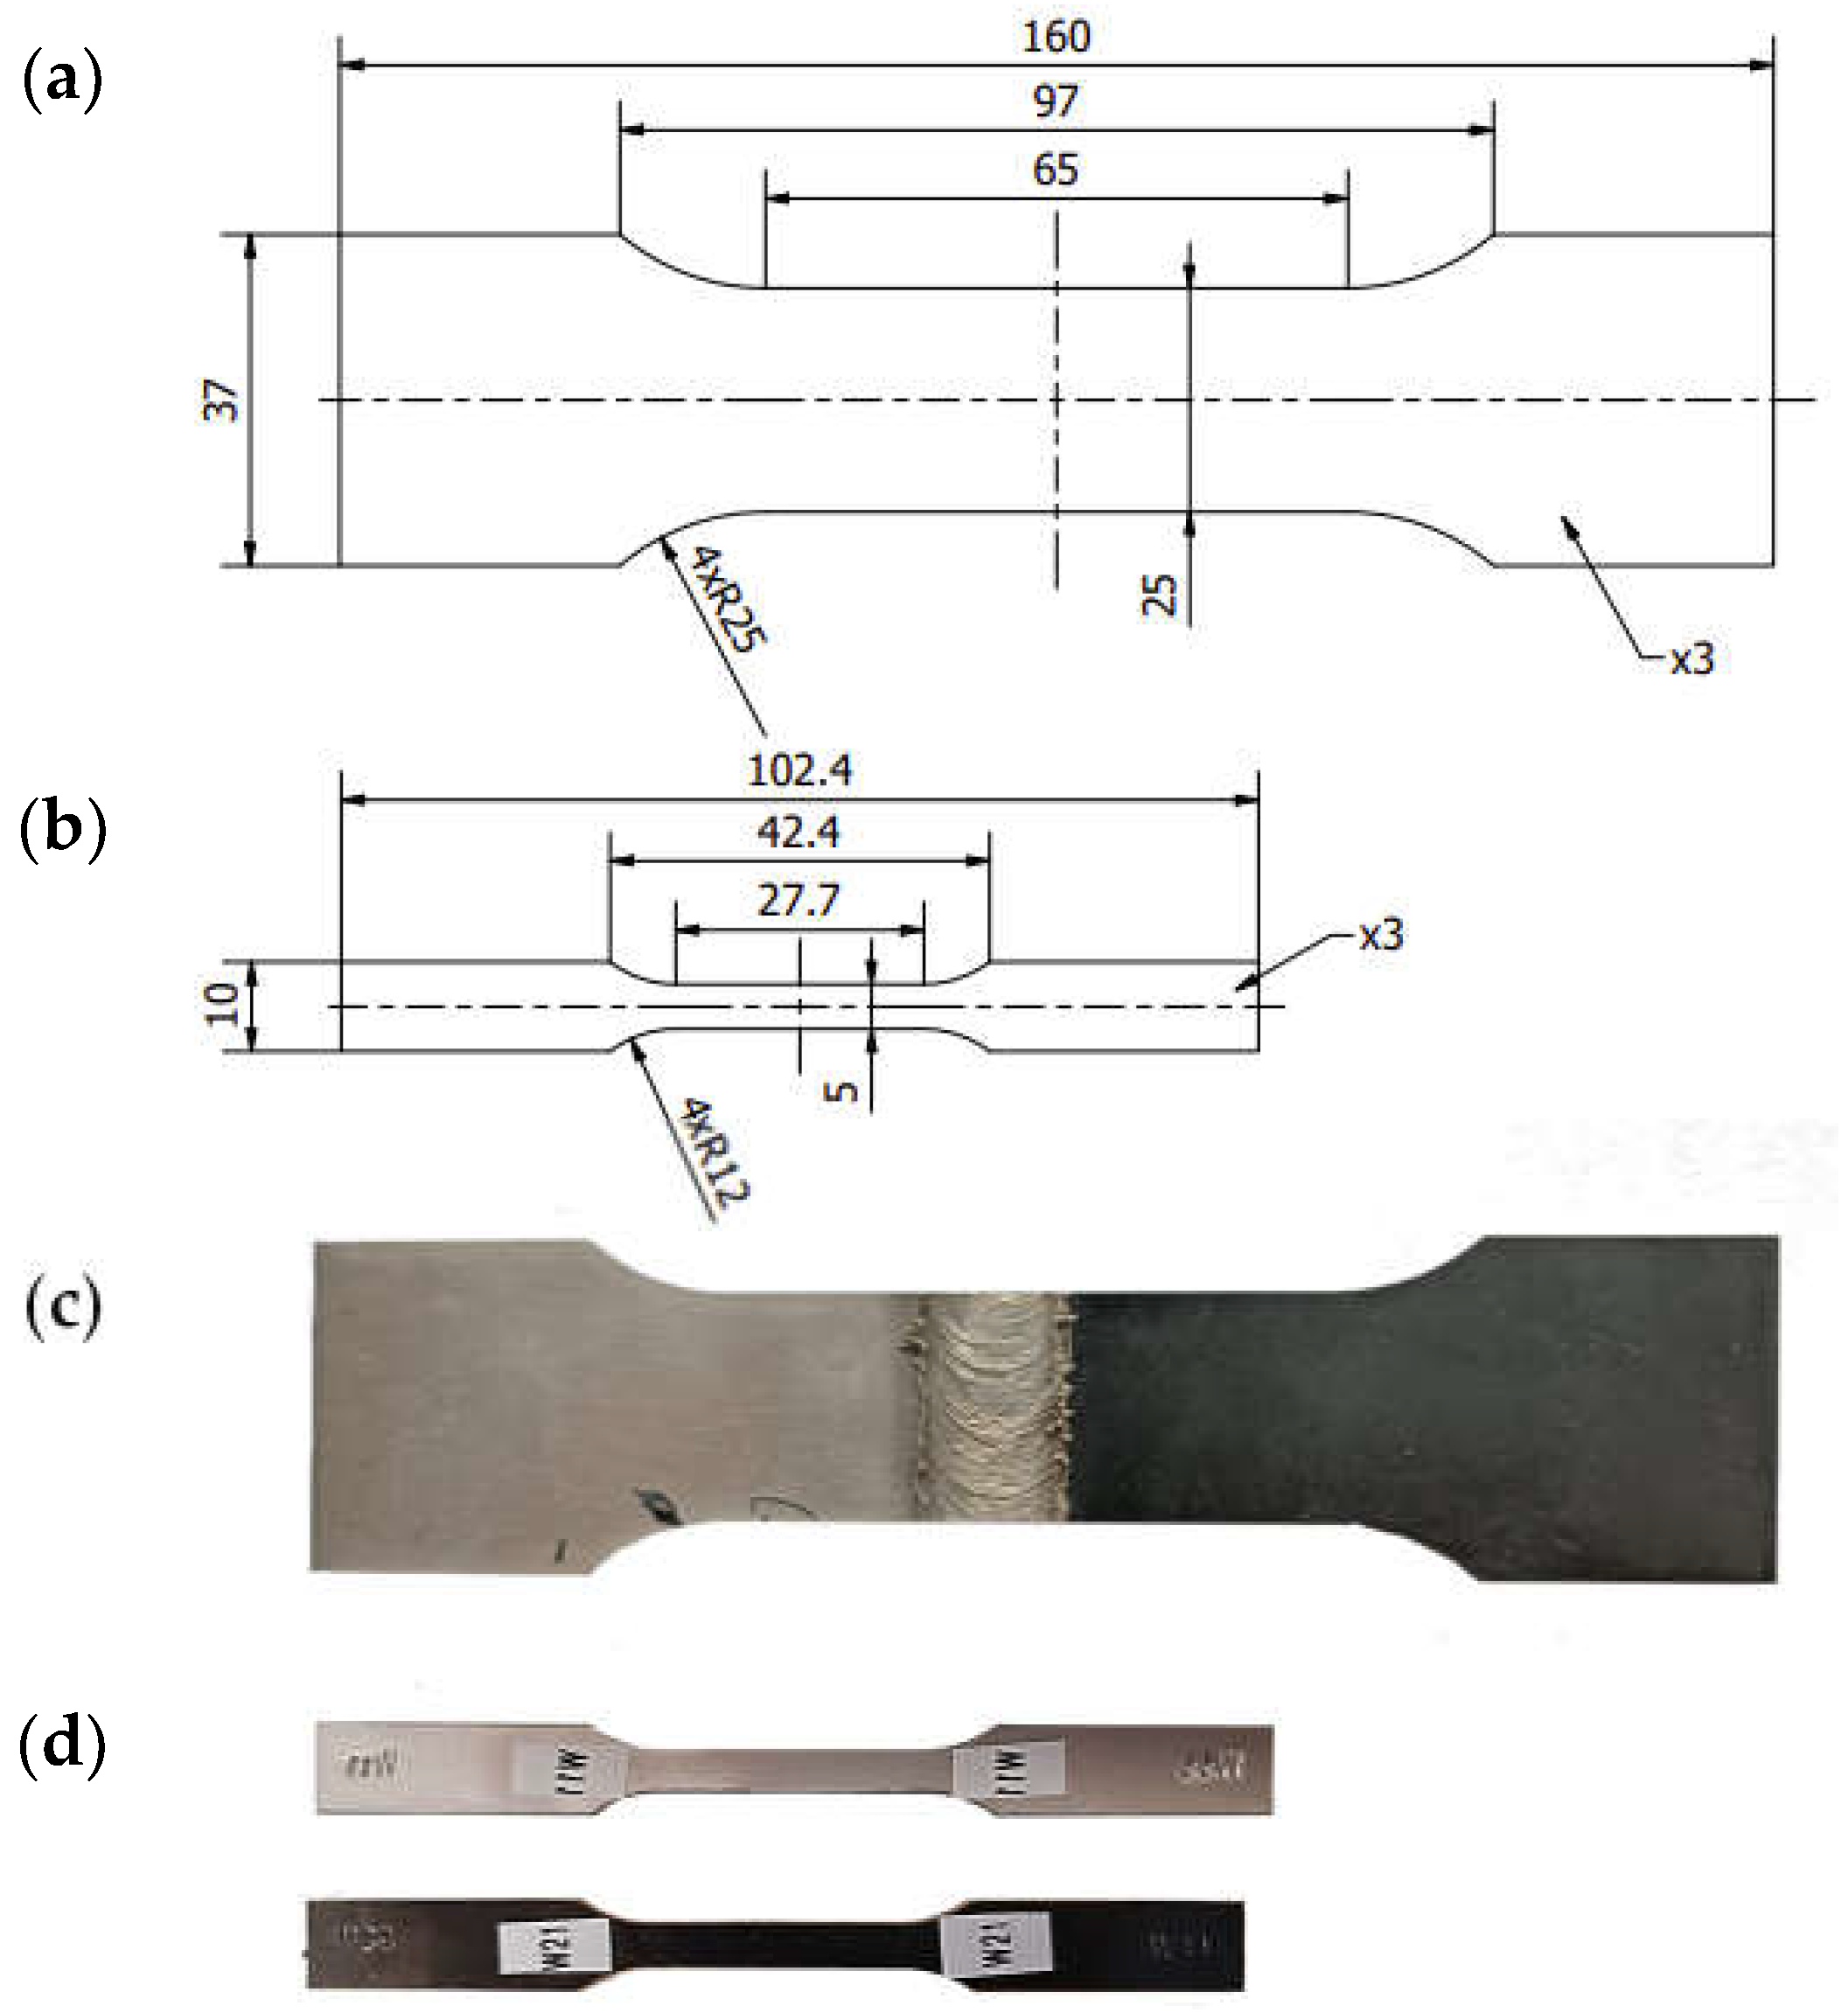
2. Materials and Methods
3. Results and Discussion
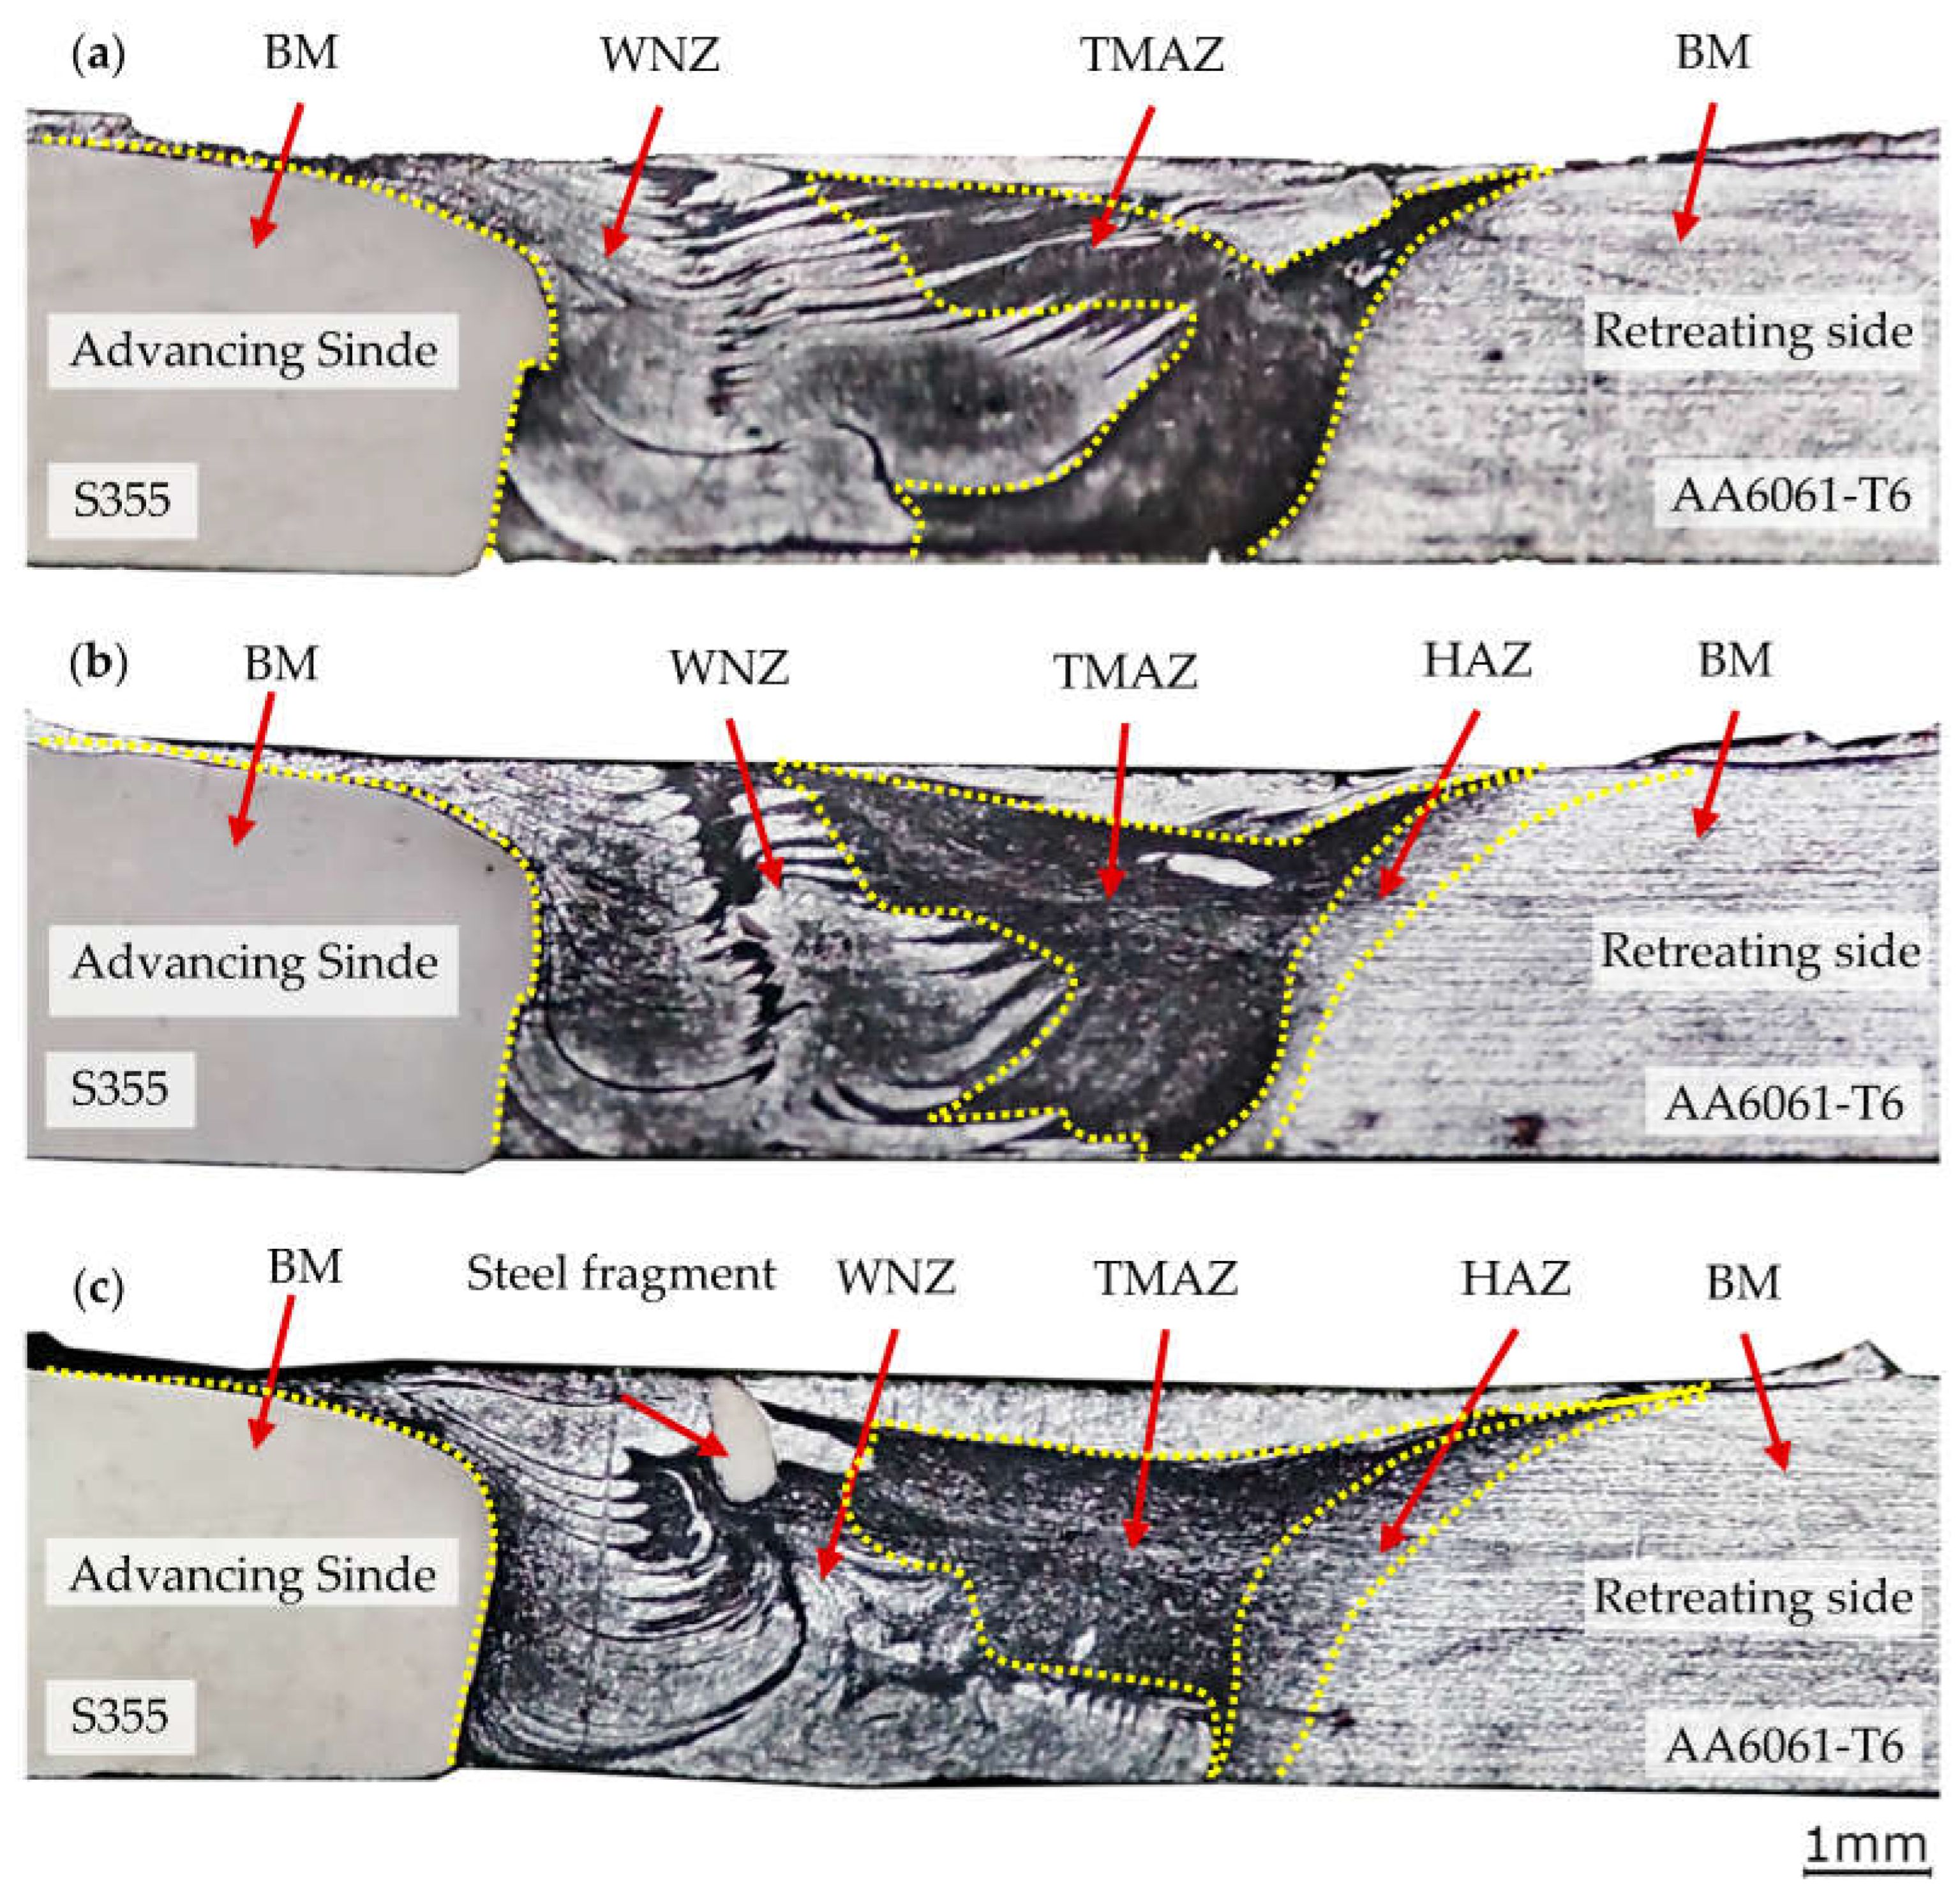
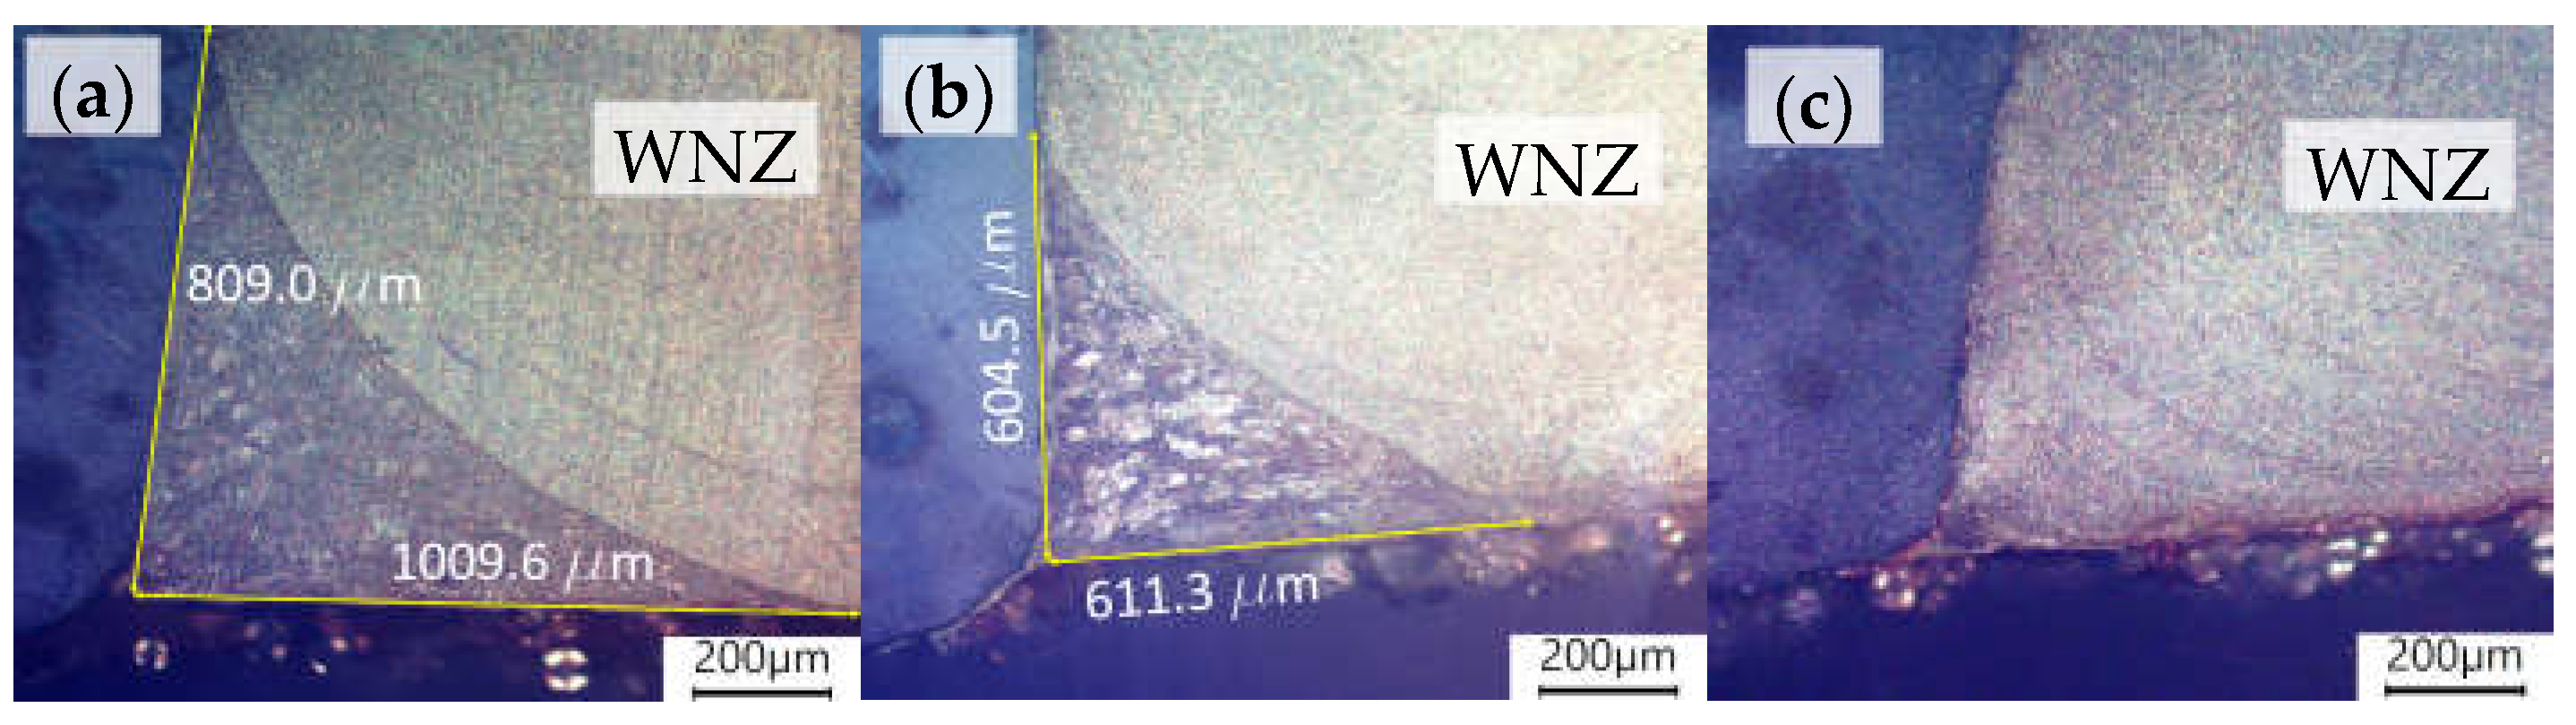
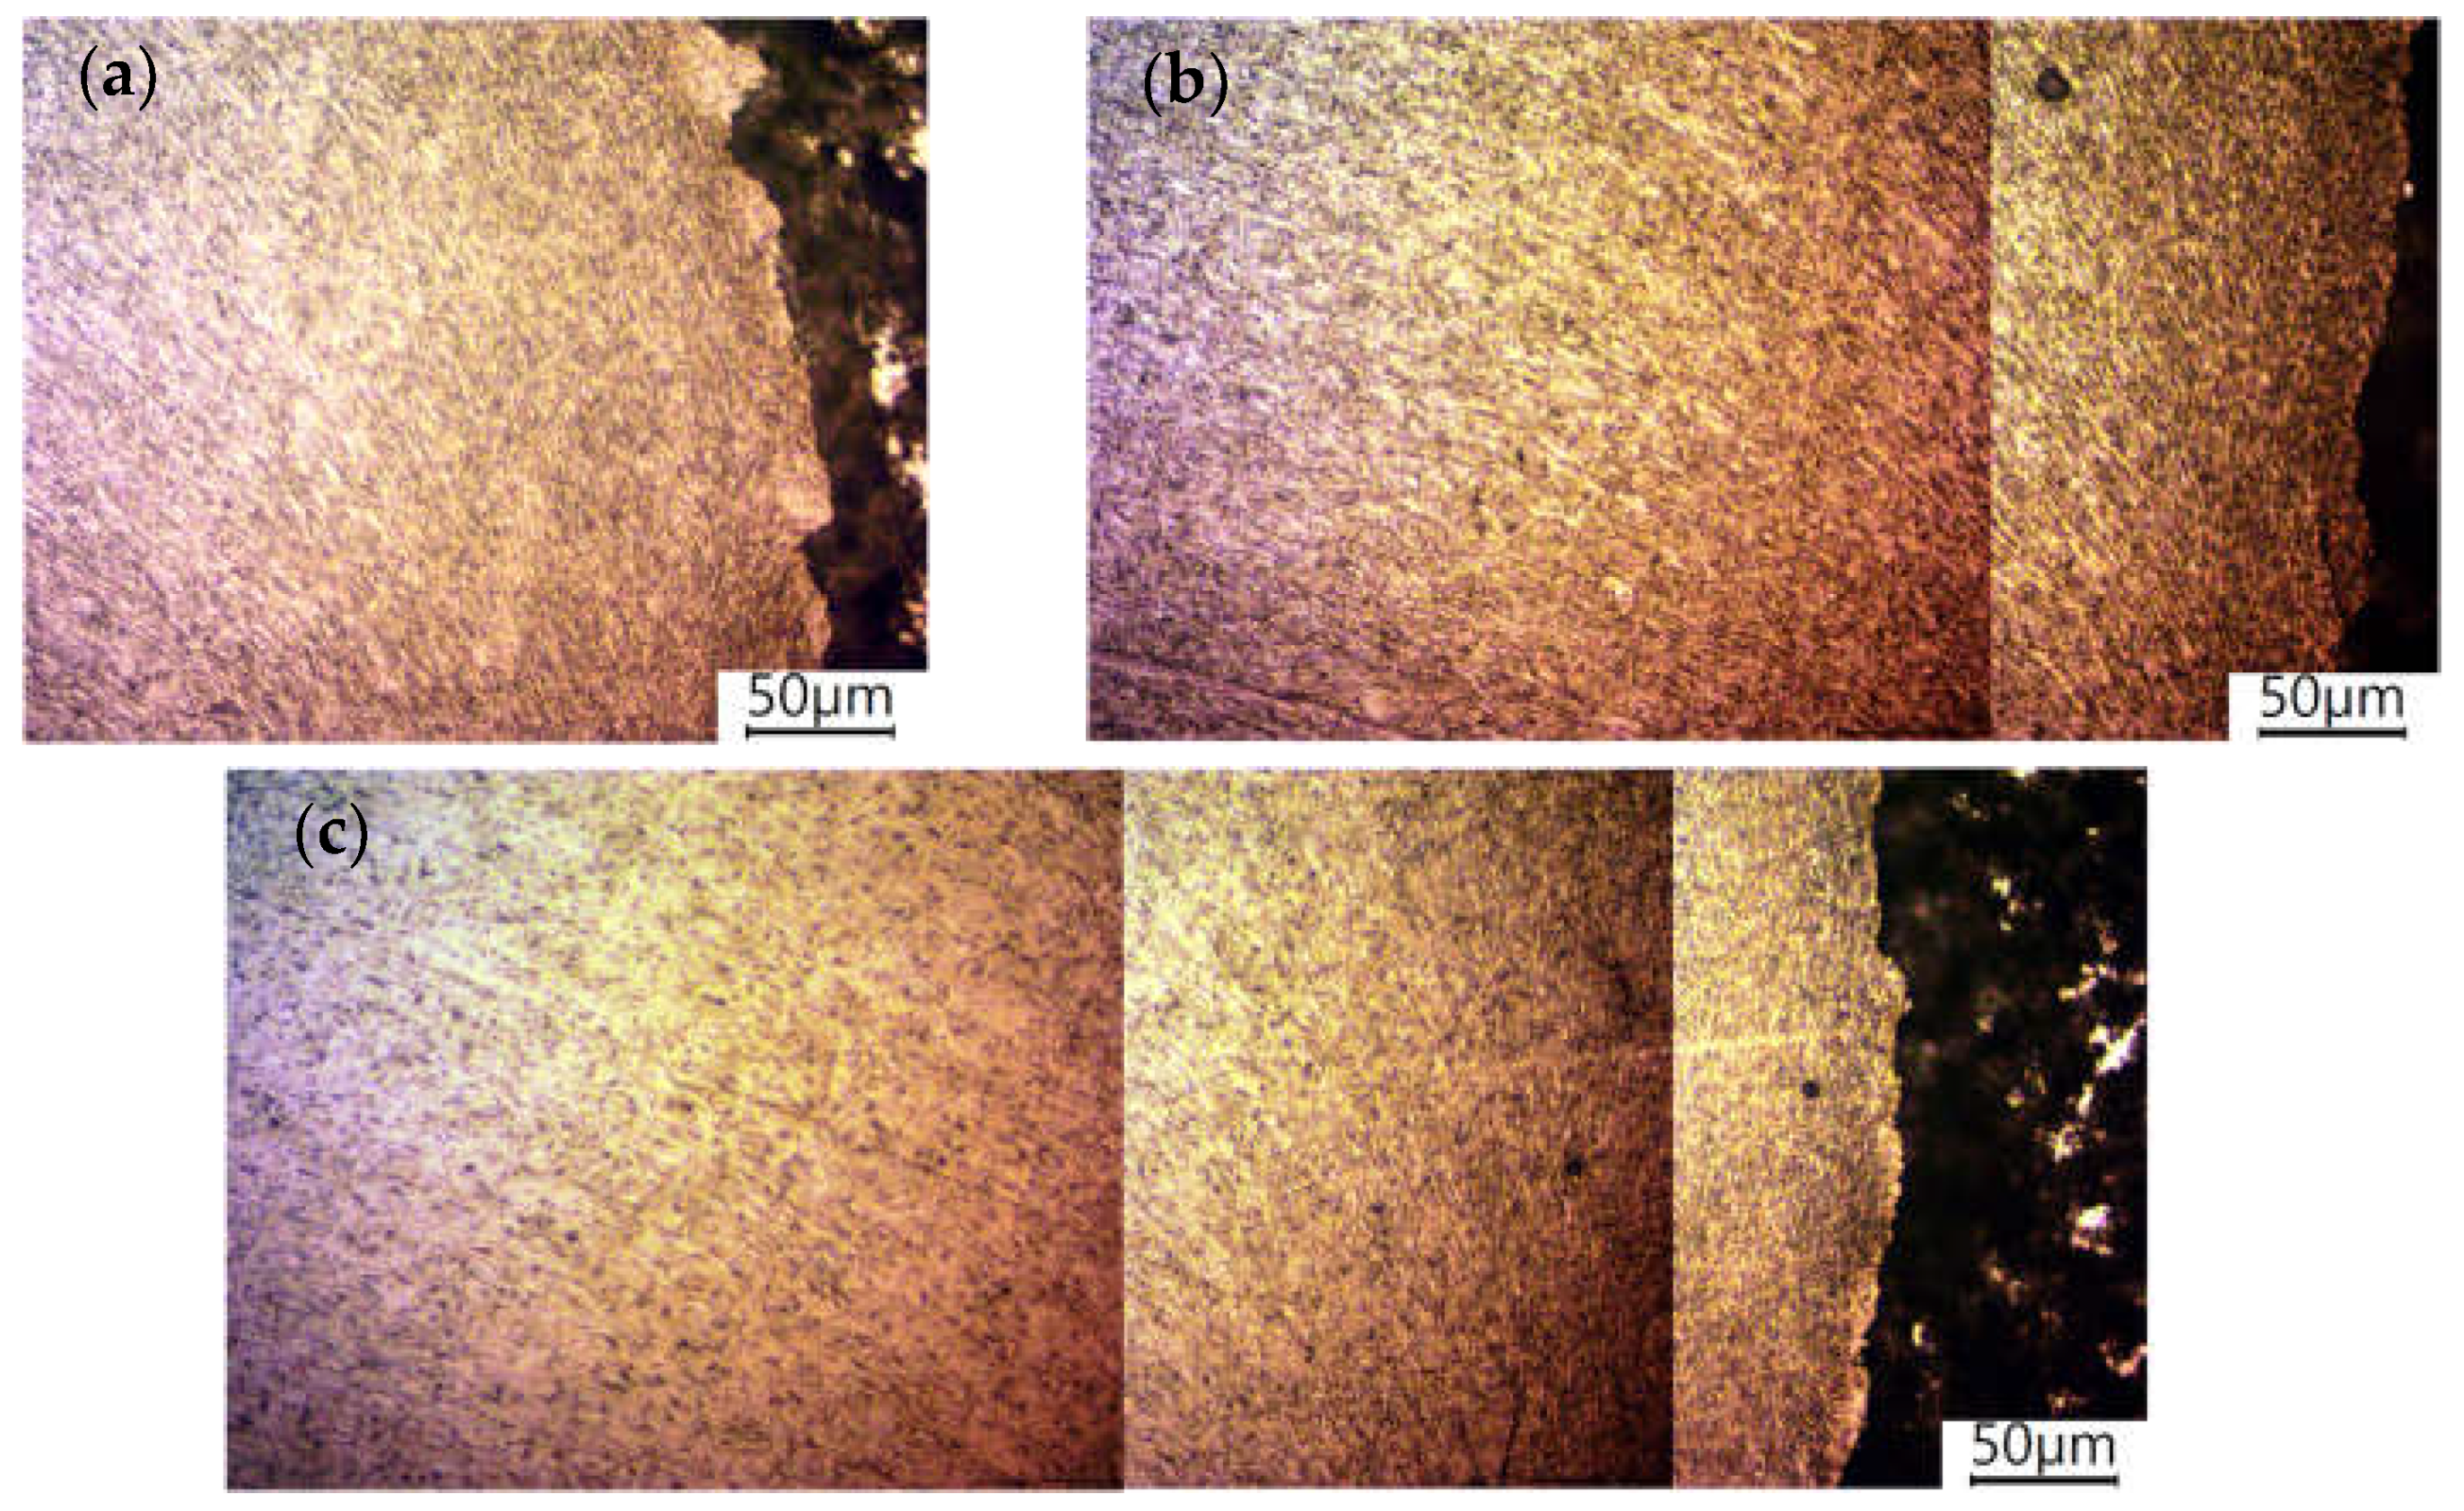
3.1. Microstructure
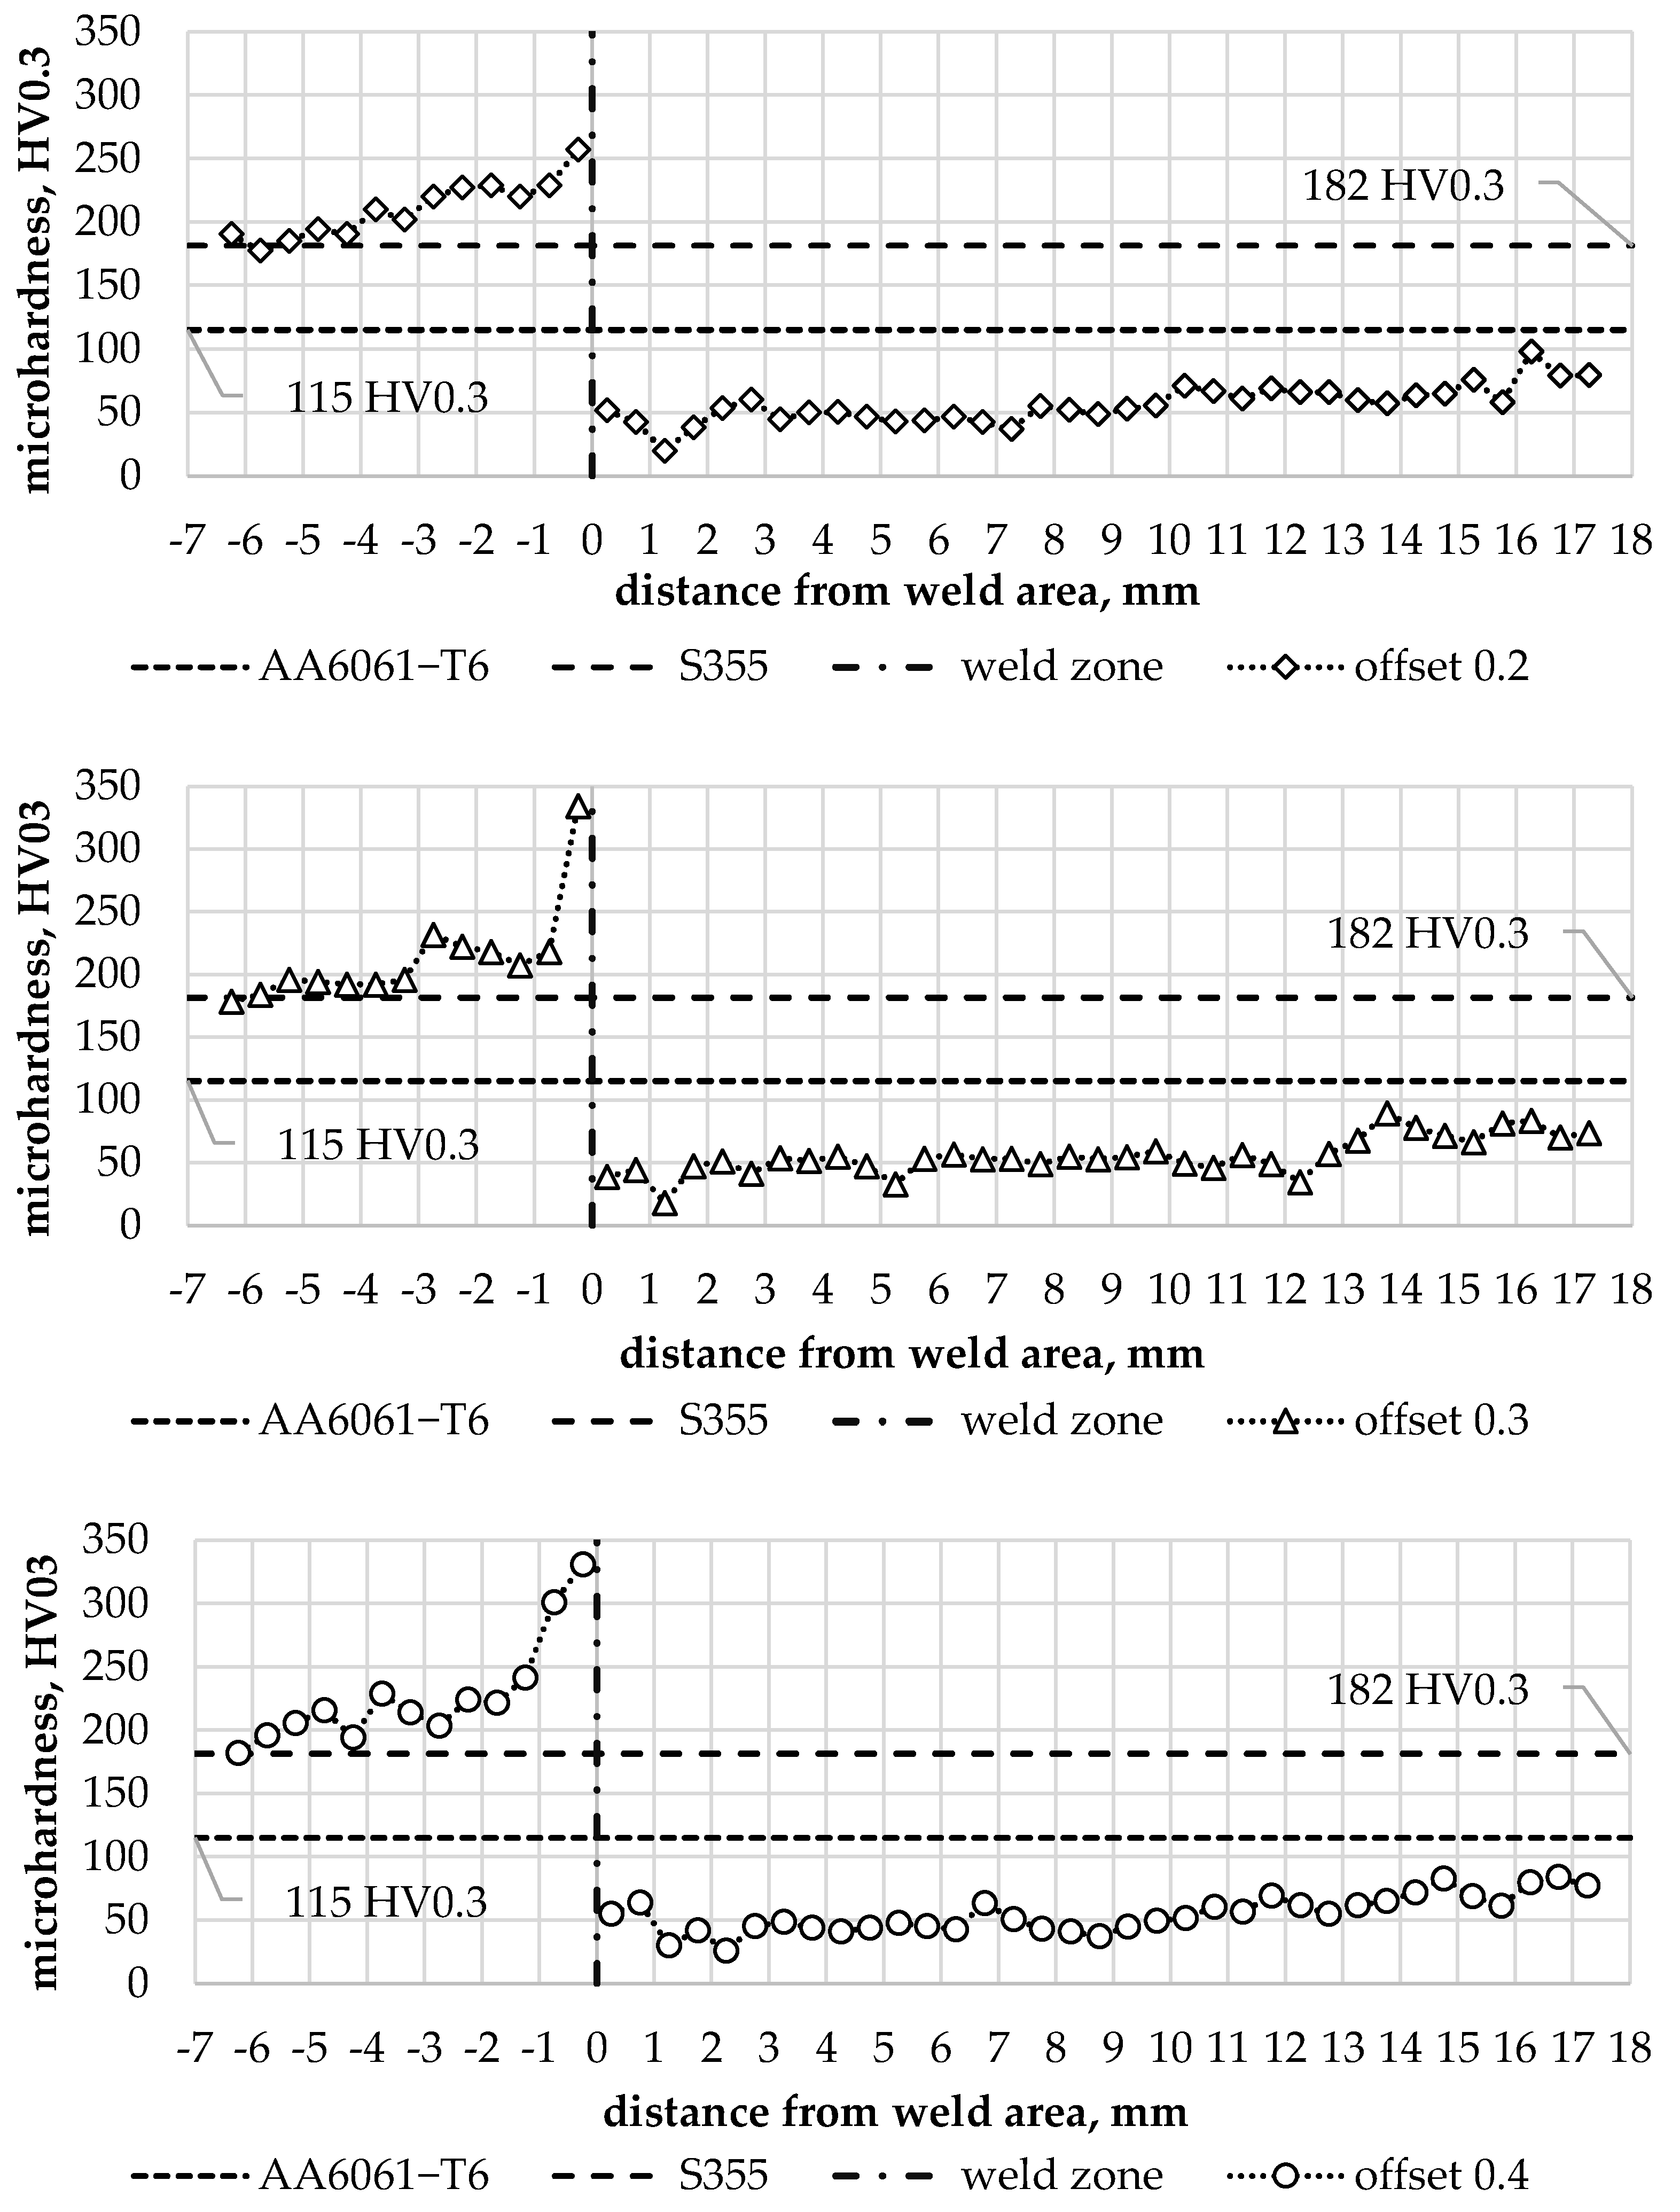
3.2. Microhardness
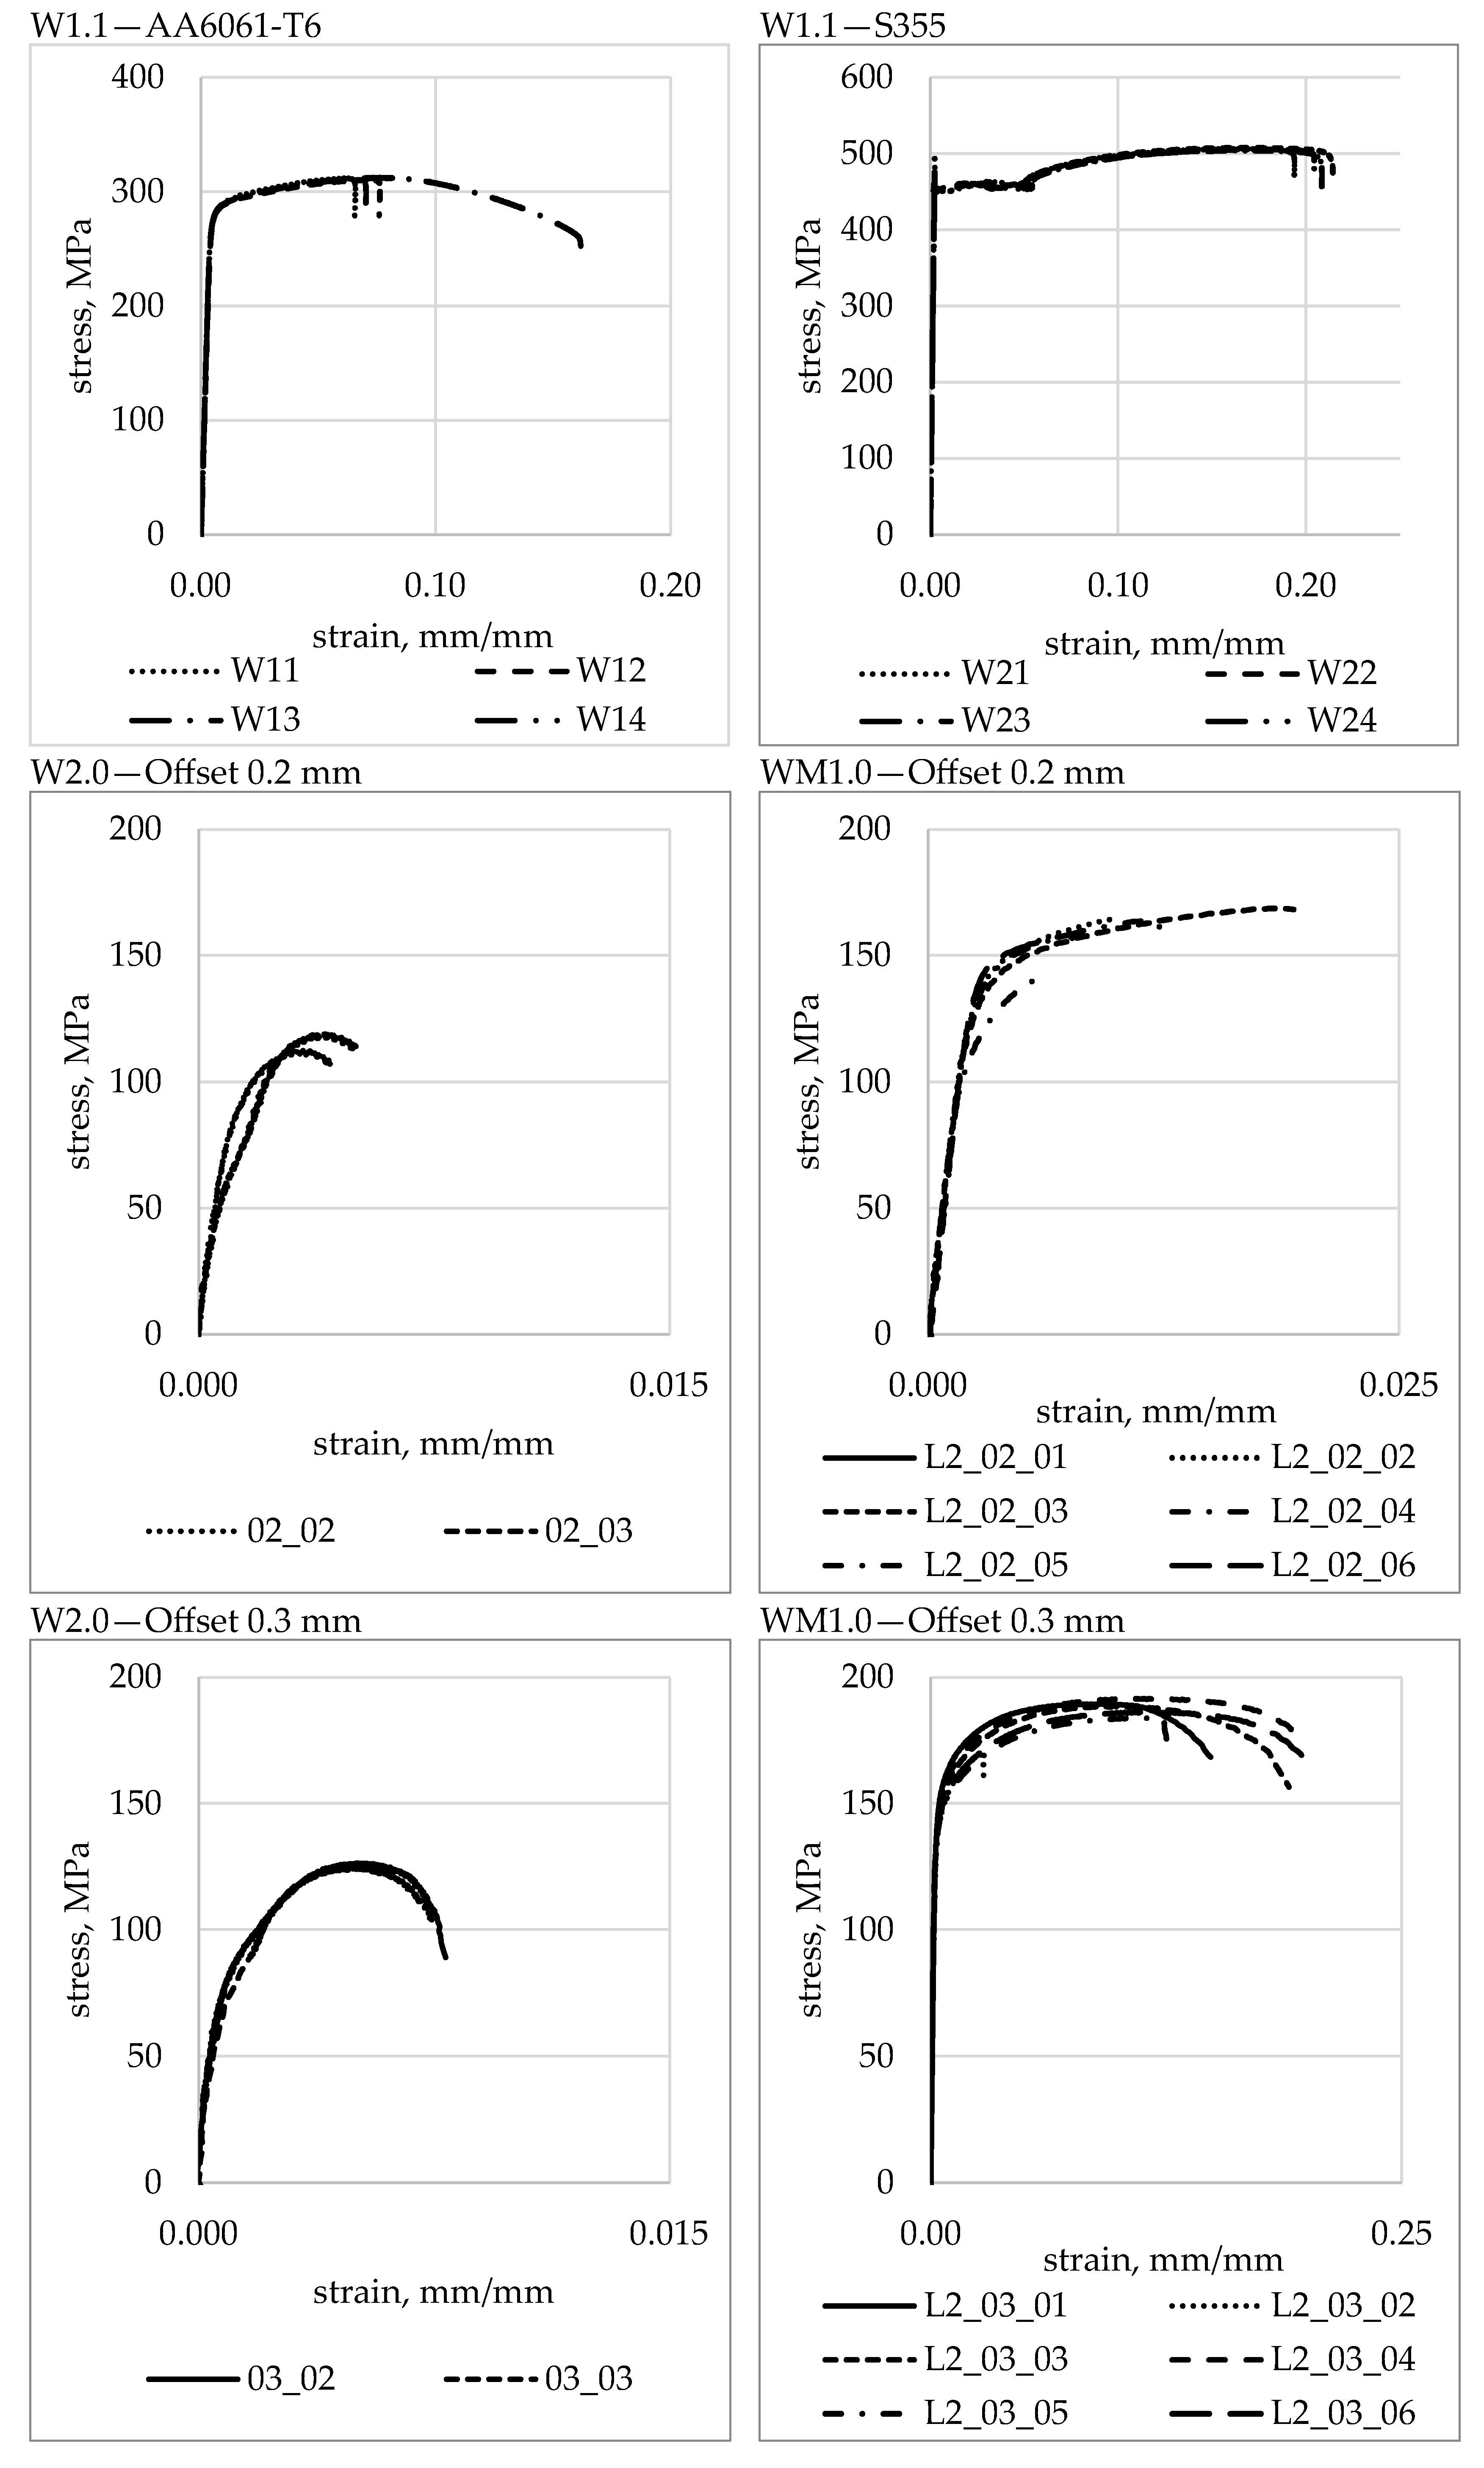
3.3. Tensile Strength
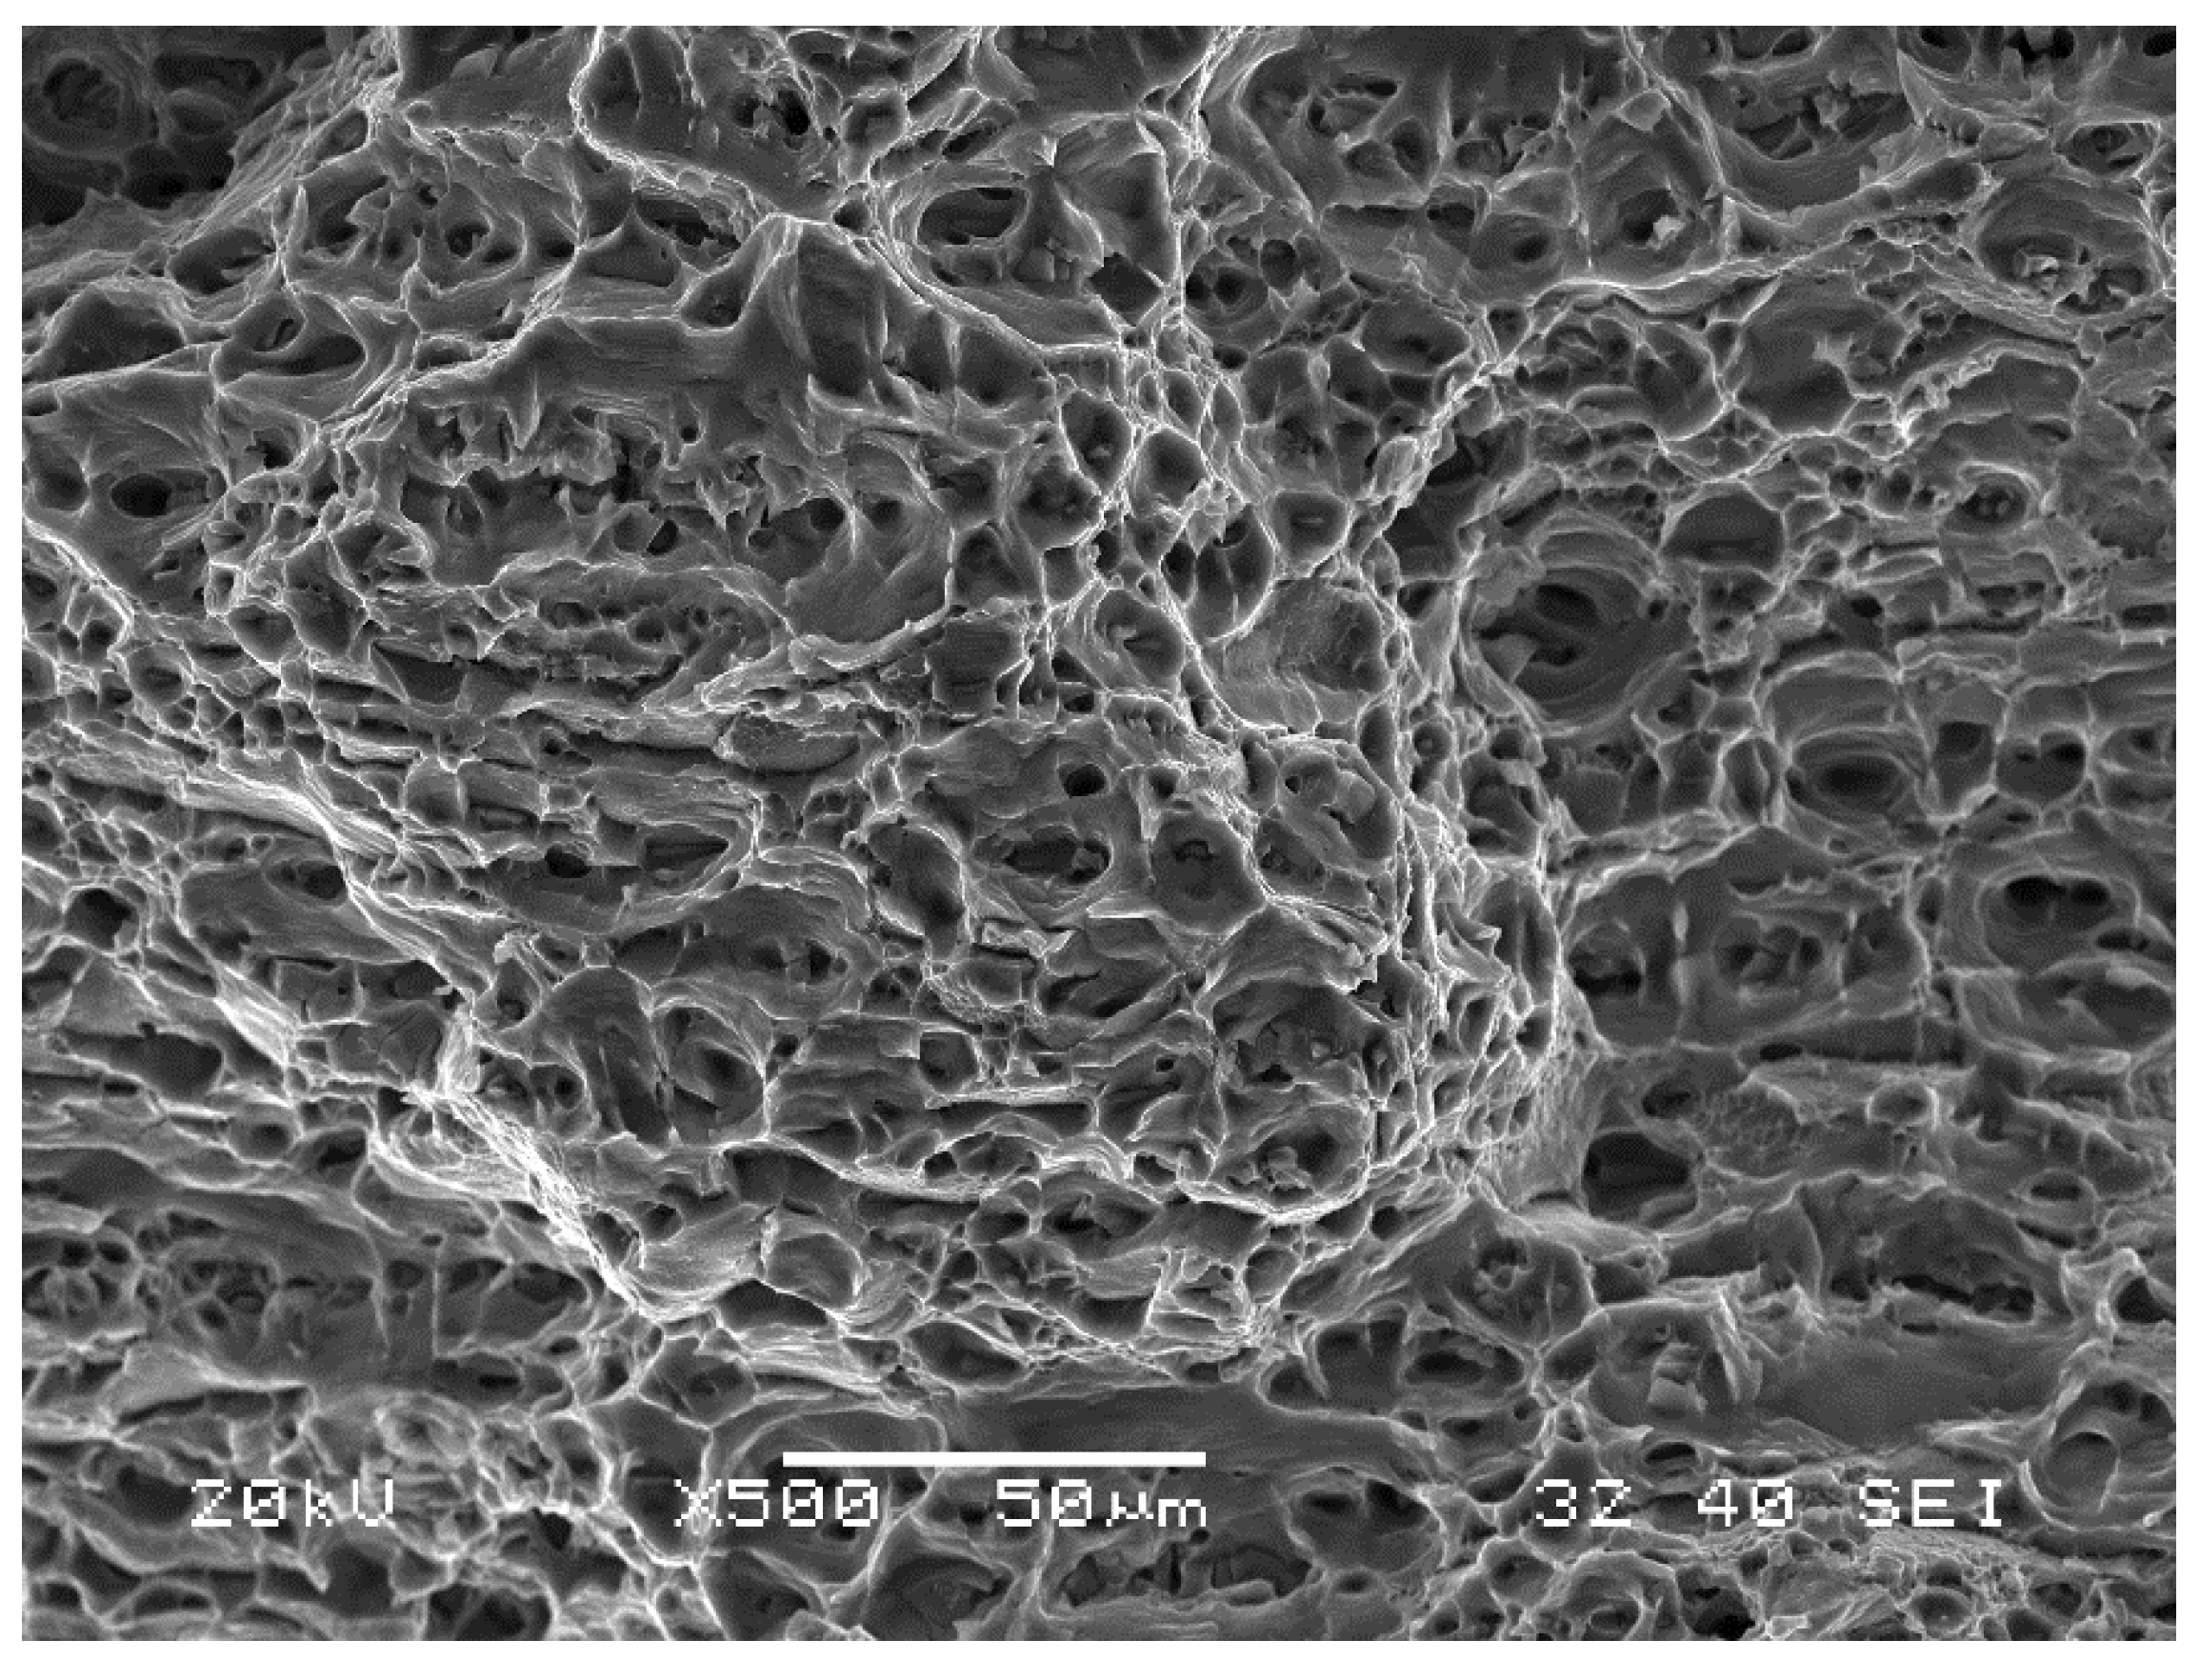
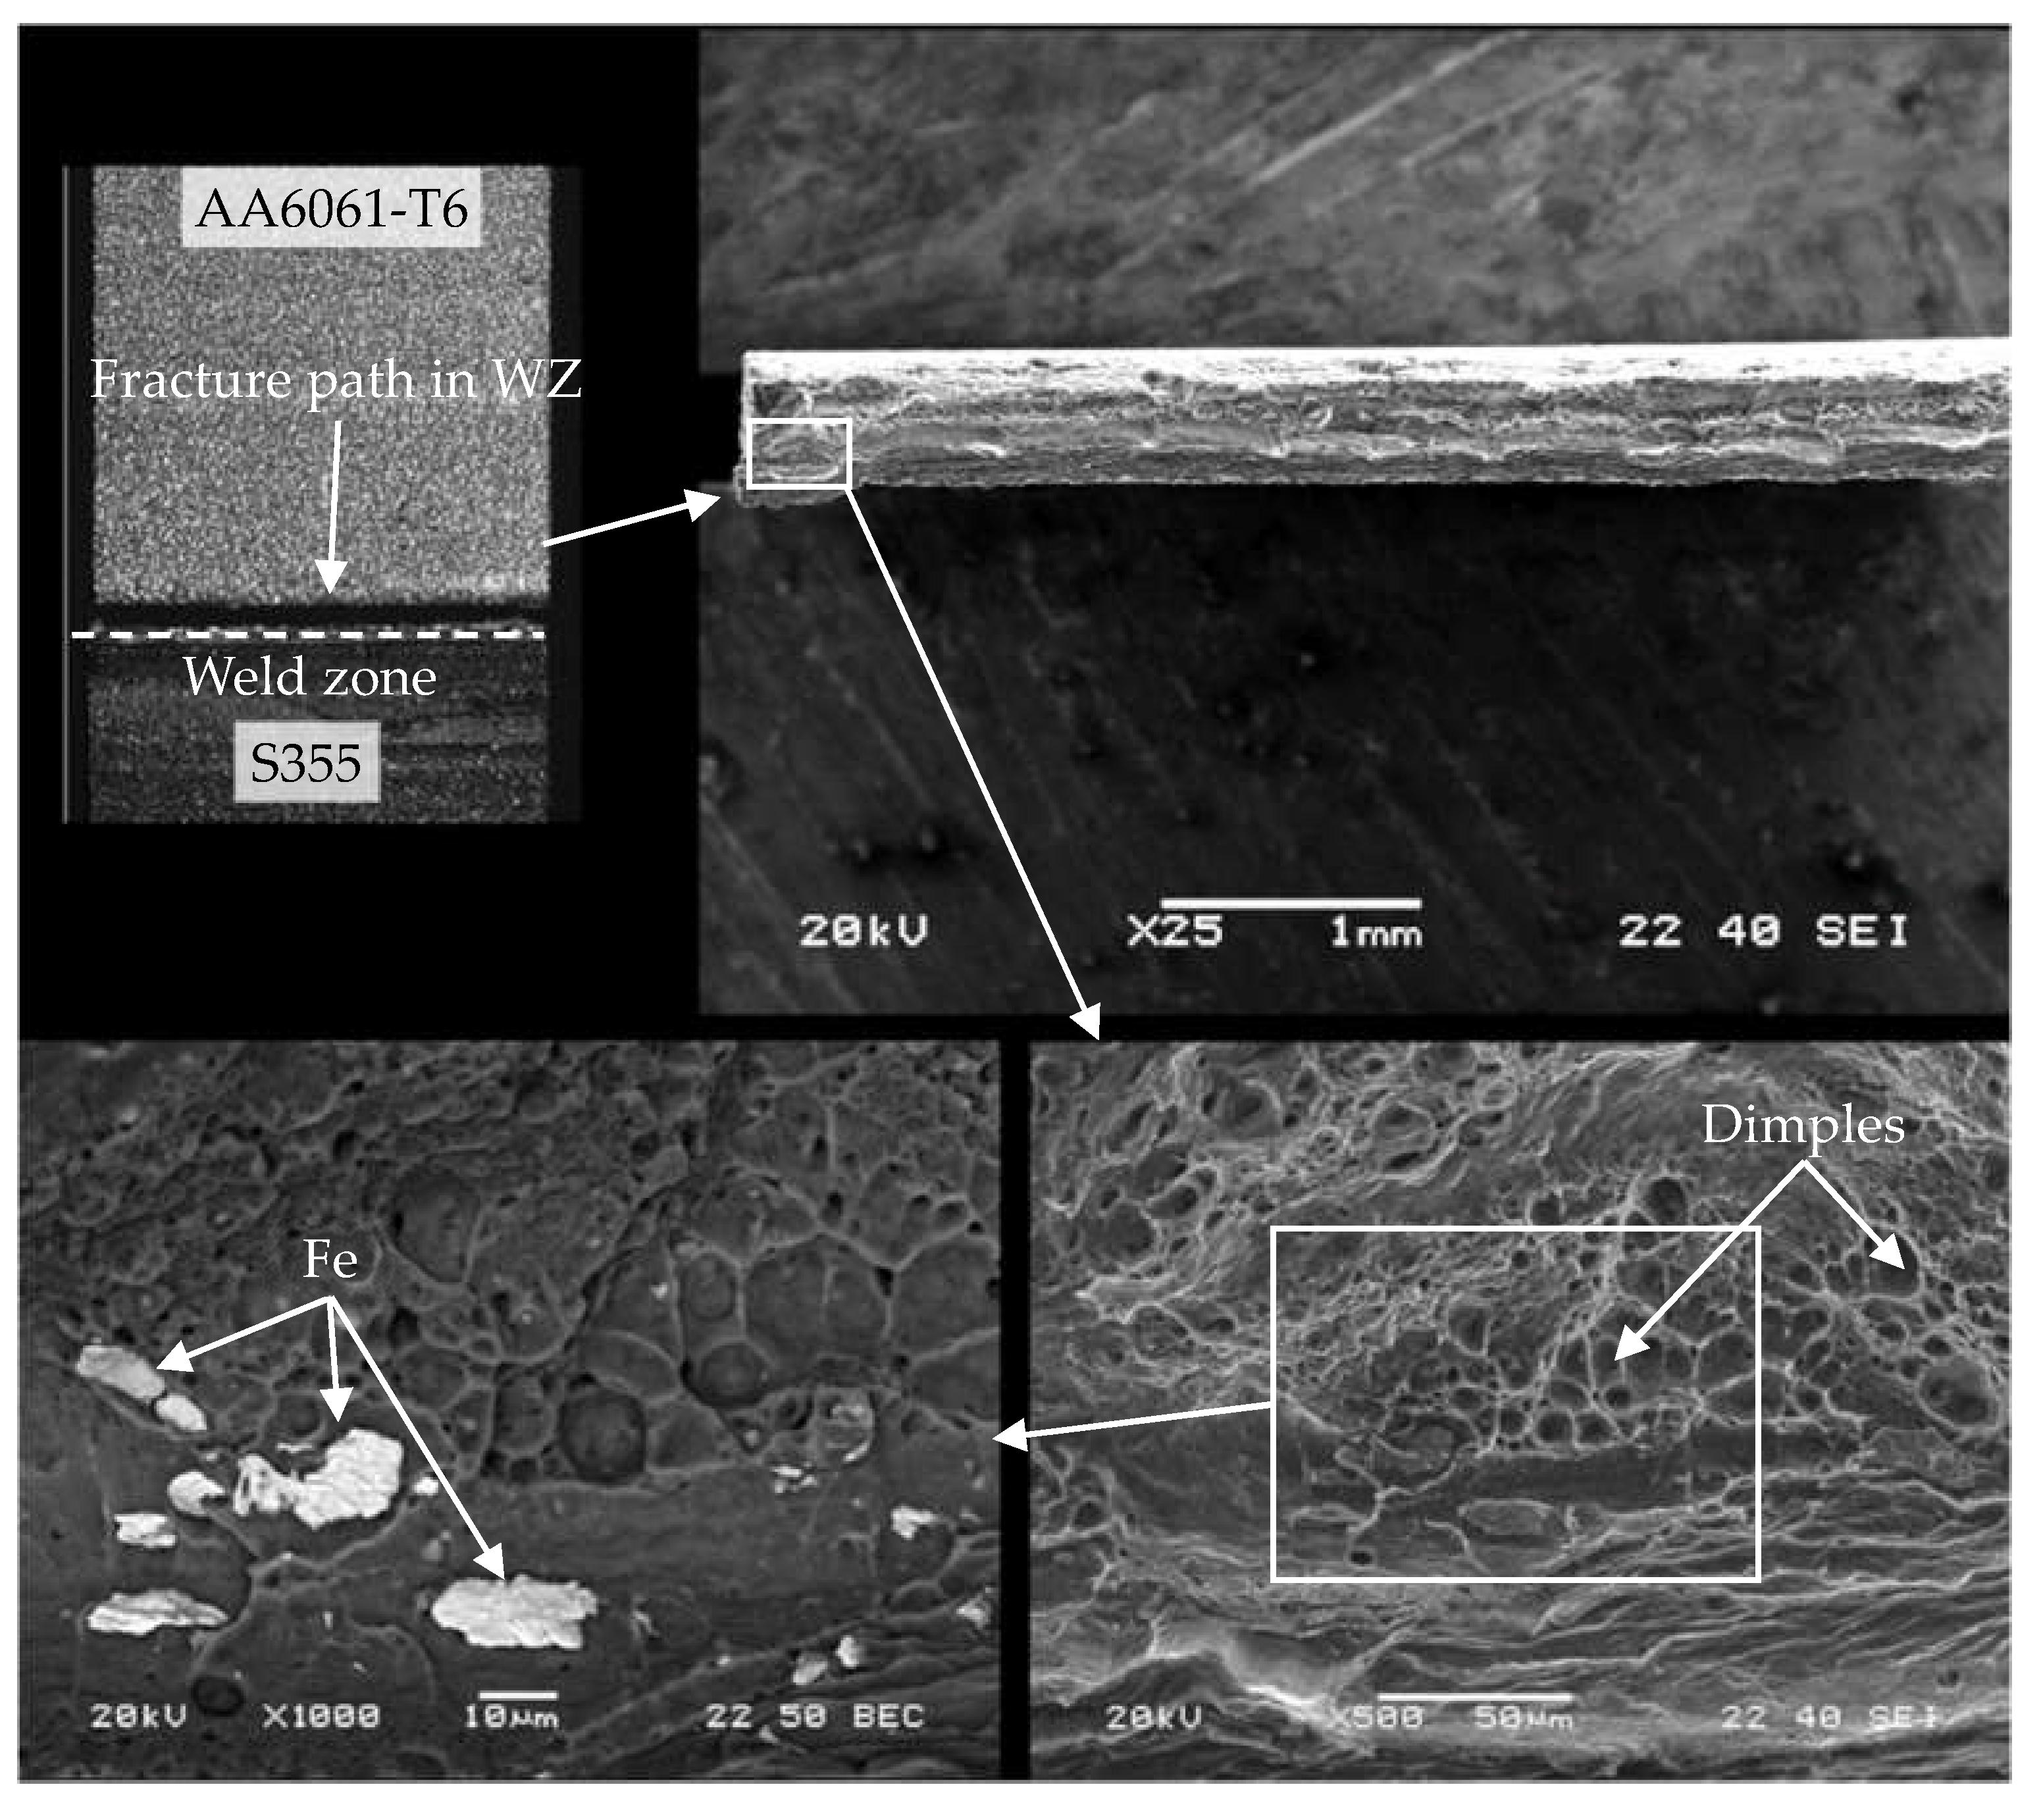
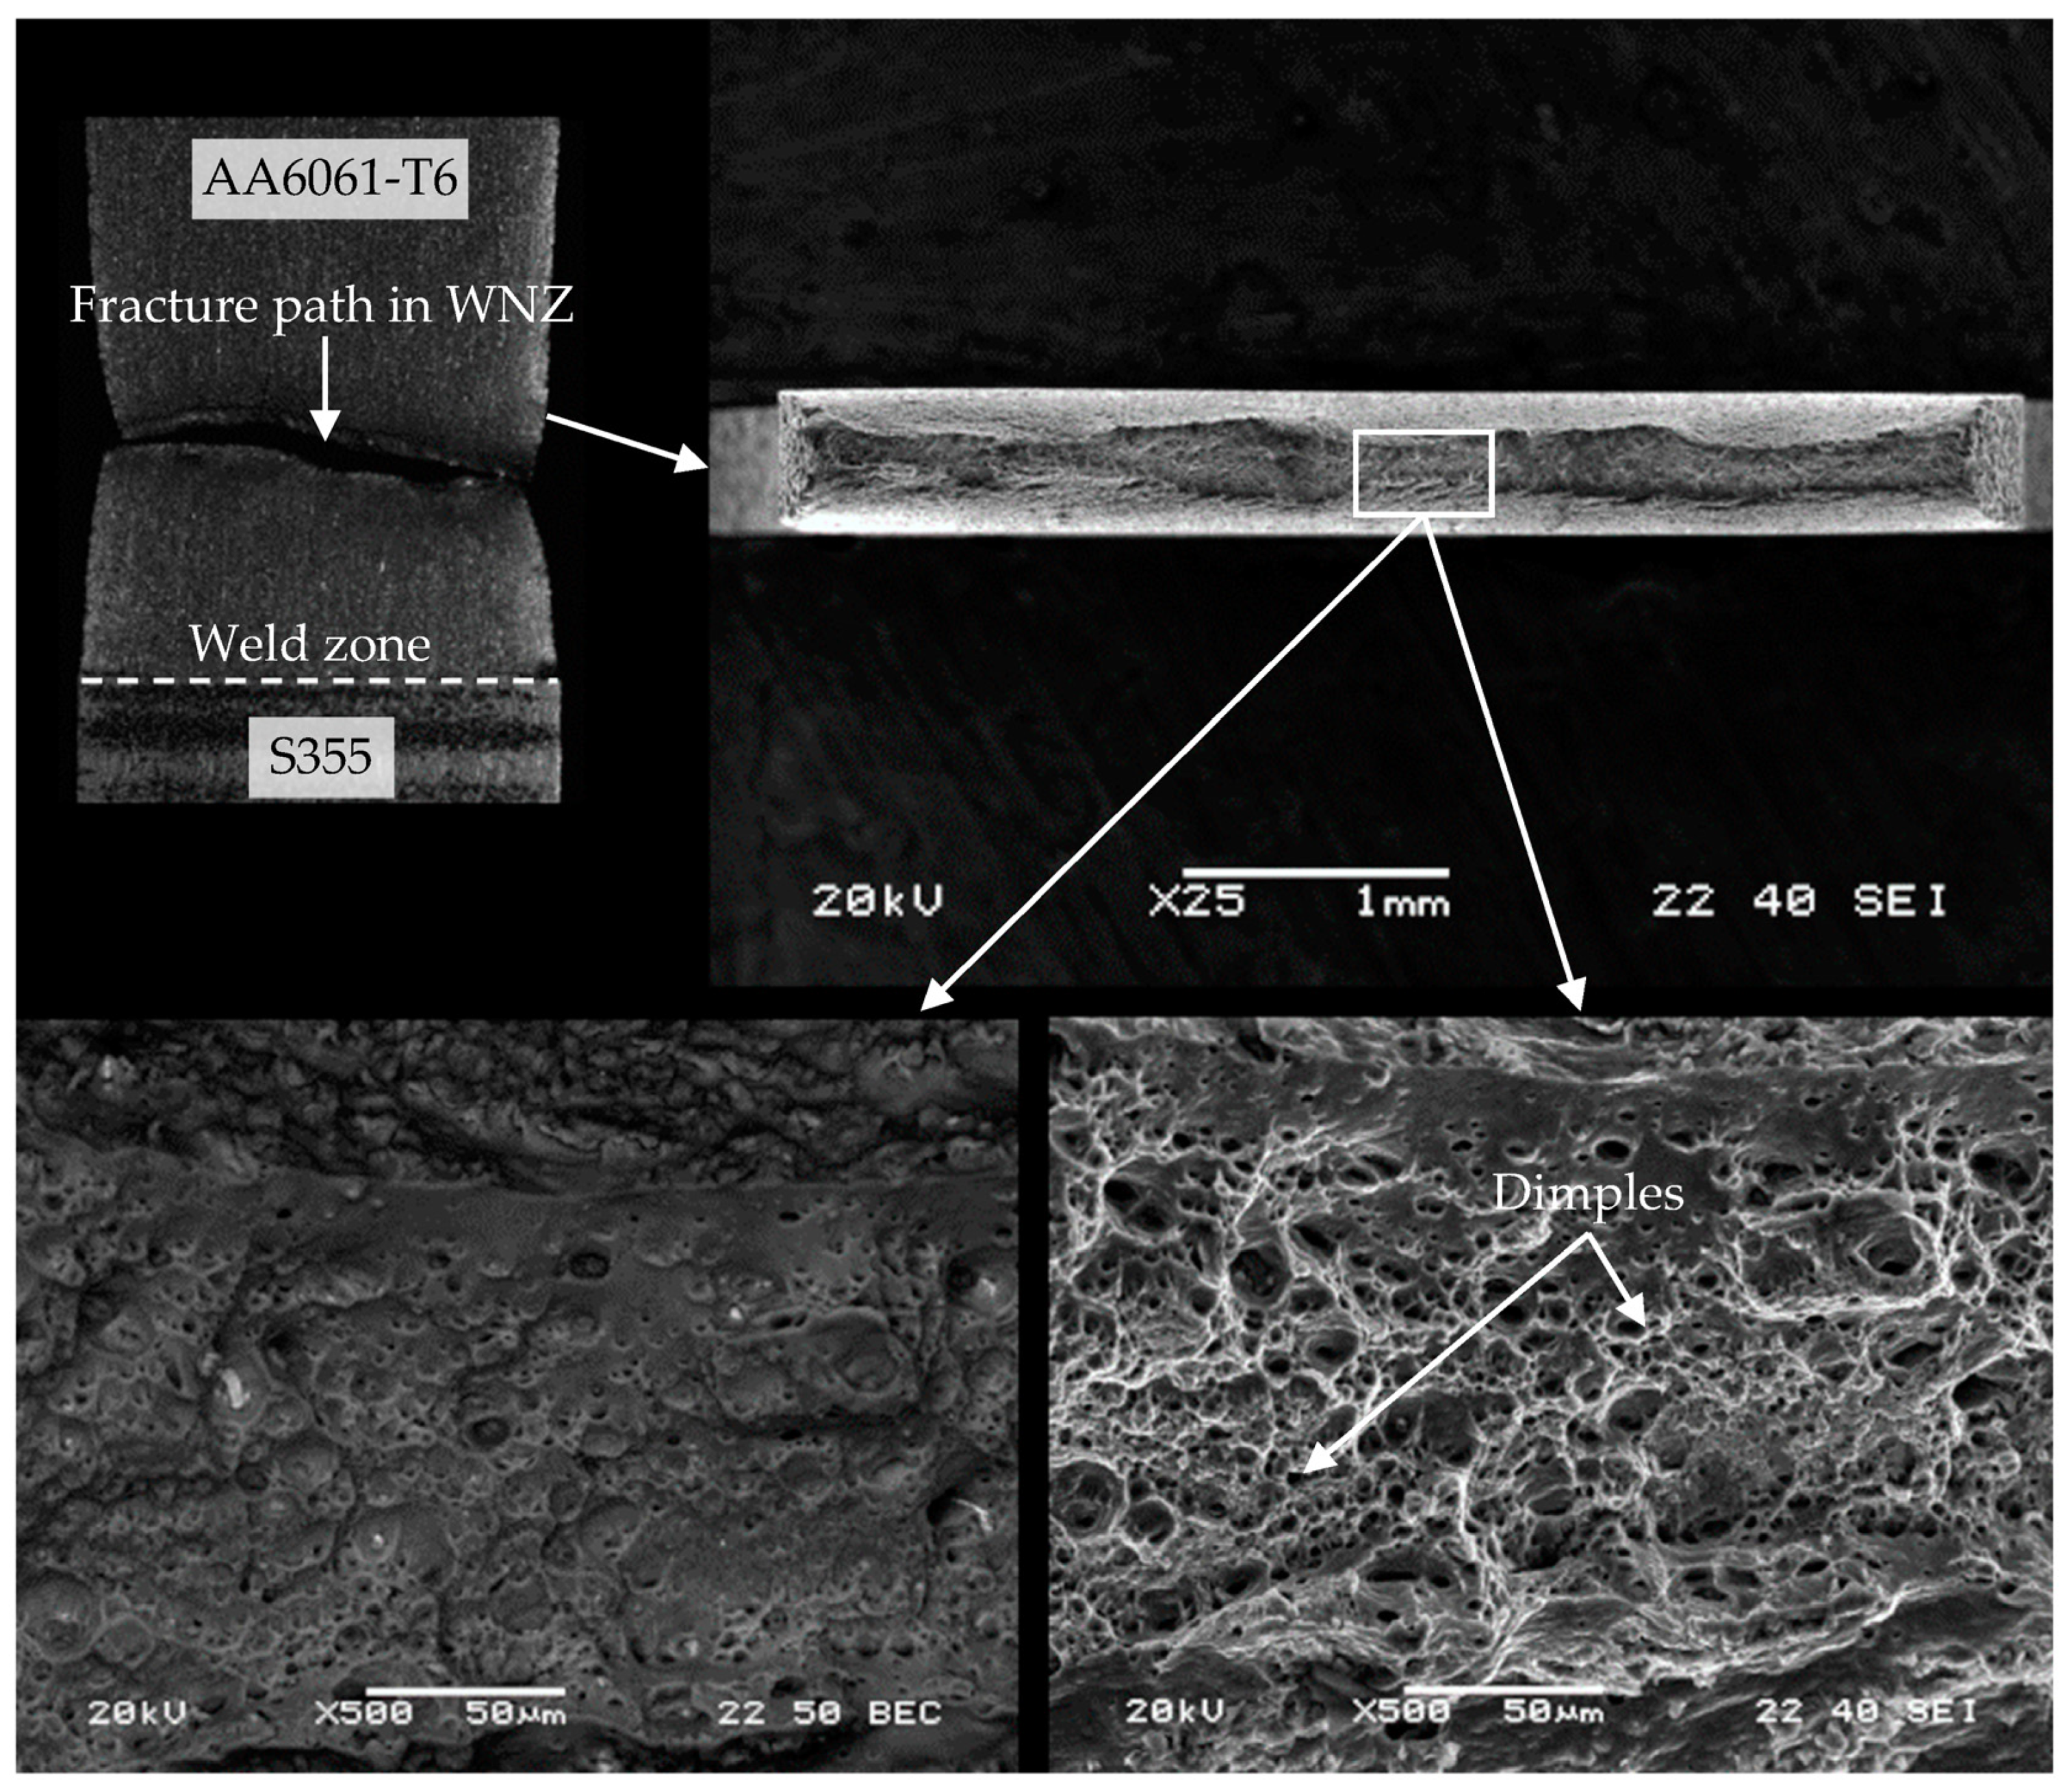
3.4. Fractography
4. Conclusions
- Hardness measurements along the cross section of the joint confirmed the weakening of the aluminium alloy in the weld zone regardless of the offset value used, and showed an increase in the steel hardness near the joint proportional to the value of the offset parameter. The analysis of the mechanical properties using hardness makes it possible to determine approximate values of the ultimate strength of the aluminium alloy in the weld zone with an inaccuracy of about 10%. However, in the case of yield strength, the inaccuracy increases to about 30%.
- The S355/AA6061-T6 joint in the L2 layer (WM1.0 minispecimens), made using offsets of 0.3 mm and 0.4 mm, meets the criteria for weld joints carried out using conventional methods, although the lack of a correct joint in the weld root needs to be resolved for the entire joint to be applicable.
- The entire S355/AA6061-T6 FSW joint (W2.0 macrospecimens) was characterized by the maximum average tensile strength of 141 MPa for an offset value of 0.4 mm, which was 45% of the strength of the AA6061-T6 parent material.
- The S355/AA6061-T6 FSW joint in the L2 layer was characterised by the tensile strength of 185 MPa for an offset value of 0.3 mm and 182 MPa for an offset value of 0.4 mm. The difference between the strength of the entire joint compared to the strength of the joint in the L2 layer is due to the insufficient integrity of the joint in the root zone.
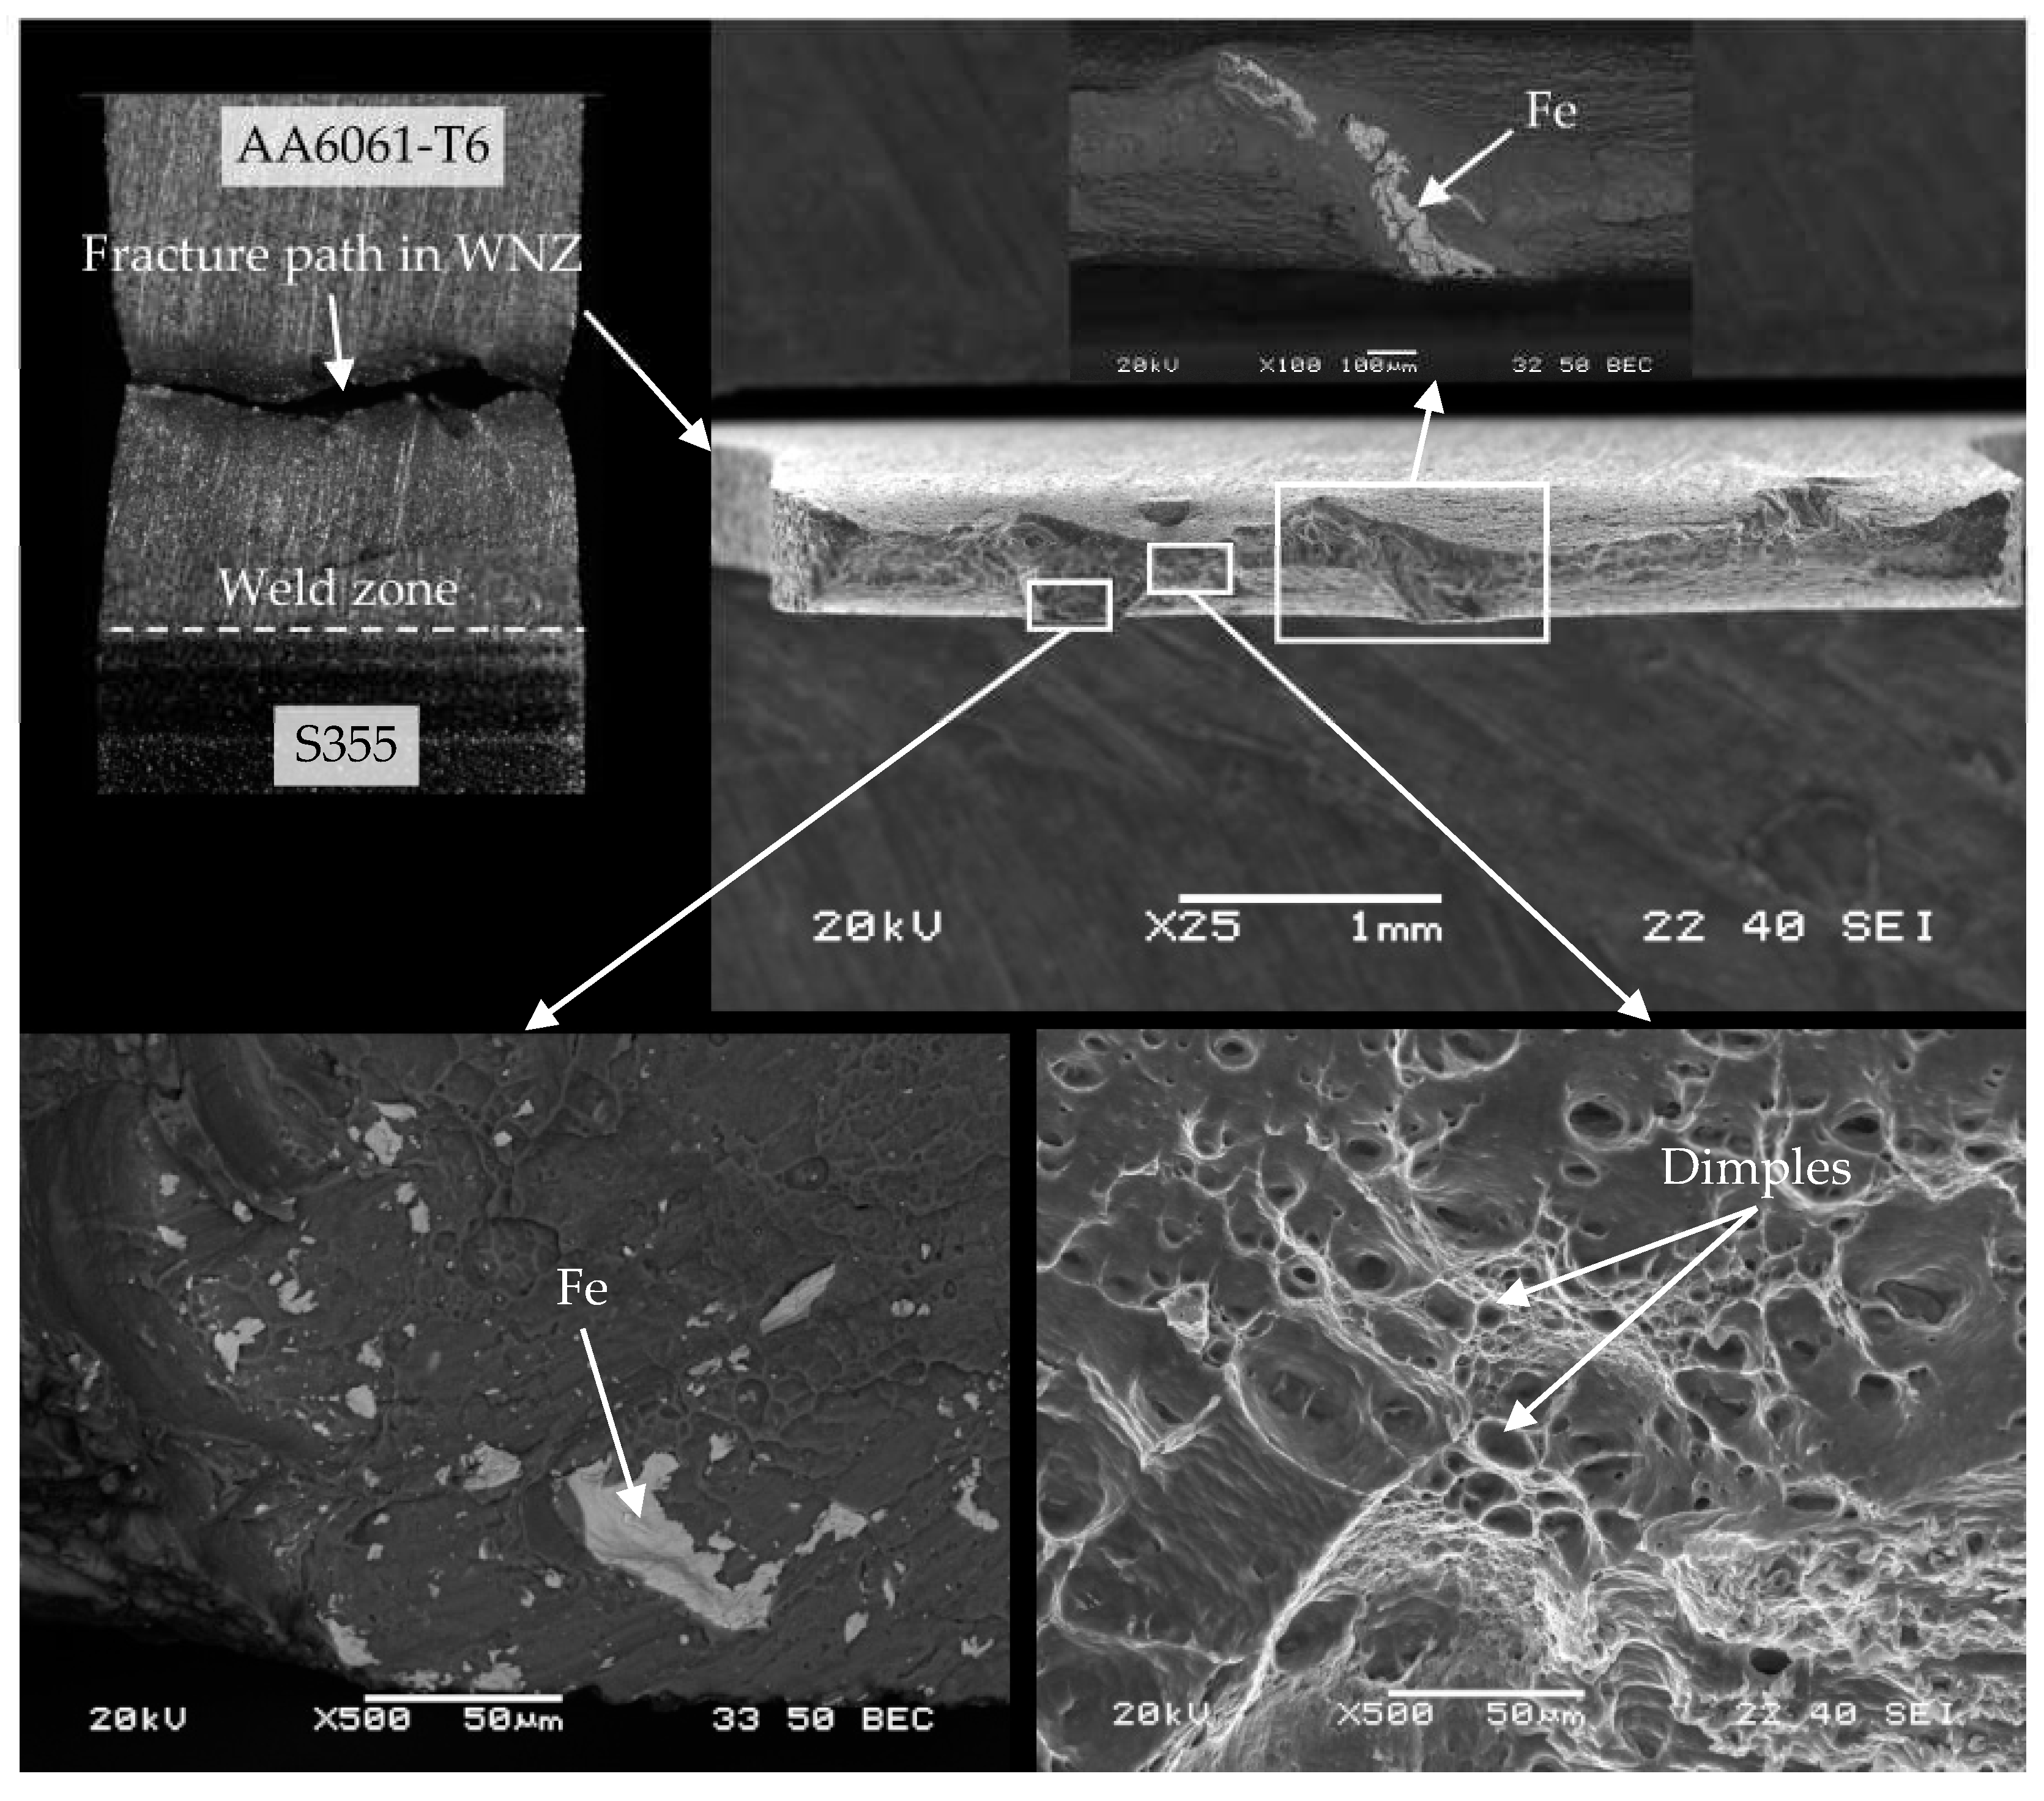
- Fracturing of the specimens of the joint taken from the L2 layer during the monotonic tensile test occurred at the steel-aluminium alloy interface for the 0.2 mm offset and in the WNZ mixing zone for the 0.3 mm and 0.4 mm offsets, where the lowest hardness was recorded.
- Fractures of WM1.0 specimens taken from the L2 layer, for each offset value, were mixed in character with a predominance of dimples of various sizes characteristic of a ductile fracture. More numerous and larger base steel inclusions were observed in the fractures of WM1.0 specimens for the 0.4 mm offset compared to the other offset values.
Author Contributions
Funding
Institutional Review Board Statement
Informed Consent Statement
Data Availability Statement
Conflicts of Interest
References
- Bodunrin, M.O.; Alaneme, K.K.; Chown, L.H. Aluminium Matrix Hybrid Composites: A Review of Reinforcement Philosophies; Mechanical, Corrosion and Tribological Characteristics. J. Mater. Res. Technol. 2015, 4, 434–445. [Google Scholar] [CrossRef]
- Thirumoorthy, A.; Arjunan, T.V.; Senthil Kumar, K.L. Latest Research Development in Aluminum Matrix with Particulate Reinforcement Composites—A Review. Mater. Today Proc. 2018, 5, 1657–1665. [Google Scholar] [CrossRef]
- Padhy, G.K.; Wu, C.S.; Gao, S. Friction Stir Based Welding and Processing Technologies—Processes, Parameters, Microstructures and Applications: A Review. J. Mater. Sci. Technol. 2018, 34, 1–38. [Google Scholar] [CrossRef]
- Padmanaban, G.; Balasubramanian, V. Selection of FSW Tool Pin Profile, Shoulder Diameter and Material for Joining AZ31B Magnesium Alloy—An Experimental Approach. Mater. Des. 2009, 30, 2647–2656. [Google Scholar] [CrossRef]
- Scialpi, A.; De Filippis, L.A.C.; Cavaliere, P. Influence of Shoulder Geometry on Microstructure and Mechanical Properties of Friction Stir Welded 6082 Aluminium Alloy. Mater. Des. 2007, 28, 1124–1129. [Google Scholar] [CrossRef]
- Elangovan, K.; Balasubramanian, V. Influences of Pin Profile and Rotational Speed of the Tool on the Formation of Friction Stir Processing Zone in AA2219 Aluminium Alloy. Mater. Sci. Eng. A 2007, 459, 7–18. [Google Scholar] [CrossRef]
- Boz, M.; Kurt, A. The Influence of Stirrer Geometry on Bonding and Mechanical Properties in Friction Stir Welding Process. Mater. Des. 2004, 25, 343–347. [Google Scholar] [CrossRef]
- Liu, H.J.; Zhou, L.; Liu, Q.W. Microstructural Characteristics and Mechanical Properties of Friction Stir Welded Joints of Ti–6Al–4V Titanium Alloy. Mater. Des. 2010, 31, 1650–1655. [Google Scholar] [CrossRef]
- Das Chowdhury, I.; Sengupta, K.; Singh, D.K.; Kumar Maji, K.; Roy, S.; Ghosal, S.; Mondal, A.K. Investigation of Mechanical Properties of Dissimilar Joint of 6063 Aluminium and C26000 Copper Alloy by Friction Stir Welding. Mater. Today Proc. 2021, 44, 4039–4047. [Google Scholar] [CrossRef]
- Anbukkarasi, R.; Kailas, S.V. Influences of Shape of the New Interfaces and Morphology of the Intermetallics on Mechanical Properties of Aluminum AA2024–Pure Copper Joints by Friction Stir Welding. Int. J. Adv. Manuf. Technol. 2020, 106, 5071–5083. [Google Scholar] [CrossRef]
- Hou, W.; Ahmad Shah, L.H.; Huang, G.; Shen, Y.; Gerlich, A. The Role of Tool Offset on the Microstructure and Mechanical Properties of Al/Cu Friction Stir Welded Joints. J. Alloys Compd. 2020, 825, 154045. [Google Scholar] [CrossRef]
- Saeid, T.; Abdollah-zadeh, A.; Sazgari, B. Weldability and Mechanical Properties of Dissimilar Aluminum–Copper Lap Joints Made by Friction Stir Welding. J. Alloys Compd. 2010, 490, 652–655. [Google Scholar] [CrossRef]
- Abdollah-Zadeh, A.; Saeid, T.; Sazgari, B. Microstructural and Mechanical Properties of Friction Stir Welded Aluminum/Copper Lap Joints. J. Alloys Compd. 2008, 460, 535–538. [Google Scholar] [CrossRef]
- Chen, Y.C.; Nakata, K. Effect of Tool Geometry on Microstructure and Mechanical Properties of Friction Stir Lap Welded Magnesium Alloy and Steel. Mater. Des. 2009, 30, 3913–3919. [Google Scholar] [CrossRef]
- Kumar, U.; Prajapati, A.; Acharya, U.; Medhi, T.; Saha Roy, B.; Saha, S.C. Welding Condition & Microstructure of Friction Stir Welded AA 6061-T6 and AZ31B. Mater. Today Proc. 2021, 46, 9484–9489. [Google Scholar] [CrossRef]
- Pourahmad, P.; Abbasi, M. Materials Flow and Phase Transformation in Friction Stir Welding of Al 6013/Mg. Trans. Nonferrous Met. Soc. China 2013, 23, 1253–1261. [Google Scholar] [CrossRef]
- Chang, W.S.; Rajesh, S.R.; Chun, C.K.; Kim, H.J. Microstructure and Mechanical Properties of Hybrid Laser-Friction Stir Welding between AA6061-T6 Al Alloy and AZ31 Mg Alloy. J. Mater. Sci. Technol. 2011, 27, 199–204. [Google Scholar] [CrossRef]
- Liu, J.; Wu, B.; Wang, Z.; Li, C.; Chen, G.; Miao, Y. Microstructure and Mechanical Properties of Aluminum-Steel Dissimilar Metal Welded Using Arc and Friction Stir Hybrid Welding. Mater. Des. 2023, 225, 111520. [Google Scholar] [CrossRef]
- Ogura, T.; Saito, Y.; Nishida, T.; Nishida, H.; Yoshida, T.; Omichi, N.; Fujimoto, M.; Hirose, A. Partitioning Evaluation of Mechanical Properties and the Interfacial Microstructure in a Friction Stir Welded Aluminum Alloy/Stainless Steel Lap Joint. Scr. Mater. 2012, 66, 531–534. [Google Scholar] [CrossRef]
- Jabraeili, R.; Jafarian, H.R.; Khajeh, R.; Park, N.; Kim, Y.; Heidarzadeh, A.; Eivani, A.R. Effect of FSW Process Parameters on Microstructure and Mechanical Properties of the Dissimilar AA2024 Al Alloy and 304 Stainless Steel Joints. Mater. Sci. Eng. A 2021, 814, 140981. [Google Scholar] [CrossRef]
- Dehghani, M.; Amadeh, A.; Akbari Mousavi, S.A.A. Investigations on the Effects of Friction Stir Welding Parameters on Intermetallic and Defect Formation in Joining Aluminum Alloy to Mild Steel. Mater. Des. 2013, 49, 433–441. [Google Scholar] [CrossRef]
- Watanabe, T.; Takayama, H.; Yanagisawa, A. Joining of Aluminum Alloy to Steel by Friction Stir Welding. J. Mater. Process. Technol. 2006, 178, 342–349. [Google Scholar] [CrossRef]
- Kimapong, K. Friction Stir Welding of Aluminum Alloy to Steel. Weld. J. 2004, 83, 277–282. [Google Scholar]
- Tanaka, T.; Nezu, M.; Uchida, S.; Hirata, T. Mechanism of Intermetallic Compound Formation during the Dissimilar Friction Stir Welding of Aluminum and Steel. J. Mater. Sci. 2020, 55, 3064–3072. [Google Scholar] [CrossRef]
- Mahto, R.P.; Rout, M.; Pal, S.K. Mechanism of Microstructure Evolution and Grain Growth in Friction Stir Welding of AA6061-T6 and AISI304 in Air and Water Media. Mater. Chem. Phys. 2021, 273, 125081. [Google Scholar] [CrossRef]
- Singh, V.P.; Patel, S.K.; Ranjan, A.; Kuriachen, B. Recent Research Progress in Solid State Friction-Stir Welding of Aluminium–Magnesium Alloys: A Critical Review. J. Mater. Res. Technol. 2020, 9, 6217–6256. [Google Scholar] [CrossRef]
- Chandran, R.; Ramaiyan, S.; Shanbhag, A.G.; Santhanam, S.K.V.; Chandran, R.; Ramaiyan, S.; Shanbhag, A.G.; Santhanam, S.K.V. Optimization of Welding Parameters for Friction Stir Lap Welding of AA6061-T6 Alloy. Mod. Mech. Eng. 2018, 8, 31–41. [Google Scholar] [CrossRef]
- Venkateswaran, P.; Reynolds, A.P. Factors Affecting the Properties of Friction Stir Welds between Aluminum and Magnesium Alloys. Mater. Sci. Eng. A 2012, 545, 26–37. [Google Scholar] [CrossRef]
- Singh, K.; Singh, G.; Singh, H. Review on Friction Stir Welding of Magnesium Alloys. J. Magnes. Alloys 2018, 6, 399–416. [Google Scholar] [CrossRef]
- Gharavi, F.; Matori, K.A.; Yunus, R.; Othman, N.K.; Fadaeifard, F. Corrosion Behavior of Al6061 Alloy Weldment Produced by Friction Stir Welding Process. J. Mater. Res. Technol. 2015, 4, 314–322. [Google Scholar] [CrossRef]
- EN ISO 6507-1; Metallic Materials—Vickers Hardness Test—Part 1: Test Method. Brussels, Belgium, 2005. Available online: https://www.iso.org/standard/64065.html (accessed on 27 August 2023).
- EN ISO 6892-1; Metallic Materials—Tensile Testing—Part 1: Method of Test at Room Temperature. Brussels, Belgium, 2019. Available online: https://www.iso.org/obp/ui/#iso:std:iso:6892:-1:ed-1:v1:en (accessed on 27 August 2023).
- EN ISO 4136; Destructive Tests on Welds in Metallic Materials – Transverse Tensile Test. Brussels, Belgium, 2011. Available online: https://www.iso.org/obp/ui/en/#iso:std:iso:4136:ed-4:v1:en (accessed on 27 August 2023).
- Boronski, D. Testing Low-Cycle Material Properties with Micro-Specimens. Mater. Mater. Test. 2015, 57, 165–170. [Google Scholar] [CrossRef]
- Boroński, D. Local Mechanical Properties of Explosively Welded AA2519-AA1050-Ti6Al4V Layered Material. Weld. World 2020, 64, 2083–2099. [Google Scholar] [CrossRef]
- Boroński, D.; Sołtysiak, R.; Giesko, T.; Marciniak, T.; Lutowski, Z.; Bujnowski, S. The Investigations of Fatigue Cracking of Laser Welded Joint with the Use of ‘FatigueVIEW’ System. Key Eng. Mater. 2014, 598, 26–31. [Google Scholar] [CrossRef]
- Sun, Y.; Tsuji, N.; Fujii, H. Microstructure and Mechanical Properties of Dissimilar Friction Stir Welding between Ultrafine Grained 1050 and 6061-T6 Aluminum Alloys. Metals 2016, 6, 249. [Google Scholar] [CrossRef]
- Krishnan, M.; Subramaniam, S.K. Investigation of Mechanical and Metallurgical Properties of Friction Stir Corner Welded Dissimilar Thickness AA5086-AA6061 Aluminium Alloys. Mater. Res. 2018, 21, e20171045. [Google Scholar] [CrossRef]
- Milagre, M.X.; Franco, M.; Genezini, F.; Wimpory, R.C.; Yokaichiya, F.; Costa, I. A Correlation between Microstructure and Residual Stress in the 6061 Al–Mg–Si Alloy with Different Thermomechanical Process. SN Appl. Sci. 2020, 2, 2106. [Google Scholar] [CrossRef]
- Ansto, P.A.S.; Hellier, A.K.; Harrison, R.P.; Ansto, I.R.; Norrish, J. Hardness-Tensile Property Relationships for HAZ in 6061-T651 Aluminum. Weld. J. 2014, 93, 301–311. [Google Scholar]
- Khodabakhshi, F.; Haghshenas, M.; Eskandari, H.; Koohbor, B. Hardness−strength Relationships in Fine and Ultra-Fine Grained Metals Processed through Constrained Groove Pressing. Mater. Sci. Eng. A 2015, 636, 331–339. [Google Scholar] [CrossRef]
- IACS. Guidelines on Welding Procedure Qualification Tests of Aluminium Alloys for Hull Construction and Marine Structures; IACS: London, UK, 2006. [Google Scholar]
- Lloyd’s Register Group Limited. Rules for the Manufacture, Testing and Certification of Materials; Lloyd’s Register Group Limited: London, UK, 2020. [Google Scholar]


| Al | Si | Fe | Cu | Mn | Mg | Cr | Zn | Ti |
|---|---|---|---|---|---|---|---|---|
| 97.51 | 0.62 | 0.4 | 0.18 | 0.1 | 1 | 0.07 | 0.05 | 0.07 |
| Fe | C | Mn | Si | P | S | Cu |
|---|---|---|---|---|---|---|
| 97.05 | 0.2 | 1.6 | 0.55 | 0.025 | 0.025 | 0.55 |
| Process Parameters | |||
|---|---|---|---|
| Name | Plate 0.2 | Plate 0.3 | Plate 0.4 |
| Offset | 0.2 mm | 0.3 mm | 0.4 mm |
| Rotational speed | 250 RPM | ||
| Welding velocity | 2.5 cm/min | ||
| Detention time | 0.5 s | ||
| Pin height | 2.8 mm | ||
| Pin diameter | 5 mm | ||
| Tool inclination | 2° | ||
| Tool penetration depth | 2.9 mm | ||
| Type | Base Materials | FSW Joint W2.0 | |||
|---|---|---|---|---|---|
| AA6061-T6 | S355 | Offset 0.2 | Offset 0.3 | Offset 0.4 | |
| su, MPa | 312 ± 0.8 | 506 ± 1.4 | 116 ± 3.6 | 125 ± 5.5 | 141 ± 4.6 |
| Type | Base Materials | FSW Joint WM1.0 | |||
|---|---|---|---|---|---|
| AA6061-T6 | S355 | Offset 0.2 | Offset 0.3 | Offset 0.4 | |
| su, MPa | 312 + 0.8 | 506 + 1.4 | 159 + 10 | 185 + 8 | 182 + 9.3 |
| sy, MPa | 279 + 1 | 479 + 16.7 | 145 + 7.6 | 145 + 3.9 | 142 + 12.8 |
| E, MPa | 72,762 + 1254 | 224,083 + 5356 | - | - | - |
| E *, MPa | - | - | 64,990 + 850 | 66,734 + 3816 | 67,012 + 3607 |
| Model | BM | Experimental | BM | ||||
|---|---|---|---|---|---|---|---|
| HV | σu MPa | σy MPa | σu MPa | σy MPa | Δσu % | Δσy % | |
| Model 1 | 115 | 323 | 292 | 312 | 279 | 3.5 | 4.7 |
| Model 2 | 323 | 292 | 3.5 | 4.7 | |||
| Model 3 | 346 | 286 | 10.9 | 2.5 | |||
| Model | WNZ | Experimental | WNZ | ||||
|---|---|---|---|---|---|---|---|
| HV | σu MPa | σy MPa | σu MPa | σy MPa | Δσu % | Δσy % | |
| Model 1 | 50 | 167 | 102 | 182 | 142 | −8.2 | −28.2 |
| Model 2 | 167 | 108 | −8.2 | −23.9 | |||
| Model 3 | 151 | 125 | −17.0 | −12.0 | |||
| Type | 0.2 | 0.3 | 0.4 |
|---|---|---|---|
| Rm, MPa | 150.2 < d < 166.9 | 178.2 < d < 191.5 | 174.7 < d < 190 |
| RP0.2, MPa | 139.1 < d < 151.5 | 141.8 < d < 148.1 | 131.8 < d < 152.8 |
Disclaimer/Publisher’s Note: The statements, opinions and data contained in all publications are solely those of the individual author(s) and contributor(s) and not of MDPI and/or the editor(s). MDPI and/or the editor(s) disclaim responsibility for any injury to people or property resulting from any ideas, methods, instructions or products referred to in the content. |
© 2023 by the authors. Licensee MDPI, Basel, Switzerland. This article is an open access article distributed under the terms and conditions of the Creative Commons Attribution (CC BY) license (https://creativecommons.org/licenses/by/4.0/).
Share and Cite
Ziółkowski, W.; Boroński, D.; Skibicki, A.; Stachowiak, R.; Kosturek, R.; Śnieżek, L. Mechanical Properties and Microstructure of Dissimilar S355/AA6061-T6 FSW Butt Joints. Materials 2023, 16, 5950. https://doi.org/10.3390/ma16175950
Ziółkowski W, Boroński D, Skibicki A, Stachowiak R, Kosturek R, Śnieżek L. Mechanical Properties and Microstructure of Dissimilar S355/AA6061-T6 FSW Butt Joints. Materials. 2023; 16(17):5950. https://doi.org/10.3390/ma16175950
Chicago/Turabian StyleZiółkowski, Wojciech, Dariusz Boroński, Andrzej Skibicki, Radosław Stachowiak, Robert Kosturek, and Lucjan Śnieżek. 2023. "Mechanical Properties and Microstructure of Dissimilar S355/AA6061-T6 FSW Butt Joints" Materials 16, no. 17: 5950. https://doi.org/10.3390/ma16175950