
Effect of Initial Crack Position on Crack Propagation Behaviors of Heavy-Duty Transmission Gear

Abstract
:1. Introduction
2. Modeling and Experimental Methods
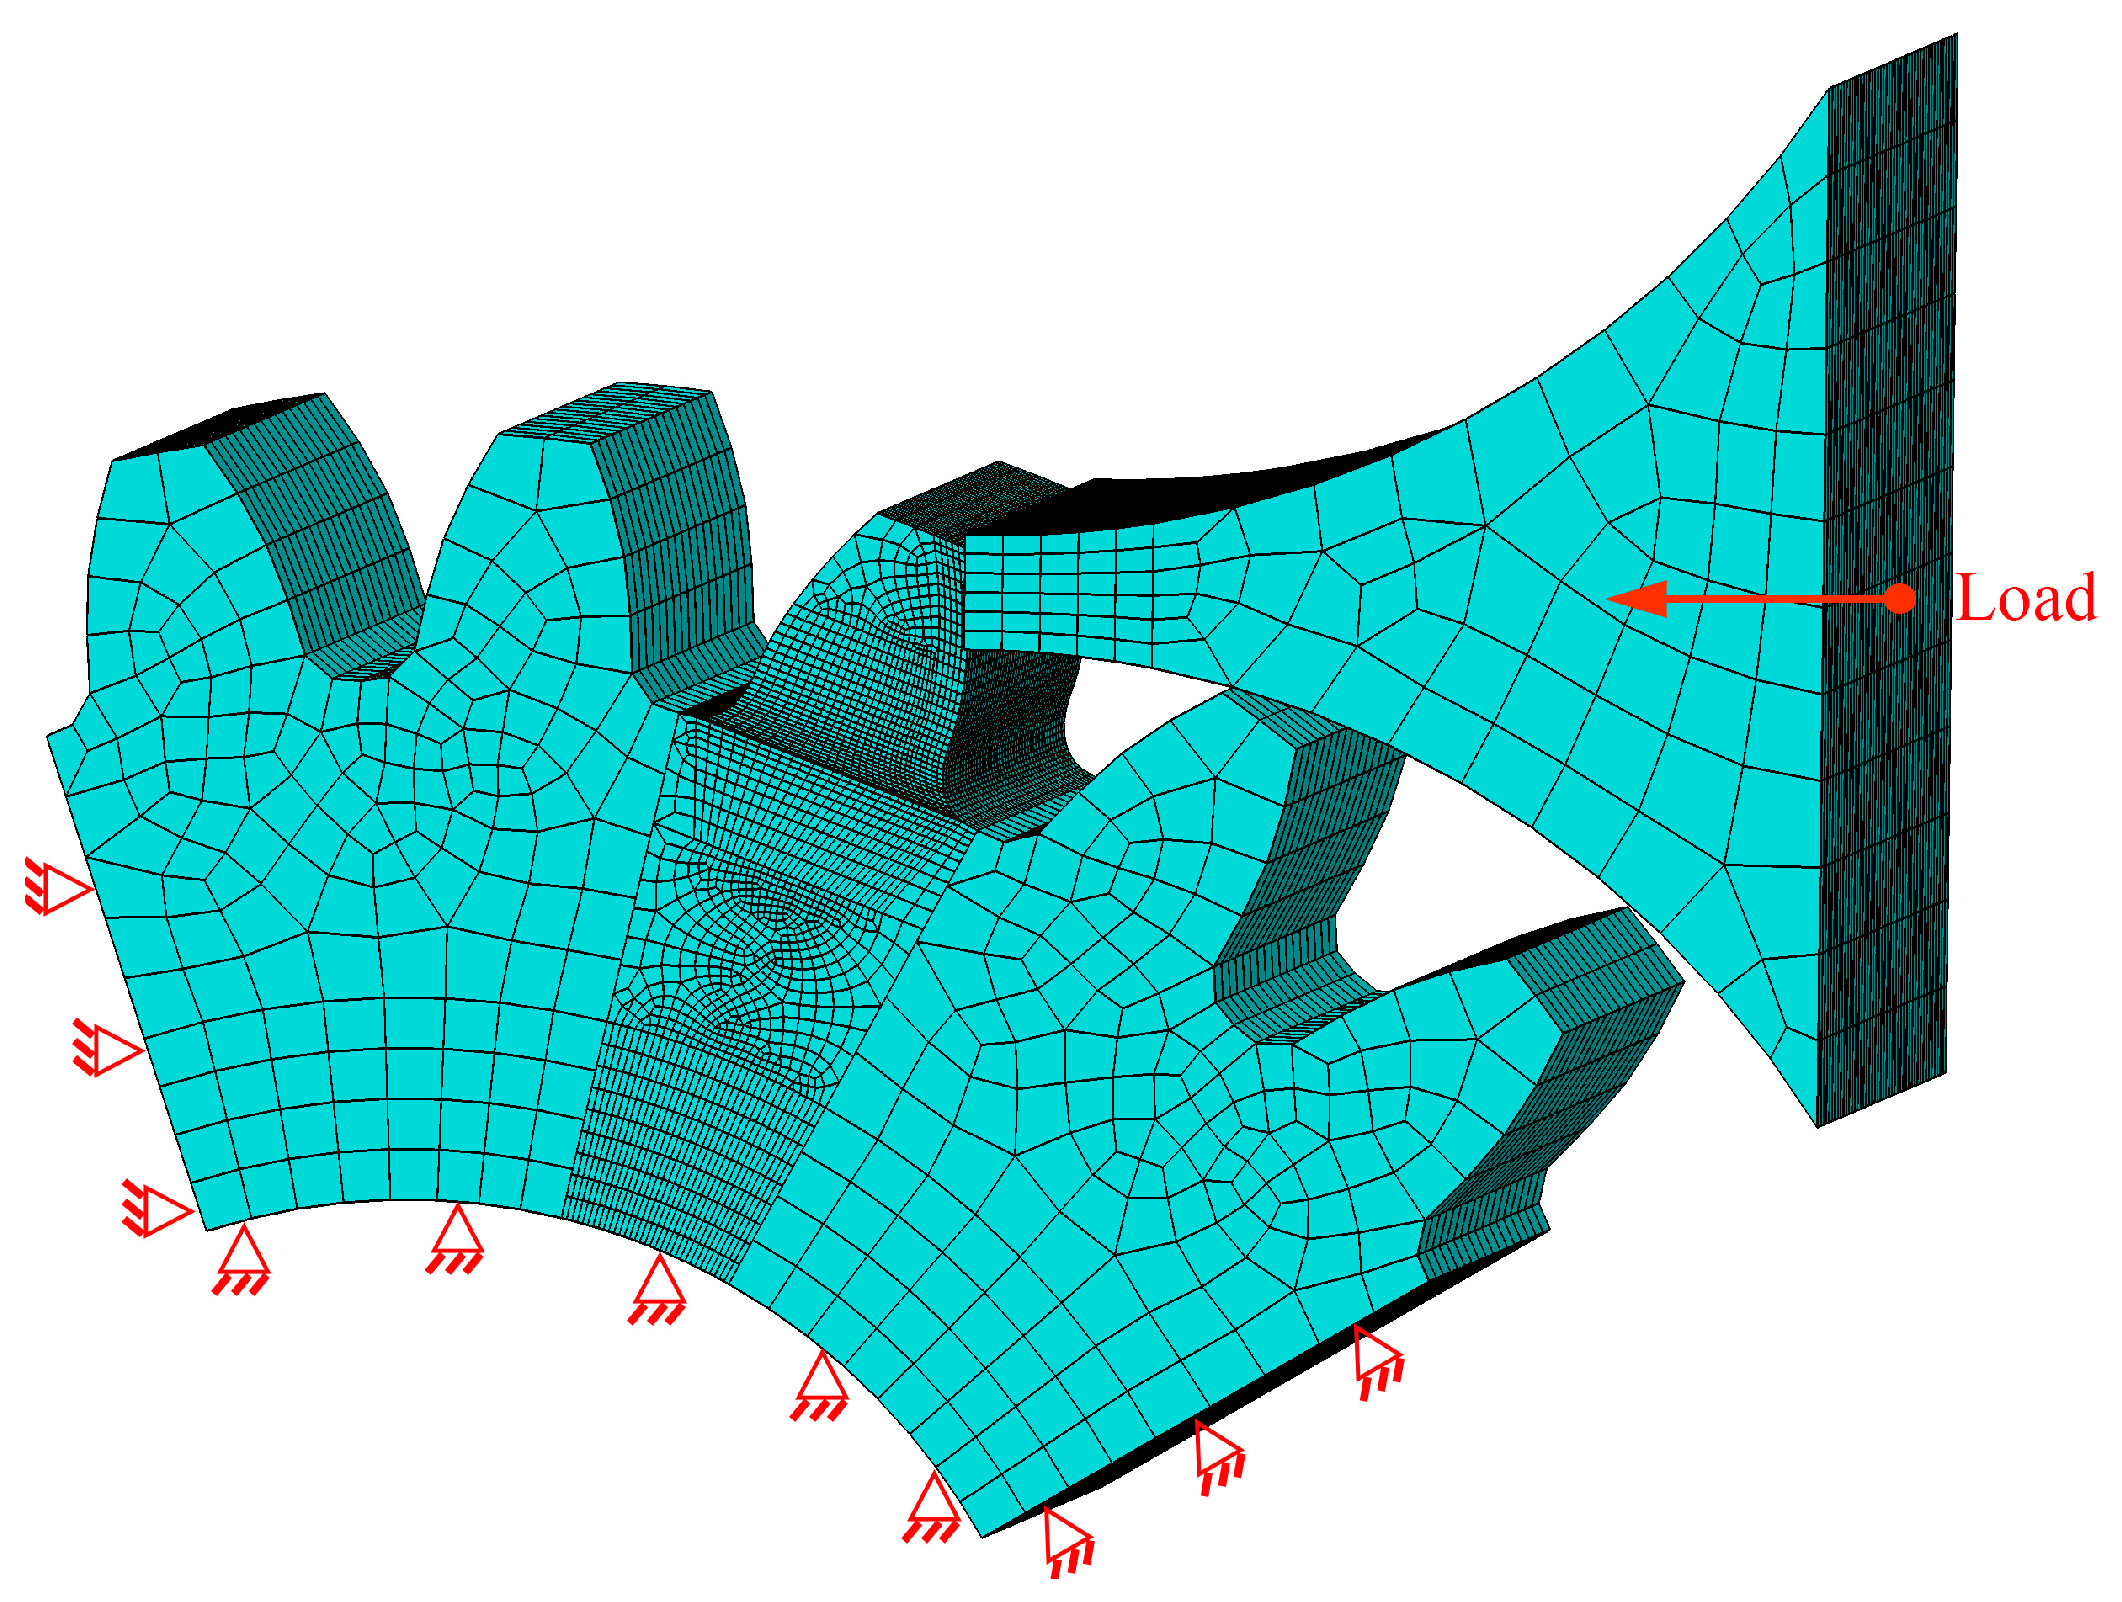
2.1. Numerical Model
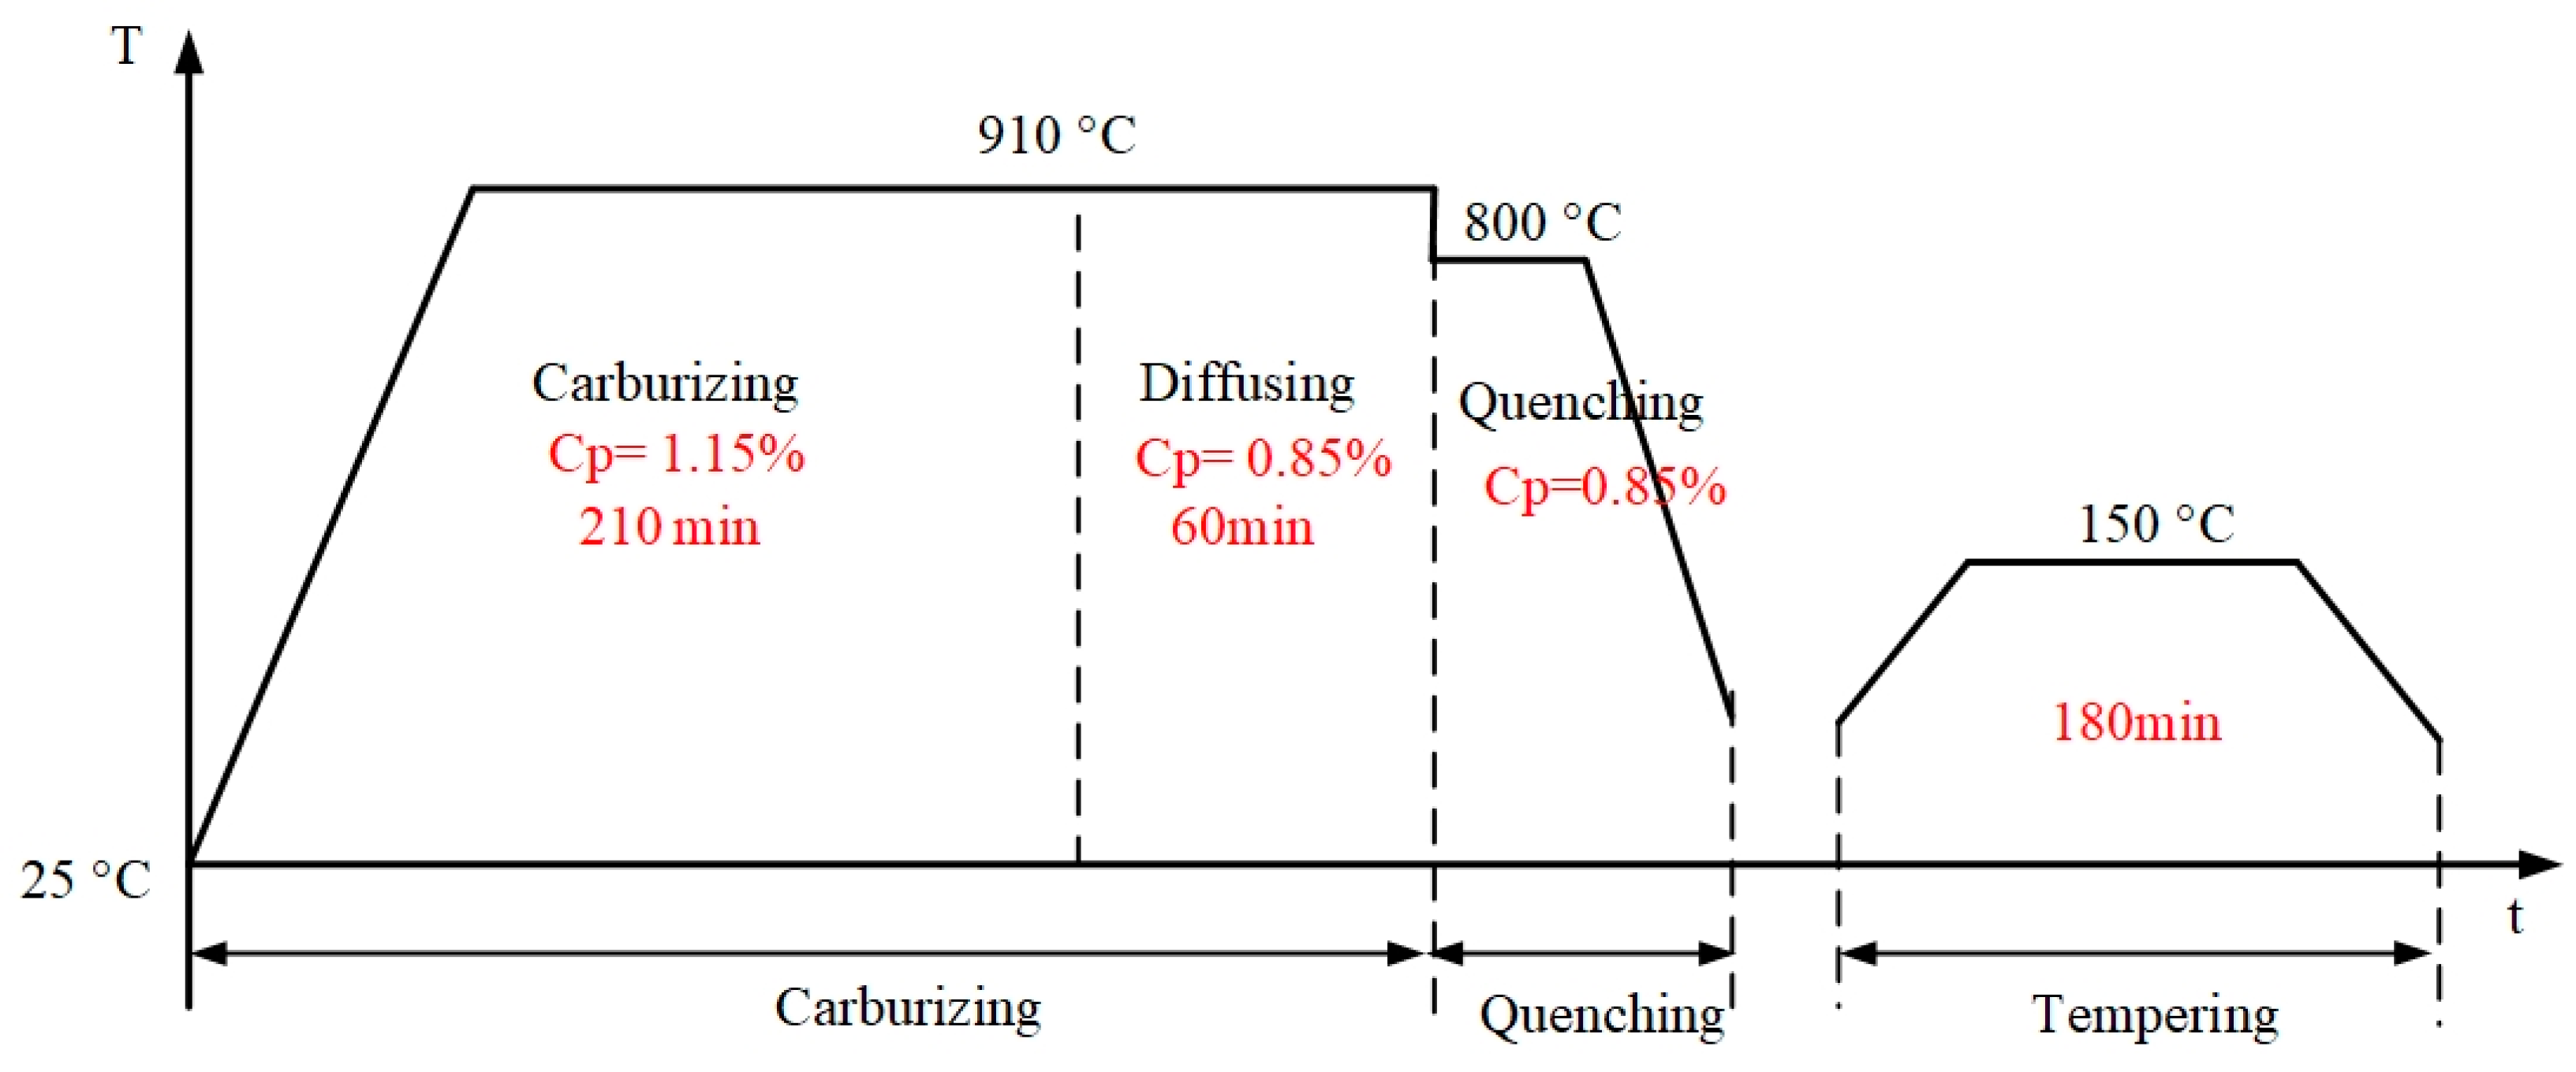
2.2. The Gear Material and Heat Treatment Process
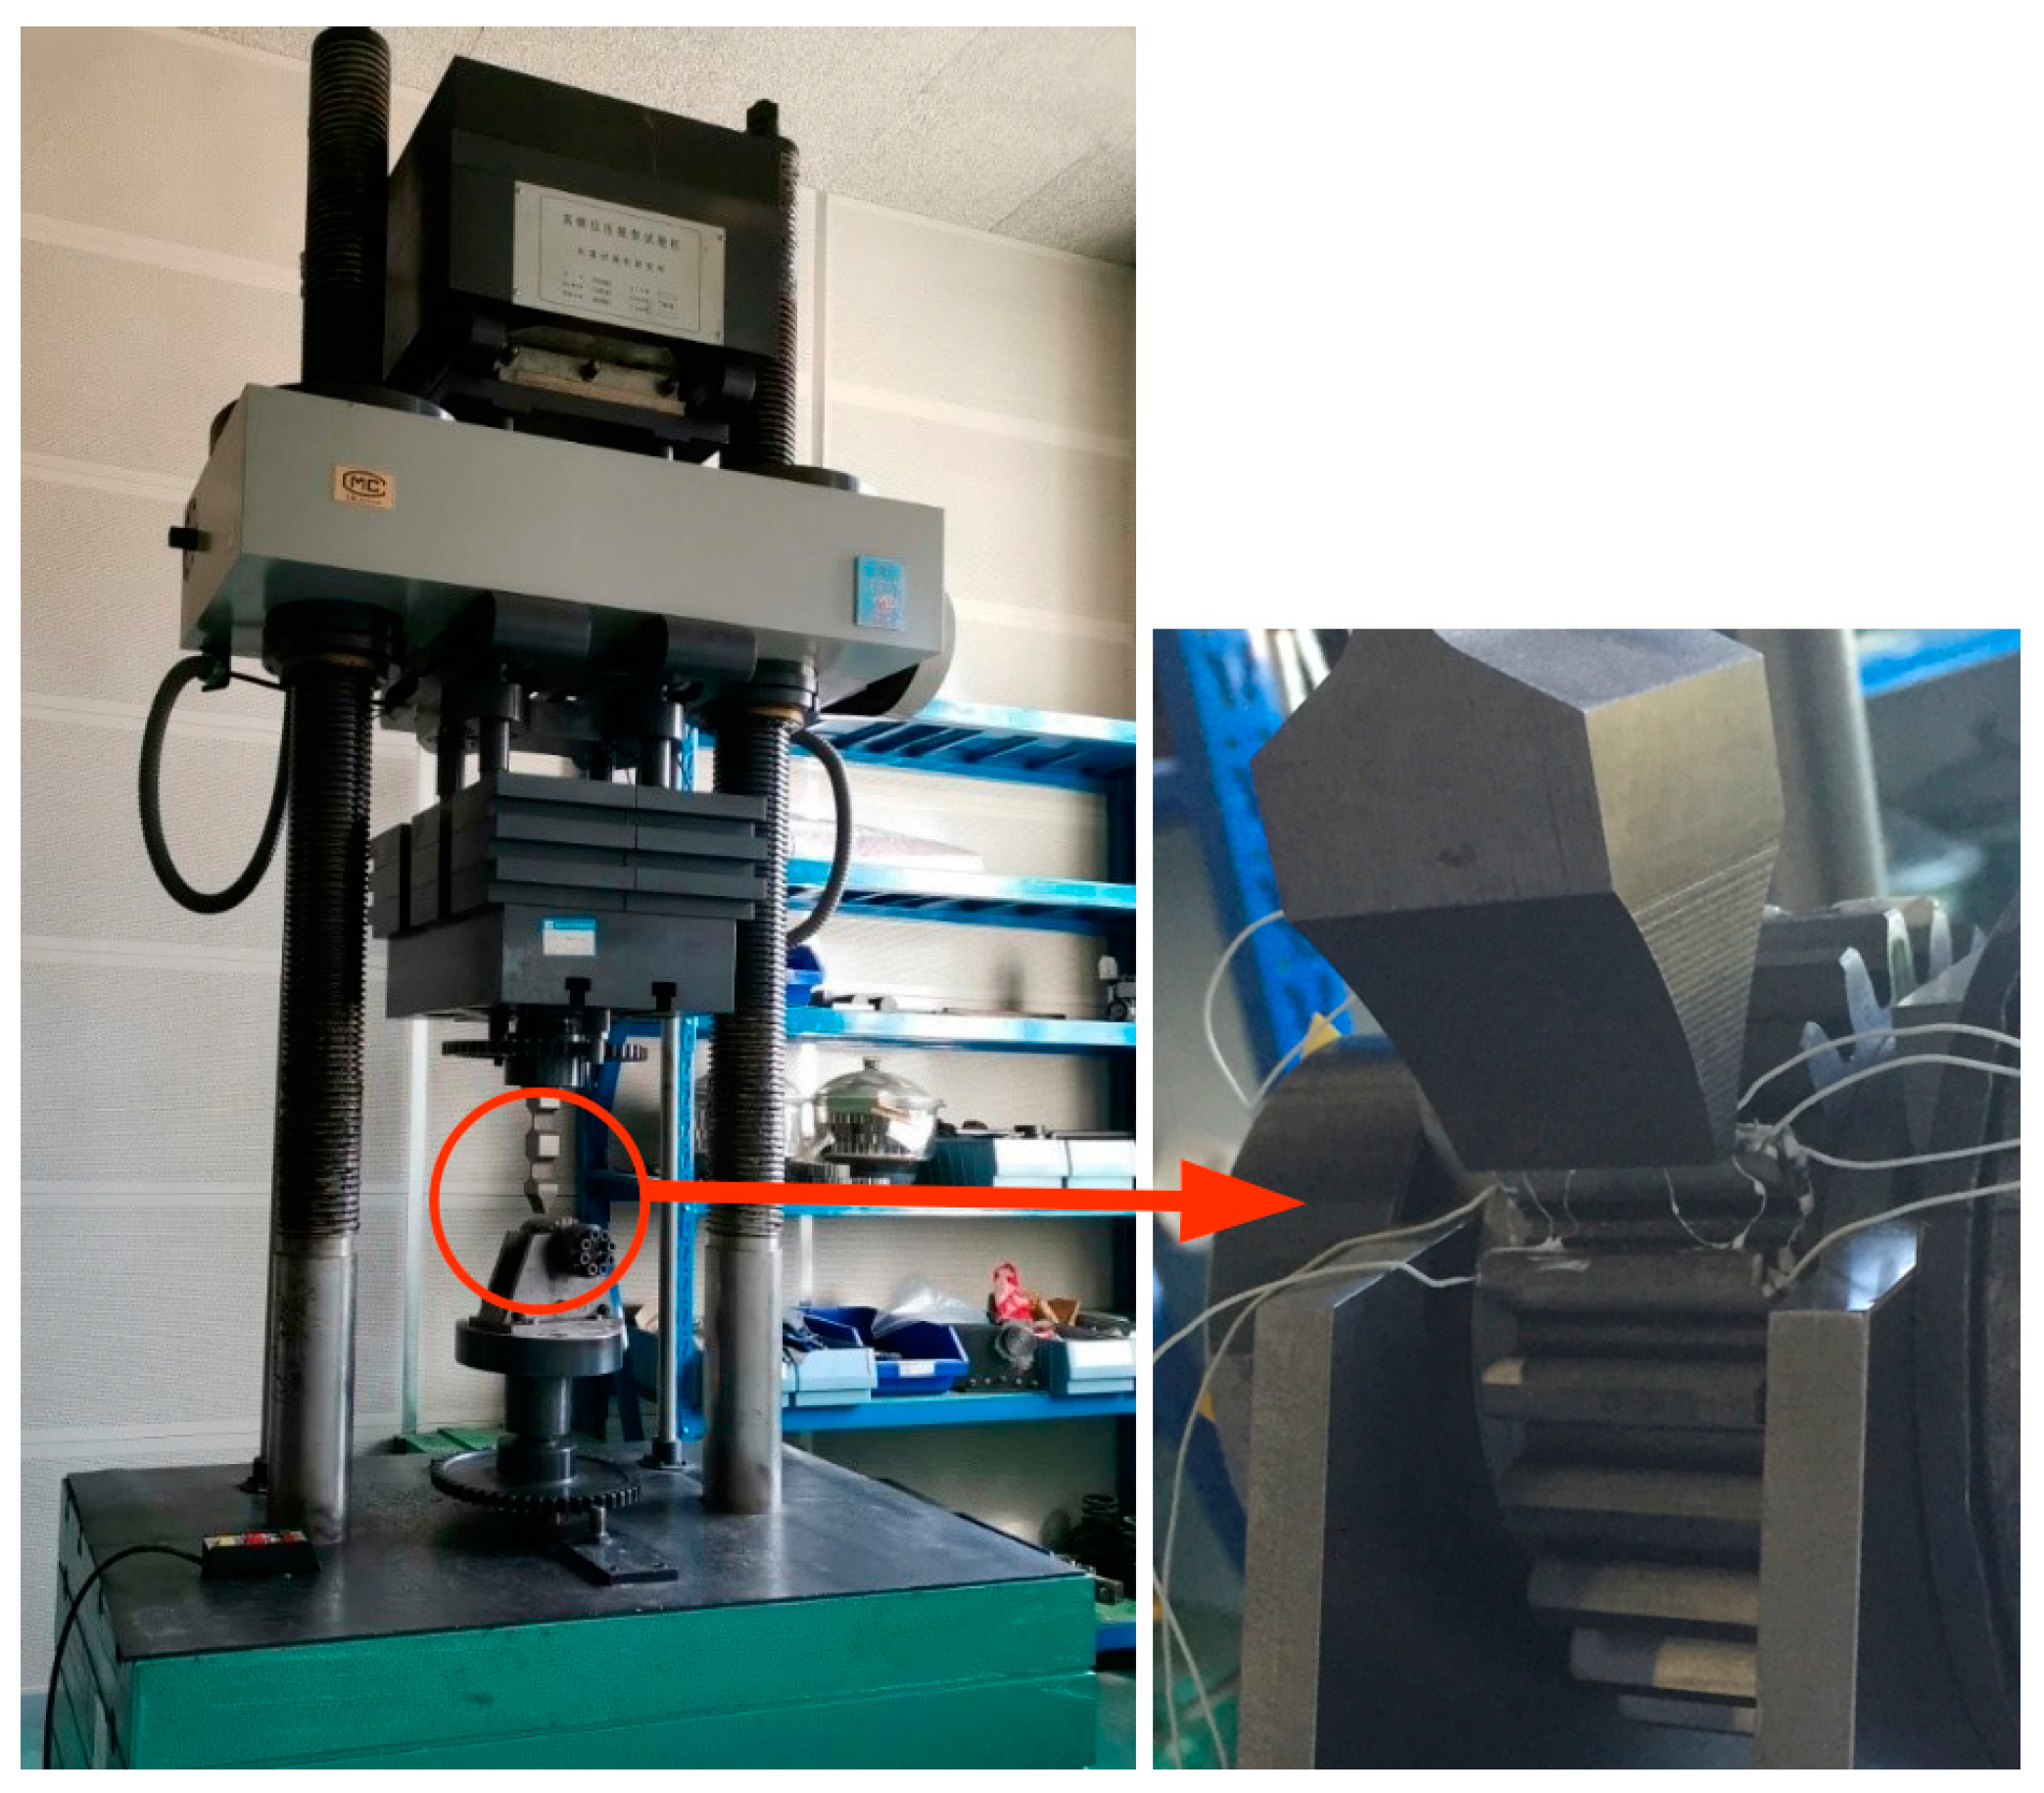
2.3. Single-Tooth Bending Fatigue Testing
3. Results and Discussions
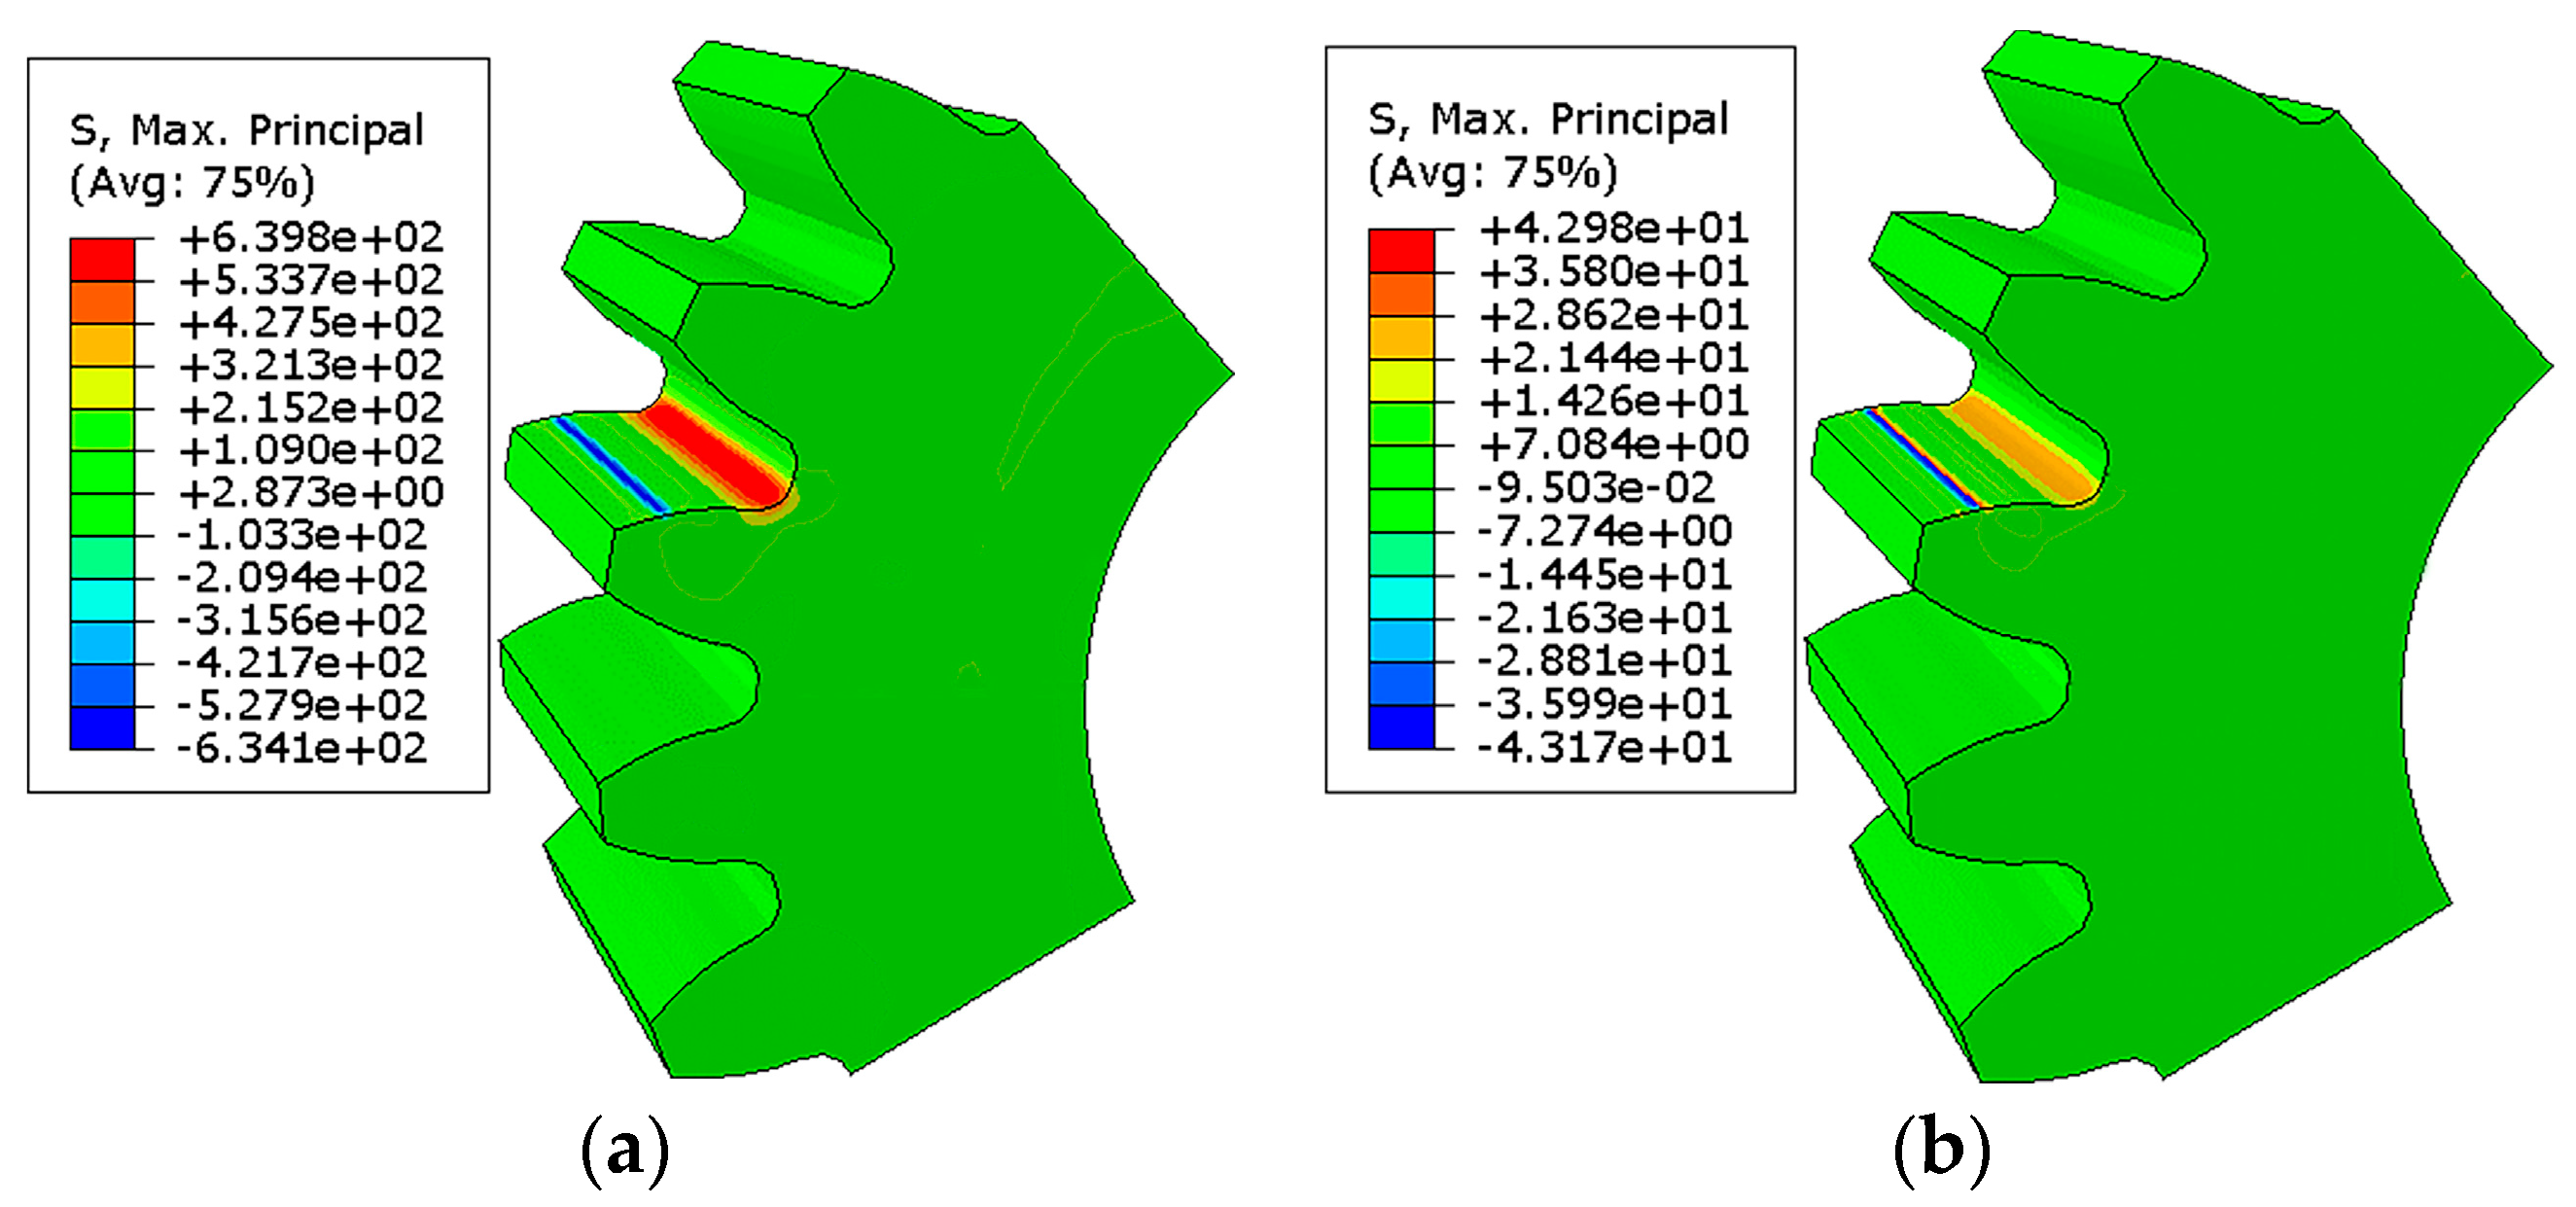
3.1. Simulation Results
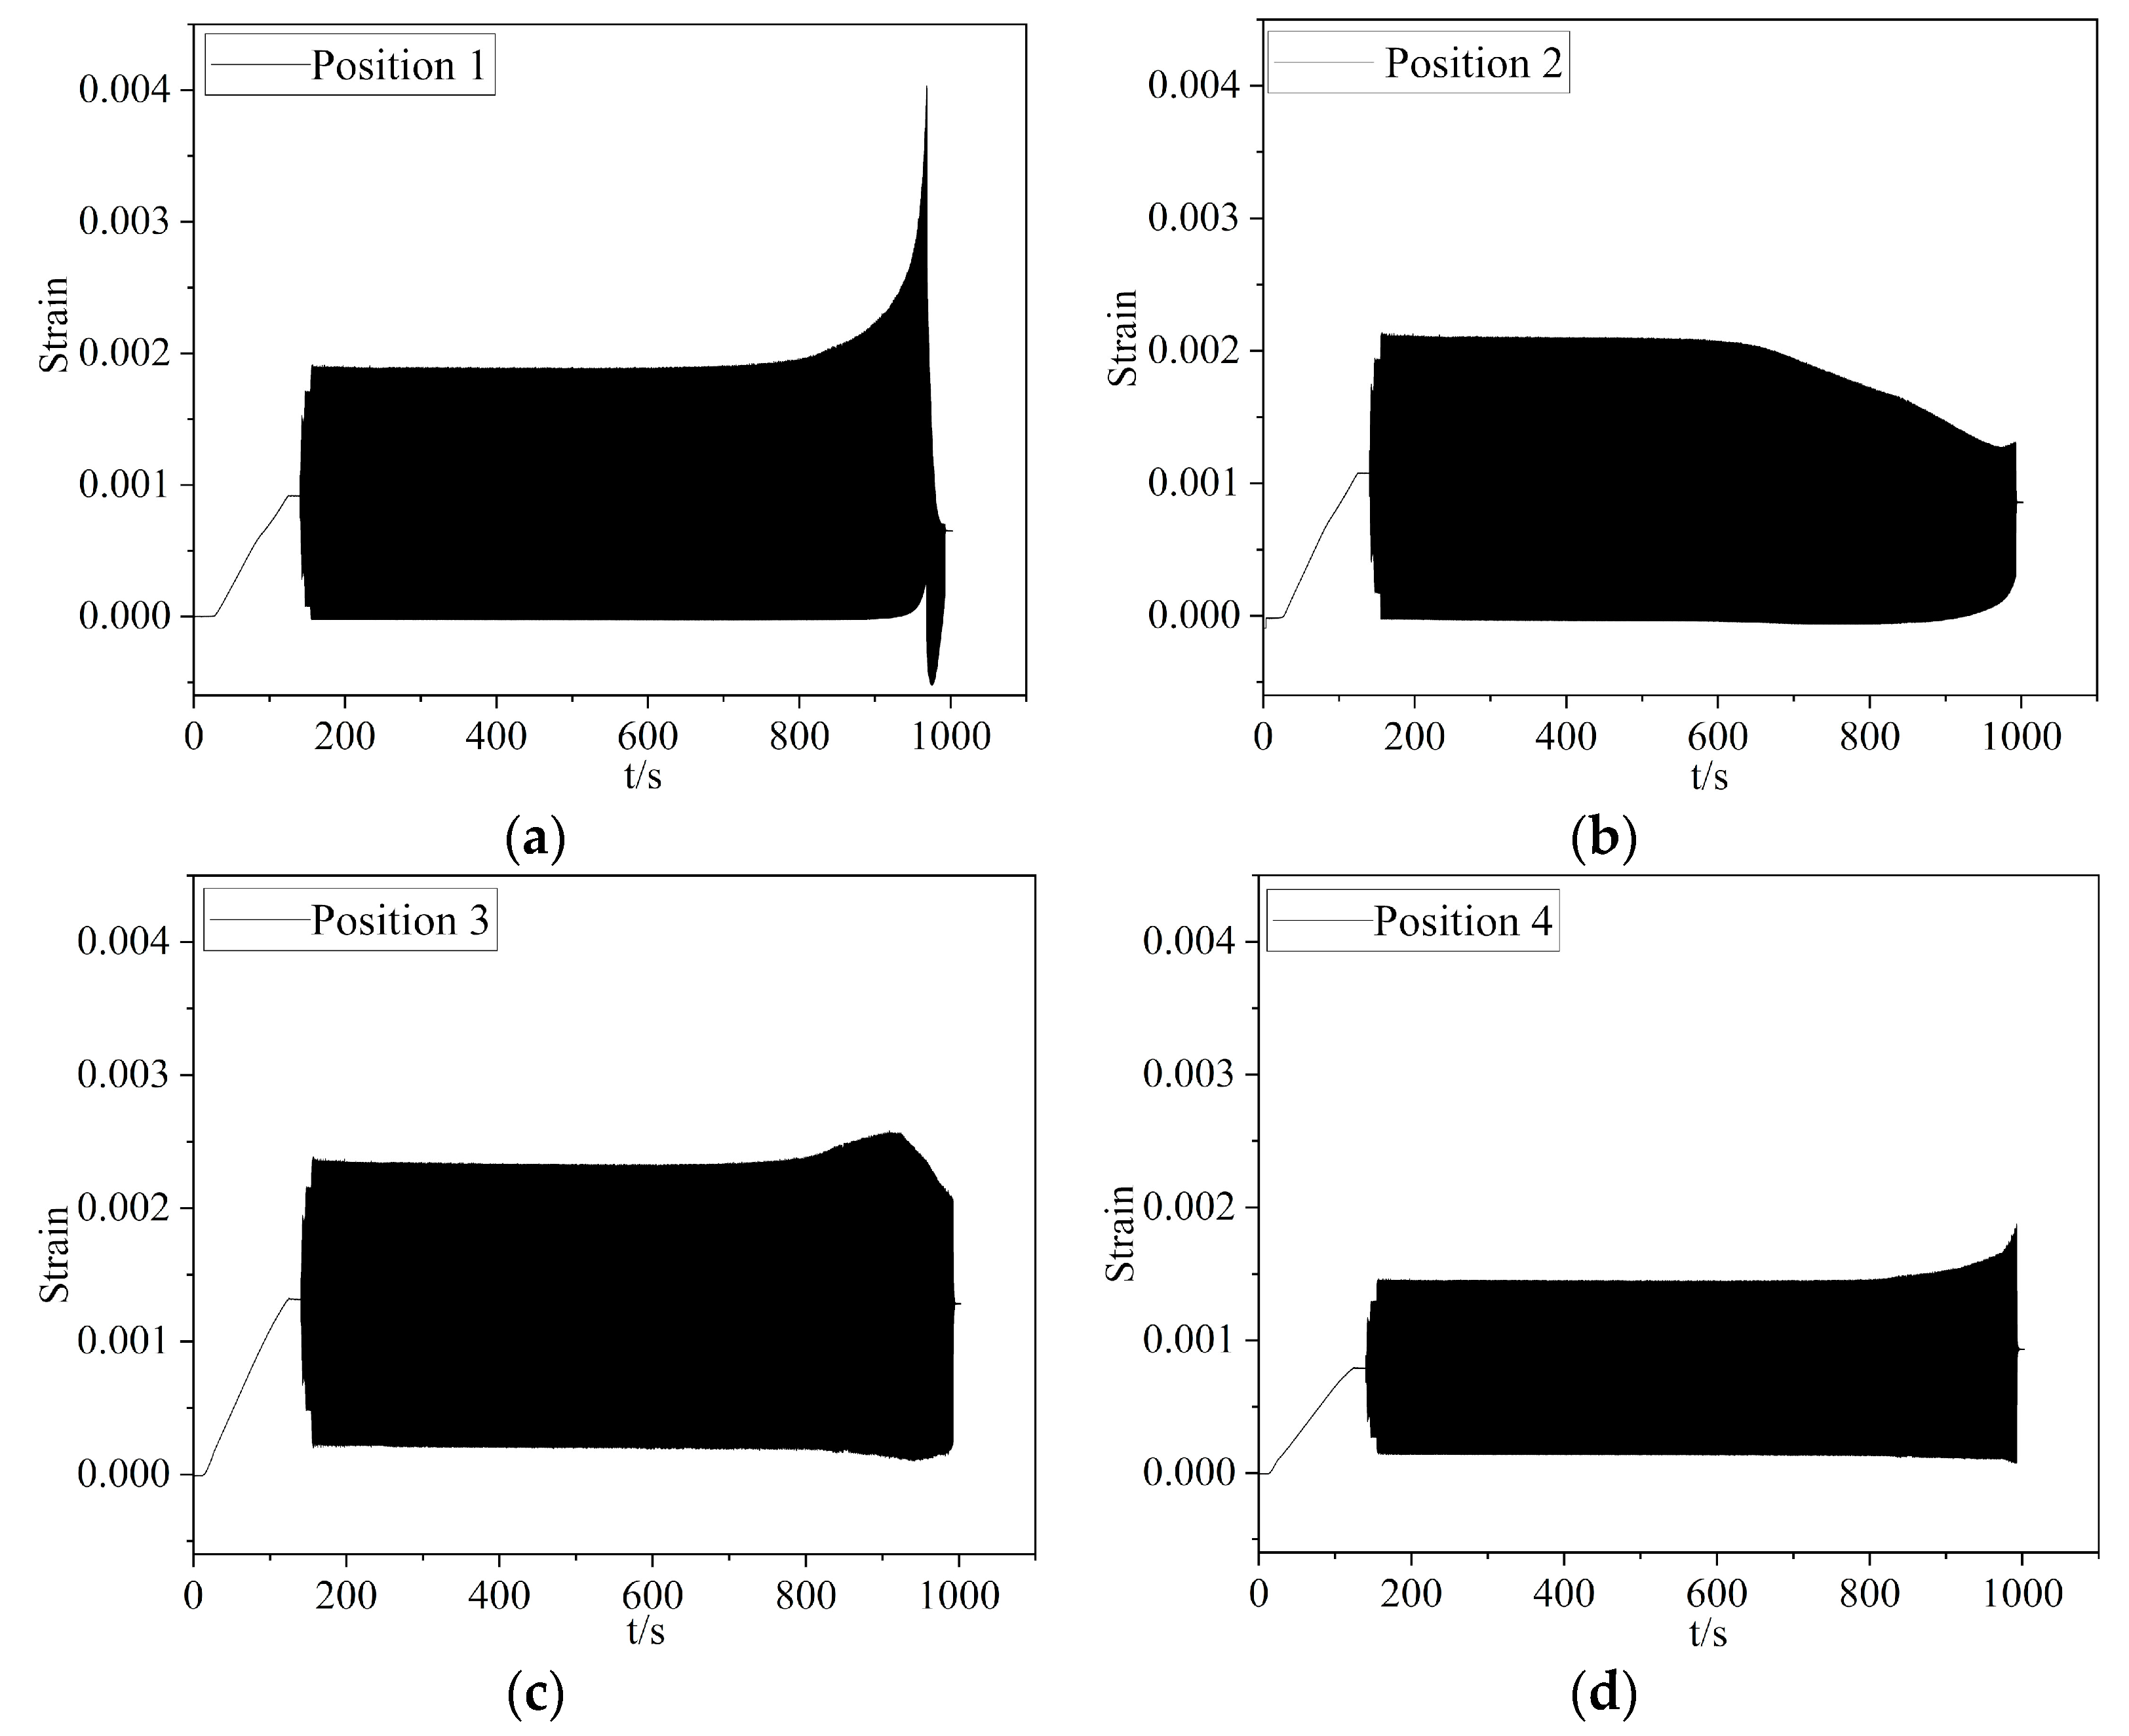
3.2. Testing Results of the Strain on the Root Surface
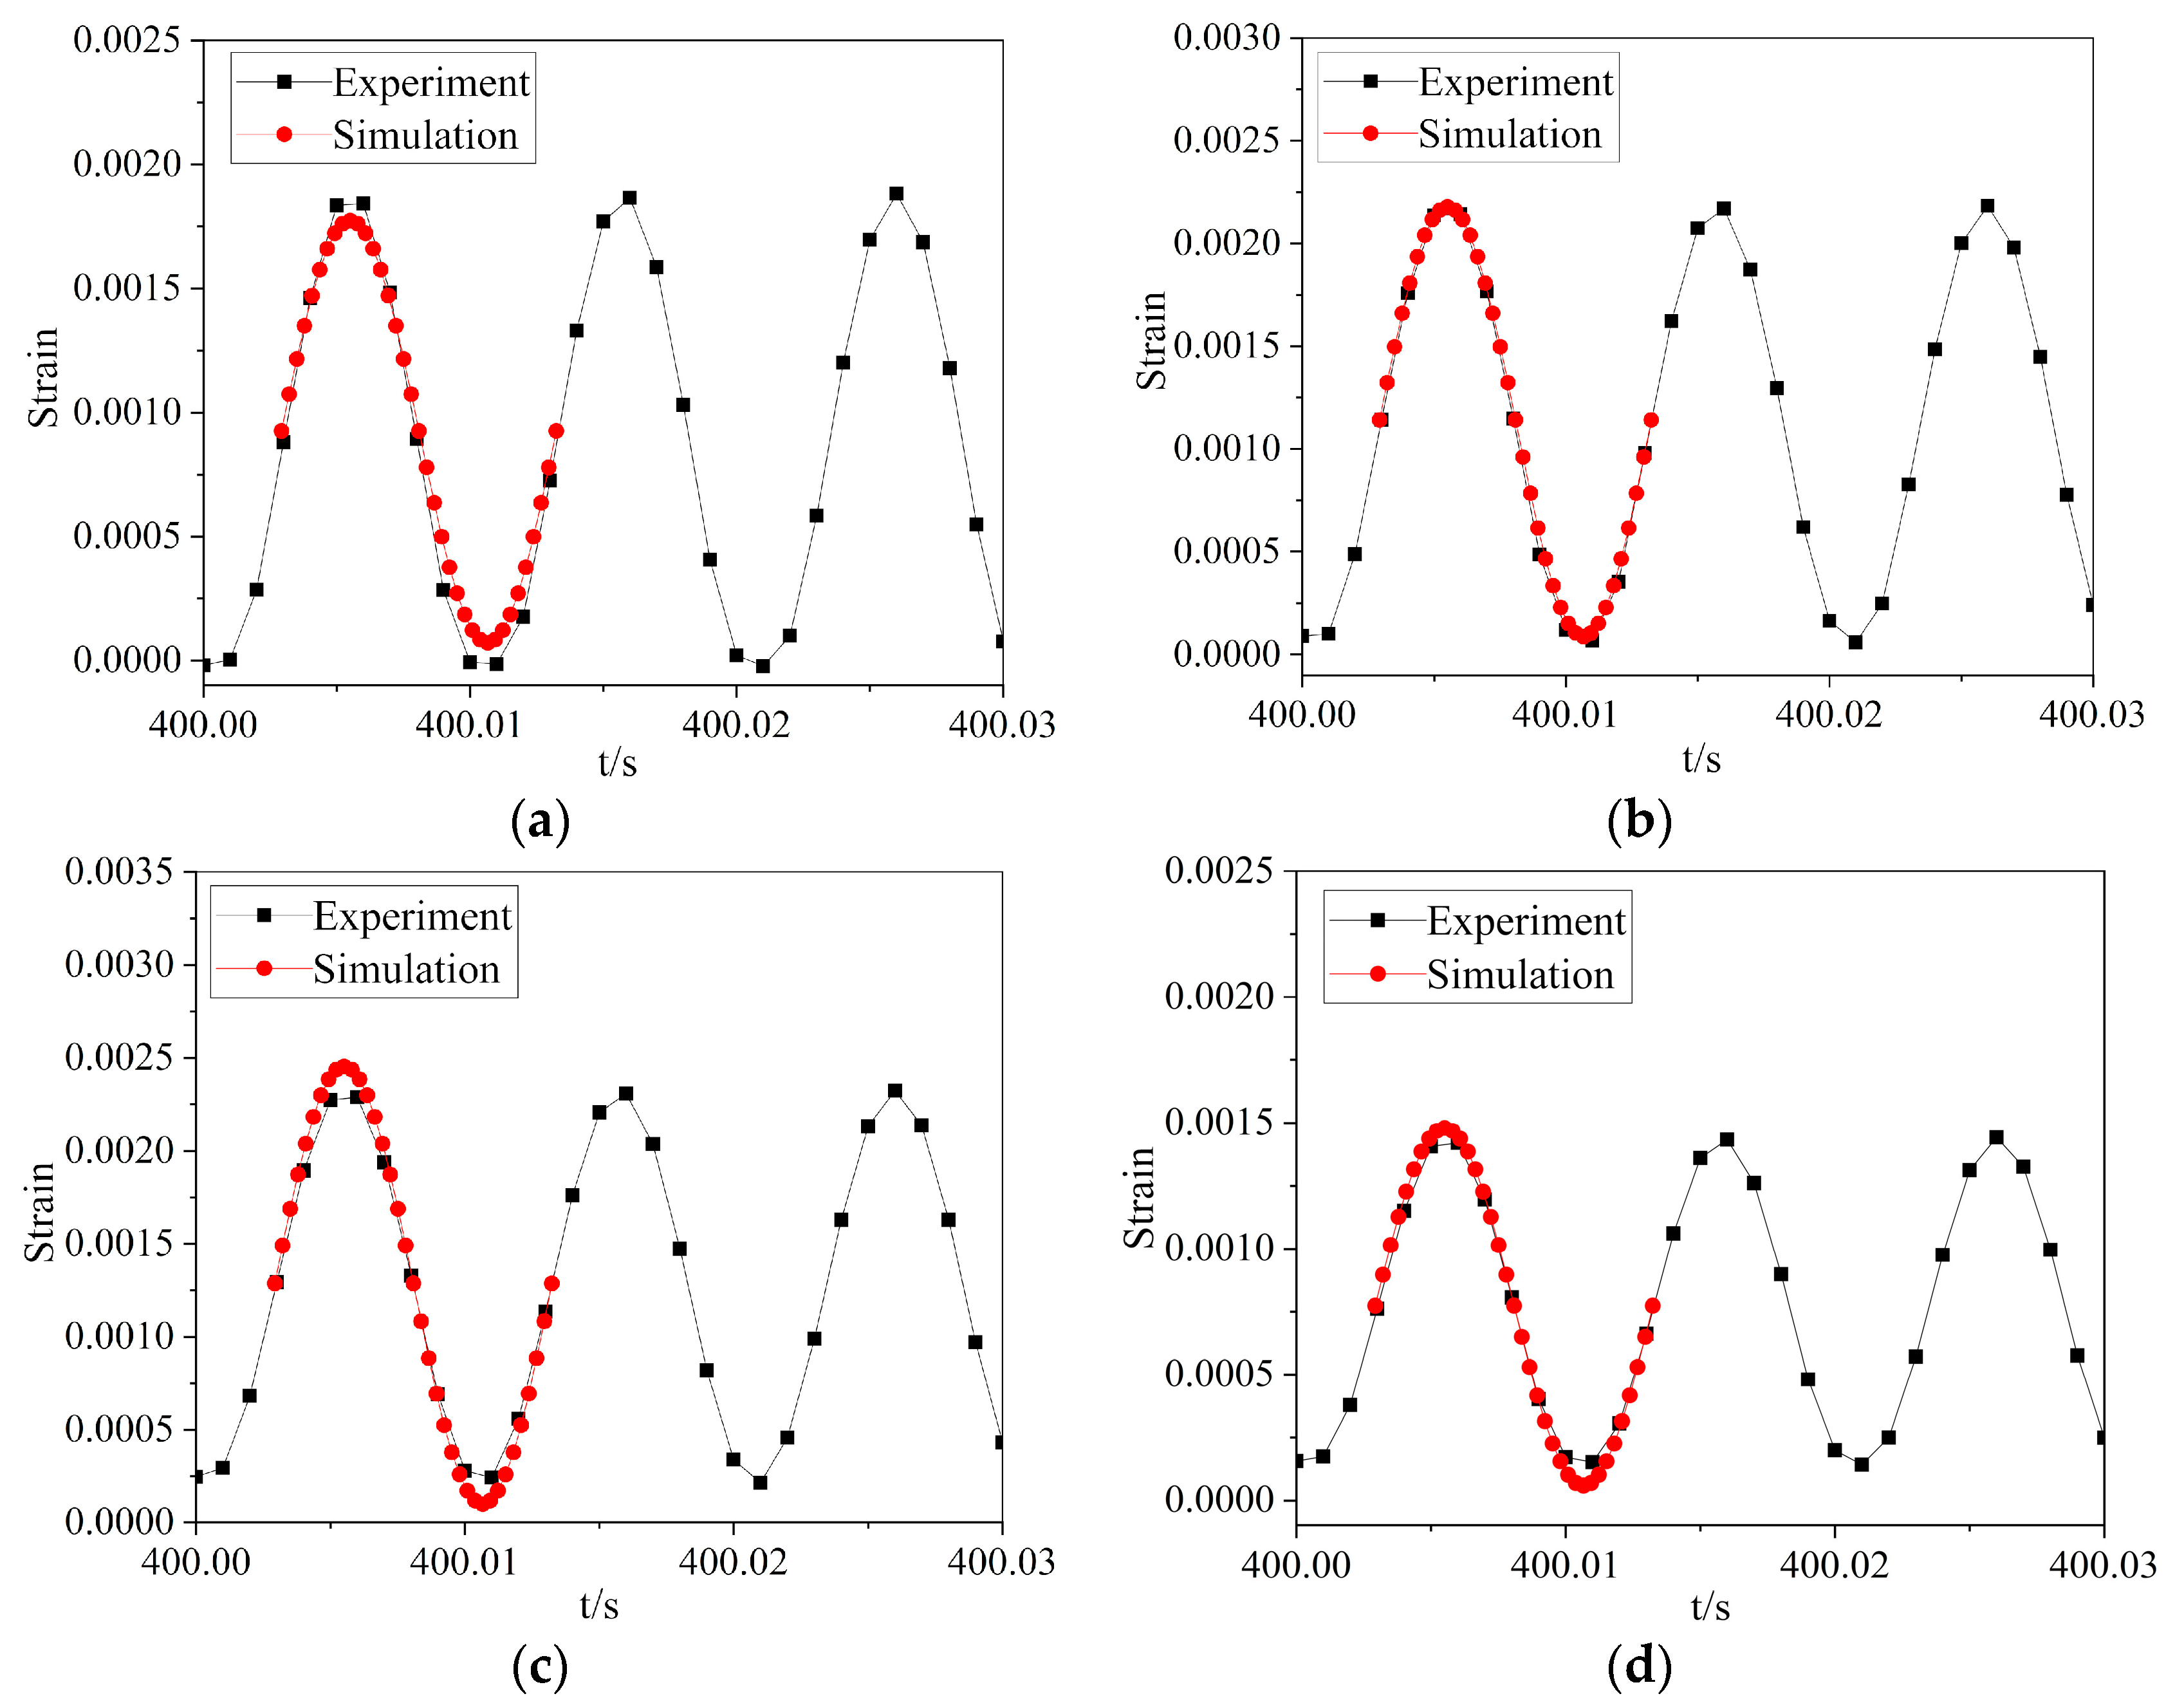
3.3. Validation of the Model
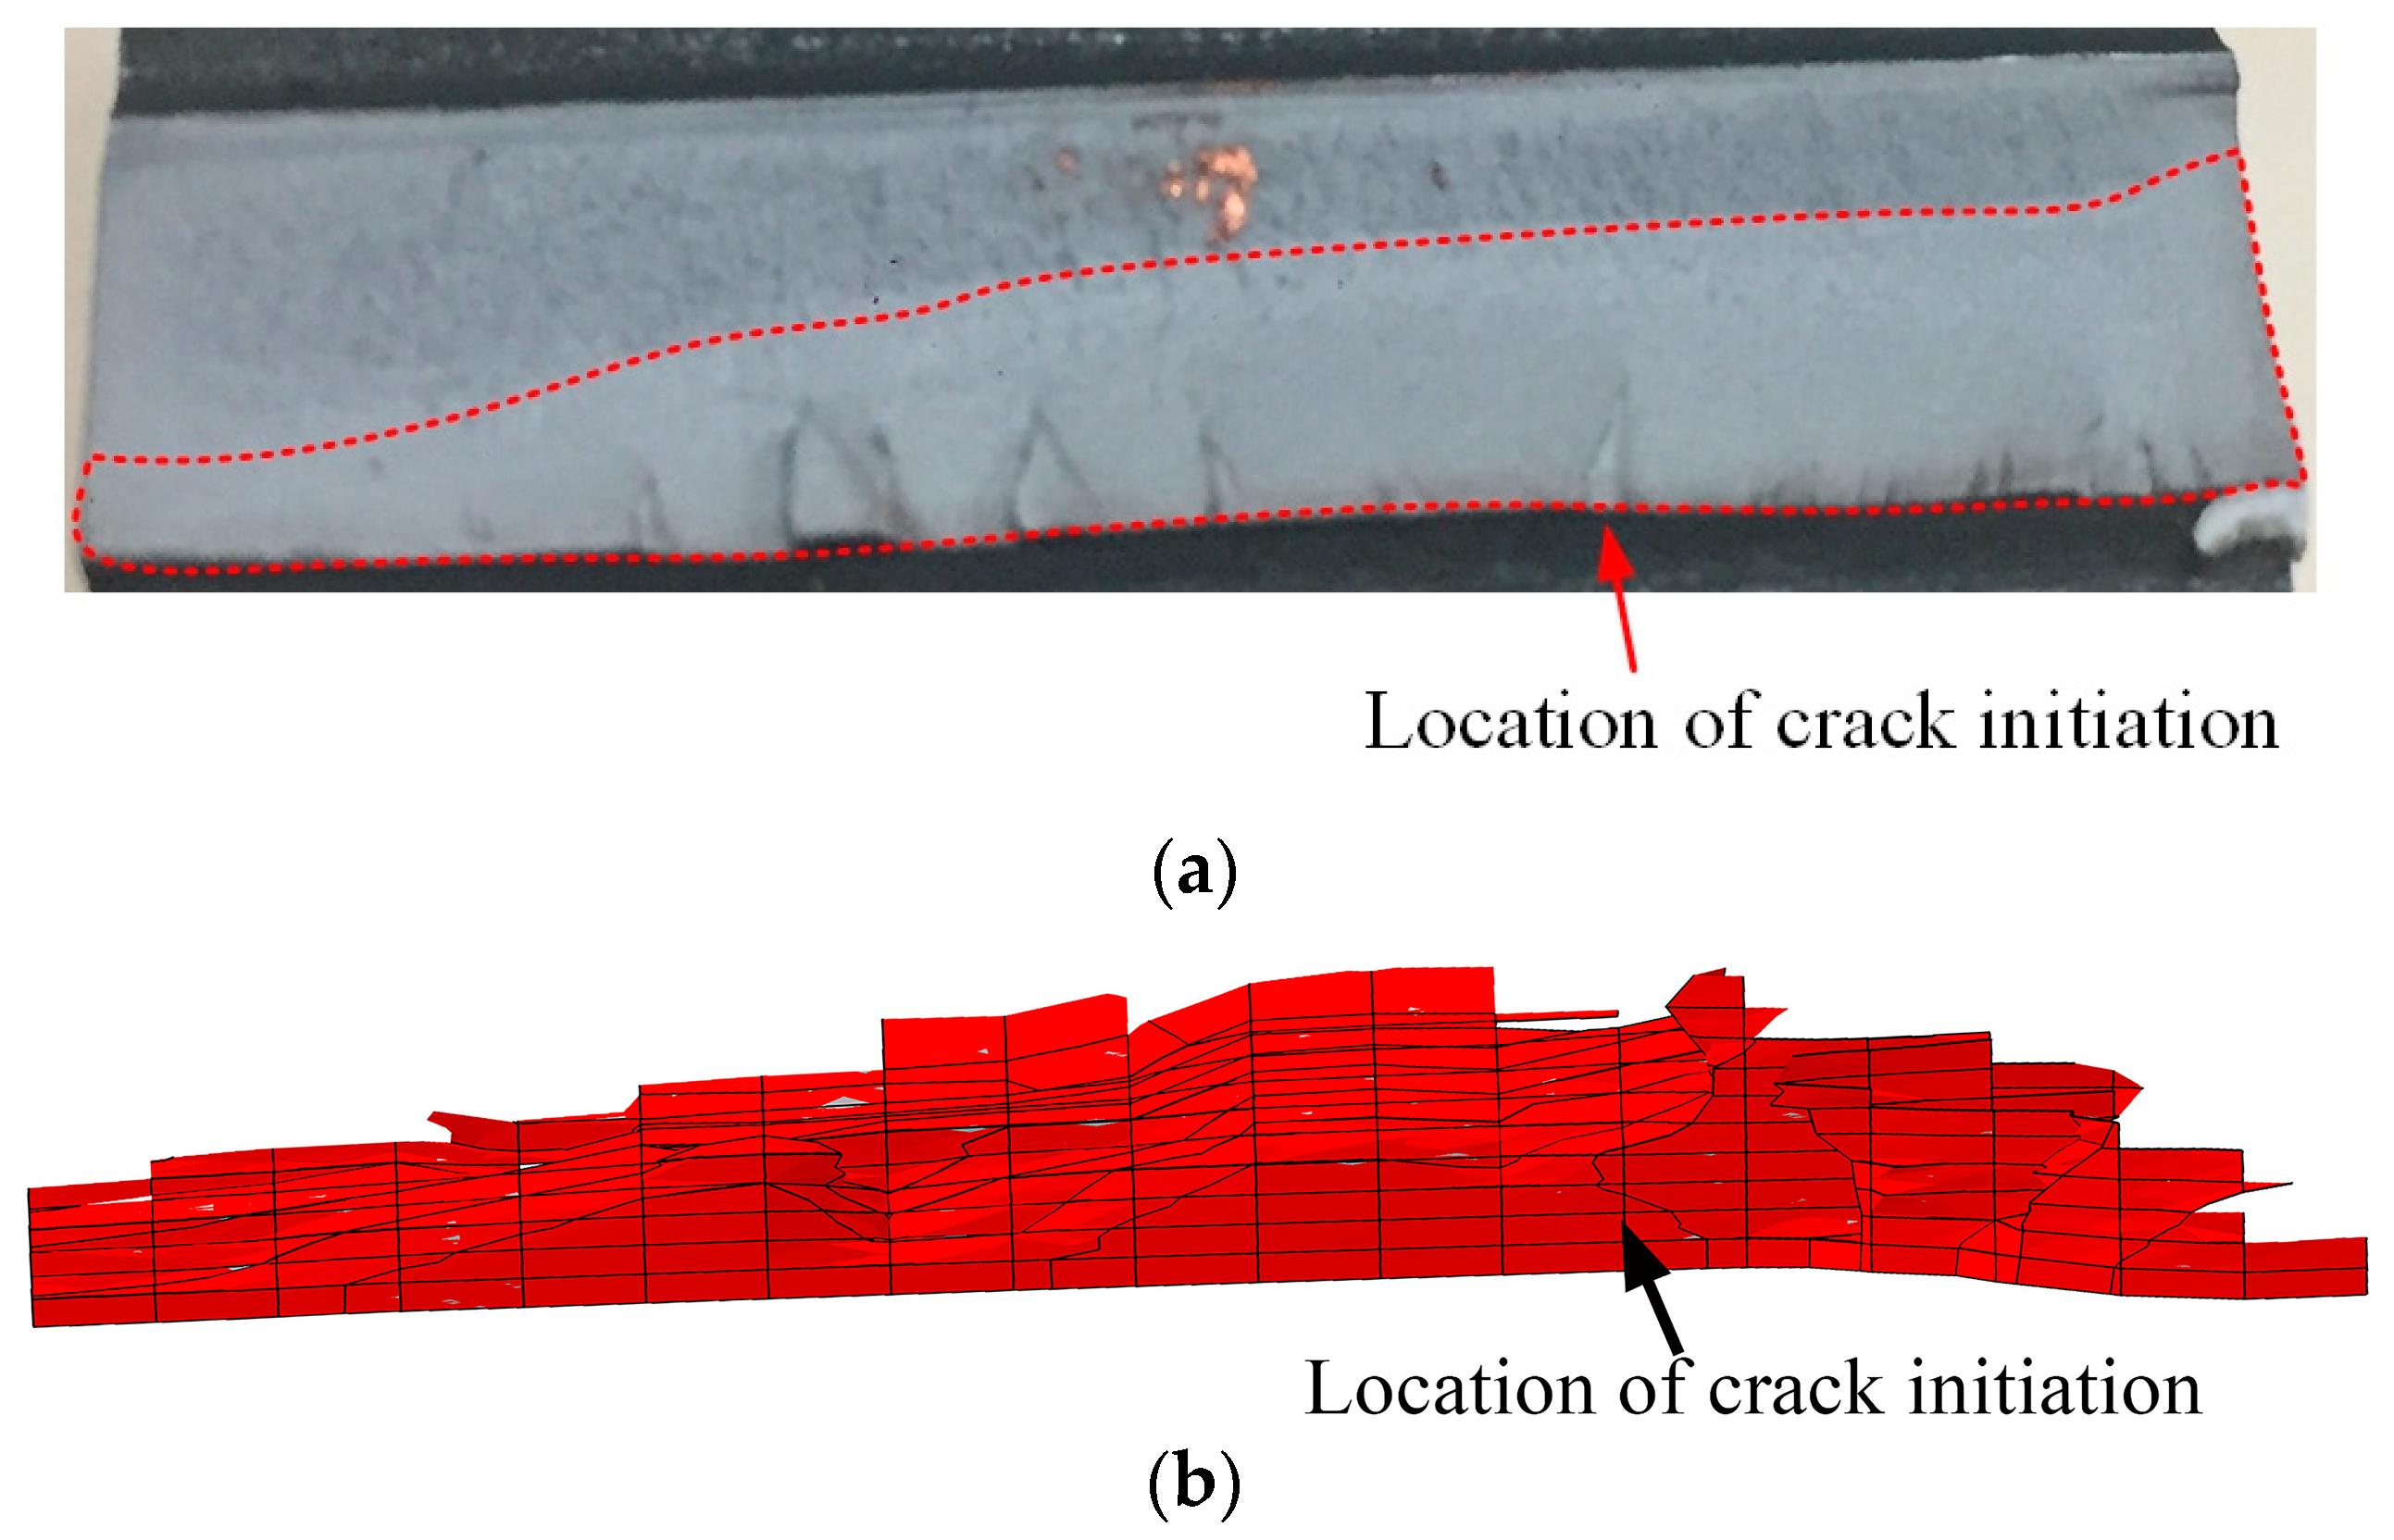
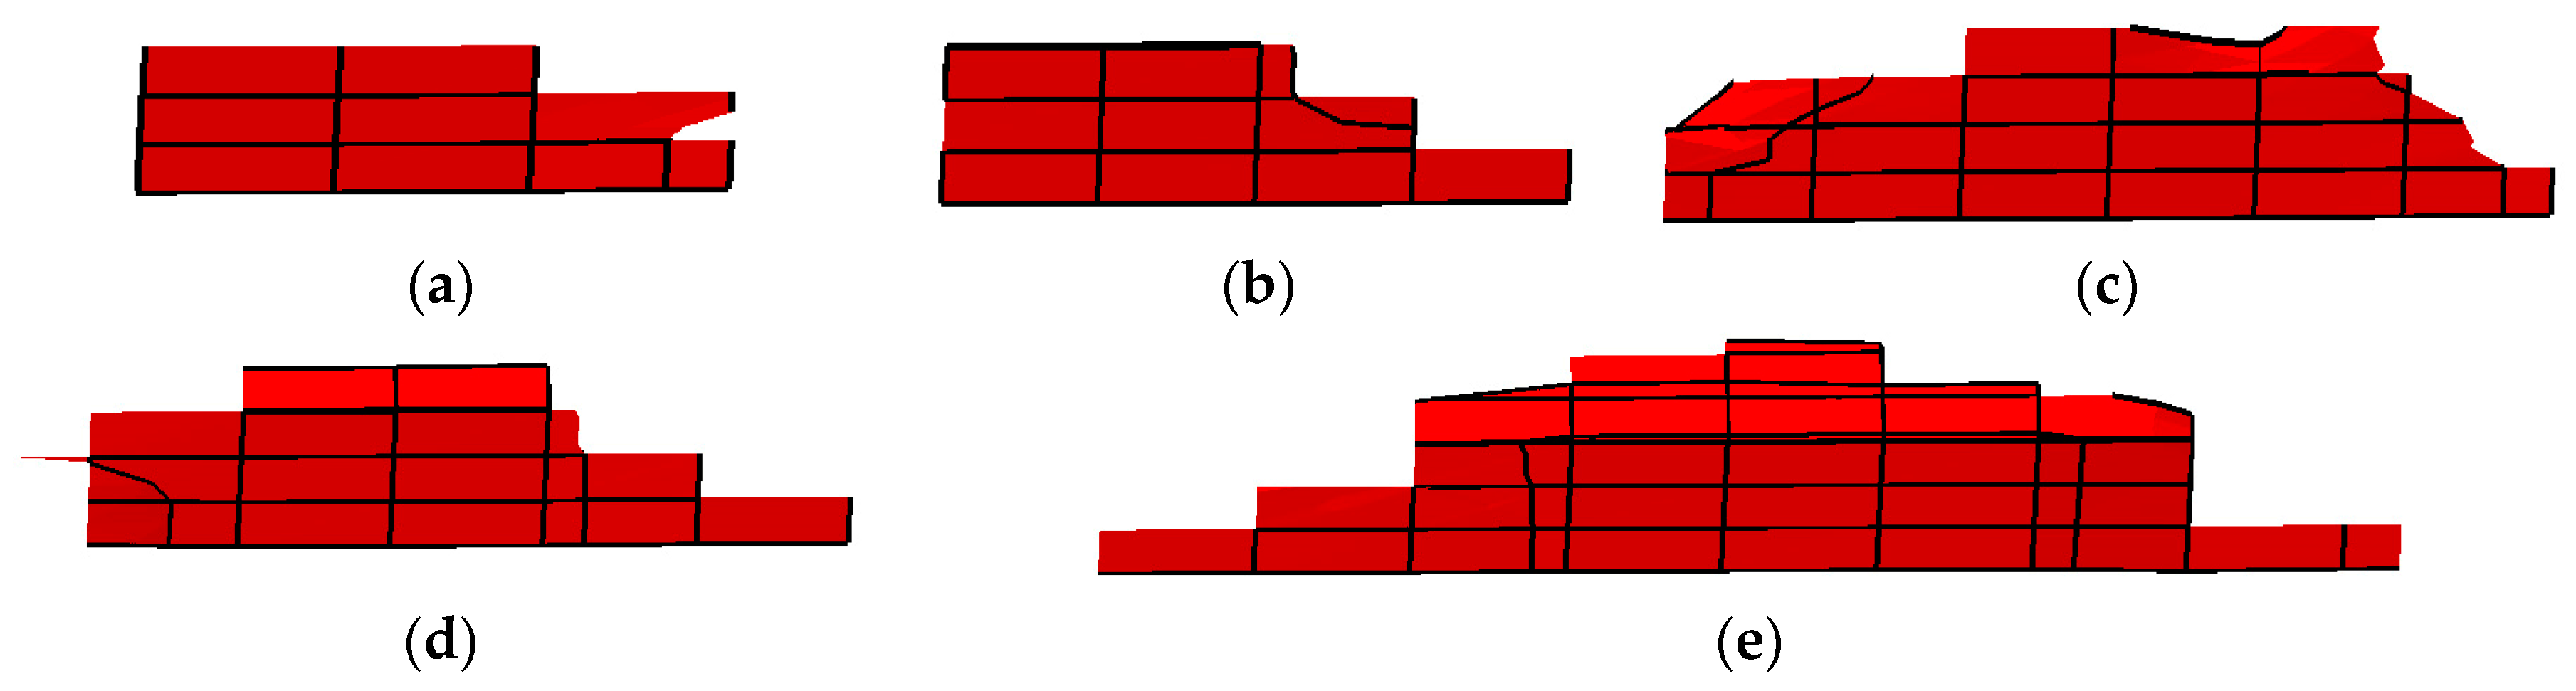
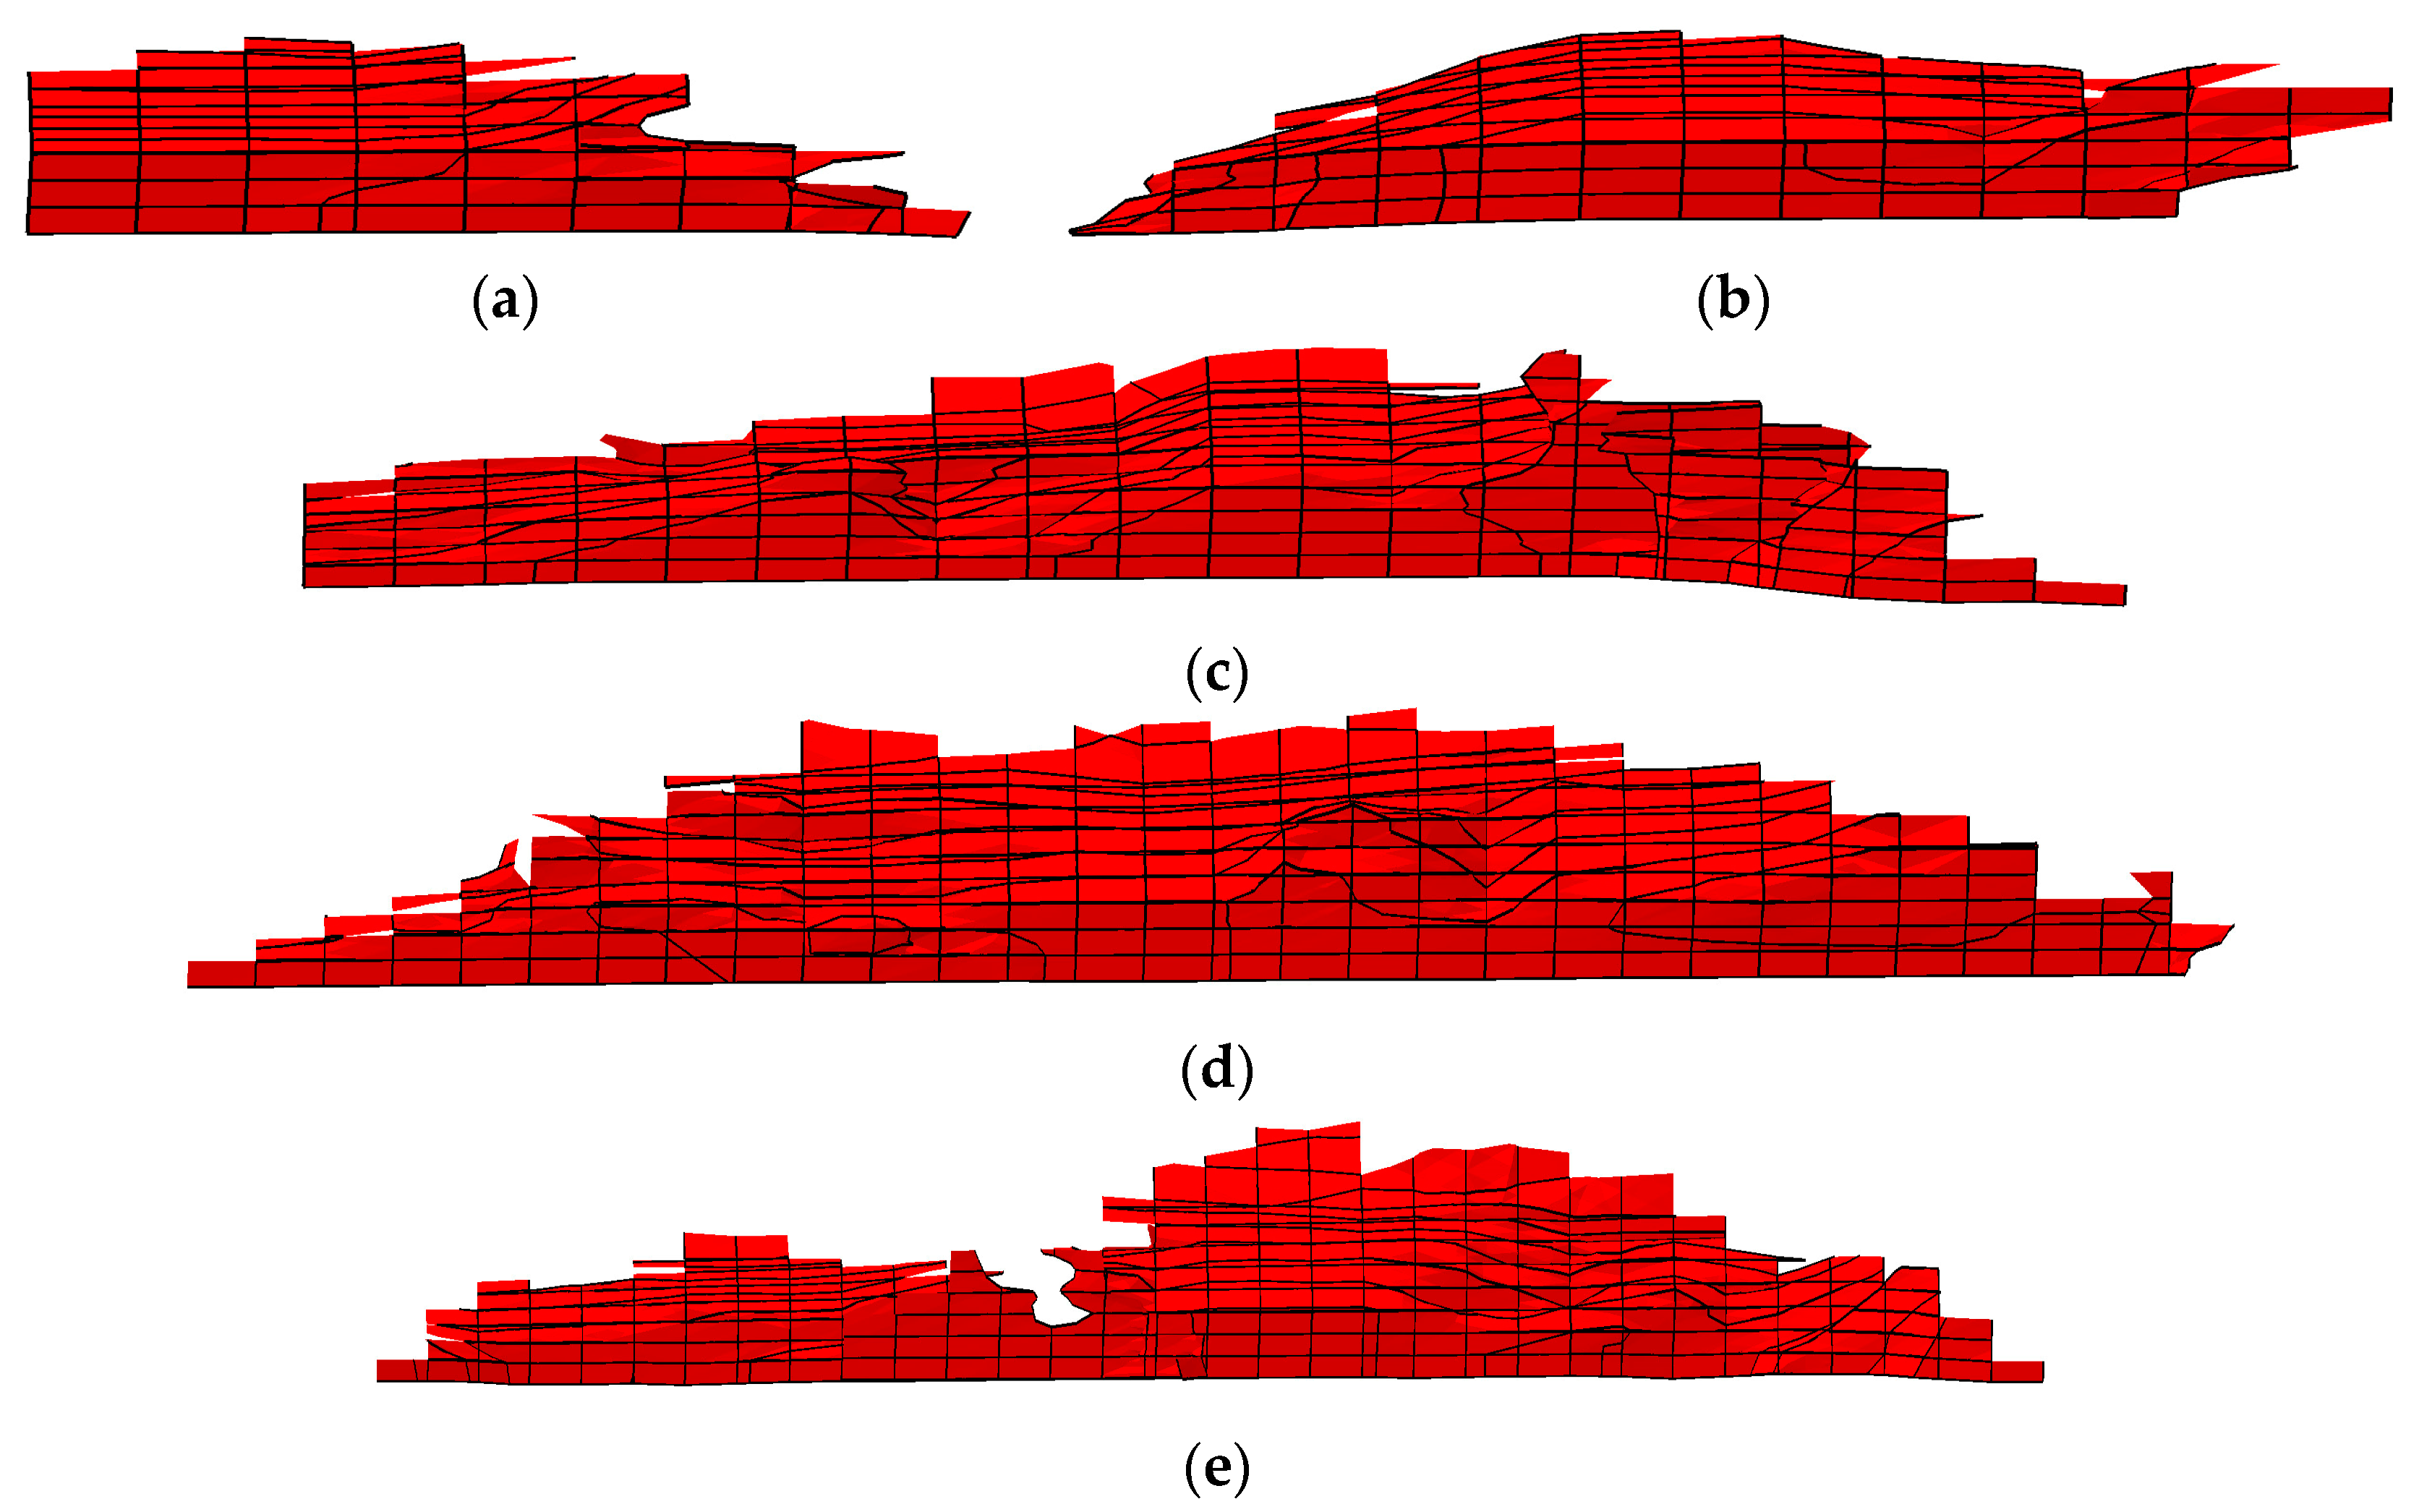
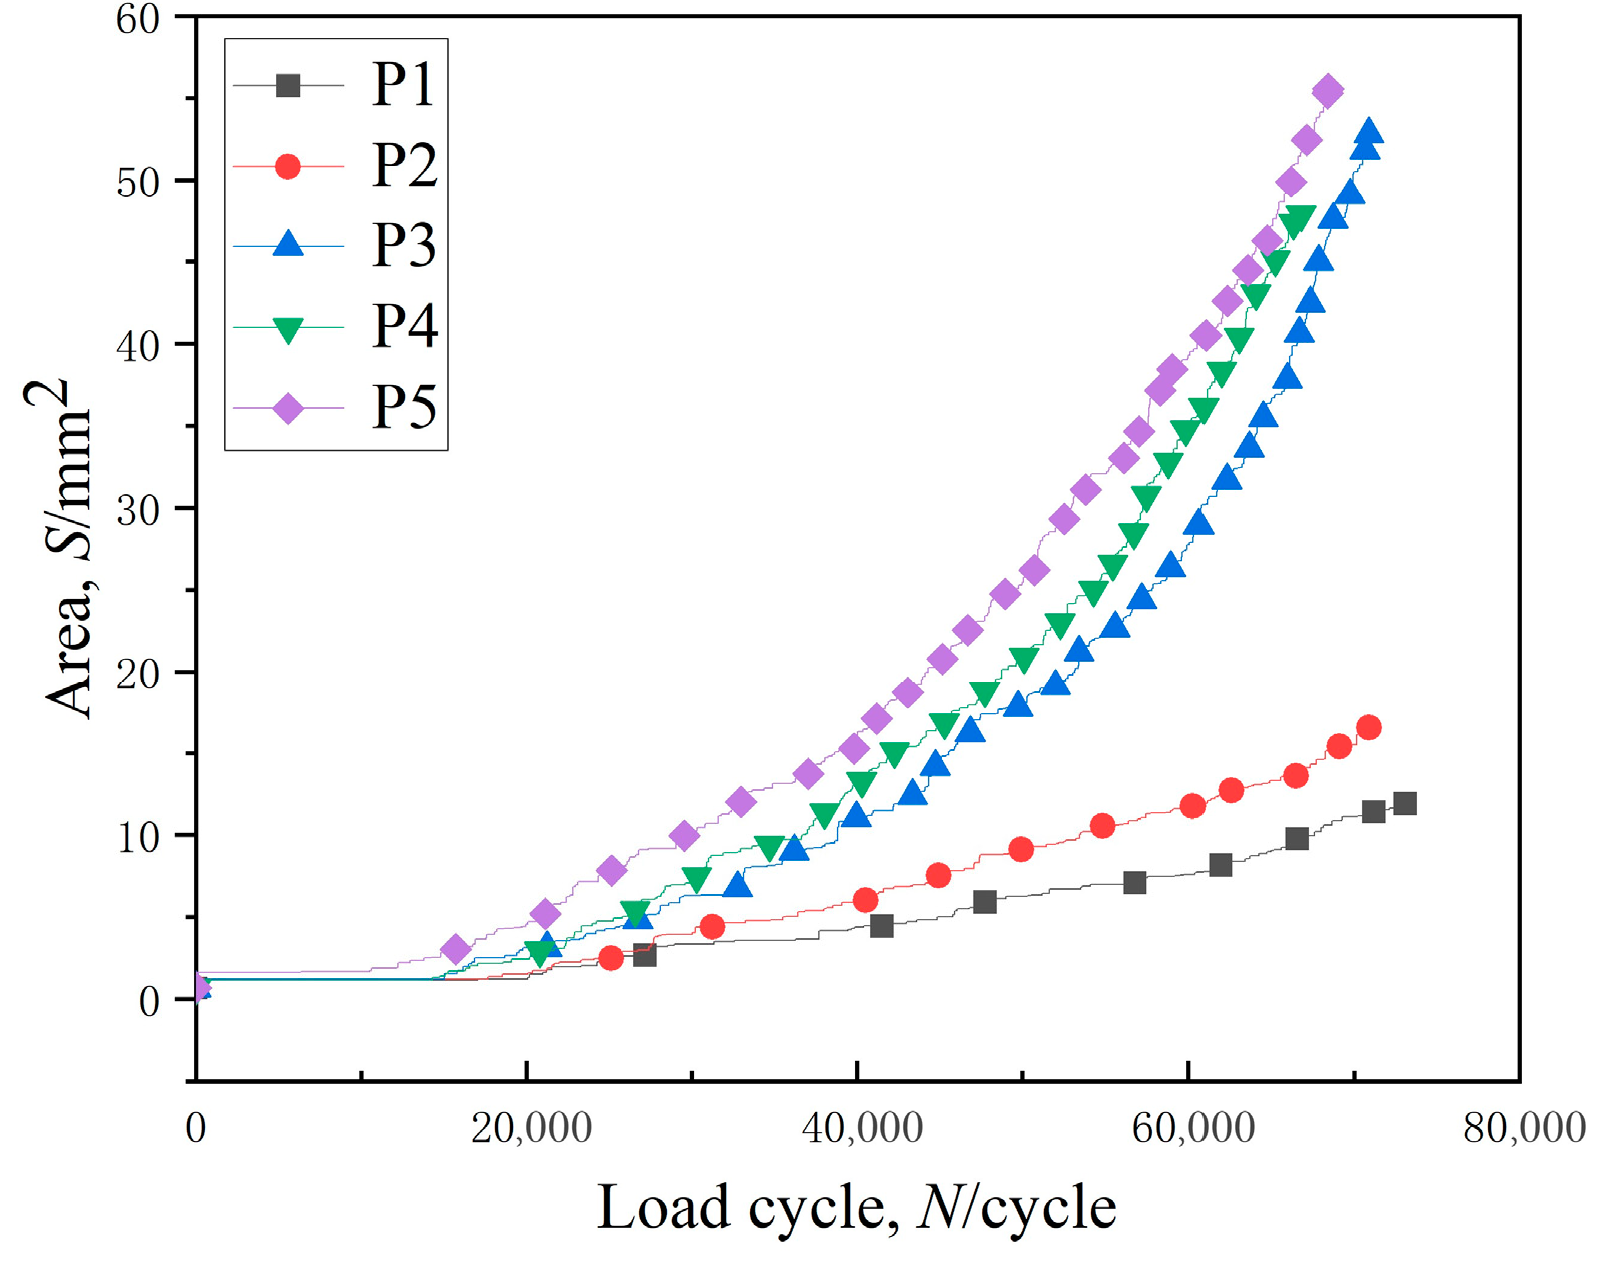
3.4. Effect of Initial Crack Location on Crack Propagation Behavior
4. Conclusions
Author Contributions
Funding
Informed Review Board Statement
Informed Consent Statement
Data Availability Statement
Conflicts of Interest
References
- Shen, G.; Xiang, D.; Zhu, K.; Jiang, L.; Shen, Y.; Li, Y. Fatigue failure mechanism of planetary gear train for wind turbine gearbox. Eng. Fail. Anal. 2018, 87, 96–110. [Google Scholar] [CrossRef]
- Liu, Y.; Shi, Z.; Liu, X.; Cheng, Z.; Zhen, D.; Gu, F. Mesh stiffness model for spur gear with opening crack considering deflection. Eng. Fail. Anal. 2022, 139, 106518. [Google Scholar] [CrossRef]
- Shao, L.; Mao, J.; Zhao, L.; Li, T. A three-dimensional deformable spheropolyhedral-based discrete element method for simulation of the whole fracture process. Eng. Fract. Mech. 2022, 263, 108290. [Google Scholar] [CrossRef]
- Kumar, S.; Singh, I.; Mishra, B. A homogenized XFEM approach to simulate fatigue crack growth problems. Comput. Struct. 2015, 150, 1–22. [Google Scholar] [CrossRef]
- Wu, W.; Li, Y.; Sun, X. Molecular dynamics simulation-based cohesive zone representation of fatigue crack growth in a single crystal nickel. Comput. Mater. Sci. 2015, 109, 66–75. [Google Scholar] [CrossRef]
- Zhang, X.Q.; Zhang, X.; Li, L.; Duan, S.W.; Li, S.Z.; Huang, Z.L.; Zhang, Y.W.; Feng, J.Y. Investigation of the influence of small hole on the fatigue crack growth path. J. Fail. Anal. Prev. 2016, 16, 391–399. [Google Scholar] [CrossRef]
- Ning, J.; Chen, Z.; Wang, Y.; Li, Y.; Zhai, W. Vibration feature of spur gear transmission with non-uniform depth distribution of tooth root crack along tooth width. Eng. Fail. Anal. 2021, 129, 105713. [Google Scholar] [CrossRef]
- Spievak, L.E.; Wawrzynek, P.A.; Ingraffea, A.R.; Lewicki, D.G. Simulating fatigue crack growth in spiral bevel gears. Eng. Fract. Mech. 2001, 68, 53–76. [Google Scholar] [CrossRef]
- Yin, S.; Zhang, N.; Liu, P.; Liu, J.; Yu, T.; Gu, S.; Cong, Y. Dynamic fracture analysis of the linearly uncoupled and coupled physical phenomena by the variable-node multiscale XFEM. Eng. Fract. Mech. 2021, 254, 107941. [Google Scholar] [CrossRef]
- Shi, F.; Wang, D.; Yang, Q. An XFEM-based numerical strategy to model three-dimensional fracture propagation regarding crack front segmentation. Theor. Appl. Fract. Mech. 2022, 118, 103250. [Google Scholar] [CrossRef]
- Wang, Y.; Shao, Y.; Chen, J.; Liang, H. Accurate and efficient hydrodynamic analysis of structures with sharp edges by the Extended Finite Element Method (XFEM): 2D studies. Appl. Ocean Res. 2021, 117, 102893. [Google Scholar] [CrossRef]
- Belytschko, T.; Black, T. Elastic crack growth in finite elements with minimal remeshing. Int. J. Numer. Methods Eng. 1999, 45, 601–620. [Google Scholar] [CrossRef]
- Wei, Y.; Jiang, Y. Fatigue fracture analysis of gear teeth using XFEM. Trans. Nonferrous Met. Soc. China 2019, 29, 2099–2108. [Google Scholar] [CrossRef]
- Verma, J.; Kumar, S.; Kankar, P. Crack growth modeling in spur gear tooth and its effect on mesh stiffness using extended finite element method. Eng. Fail. Anal. 2018, 94, 109–120. [Google Scholar] [CrossRef]
- Dyskin, A.V.; Sahouryeh, E.; Jewell, R.J.; Joer, H.; Ustinov, K.B. Ustinov, Influence of shape and locations of initial 3-D cracks on their growth in uniaxial compression. Eng. Fract. Mech. 2003, 70, 2115–2136. [Google Scholar] [CrossRef]
- Moes, N.; Dolbow, J.; Belytschko, T. A finite element method for crack growth without remeshing. Int. J. Numer. Methods Eng. 1999, 46, 131–150. [Google Scholar] [CrossRef]
- Chen, Z.; Bao, H.; Dai, Y.; Liu, Y. Numerical prediction based on XFEM for mixed-mode crack growth path and fatigue life under cyclic overload. Int. J. Fatigue 2022, 162, 106943. [Google Scholar] [CrossRef]
- Deng, H.; Yan, B.; Okabe, T. Fatigue crack propagation simulation method using XFEM with variable-node element. Eng. Fract. Mech. 2022, 269, 108533. [Google Scholar] [CrossRef]
- Wang, X.; Yang, Y.; Wang, W.; Chi, W. Simulating coupling behavior of spur gear meshing and fatigue crack propagation in tooth root. Int. J. Fatigue 2020, 134, 105381. [Google Scholar] [CrossRef]
- Paluskiewicz, S.; Muhlstein, C. Mode I crack growth in paper exhibits three stages of strain evolution in reaching steady-state. Theor. Appl. Fract. Mech. 2022, 118, 103279. [Google Scholar] [CrossRef]
- Alneasan, M.; Behnia, M. Strain rate effects on the crack propagation speed under different loading modes (I, II and I/II): Experimental investigations. Eng. Fract. Mech. 2021, 258, 108118. [Google Scholar] [CrossRef]
- Wu, J.; Yang, Y.; Wang, P.; Wang, J.; Cheng, J. A novel method for gear crack fault diagnosis using improved analytical-FE and strain measurement. Measurement 2020, 163, 107936. [Google Scholar] [CrossRef]
- Xing, Z.; Wang, Z.; Wang, H.; Shan, D. Bending fatigue behaviors analysis and fatigue life prediction of 20Cr2Ni4 gear steel with different stress concentrations near non-metallic inclusions. Materials 2019, 12, 3443. [Google Scholar] [CrossRef]
- Chen, W.; He, X.; Yu, W.; Shi, J.; Wang, M.; Yao, K. Characterization of the microstructure and hardness of case-carburized gear steel. Micron 2021, 144, 103028. [Google Scholar] [CrossRef] [PubMed]
- Wang, Z.; Xing, Z.; Wang, H.; Shan, D.; Huang, Y.; Xu, Z.; Xie, F. The relationship between inclusions characteristic parameters and bending fatigue performance of 20Cr2Ni4A gear steel. Int. J. Fatigue 2022, 155, 106594. [Google Scholar] [CrossRef]
- Calvín, G.; Escalero, M.; Zabala, H.; Muñiz-Calvente, M. Distribution of the through-thickness effective stress intensity factor range and its influence on fatigue crack growth rate curves. Theor. Appl. Fract. Mech. 2022, 119, 103374. [Google Scholar] [CrossRef]
- Pang, K.; Yuan, H. Assessment of three-dimensional multi-crack propagation for fatigue life prediction. Int. J. Press. Vessel. Pip. 2022, 198, 104660. [Google Scholar] [CrossRef]
- Mahdavi, E.; Aliha, M.R.M.; Bahrami, B.; Ayatollahi, M.R. Comprehensive data for stress intensity factor and critical crack length in chevron notched semi-circular bend specimen subjected to tensile type fracture mode. Theor. Appl. Fract. Mech. 2020, 106, 102466. [Google Scholar] [CrossRef]


| Parameter | Value |
|---|---|
| Number of teeth | 23 |
| Normal modulus/mm | 4 |
| Pressure angle/° | 20 |
| Gear width/mm | 34 |
| Material | 20Cr2Ni4A |
| Poison ratio | 0.3 |
| Elastic modulus/GPa | 206 |
| C1 | 0.001 |
| C2 | 0 |
| C3 | 1.24 × 10⁻⁴ |
| C4 | 1.03 |
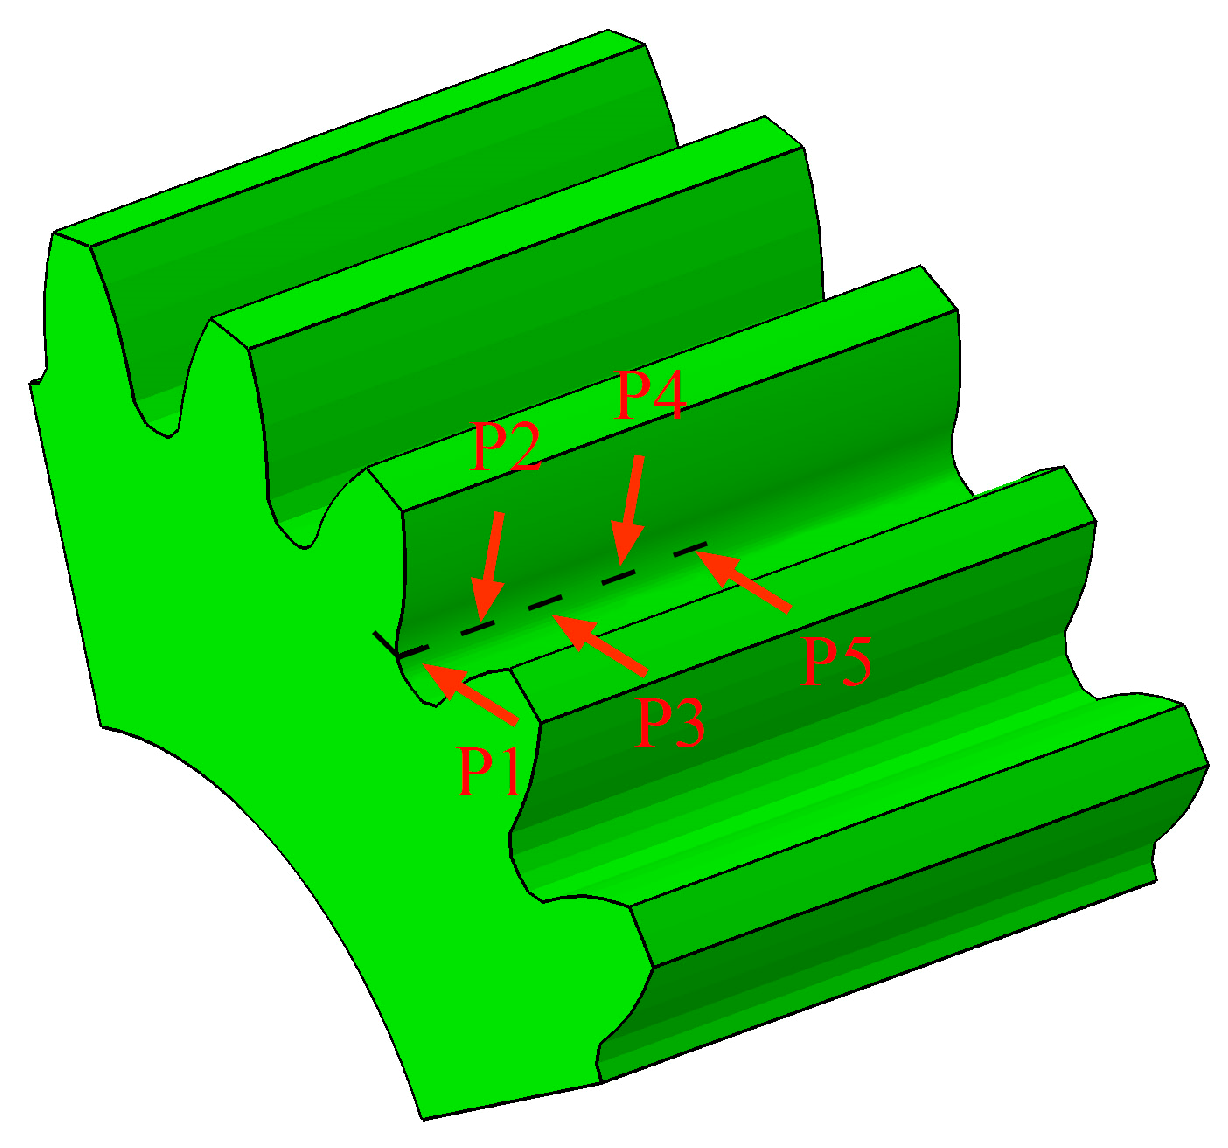
| Crack Location | P1 | P2 | P3 | P4 | P5 |
|---|---|---|---|---|---|
| Distance from the end face/mm | 0 | 4.2 | 8.3 | 12.4 | 16.5 |
| C | Cr | Ni | Mn | Si | Fe |
|---|---|---|---|---|---|
| 0.15~0.19 | 1.25~1.65 | 3.25~3.65 | 0.30~0.60 | 0.17~0.37 | Bal. |
| Position of Strain Gauge | Position 1 | Position 2 | Position 3 | Position 4 |
|---|---|---|---|---|
| a/mm | 9.1 | 6.56 | 7.0 | 9.1 |
| b/mm | 0 | 8.5 | 24 | 34 |
| Maximum Load/kN | Mean Load/kN | Alternating Load/kN | Loading Frequency/Hz | Stress Ratio | Maximum Root Bending Stress /MPa |
|---|---|---|---|---|---|
| 40 | 20.8 | 19.2 | 100 | 0.04 | 639 |
| Initial Crack Location | P1 | P2 | P3 | P4 | P5 |
|---|---|---|---|---|---|
| Distance from the end face/mm | 2.8 | 4.0 | 12.1 | 15.3 | 17.1 |
Disclaimer/Publisher’s Note: The statements, opinions and data contained in all publications are solely those of the individual author(s) and contributor(s) and not of MDPI and/or the editor(s). MDPI and/or the editor(s) disclaim responsibility for any injury to people or property resulting from any ideas, methods, instructions or products referred to in the content. |
© 2023 by the authors. Licensee MDPI, Basel, Switzerland. This article is an open access article distributed under the terms and conditions of the Creative Commons Attribution (CC BY) license (https://creativecommons.org/licenses/by/4.0/).
Share and Cite
Zhang, Y.; Tang, Z.; Zhao, L.; Gong, B.; Wang, G.; Li, Z. Effect of Initial Crack Position on Crack Propagation Behaviors of Heavy-Duty Transmission Gear. Materials 2023, 16, 5961. https://doi.org/10.3390/ma16175961
Zhang Y, Tang Z, Zhao L, Gong B, Wang G, Li Z. Effect of Initial Crack Position on Crack Propagation Behaviors of Heavy-Duty Transmission Gear. Materials. 2023; 16(17):5961. https://doi.org/10.3390/ma16175961
Chicago/Turabian StyleZhang, Yingtao, Zirong Tang, Lijuan Zhao, Benxiang Gong, Gang Wang, and Zhichao Li. 2023. "Effect of Initial Crack Position on Crack Propagation Behaviors of Heavy-Duty Transmission Gear" Materials 16, no. 17: 5961. https://doi.org/10.3390/ma16175961