
Comparative Analysis of Reinforced Asphalt Concrete Overlays: Effects of Thickness and Temperature


Abstract
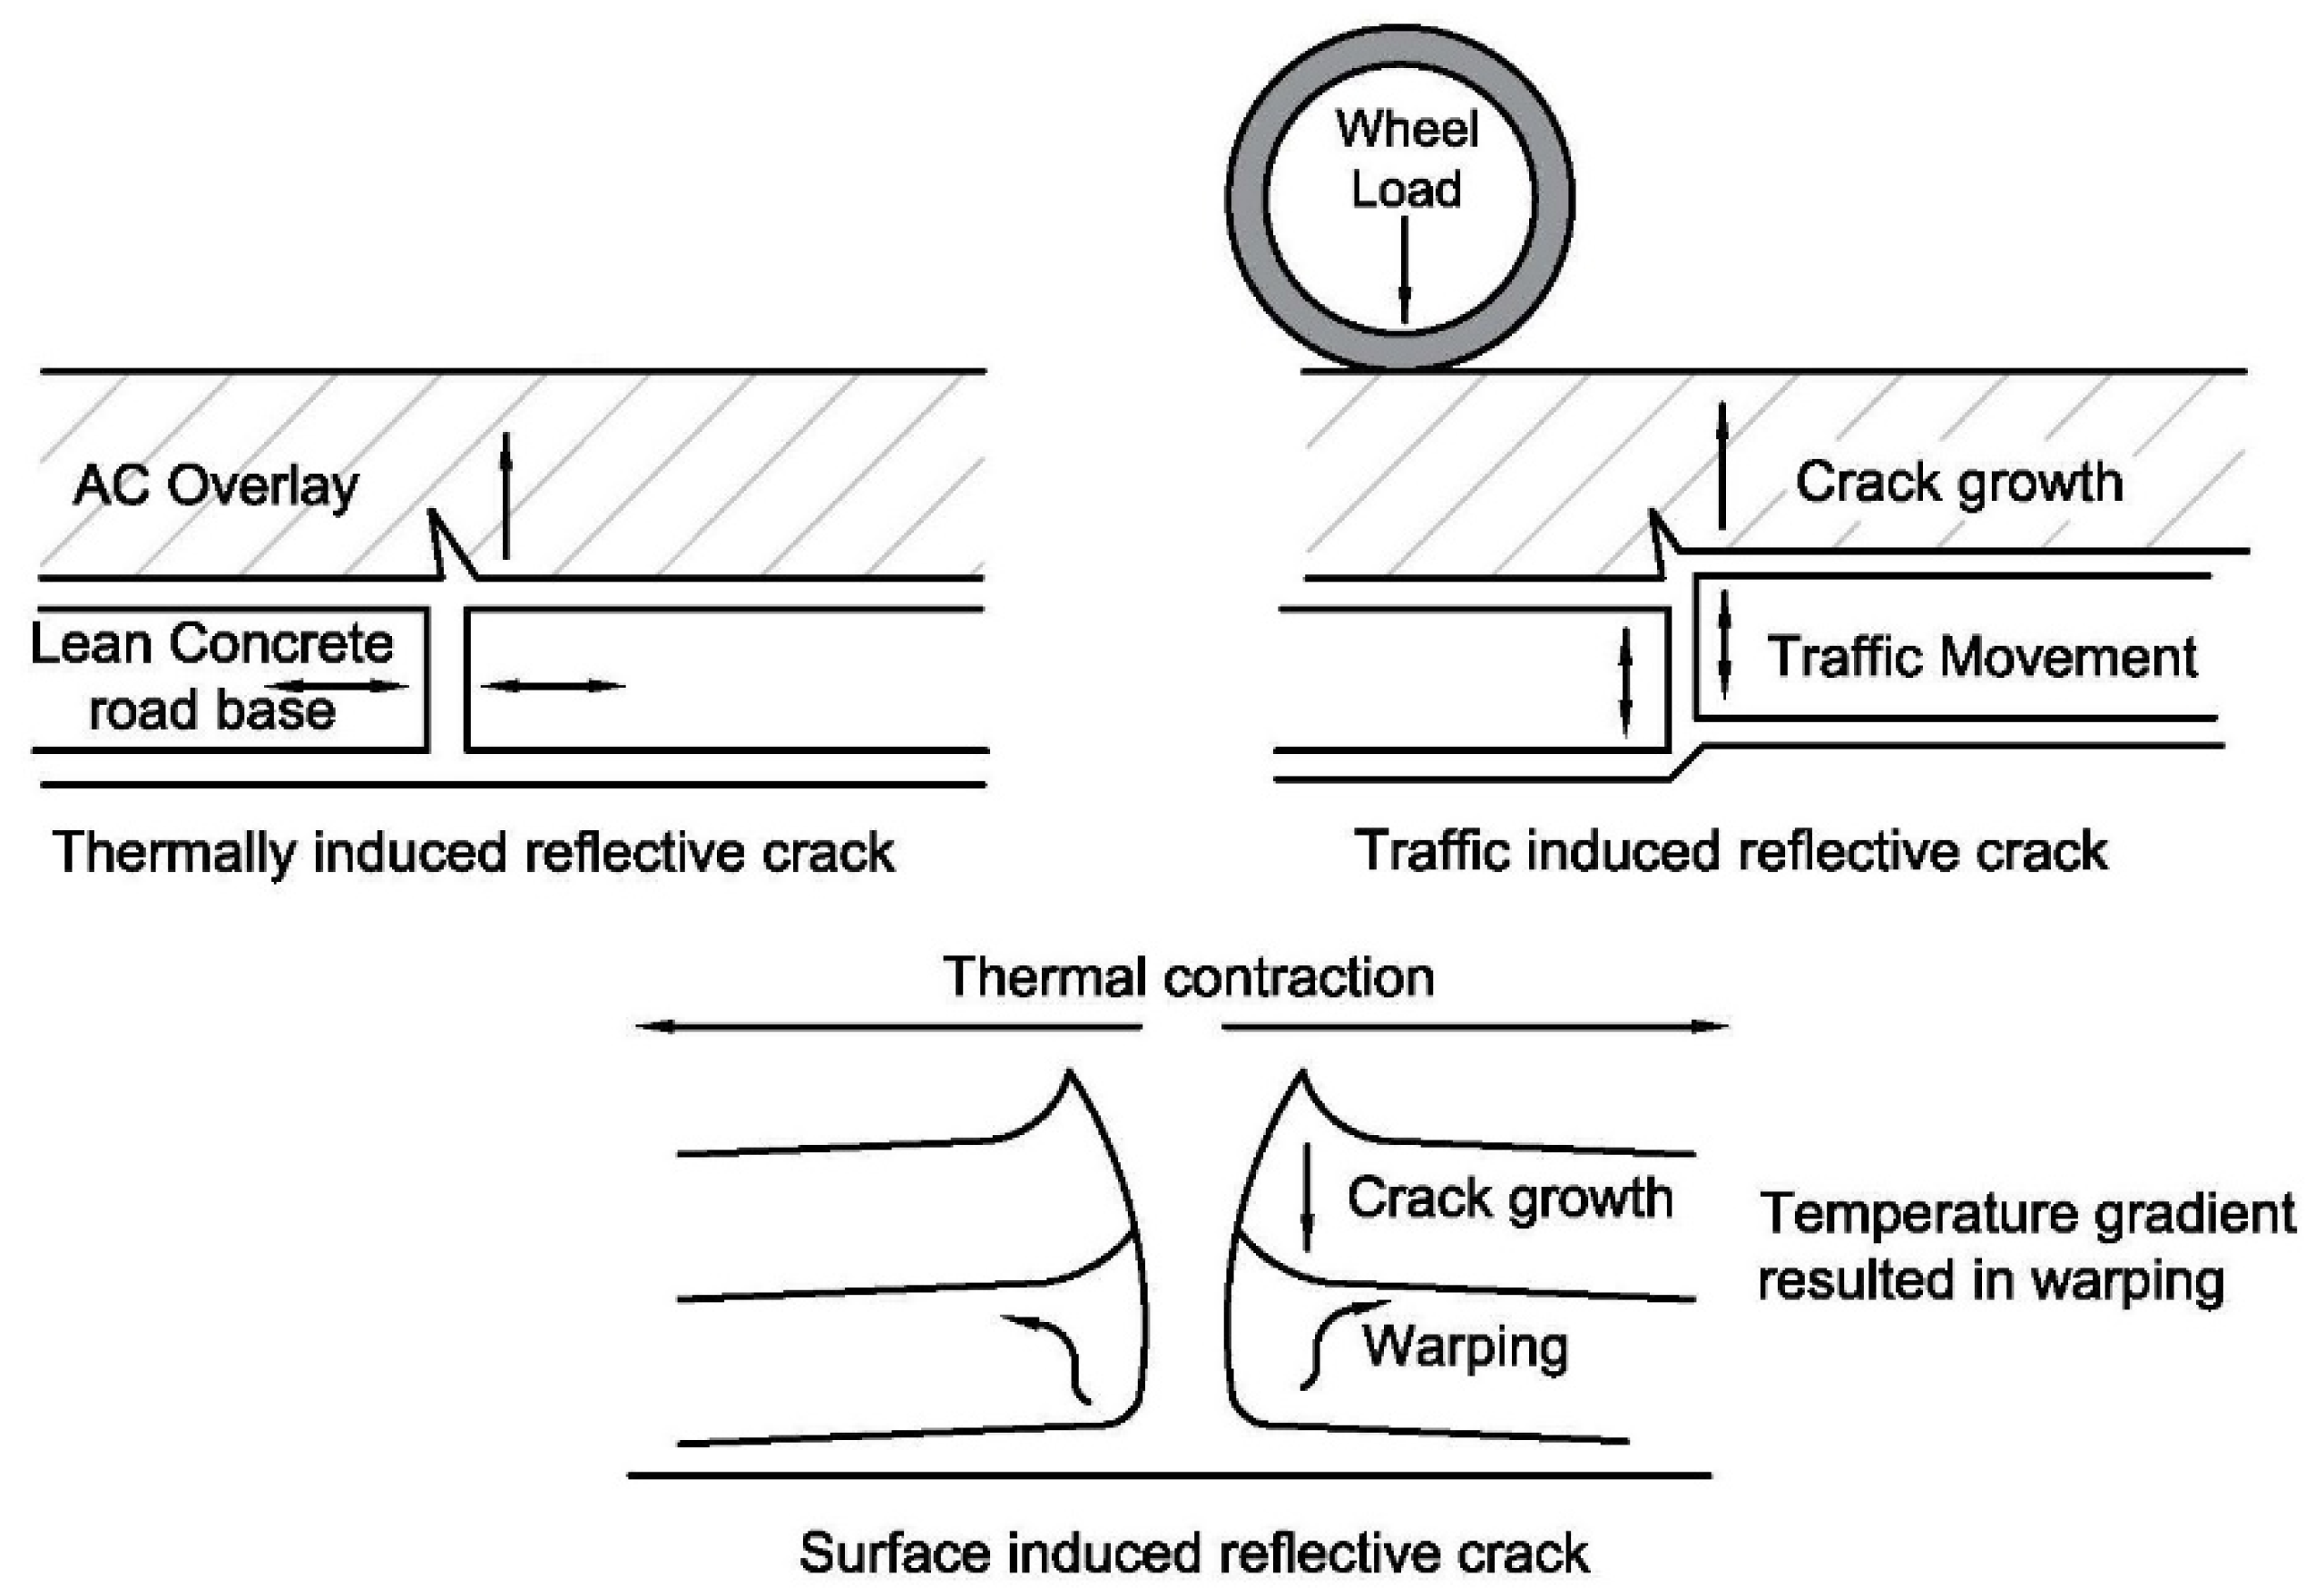
:1. Introduction
2. Materials and Testing Methods
2.1. Materials
2.1.1. Asphalt Cement
2.1.2. Aggregate
2.1.3. Mineral Filler
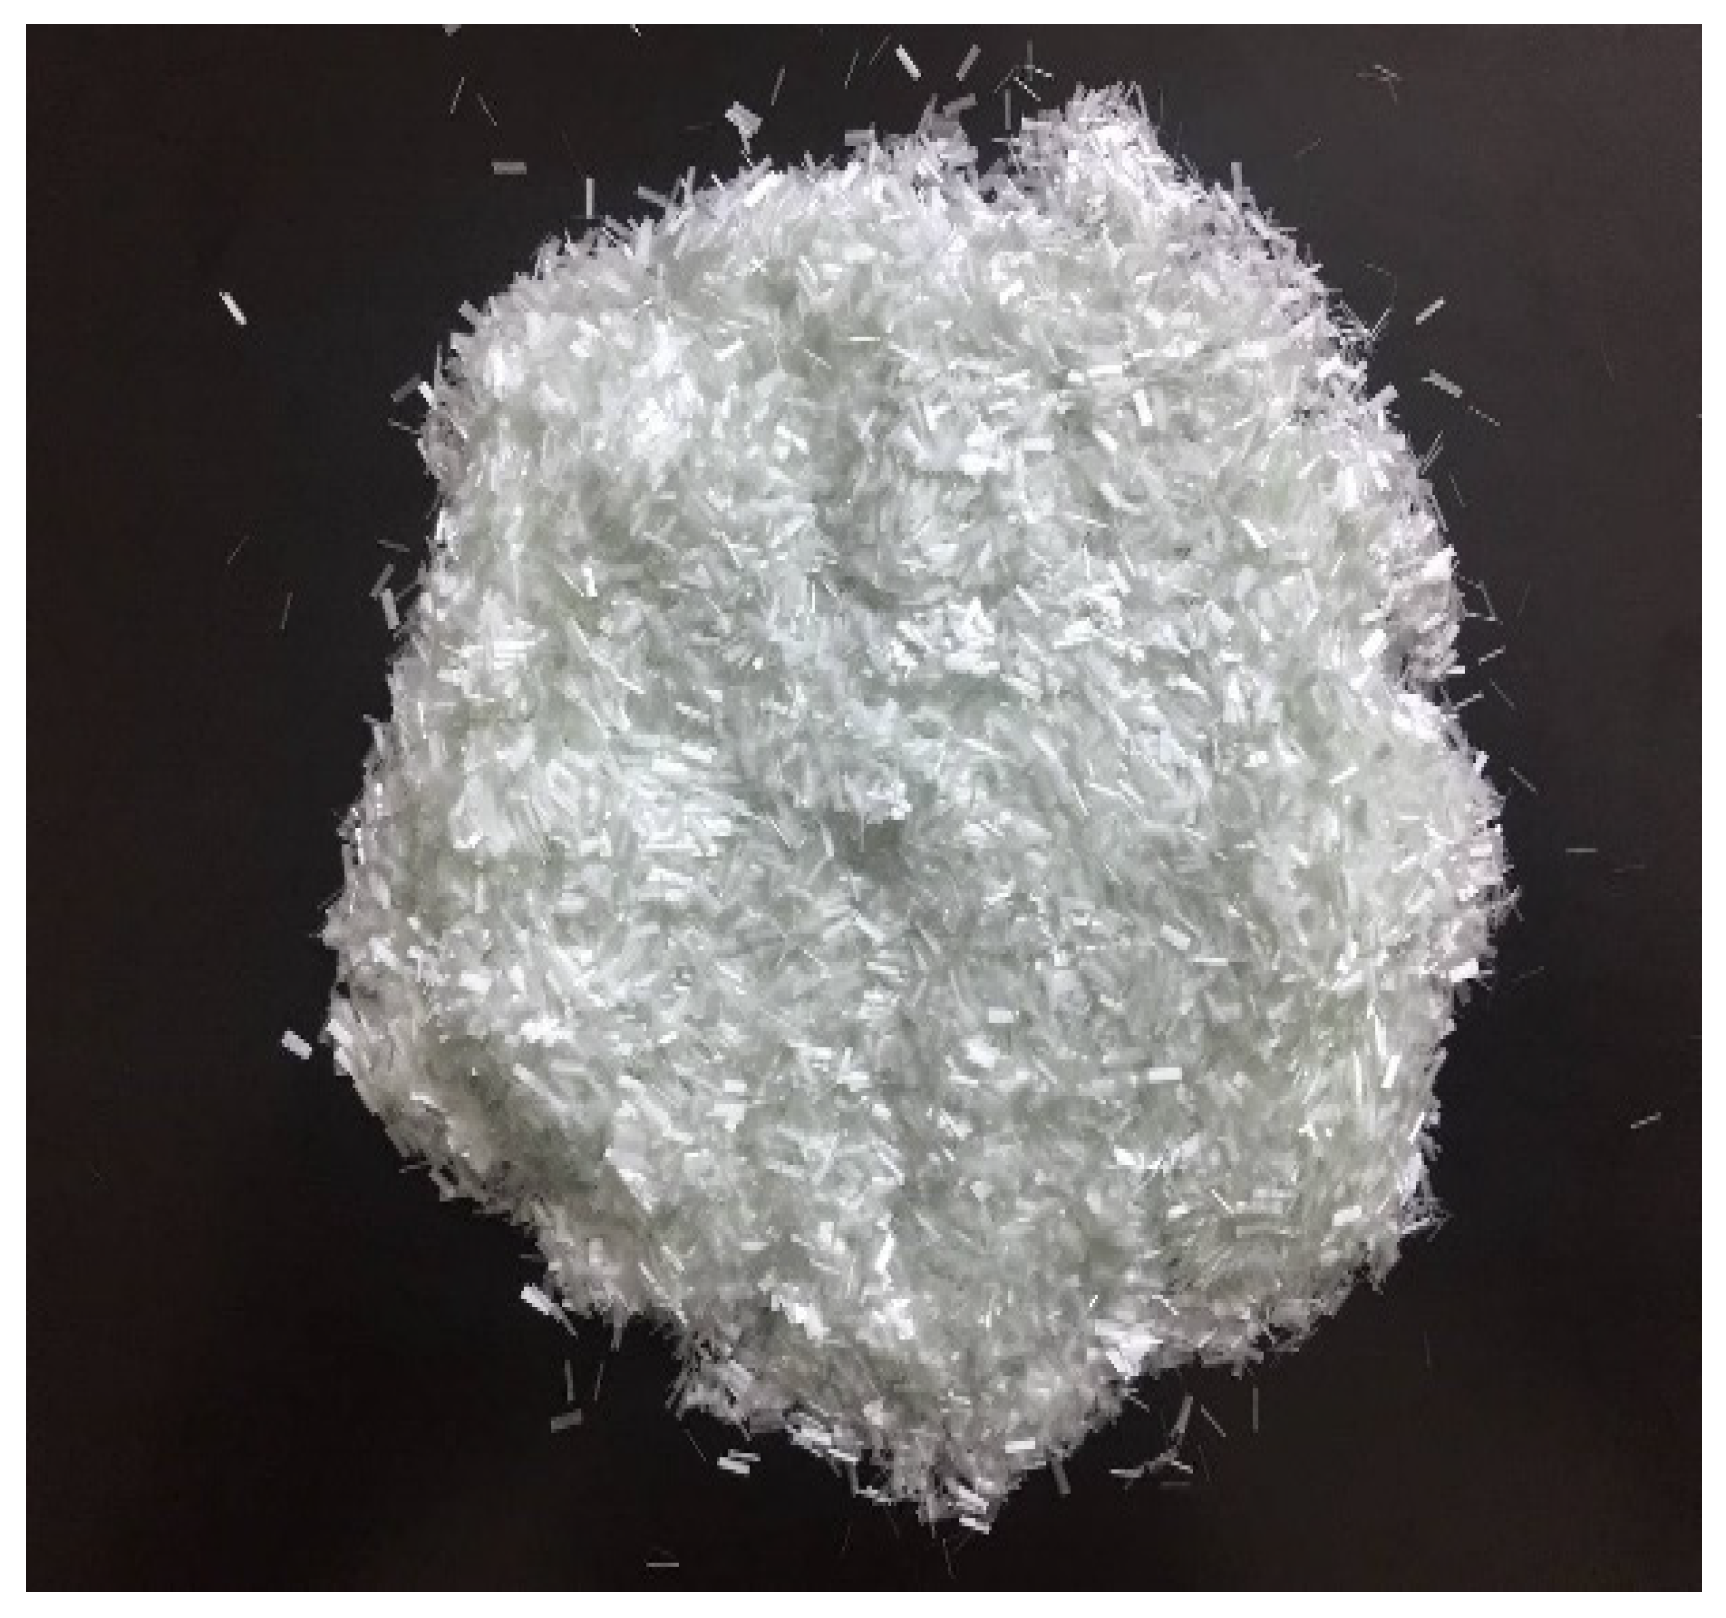
2.1.4. Chopped Fiber
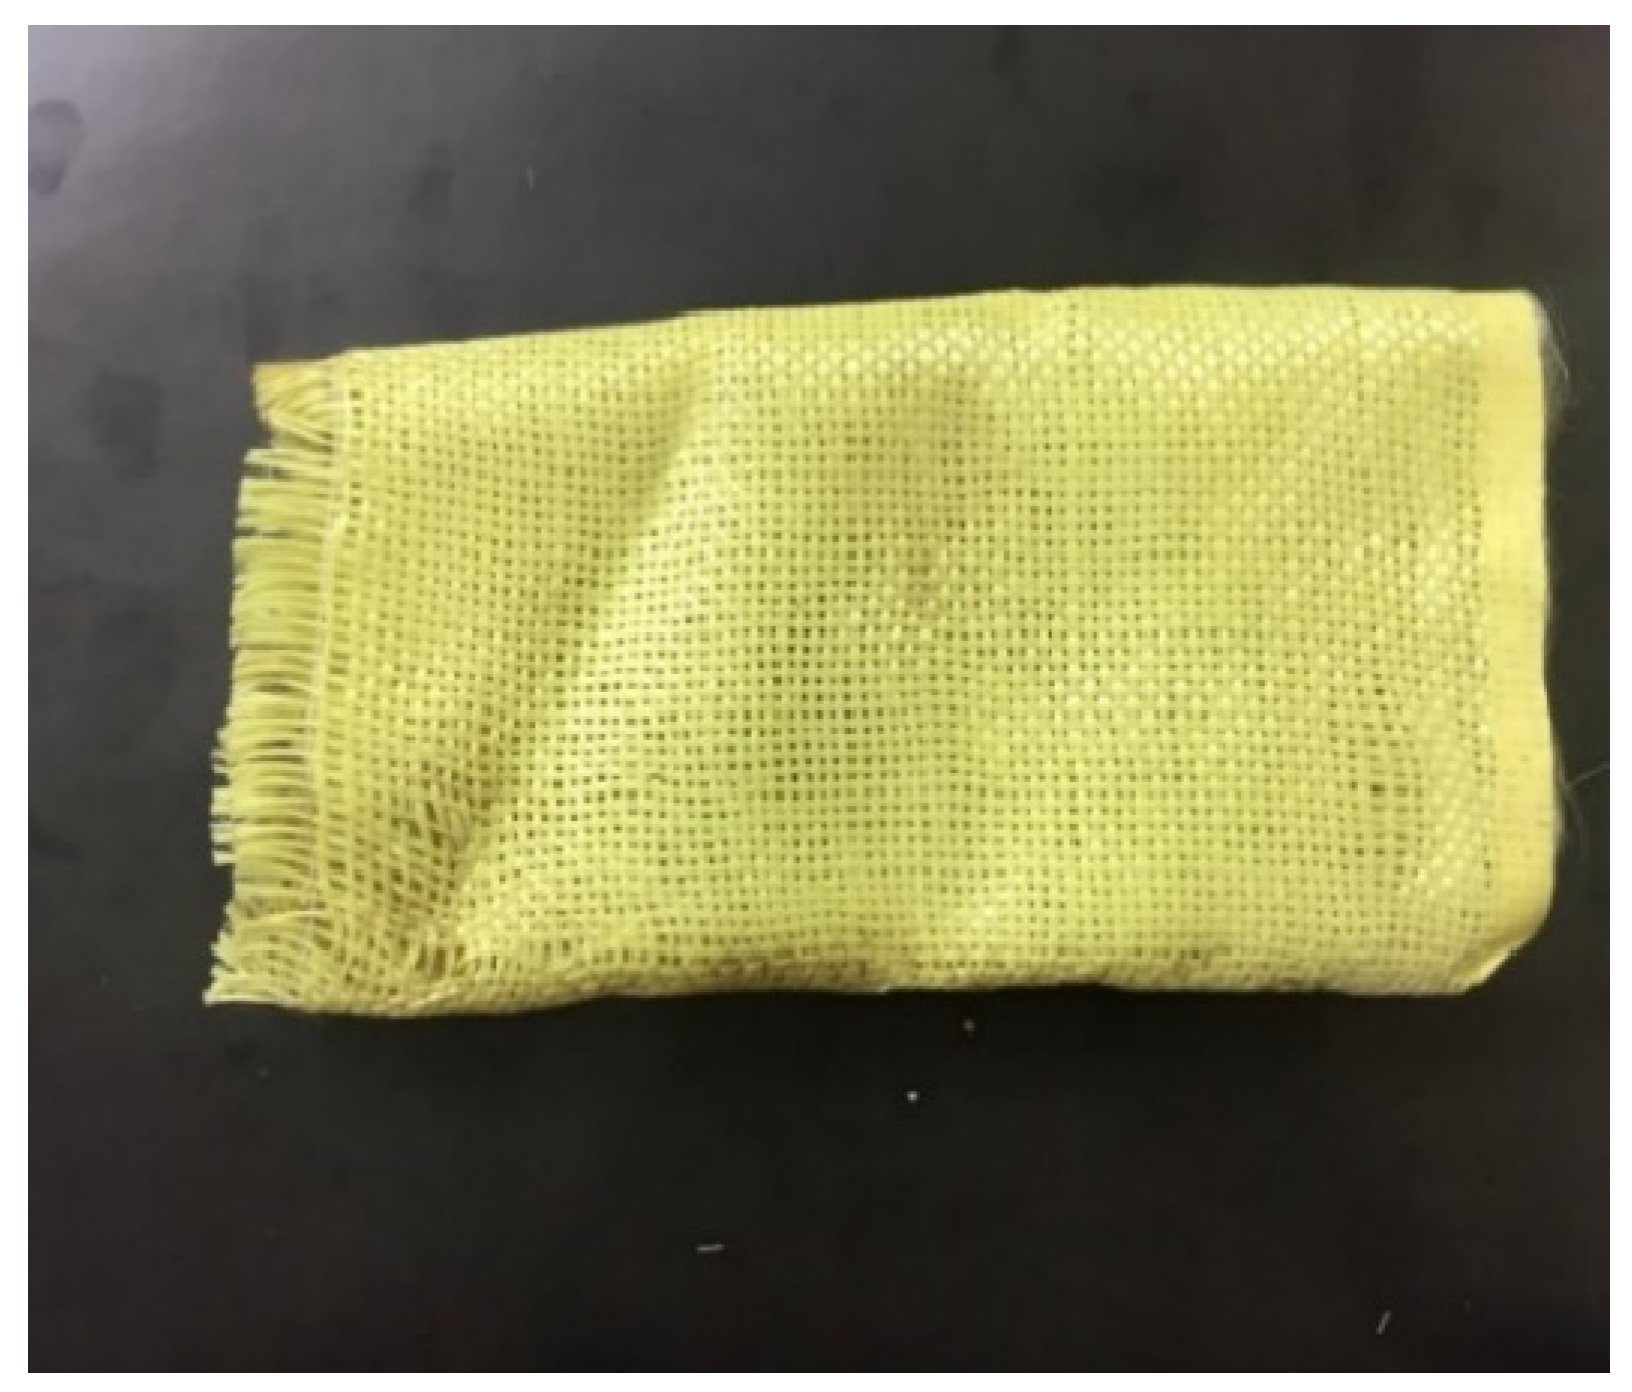
2.1.5. Geotextile
2.2. Mix Preparation and Specimen Legend
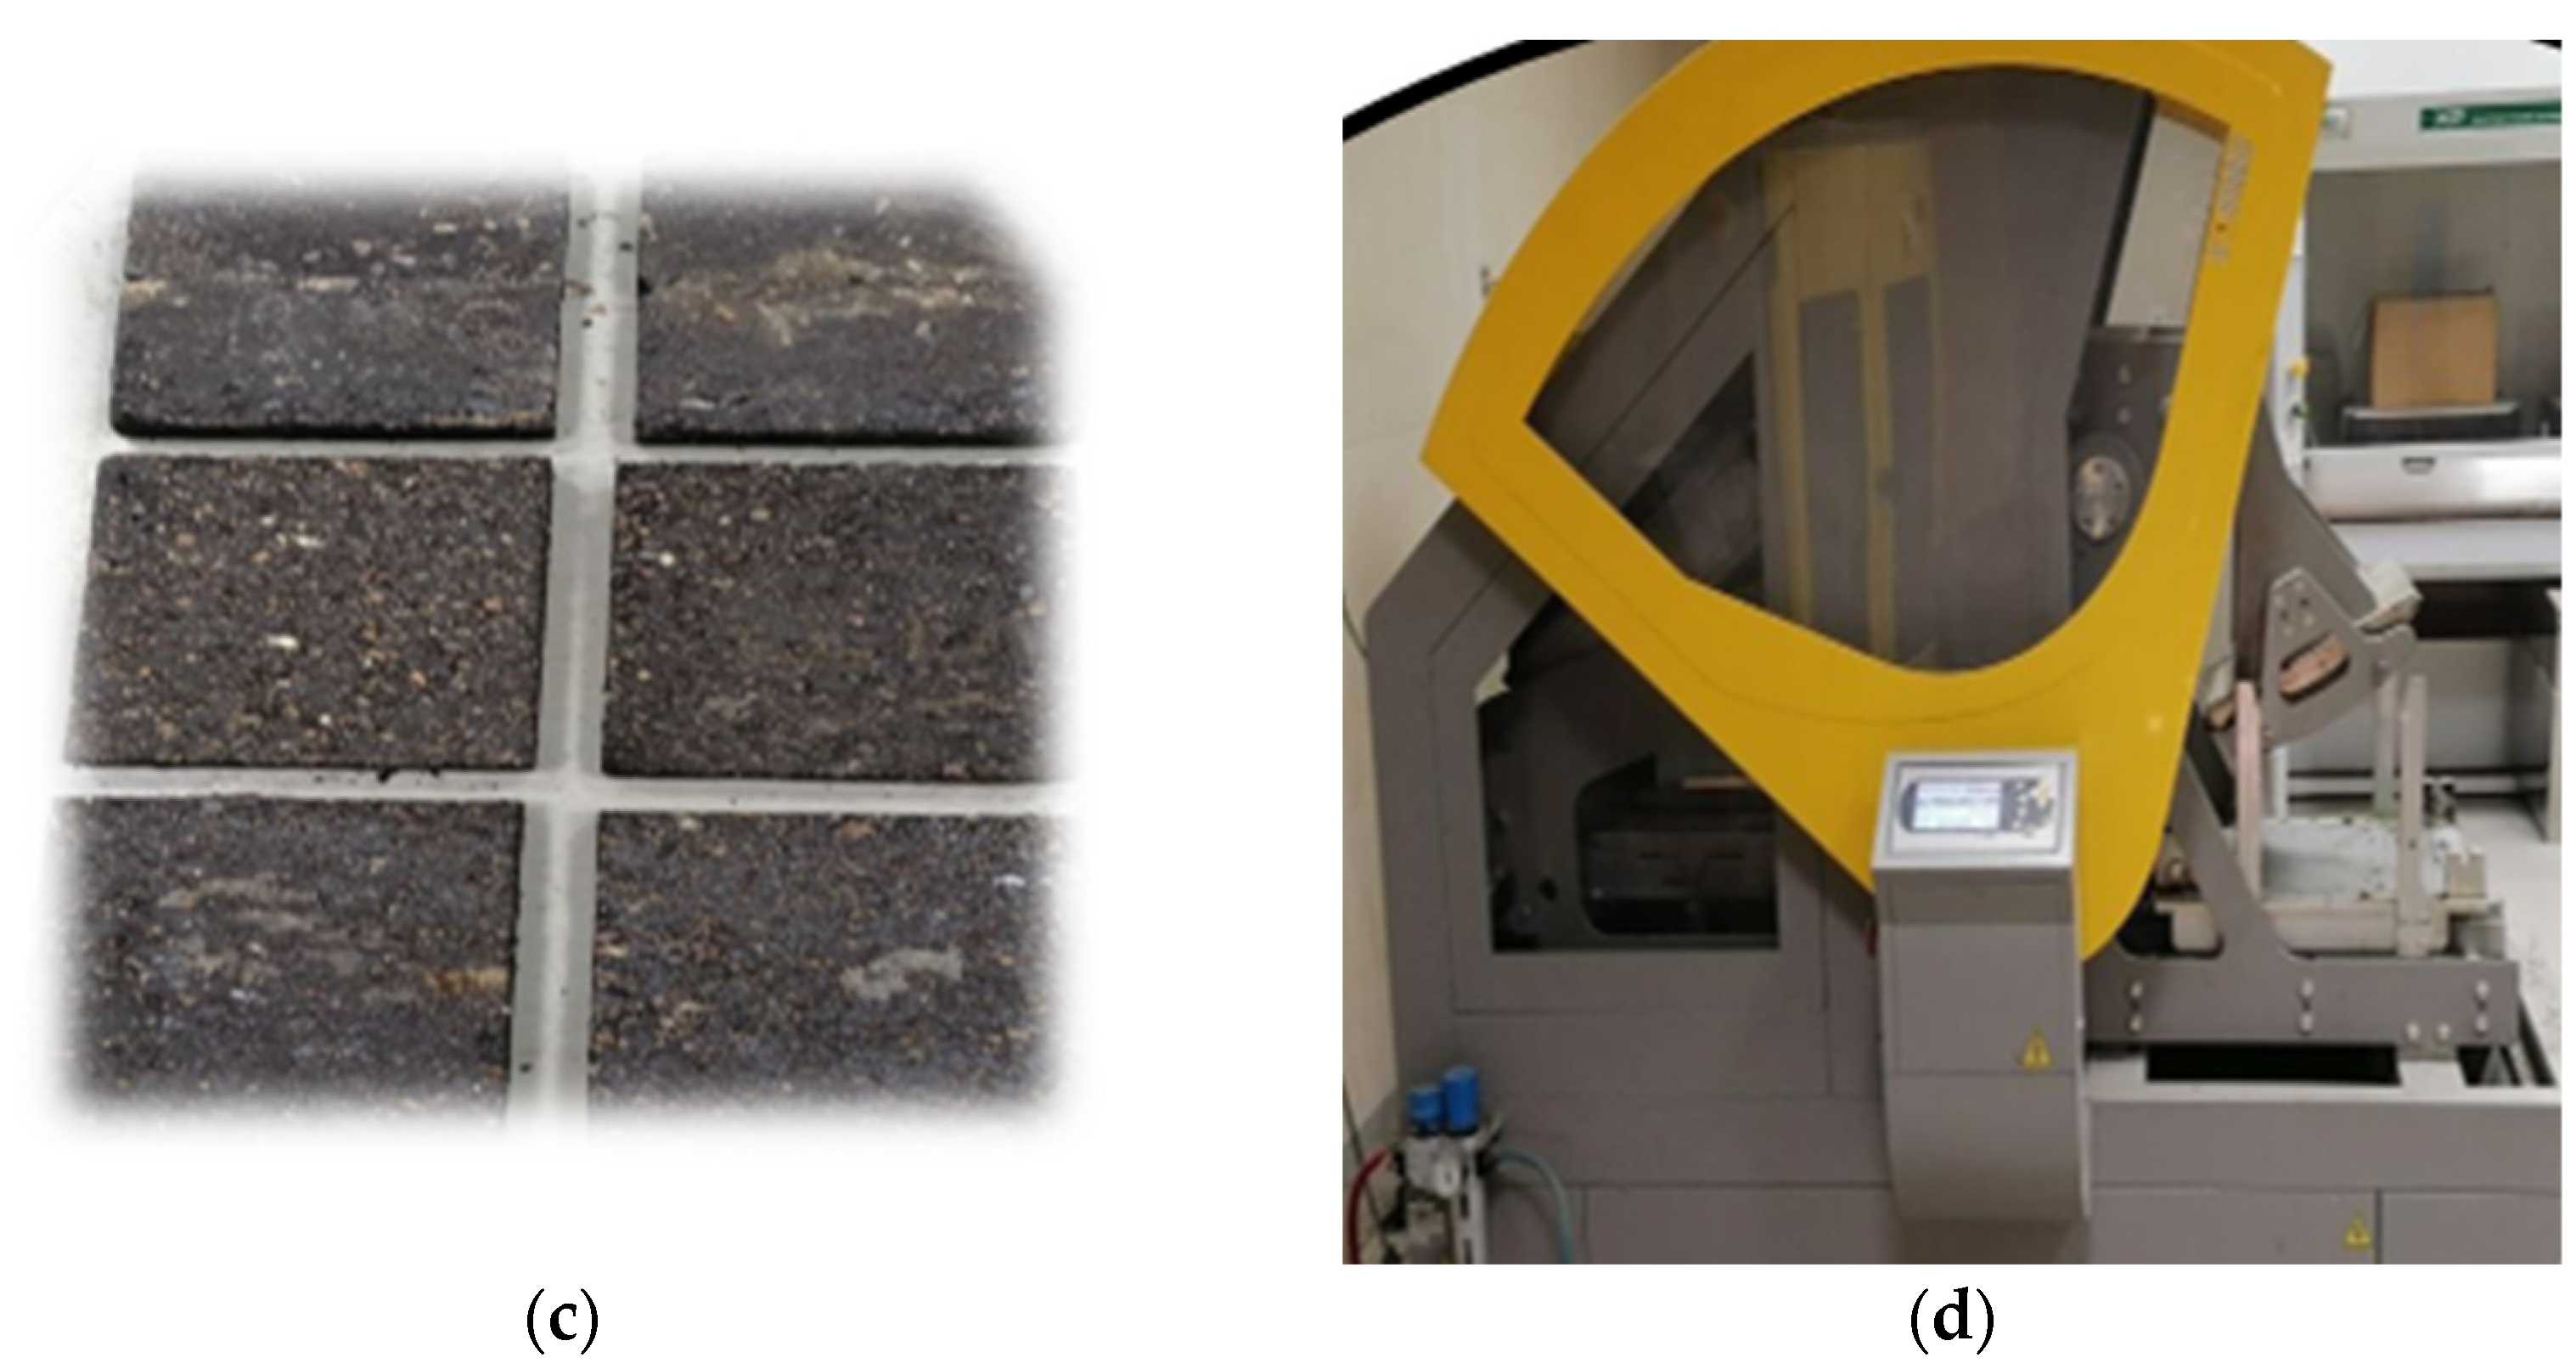
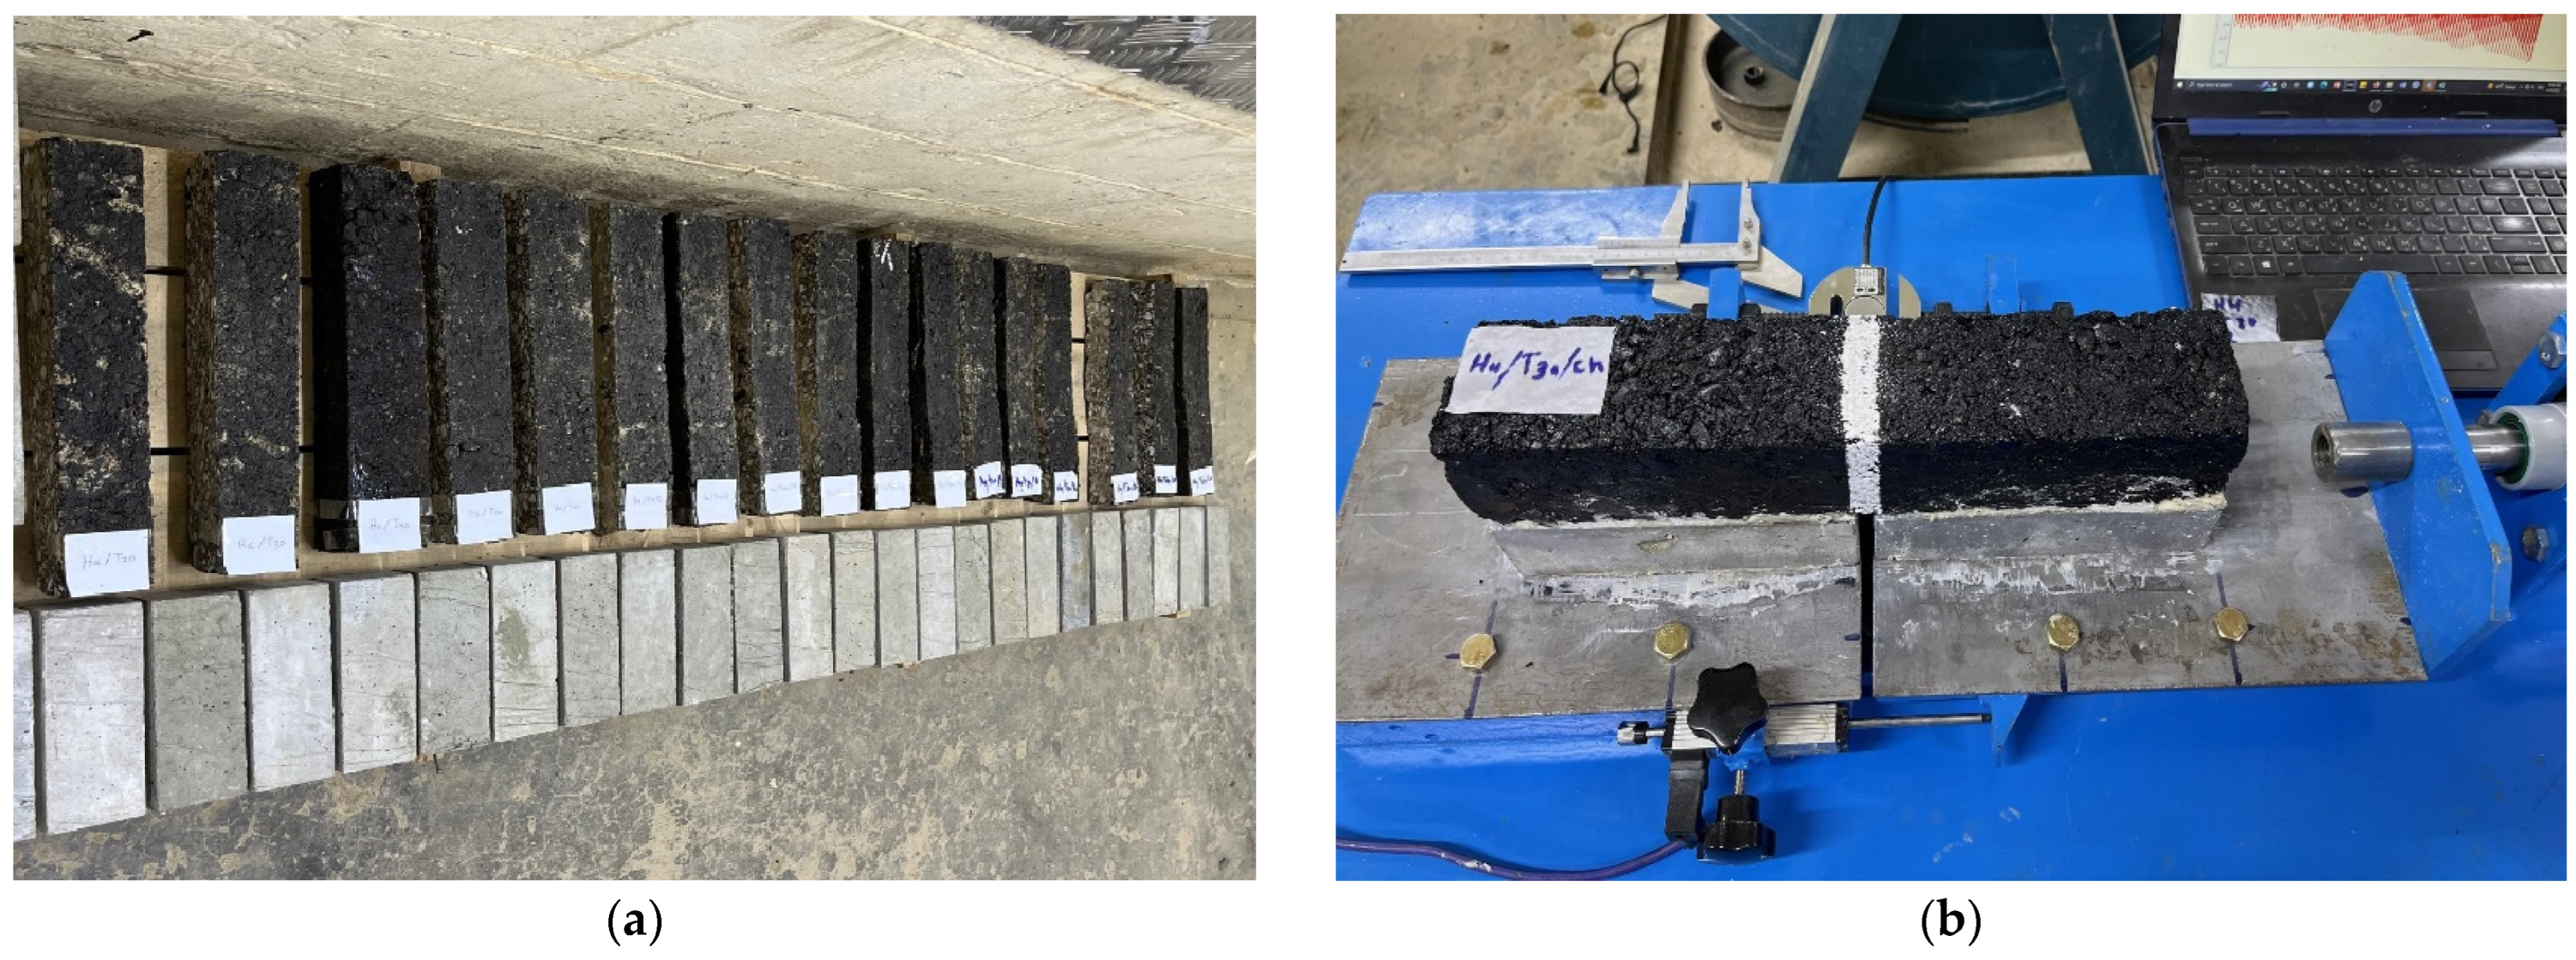
2.3. Testing Methods
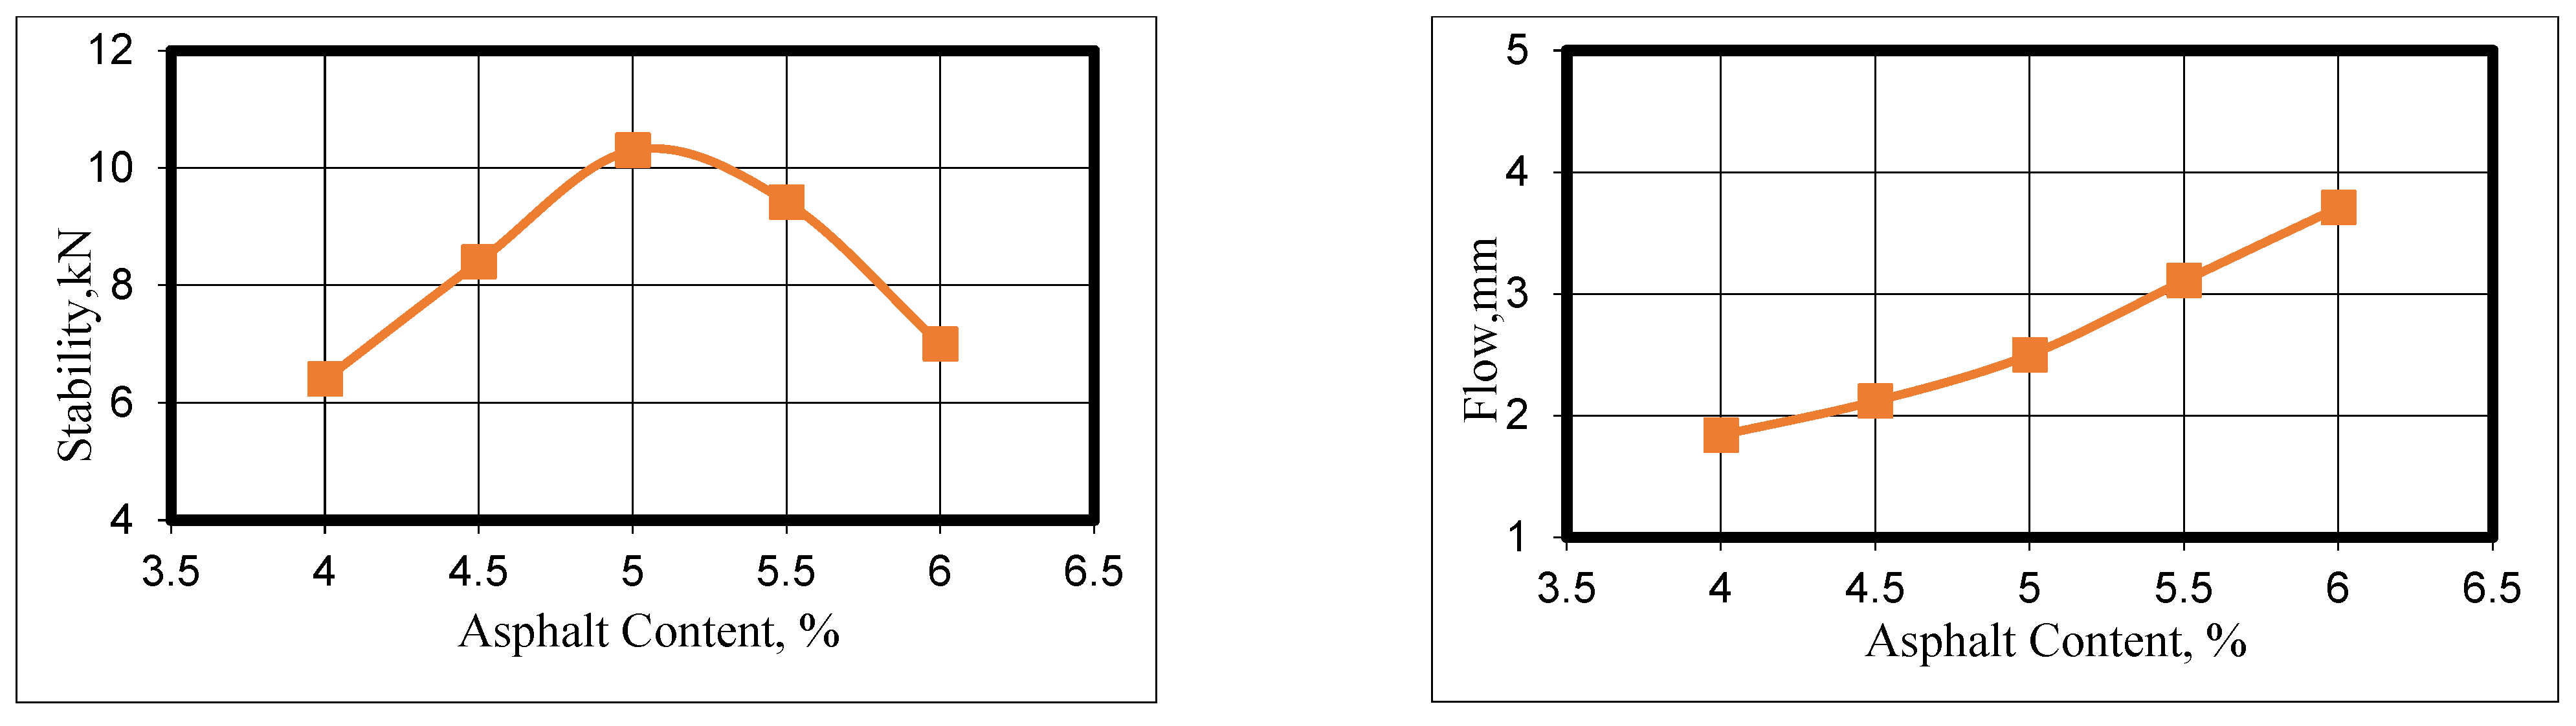
- Marshall test
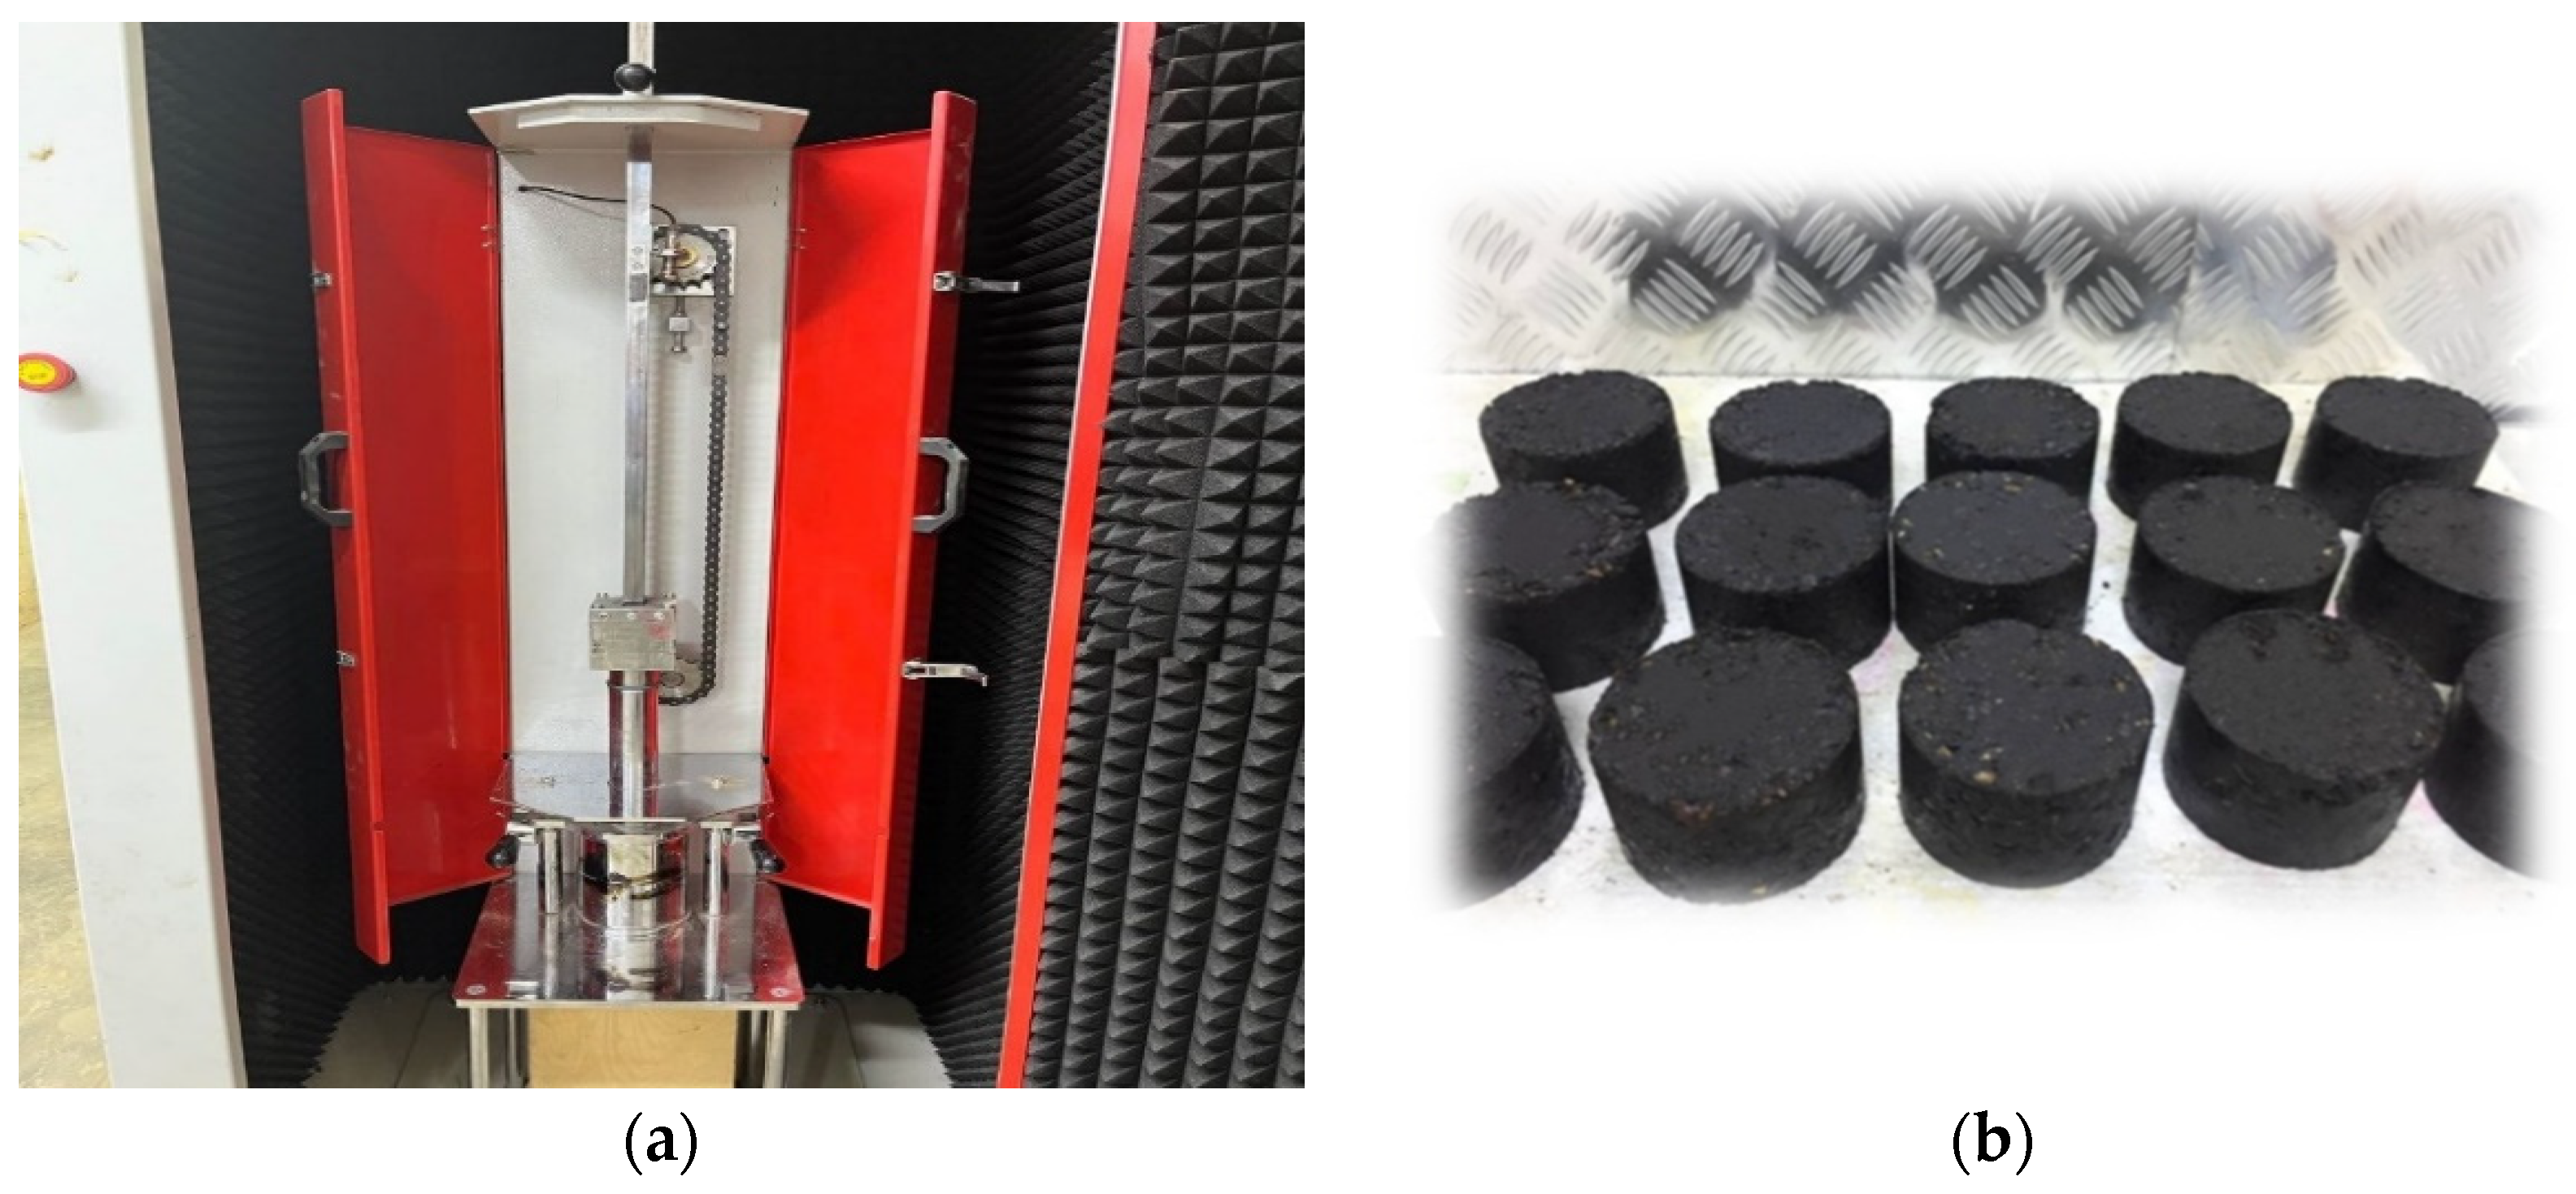
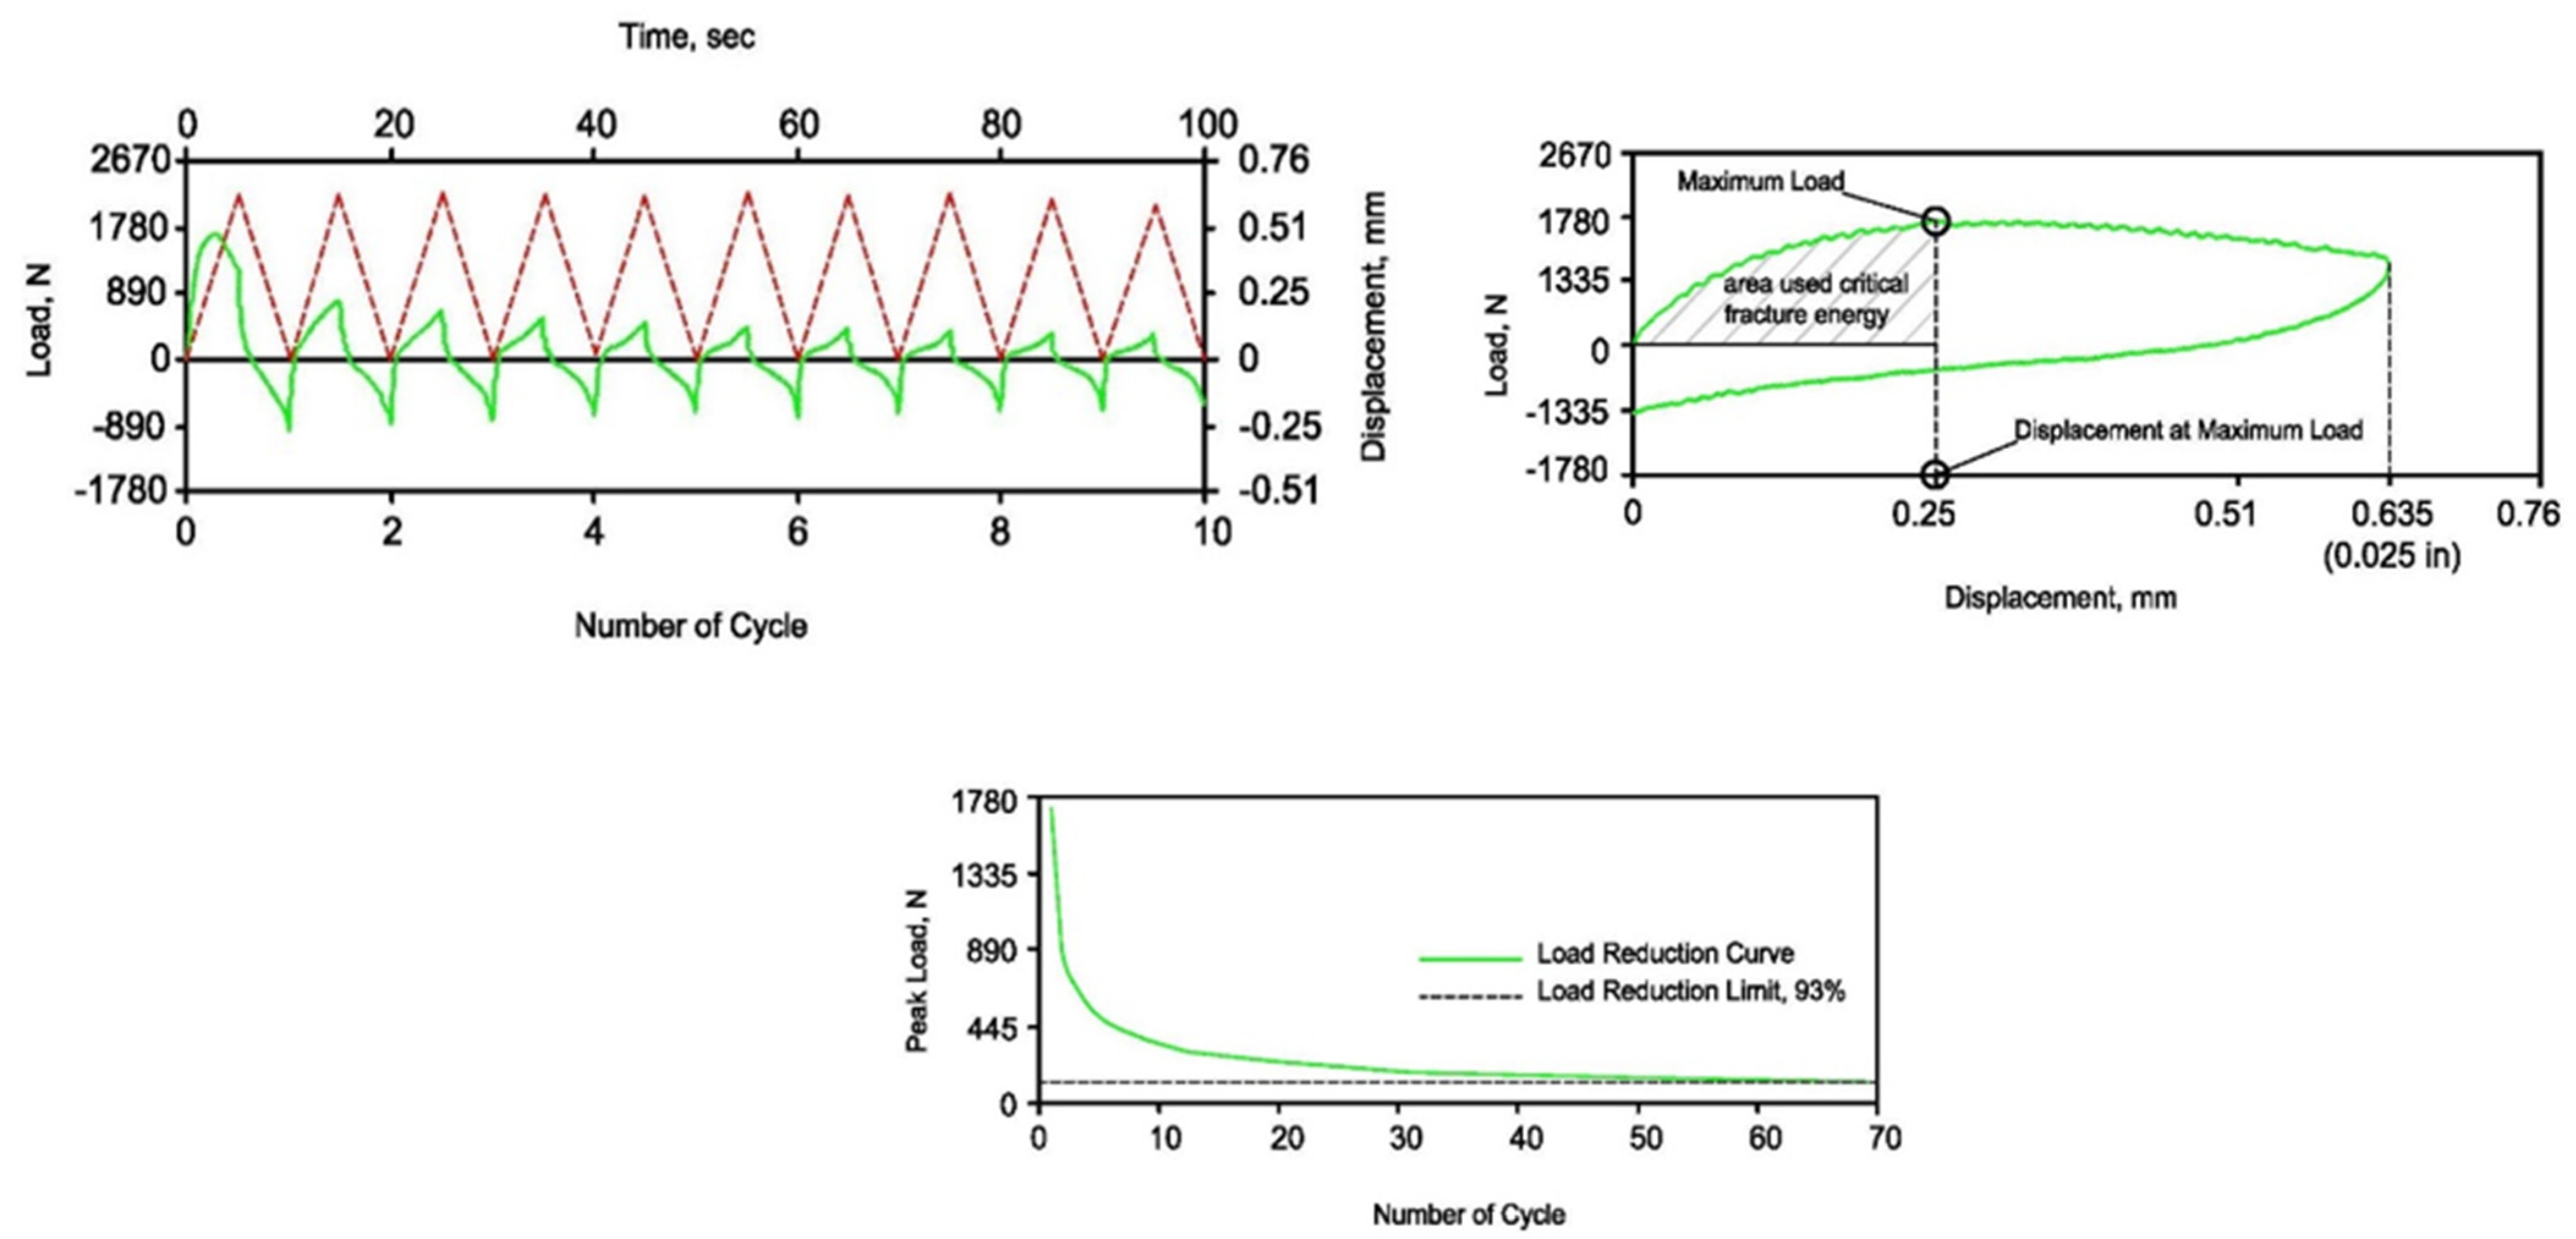
- Overlay test
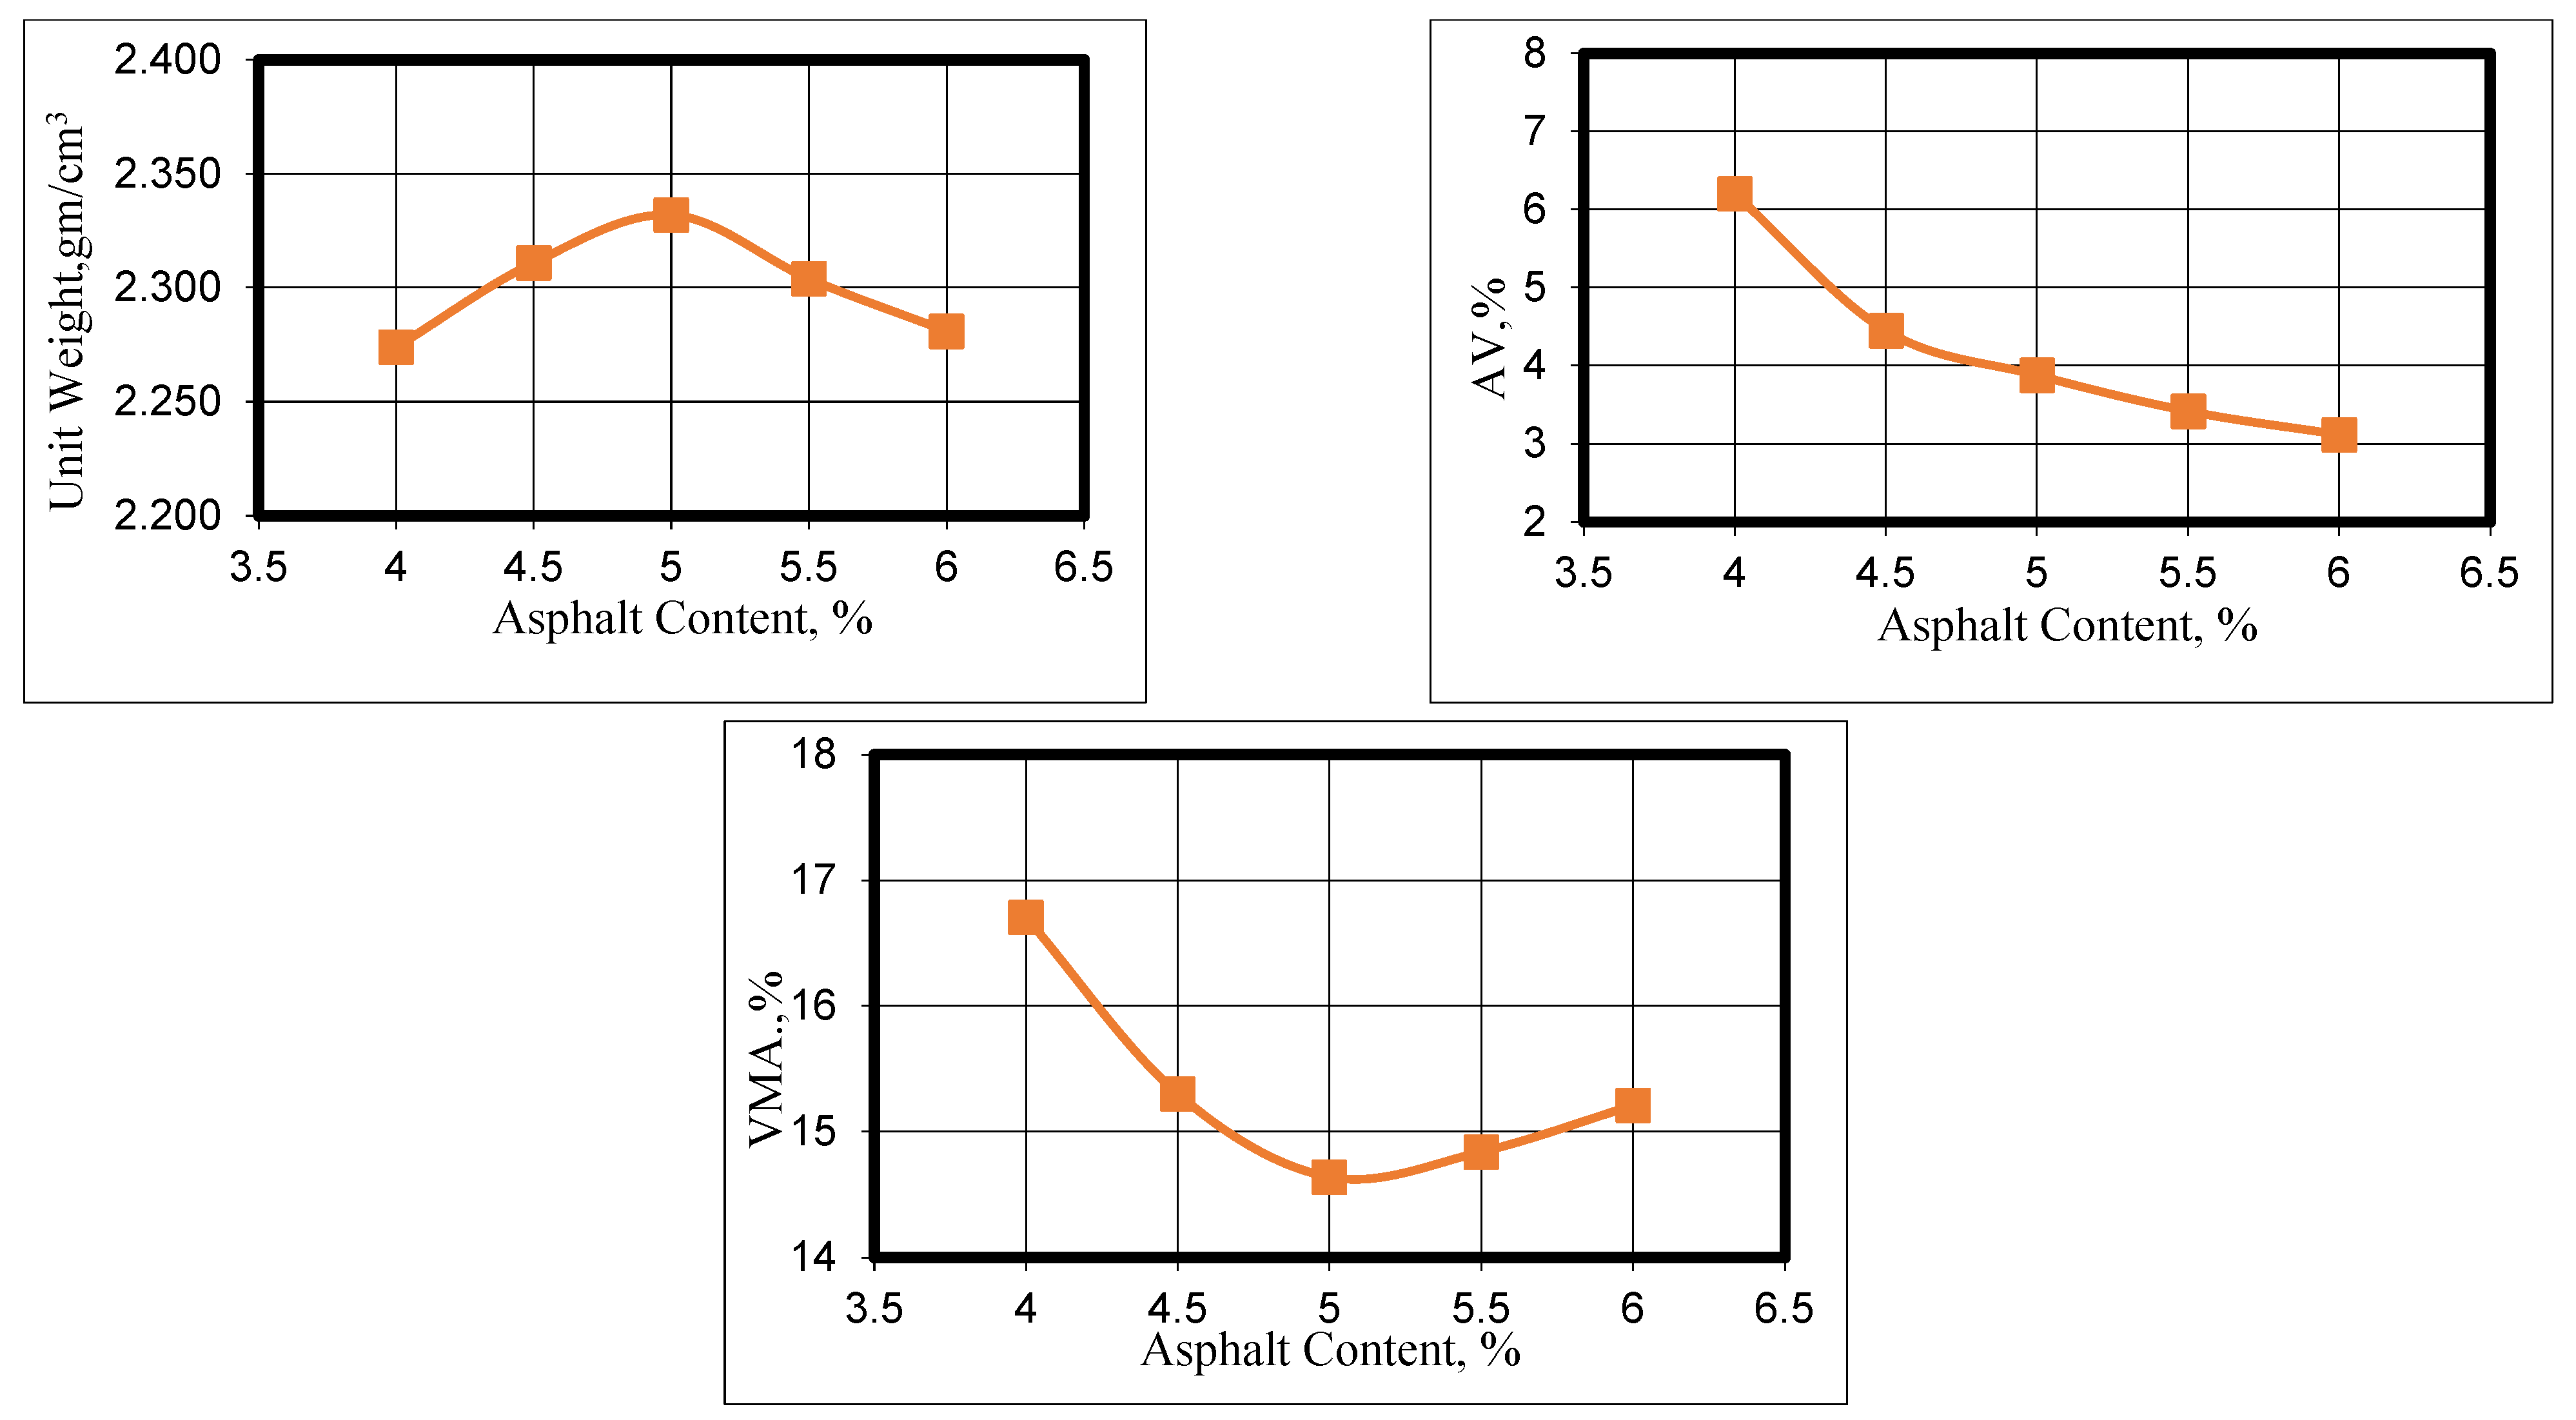
3. Mix Design
4. OT Results and Discussion
4.1. Reference Specimens
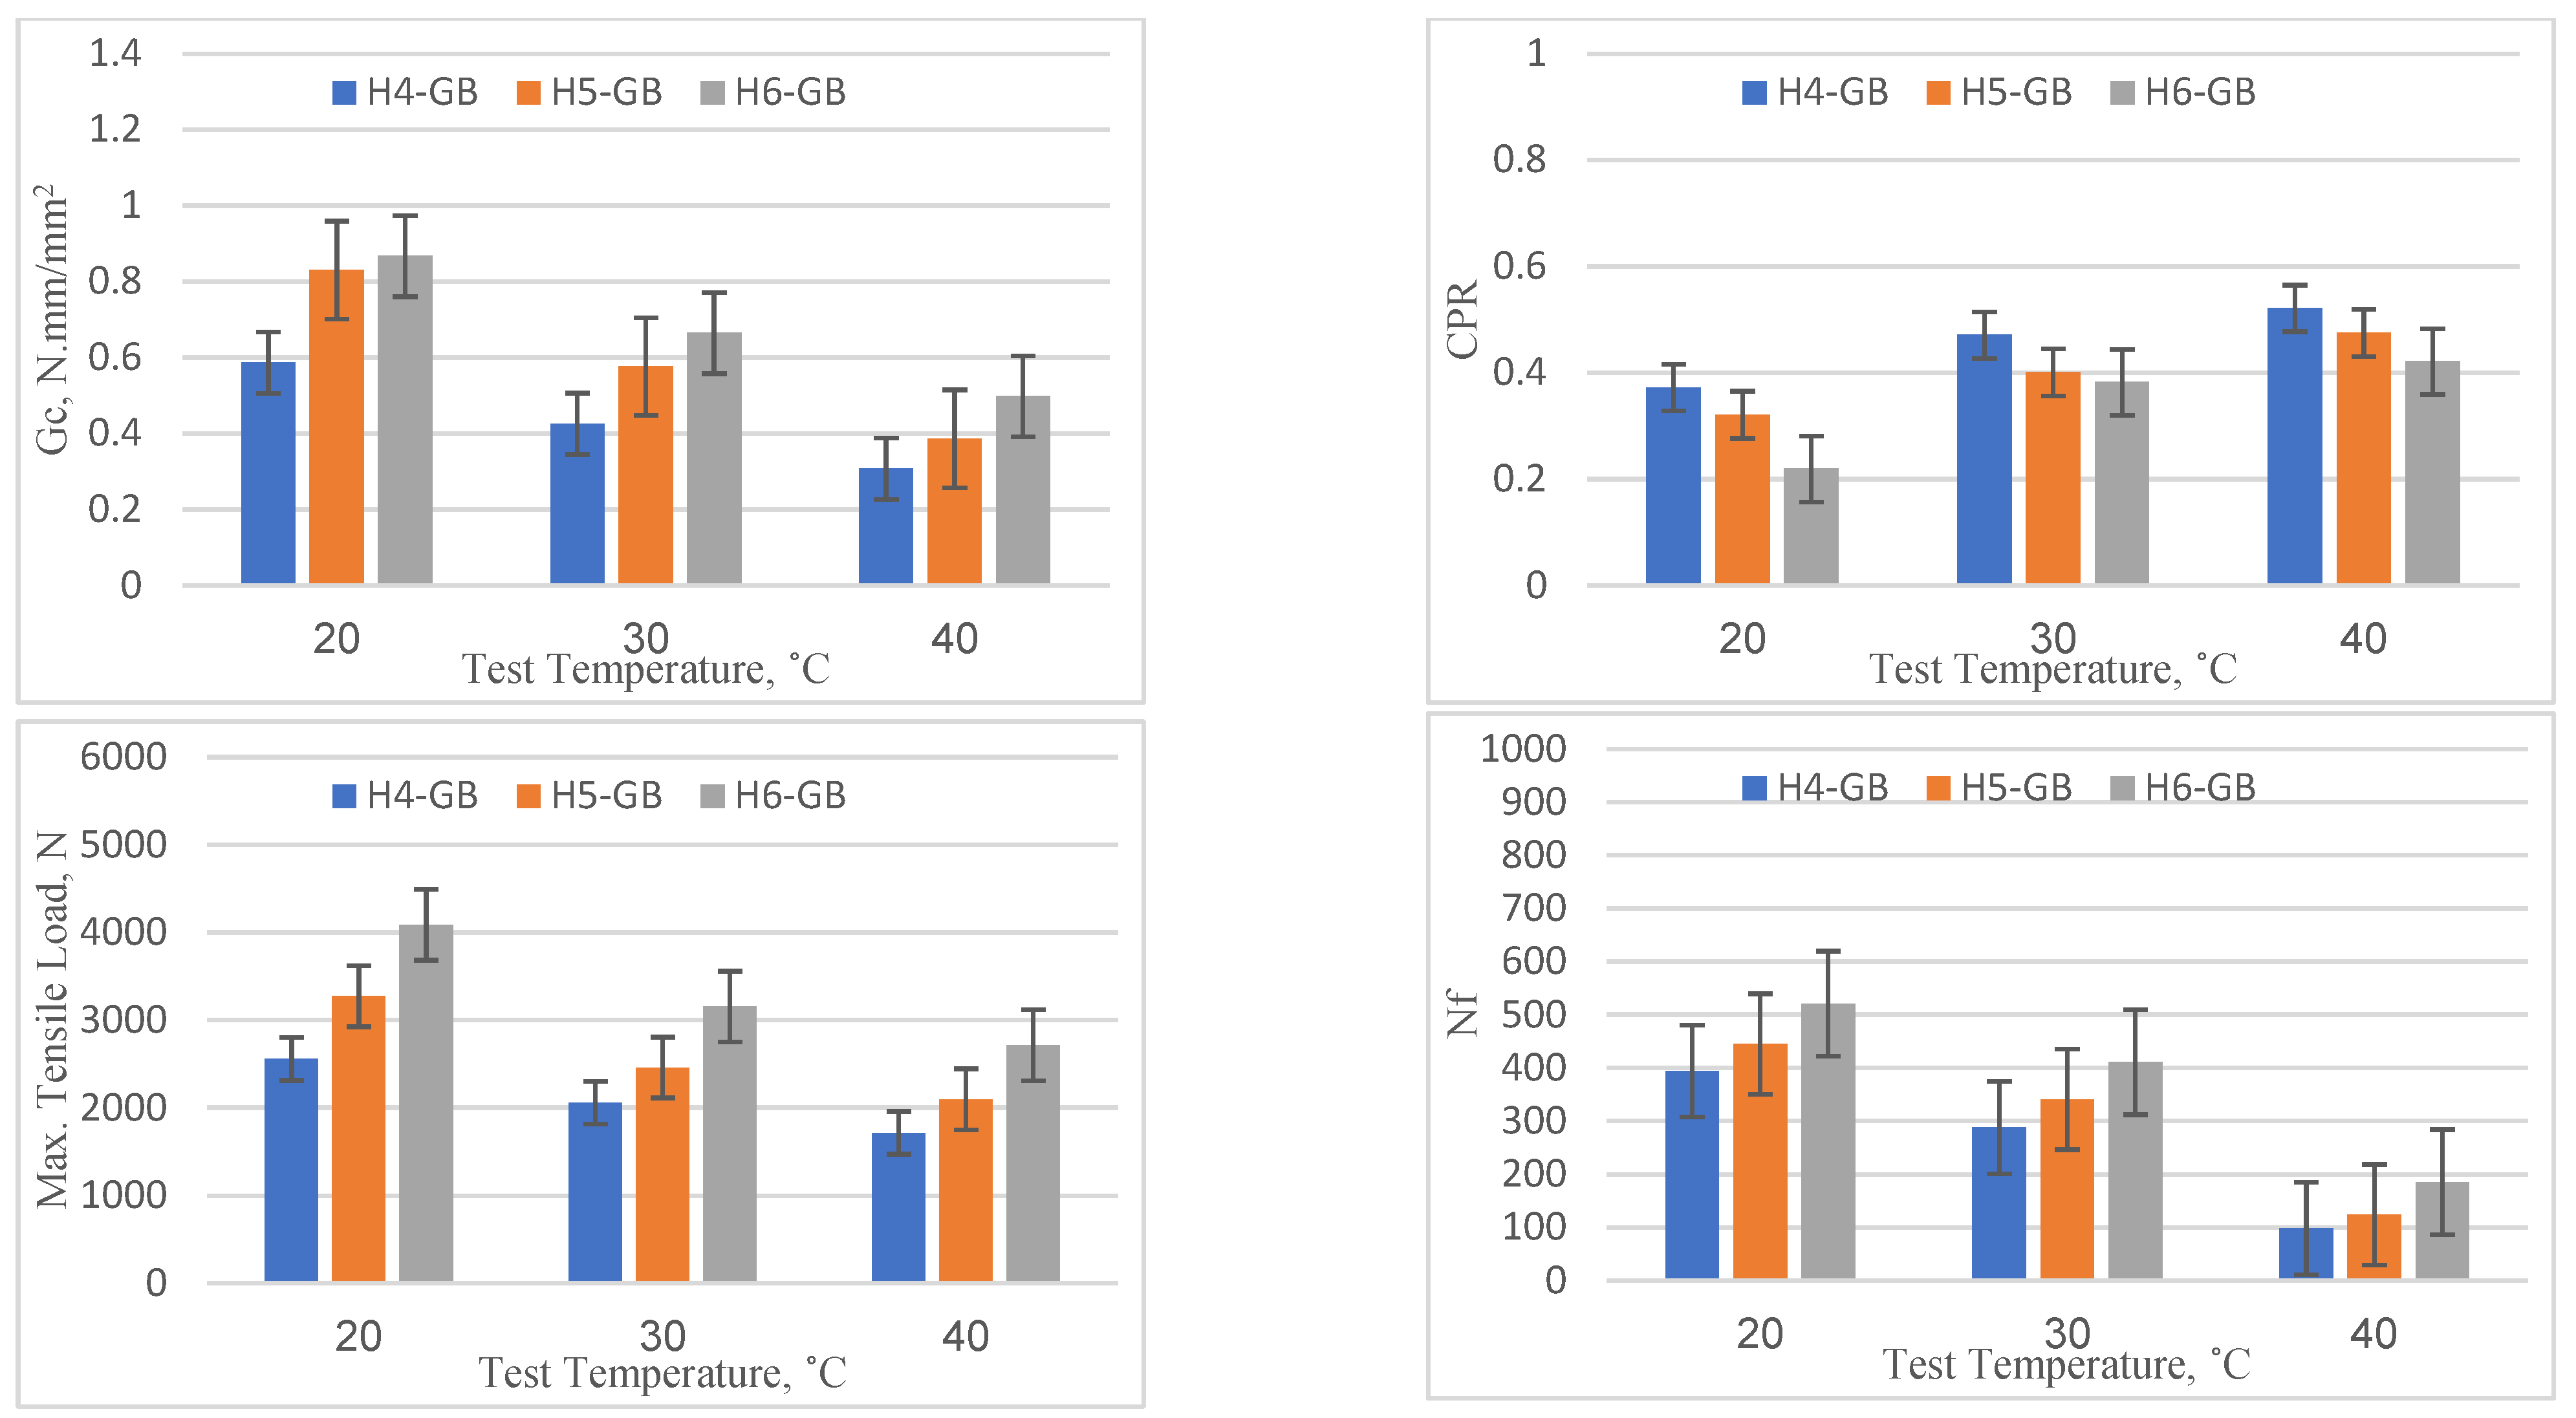
4.2. Geotextiles at the Bottom
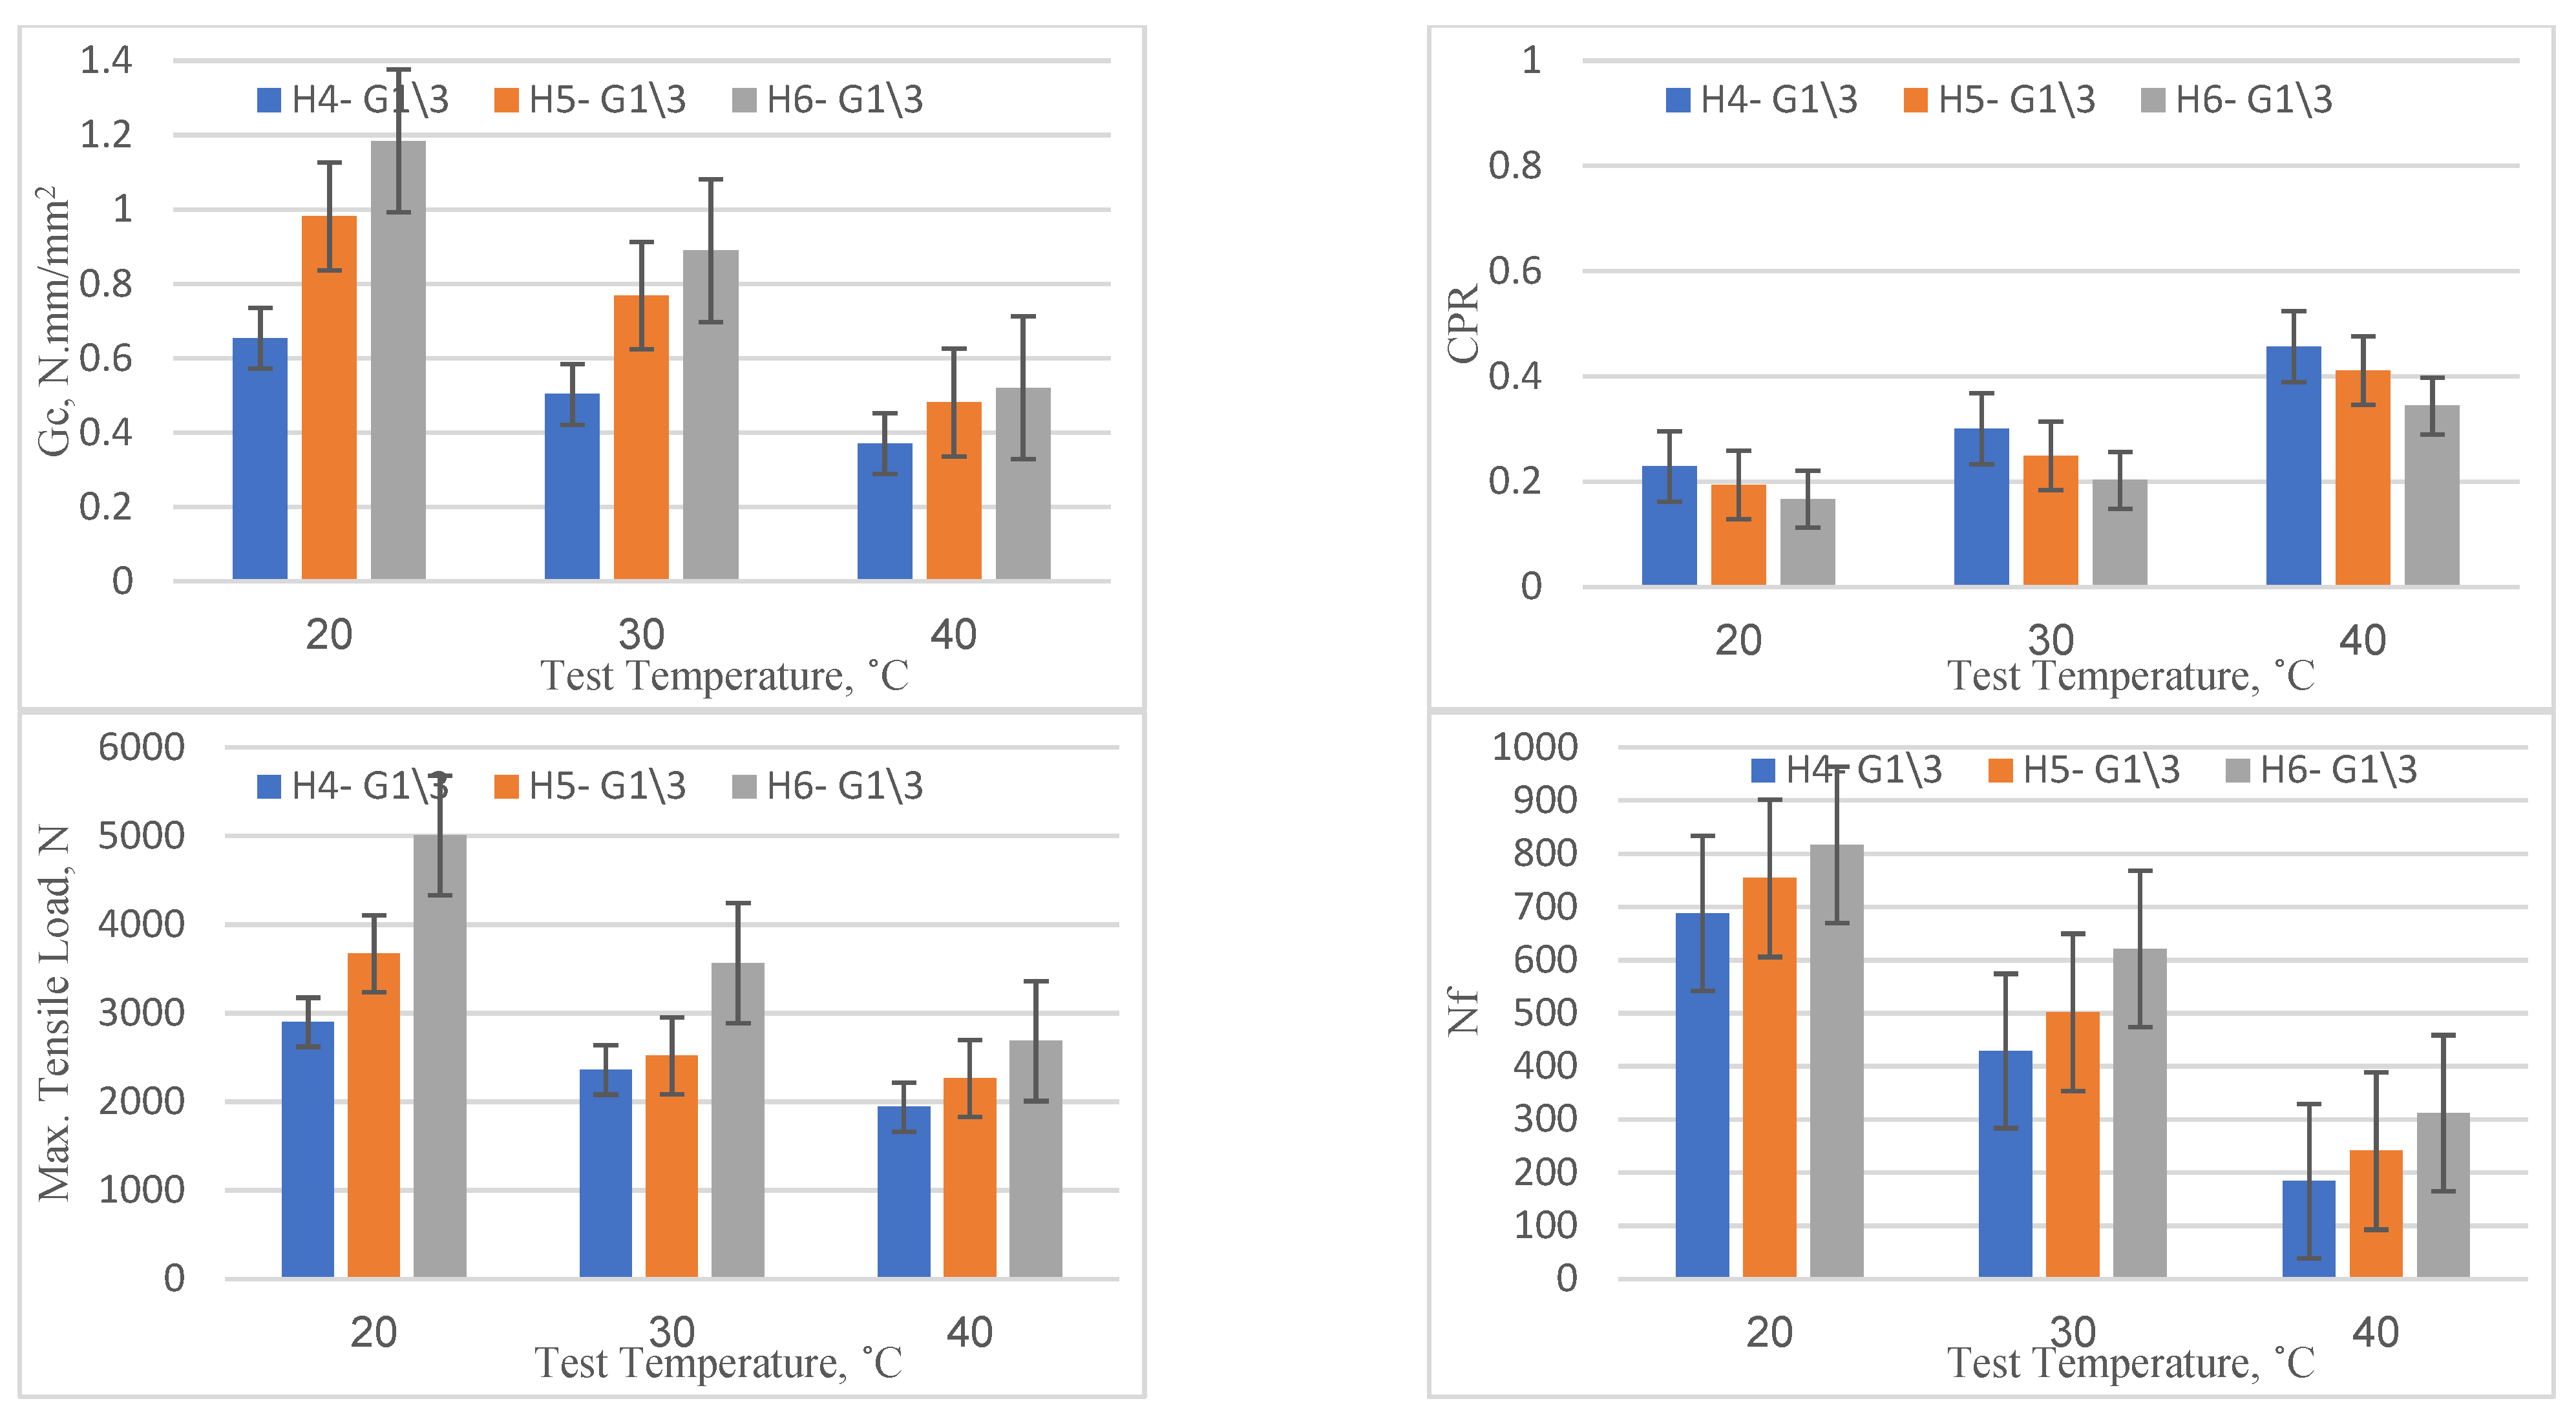
4.3. Geotextiles at One-Third of the Depth
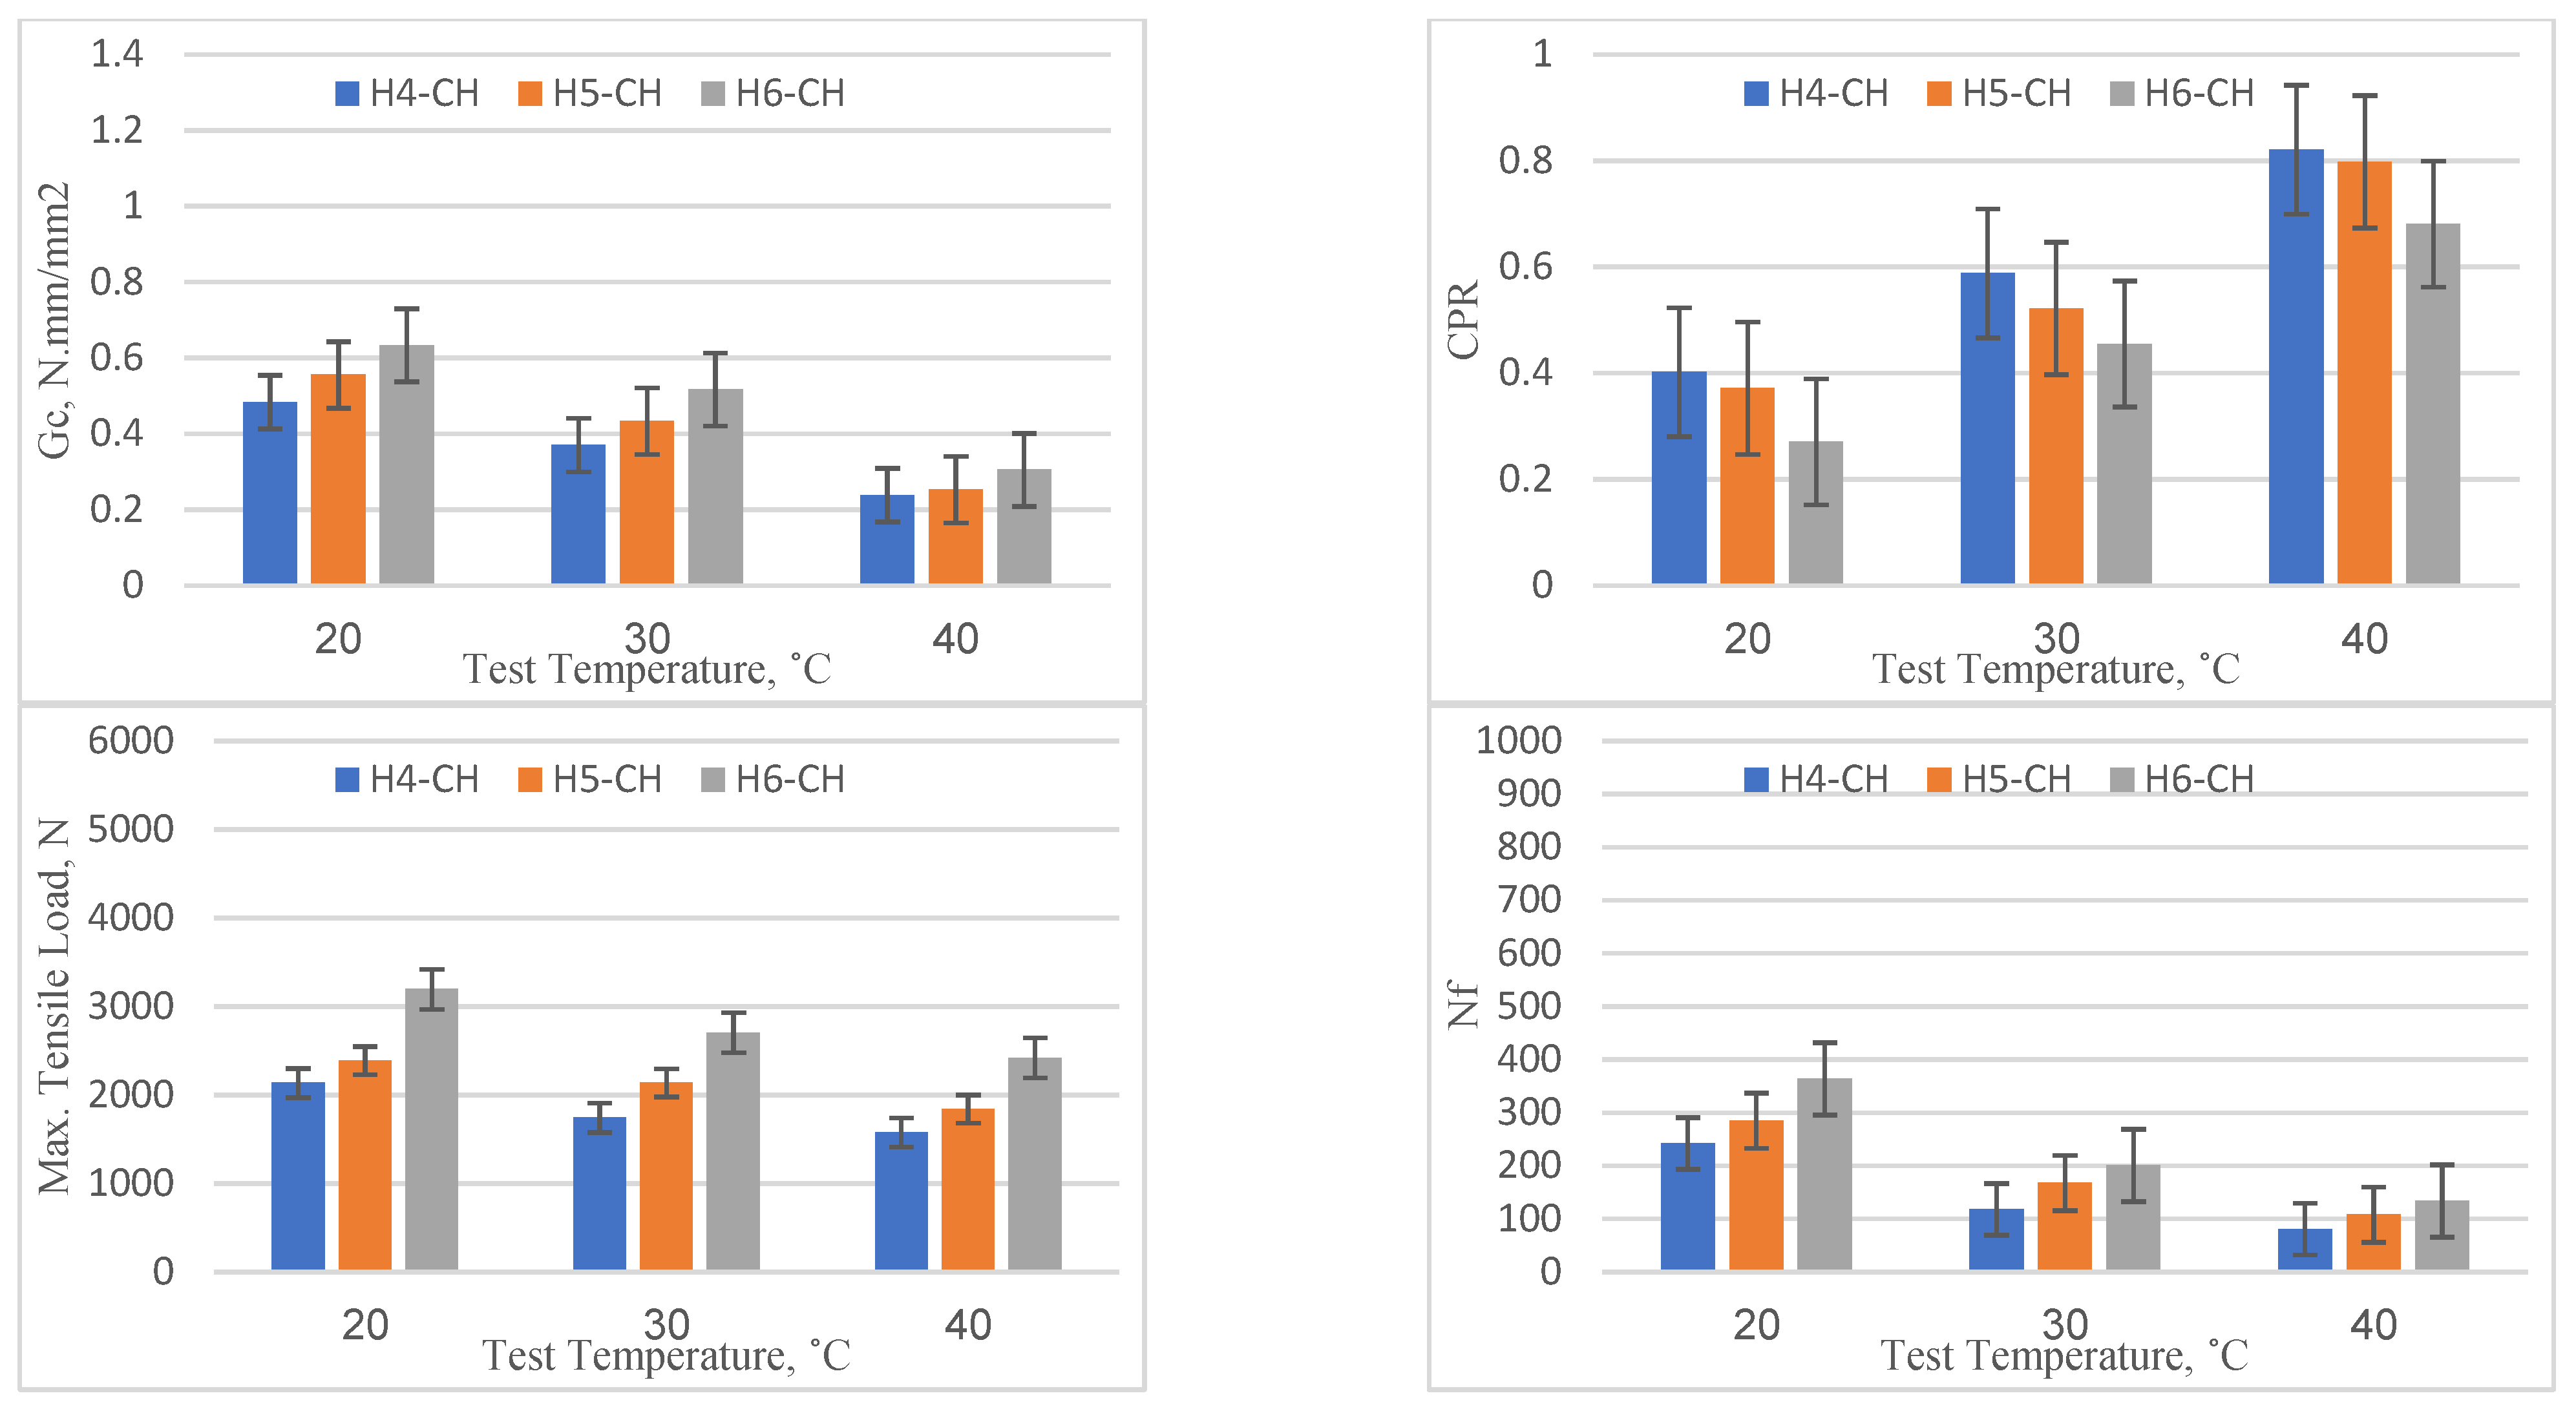
4.4. Chopped Fibers
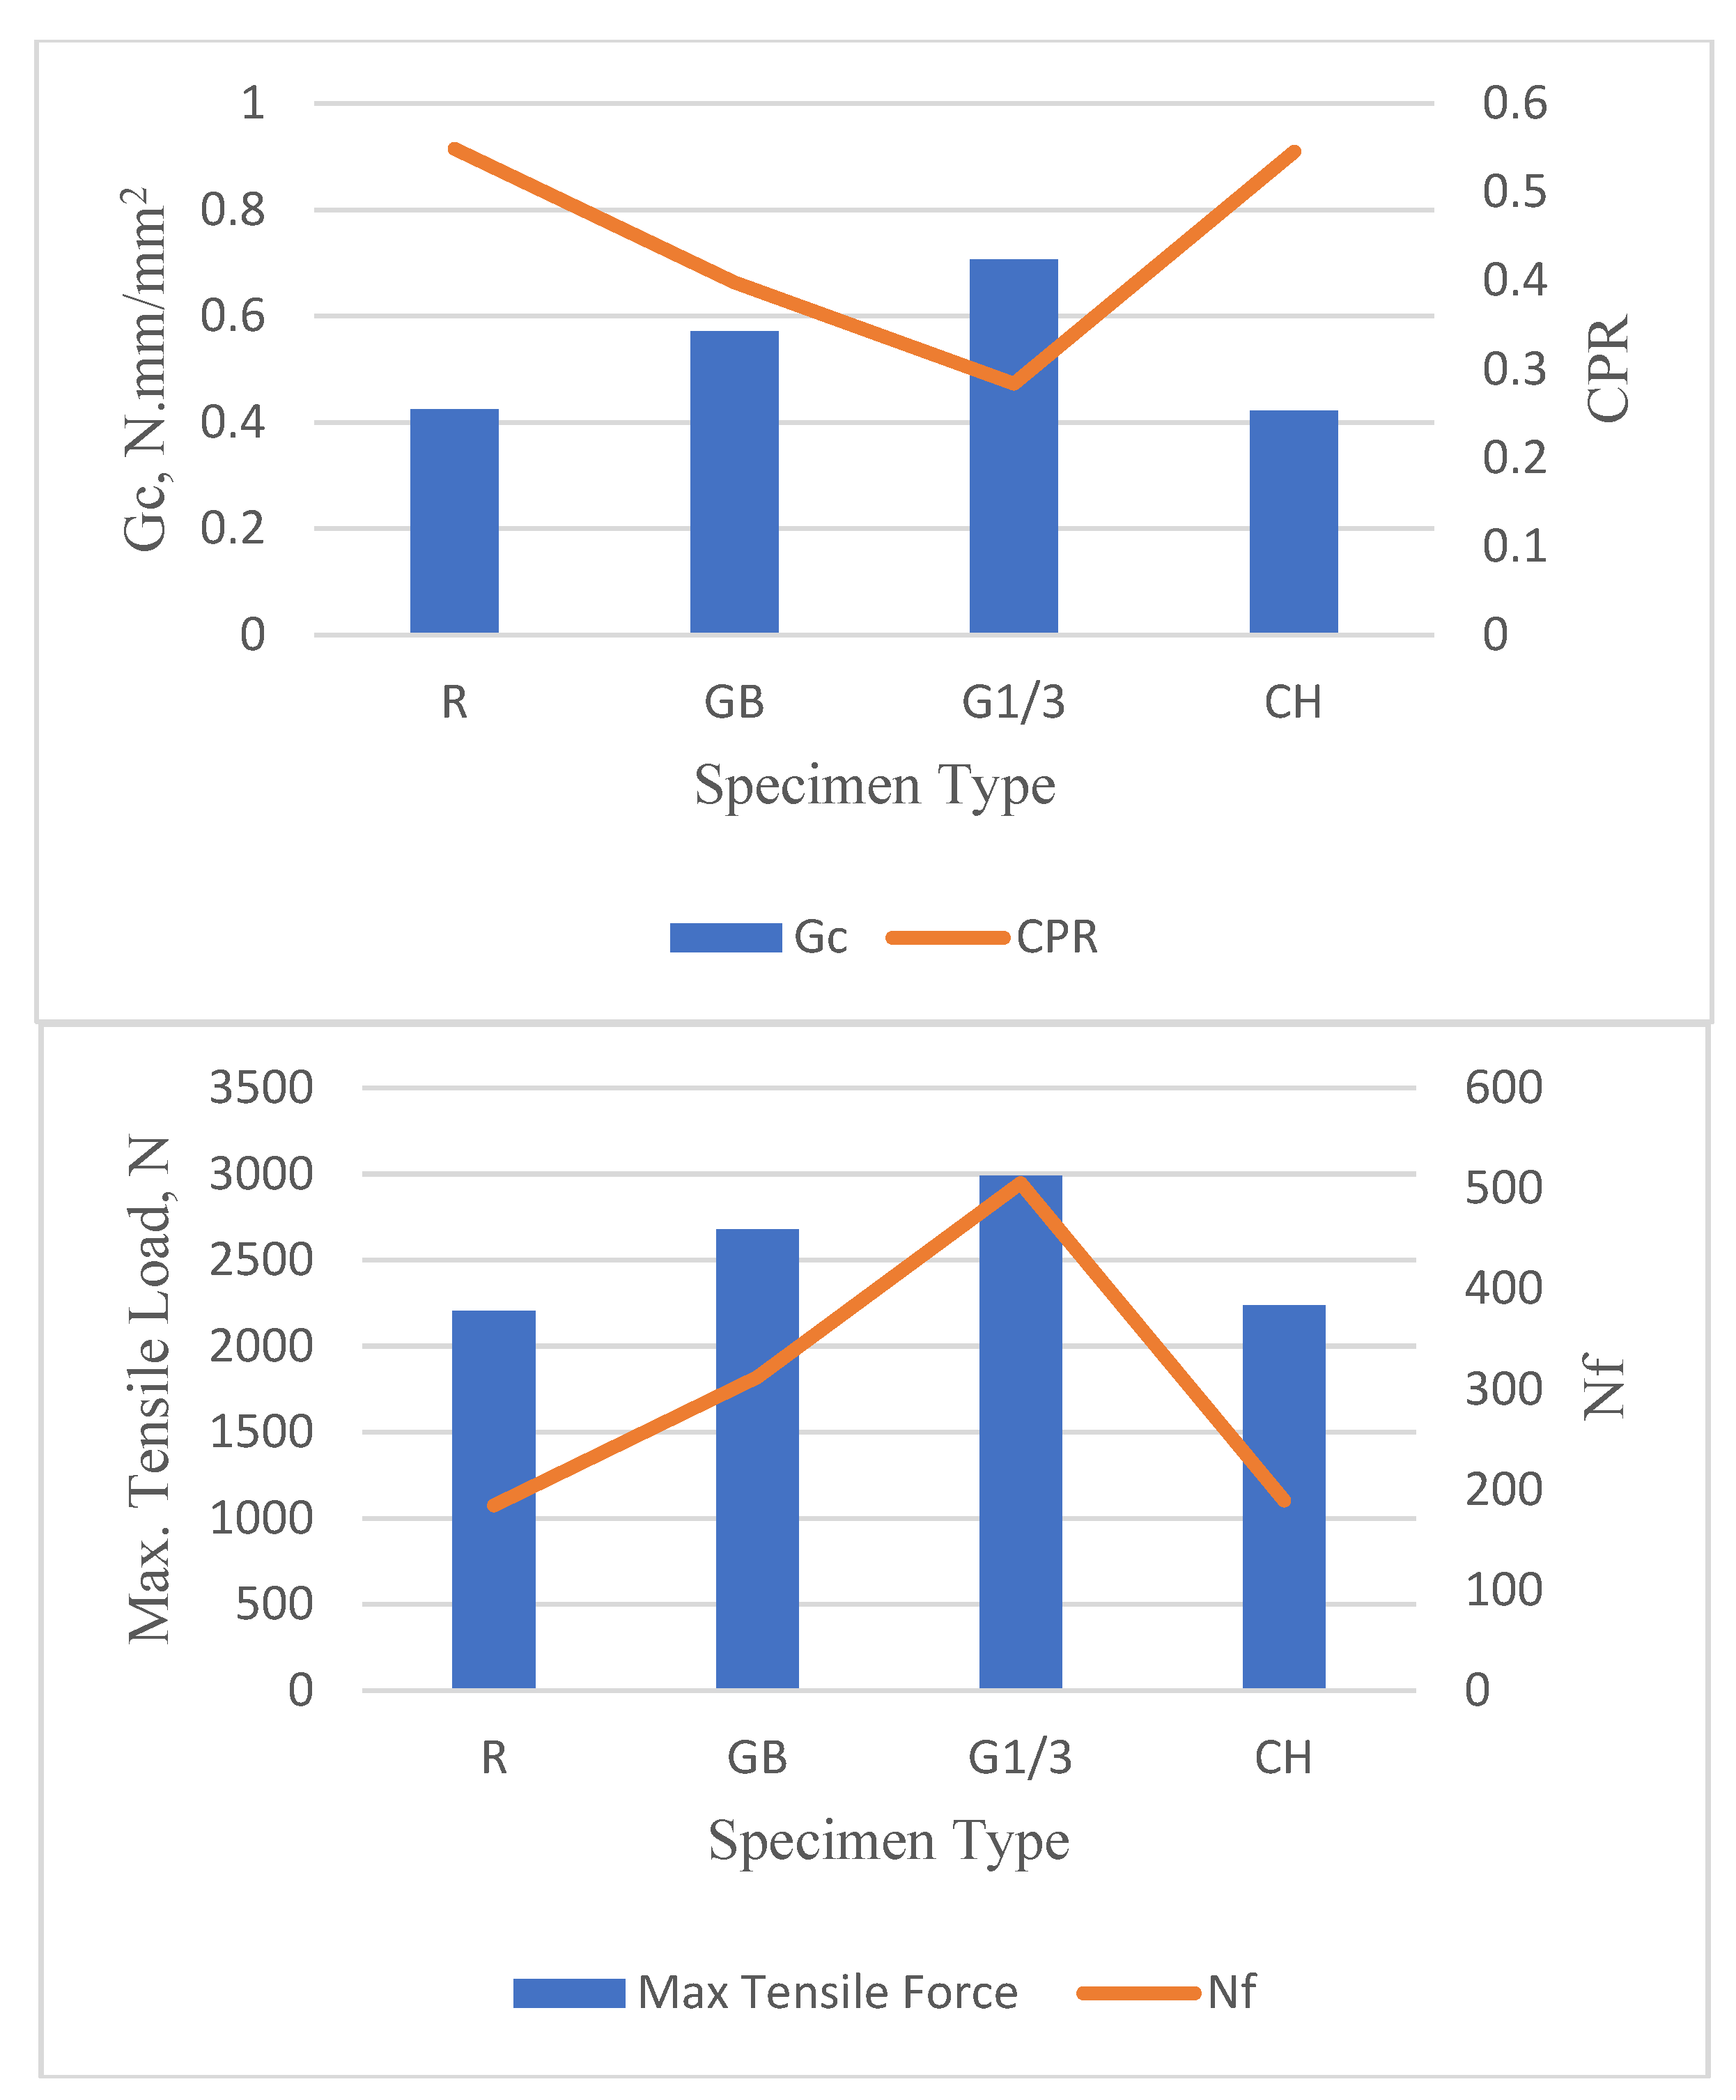
4.5. Comparison of Reinforced Specimens Performance
5. Conclusions and Recommendations
- The presence of geotextiles, whether at the bottom or one-third of the depth from the bottom, significantly improved the overall performance of the asphalt concrete overlays. For instance, overlays with geotextiles at one-third of the depth from the bottom demonstrated an average improvement in Gc and Nf of approximately 66.1% and 97.8%, respectively, compared to the reference mix.
- As the overlay thickness increased from 40 mm to 60 mm, there were noticeable improvements in the performance against reflection cracking for all parameters across all specimens. For example, in the reference mix, Gc values increased by around 34.5% when the overlay thickness changed from 40 mm to 60 mm, and the number of load cycles to failure (Nf) improved from 224 to 344, suggesting a 53.6% increase in the number of load cycles the overlay could withstand before failure.
- The performance parameters Gc, CPR, maximum tensile load, and Nf exhibited dependence on the test temperature, which became more pronounced in the modified overlay types. For instance, the reference mix at 20 °C experienced around 61% more load cycles to failure (Nf) than at 40 °C, whereas the corresponding rate was 67% in the case of specimens with geotextiles at the bottom.
- Overlays with geotextiles at one-third of the depth from the bottom consistently outperformed the others in terms of Gc, CPR, maximum tensile load, and Nf, indicating their superior resistance to crack initiation and propagation.
- Despite a slight enhancement in certain properties, such as the Gc value at 20 °C and 40 mm thickness, the incorporation of chopped fibers in the overlays did not substantially improve the overall performance in comparison to the reference specimens.
- Based on the above results, which are limited to the available materials and testing programs, it is suggested to consider different types of asphalt cement as well as aggregate gradations. Additionally, extending the temperature range both below and above those examined here will more accurately reflect the climatic conditions of both colder and hotter regions.
Author Contributions
Funding
Institutional Review Board Statement
Informed Consent Statement
Data Availability Statement
Conflicts of Interest
References
- Albayati, A.H.; Abdulsattar, H. Performance evaluation of asphalt concrete mixes under varying replacement percentages of natural sand. Results Eng. 2020, 7, 100131. [Google Scholar] [CrossRef]
- Albayati, A.; Wang, Y.; Haynes, J. Size effect of hydrated lime on the mechanical performance of asphalt concrete. Materials 2022, 15, 3715. [Google Scholar] [CrossRef] [PubMed]
- Zvonarić, M.; Dimter, S. Prevention and remediation measures for reflection cracks in flexible pavements. Gradevinar 2022, 74, 189–197. [Google Scholar] [CrossRef]
- Dhakal, N.; Elseifi, M.A.; Zhang, Z. Mitigation strategies for reflection cracking in rehabilitated pavements—A synthesis. Int. J. Pavement Res. Technol. 2016, 9, 228–239. [Google Scholar] [CrossRef]
- Karlsson, R.; Isacsson, U. Material-related aspects of asphalt recycling-state-of-the-art. J. Mater. Civ. Eng. 2006, 18, 81–92. [Google Scholar] [CrossRef]
- Kim, Y.R.; Little, D.N.; Lytton, R.L. Fatigue and healing characterization of asphalt mixtures. J. Mater. Civ. Eng. 2003, 15, 75–83. [Google Scholar] [CrossRef]
- Al-Qadi, I.L.; Elseifi, M.; Carpenter, S.H. Reclaimed Asphalt Pavement—A Literature Review; Illinois Center for Transportation: Rantoul, IL, USA, 2007. [Google Scholar]
- Zhou, F.; Scullion, T. Overlay Tester: A Rapid Performance Related Crack Resistance Test; Texas Transportation Institute, Texas A&M University System: College Station, TX, USA, 2005; Volume 7. [Google Scholar]
- Garcia, V.; Miramontes, A.; Garibay, J.; Abdallah, I.; Nazarian, S. Improved Overlay Tester for Fatigue Cracking Resistance of Asphalt Mixtures; No. TxDOT 0-6815-1; University of Texas at El Paso: El Paso, TX, USA, 2017. [Google Scholar]
- Wagoner, M.P.; Buttlar, W.G.; Paulino, G.H.; Blankenship, P. Investigation of the fracture resistance of hot-mix asphalt concrete using a disk-shaped compact tension test. Transp. Res. Rec. 2005, 1929, 183–192. [Google Scholar] [CrossRef]
- Kim, K.W.; Doh, Y.S.; Lim, S. Mode I reflection cracking resistance of strengthened asphalt concretes. Constr. Build. Mater. 1999, 13, 243–251. [Google Scholar] [CrossRef]
- Rincón-Estepa, J.A.; González-Salcedo, E.V.; Rondón-Quintana, H.A.; Reyes-Lizcano, F.A.; Bastidas-Martínez, J.G. Mechanical Behavior of Low-Density Polyethylene Waste Modified Hot Mix Asphalt. Sustainability 2022, 14, 4229. [Google Scholar] [CrossRef]
- Habbouche, J.; Hajj, E.Y.; Sebaaly, P.E.; Piratheepan, M. A critical review of high polymer-modified asphalt binders and mixtures. Int. J. Pavement Eng. 2020, 21, 686–702. [Google Scholar] [CrossRef]
- Shafabakhsh, G.; Ahmadi, S. Reflection cracking reduction by a comparison between modifying asphalt overlay and sand asphalt interlayer: An experimental evaluation. Int. J. Pavement Eng. 2021, 22, 192–200. [Google Scholar] [CrossRef]
- Yi, J.; McDaniel, S. Application of cracking and seating and use of fibers to control reflection cracking. Transp. Res. Rec. 1993, 1388, 150–159. [Google Scholar]
- Tapkın, S. The effect of polypropylene fibers on asphalt performance. Build. Environ. 2008, 43, 1065–1071. [Google Scholar] [CrossRef]
- Sobhan, K.; Genduso, M.; Tandon, V. Effects of geosynthetic reinforcement on the propagation of reflection cracking and accumulation of permanent deformation in asphalt overlays. In Advances in Engineering and Technology: A Global Perspective, Proceedings of the 3rd LACCEI International Latin American and Caribbean Conference for Engineering and Technology (LACCET’05), Cartegena, Columbia, 8–10 June 2005; LACCEI: Boca Raton, FL, USA.
- Lee, S.J. Constitutive Design Criteria for a Fiberglass Grid: The Mechanical Performance and Bottom-up Crack Propagation Retardation Mechanism of a Grid-Reinforced Asphalt Concrete System. In Proceedings of the Transportation Research Board 87th Annual Meeting, Washington, DC, USA, 13–17 January 2008. No. 08-1357. [Google Scholar]
- Khodaei, A.; Falah, S.H. Effects of geosynthetic reinforcement on the propagation of reflection cracking in asphalt overlays. Int. J. Civ. Eng. 2009, 7, 131–140. [Google Scholar]
- Fallah, S.; Khodaii, A. Evaluation of parameters affecting reflection cracking in the geogrid-reinforced overlay. J. Cent. South Univ. 2015, 22, 1016–1025. [Google Scholar] [CrossRef]
- Leiva-Padilla, P.; Loria-Salazar, L.; Aguiar-Moya, J.; Leiva-Villacorta, F. Reflection Cracking in Asphalt Overlays Reinforced with Geotextiles. In Proceedings of the 8th RILEM International Conference on Mechanisms of Cracking and Debonding in Pavements, Nantes, France, 7–9 June 2016; Springer: Dordrecht, Netherlands, 2016; pp. 219–226. [Google Scholar] [CrossRef]
- Caltabiano, M.A.; Brunton, J.M. Reflection cracking in asphalt overlays. In Proceedings of the Association of Asphalt Paving Technologists Technical Sessions, Seattle, WA, USA, 4–6 March 1991; Volume 60. [Google Scholar]
- SCRB/R9; General Specification for Roads and Bridges, Section R/9, Hot-Mix Asphalt Concrete Pavement, Revised Edition. State Corporation of Roads and Bridges, Ministry of Housing and Construction: Irbil, Iraq, 2003.
- D6927; Standard Test Method for Marshall Stability and Flow of Asphalt Mixtures. ASTM: West Conshohocken, PA, USA, 2022.
- D2726; Standard Test Method for Bulk Specific Gravity and Density of Non-Absorptive Compacted Bituminous Mixtures. ASTM: West Conshohocken, PA, USA, 2011.
- D2041; Standard Test Method for Theoretical Maximum Specific Gravity and Density of Bituminous Paving Mixtures. ASTM: West Conshohocken, PA, USA, 2010.
- Zhou, F.; Hu, S.; Scullion, T. Integrated Asphalt (Overlay) Mixture Design, Balancing Rutting and Cracking Requirements; No. FHWA/TX-06/0-5123-1; Texas Transportation Institute, Texas A&M University System: College Station, TX, USA, 2006. [Google Scholar]
- Asphalt Institute. Thickness Design—Asphalt Pavements for Highways and Streets; No. 1; Asphalt Institute: Lexington, KY, USA, 1981. [Google Scholar]
- Sadek, H.; Hassan, M.; Berryman, C.; Hossain, M.; Idris, I. Evaluation of Asphalt Mixtures’ Resistance to Cement-Treated Base (CTB) Reflection Cracking in the Laboratory; Tran-SET: San Antonio, TX, USA, 2020. [Google Scholar]


| Method | Researcher | Description | Test | Effect on Reflection Cracking |
|---|---|---|---|---|
| Modifying asphalt concrete | [11,12] |
|
| The best improvement in the number of loading cycles to initiate cracking was obtained using LDPE and CB |
| [13] |
|
| The high content of PMA resulted in better reflection cracking resistance than PMA mixes with normal content | |
| [14] |
|
| CRM binders with natural zeolite are superior in crack mitigation in comparison to CRM binders with hydrated lime | |
| Incorporation of fibers | [15] |
|
| Crack severity was less on the fiber-modified overlay sections |
| [16] |
|
| Less reflection cracking exhibited for modified mixes in comparison to the reference mix | |
| The use of geosynthetic stress-relieving layer | [17] |
|
| The rate of crack propagation was remarkably reduced compared to unreinforced sample. |
| [18] |
|
| The reinforcement with the grid system resulted in better resistance to crack propagation. | |
| [19] |
|
| Crack growth was drastically slowed when a geogrid was installed at a depth of one-third of the overlay. | |
| [20] |
|
| In a reinforced overlay, a glass grid is superior to a polyester grid | |
| [21] |
|
| When used as an interlayer system, geotextiles delay the spread of reflection cracks. | |
| Thick overlay thickness | [22] |
|
| A decrease in asphaltic concrete thickness of 25% produced a corresponding decrease in reflection cracking life by 400%. |
| [20] |
|
| A thicker overlayer offered better resistance to reflection cracking. | |
| Current Study |
|
| …. |
| Asphalt Cement | Properties | Temperature Measured (°C) | Measured Parameters | Specification Requirements, AASHTO M320-05 |
|---|---|---|---|---|
| Original | Flash point (°C) | - | 284 | 230 °C, min |
| Viscosity at 135 °C (Pa.s) | - | 0.466 | 3 Pa.s, max | |
| DSR, G/sinδ at 10 rad/s (kPa) | 58 | 3.3044 | 1.00 kPa, min | |
| 64 | 2.2182 | |||
| 70 | 0.912 | |||
| RTFO Aged | Mass loss (%) | - | 0.621 | 1%, max |
| DSR, G/sinδ at 10 rad/s (kPa) | 58 | 4.1669 | 2.2 kPa, min | |
| 64 | 3.1287 | |||
| 70 | 1.9118 | |||
| PAV Aged | DSR, G/sinδ at 10 rad/s (kPa) | 28 | 4499 | 5000 kPa, max |
| 25 | 6247 | |||
| BBR, creep stiffness (MPa) | −6 | 123.7 | 300 MPa, max |
| Test | ASTM Standard | Result | Specification of SCRB/R9 [23] |
|---|---|---|---|
| Coarse Aggregate | |||
| Apparent specific gravity | C127 | 2.641 | - |
| Bulk specific gravity | 2.628 | - | |
| Water absorption (%) | 0.208 | - | |
| Soundness (sodium sulfate solution loss; %) | C88 | 2.7 | 12 max. |
| Percent wear (Los Angeles abrasion; %) | C131 | 21 | 30 max. |
| Flat and elongated (5:1; %) | D4791 | 4 | 10 max. |
| Fractured Pieces (%) | D5821 | 96 | 90 min. |
| Fine Aggregate | |||
| Apparent specific gravity Bulk specific gravity Water absorption (%) | C128 | 2.608 2.542 0.872 | - - - |
| Clay lump and friable particles (%) | C142 | 1.08 | 3 max. |
| Sand equivalent (%) | D2419 | 51 | 45 min. |
| Test | Results |
|---|---|
| Specific gravity | 3.15 |
| Passing sieve No. 200 (%) | 98 |
| Trade code | ECS13-06-562A |
| Type of glass | E |
| Filament diameter (µm) | 13 |
| Chop length (mm) | 12 |
| Tensile strength (MPa) | 1340 |
| Density (kg/m3) | 1903 |
| Product type | Woven aramid fabric |
| Style/pattern | Twill/unidirectional |
| Material | poly-phenylene terephthalamide |
| Thickness | 1 mm |
| Color | Yellow |
| Tensile strength (gpd) | 23 |
| Density (kg/m3) | 1446 |
| No. | Nomenclature | Height (mm) | Reinforcement | |
|---|---|---|---|---|
| Type | Location | |||
| 1 | H4-R | 40 | Nil | … |
| 2 | H5-R | 50 | Nil | … |
| 3 | H6-R | 60 | Nil | ... |
| 4 | H4-GB | 40 | Geotextile | Bottom |
| 5 | H5-GB | 50 | Geotextile | Bottom |
| 6 | H6-GB | 60 | Geotextile | Bottom |
| 7 | H4-G1\3 | 40 | Geotextile | 1\3 depth from the bottom |
| 8 | H5-G1\3 | 50 | Geotextile | 1\3 depth from the bottom |
| 9 | H6-G1\3 | 60 | Geotextile | 1\3 depth from the bottom |
| 10 | H4-CH | 40 | Chopped | Added to mix |
| 11 | H5-CH | 40 | Chopped | Added to mix |
| 12 | H6-CH | 40 | Chopped | Added to mix |
Disclaimer/Publisher’s Note: The statements, opinions and data contained in all publications are solely those of the individual author(s) and contributor(s) and not of MDPI and/or the editor(s). MDPI and/or the editor(s) disclaim responsibility for any injury to people or property resulting from any ideas, methods, instructions or products referred to in the content. |
© 2023 by the authors. Licensee MDPI, Basel, Switzerland. This article is an open access article distributed under the terms and conditions of the Creative Commons Attribution (CC BY) license (https://creativecommons.org/licenses/by/4.0/).
Share and Cite
Albayati, A.H.; Ajool, Y.S.; Allawi, A.A. Comparative Analysis of Reinforced Asphalt Concrete Overlays: Effects of Thickness and Temperature. Materials 2023, 16, 5990. https://doi.org/10.3390/ma16175990
Albayati AH, Ajool YS, Allawi AA. Comparative Analysis of Reinforced Asphalt Concrete Overlays: Effects of Thickness and Temperature. Materials. 2023; 16(17):5990. https://doi.org/10.3390/ma16175990
Chicago/Turabian StyleAlbayati, Amjad H., Yasmin S. Ajool, and Abbas A. Allawi. 2023. "Comparative Analysis of Reinforced Asphalt Concrete Overlays: Effects of Thickness and Temperature" Materials 16, no. 17: 5990. https://doi.org/10.3390/ma16175990