Abstract
The accurate prediction of alloying effects on the martensitic transition temperature (Ms) is still a big challenge. To investigate the composition-dependent lattice deformation strain and the Ms upon the β to α″ phase transition, we calculate the total energies and transformation strains for two selected Ti−Nb−Al and Ti−Nb−Ta ternaries employing a first-principles method. The adopted approach accurately estimates the alloying effect on lattice strain and the Ms by comparing it with the available measurements. The largest elongation and the largest compression due to the lattice strain occur along ±[011]β and ±[100]β, respectively. As compared to the overestimation of the Ms from existing empirical relationships, an improved Ms estimation can be realized using our proposed empirical relation by associating the measured Ms with the energy difference between the β and α″ phases. There is a satisfactory agreement between the predicted and measured Ms, implying that the proposed empirical relation could accurately describe the coupling alloying effect on Ms. Both Al and Ta strongly decrease the Ms, which is in line with the available observations. A correlation between the Ms and elastic modulus, C44, is found, implying that elastic moduli may be regarded as a prefactor of composition-dependent Ms. This work sheds deep light on precisely and directly predicting the Ms of Ti-containing alloys from the first-principles method.
1. Introduction
Ti-based alloys are good potential candidates in biomaterials due to their excellent biocompatibility and low elastic modulus. TiNi-based shape memory alloys (SMAs) have been successfully used in orthodontic archwires [1] and bone implants [2]. To avoid the hypersensitivity and toxicity of the Ni element, it is, therefore, necessary to develop Ni-free biomedical SMAs [3,4,5,6,7,8,9,10,11,12,13,14,15,16,17,18,19,20,21,22,23,24,25,26,27,28,29,30,31,32]. Particularly, TiNb-based SMAs have attracted great attention because of their excellent shape memory effect and superelasticity. There has been broad investigation on TiNb-based alloys, such as Ti−Nb−Al [4,5,6], Ti−Nb−Ta [7,8,9,10,11], Ti−Nb−Zr [12,13,14], Ti−Nb−Sn [15,16,17,18], Ti−Nb−Zr−Ta [19,20], and Ti−Nb−Zr−Sn [21,22,23].
The phase transformation temperature of pure Ti from the α phase (hexagonal close-packed (hcp)) to β phase (body centered-cubic (bcc)) is 1154 K [3]. When the content of β-stabilizing elements is low, the hcp martensite (α′) and orthorhombic martensite (α″) can be created from the β austenite phase by high-speed cooling [33]. Additionally, the hexagonal ω phase can be generated from the β phase via severe plastic deformation [34,35,36] and from the α′ phase under the drive of high-temperature torsion [33,35,37,38,39,40]. The ω phase is detrimental to the shape memory effect and superelasticity of martensite. In this work, we mainly focus on the phase transition of β to α″. To some extent, alloying elements can tune the mechanical properties and phase transformation temperature of Ti alloys. Upon adding β-stabilized elements, such as Nb and Mo, Nb can stabilize the β phase and lower the transformation temperature of Ti alloys [41,42]. Both experiments [5,7,12,13,15,23,41,43,44] and first-principles calculations [45,46,47,48] have extensively investigated TiNb-based SMAs. From an experimental point of view, the alloying of Al [5], Zr [44], Sn [15], and Ta [7] into Ti−Nb alloys can affect superelasticity, shape memory effect, and martensite transition temperature (Ms). It has been reported that the Ms linearly decreases by about 40, 30, 38, and 150 K with 1 at. % increases in Nb [43], Ta [7], Zr [44], and Sn [15] additions, respectively. Ti−Nb22−xTa (x = 2–8, in at. %) ternary alloys display a stable shape memory effect and superelasticity at room temperature (RT). Note that the compositions mentioned here are given in at. %. Since the ω phase has an adverse effect on the shape memory effect, it is found that the doping of Al can greatly hinder ω formation [26,27]. From a theoretical point of view, Neelakantan et al. [45] proposed a thermodynamics-based model to estimate the Ms of Ti alloys. They created a linear relation between the predicted Ms and molybdenum equivalent ([Mo]eq), suggesting that the predicted Ms increases with decreasing [Mo]eq. Minami et al. [47] and Sun et al. [48] correlated the Ms and the energy difference between the β and α″ phases in Ti−Nb binaries. Moreover, C′ and C44 are regarded as predictors of composition-dependent Ms in Ni2MnGa-based SMAs [49] and Ti−Ni binary alloys [50]. Since the overestimation of the existing predicted Ms compared to the measurements, there is still a big challenge to directly predict the Ms through first-principles methods.
Another challenge is to enhance the recoverable strain of the material while reducing the Ms meantime. The recoverable strain of Ti−Nb SMAs is around 3% [41] and is smaller than that of Ti−Ni superelastic alloys [51]. Both recoverable strain and the Ms in TiNb-based SMAs [7,9,52] increase with decreasing Nb content. Namely, there is a conflict between high deformation strain and low Ms in TiNb-based SMAs [48]. The contradiction between the strain and the Ms can be alleviated by alloying [53], owing to the coupling alloying effects. Compared to the strong Nb effect [41] on the transformation strains of Ti-Nb binaries, Al [4,5,6,54] and Ta [7,9] elements have a weaker influence on transformation strains in Ti−Nb−X ternary alloys. For instance, a maximum recoverable strain of 4.7% appears if doping 3 at. % Al into Ti−24Nb−Al alloys [4]. Alloying Ta can reduce the transformation strains along [011]β on average by 0.28%/1 at. % [9]. However, the alloying effect of Nb [41], Al [4,5,6,54], and Ta [7] show similar magnitude orders on the Ms. The measured Ms decreases by 40, 40, and 30 K, with an increase of 1 at. % Nb, Al, and Ta, respectively.
To overcome low recoverable strain and high Ms trade-off, Sun et al. [48] calculated the lattice deformation strains using a first-principles method. Meanwhile, they correlated calculated energy differences between the β and α″ phases and the measured Ms for Ti−Nb binaries and, thus, estimated an empirical relationship [48] to predict the Ms of multi-principal element alloys. It has been found that the trade-off is somehow improved or even broken by alloying. Such empirical relationships [48] can roughly describe the composition dependence of the Ms [48]; however, it overestimates the measured Ms to some extent. Aiming to accurately predict the Ms, here, we take Ti−Nb−Al and Ti−Nb−Ta as representative alloy systems to search for a better correlation between the Ms and the change in energy. In the present work, theoretical equilibrium lattice constants, lattice strains, and total energies in the β → α″ phase transformation for Ti−22Nb−(0–10)Al and Ti−22Nb−(0–10)Ta ternary alloys are calculated using a first-principles method. A pseudobinary approach is ‘used to associate the measured Ms with the calculated energy difference between the β and α″ phases. A satisfied agreement is acquired between the predicted and measured Ms. Based on our proposed relationships considering the coupling effect of alloying, the estimated Ms can accurately reproduce the composition dependence of measured Ms. Furthermore, it is found that elastic moduli, C44 and C′, may be regarded as prefactors of the composition-dependent Ms. This work can precisely predict alloying effects on the Ms of Ti-based alloys from first-principles calculations. The computational methods are described in detail in Section 2. The results and discussion of the alloying effect on the lattice deformation strain, stereographic projections of the lattice strains, and comparisons between the predicted and measured Ms for Ti-based alloys are shown in Section 3. We put forward a conclusion in Section 4.
2. Methodology
The total energies were calculated using the first-principles exact muffin-tin orbitals (EMTO) [55] method. The self-consistent calculations were performed using the Perdew–Burke–Ernzerhof (PBE) generalized gradient approximation [56]. The Kohn–Sham equations were solved with scalar-relativistic approximation and soft-core approximation. To integrate the valence states below the Fermi level, Green’s function was calculated for 16 complex energy points. The basis sets included the s, p, d, and f orbitals in EMTO. The alloys considered here were nonmagnetic. The random distribution in a solid solution was described by the coherent-potential approximation (CPA) [55], implying that the degree of the atomic order of a solid solution is treated in a completely disordered way. To process the electrostatic correction to the CPA, the screened impurity model [57] was used with a screening parameter of 0.6. The k point meshes were carefully chosen to describe the tiny changes in energy for different phases. Hence, the used k point meshes were 25 × 25 × 25 and 11 × 11 × 11 for the β and α″ phases in the irreducible Brillouin zone. The theoretical equilibrium lattice constant was determined by fitting the total energies of nine different atomic volumes based on a Morse equation of states.
Based on the crystallographic relationship among the β, α″, and α phases [9,41,48], the α″ phase is equivalent to the β phase if b/a = c/a = and shuffle y = 0, while the α″ phase turns into the α phase if b/a = and y/b = 1/6. Consequently, four variable parameters, including the Winger–Seitz radius (w, in Bohr), the axis ratios of c/a and b/a, and shuffle y, dominate the total energy upon the β → α″ phase transition. It is found that a small volume difference produces a relatively tiny energy difference of less than 0.2 mRy for a given phase [58]. Therefore, to reduce the complexity of structural optimization, we ignore the influence induced by volume on different phases when calculating the total energy and consider total energy as functions of b/a, c/a, and y. In the present study, the range of the b/a is 1.40–1.75, and the interval of the c/a is 1.40–1.70. The interval of y is set from 0 to 1/6b for every b/a and c/a. Spline interpolation is chosen to find the equilibrium shuffle y in each group of b/a and c/a. Then, two-dimensional cubic interpolation is used to determine the equilibrium b/a and c/a.
The cubic austenite phase has three independent elastic constants [59,60]: C11 (the uniaxial deformation along [001]β), C12 (the shear stress at (110)β along [10]β), and C44 (the shear deformation along (100)β). The mechanical stability criteria for a cubic crystal are C44 > 0, C11 + 2C12 > 0, and C11 − C12 > 0. The standard technique [61,62,63,64] was used to calculate the C11, C12, and C44. Theoretical values of C′ and C44 were calculated by using the EMTO-CPA method [65]. The C11 and C12 were computed from bulk modulus, B = 1/3 (C11 + 2C12), and tetragonal shear constant, C′ = (C11 − C12)/2. The k point meshes were assigned as 29 × 29 × 29 for the β phase.
3. Results and Discussion
Transformation strain principally affects shape recovery strain. The martensitic transformation strain depends on lattice strain and lattice correspondence [9,41,48,53,66]. The lattice correspondence between the β austenite phase and α″ orthorhombic martensite phase is displayed in Figure S1 and can be described, as below:
The lattice deformation strains η1, η2, and η3 [9,41,48,53,66] along the three principal axes of [100]β, [011]β, and [01]β are written as follows:
where a′, b′, and c′ represent the lattice constants of the α″ phase and aβ is the lattice parameter of β phase.
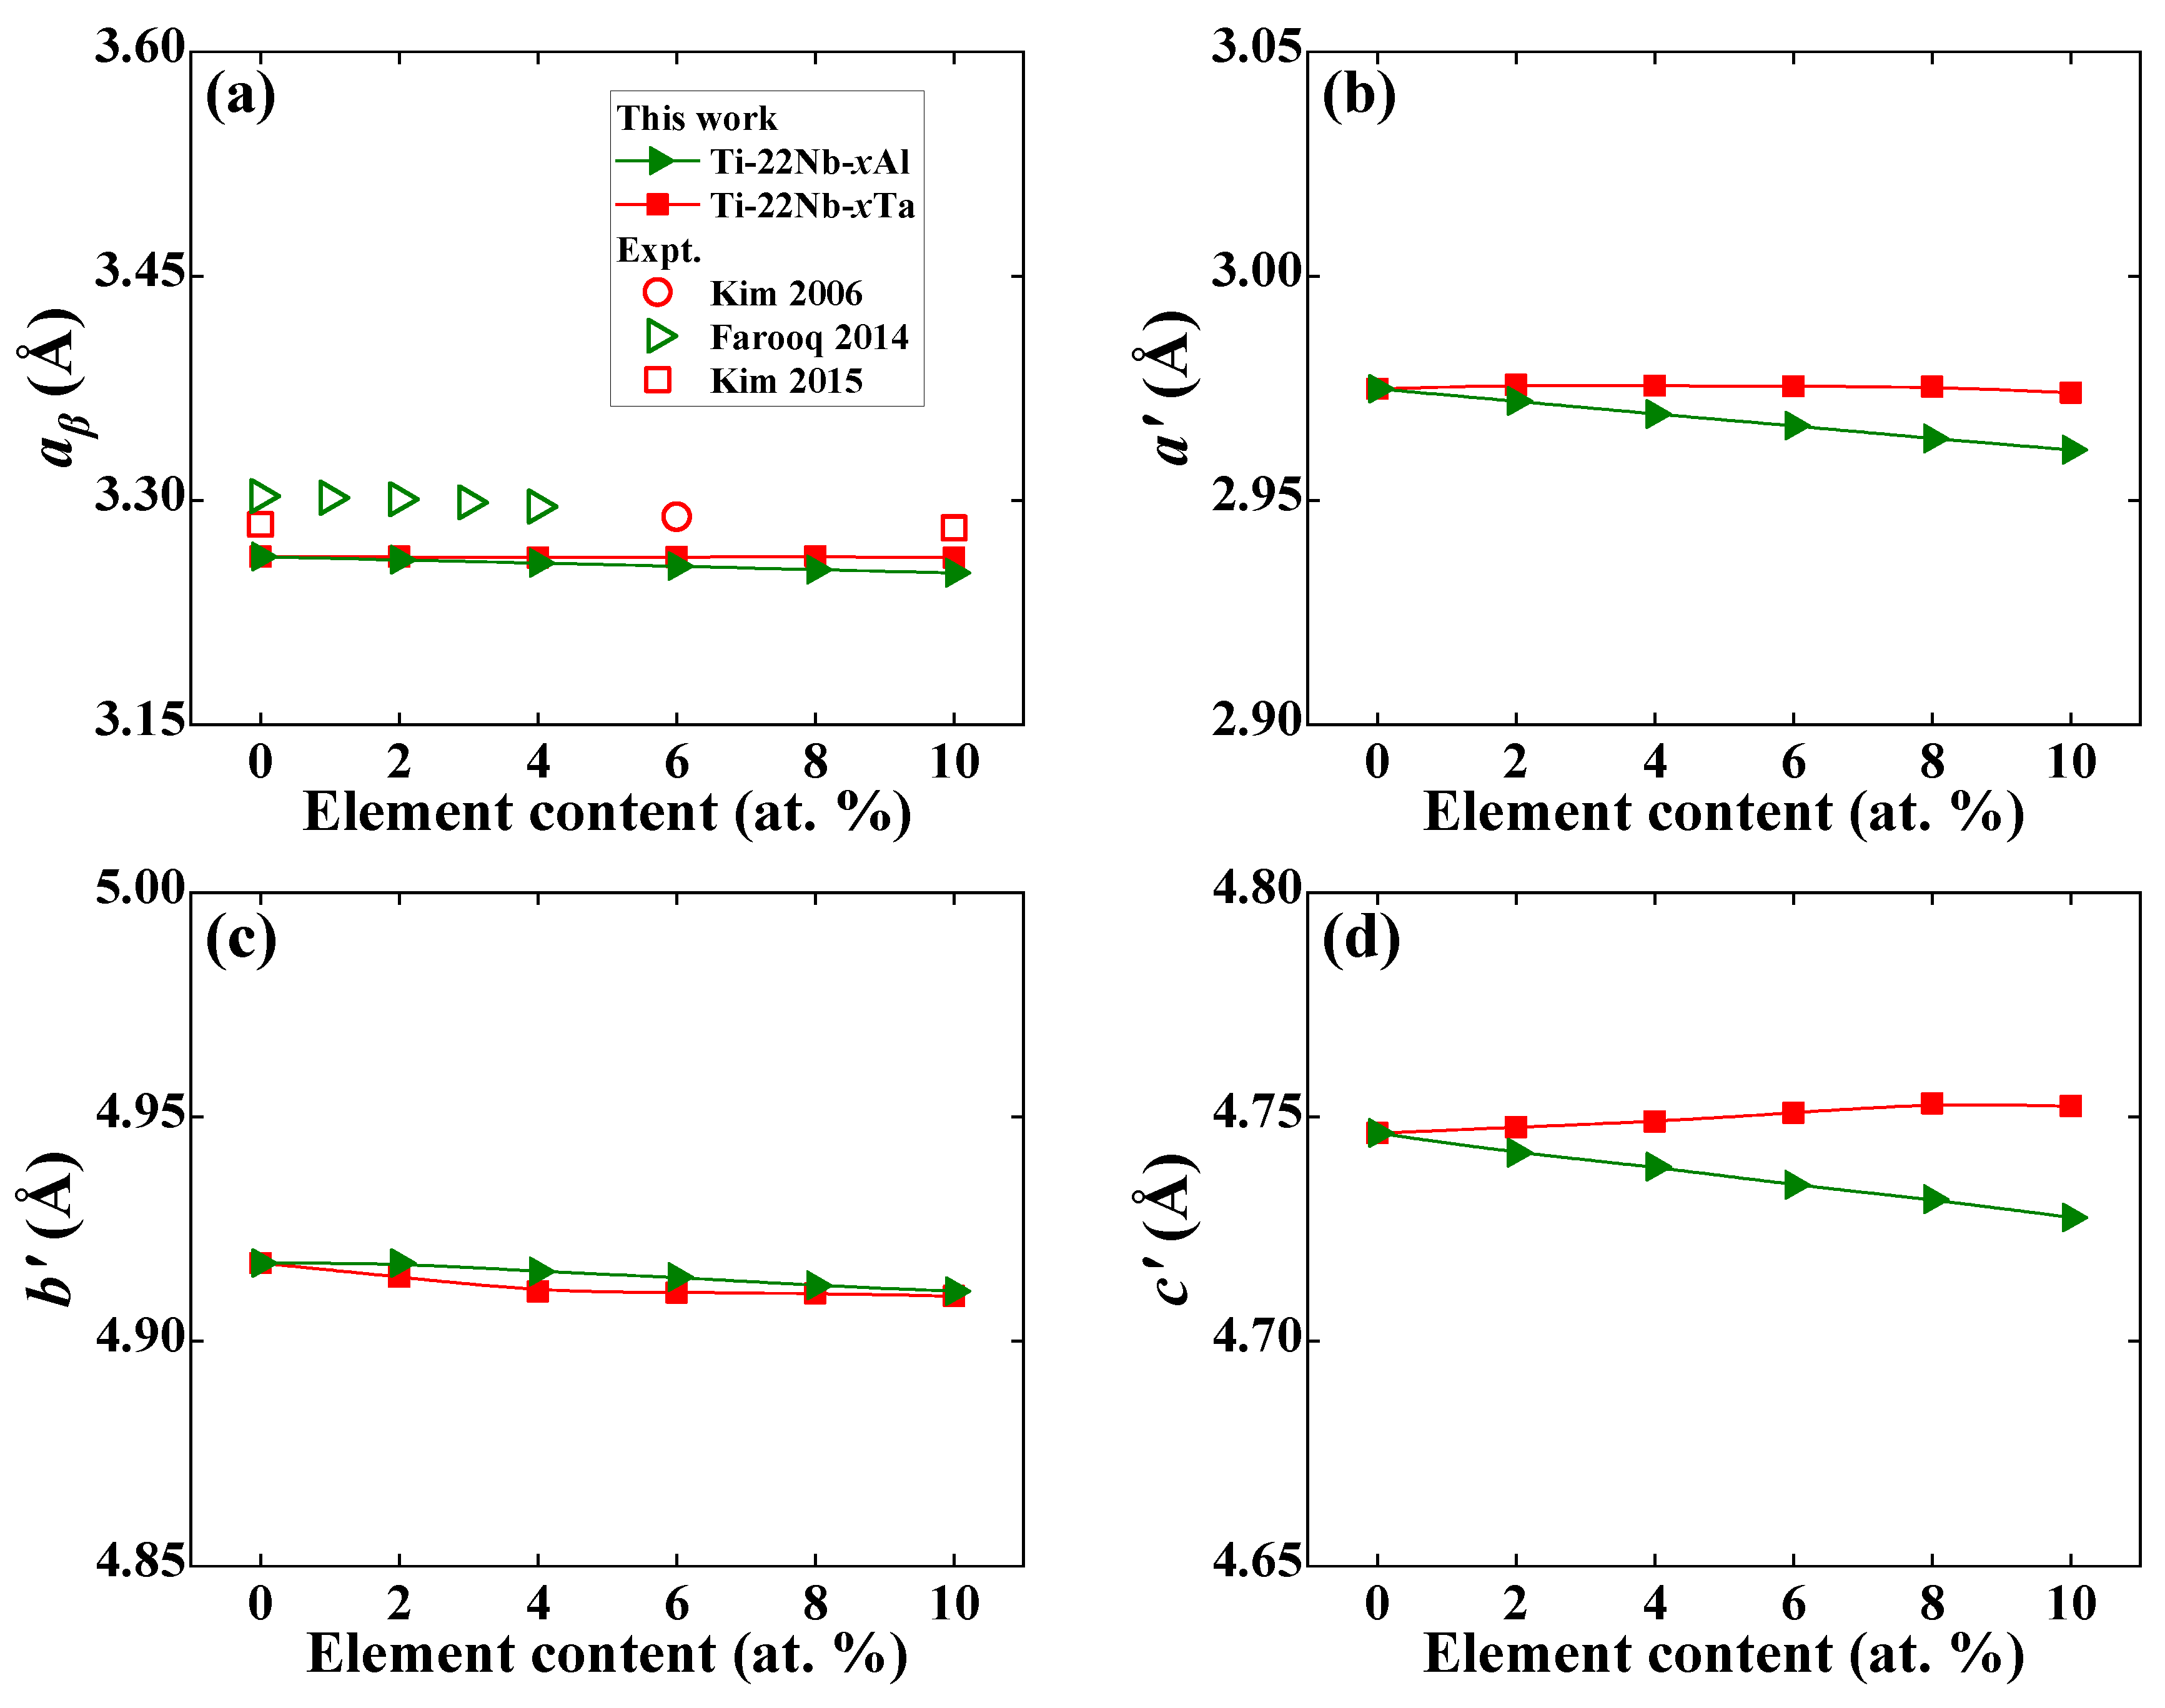
Figure 1 shows the present theoretical equilibrium lattice constants of Ti−22Nb−xX (x = 0–10, X = Al, Ta) in the β and α″ phases, compared with the available experimental data [4,9,11] in the β phase. Theoretical lattice constants from our static calculations are generally smaller than the experimental values. The partial reason may come from ignoring the thermal expansion caused by temperature effects. Alternatively, the deviation between calculation and measurement partially contributes to the different alloy compositions in our selected Ti−22Nb−Al and the measured Ti−24Nb−Al. However, the same composition dependence of the lattice constant appears for both theoretical calculations and available measurements. For example, the lattice constant aβ of Ti−Nb−Al ternaries decreases about 1.07 × 10⁻³ Å/1 at. % with an increase in Al, which is consistent with the available experimental decrement of 1.71 × 10⁻³ Å/1 at. % [4] and 1.9 × 10⁻³ Å/1 at. % [6]. For Ti−Nb−Ta ternaries, aβ keeps almost constant at around 3.26 Å, which is in line with the previous first-principles calculations [67].
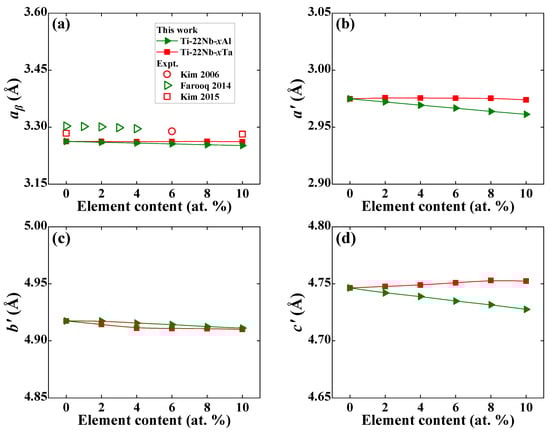
Figure 1.
Theoretical equilibrium lattice constants of (a) aβ in β phase and (b) a′, (c) b′, (d) c′ in α″ phase for Ti−22Nb−xX (x = 0–10, in at. %; X = Al, Ta) as a function of alloying elements, compared with the available experimental values [4,9,11].
Like the decreasing aβ of Ti−Nb−Al, the lattice constants a′, b′, and c′ of Ti−Nb−Al in the α″ phase also linearly decrease with increasing Al content. The a′, b′, and c′ of Ti−Nb−Al reduce by 1.37 × 10⁻³ Å, 6.76 × 10⁻⁴ Å, and 1.85 × 10⁻³ Å with a 1 at. % increase in Al, respectively. The situation becomes complex for α″ Ti−Nb−Ta ternaries. The a′ of Ti−Nb−Ta is insensitive to Ta content, but the b’ first decreases and then increases with increasing Ta content, while the c′ shows a linear increasing trend. Such complicated composition dependence agrees with the available measurement [9] and first-principles calculations [67], although the changes in a′, b′, and c′ for a given Ti−Nb−Ta system are somehow scattered [9,67]. For example, the a′, b′, and c′ for Ti−37.5Nb−(12.5, 18.75)Ta alloys [67] increase as Ta content increases, while the a′ (b′ and c′) increases (decrease) with alloying Ta into Ti−(14–18)Nb−(0–10)Ta alloys [9], differing from the theoretical trends in Figure 1b–d. This deviation may come from different Nb and Ta contents and different experimental processes.
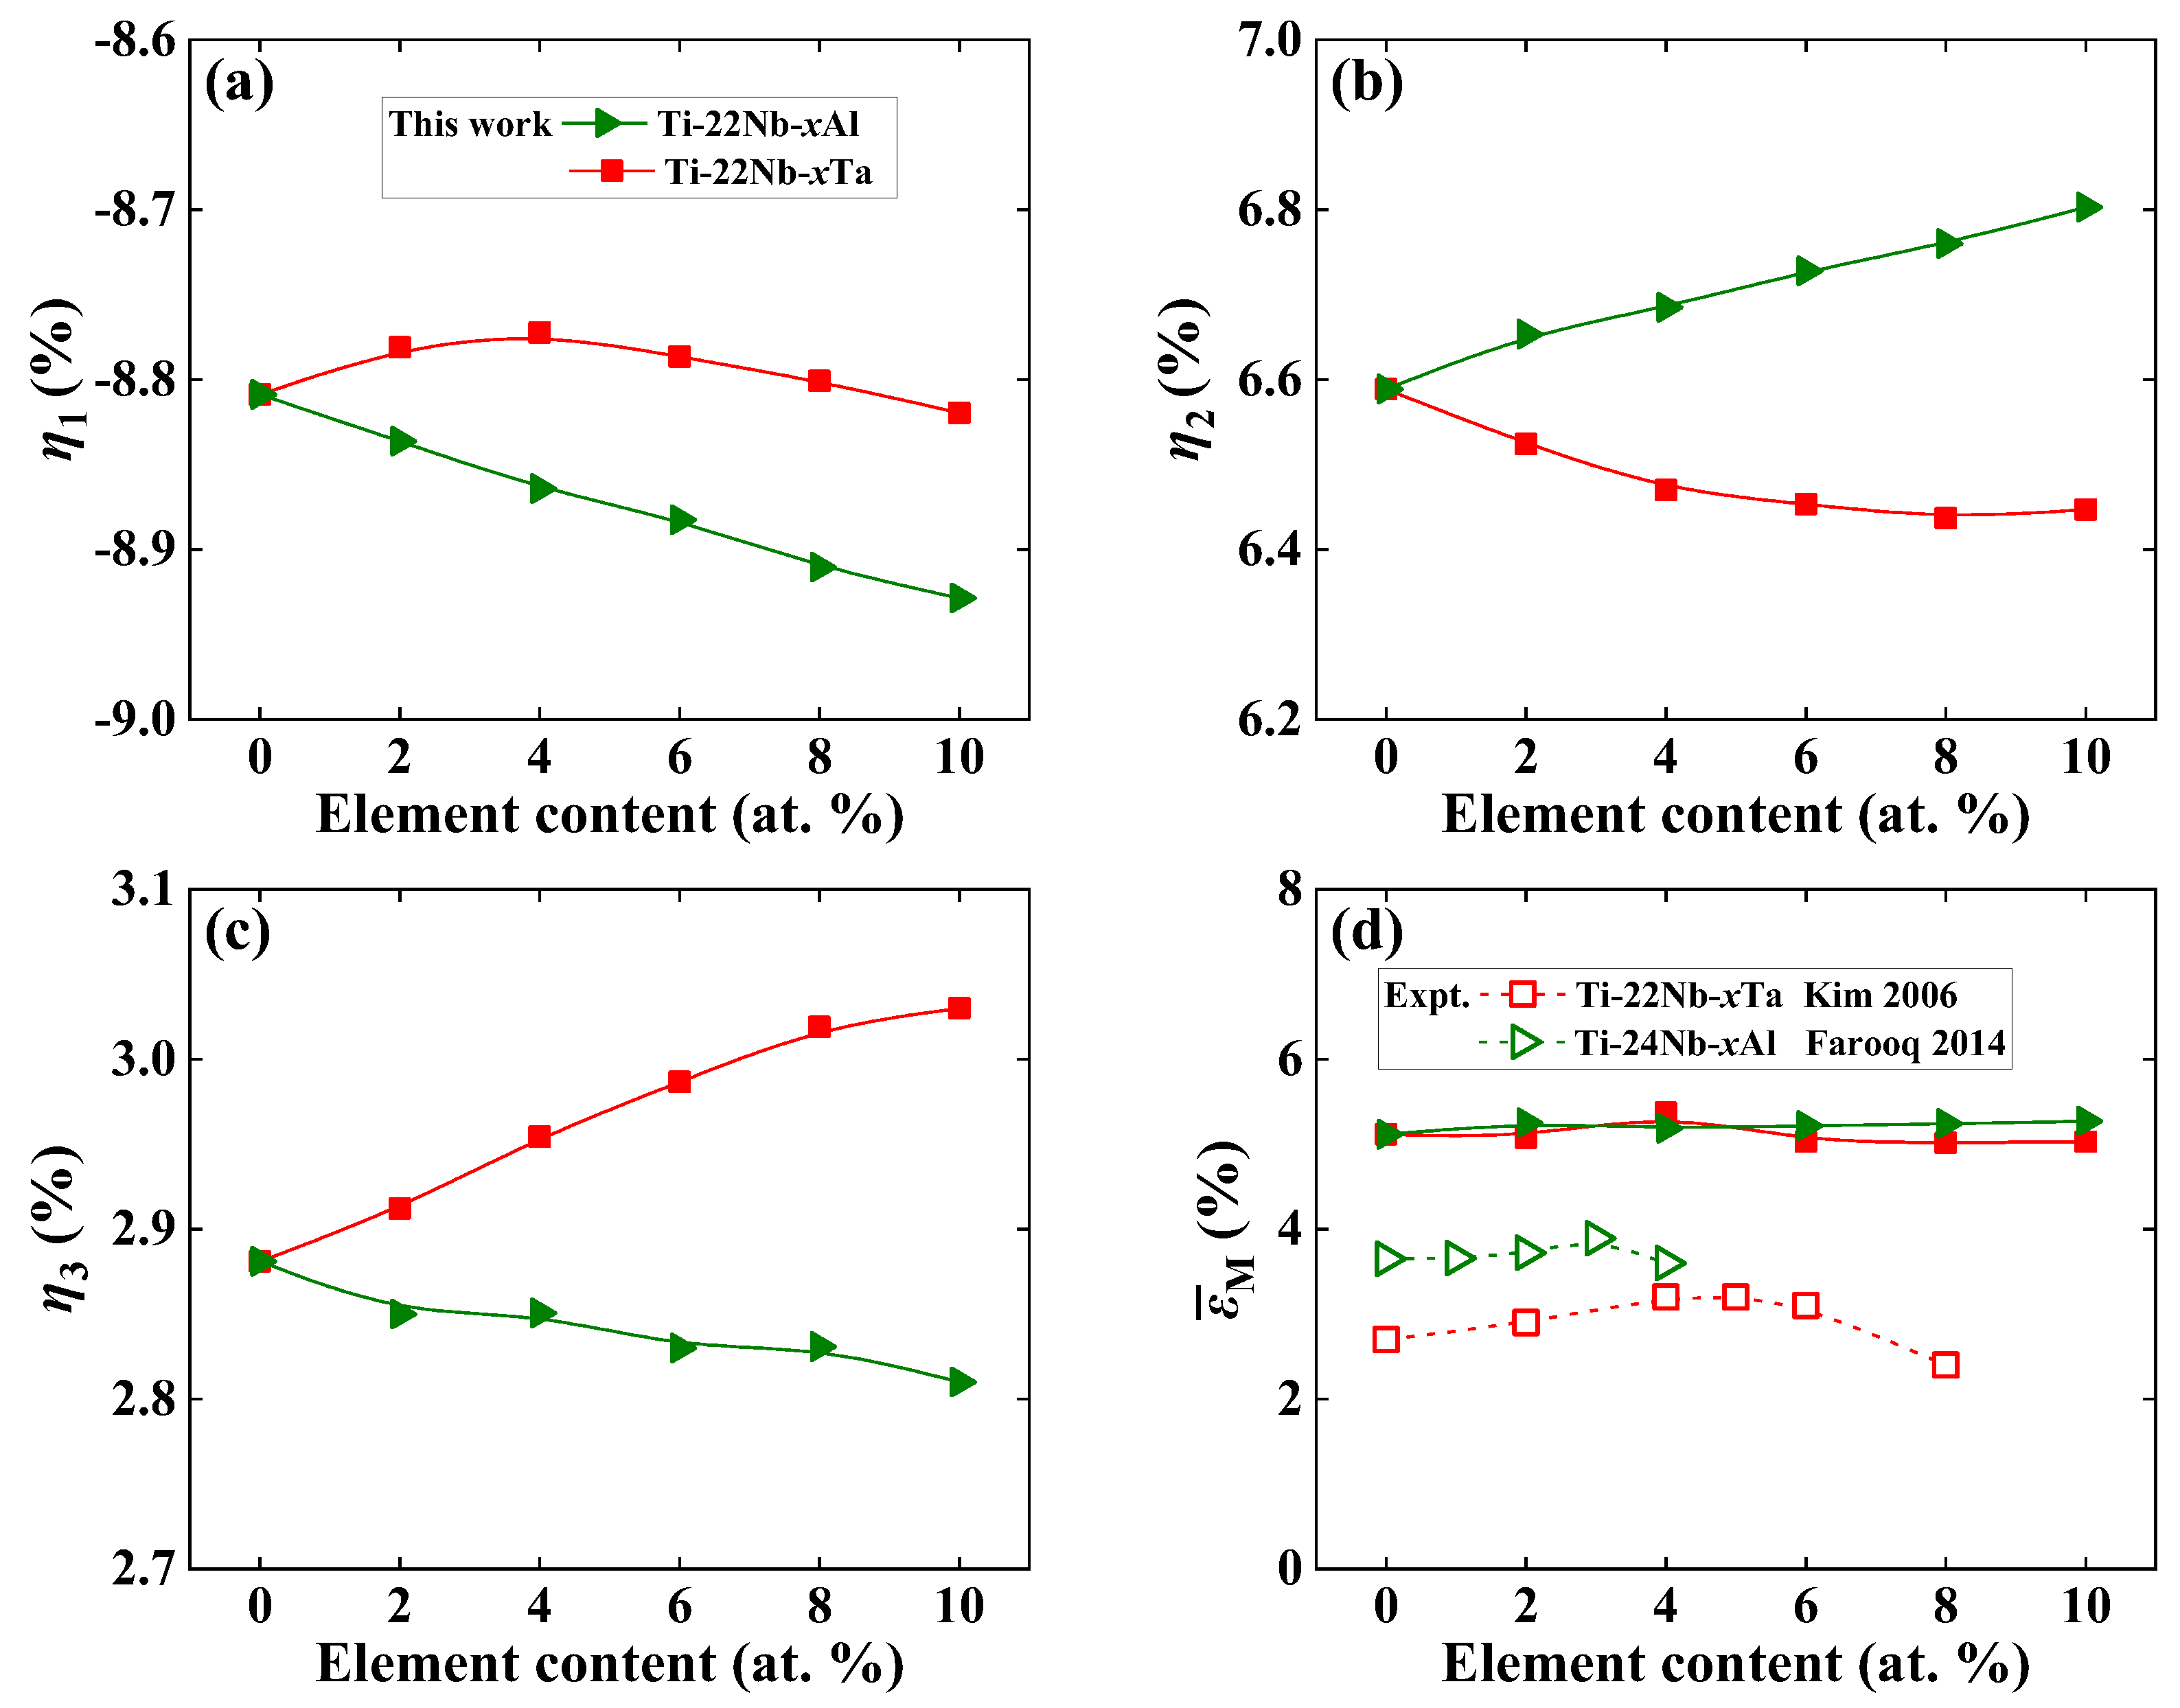
In Figure 2a–c, we display the lattice deformation strains η1, η2, and η3 of Ti−22Nb−xX (x = 0–10, in at. %; X = Al, Ta) using Equation (2). It is generally accepted that there is a positive correlation between lattice strain and recoverable strain in SMAs [32,48]. From Figure 2, it can be observed that η1 is negative, while η2 is positive, indicating that the martensitic contracts (expands) the lattice along the [100]β ([011]β) direction. This finding is consistent with the available measurements in Ti−Nb−Ta [9]. Note that η1 (η3) is the largest (smallest) among all three deformation strains in Ti−Nb−Al and Ti−Nb−Ta ternaries. For Ti−Nb−Al alloys, the absolute magnitudes of η1 and η2 (η3) increase (decreases) with increasing Al content, relative to the increase (decrease) in lattice strain. Additionally, the doping of Al produces different variations in lattice strains, which is different from previous theoretical [48] and measured [41,43] observations in Ti−Nb binary alloys. Unlike Ti−Nb−Al, the composition dependence of η1, η2, and η3 of Ti−Nb−Ta ternary alloys is opposite to that of Ti−Nb−Al. The absolute magnitudes of both η1 and η2 (η3) reduce (increases) with increasing Ta content, implying a decrease (increase) in lattice strain. It is found that the present predicted η2 increases (decreases) with alloying Al (Ta), which is in line with former first-principles calculations [47]. Note that theoretical aβ in the β phase is smaller than the available experimental one by an overall error of 1.2%, as shown in Figure 1. The calculated a′ in the α″ phase is also underestimated, but theoretical b′ and c′ are rather close to the measurements. Therefore, the absolute magnitudes of η1, η2, and η3 calculated by Equation (2) are all larger than the available measurements [6,9,11]. The measured η1, η2, and η3 in Ti−24Nb−3Al [6] are −2.96%, 2.98%, and −0.04%, respectively. The measured η1, η2, and η3 in Ti−17Nb−10Ta [9] are −2.28%, 2.56%, and −0.38%, respectively, and the measured η1, η2, and η3 in Ti−22Nb−6Ta [11] are −2.07%, 2.47%, and −0.44%, respectively.

Figure 2.
Theoretically predicted lattice deformation strains (a) η1, (b) η2, (c) η3, and (d) the predicted average maximum transformation strains, , of Ti−22Nb−xX (x = 0–10, in at. %; X = Al, Ta). For comparison, the available experimental maximum recovery strains [4,7] are also displayed.
Kim et al. [41] proposed an approach to calculate the maximum transformation strain () along a certain orientation and the average maximum transformation strain () for a polycrystal with randomly distributed grains. Following Kim’s approach [41], the lattice distortion matrix (T) during the β → α″ phase transformation relative to the coordinates of the β phase can be illustrated, as in Equation (3):
Supposing a stochastic vector, , in the β phase is transformed to in the α″ phase due to martensitic transition, the maximum transformation strain, , along every orientation, can be evaluated, as in Equation (4):
Kim’s approach has been successfully applied to predict the and of Ti-Nb binaries [41,68] and TiNb-based ternaries [9,66]. To distinguish different strains, Figure S2 in the Supplementary Materials displays the relationship of the lattice deformation strains (η1, η2, and η3), the maximum transformation strain (), and the average maximum transformation strain (). According to Equations (3) and (4), 57 representative orientations (i.e., the vertex and the midpoint of the edge at each standard stereographic triangle, as shown in Figure S3a) located in the standard stereographic circle are chosen to exhibit the stereographic projections of lattice strains along (100)β and (001)β, respectively.
Based on Kim’s [41] approach, as shown in Equations (3) and (4), we first choose 13 representative orientations located in the [001]−[011]−[111] standard stereographic triangle (shown in the Figure S3b) and calculate the along these orientations. Consequently, the predicted can be obtained by spline interpolation of the . Thus, we compare the calculated for both Ti−Nb−Al and Ti−Nb−Ta alloys in Figure 2d, along with the available measured maximum recovery strains [4,7] for comparison. According to Figure 2d, the predicted by Equations (3) and (4) for Ti−Nb−Al and Ti−Nb−Ta ternaries are higher than the experimental values. This is partially from the underestimation of theoretical aβ and a′ in the β and α″ phase. Furthermore, the measured recovered strains also depend on the tensile strains, which are limited due to the increasing remaining plastic strain. Despite the fact that the predicted for both alloys are somehow overestimated compared to those of the experimental counterparts, the composition dependence of theoretical reproduces the measurements [4,7]. From Figure 2d, it can be observed that the theoretical first weakly increases and then decreases with an increase in Al and Ta contents, and reaches a maximum of 5.34% (5.25%) in Ti−22Nb−4Ta (Ti−22Nb−2Al). It can be observed that the maximum recovery strain is about 3.89% in Ti−24Nb−3Al [4] and 3.20% in both Ti−22Nb−4Ta and Ti−22Nb−5Ta [7] at RT, respectively. For lower Al and Ta contents, the effect of solid solution strengthening plays a leading role in the increase in the recovered strain [4,44,69]. With increasing Al and Ta contents, the critical stress may become the dominant factor in the previous measurements for TiNb-based alloys [4,7,54,66,70,71]. From Figure 2d, it can be observed that both the predicted and measured of Ti−Nb−Al (except for Ti−22Nb−4Al) are higher than those of Ti−Nb−Ta, despite the different magnitudes of that appear in our 0 K calculations and RT measurements [4,7]. The deviation for Ti−Nb−Al may originate from the different compositions used in our calculations and available measurements [4] and intermetallic compounds or second-phase particles in the experiments [4,7].
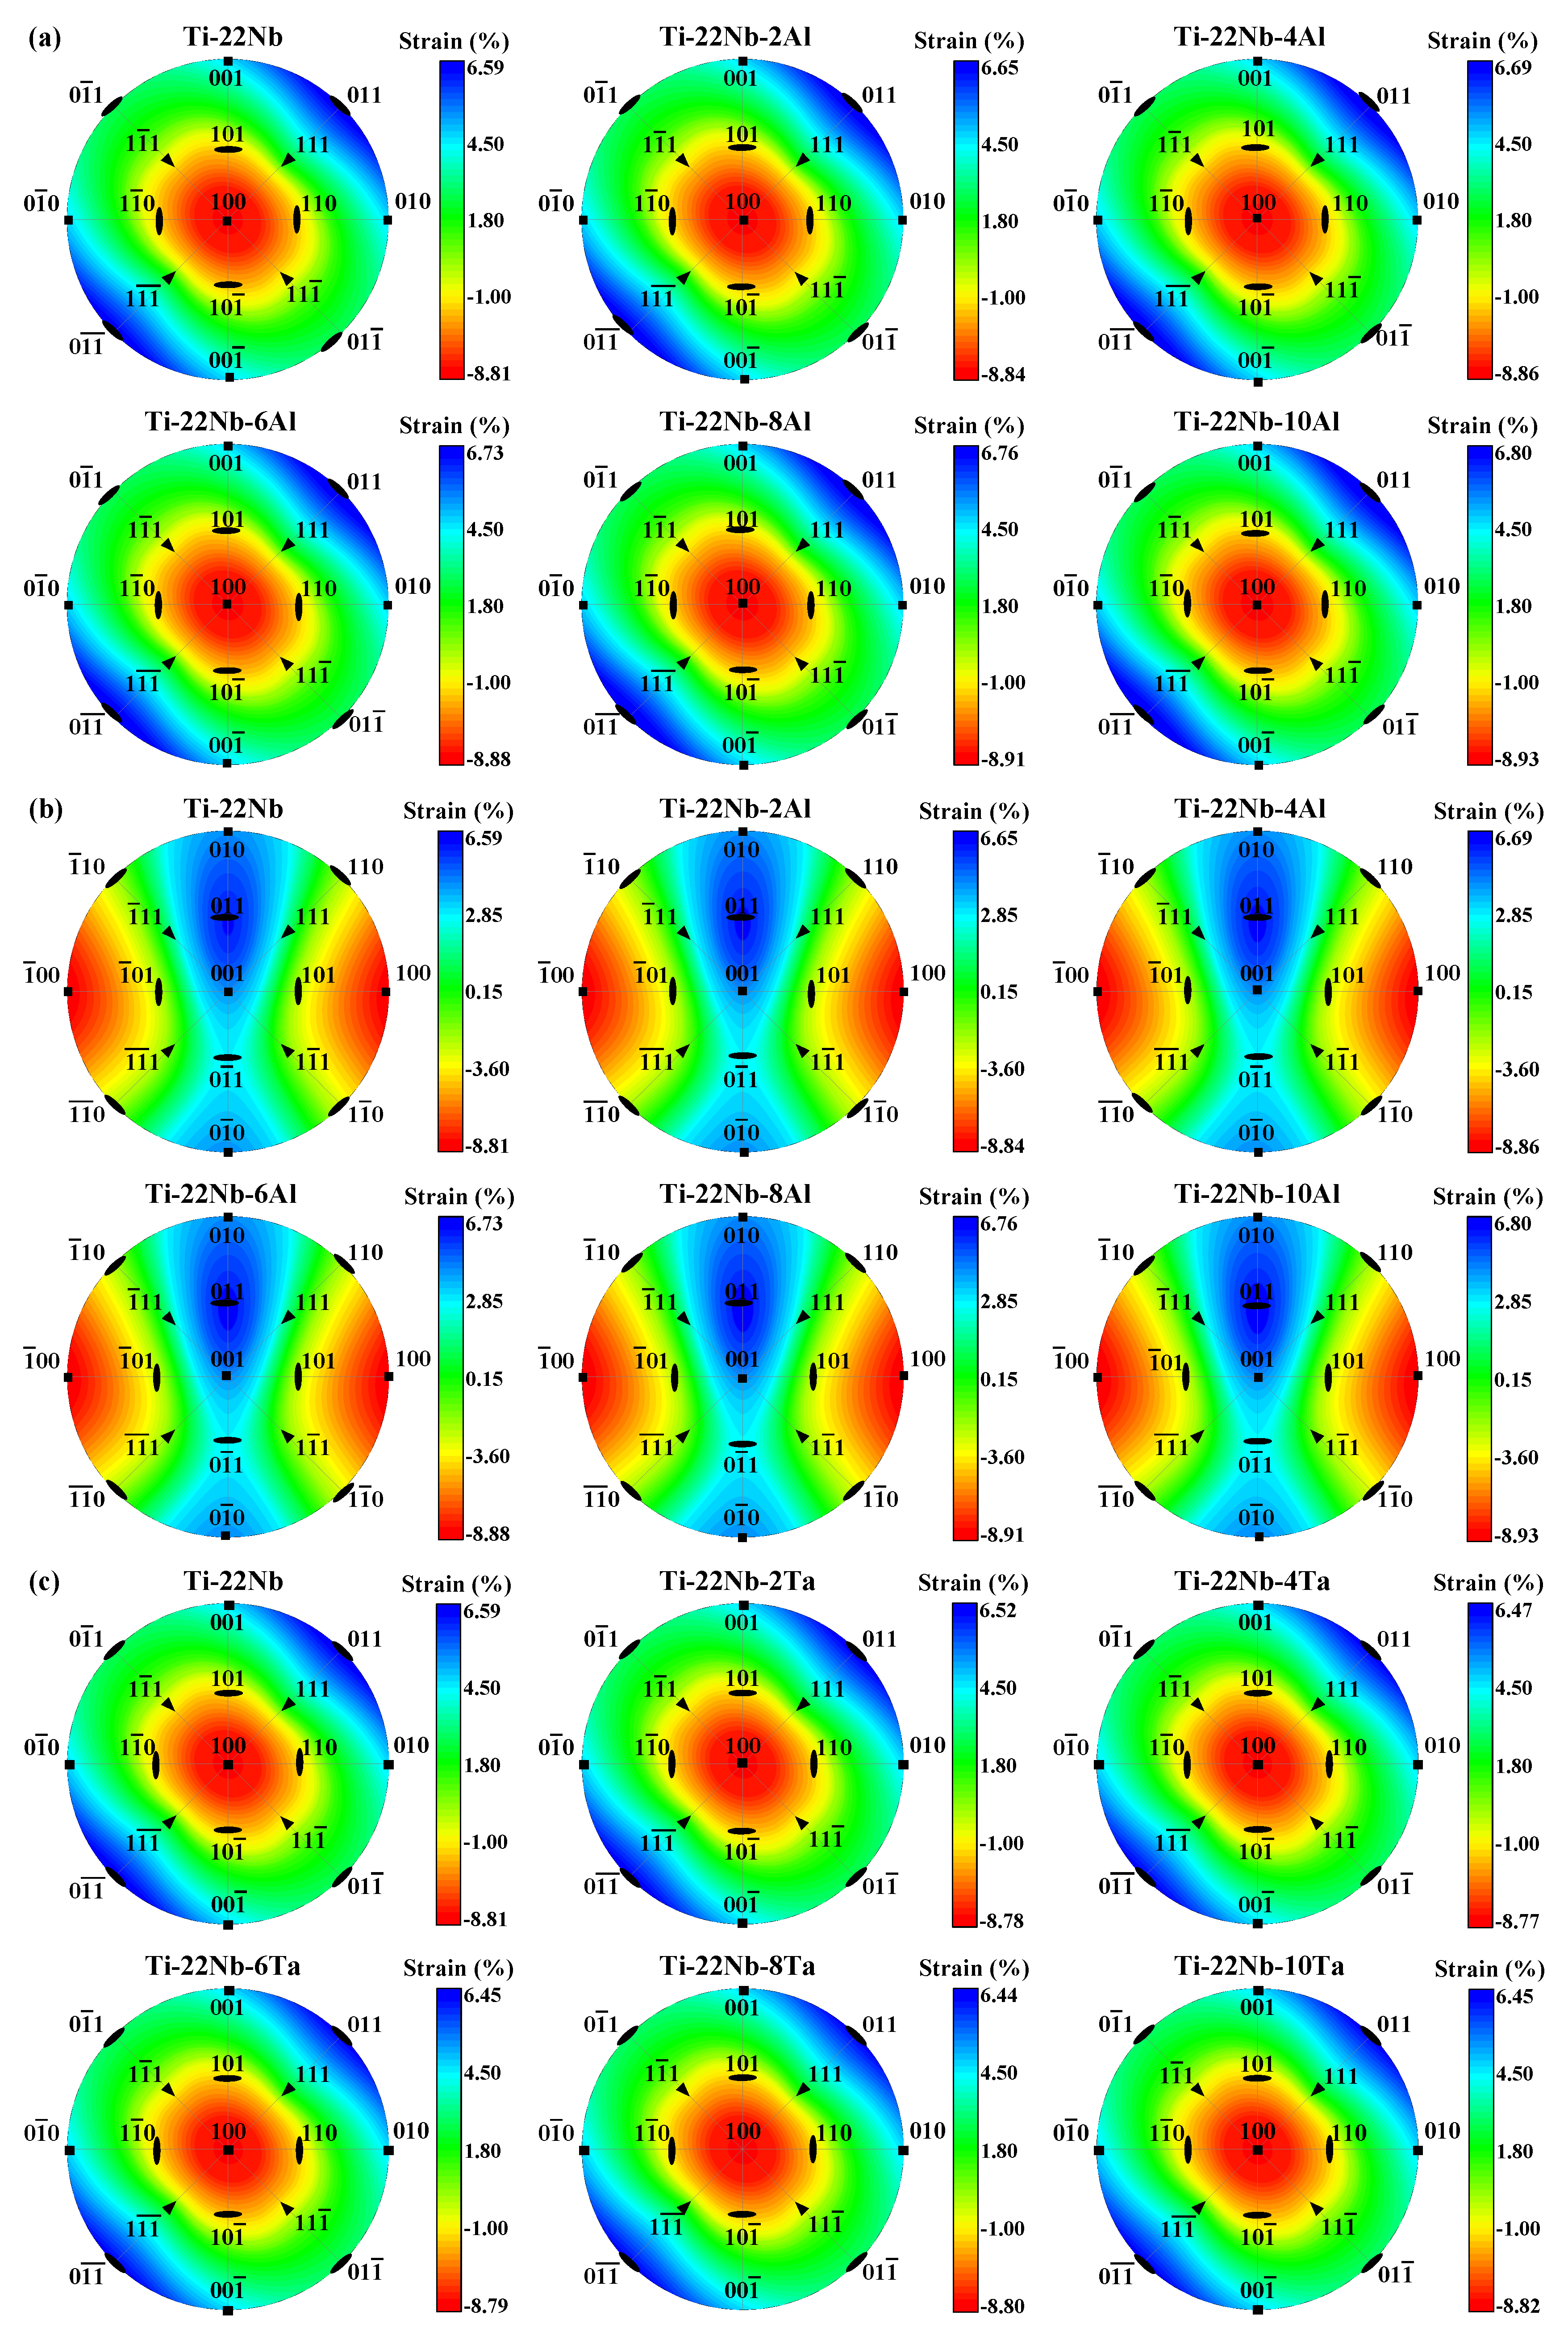
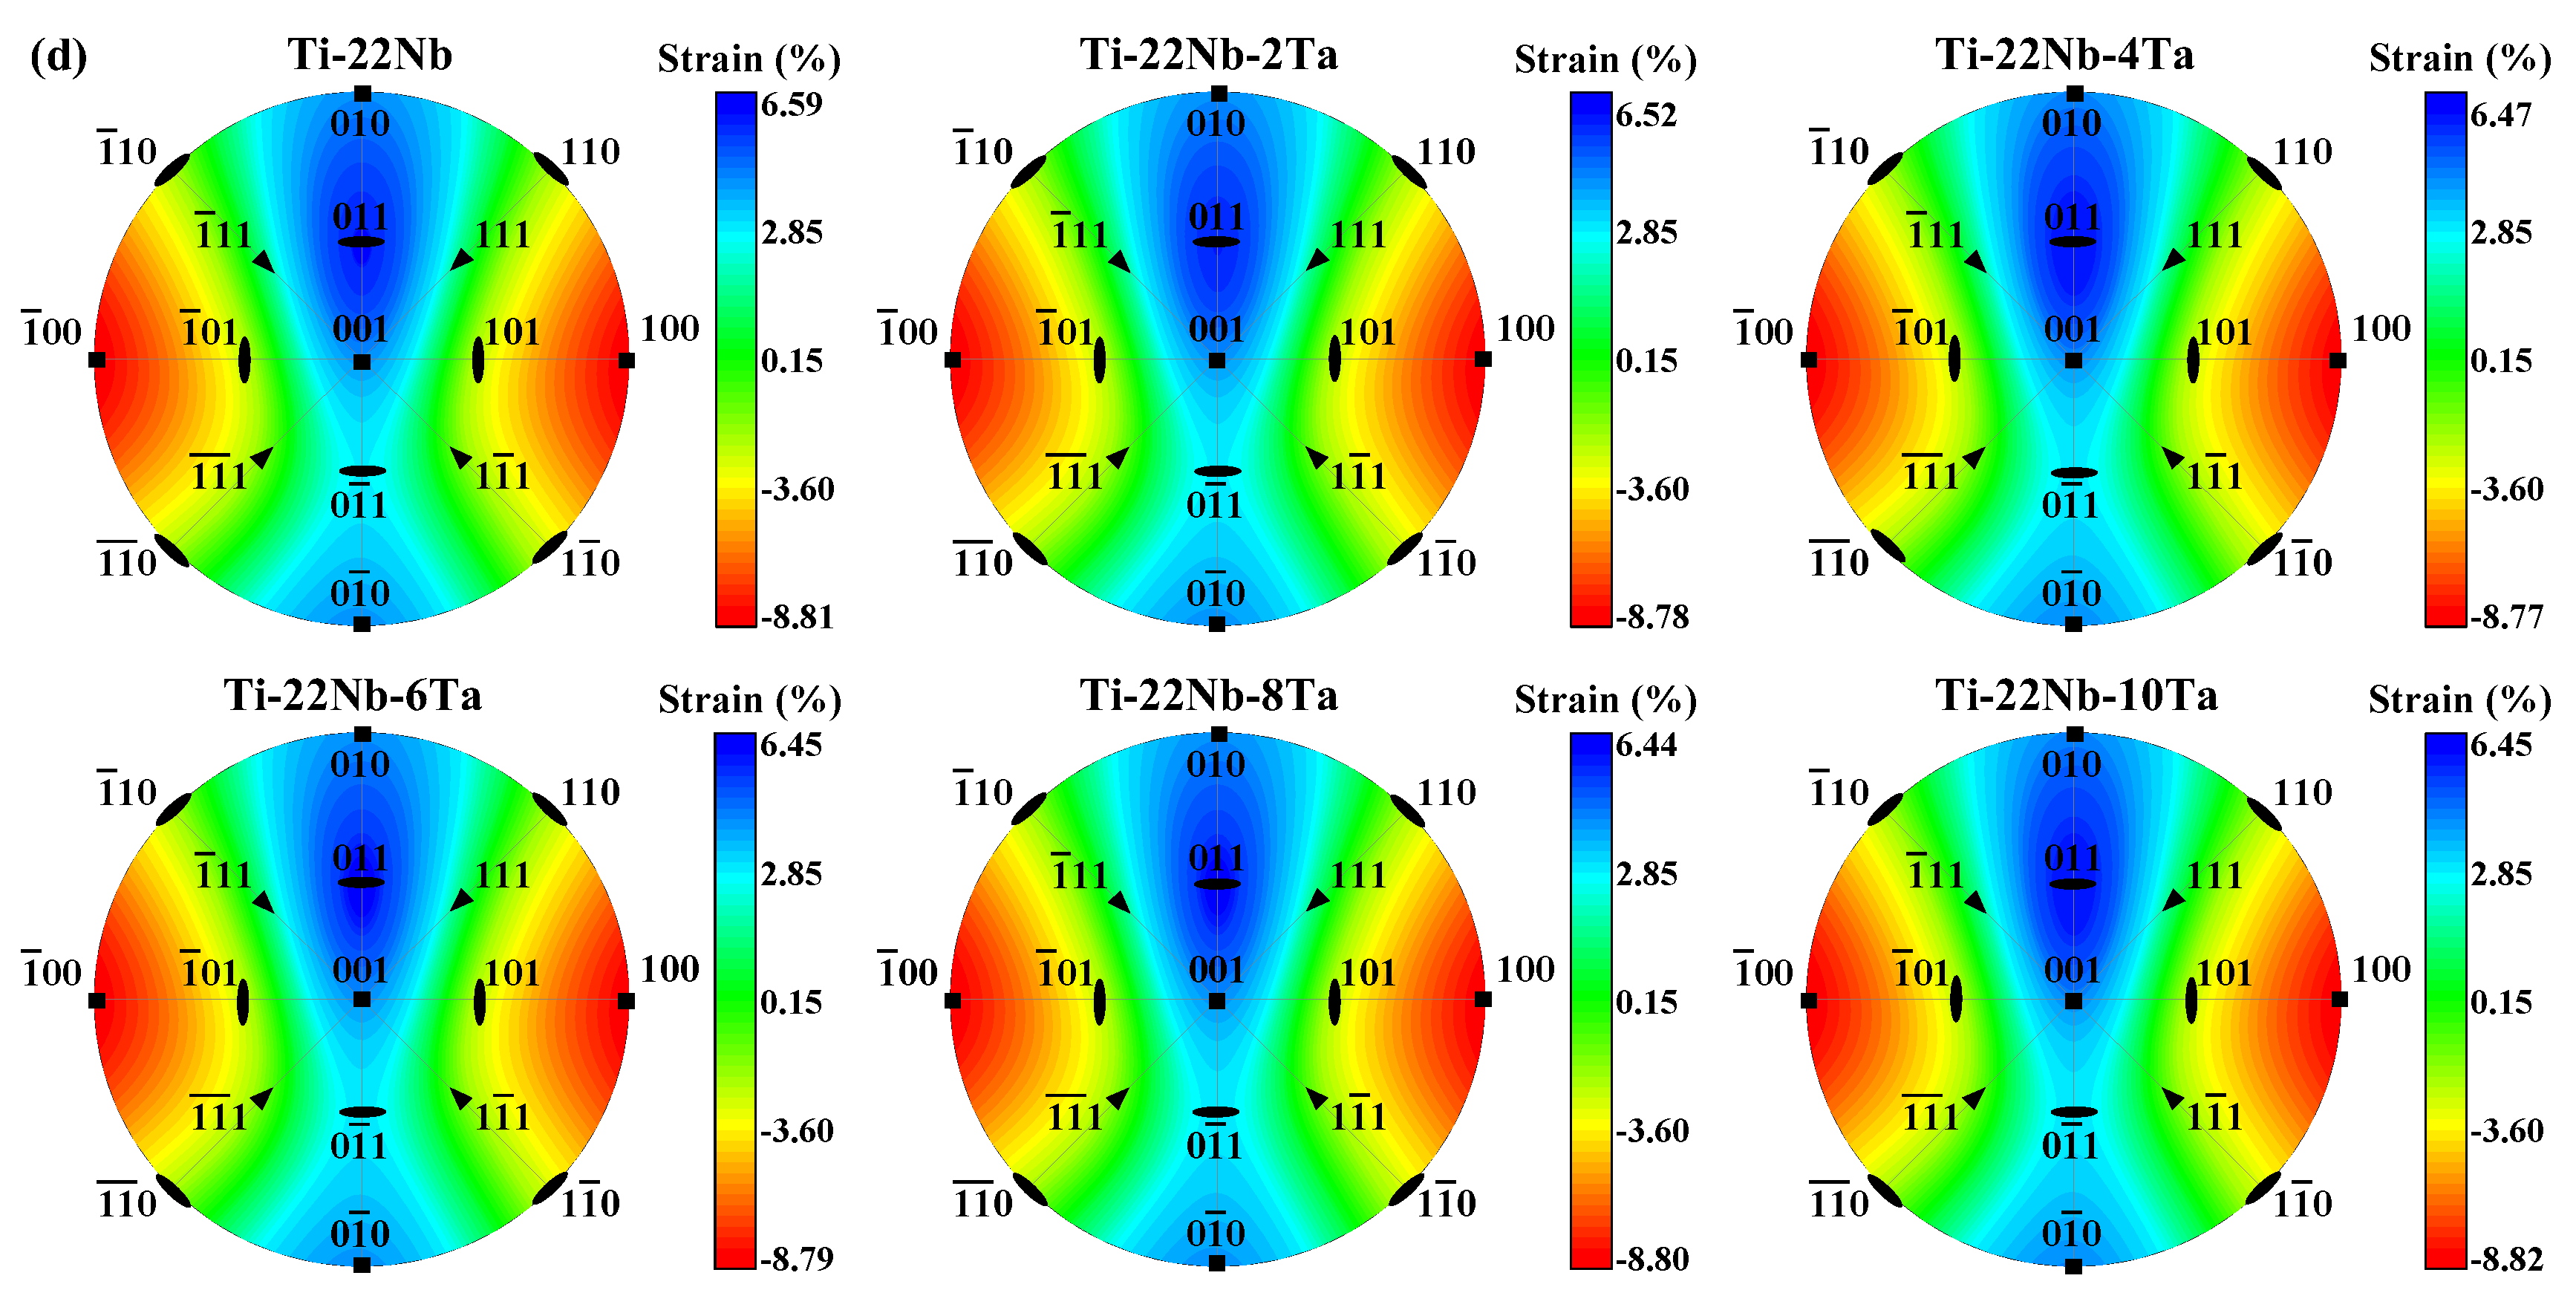
In Figure 3, we demonstrate the contour plots of the lattice strain (Equation (4)) using stereographic projections on the (100)β and (001)β of the β unit cell in Ti−Nb−Al and Ti−Nb−Ta ternary alloys. For the sake of simplicity, only 17 orientations are marked in Figure 3. Deviations from uniform coloring easily illustrate the direction and degree of deviatoric behavior. The red (blue) color of the contour plots denotes the maximum negative (positive) strain. The contour plots indicate the maximum transformation strains of the martensitic transformations in Ti−Nb−Al and Ti−Nb−Ta ternary alloys. From Figure 3, it can be distinctly observed that the largest elongations are along ±[011]β and that the largest compressions occur along ±[100]β for Ti−Nb−Al and Ti−Nb−Ta alloys, agreeing with the observations on Ti−Nb binary alloys [68]. As shown in Figure 3a,b, an increase in elongated lattice strain ranges from 6.59% to 6.80% as Al content increases, while an increase in contracted lattice strain ranges from 8.81% to 8.93% for Ti−Nb−Al alloys. Namely, the largest contraction and the largest elongation in Ti−Nb−Al alloys linearly increases by 0.02 and 0.07%/at. %, respectively. The situation becomes different for the Ti−Nb−Ta system. From Figure 3c,d, it can be observed that the largest contraction in the Ti−Nb−Ta alloys remains almost constant at around 8.80%, while the largest elongation decreases by 0.03%/at. % with increasing Ta content.
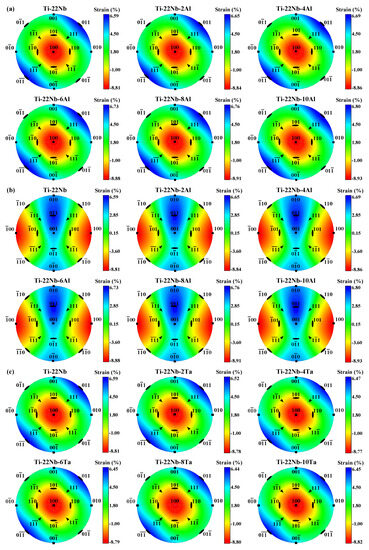
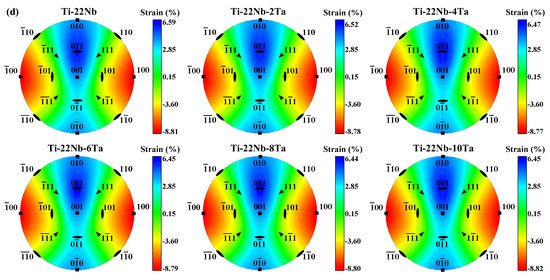
Figure 3.
Stereographic projections of the lattice strains associated with the β → α″ phase transformation (a,c) along (100)β and (b,d) along (001)β for Ti−22Nb−xX (x = 0–10, in at. %; X = Al, Ta) from Equations (3) and (4). The largest elongation and the largest compression appear along ±[011]β and ±[100]β, respectively.
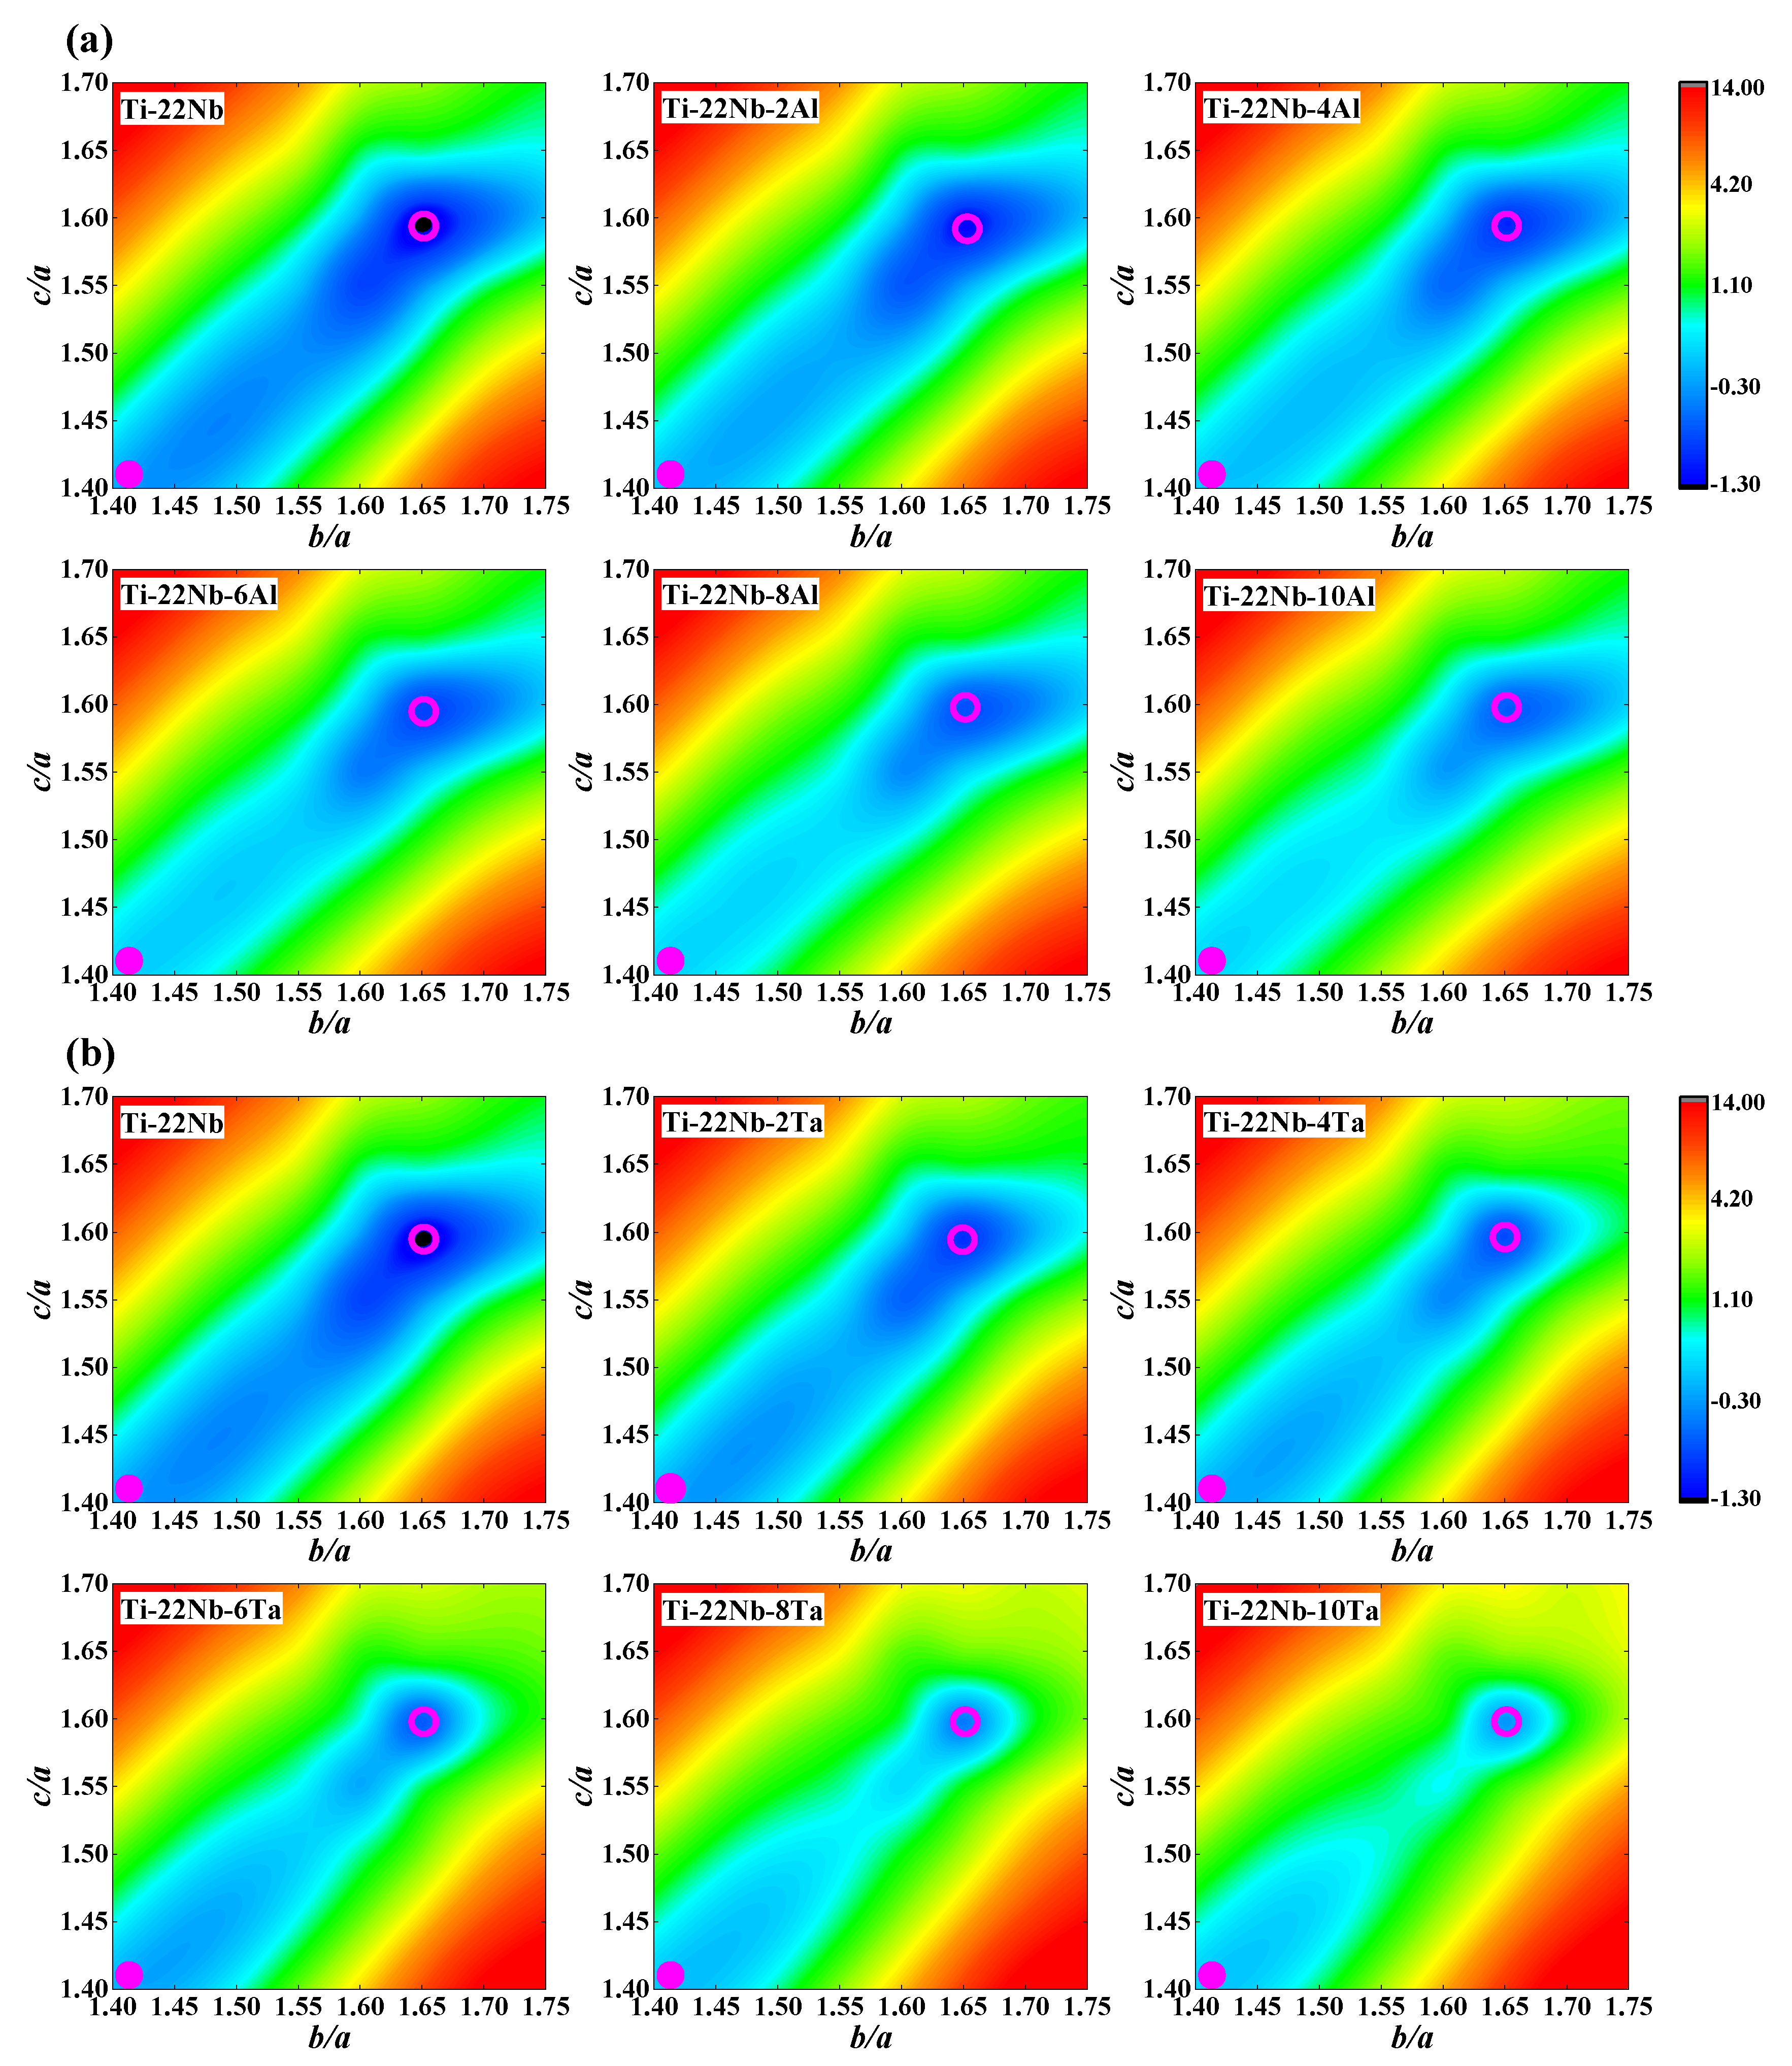
We calculate the total energies, E, at the corresponding equilibrium volume (Figure 1a) of the β phase in each composition. After fixing the shuffle y, the total energy contours of the β to α″ phase transformation for Ti−22Nb−xX (x = 0–10, in at. %; X = Al, Ta) are plotted in Figure 4 as a function of the ratios of b/a and c/a. From Figure 4, it can be seen that the most stable phase in the Ti−22Nb binary alloy appears to be the α″ phase (c/a = 1.60, b/a = 1.65), which is in line with the available experimental results [72,73,74] on Ti−Nb binaries. The c/a and b/a of the α″ phase (as shown in Table S1) for the Al-containing and Ta-containing ternaries remain almost unchanged, agreeing with the available measurement on Ti−Nb−Ta alloys [9]. Additionally, the predicted shuffle y (as shown in Table S1) for Ti−Nb−Ta ternary alloys is almost constant and is around 1.50, while the calculated y for Ti−Nb−Al alloys declines from 1.50 to 1.43 with increasing Al content. This finding indicates that Al has a greater ability to lower shuffle y than Ta, suggesting greater capacity on the lattice distortion induced by Al.
Figure 4.
Total energy contours (in mRy) of the β and α″ phase transformation for (a) Ti−22Nb−xAl (x = 0–10, in at. %) and (b) Ti−22Nb−xTa (x = 0–10, in at. %) ternary alloys as a function of the ratios of b/a and c/a from first-principles calculations. All energies are plotted relative to the corresponding β phase minima. The pink solid circles and pink open circles represent the β and α″ phases, respectively.
The energy difference, ΔEβ→α″ (ΔEβ→α″ = Eα″ − Eβ, in mRy), between the β and α″ phases indicates the relative stability of the β and α″ phases. The ΔEβ→α″ < 0 shows that the α″ phase is more stable than the β phase. If the absolute value of the ΔEβ→α″ becomes smaller with increasing alloying elements, the relative stability of the α″ phase is regularly weakened and the ability to generate the β phase is gradually promoted. From Figure 4, it can be seen that the change in ΔEβ→α″ in the Ti−Nb−Al system is from −1.12 to −0.94 mRy with increasing Al content, revealing that the relative stability of the α″ phase weakly decreases. The ΔEβ→α″ of Ti−Nb−Ta alloys varies from −1.12 to −0.39 mRy with increasing Ta content, implying that the relative stability of the α″ phase strongly decreases. This finding demonstrates that Ta [7,75] is a much stronger β stabilizer in Ti alloys than Al [26], implying that Ta distinctly promotes the formation of the β phase when compared to doping Al. The available measurements have shown that both Nb and Al can act as β stabilizers in TiNb-based alloys [26,54,70,71]. From Figure 4, it can be observed that both Al and Ta can reduce energy differences in different magnitudes, but Ta shows a much stronger ability to stabilize the β phase than Al. Moreover, Al can reduce the energy difference between the β and α″ phases in Ti−Ta−Al ternary alloys [27].
For the sake of convenience, the martensitic transformation temperature is investigated based on a proposed hypothesis. In this work, we approximate the two Ti−Nb−Al and Ti−Nb−Ta ternaries into individual Ti−(Nb + Al) and Ti−(Nb + Ta) pseudobinaries, respectively. Since the measured Ms decreases by 40, 40, and 30 K with an increase of 1 at. % Nb, Al, and Ta, respectively, it is indicated that the doping of Nb [41], Al [4,5,6,54], and Ta [7] shows a similar magnitude order on the Ms. Alternatively, it is found that the calculated ΔEβ→α″ for different Ti−Nb−Al alloys having the same (Nb + Al) content is almost the same (as shown in Figure S4). Namely, our calculated ΔEβ→α″ is insensitive to specific alloy components. Therefore, it is assumed that different Ti−Nb−Al alloys approximately possess the same ΔEβ→α″ if Ti−Nb−Al alloys contain the same (Nb + Al) content. Like Ti−Nb−Al, the Ti−Nb−Ta system having the same (Nb + Ta) content exhibits the same ΔEβ→α″. Consequently, Table 1 shows that Ti−Nb−X alloys containing the same (Nb + X) (X = Al, Ta) content have the same predicted Ms due to the same ΔEβ→α″ based on our pseudobinary hypothesis. For example, the ΔEβ→α″ of both Ti−23Nb−3Al and Ti−24Nb−2Al is the same as that of Ti−22Nb−4Al since these three alloys contain the same (Nb + Al) content. Namely, they have the same ΔEβ→α″ of −1.141 mRy and then possess the same predicted of 335.2 K.

Table 1.
Theoretically calculated energy difference (ΔEβ→α″, in mRy) between the β and α″ phases and estimated martensitic transformation temperature (Ms, in K) for Ti−Nb−Al and Ti−Nb−Ta (in at. %) alloys. Note that the predicted and are derived from Equations (5) and (6), respectively. For comparison, we show the available experimental [4,6] and [7] and the evaluated from former empirical relationships [48].
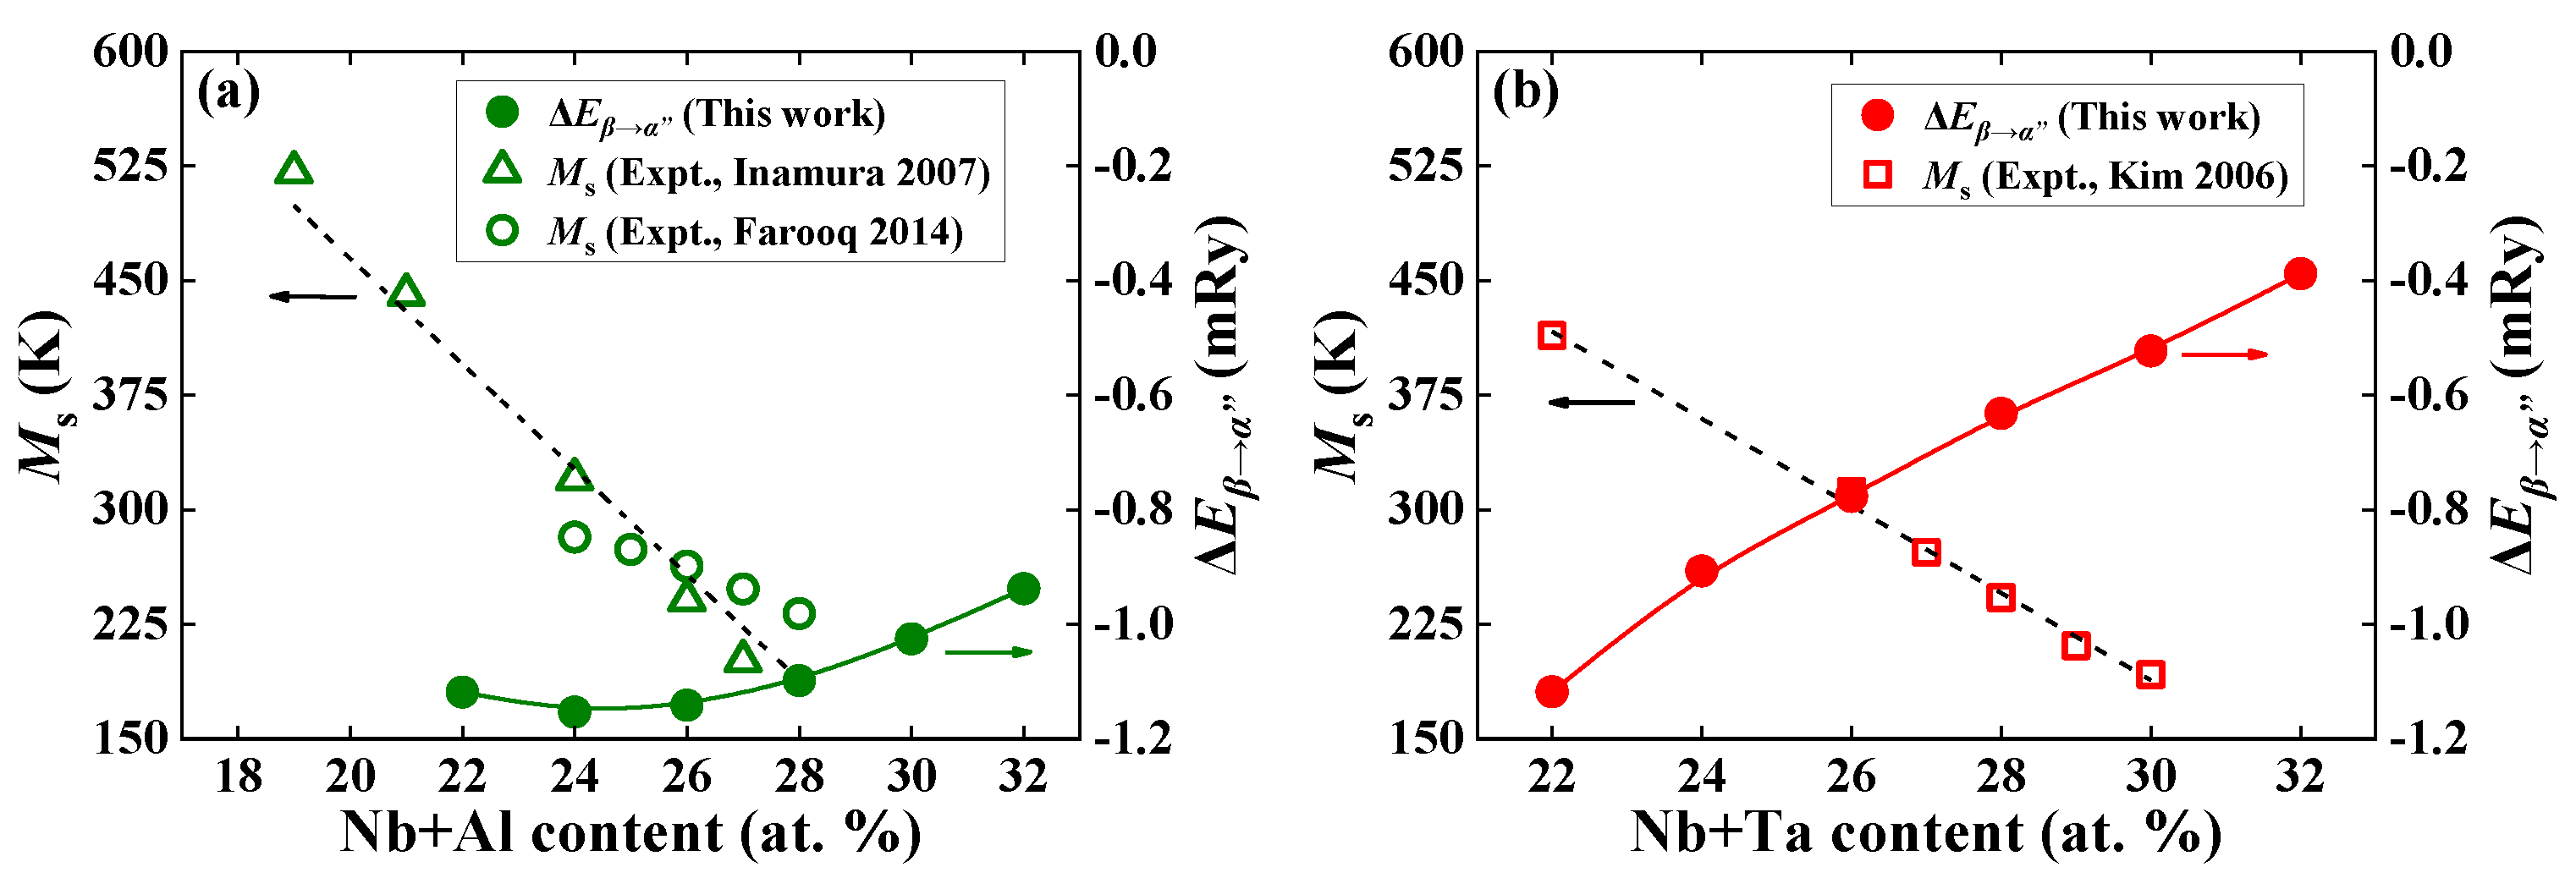
Figure 5a,b plot the available measured Ms [4,6,7] and the present theoretical ΔEβ→α″ for Ti−22Nb−xX (x = 0–10, X = Al, Ta) ternary alloys as functions of the (Nb + X) (X = Al, Ta) content. Note that the values of the ΔEβ→α″ are all negative, indicating that the α″ phase is more stable than the β phase. The absolute value of ΔEβ→α″ decreases with increasing Al and Ta contents, signifying that the relative stability of the α″ phase is gradually weakened and the tendency to generate the β phase is enhanced. This finding agrees with the available observations on Ti−Nb−Al [4] and Ti−Nb−Ta [7].

Figure 5.
Theoretically calculated energy difference (ΔEβ→α″, in mRy) for (a) Ti−22Nb−xAl (x = 0–10, in at. %) and (b) Ti−22Nb−xTa (x = 0–10, in at. %) as a function of alloying elements, as well as the available measured martensitic transformation temperature (Ms, in K) [4,6,7]. The measured alloys are Ti−(16, 18, 23, 24)Nb−3Al [6], Ti−24Nb−(0–4)Al [4], and Ti−22Nb−(4–8)Ta [7] ternary alloys. For completeness, Ti−22Nb [7] and Ti−24Nb [6] binary alloys are also displayed.
It is still a challenge to directly predict the Ms using a first-principles method. Based on former first-principles calculations [47,48], the lower the absolute ΔEβ→α″, the lower the Ms. Furthermore, Minami et al. [47] and Sun et al. [48] correlated the Ms and the ΔEβ→α″ between the β and α″ phase for Ti−Nb binaries. Their correlations can qualitatively predict the composition dependence of the Ms. However, the evaluated Ms derived from their empirical relationships [47,48] greatly overestimated the measurements overall. Despite the fact that the alloying effect on TiNb-based ternaries [47,48] and high-entropy alloys [48] has been qualitatively investigated, there is no quantitative research on TiNb-based ternary systems. Furthermore, extensive experimental observations have used different functions, such as linear [41,43,47], 1.5 degrees [45], and cubic polynomial [46], to fit the Ms for different Ti−Nb binary alloys. Therefore, these functions [41,43,45,46,47] used in binary systems may lower the accuracy of Ti-based ternary and multicomponent alloys due to the ignorance of the coupling effect of alloying elements. In this work, the coupling effect of alloying elements is considered by adopting a pseudobinary hypothesis on Ti−(Nb + Al) and Ti−(Nb + Ta) systems.
Here, we construct the relationships between the calculated composition-dependent ΔEβ→α″ for Ti−(Nb + Al) and Ti−(Nb + Ta) pseudobinaries with the measured Ms. In this way, one may accurately determine the Ms employing first-principles calculations.
Since the alloying elements Al and Ta have different influences on the energy difference between the β and α″ phase, we separately fit two empirical relationships by connecting our theoretical ΔEβ→α″ with the measured Ms for Ti−Nb−Al [4,6] and Ti−Nb−Ta [7] alloys. For the Ti−Nb−Al system, an empirical relationship derived from Figure 5a can be expressed, as in Equation (5):
For the Ti−Nb−Ta system, another empirical relationship draw from Figure 5b can be fitted, as in Equation (6):
where the unit of and is K, and the unit of ΔEβ→α″ is mRy. Although Al and Ta have similar alloying effects on the Ms, their influences on the energy difference, ΔEβ→α″, are different. As shown in Equations (5) and (6), the different coefficients of ΔEβ→α″ for Al-containing and Ta-containing systems are 1.13 and 4.36, respectively. Based on the ΔEβ→α″ calculated from first-principles calculations, the theoretical Ms for Ti−Nb−Al and Ti−Nb−Ta alloys can be quickly predicted from Equations (5) and (6), respectively.
To assess the reliability of the predicted by Equation (5) and by Equation (6), Table 1 displays the present predicted and , the available and [4,6,7], and the estimated from former empirical relationships [48] for Ti−Nb−Al and Ti−Nb−Ta alloys. The composition dependence of the present predicted Ms for Ti−Nb−Al and Ti−Nb−Ta alloys reproduces their experimental counterparts. For Ti−Nb−Ta, the average error between the predicted by Equation (6) and available [7] is about 4%. Compared to the current and , the predicted by former empirical relationships [48] shows the unreasonable composition dependence of Ti−Nb−Al and Ti−Nb−Ta alloys and is greatly overestimated relative to the experimental counterparts [4,6,7]. When compared to the measurements [4,6], an opposite alloying effect of Al on the Ms can be estimated by fitting an empirical equation [45]. Therefore, the present empirical relationships of Equations (5) and (6) accurately predict the Ms, corresponding to former empirical relationships [45,48]. As shown in Table 1, the error between and is relatively smaller than that of and . The deviation in Equation (5) for Ti−Nb−Al may result from the different alloy compositions used in our calculated ΔEβ→α″ and the measured [4,6]. The prediction of Equation (5) may further deteriorate for higher (Nb + Al) contents, such as the predicted of −85.5 K for Ti−22Nb−10Al.
As shown in Table 1 and Figure 6, both the present predictions and available measurements [4,6,7] qualitatively predict the similar composition dependence of Ms, despite the fact that the predicted and are somehow higher than the relative and . The predicted Ms decreases by 28 and 30 K with an increase of 1 at. % Al and Ta, corresponding to a decrease in the measured Ms by 13 [4] and 30 K [7], respectively. Both and begin to fall below RT when x > 4 at. % Ta. The case is quite complex for Ti−Nb−Al. The predicted for Ti−22Nb−xAl starts to fall below RT if x > 6 at. % Al. However, the for Ti−23Nb−xAl and Ti−24Nb−xAl (except for Ti−24Nb−4Al) are above RT, while the [4,6] are below RT. However, the predicted decreases by 46 K/1 at. % Nb for Ti−(23–24)Nb−3Al alloys, which is consistent with the measured decline of 40 K and 40 K for Ti−Nb binary alloys [41] and Ti−Nb−Al ternary alloys [6], respectively. This finding suggests that the coupling effect of alloying elements are appropriately described based on our pseudobinary hypothesis.

Figure 6.
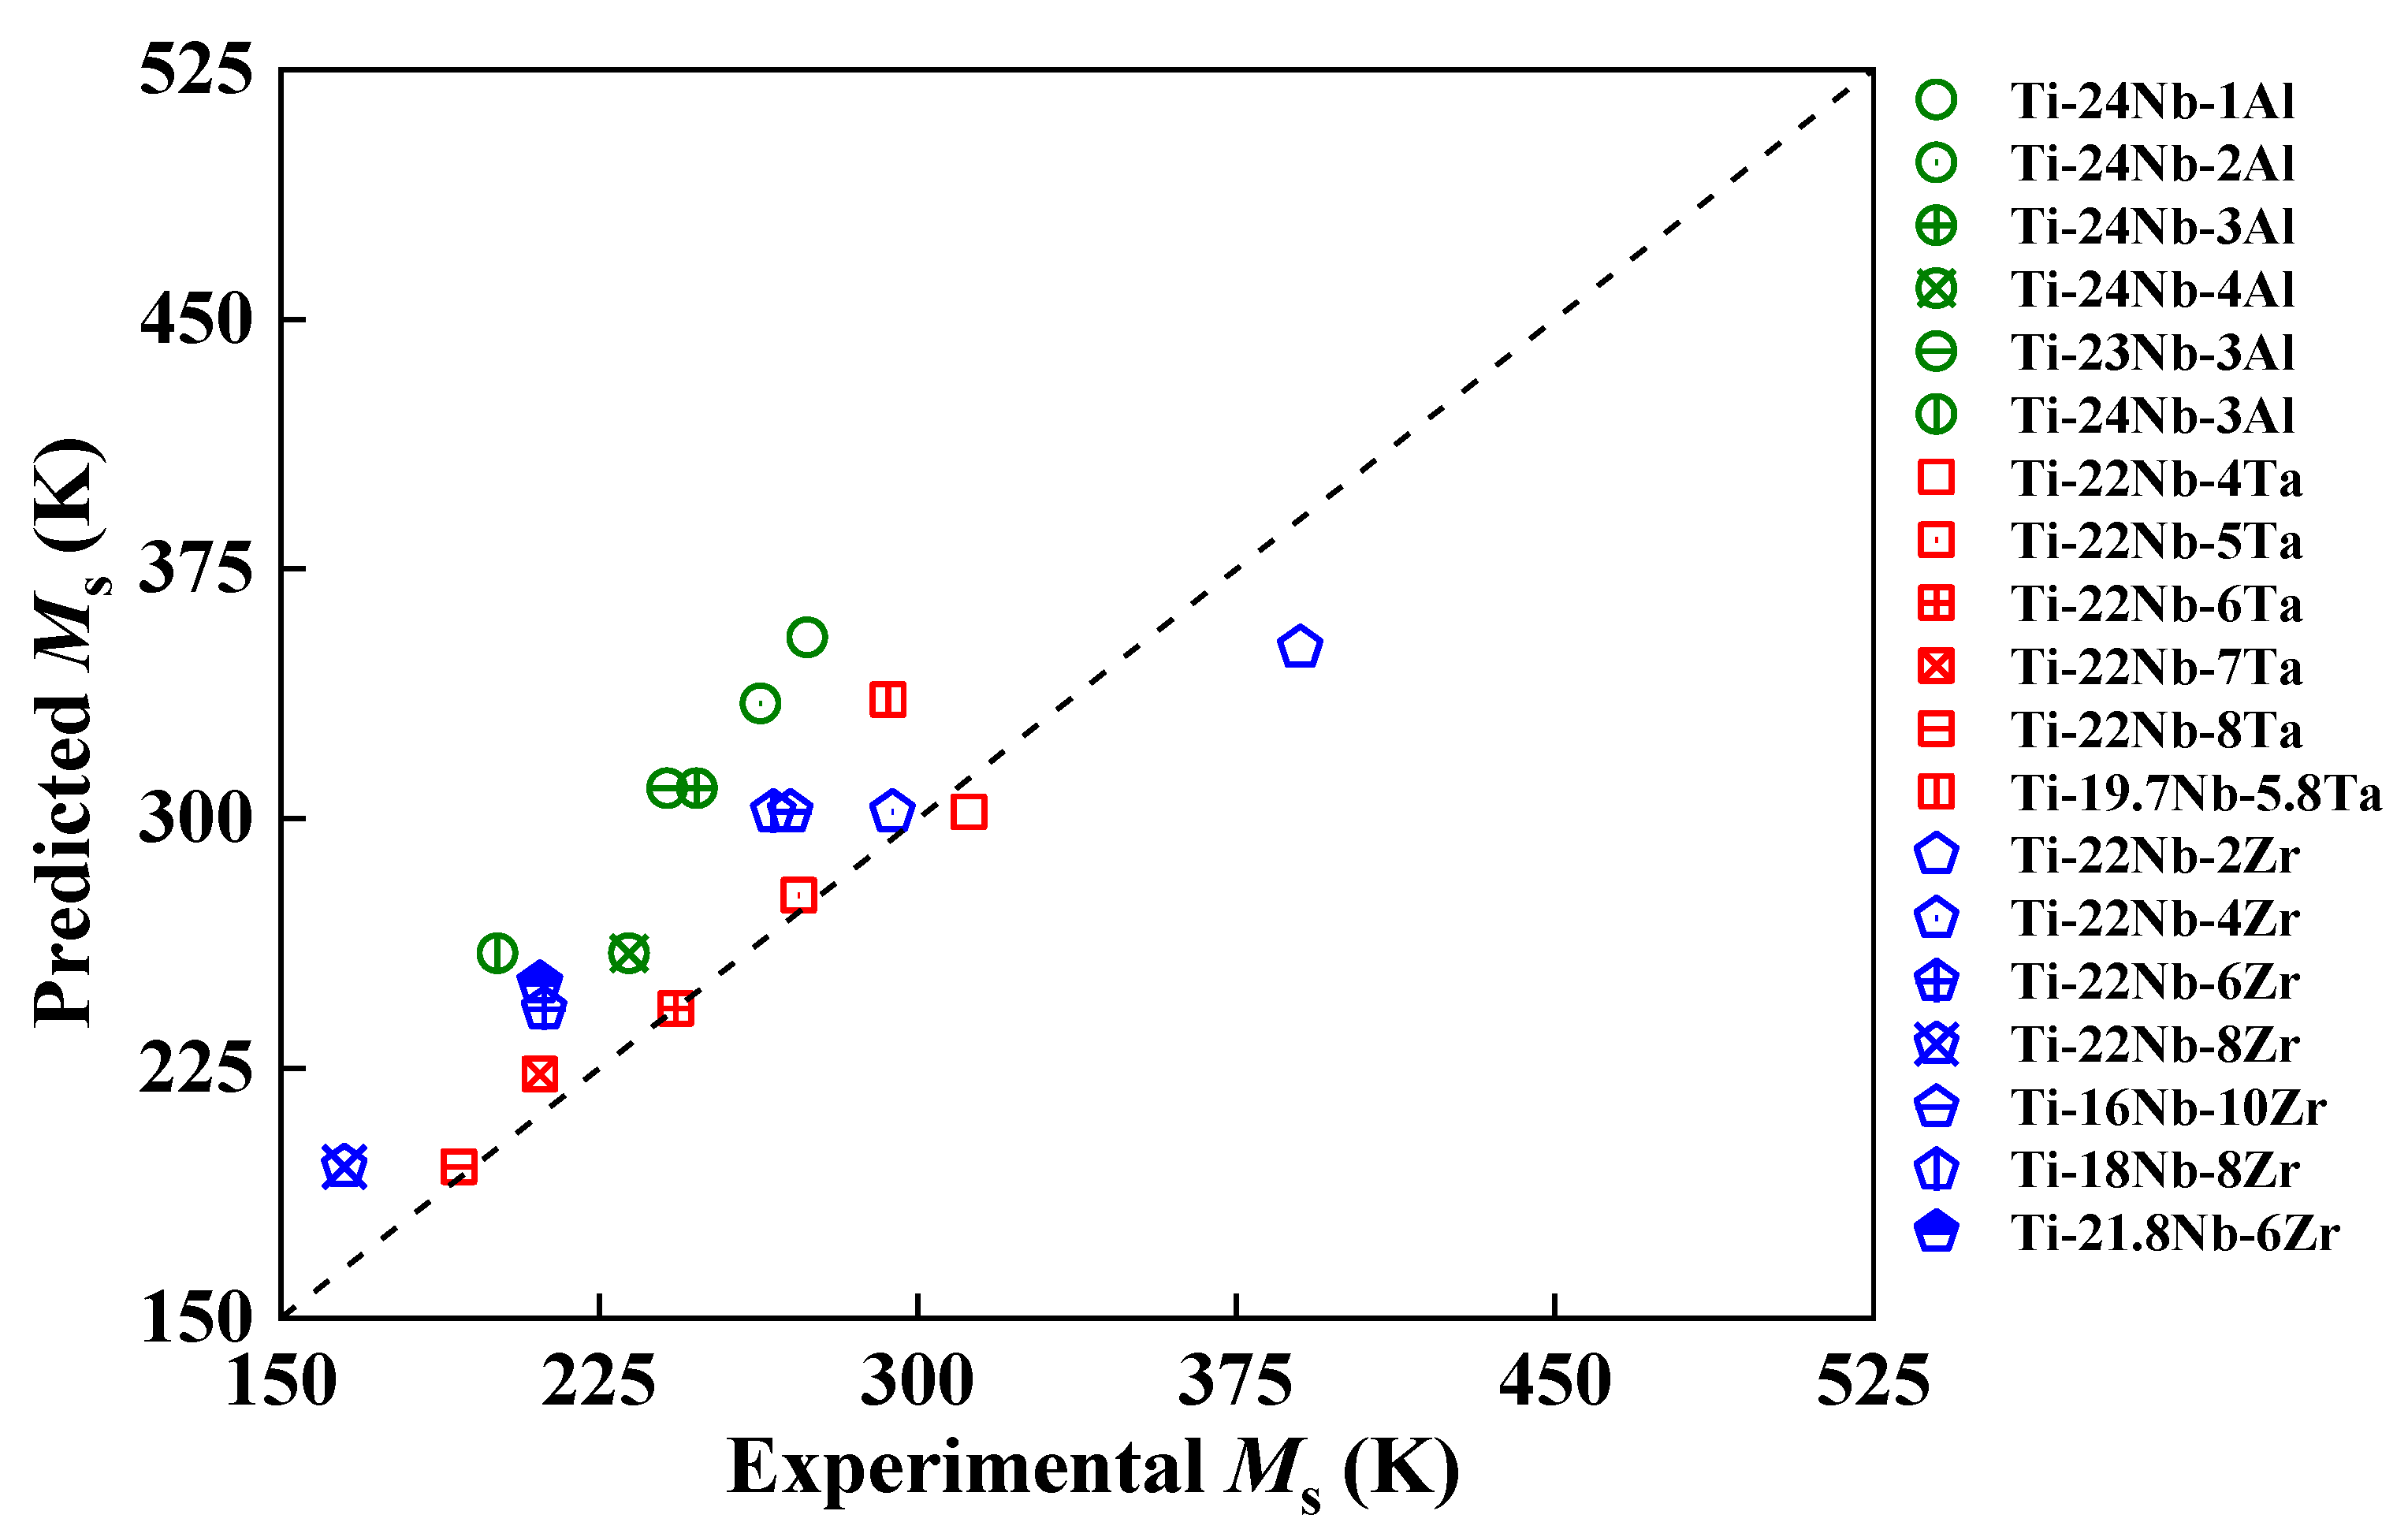
Comparison between present predicted and available experimental [4,6,7,12,13] martensitic transformation temperature (Ms, in K) for Ti−Nb−Al (green circles), Ti−Nb−Ta (red squares), and Ti−Nb−Zr (blue pentagons) ternary alloys. The estimated Ms in Ti−Nb−Al is from Equation (5), while the predicted Ms in Ti−Nb−Ta and Ti−Nb−Zr is from Equation (6).
To further directly compare the discrepancy between our predicted and measured Ms, in Figure 6, we plot the predicted Ms for Ti−Nb−Al by Equation (5) and for Ti−Nb−Ta and Ti−Nb−Zr by Equation (6), along with the measured Ms for Ti−Nb−Al [4,6], Ti−Nb−Ta [7,13], and Ti−Nb−Zr [12,13,44] ternary alloys. Since Zr and Ta have similar alloying effects on the Ms, we assume that the energy difference, ΔEβ→α″, in the Ti−Nb−Zr alloy is approximate to the ΔEβ→α″ in the Ti−Nb−Ta alloy when the (Nb + Zr) content is equal to the (Nb + Ta) content. As shown in Figure 6, there are average errors of about 28%, 4%, and 13% between our predicted and measured Ms for Ti−Nb−Al [4,6], Ti−Nb−Ta [7,13], and Ti−Nb−Zr [12,13,44], respectively. It can be concluded that there is a general agreement between the prediction and measurements.
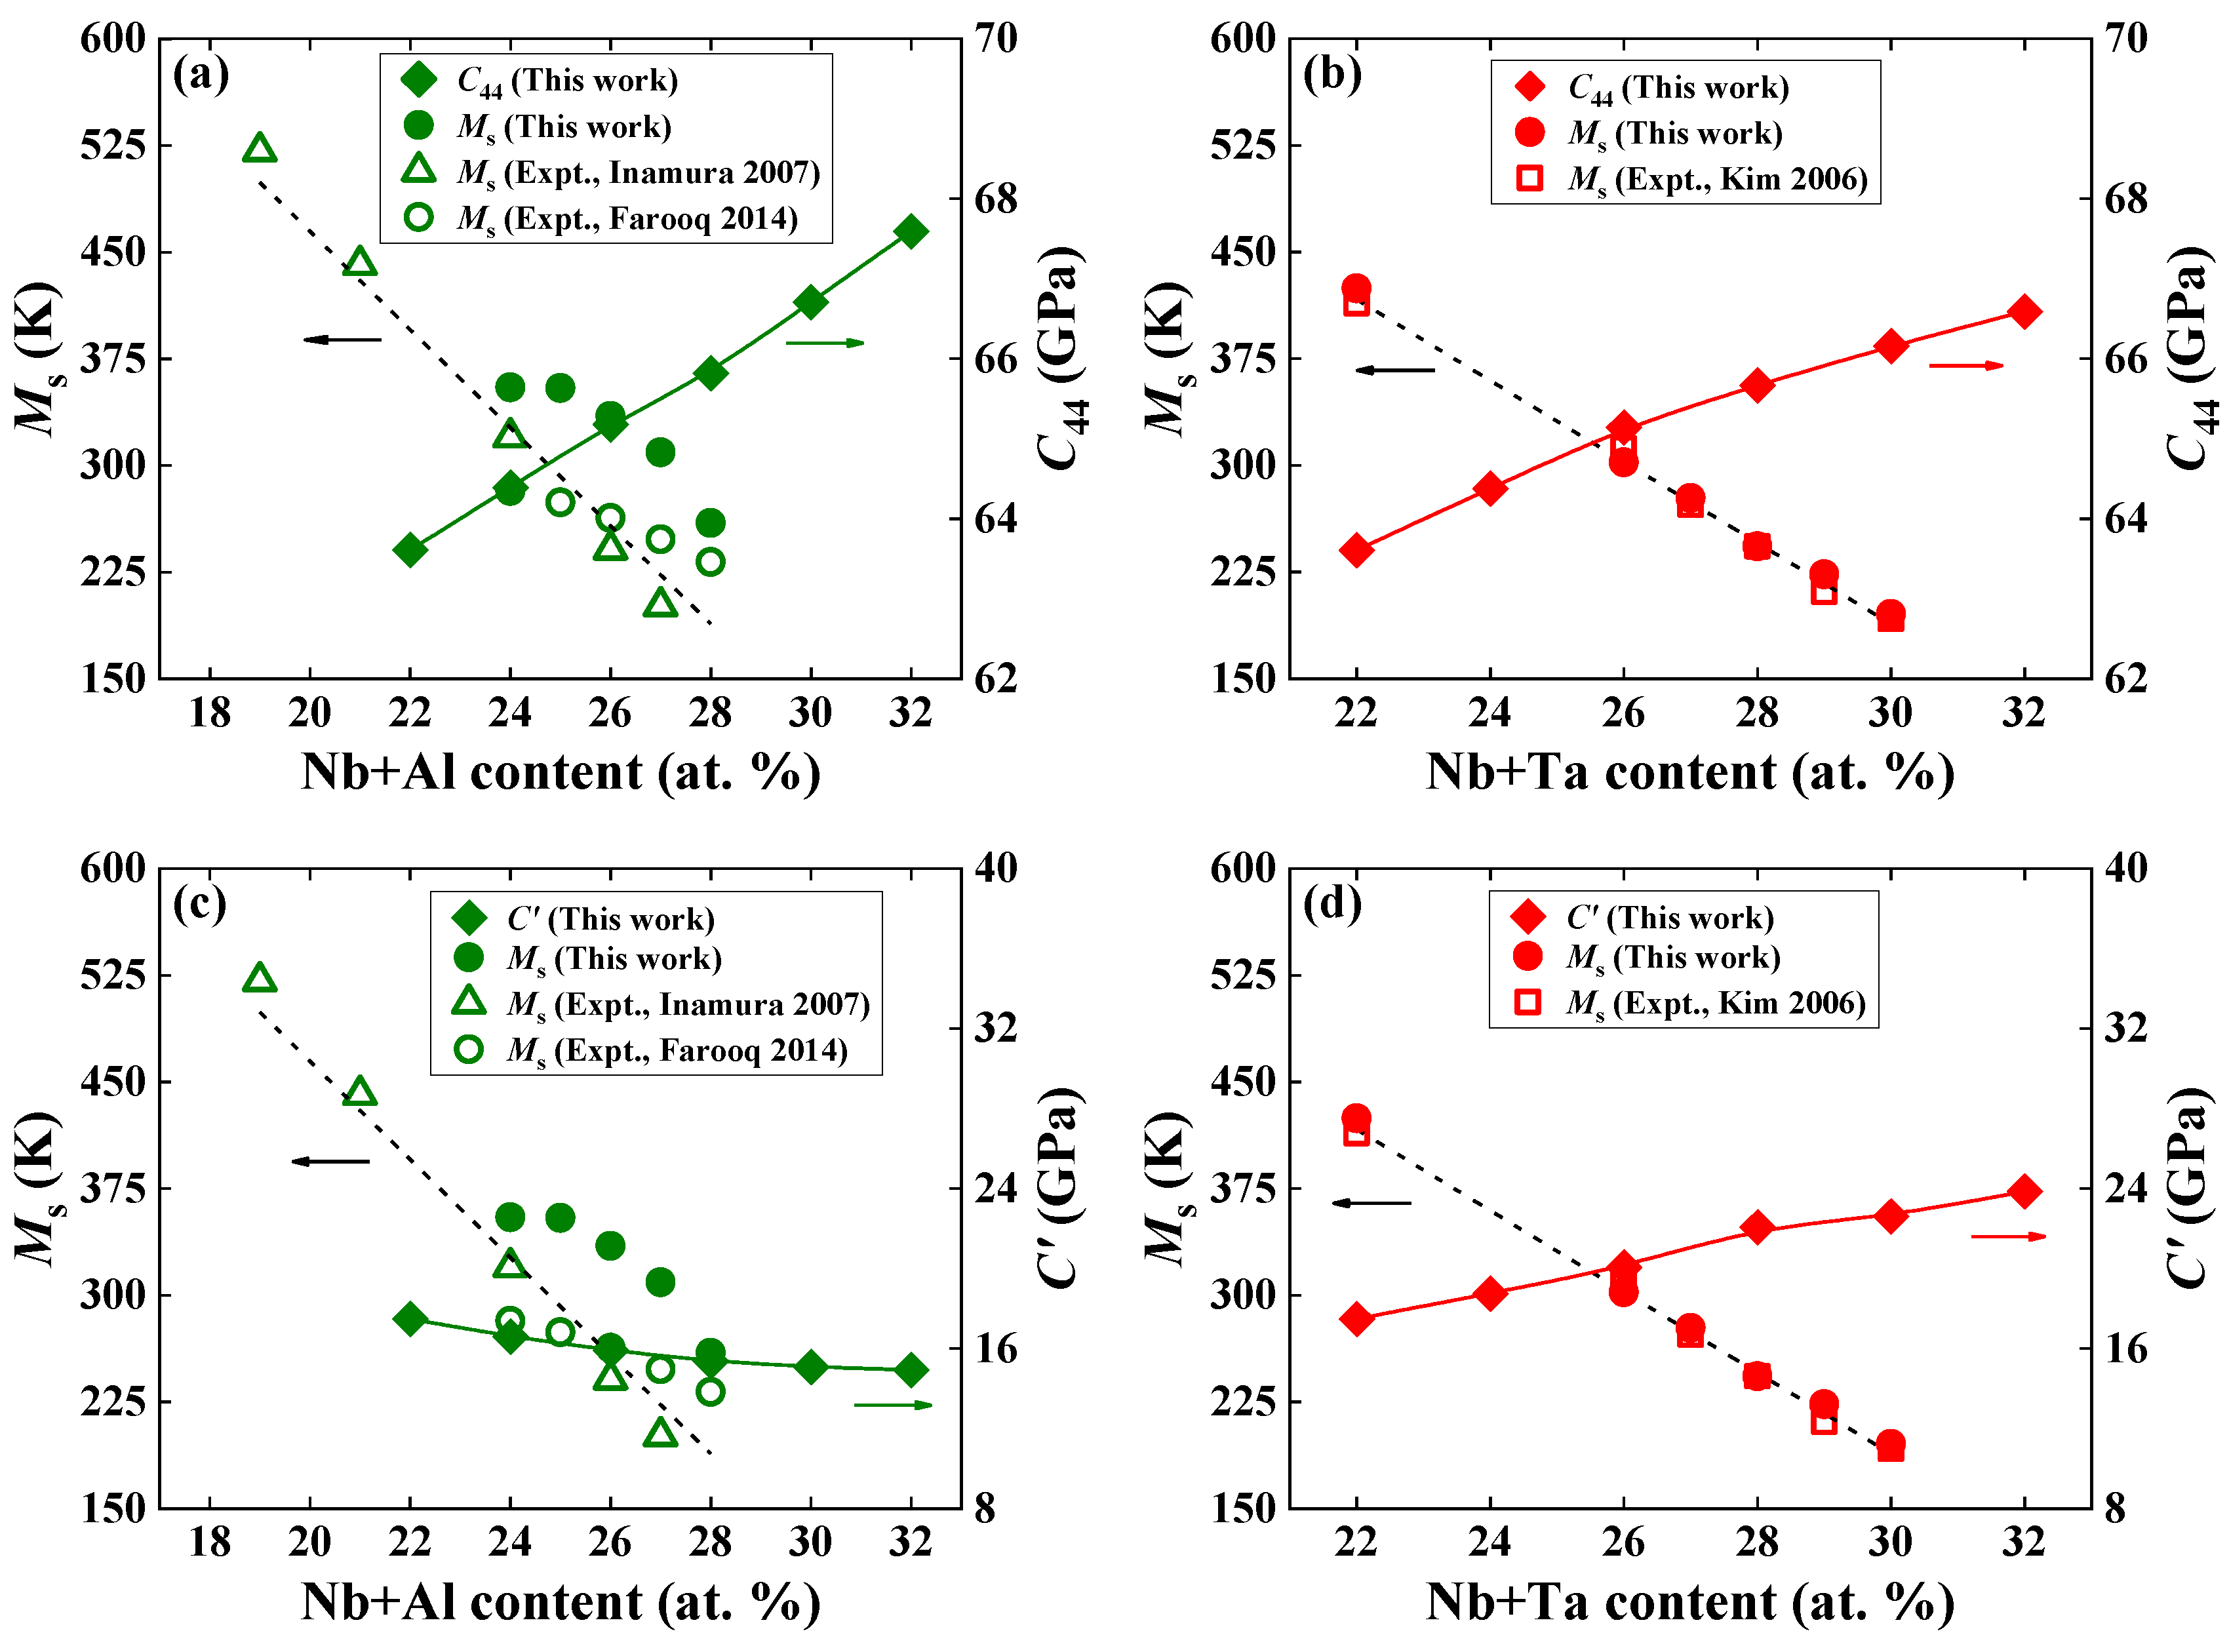
Ren and Otsuka [76] explained the compositional dependence of Ms using the Landau-type model. In the process of martensitic transformation, elastic modulus decreases gradually with cooling and reaches a critical value before martensitic transformation [76]. Therefore, if the elastic constants C′ and C44 of the β phase increase, the cooling should continue to lower temperatures before a critical elastic constant and Ms decreases. The critical elastic constraint of martensite alloys is temperature-independent. Therefore, when the elastic modulus changes, the Ms must also change due to critical elastic constraints. The relationship [76] between the Ms and elastic modulus (C) can be approximately expressed as follows:
where the Ms is the martensitic transformation temperature, C is the elastic modulus (the C can be either C44, C′, or some other elastic modulus), and γ is the temperature coefficient of elastic modulus. Therefore, the increase in the martensite temperature is consistent with the decrease in elastic modulus. The relationship proposed by Ren and Otsuka [76] has been widely accepted for investigating the Ms for TiNi-based [50,77,78], Cu−Al−Mn [79], and Ni-based [49,80,81,82] systems. These studies [49,50,77,78,79,80,81,82] have treated elastic modulus as one of the indicators to predict martensite temperature. For example, Cao et al. [81] used C′ to evaluate the Ms, indicating that a large C′ would inhibit martensite transformation. That is, besides the energy difference, ΔEβ→α″, the elastic moduli, C′ and C44, can be considered as predictors of the Ms [49,50], implying a correlation between the elastic moduli (C′ and C44) and the Ms.
In Figure 7, we display the calculated C′ and C44 and the predicted and , as well as the available experimental [4,6] and [7] as a function of alloying elements. As for Ti−Nb−Al ternary alloys, C44 (C′) increases (decreases) with increasing Al content, corresponding to a decrease in and . For Ti−Nb−Ta ternary alloys, both C44 and C′ increase, whereas and decrease with increasing Ta content. From Figure 7a,b, it can be observed that for both Ti−Nb−Al and Ti−Nb−Ta alloys, the larger the calculated C44, the lower the Ms. There is a similar relationship between the calculated C′ and and for the Ti−Nb−Ta system in Figure 7d. However, such a relationship connecting C′ with Ms is invalid for Ti−Nb−Al, as shown in Figure 7c. This finding implies that the elastic modulus, C44, may be regarded as a prefactor of the composition dependence of the Ms.

Figure 7.
Theoretically estimated martensitic transformation temperature (Ms, in K) and elastic moduli, C44 and C′, (in GPa) for (a,c) Ti−22Nb−xAl (x = 0–10, in at. %) and (b,d) Ti−22Nb−xTa (x = 0–10, in at. %) ternary alloys. The available measured Ms for Ti-Nb-Al [4,6] and Ti-Nb-Ta [7] ternary alloys are shown for comparison. Note that the available measured alloy compositions are Ti−(16, 18, 23, 24)Nb−3Al [6] and Ti−24Nb−(1–4)Al [4] for Ti-Nb-Al alloys and Ti−22Nb−(4–8)Ta [7] for Ti−Nb−Ta alloys. For completeness, the Ms of Ti−22Nb [7] and Ti−24Nb [4] are also displayed. Note that different colored arrows in the figure mark the Ms, C44, or C′, respectively.
4. Conclusions
Using first-principles EMTO-CPA calculations, we systematically calculated the total energy contours, lattice deformation strains (η1, η2, and η3), maximum transformation strains (), and the martensitic transition temperature (Ms) during the β → α″ phase transformation for two selected Ti−Nb−Al and Ti−Nb−Ta ternary alloys. The present theoretical calculations and the available experiments gave the same composition dependence on the lattice strains and Ms. As for the calculated stereographic projections of lattice strains alongside phase transformation along (100)β and (001)β, the largest elongation and the largest contraction due to the lattice strain occurred along ±[011]β and ±[100]β, respectively. The addition of Al and Ta increased and decreased the transformation strain by 0.07 and 0.03%/at. %, respectively.
The effect of either Al or Ta additions on the energy difference (ΔEβ→α″) between the β and α″ phases was also studied, suggesting that both Al and Ta can lower ΔEβ→α″. The relative phase stability of α″ gradually weakened but the tendency to generate the β phase became stronger as Al and Ta contents increased. Aiming to directly assess the Ms from first-principles calculations, two empirical relationships were fitted by associating the measured Ms with the calculated ΔEβ→α″. When compared to the overestimation by the existing relationships, there was a satisfactory agreement between the predicted and measured Ms, implying that the proposed relationships could accurately describe the coupling effect of alloying elements on the Ms. In this work, the theoretically predicted Ms were reduced by around 46, 28, and 30 K with an increase of 1 at. % Nb, Al, and Ta, respectively, corresponding to measured declines in Ms by 40, 40, and 30 K, respectively. Moreover, there was a correlation between Ms and C44, implying that an elastic modulus can be used as a prefactor to evaluate composition-dependent Ms. This work can contribute to accurately estimating the Ms of Ti-based alloys.
Supplementary Materials
The following supporting information can be downloaded at: https://www.mdpi.com/article/10.3390/ma16176069/s1. Figure S1. The crystal structures and the lattice correspondence of the β, α″ and α phase; Figure S2. The relationship of the lattice deformation strains (η1, η2, and η3), the maximum transformation strain (), and the average maximum transformation strain (); Figure S3. Schematic diagram for selected representative orientations of stereographic projections of the lattice strains associated with the β → α″ phase transformation; Figure S4. The calculated energy difference ΔEβ→α″ for Ti−(0−40)Nb−(0−20)Al alloys; Table S1. Predicted b/a, c/a and shuffle y of Ti−22Nb−xX (x = 0, 2, 4, 6, 8, 10, in at. %; X = Al, Ta) alloys. References [83,84] can be found in Supplementary Materials.
Author Contributions
Conceptualization, H.Z.; Investigation, H.F., X.X., H.Z., Q.S. and J.S.; Resources, H.Z., Q.S. and J.S.; Data curation, H.F. and X.X.; Writing—original draft, H.F., X.X. and H.Z.; Writing—review & editing, H.Z., Q.S. and J.S.; Visualization, H.F. and X.X.; Supervision, H.Z., Q.S. and J.S.; Funding acquisition, H.Z., Q.S. and J.S. All authors have read and agreed to the published version of the manuscript.
Funding
This research was funded by the National Natural Science Foundation of China (no.: 51871175 and 51671158), the Opening Project (no.: 2021LHM-KFKT005) of Key Laboratory of Shaanxi Province for Craniofacial Precision Medicine Research, and the 111 project 2.0 (no.: BP0618008).
Institutional Review Board Statement
Not applicable.
Informed Consent Statement
Not applicable.
Data Availability Statement
The research data are available on request from the corresponding author.
Conflicts of Interest
The authors declare no conflict of interest.
References
- Jafari, J.; Zebarjad, S.; Sajjadi, S. Effect of pre-strain on microstructure of Ni–Ti orthodontic archwires. Mater. Sci. Eng. A 2008, 473, 42–48. [Google Scholar] [CrossRef]
- Dong, W.; Padilla, C.; Epstein, J.; Varadan, V.; Jiang, Y.; Cogbill, A.; Tian, Z.R. New bone implants and stents from nanowire scaffolds corroded on Ti or Ti/Ni alloys. Nanomed. Nanotechnol. Biol. Med. 2007, 3, 355. [Google Scholar] [CrossRef]
- Baker, C. The Shape-Memory Effect in a Titanium-35 wt.-% Niobium Alloy. Met. Sci. J. 1971, 5, 92–100. [Google Scholar] [CrossRef]
- Farooq, M.U.; Khalid, F.A.; Zaigham, H.; Abidi, I.H. Superelastic behaviour of Ti–Nb–Al ternary shape memory alloys for biomedical applications. Mater. Lett. 2014, 121, 58–61. [Google Scholar] [CrossRef]
- Fukui, Y.; Inamura, T.; Hosoda, H.; Wakashima, K.; Miyazaki, S. Mechanical Properties of a Ti-Nb-Al Shape Memory Alloy. Mater. Trans. 2004, 45, 1077–1082. [Google Scholar] [CrossRef]
- Inamura, T.; Kim, J.I.; Kim, H.Y.; Hosoda, H.; Wakashima, K.; Miyazaki, S. Composition dependent crystallography of α″-martensite in Ti–Nb-based β-titanium alloy. Philos. Mag. 2007, 87, 3325. [Google Scholar] [CrossRef]
- Kim, H.; Hashimoto, S.; Kim, J.; Inamura, T.; Hosoda, H.; Miyazaki, S. Effect of Ta addition on shape memory behavior of Ti–22Nb alloy. Mater. Sci. Eng. A 2006, 417, 120–128. [Google Scholar] [CrossRef]
- Brailovski, V.; Prokoshkin, S.; Gauthier, M.; Inaekyan, K.; Dubinskiy, S.; Petrzhik, M.; Filonov, M. Bulk and porous metastable beta Ti–Nb–Zr(Ta) alloys for biomedical applications. Mater. Sci. Eng. C 2011, 31, 643. [Google Scholar] [CrossRef]
- Kim, H.Y.; Fu, J.; Tobe, H.; Kim, J.I.; Miyazaki, S. Crystal Structure, Transformation Strain, and Superelastic Property of Ti-Nb-Zr and Ti-Nb-Ta Alloys. Shape Mem. Superelasticity 2015, 1, 107. [Google Scholar] [CrossRef]
- Hussein, A.H.; Gepreel, M.A.; Gouda, M.K.; Hefnawy, A.M.; Kandil, S.H. Biocompatibility of new Ti-Nb-Ta base alloys. Mater. Sci. Eng. C Mater. Biol. Appl. 2016, 61, 574. [Google Scholar] [CrossRef]
- Kim, H.Y.; Sasaki, T.; Okutsu, K.; Kim, J.I.; Inamura, T.; Hosoda, H.; Miyazaki, S. Texture and shape memory behavior of Ti-22Nb-6Ta alloy. Acta Mater. 2006, 54, 423. [Google Scholar] [CrossRef]
- Zhang, J.; Sun, F.; Hao, Y.; Gozdecki, N.; Lebrun, E.; Vermaut, P.; Portier, R.; Gloriant, T.; Laheurte, P.; Prima, F. Influence of equiatomic Zr/Nb substitution on superelastic behavior of Ti–Nb–Zr alloy. Mater. Sci. Eng. A 2013, 563, 78–85. [Google Scholar] [CrossRef]
- Inaekyan, K.; Brailovski, V.; Prokoshkin, S.; Pushin, V.; Dubinskiy, S.; Sheremetyev, V. Comparative study of structure formation and mechanical behavior of age-hardened Ti-Nb-Zr and Ti-Nb-Ta shape memory alloys. Mater. Charact. 2015, 103, 65. [Google Scholar] [CrossRef]
- Dubinskiy, S.; Markova, G.; Baranova, A.; Vvedenskiy, V.; Minkova, I.; Prokoshkin, S.; Brailovski, V. A non-typical Elinvar effect on cooling of a beta Ti-Nb-Zr alloy. Mater. Lett. 2022, 314, 131870. [Google Scholar] [CrossRef]
- Takahashi, E.; Sakurai, T.; Watanabe, S.; Masahashi, N.; Hanada, S. Effect of Heat Treatment and Sn Content on Superelasticity in Biocompatible TiNbSn Alloys. Mater. Trans. 2002, 43, 2978–2983. [Google Scholar] [CrossRef]
- Matsumoto, H.; Watanabe, S.; Hanada, S. Beta TiNbSn Alloys with Low Young’s Modulus and High Strength. Mater. Trans. 2005, 46, 1070–1078. [Google Scholar] [CrossRef]
- Ibrahim, M.K.; Hamzah, E.; Saud, S.N. Microstructure, Phase Transformation, Mechanical Behavior, Bio-corrosion and Antibacterial Properties of Ti-Nb-xSn (x = 0, 0.25, 0.5 and 1.5) SMAs. J. Mater. Eng. Perform. 2018, 28, 382. [Google Scholar] [CrossRef]
- Cai, S.; Wang, L.; Schaffer, J.; Gao, J.; Ren, Y. Influence of Sn on martensitic beta Ti alloys. Mater. Sci. Eng. A 2019, 743, 764–772. [Google Scholar] [CrossRef]
- Wang, J.; Li, Q.; Xiong, C.; Li, Y.; Sun, B. Effect of Zr on the martensitic transformation and the shape memory effect in Ti-Zr-Nb-Ta high-temperature shape memory alloys. J. Alloys Compd. 2018, 737, 672–677. [Google Scholar] [CrossRef]
- Li, Q.; Ma, X.; Xiong, C.; Qu, W.; Li, Y. Effects of annealing temperature on microstructures and shape memory effect of Ti-19Zr-11Nb-2Ta alloy sheets. J. Alloys Compd. 2022, 897, 162728. [Google Scholar] [CrossRef]
- Li, S.; Rehman, I.U.; Lim, J.-H.; Lee, W.-T.; Seol, J.B.; Kim, J.G.; Nam, T.-H. Effect of Sn content on microstructure, texture evolution, transformation behavior and superelastic properties of Ti−20Zr−9Nb−(2–5)Sn (at. %) shape memory alloys. Mater. Sci. Eng. A 2021, 827, 141994. [Google Scholar] [CrossRef]
- Li, S.; Lim, J.-H.; Rehman, I.U.; Lee, W.-T.; Kim, J.G.; Oh, J.S.; Lee, T.; Nam, T.-H. Tuning the texture characteristics and superelastic behaviors of Ti–Zr–Nb–Sn shape memory alloys by varying Nb content. Mater. Sci. Eng. A 2022, 845, 143243. [Google Scholar] [CrossRef]
- Hao, Y.L.; Li, S.J.; Sun, S.Y.; Yang, R. Effect of Zr and Sn on Young’s modulus and superelasticity of Ti-Nb-based alloys. Mater. Sci. Eng. A 2006, 441, 112. [Google Scholar] [CrossRef]
- Marupalli, B.C.; Adhikary, T.; Sahu, B.; Mitra, R.; Aich, S. Effect of annealing temperature on microstructure and mechanical response of sputter deposited Ti-Zr-Mo high temperature shape memory alloy thin films. Appl. Surf. Sci. Adv. 2021, 6, 100137. [Google Scholar] [CrossRef]
- Kim, Y.-W. Specific mechanical properties of highly porous Ti-Zr-Mo-Sn shape memory alloy for biomedical applications. Scr. Mater. 2023, 231, 115433. [Google Scholar] [CrossRef]
- Buenconsejo, P.J.S.; Kim, H.Y.; Miyazaki, S. Novel β-TiTaAl alloys with excellent cold workability and a stable high-temperature shape memory effect. Scr. Mater. 2011, 64, 1114. [Google Scholar] [CrossRef]
- Ferrari, A.; Paulsen, A.; Frenzel, J.; Rogal, J.; Eggeler, G.; Drautz, R. Unusual composition dependence of transformation temperatures in Ti-Ta-X shape memory alloys. Phys. Rev. Mater. 2018, 2, 073609. [Google Scholar] [CrossRef]
- Kim, H.Y.; Fukushima, T.; Buenconsejo, P.J.S.; Nam, T.-H.; Miyazaki, S. Martensitic transformation and shape memory properties of Ti–Ta–Sn high temperature shape memory alloys. Mater. Sci. Eng. A 2011, 528, 7238–7246. [Google Scholar] [CrossRef]
- Li, J.; Yi, X.; Wang, H.; Sun, K.; Liu, J.; Meng, X.; Gao, Z. Effect of thermo-mechanical treatment on Ti–Ta-Hf high temperature shape memory alloy. Prog. Nat. Sci. 2021, 31, 779–782. [Google Scholar] [CrossRef]
- Yi, X.; Sun, K.; Liu, J.; Zheng, X.; Meng, X.; Gao, Z.; Cai, W. Tailoring the microstructure, martensitic transformation and strain recovery characteristics of Ti-Ta shape memory alloys by changing Hf content. J. Mater. Sci. Technol. 2021, 83, 123–130. [Google Scholar] [CrossRef]
- Chiu, W.; Wakabayashi, K.; Umise, A.; Tahara, M.; Inamura, T.; Hosoda, H. Enhancement of the shape memory effect by the introductions of Cr and Sn into the β–Ti alloy towards the biomedical applications. J. Alloys Compd. 2021, 875, 160088. [Google Scholar] [CrossRef]
- Park, M.S.; Chiu, W.-T.; Nohira, N.; Tahara, M.; Hosoda, H. Effects of Cr and Sn additives on the martensitic transformation and deformation behavior of Ti-Cr-Sn biomedical shape memory alloys. Mater. Sci. Eng. A 2021, 822, 141688. [Google Scholar] [CrossRef]
- Kilmametov, A.; Ivanisenko, Y.; Straumal, B.; Mazilkin, A.A.; Gornakova, A.S.; Kriegel, M.J.; Fabrichnaya, O.B.; Rafaja, D.; Hahn, H. Transformations of α’ martensite in Ti–Fe alloys under high pressure torsion. Scr. Mater. 2017, 136, 46. [Google Scholar] [CrossRef]
- Kriegel, M.J.; Kilmametov, A.; Klemm, V.; Schimpf, C.; Straumal, B.B.; Gornakova, A.S.; Ivanisenko, Y.; Fabrichnaya, O.; Hahn, H.; Rafaja, D. Thermal Stability of Athermal ω-Ti(Fe) Produced upon Quenching of β-Ti(Fe). Adv. Eng. Mater. 2019, 21, 1800158. [Google Scholar] [CrossRef]
- Kilmametov, A.R.; Ivanisenko, Y.; Mazilkin, A.A.; Straumal, B.B.; Gornakova, A.S.; Fabrichnaya, O.B.; Kriegel, M.J.; Rafaja, D.; Hahn, H. The α→ω and β→ω phase transformations in Ti–Fe alloys under high-pressure torsion. Acta Mater. 2018, 144, 337. [Google Scholar] [CrossRef]
- Li, M.; Min, X.; Yao, K.; Ye, F. Novel insight into the formation of α″-martensite and ω-phase with cluster structure in metastable Ti-Mo alloys. Acta Mater. 2019, 164, 322. [Google Scholar] [CrossRef]
- Kilmametov, A.; Gornakova, A.; Karpov, M.; Afonikova, N.; Korneva, A.; Zięba, P.; Baretzky, B.; Straumal, B. Influence of β-Stabilizers on the α-Ti→ω-Ti Transformation in Ti-Based Alloys. Processes 2020, 8, 1135. [Google Scholar] [CrossRef]
- Kilmametov, A.R.; Ivanisenko, Y.; Straumal, B.B.; Gornakova, A.S.; Mazilkin, A.A.; Hahn, H. The α → ω Transformation in Titanium-Cobalt Alloys under High-Pressure Torsion. Metals 2018, 8, 1. [Google Scholar] [CrossRef]
- Korneva, A.; Straumal, B.; Kilmametov, A.; Gondek, L.; Wierzbicka-Miernik, A.; Litynska-Dobrzynska, L.; Cios, G.; Chulist, R.; Zieba, P. Thermal stability and microhardness of metastable omega-phase in the Ti-3.3 at. % Co alloy subjected to high pressure torsion. J. Alloys Compd. 2020, 834, 155132. [Google Scholar] [CrossRef]
- Kriegel, M.J.; Rudolph, M.; Kilmametov, A.; Straumal, B.B.; Ivanisenko, J.; Fabrichnaya, O.; Hahn, H.; Rafaja, D. Formation and Thermal Stability of ω-Ti(Fe) in α-Phase-Based Ti(Fe) Alloys. Metals 2020, 10, 402. [Google Scholar] [CrossRef]
- Kim, H.Y.; Ikehara, Y.; Kim, J.I.; Hosoda, H.; Miyazaki, S. Martensitic transformation, shape memory effect and superelasticity of Ti-Nb binary alloys. Acta Mater. 2006, 54, 2419. [Google Scholar] [CrossRef]
- Brown, A.R.G.; Clark, D.; Eastabbook, J.; Jepson, K.S.; System, T.T.-N. The Titanium-Niobium System. Nature 1964, 201, 914. [Google Scholar] [CrossRef]
- Kim, H.Y.; Hashimoto, S.; Kim, J.I.; Hosoda, H.; Miyazaki, S. Mechanical Properties and Shape Memory Behavior of Ti-Nb Alloys. Mater. Trans. 2004, 45, 2443–2448. [Google Scholar] [CrossRef]
- Kim, J.I.; Kim, H.Y.; Inamura, T.; Hosoda, H.; Miyazaki, S. Shape memory characteristics of Ti-22Nb-(2-8)Zr(at.%) biomedical alloys. Mater. Sci. Eng. A 2005, 403, 334. [Google Scholar] [CrossRef]
- Neelakantan, S.; Rivera-Díaz-Del-Castillo, P.; van der Zwaag, S. Prediction of the martensite start temperature for β titanium alloys as a function of composition. Scr. Mater. 2009, 60, 611–614. [Google Scholar] [CrossRef]
- Prabha, A.J.; Raju, S.; Jeyaganesh, B.; Rai, A.K.; Behera, M.; Vijayalakshmi, M.; Paneerselvam, G.; Johnson, I. Thermodynamics of α’’→β phase transformation and heat capacity measurements in Ti-15at% Nb alloy. Phys. B Condens. Matter 2011, 406, 4200. [Google Scholar] [CrossRef]
- Minami, D.; Uesugi, T.; Takigawa, Y.; Higashi, K. First-principles study of transformation strains and phase stabilities in α″ and β Ti-Nb-X alloys. J. Alloys Compd. 2017, 716, 37. [Google Scholar] [CrossRef]
- Sun, X.; Zhang, H.L.; Wang, D.; Sun, Q.Y.; Zhao, S.S.; Lu, S.; Li, W.; Vitos, L.; Ding, X.D. Large recoverable strain with suitable transition temperature in TiNb-based multicomponent shape memory alloys: First-principles calculations. Acta Mater. 2021, 221, 117366. [Google Scholar] [CrossRef]
- Hu, Q.; Luo, H.; Li, C.; Vitos, L.; Yang, R. Composition dependent elastic modulus and phase stability of Ni2MnGa based ferromagnetic shape memory alloys. Sci. China Technol. Sci. 2011, 55, 295–305. [Google Scholar] [CrossRef]
- Lu, J.-M.; Hu, Q.-M.; Yang, R. Composition-dependent elastic properties and electronic structures of off-stoichiometric TiNi from first-principles calculations. Acta Mater. 2008, 56, 4913–4920. [Google Scholar] [CrossRef]
- Miyazaki, S.; Imai, T.; Igo, Y.; Otsuka, K. Effect of cyclic deformation on the pseudoelasticity characteristics of Ti-Ni alloys. Met. Trans. A 1986, 17, 115–120. [Google Scholar] [CrossRef]
- Kim, K.M.; Kim, H.Y.; Miyazaki, S. Effect of Zr Content on Phase Stability, Deformation Behavior, and Young’s Modulus in Ti–Nb–Zr Alloys. Materials 2020, 13, 476. [Google Scholar] [CrossRef] [PubMed]
- Kim, H.Y.; Miyazaki, S. Several Issues in the Development of Ti–Nb-Based Shape Memory Alloys. Shape Mem. Superelasticity 2016, 2, 380–390. [Google Scholar] [CrossRef]
- Tada, H.; Yamamoto, T.; Wang, X.; Kato, H. Effect of Al Addition on Superelastic Properties of Aged Ti-Nb-Zr-Al Quaternary Alloys. Mater. Trans. 2012, 53, 1981. [Google Scholar] [CrossRef]
- Vitos, L. Computational Quantum Mechanics for Materials Engineers: The EMTO Method and Applications; Springer Science & Business Media: London, UK, 2007. [Google Scholar]
- Perdew, J.P.; Burke, K.; Ernzerhof, M. Generalized gradient approximation made simple. Phys. Rev. Lett. 1996, 77, 3865–3868. [Google Scholar] [CrossRef]
- Korzhavyi, P.A.; Ruban, A.V.; Abrikosov, I.A.; Skriver, H.L. Madelung energy for random metallic alloys in the coherent potential approximation. Phys. Rev. B 1995, 51, 5773–5780. [Google Scholar] [CrossRef] [PubMed]
- Li, C.X.; Luo, H.B.; Hu, Q.M.; Yang, R.; Yin, F.X.; Umezawa, O.; Vitos, L. Lattice parameters and relative stability of α″ phase in binary titanium alloys from first-principles calculations. Solid State Commun. 2013, 159, 70–75. [Google Scholar] [CrossRef]
- Born, M.; Huang, K. Dynamical Theory of Crystal Lattices; Oxford University Press: Oxford, UK, 1956. [Google Scholar]
- Hill, T.R. The elastic behavior of crystalline aggregate. Proc. Phys. Soc. Sect. A 1952, 65, 337. [Google Scholar] [CrossRef]
- Zhang, H.L.; Johansson, B.; Vitos, L. Ab initio calculations of elastic properties of bcc Fe-Mg and Fe-Cr random alloys. Phys. Rev. B 2009, 79, 224201. [Google Scholar] [CrossRef]
- Zhang, H.; Punkkinen, M.P.J.; Johansson, B.; Hertzman, S.; Vitos, L. Single-crystal elastic constants of ferromagnetic bcc Fe-based random alloys from first-principles theory. Phys. Rev. B 2010, 81, 184105. [Google Scholar] [CrossRef]
- Zhang, H.L.; Sun, X.; Lu, S.; Dong, Z.H.; Ding, X.D.; Wang, Y.Z.; Vitos, L. Elastic properties of AlxCrMnFeCoNi (0 ≤ x ≤ 5) high-entropy alloys from ab initio theory. Acta Mater. 2018, 155, 12. [Google Scholar] [CrossRef]
- Sun, X.; Zhang, H.; Lu, S.; Ding, X.; Wang, Y.; Vitos, L. Phase selection rule for Al-doped CrMnFeCoNi high-entropy alloys from first-principles. Acta Mater. 2017, 140, 366–374. [Google Scholar] [CrossRef]
- Hu, Q.-M.; Li, S.-J.; Hao, Y.-L.; Yang, R.; Johansson, B.; Vitos, L. Phase stability and elastic modulus of Ti alloys containing Nb, Zr, and/or Sn from first-principles calculations. Appl. Phys. Lett. 2008, 93, 121902. [Google Scholar] [CrossRef]
- Miyazaki, S.; Kim, H.; Hosoda, H. Development and characterization of Ni-free Ti-base shape memory and superelastic alloys. Mater. Sci. Eng. A 2006, 438–440, 18–24. [Google Scholar] [CrossRef]
- Ojha, A.; Sehitoglu, H. Slip Resistance of Ti-Based High-Temperature Shape Memory Alloys. Shape Mem. Superelasticity 2016, 2, 50–61. [Google Scholar] [CrossRef]
- Bönisch, M.; Waitz, T.; Calin, M.; Skrotzki, W.; Eckert, J. Tailoring the Bain strain of martensitic transformations in Ti Nb alloys by controlling the Nb content. Int. J. Plast. 2016, 85, 190–202. [Google Scholar] [CrossRef]
- Cui, Y.; Li, Y.; Luo, K.; Xu, H.B. Microstructure and shape memory effect of Ti-20Zr-10Nb alloy. Mater. Sci. Eng. A 2010, 527, 652. [Google Scholar] [CrossRef]
- Zhang, F.; Yu, Z.; Xiong, C.; Qu, W.; Yuan, B.; Wang, Z.; Li, Y. Martensitic transformations and the shape memory effect in Ti-Zr-Nb-Al high-temperature shape memory alloys. Mater. Sci. Eng. A 2017, 679, 14–19. [Google Scholar] [CrossRef]
- Yao, T.T.; Zhang, Y.G.; Yang, L.; Bu, Z.Q.; Li, J.F. A metastable Ti-Zr-Nb-Al multi-principal-element alloy with high tensile strength and ductility. Mater. Sci. Eng. A 2022, 851, 143646. [Google Scholar] [CrossRef]
- Bönisch, M.; Calin, M.; Waitz, T.; Panigrahi, A.; Zehetbauer, M.; Gebert, A.; Skrotzki, W.; Eckert, J. Thermal stability and phase transformations of martensitic Ti–Nb alloys. Sci. Technol. Adv. Mater. 2013, 14, 055004. [Google Scholar] [CrossRef] [PubMed]
- Dobromyslov, A.; Elkin, V. Martensitic transformation and metastable β-phase in binary titanium alloys with d-metals of 4–6 periods. Scr. Mater. 2001, 44, 905–910. [Google Scholar] [CrossRef]
- Moffat, D.L.; Larbalestier, D.C. The competition between martensite and omega in quenched Ti-Nb alloys. Metall. Trans. A 1987, 19A, 1677. [Google Scholar]
- Buenconsejo, P.J.S.; Kim, H.Y.; Hosoda, H.; Miyazaki, S. Shape memory behavior of Ti–Ta and its potential as a high-temperature shape memory alloy. Acta Mater. 2009, 57, 1068–1077. [Google Scholar] [CrossRef]
- Ren, X.; Otsuka, K. Why Does the Martensitic Transformation Temperature Strongly Depend on Composition? Mater. Sci. Forum 2000, 327–328, 429. [Google Scholar] [CrossRef]
- Hu, Q.M.; Yang, R.; Lu, J.M.; Wang, L.; Johansson, B.; Vitos, L. Effect of Zr on the properties of (TiZr)Ni alloys from first-principles calculations. Phys. Rev. B 2007, 76, 224201. [Google Scholar] [CrossRef]
- Ren, X.; Miura, N.; Zhang, J.; Otsuka, K.; Tanaka, K.; Koiwa, M.; Suzuki, T.; Chumlyakov, Y.I.; Asai, M. A comparative study of elastic constants of Ti–Ni-based alloys prior to martensitic transformation. Mater. Sci. Eng. A 2001, 312, 196–206. [Google Scholar] [CrossRef]
- Xiong, B.; Zhao, X.; Hu, Y.; Huang, H.; Liu, Y.; Su, Y. Machine learning assisted empirical formula augmentation. Mater. Des. 2021, 210, 110037. [Google Scholar] [CrossRef]
- Luo, H.; Li, C.; Hu, Q.; Yang, R.; Johansson, B.; Vitos, L. Theoretical investigation of the effects of composition and atomic disordering on the properties of Ni2Mn(Al1−xGax) alloy. Acta Mater. 2011, 59, 971–980. [Google Scholar] [CrossRef]
- Cao, P.; Tian, F.; Li, W.; Vitos, L.; Wang, Y. Ideal superelasticity in Ni-based Heusler alloys. Acta Mater. 2021, 210, 116816. [Google Scholar] [CrossRef]
- Ghosh, S.; Ghosh, S. Understanding the origin of the magnetocaloric effects in substitutional Ni-Mn-Sb-Z (Z=Fe, Co, Cu) compounds: Insights from first-principles calculations. Phys. Rev. B 2020, 101, 024109. [Google Scholar] [CrossRef]
- Liang, Q.; Wang, D.; Zheng, Y.; Zhao, S.; Gao, Y.; Hao, Y.; Yang, R.; Banerjee, D.; Fraser, H.L.; Wang, Y. Shuffle-nanodomain regulated strain glass transition in Ti−24Nb−4Zr−8Sn alloy. Acta Mater. 2020, 186, 415. [Google Scholar] [CrossRef]
- Abdel-Hady, M.; Fuwa, H.; Hinoshita, K.; Kimura, H.; Shinzato, Y.; Morinaga, M. Phase stability change with Zr content in β-type Ti–Nb alloys. Scr. Mater. 2007, 57, 1000. [Google Scholar] [CrossRef]
Disclaimer/Publisher’s Note: The statements, opinions and data contained in all publications are solely those of the individual author(s) and contributor(s) and not of MDPI and/or the editor(s). MDPI and/or the editor(s) disclaim responsibility for any injury to people or property resulting from any ideas, methods, instructions or products referred to in the content. |
© 2023 by the authors. Licensee MDPI, Basel, Switzerland. This article is an open access article distributed under the terms and conditions of the Creative Commons Attribution (CC BY) license (https://creativecommons.org/licenses/by/4.0/).