1. Introduction
In recent years, the probability of global earthquakes has continued to increase. High-intensity earthquake disasters have occurred frequently, such as the magnitude 7.9 earthquake that occurred in central Nepal in April 2015, the magnitude 7.3 earthquake that occurred in Kyushu, Japan, in April 2016, the magnitude 5.4 earthquake that occurred in Pohang, South Korea, on 15 November 2017, and the magnitude 6.4 earthquake that occurred near Hualien County, Taiwan, in February 2018. Earthquakes cause the collapse of buildings and casualties, bringing endless pain and disaster to human society. The seismic wave propagated from the bedrock reaches the upper soil particles through the soil layer. The dynamic stress of the soil unit is mainly caused by shear waves propagating upward from the bedrock, and the unit will be subjected to repeated shear stresses whose magnitude and direction are constantly changing. Because of ground constraints and the uncertainty of seismic occurrence, research on sites prone to seismic action is essential.
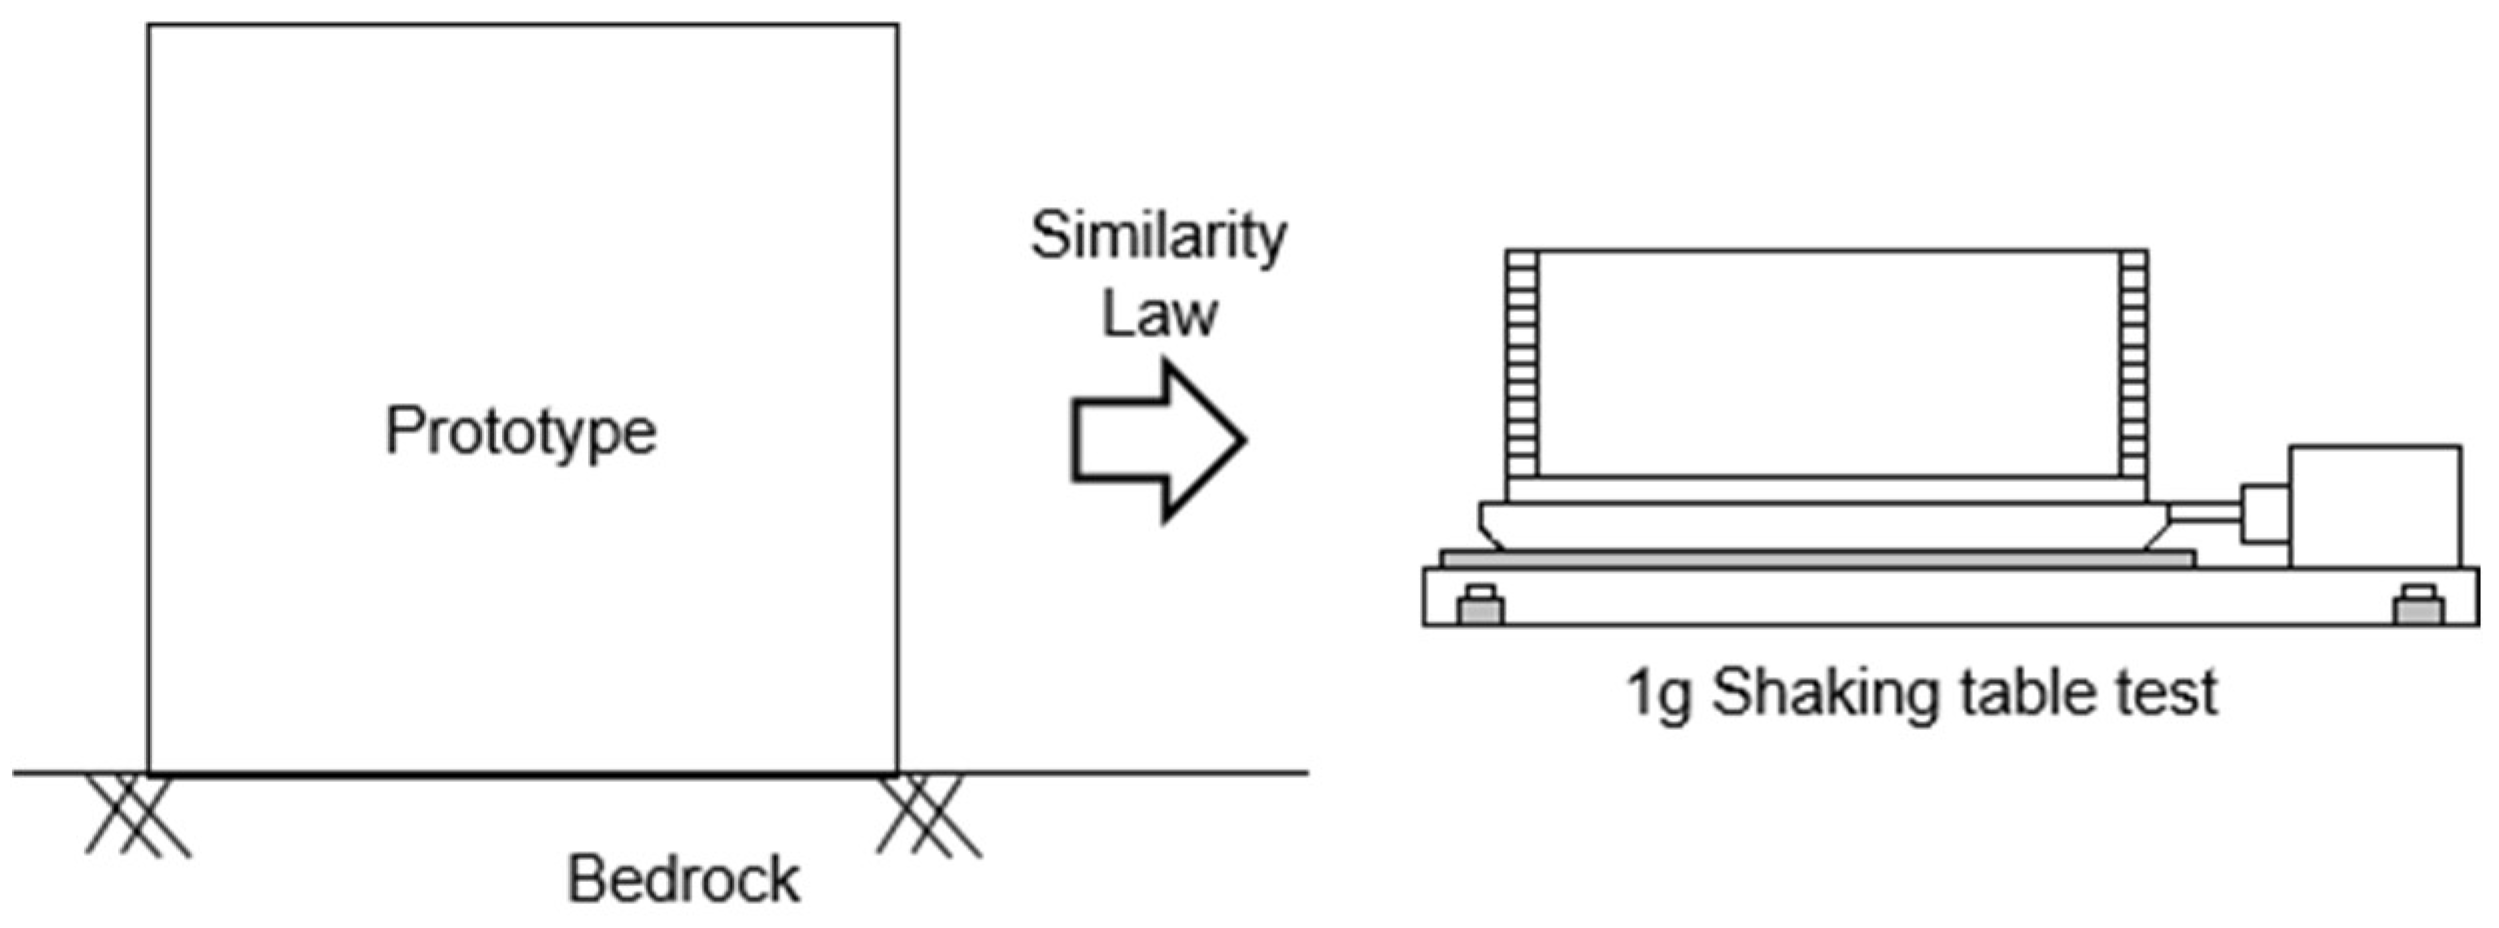
A typical method researchers employ to simulate and analyze the dynamic behavior and response of a prototype is by performing the 1 g shaking table test as shown in
Figure 1. A 1 g shaking table test can fully simulate the seismic process. It is the most direct method to study the seismic response and failure mechanism of sites in the laboratory. Most of the 1 g shaking table tests utilize prototypes and adhere to the principles of similarity, ensuring an accurate representation of real-scale ground. On the one hand, some research has focused on experimental analysis, utilizing the 1 g shaking table as the primary method for investigating and analyzing the experimental results. Kim et al. [
1] aimed to evaluate the influence of soil box boundary conditions on soil dynamic behavior by comparing a rigid box (RB) and a laminar shear box (LSB) through 1 g shaking table tests. Saha et al. [
2] investigated the effect of soil-structure interaction using a rigid box with permeable boundaries. Niu et al. [
3] performed a 1 g shaking table test on a scaled model of the rock slope. Lin and Wang [
4] conducted a shaking table test on a model slope to investigate the initiation of slope failure. The above studies all used 1 g shaking table tests to show the dynamic behaviors of the prototype, but the shortcomings of the 1 g shaking table tests were not considered, such as geostatic stress and confining stress. On the other hand, certain studies have employed numerical analysis techniques to study the 1 g shaking table models, allowing for a more detailed examination of the behavior and response of the tested systems. Kheradi et al. [
5] conducted numerical analysis and 1 g shaking table tests to evaluate the effectiveness of partial ground improvement as an earthquake countermeasure for the existing box culvert described earlier. Zarnani et al. [
6] developed a simplified numerical model using FLAC software to simulate the dynamic response of two reinforced earth walls constructed under 1 G conditions. Pitilakis et al. [
7] conducted a significant study utilizing initial stress–strain loops to compare centrifuge test results with numerical data. Moghadam and Baziar [
8] conducted a series of 1 g shaking table tests and performed FLAC 2D numerical simulations to investigate the effects of circular subway tunnels on ground motion amplification patterns. Although these studies increased the size of the model, the similarity law was not fully followed between the models, such as the input motion time.
Previous research experiences have provided valuable inspiration and suggestions for this study. Guo et al. [
9] conducted a shaking table model test with a rigid box to study a symmetrical anti-bedding rock slope’s dynamic characteristics and dynamic response. The effects of dynamic parameters, seismic wave types, and weak interlayers on the slope dynamic response were considered. Aldaikh et al. [
10] conducted a series of shaking table tests. The similarity law was adopted for the determination of the dynamic testing conditions of the model. In order to ensure the validity of the test results, the researchers applied the similarity law, which states that specific properties of the model should be scaled appropriately about the prototype [
11,
12,
13]. Using the 1 g shaking table, researchers can replicate seismic motions in a controlled laboratory environment and observe how the prototype ground responds. This approach allows for a comprehensive investigation of various aspects related to seismic performance. The 1 g shaking table test has the limitation that it cannot simulate the geostatic stress and confining stress of the prototype. Zhang et al. [
14] and Sadiq et al. [
15] compared the dynamic analysis results with the experimental data from a centrifuge test to evaluate the dynamic behavior of a tunnel. The experimental results of the centrifuge in the free field are in good agreement with the numerical analysis results at different depths. It provides strong proof for using numerical analysis to simulate large-scale models. Therefore, it is necessary to use the simulation analysis to study the large-scale model according to the similarity law and the results of the 1 g shaking table test.
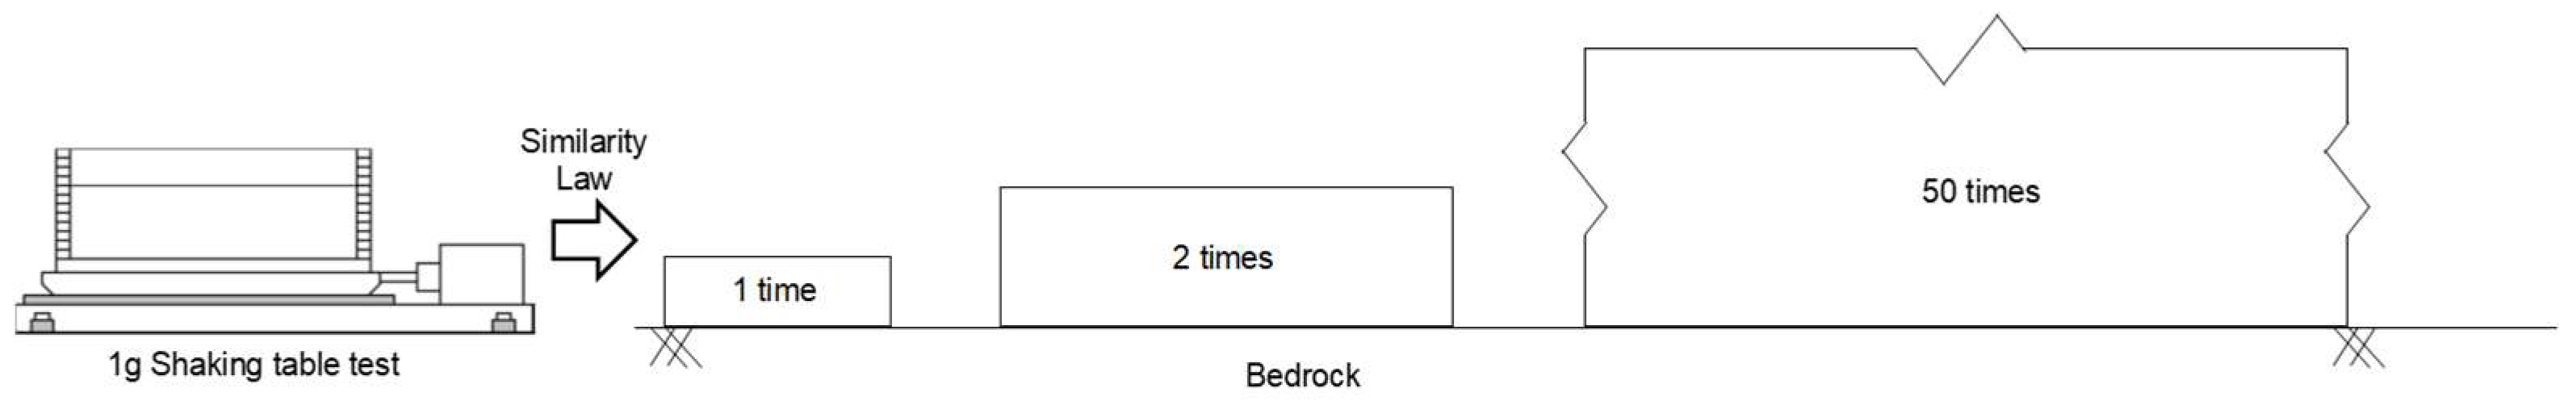
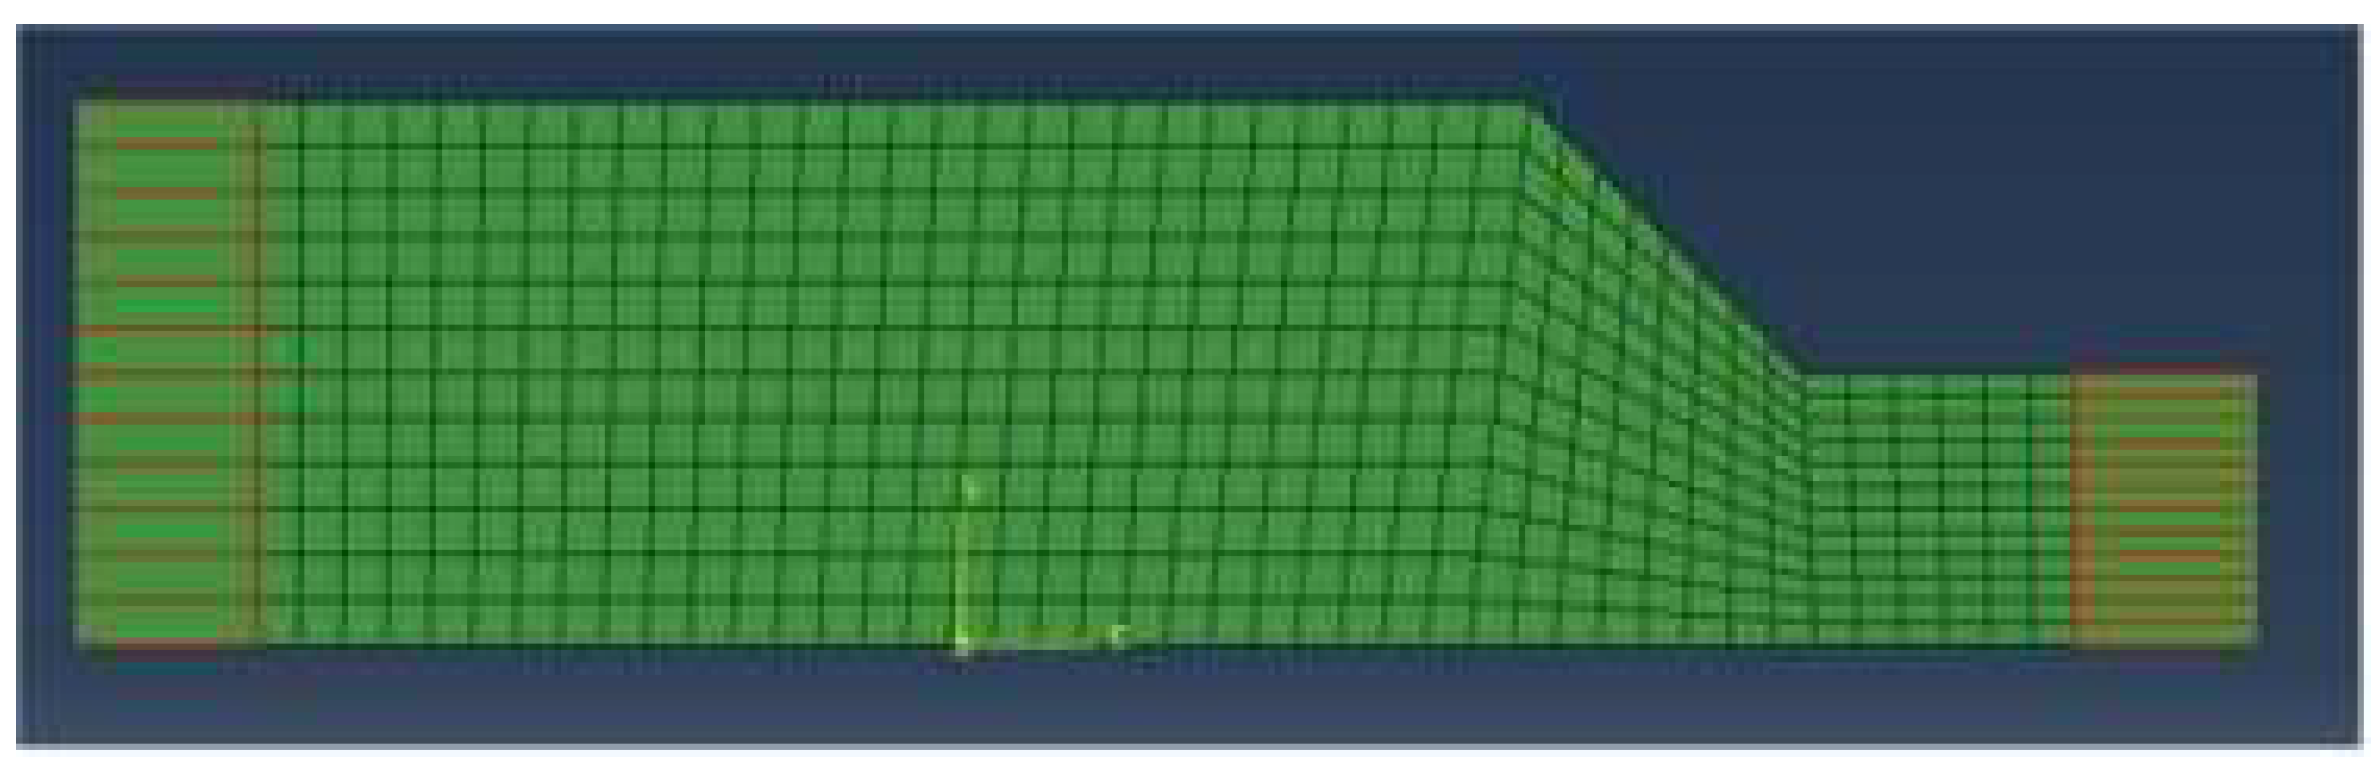
In this study, numerical analysis predicted the dynamic behavior and response of models of different scales under different seismic waves by ABAQUS and DEEPSOIL. Firstly, the 1 g shaking table test was carried out, and a model of the same size was established in the numerical analysis. The model’s dynamic behavior and response results were compared with the 1 g shaking table test and numerical analysis. A large-scale model was established through the numerical analysis, and the dynamic behavior and responses of the large-scale model using different constitutive models were obtained by combining the similarity law, as shown in
Figure 2. In this way, geostatic stress and confining stress in small-scale models can be avoided to the greatest extent. The difference between this research and the previous research was that the prototype was used as the benchmark, and the accuracy of the numerical analysis was verified by comparing the 1 g shaking table experiment with the numerical analysis. The approach taken in this research is innovative and unique, as it combines a 1 g shaking table test and similarity law to provide a fresh perspective on soil behavior and the response of a full-scale model.
3. Results and Discussion
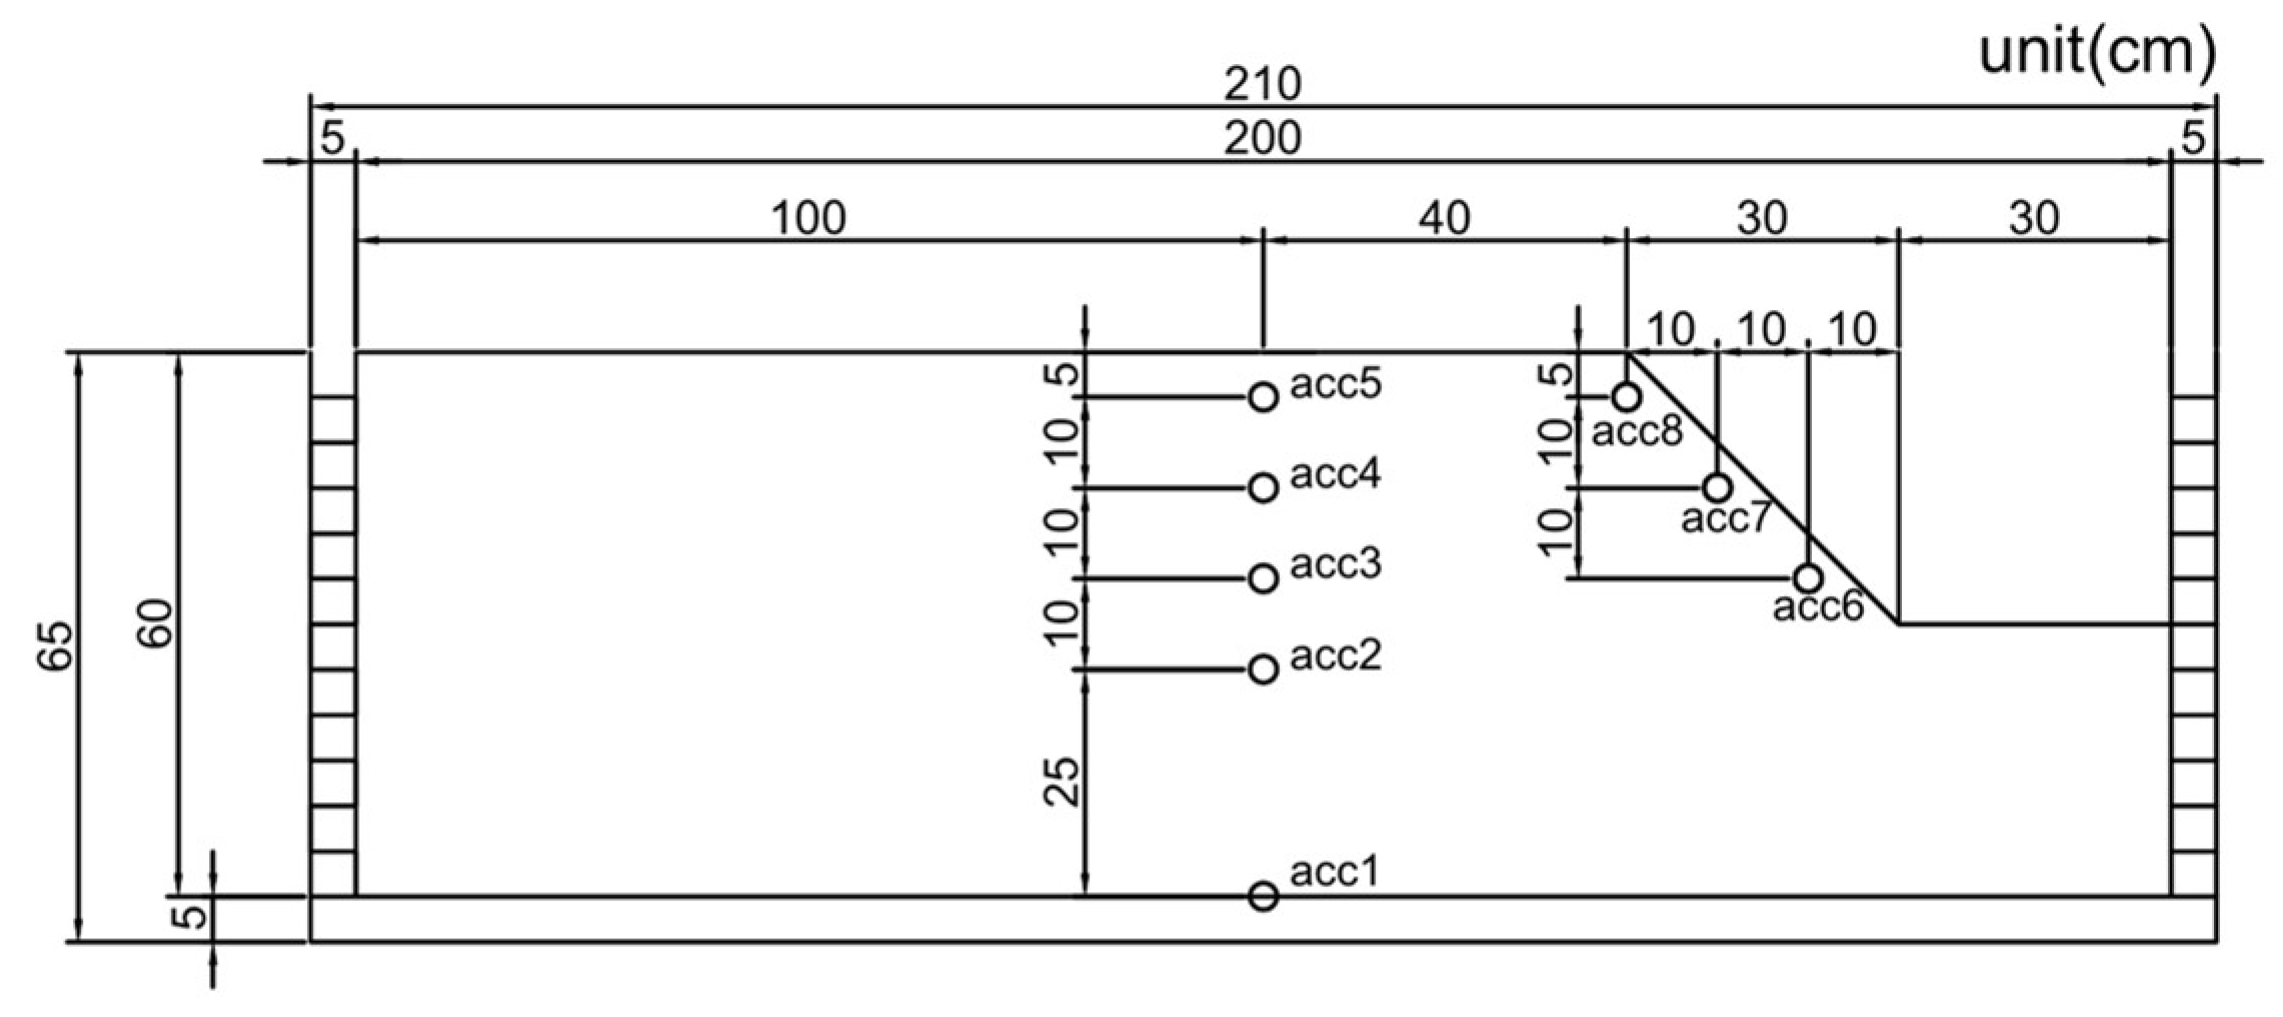
This section used DEEPSOIL and ABAQUS programs to analyze and compare different seismic input motions. In the 1 g shaking table test, the top of the model is often where the acceleration was most amplified. In this study, the accelerations of the flat and slope ground surfaces were consistent with the locations of accelerometer 5 and accelerometer 8 in
Figure 6.
The 1 g shaking table test results and numerical analysis results were compared through root mean square error. The RMSE values are calculated to assess the overall accuracy and reliability of the numerical analysis. When the analysis value of RMSE is close to 0, it is more consistent with the experimental value. In seismology or geotechnical engineering, RMSE reference values for simulated acceleration-time histories range from 0 to 0.3 [
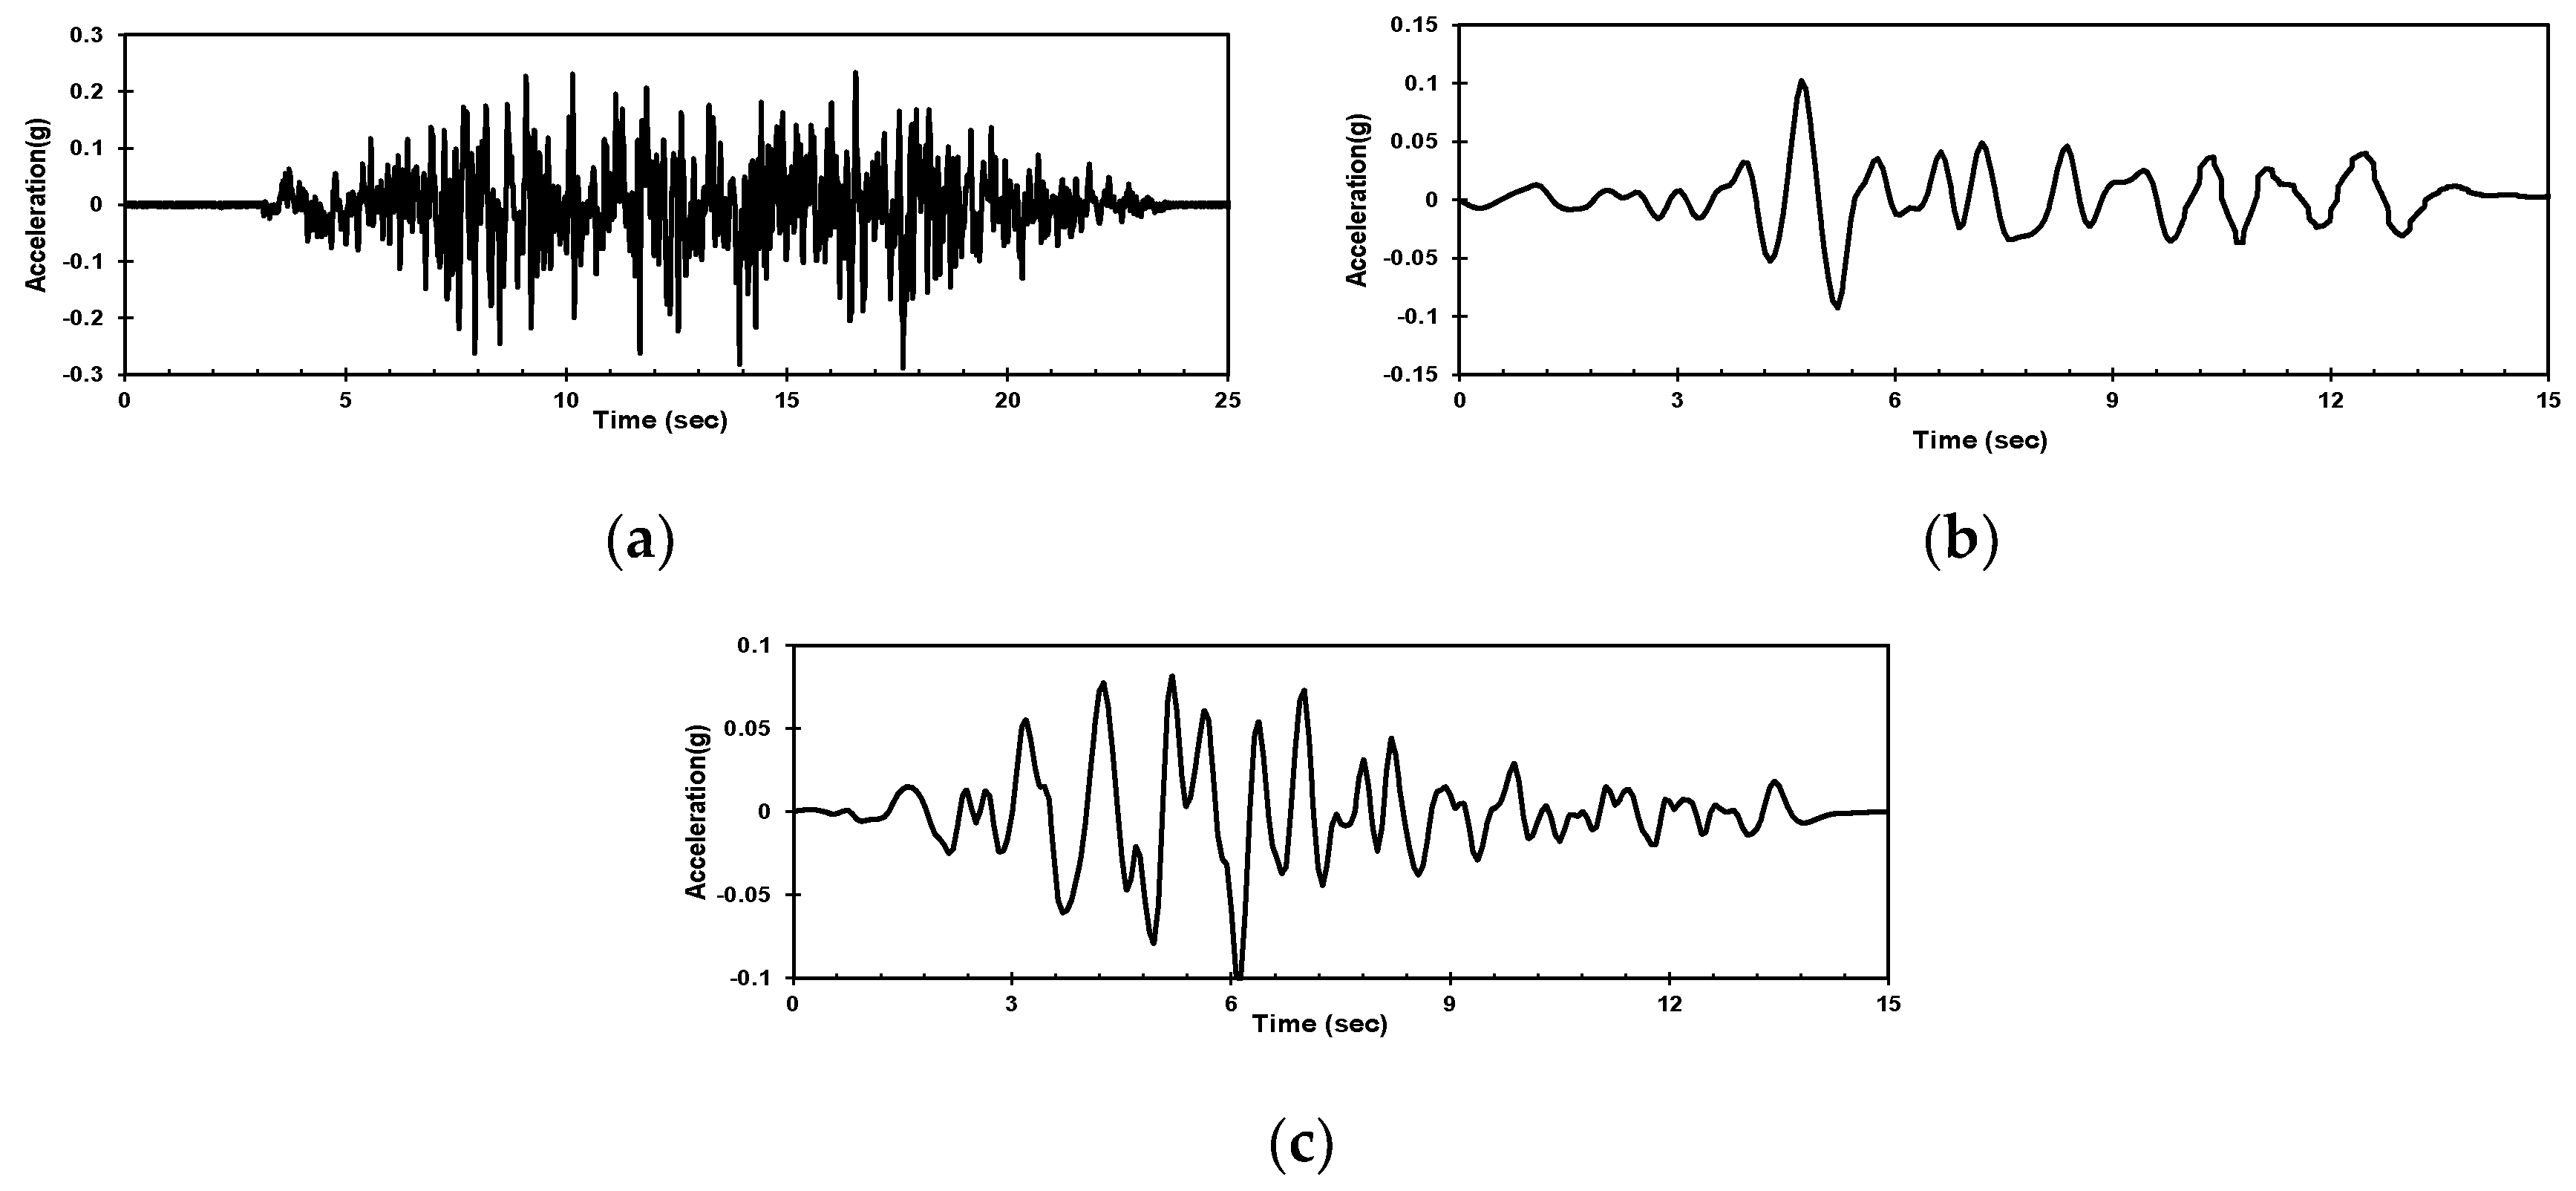
19,
20]. Artificial seismic waves contain the characteristics of long-period and short-period waves. In the following, the results are presented only with artificial seismic waves.
3.1. Acceleration-Time History
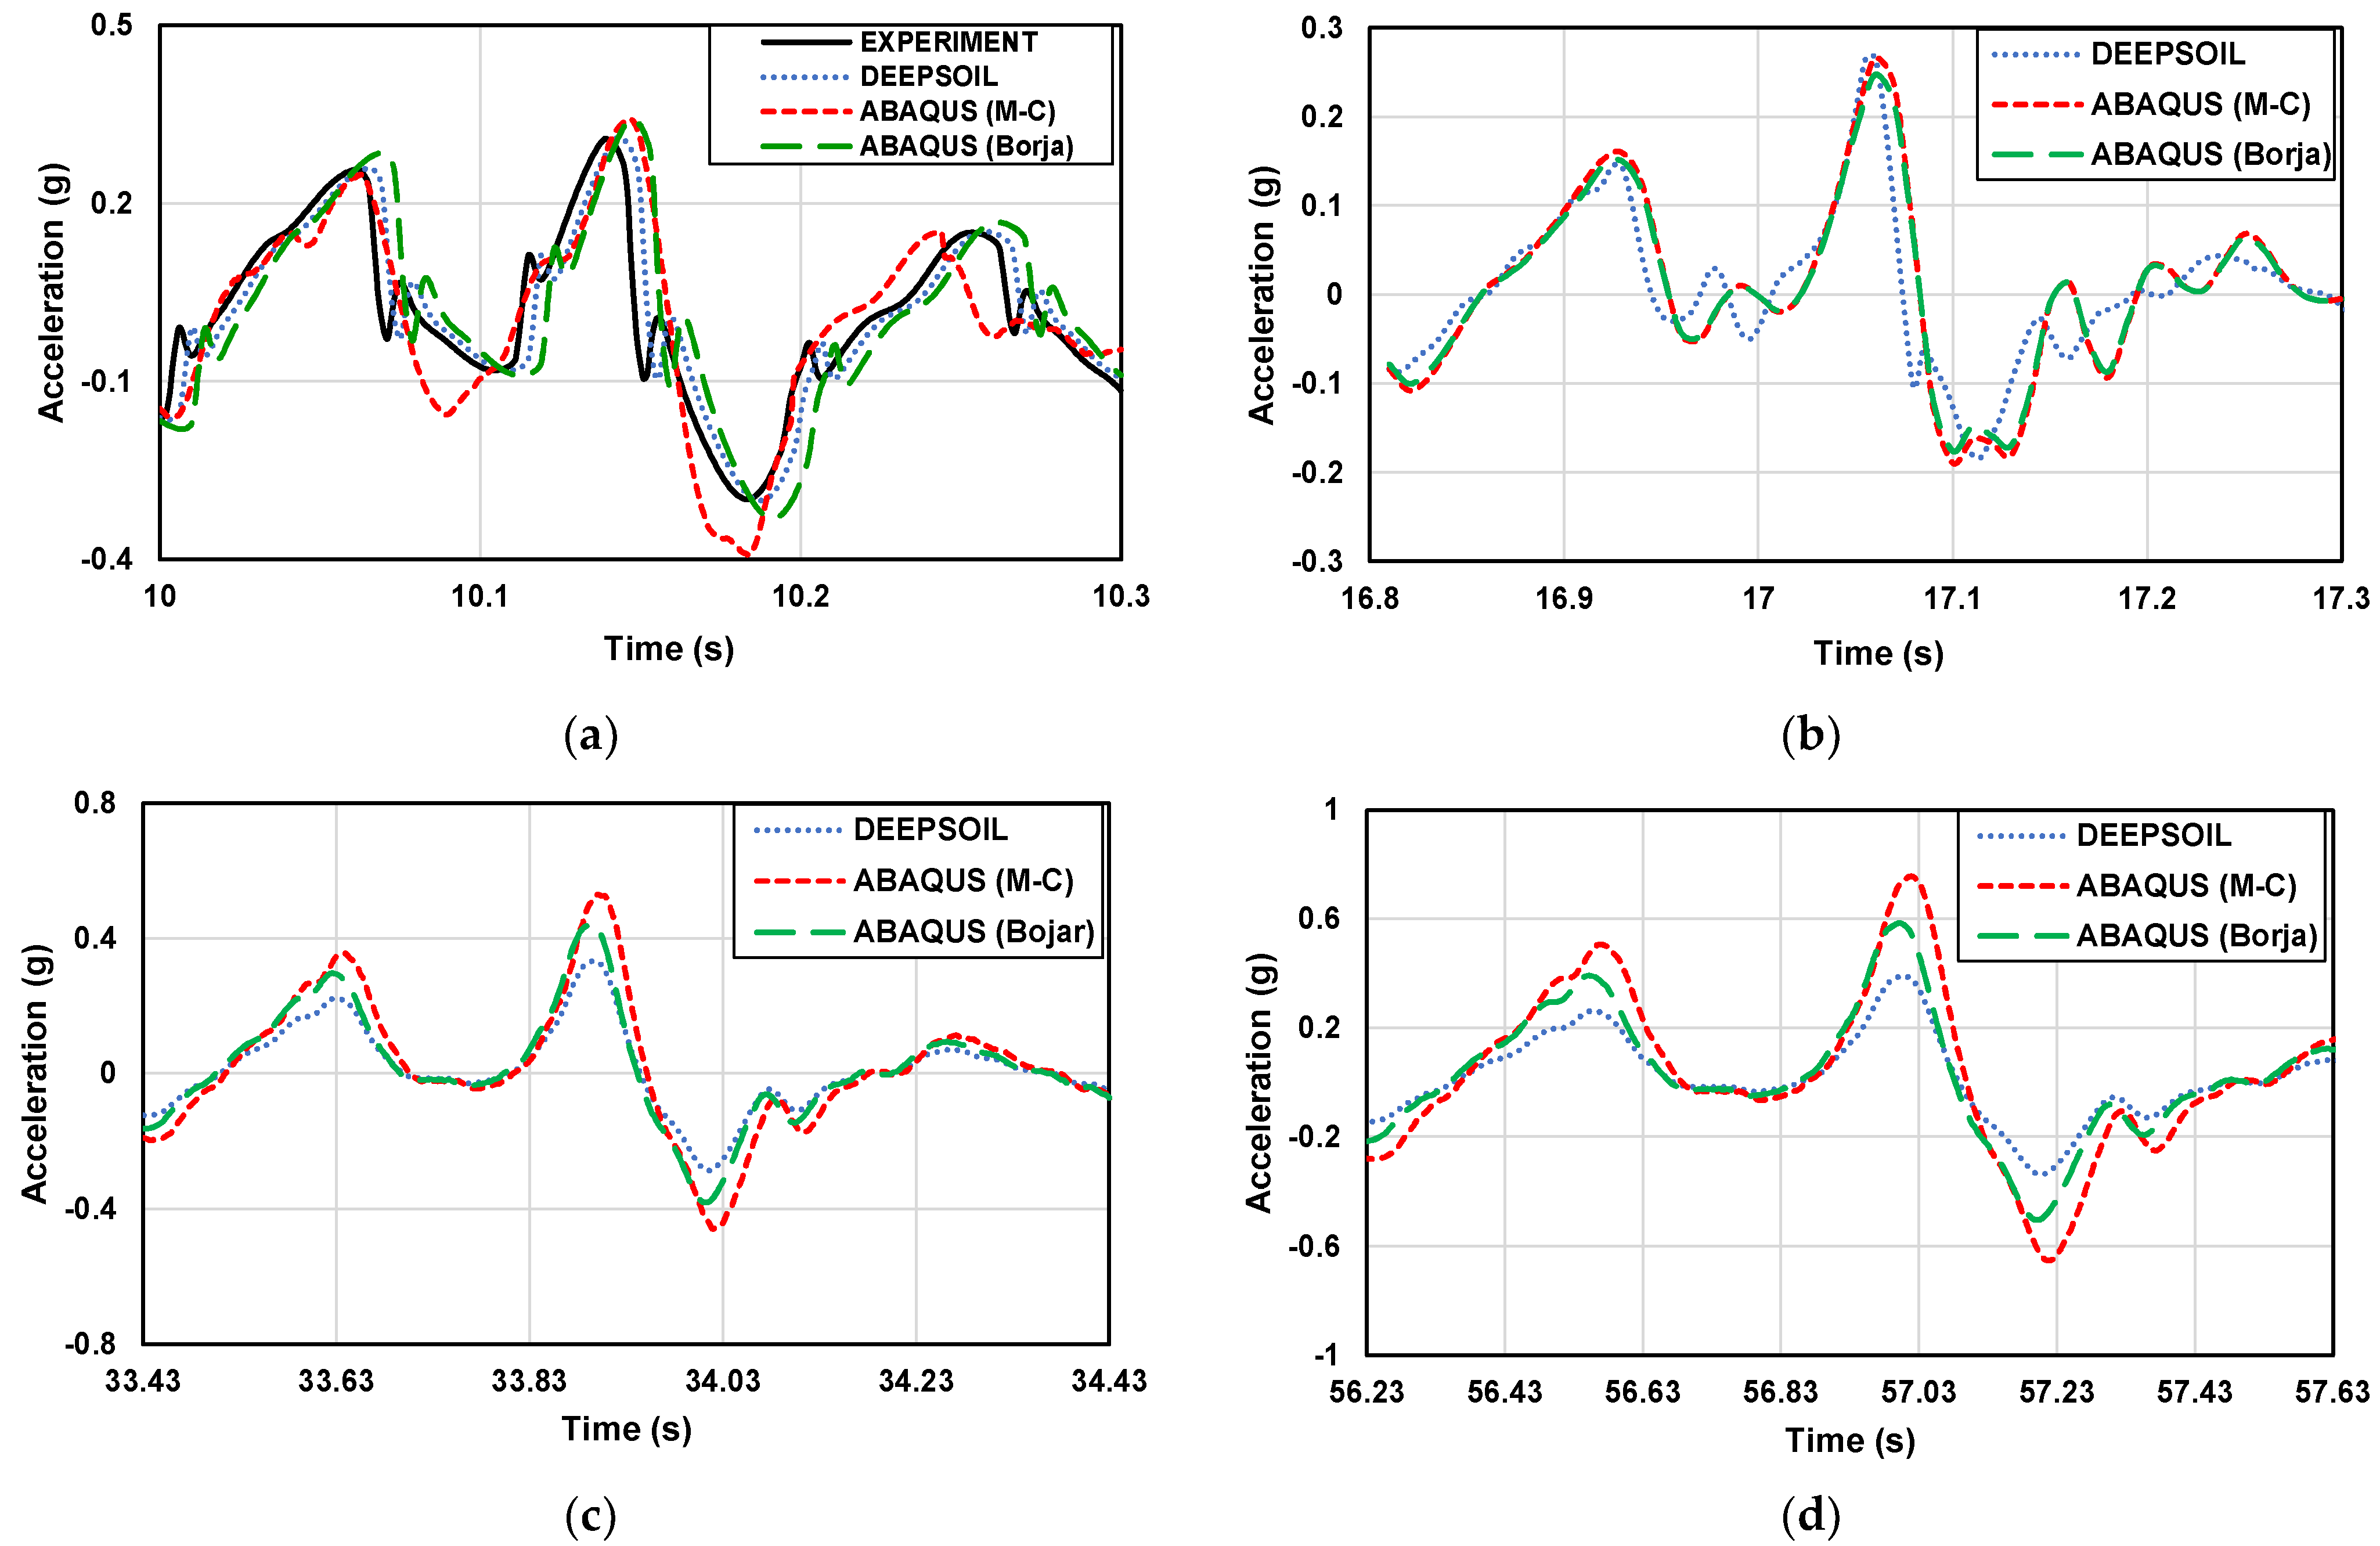
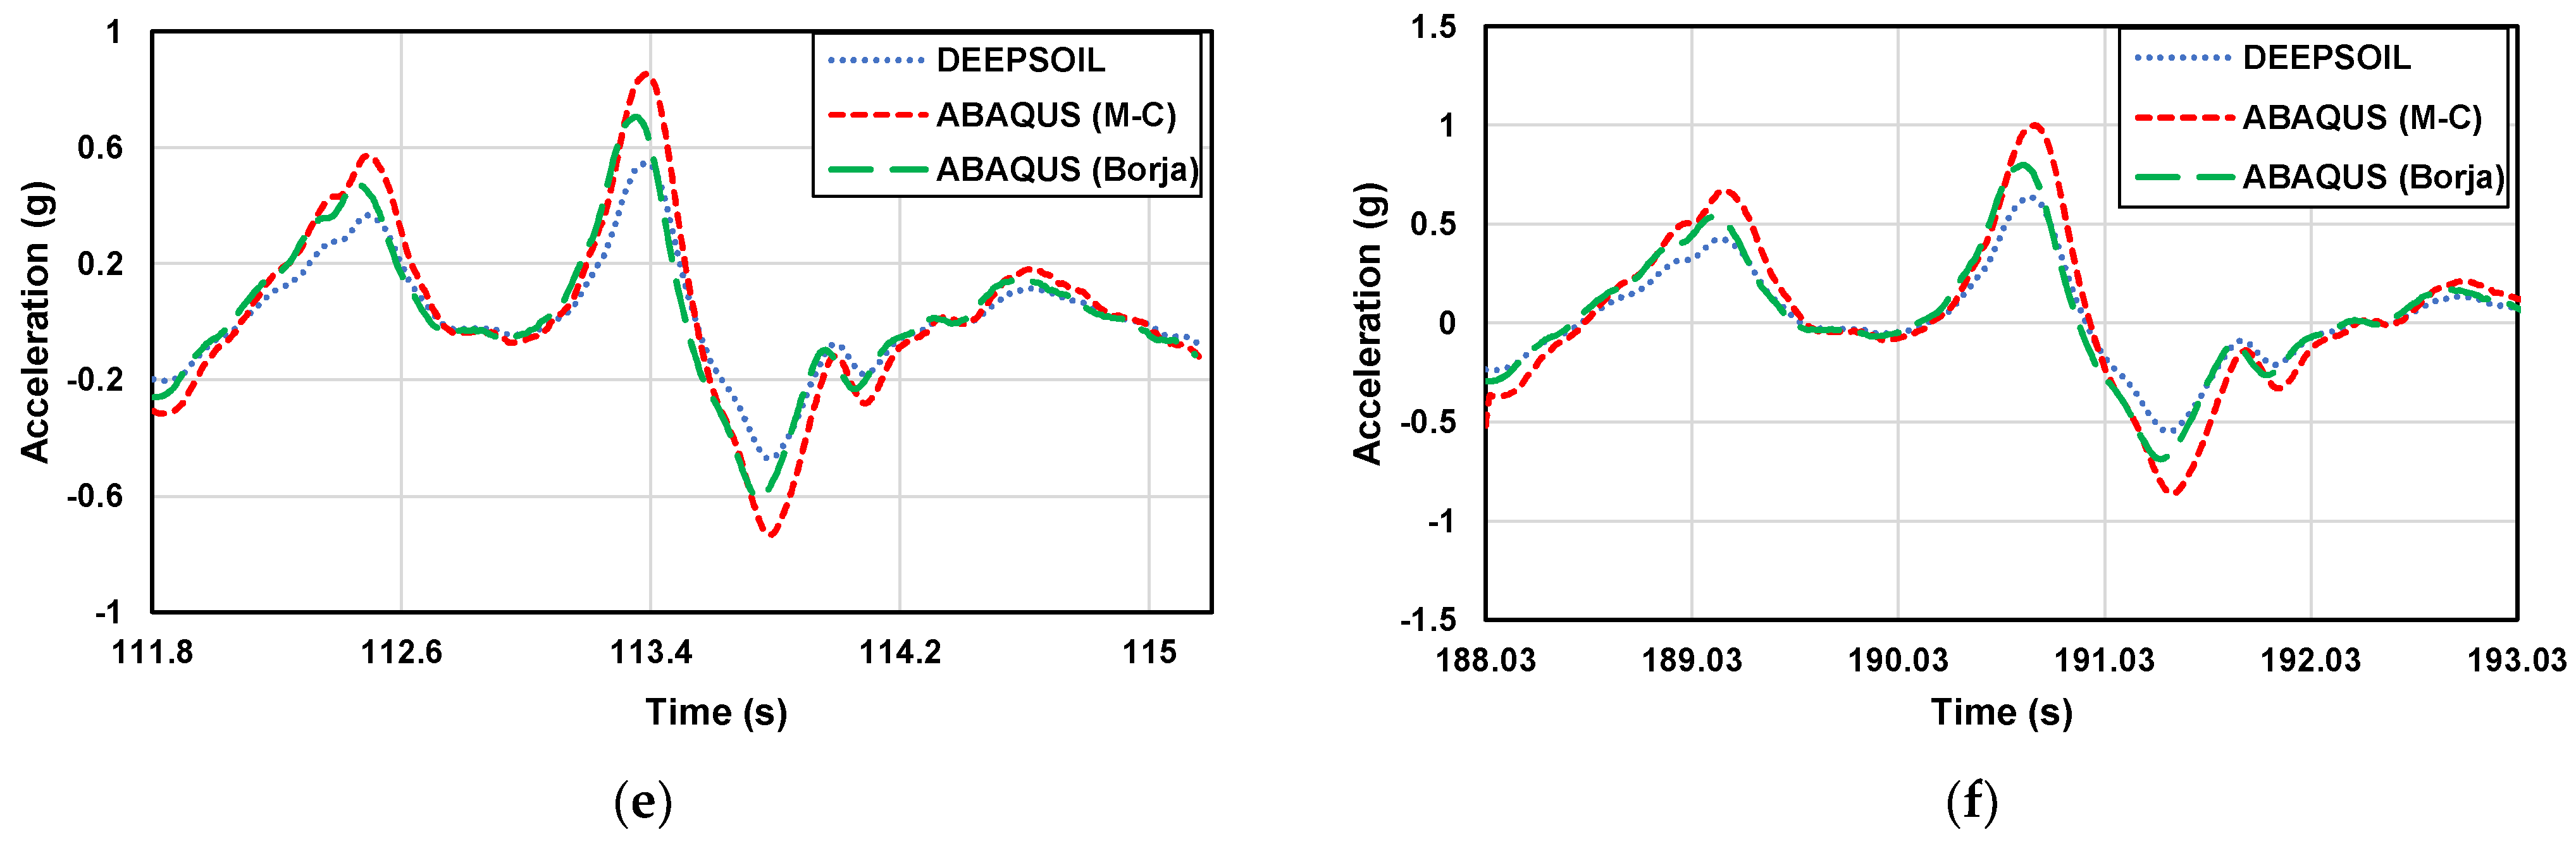
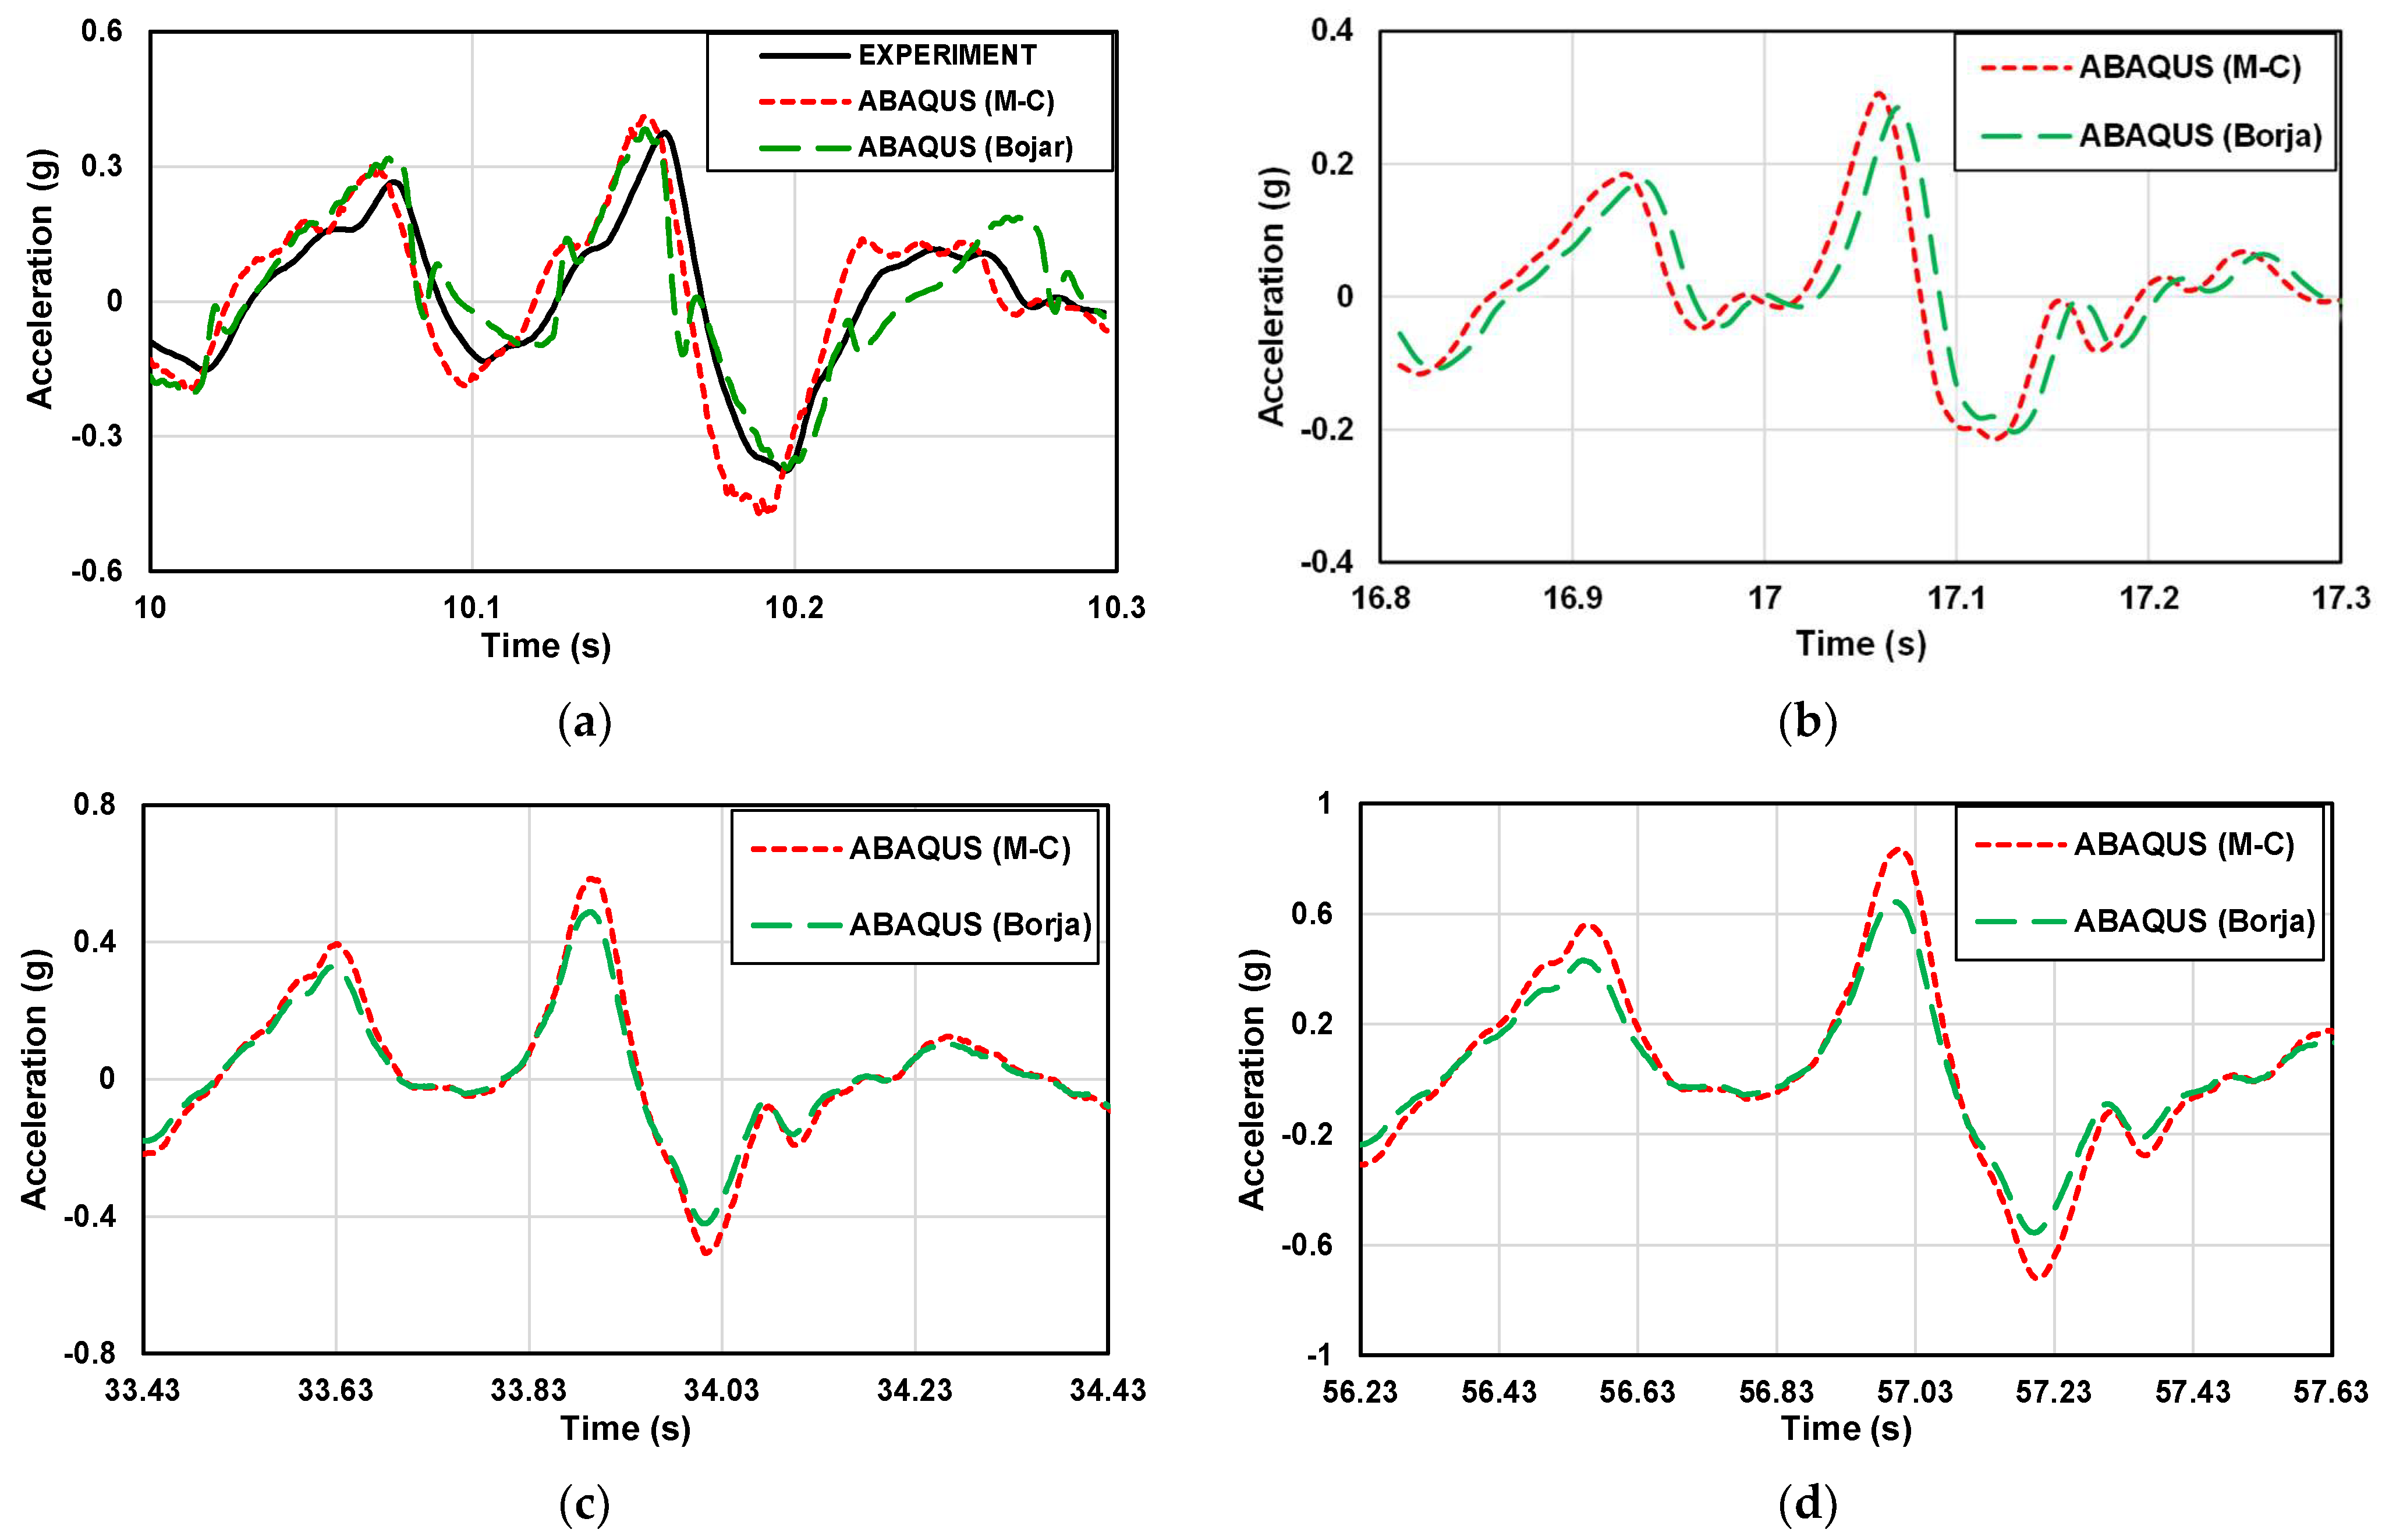
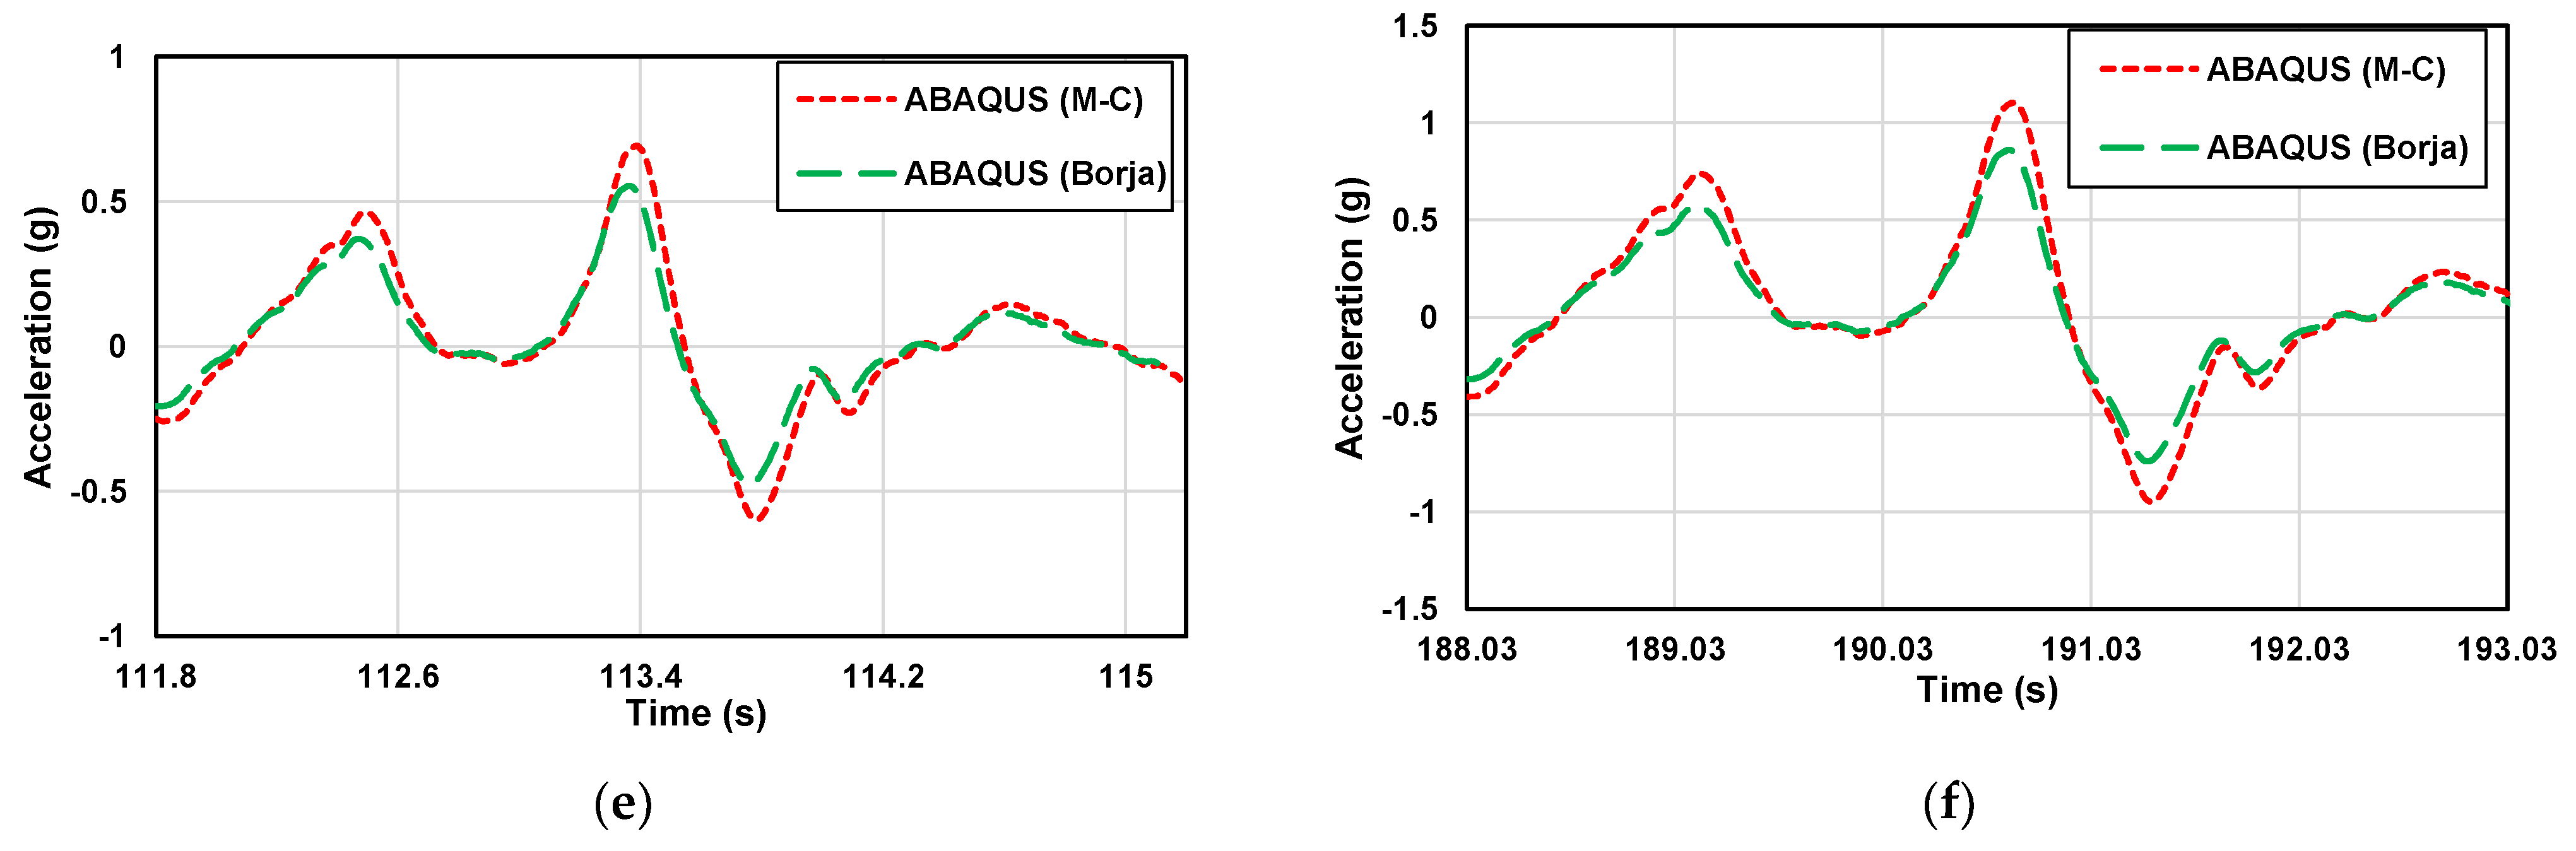
The difference between the experimental and numerical analysis results can be more clearly understood by comparing a small acceleration segment.
Figure 9 and
Figure 10 show the part of the acceleration-time history of the 1 g shaking table test and numerical analysis with the artificial seismic wave in different scales.
The analysis of the acceleration variation between the experimental results and numerical results was conducted to compare the predicted ground acceleration values and accelerations amplified with depth. At the same depth, the acceleration of the sloping part is greater than that of the flat part. Experimental and numerical data cannot be directly compared because they are very close. Therefore, values were analyzed using the RMSE method. The differences in the numerical analysis were confirmed based on the experimental results in this study. The numerical analysis results are in good agreement with the experimental results. In the flat ground, the RMSE analysis values of DEEPSOIL, ABAQUS (M-C), ABAQUS (Borja) results, and experimental results are 0.0184, 0.0527, and 0.0460, respectively. In the sloping ground, the RMSE analysis values of ABAQUS (M-C), ABAQUS (Borja) results, and experimental results are 0.1017 and 0.0512, respectively. It shows that the numerical analysis results are very close to the experimental results, which proves that the numerical analysis method is feasible. At the same time, the accuracy of the 1 g shaking table model was also verified.
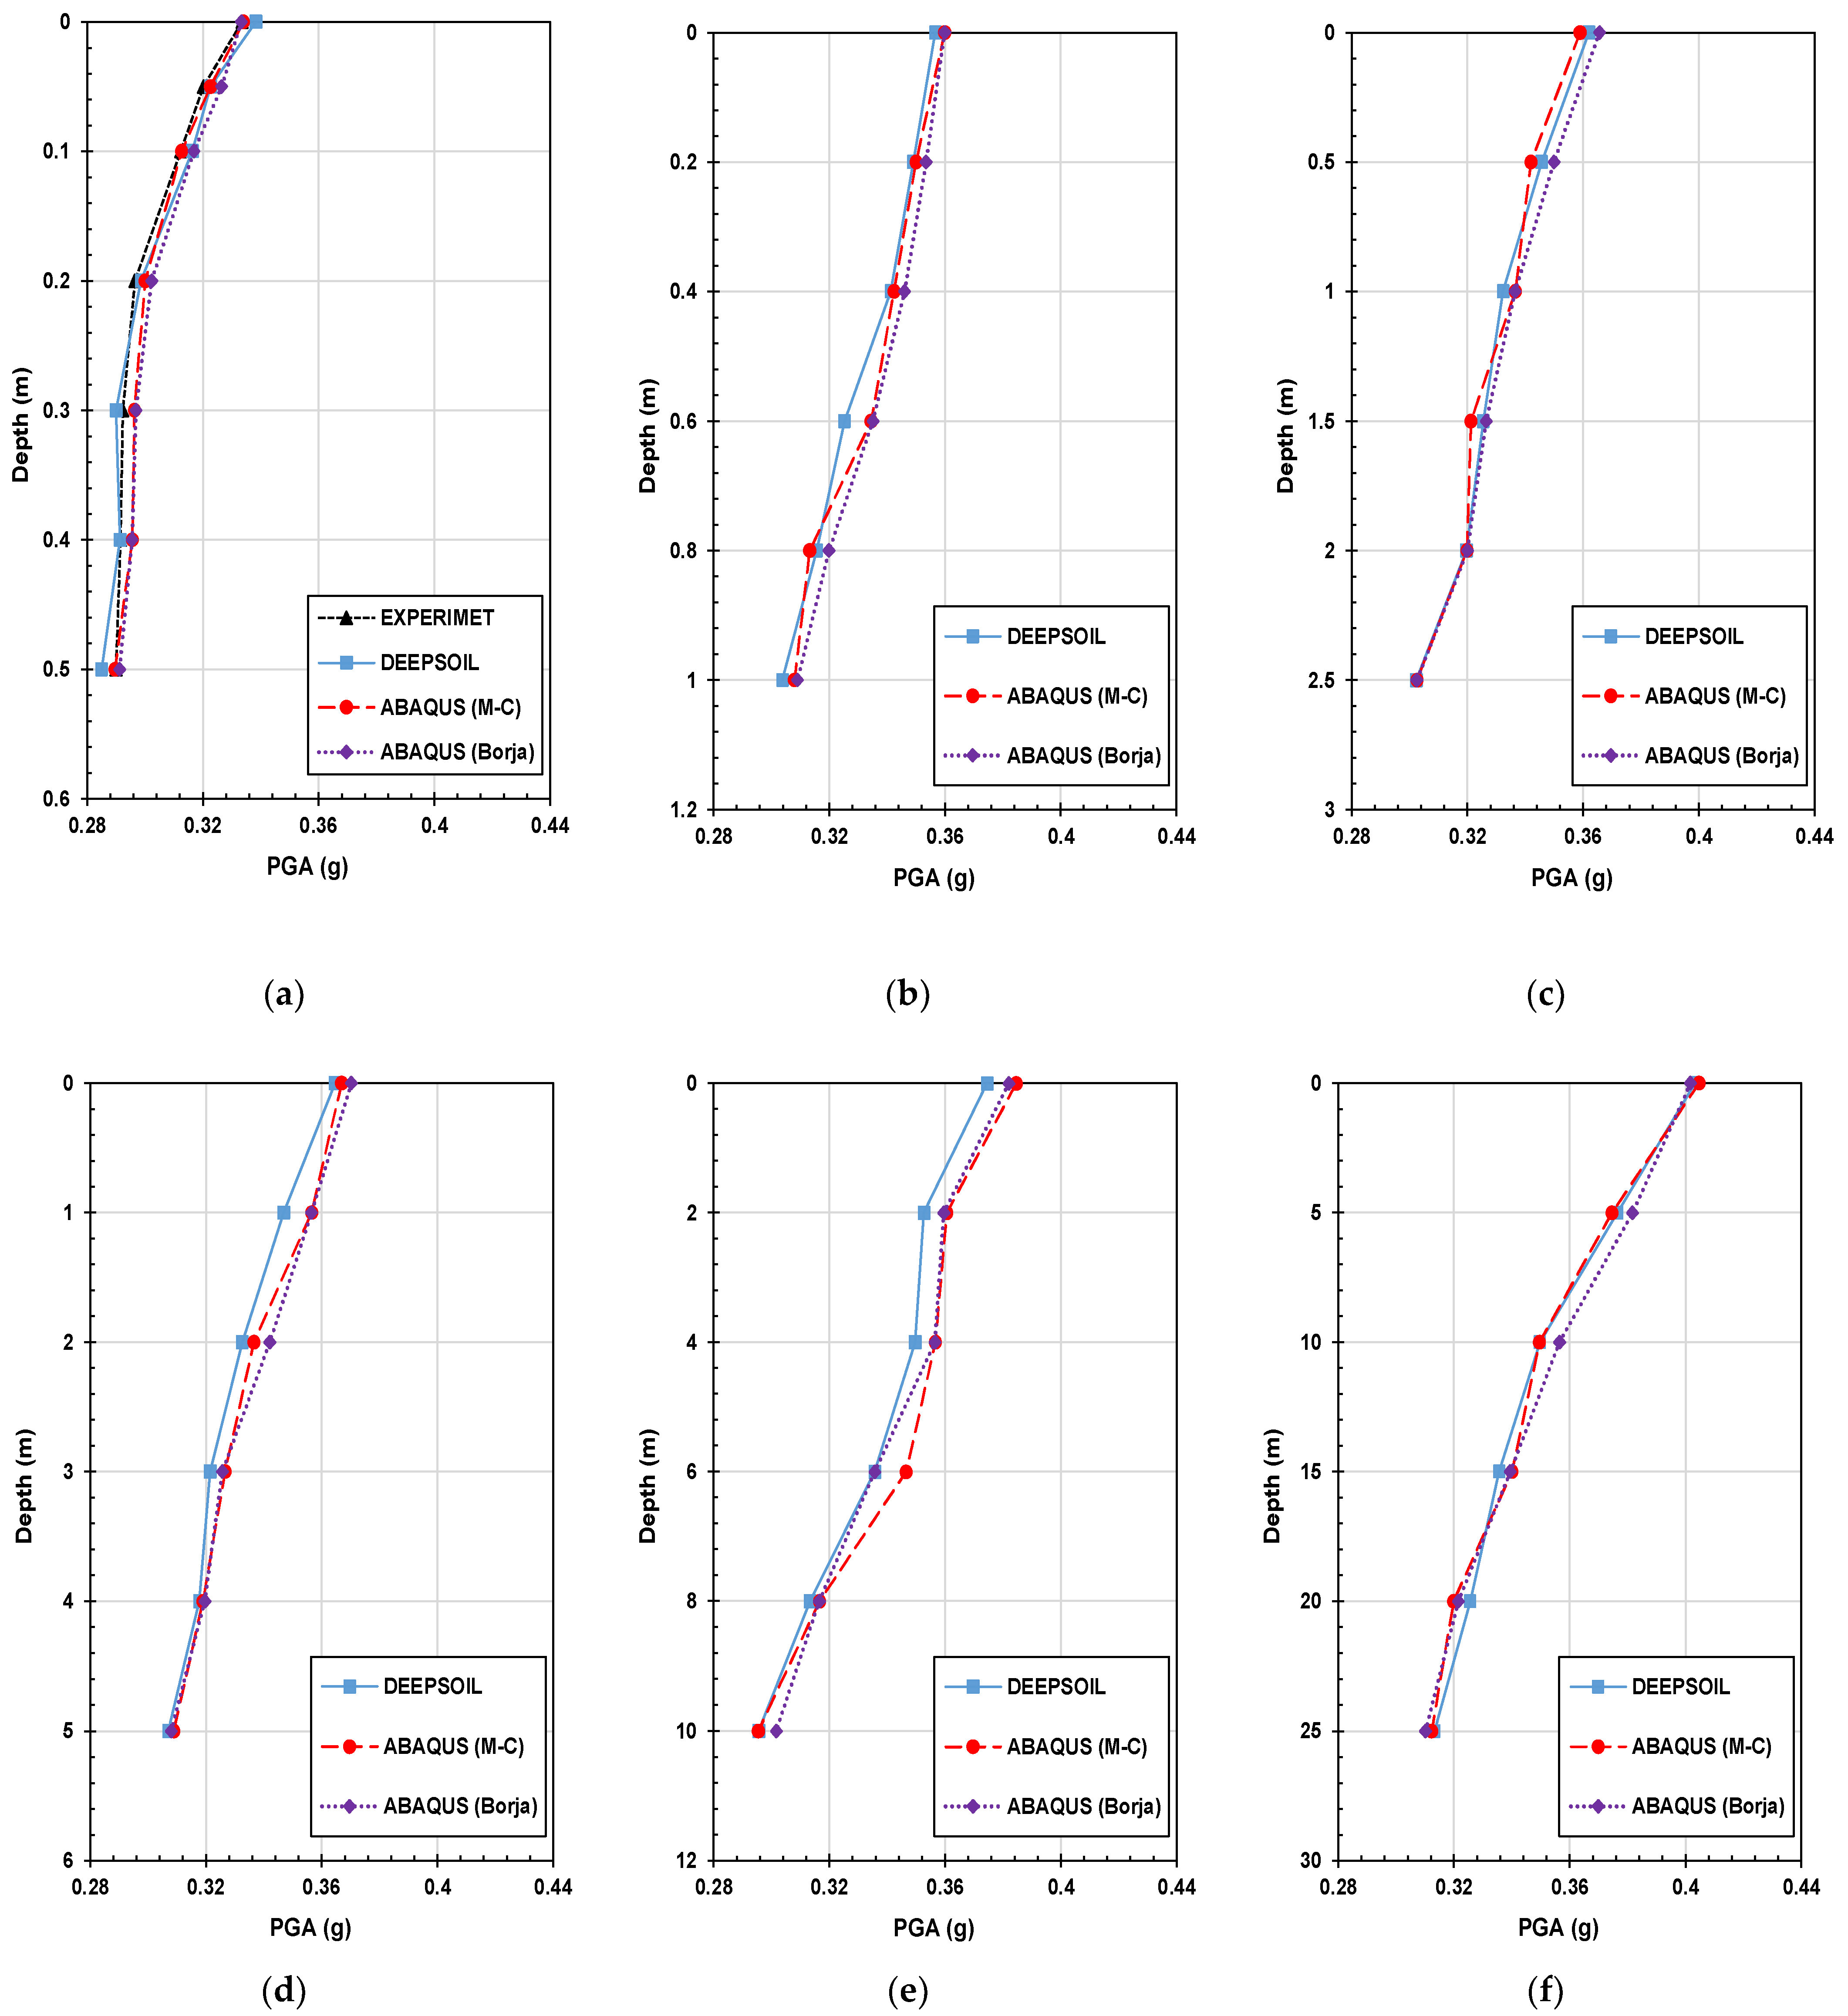
3.2. Peak Ground Acceleration
Peak ground acceleration (PGA) is a measure used to quantify the maximum acceleration experienced by the ground during an earthquake. It represents the highest value of ground acceleration recorded at a specific location during the seismic event.
Figure 11 is the PGA of the experiment result and numerical analysis result of the flat part with the artificial seismic wave in different scales.
The relationship between PGA and depth highlighted the importance of considering site-specific soil properties and layering effects in seismic hazard assessments. Experiment and numerical analysis results showed a consistent tendency to increase as the depth became shallower. Whether it is the experimental results or the numerical analysis results, with the increase in depth, the PGA presents an increasing trend. By examining the differences in PGA values between numerical analyses, insights can be gained into the accuracy and reliability of these models in estimating ground shaking. The findings suggest that DEEPSOIL may be more suitable for capturing the ground-shaking characteristics and providing reliable estimates of PGA compared to ABAQUS in the context of this study.
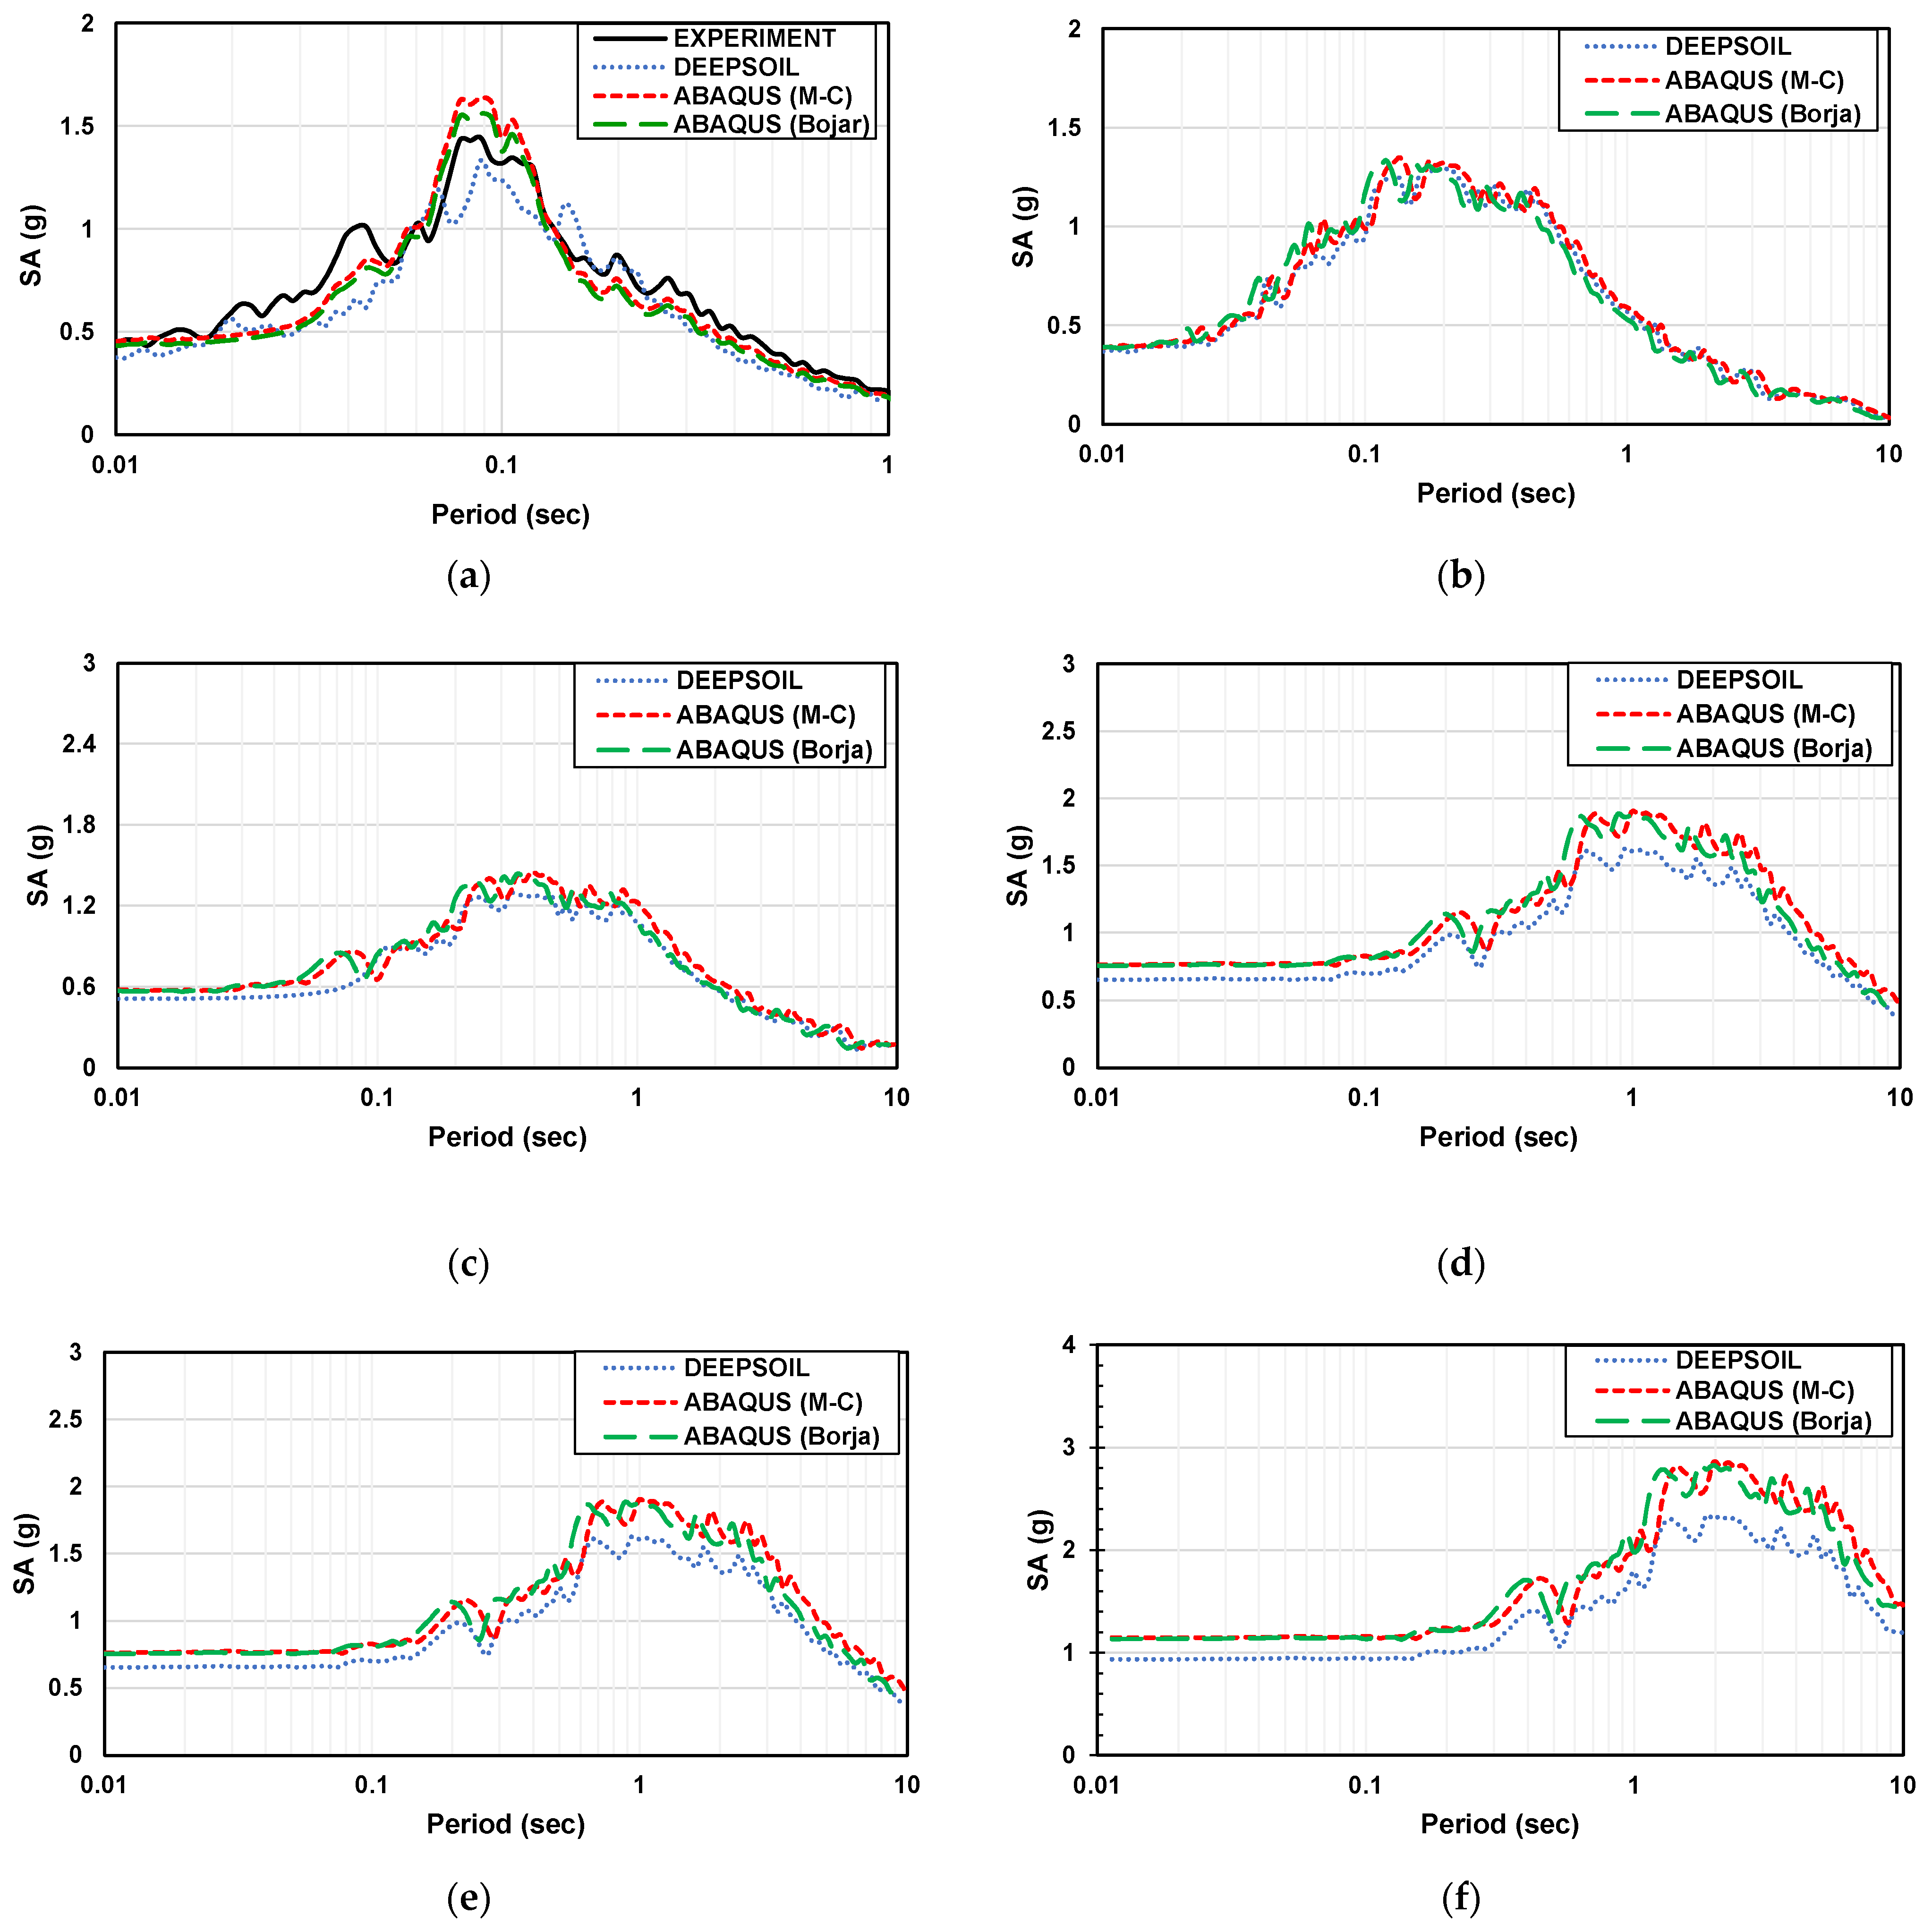
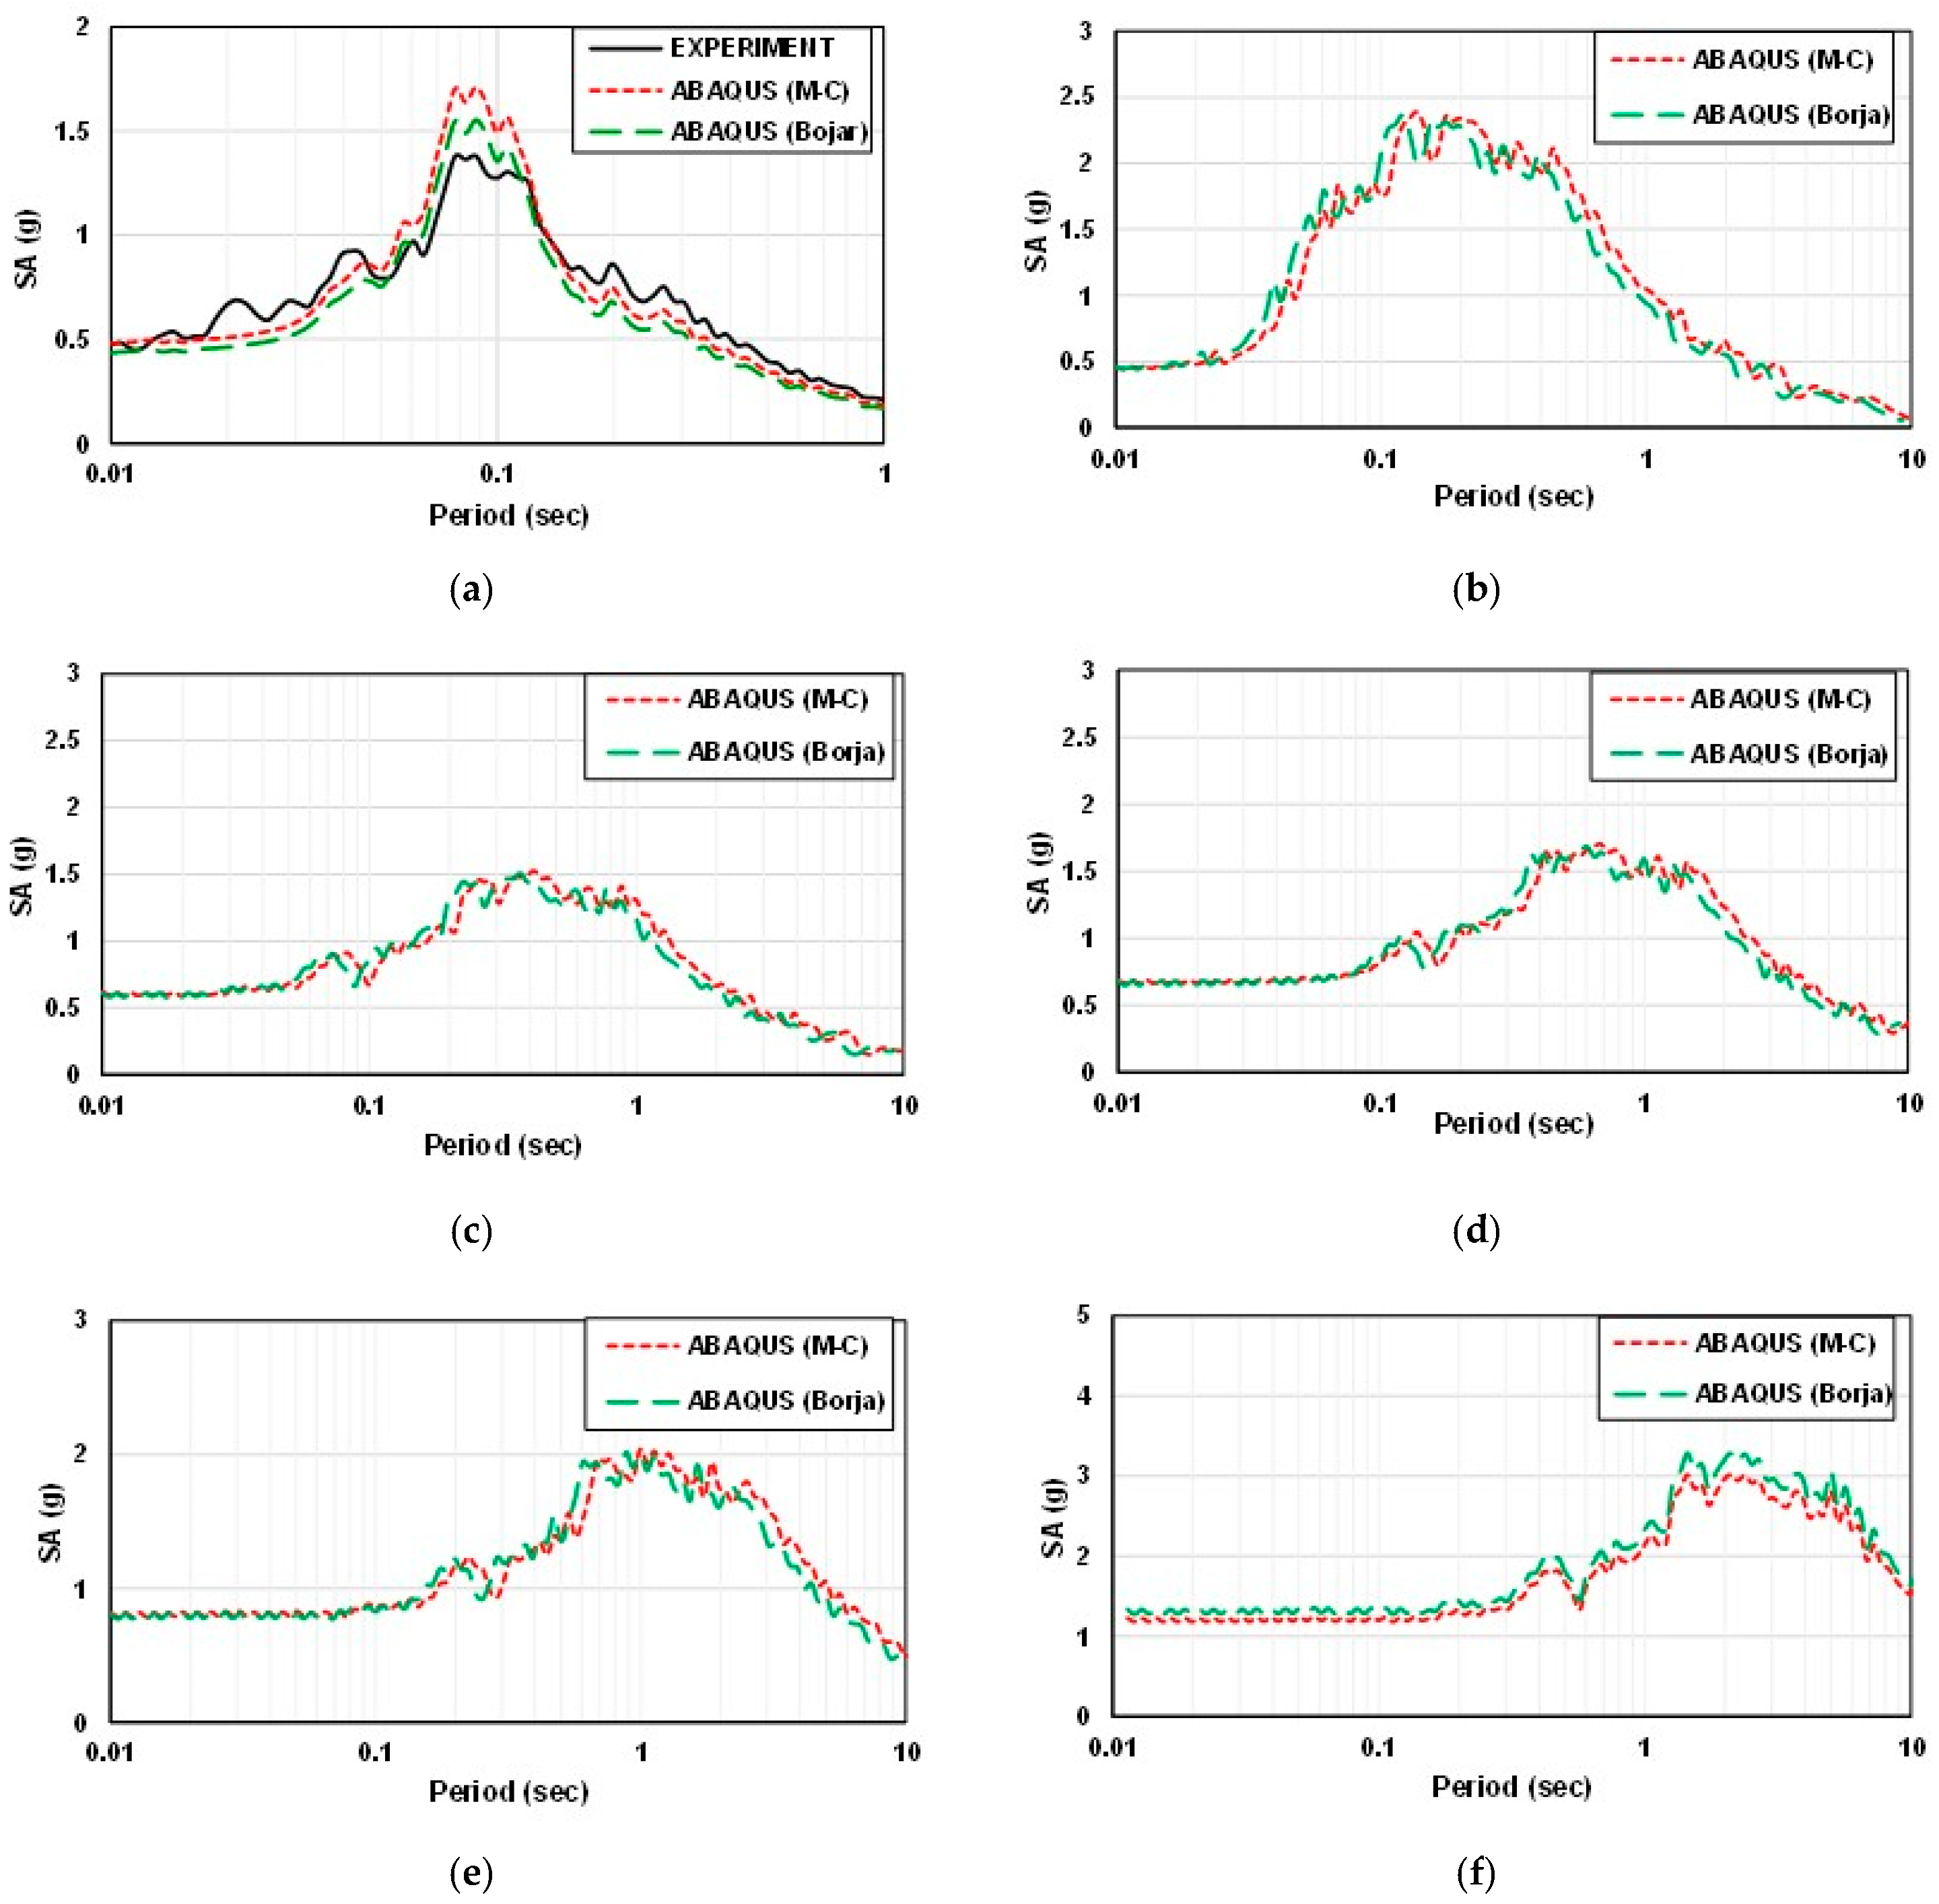
3.3. Spectral Acceleration
Spectral acceleration is a measure used in earthquake engineering to quantify the amplitude of ground motion at different frequencies during an earthquake. It represents the maximum acceleration that a specific structure or location experiences at a particular frequency.
Figure 12 and
Figure 13 show the spectral acceleration of the experiment and analysis with the artificial seismic wave at different scales.
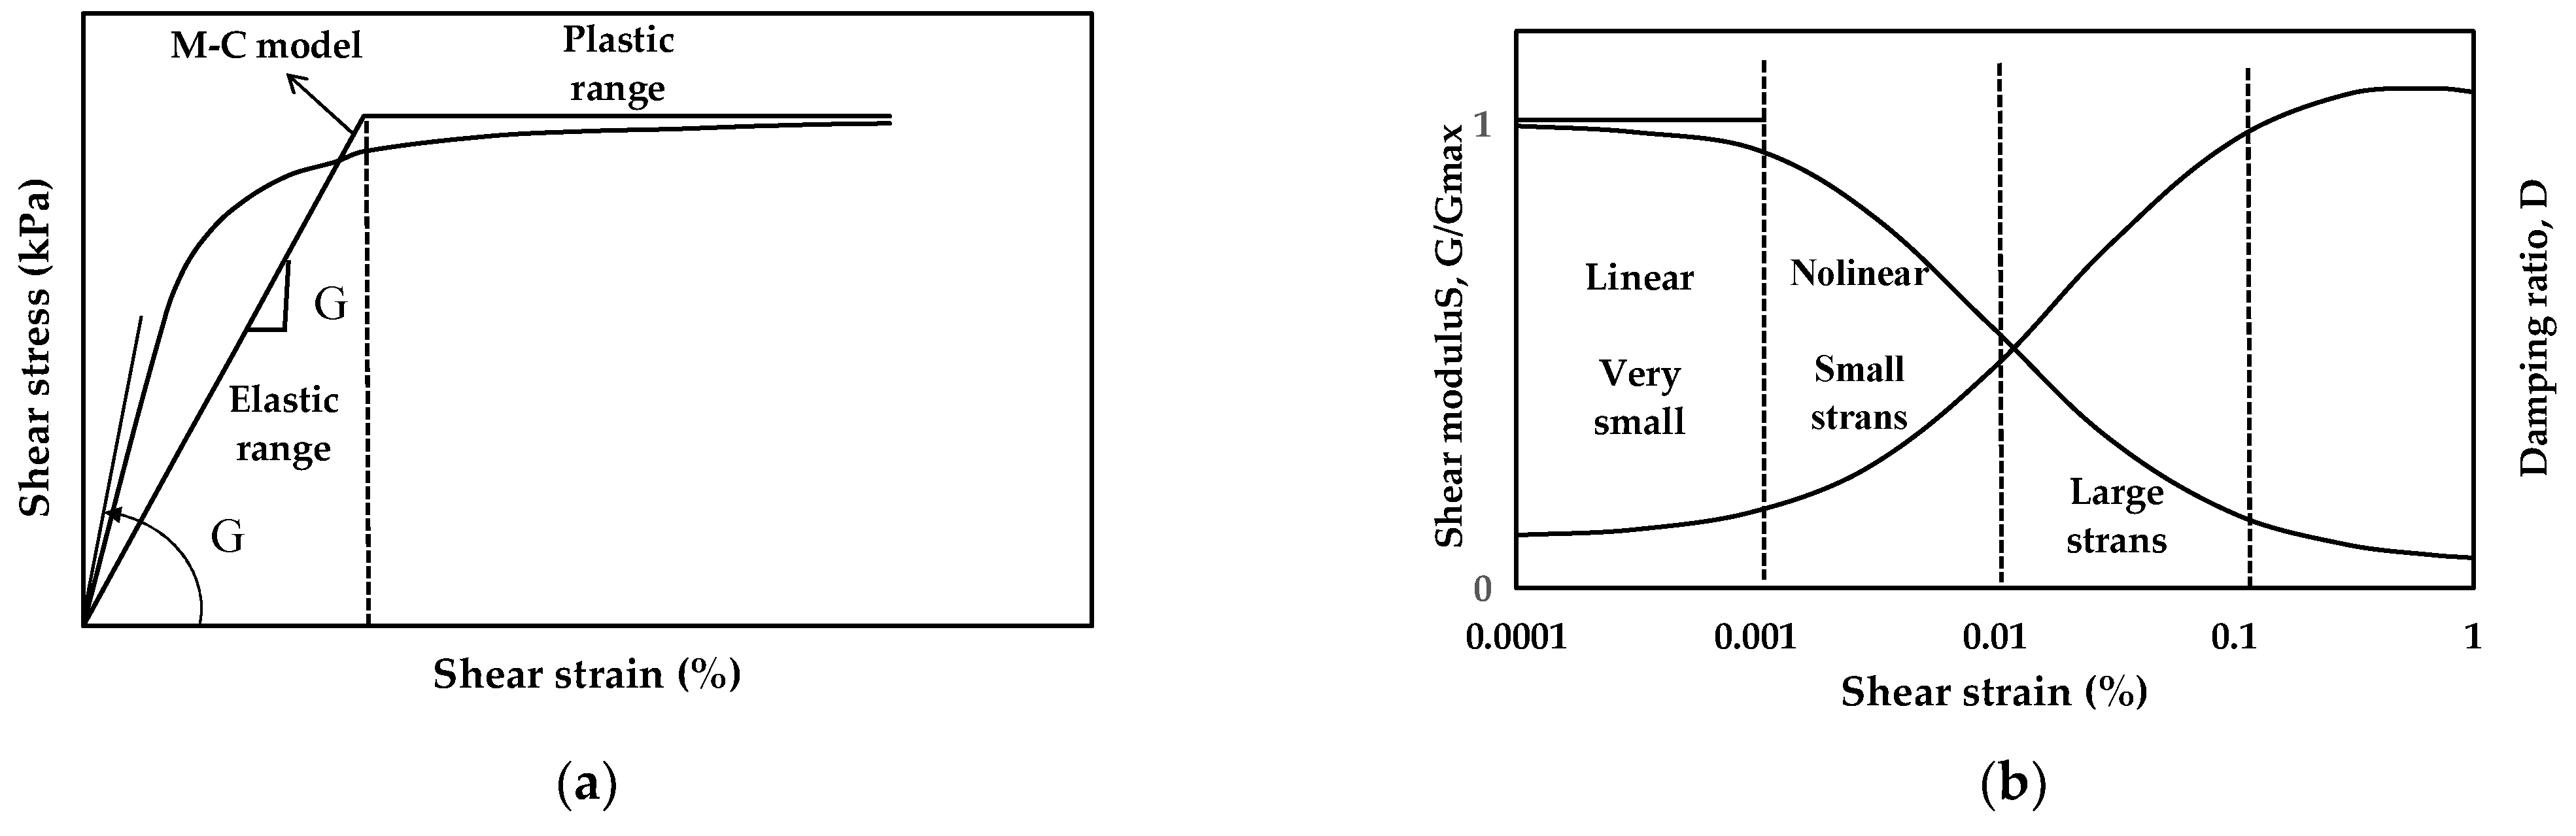
By comparing the spectral acceleration, when it is less than the natural period, for a flat part and a sloping part, the amplification factor gradually decreases with the increase in the natural period for the flat part. The ABAQUS (Mohr–Coulomb model) analysis value is the highest, followed by the ABAQUS (Borja model), DEEPSOIL, and experimental values. The ABAQUS value is more significant than that of the experimental analysis at the sloping part. One of the reasons for the difference between the ABAQUS and DEPSOIL analysis may be due to the difference in constitutive models. The Mohr–Coulomb model was used in ABAQUS, and the Darendeli nonlinear model was used in DEEPSOIL. However, the ABAQUS (Borja model) result is very close to DEEPSOIL. In general, the experimental results are very close to the numerical results.
Peak spectral acceleration can be predicted based on the relationship between frequency and size. The accuracy of modeling using ABAQUS is verified by calculating the period and frequency of the model. Therefore, the values in the numerical model conform to the equations and scale factor.
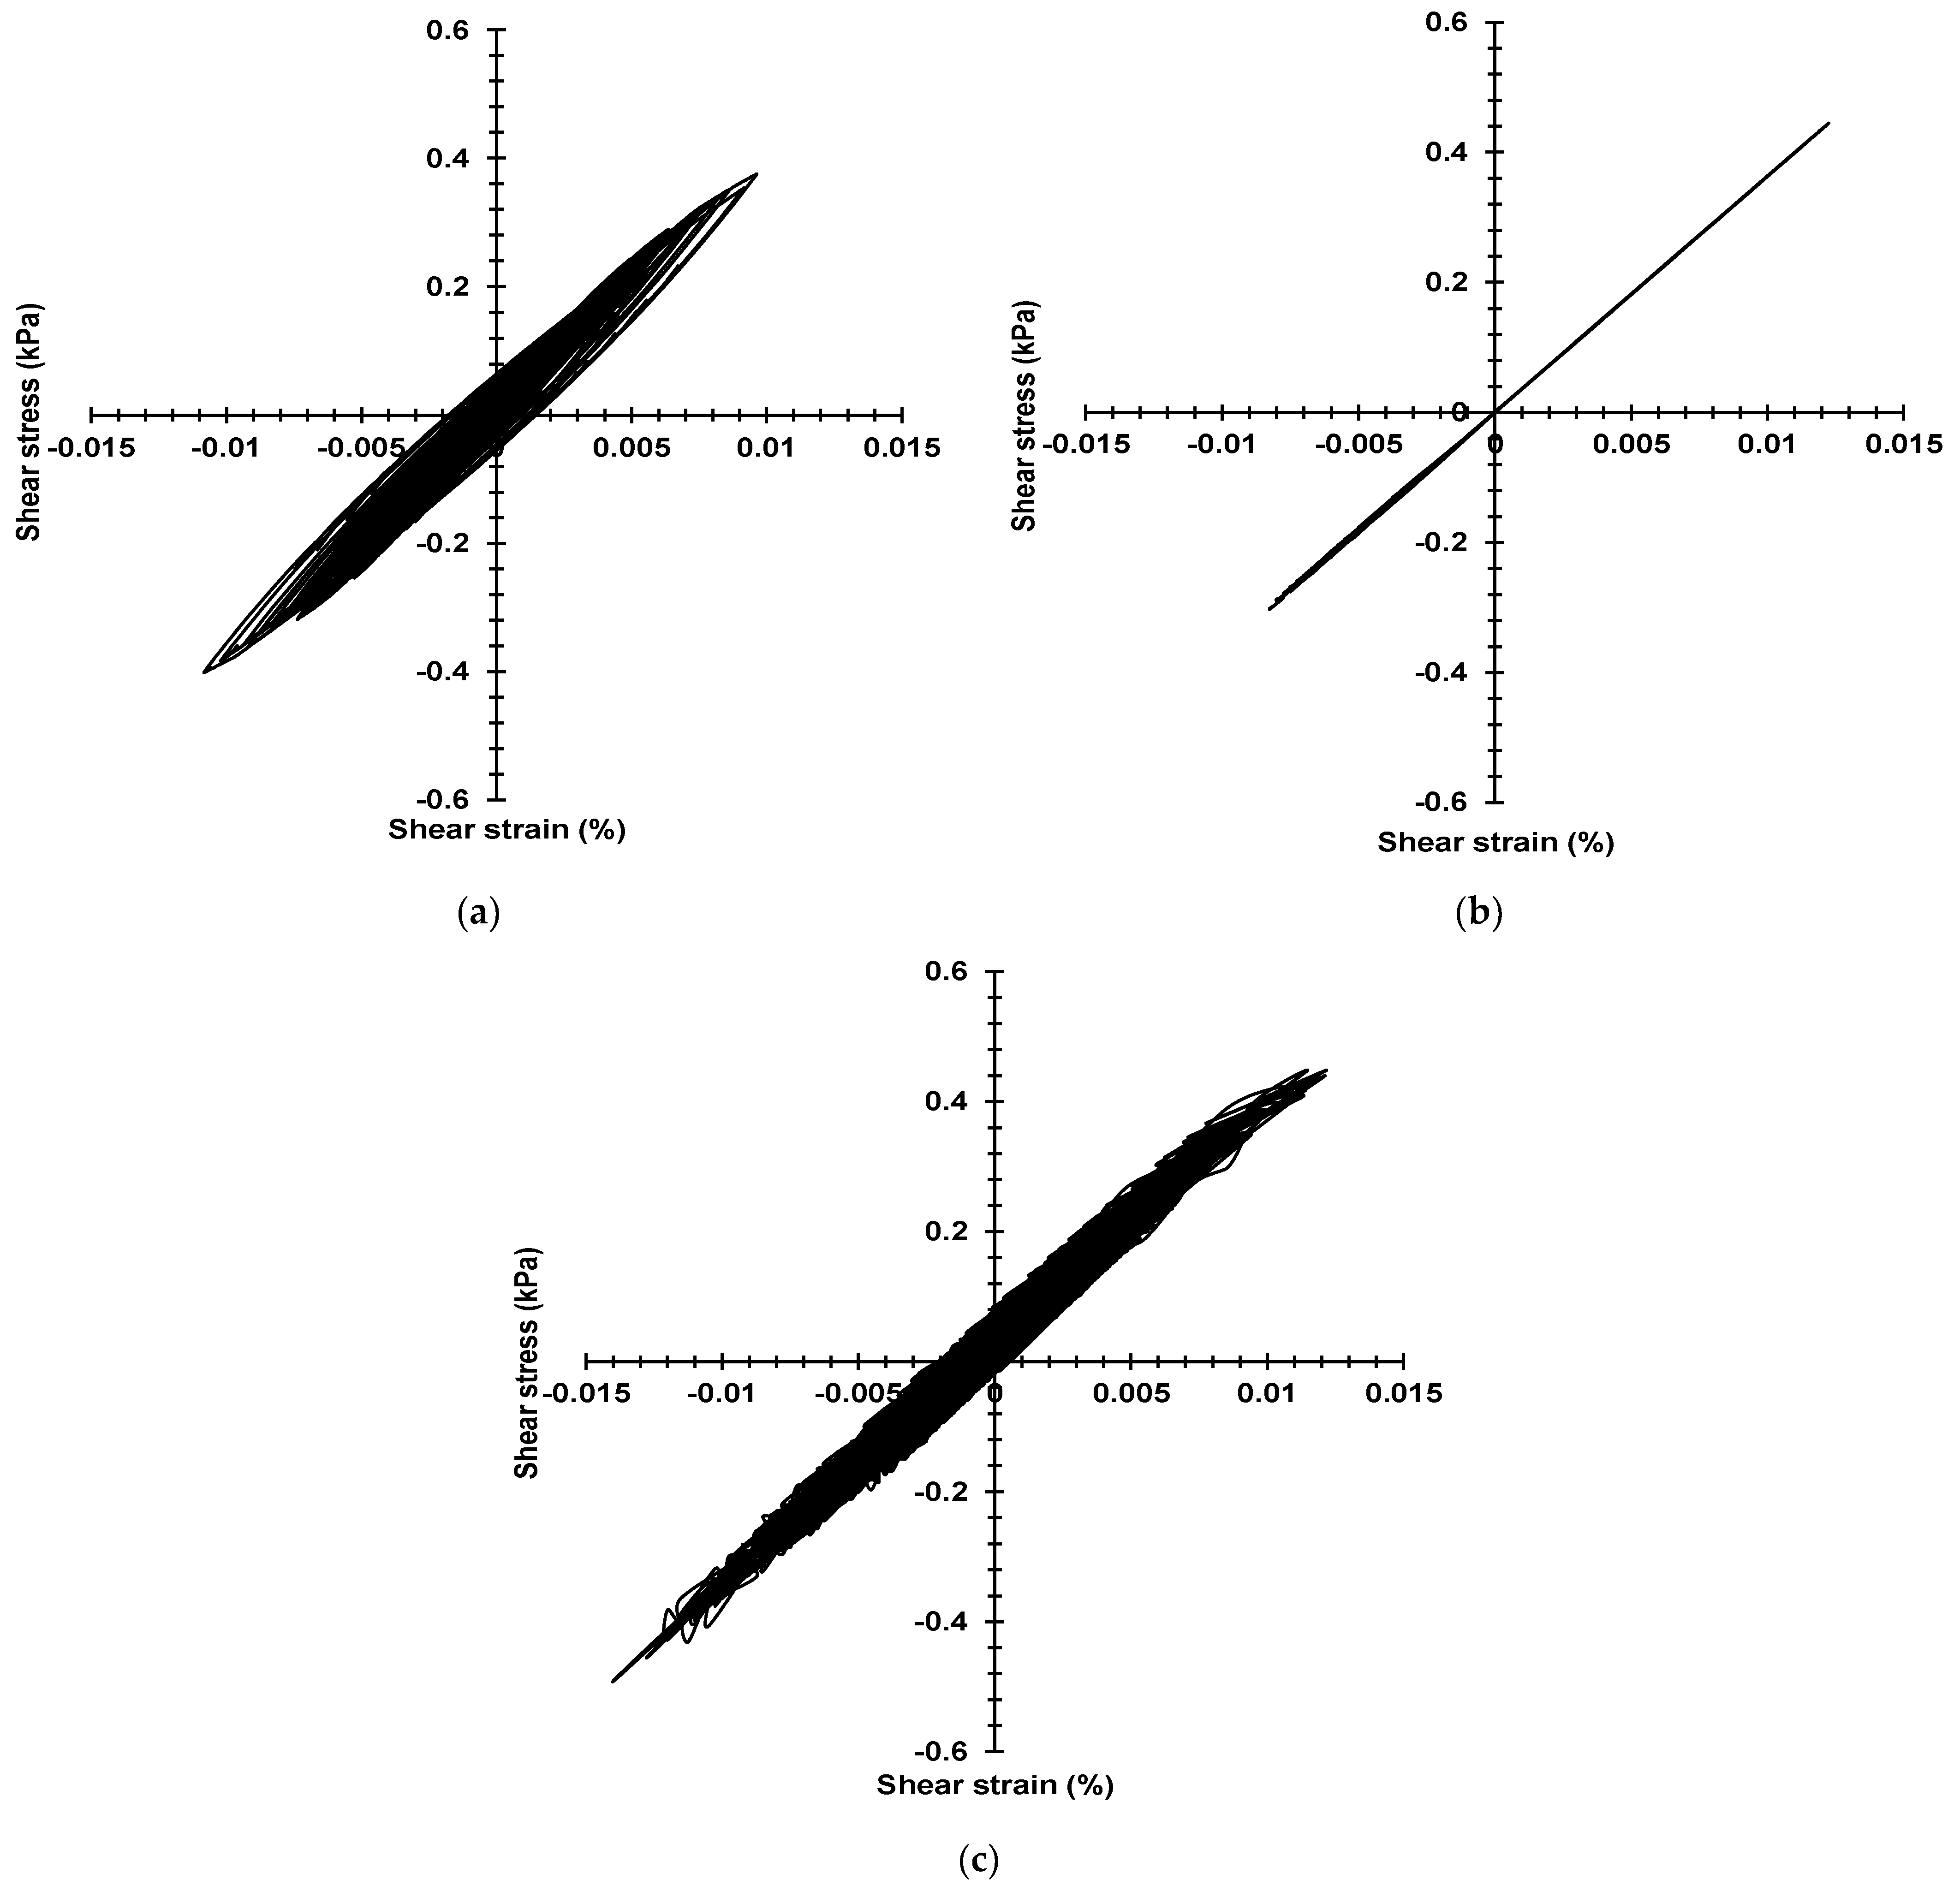
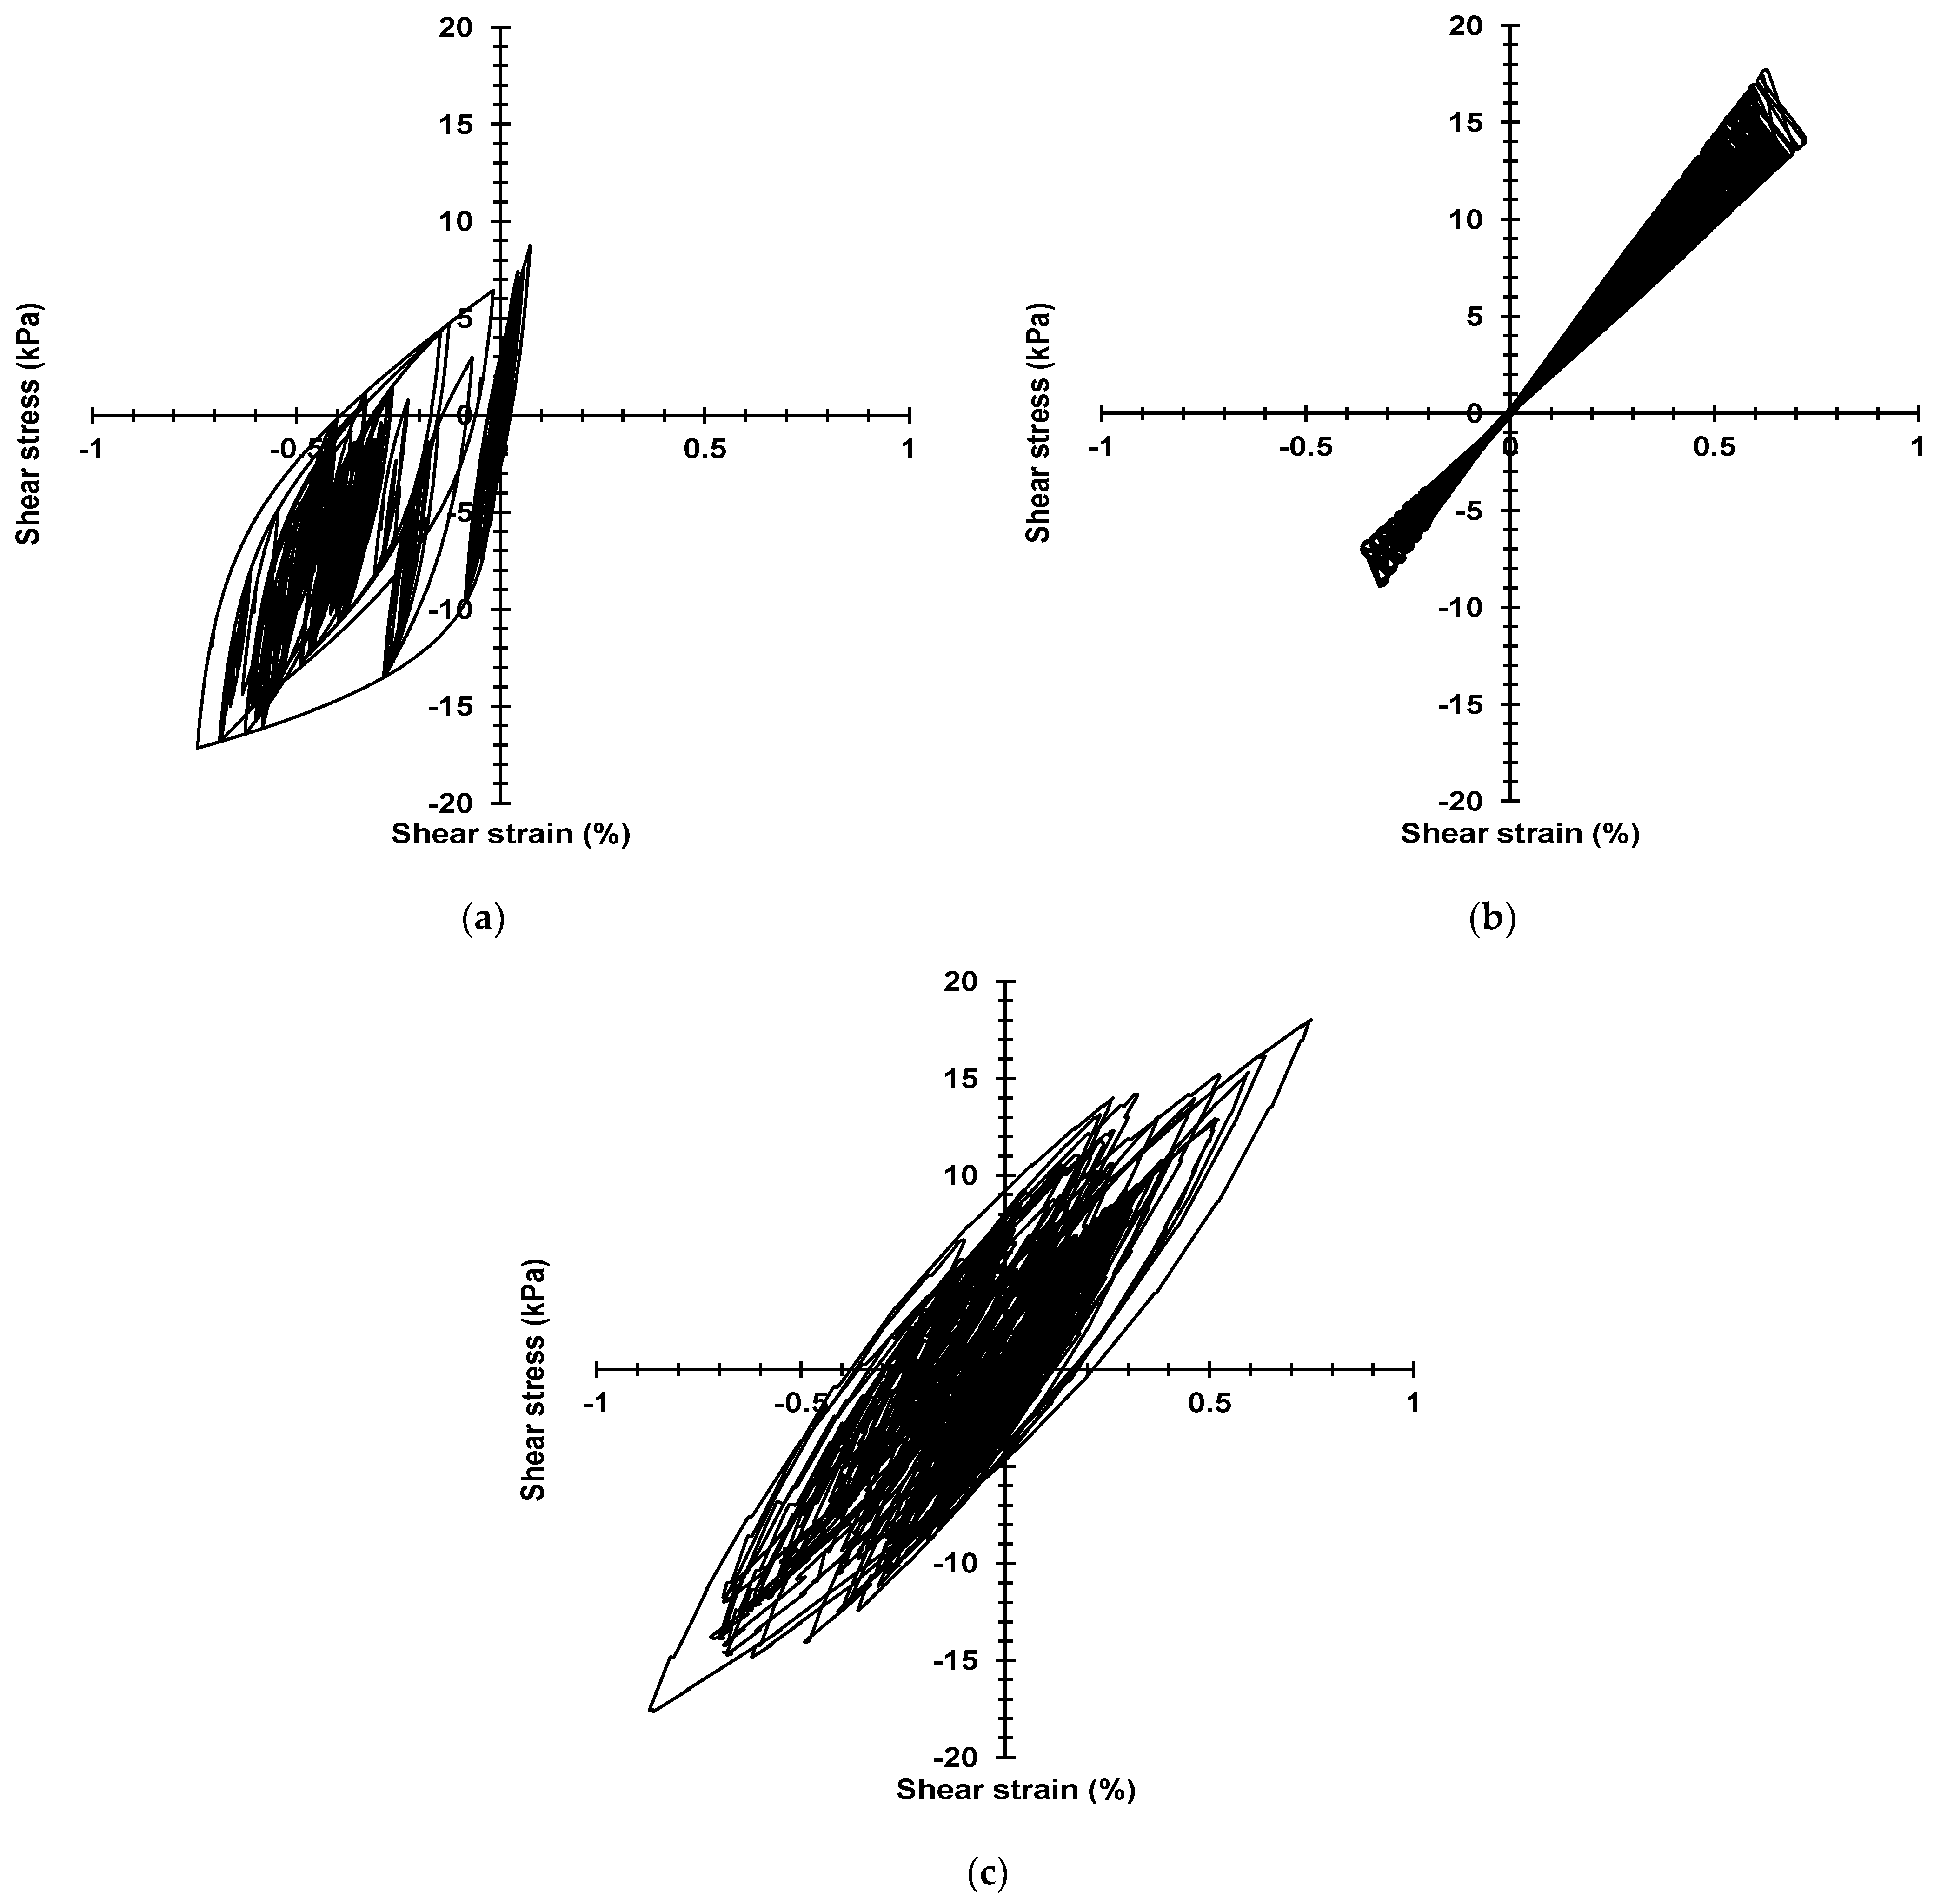
3.4. The Stress–Strain Curve of Large-Scale Models
In this study, the surface layers of the model will be selected to obtain the shear stress–strain value from the numerical analysis.
Figure 14 and
Figure 15 show the stress–strain curve of the Mohr–Coulomb model, Darendeli model, and Borja model of the 1-time and 50-times model, respectively.
In the one-time model, when the strain is less than 0.03%, the stress–strain curve of the Mohr–Coulomb model is linear, which indicates that the model has only elastic ranges. The Darendeli model and Borja model can also capture stress and strain well. Numerically, the stress and strain of the Darendeli model were smaller than the other two, which was based on the difference in the parameters of the constitutive model.
Moreover, the hysteretic curves of the Darendeli model and the Borja model also appear to be unable to follow the Masing criterion because as the strain increases, the damping of the model increases rapidly, and energy is absorbed and attenuated. In the 50-times model, when the strain is more significant than 0.7%, the Darendeli model cannot capture the shear strain well, which can be considered as the Darendeli model reaching the limit of obtaining strain in this study. However, the Mohr–Coulomb model and Borja model can obtain shear strain. It is essential to understand the dynamic behavior of the ground.


