Reinforcement of Different Sands by Low-pH Bio-Mineralization


Abstract
:1. Introduction
2. Materials and Methods
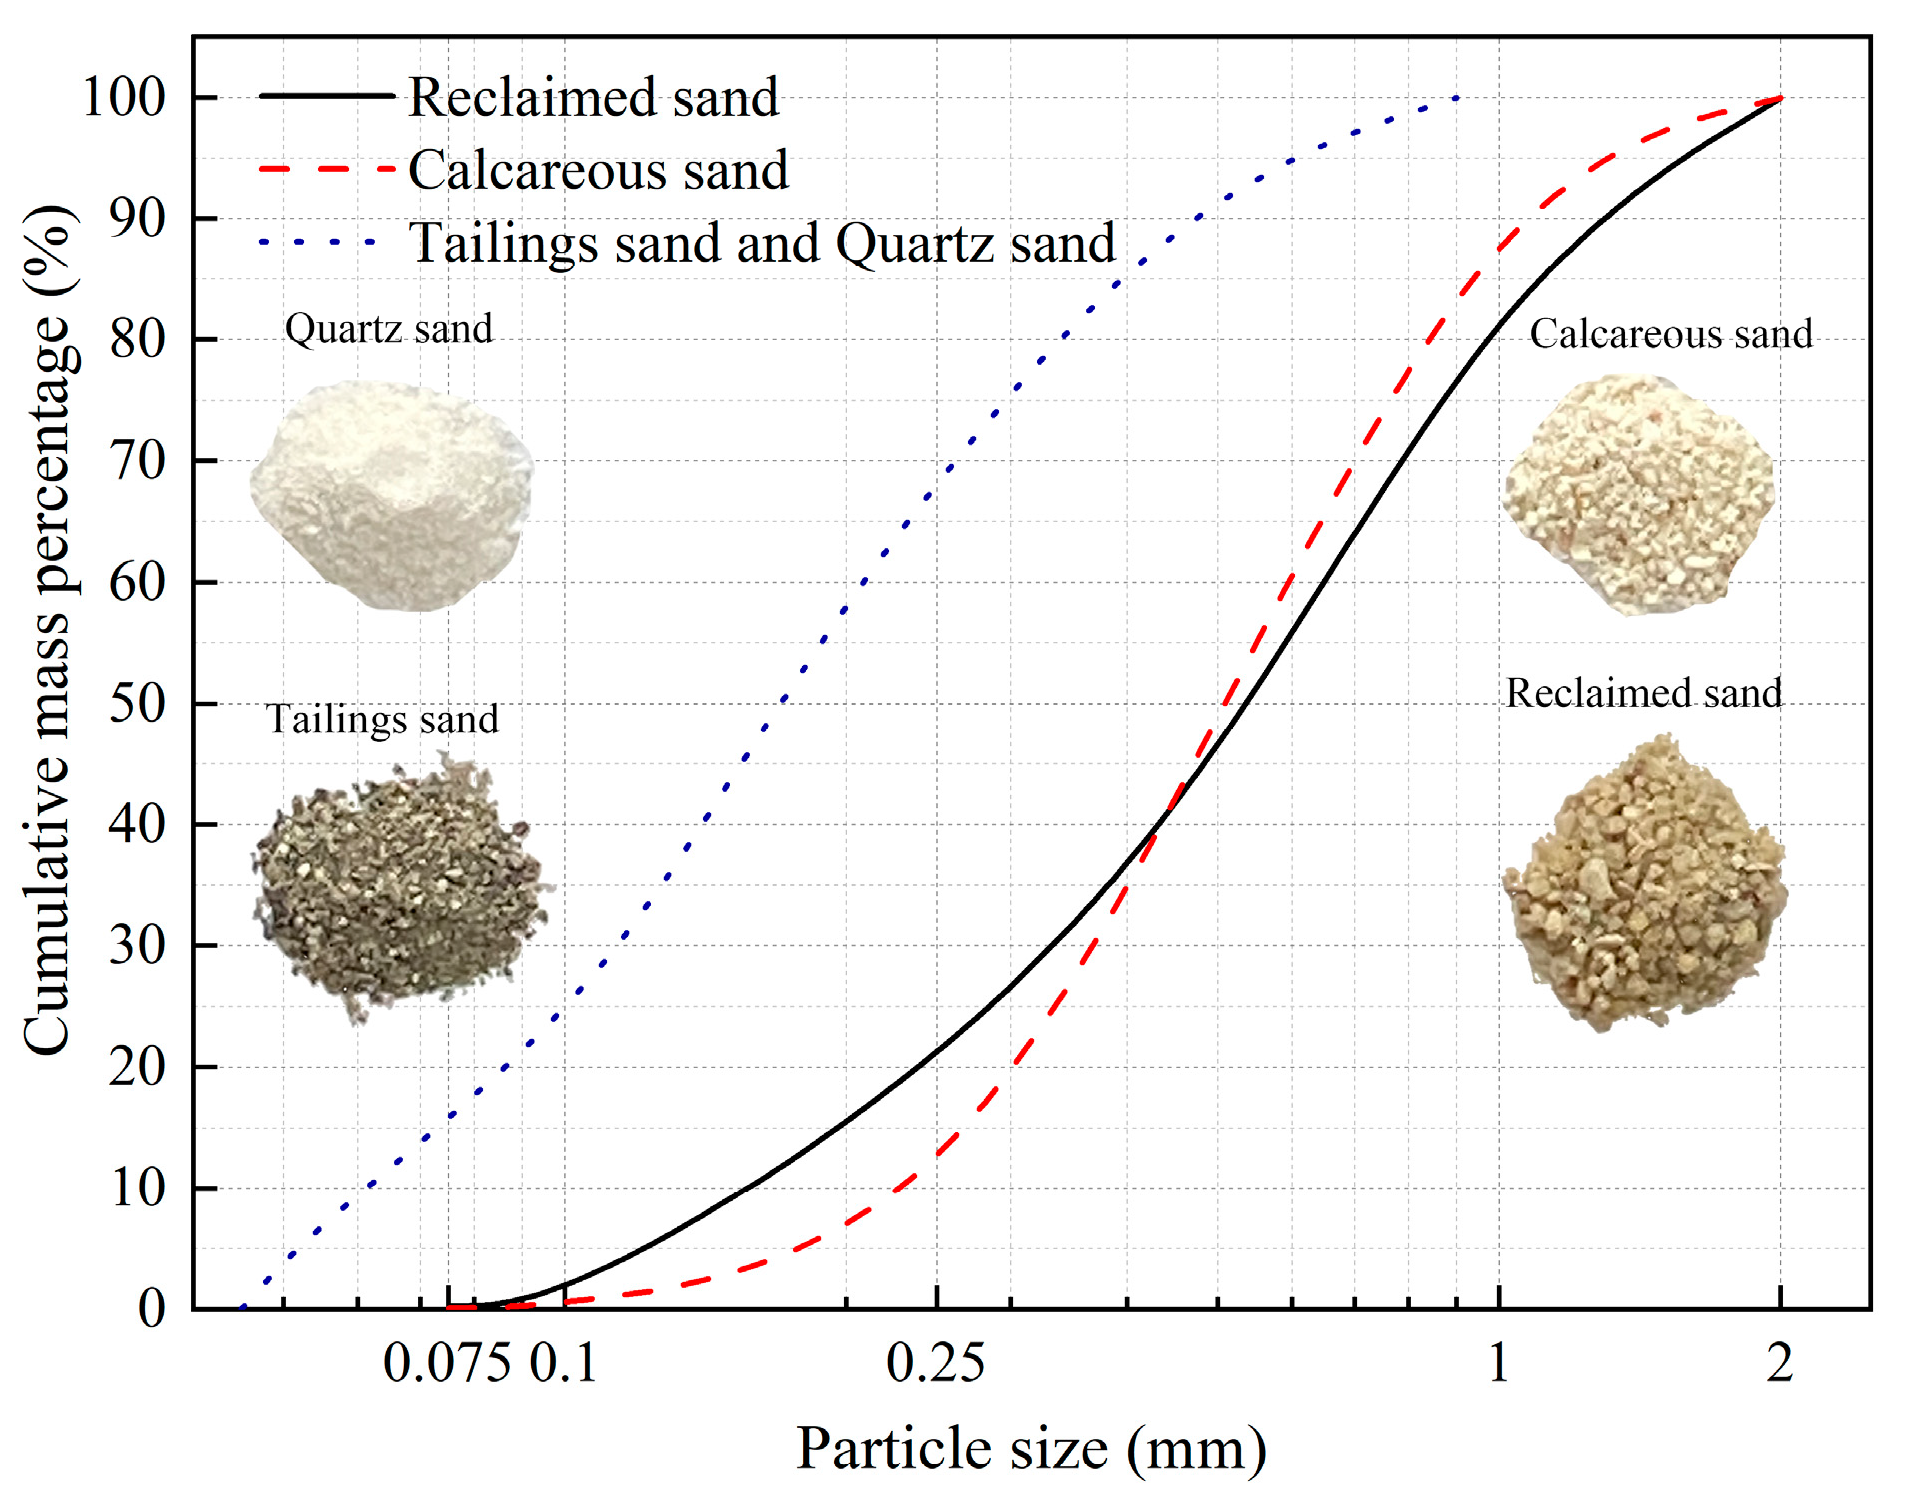
2.1. Test Sands
2.2. Bacterial Solution and Cementation Solution
2.3. Molds and Methods
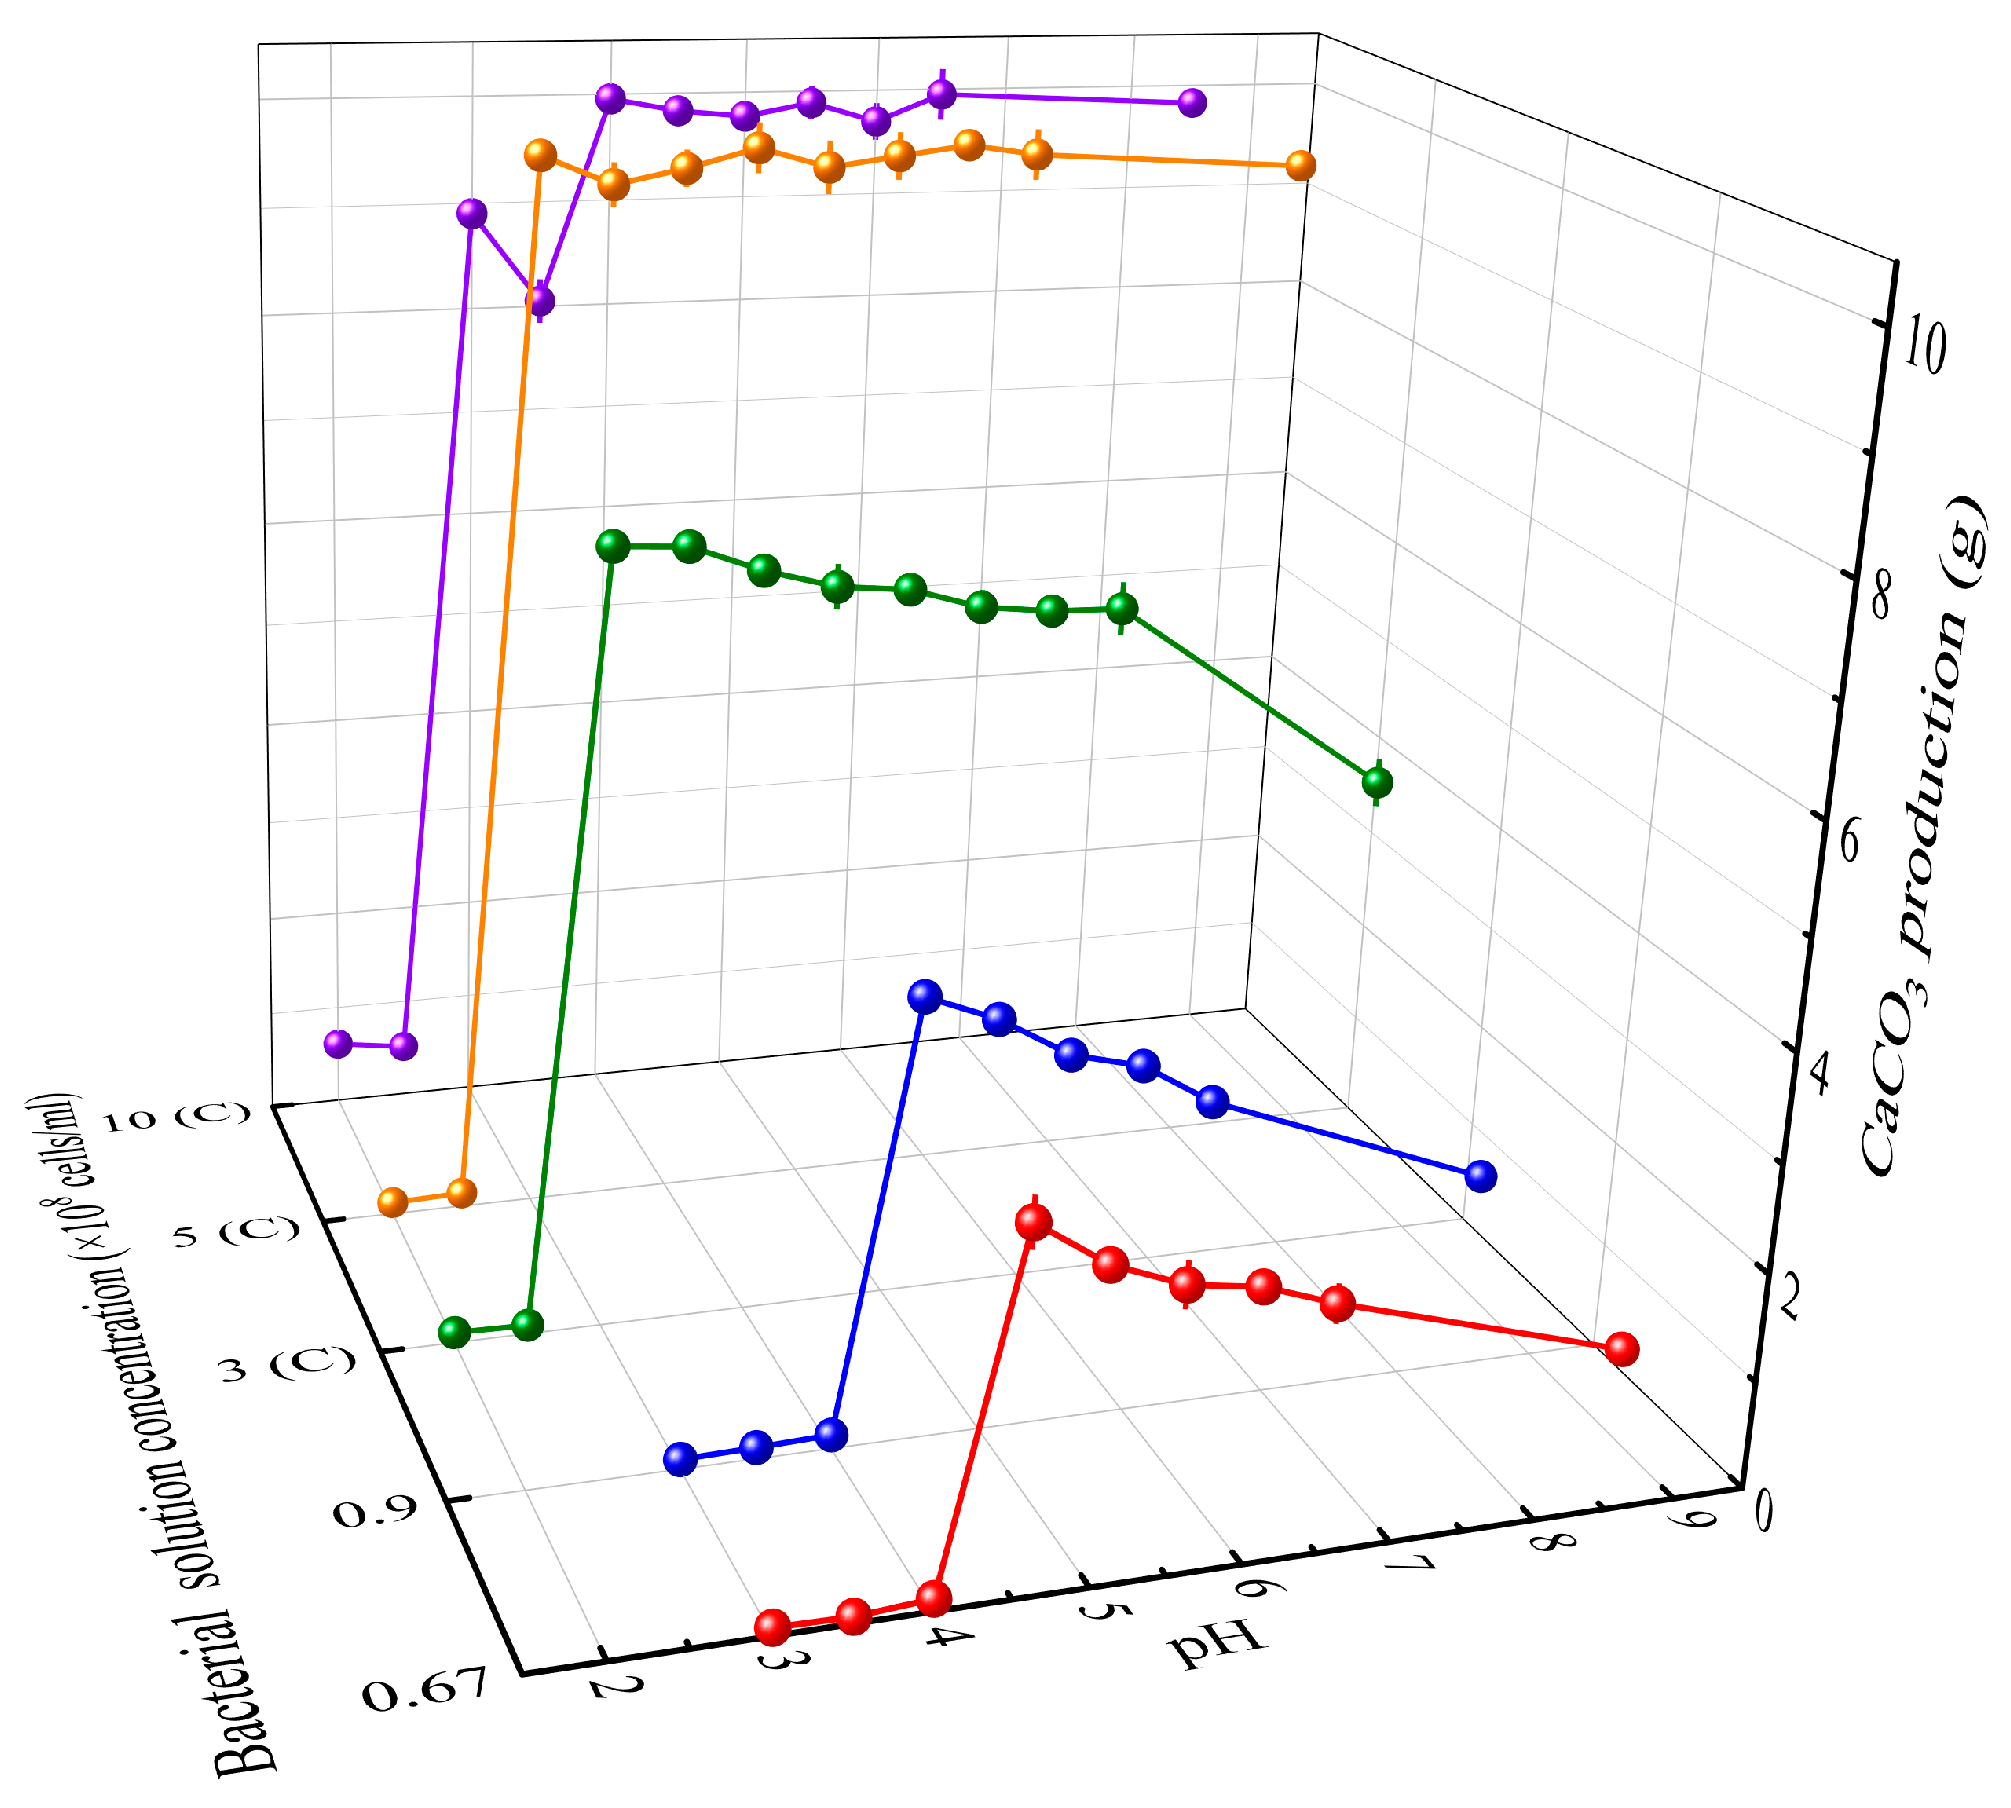
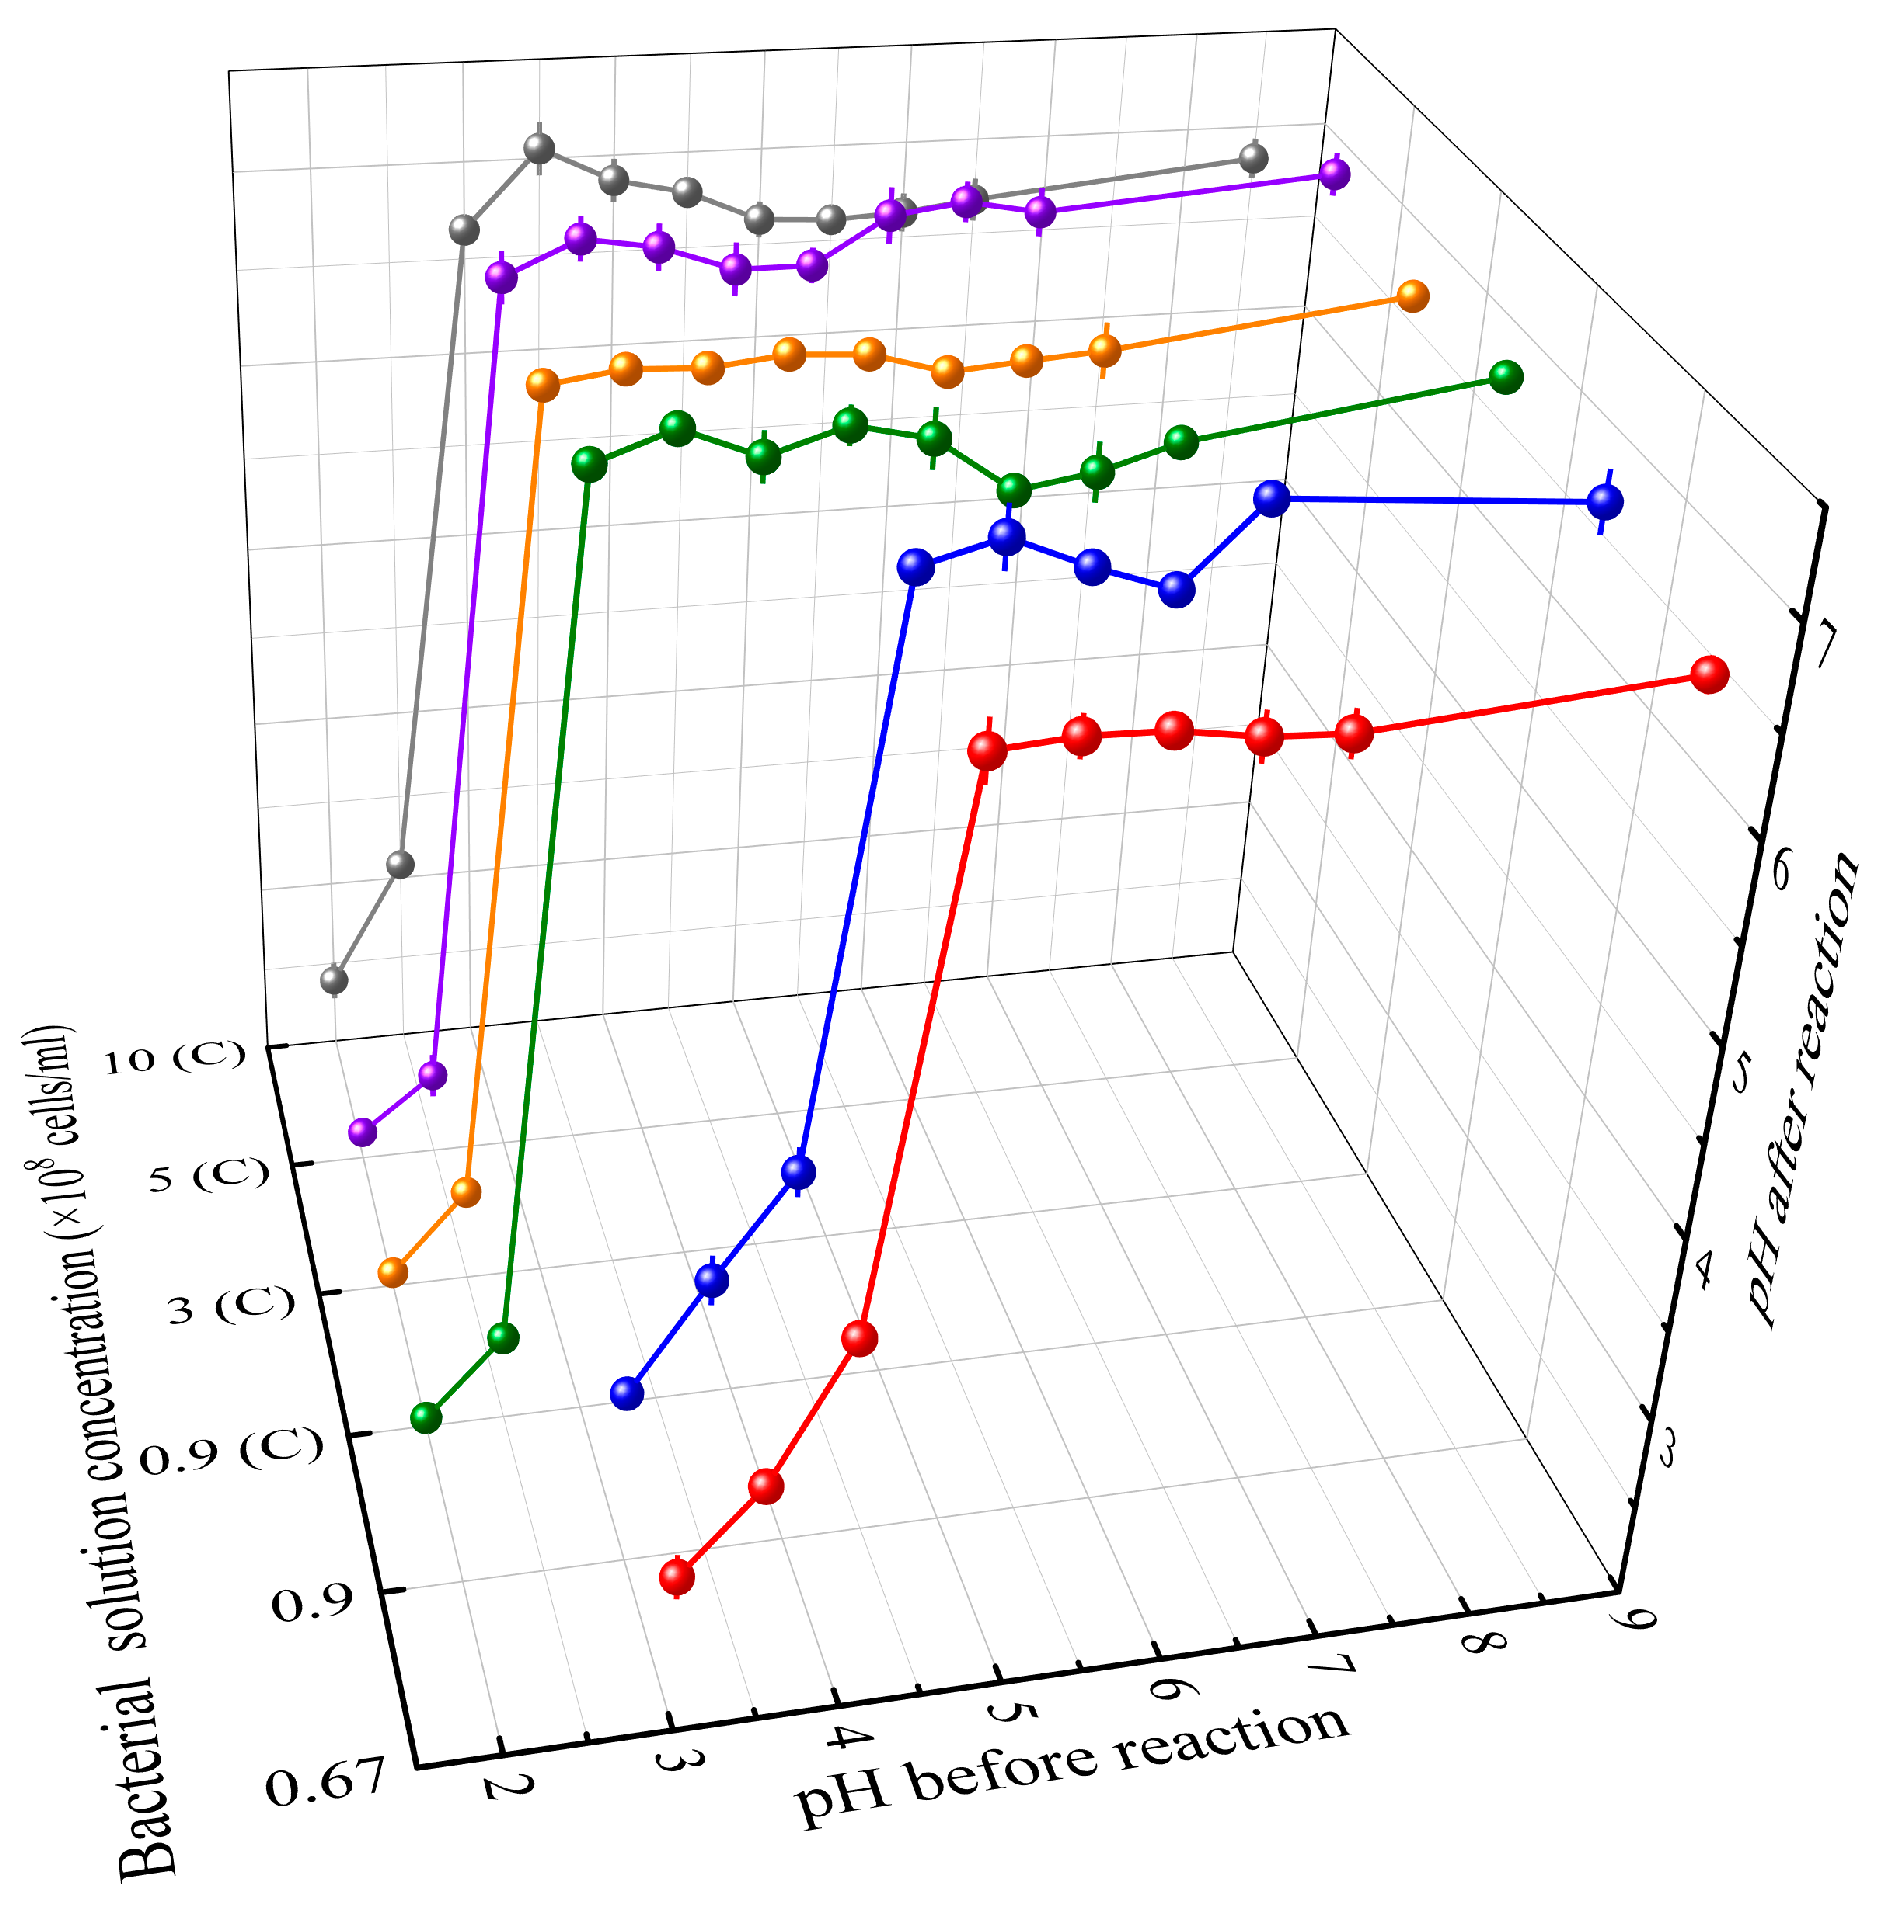
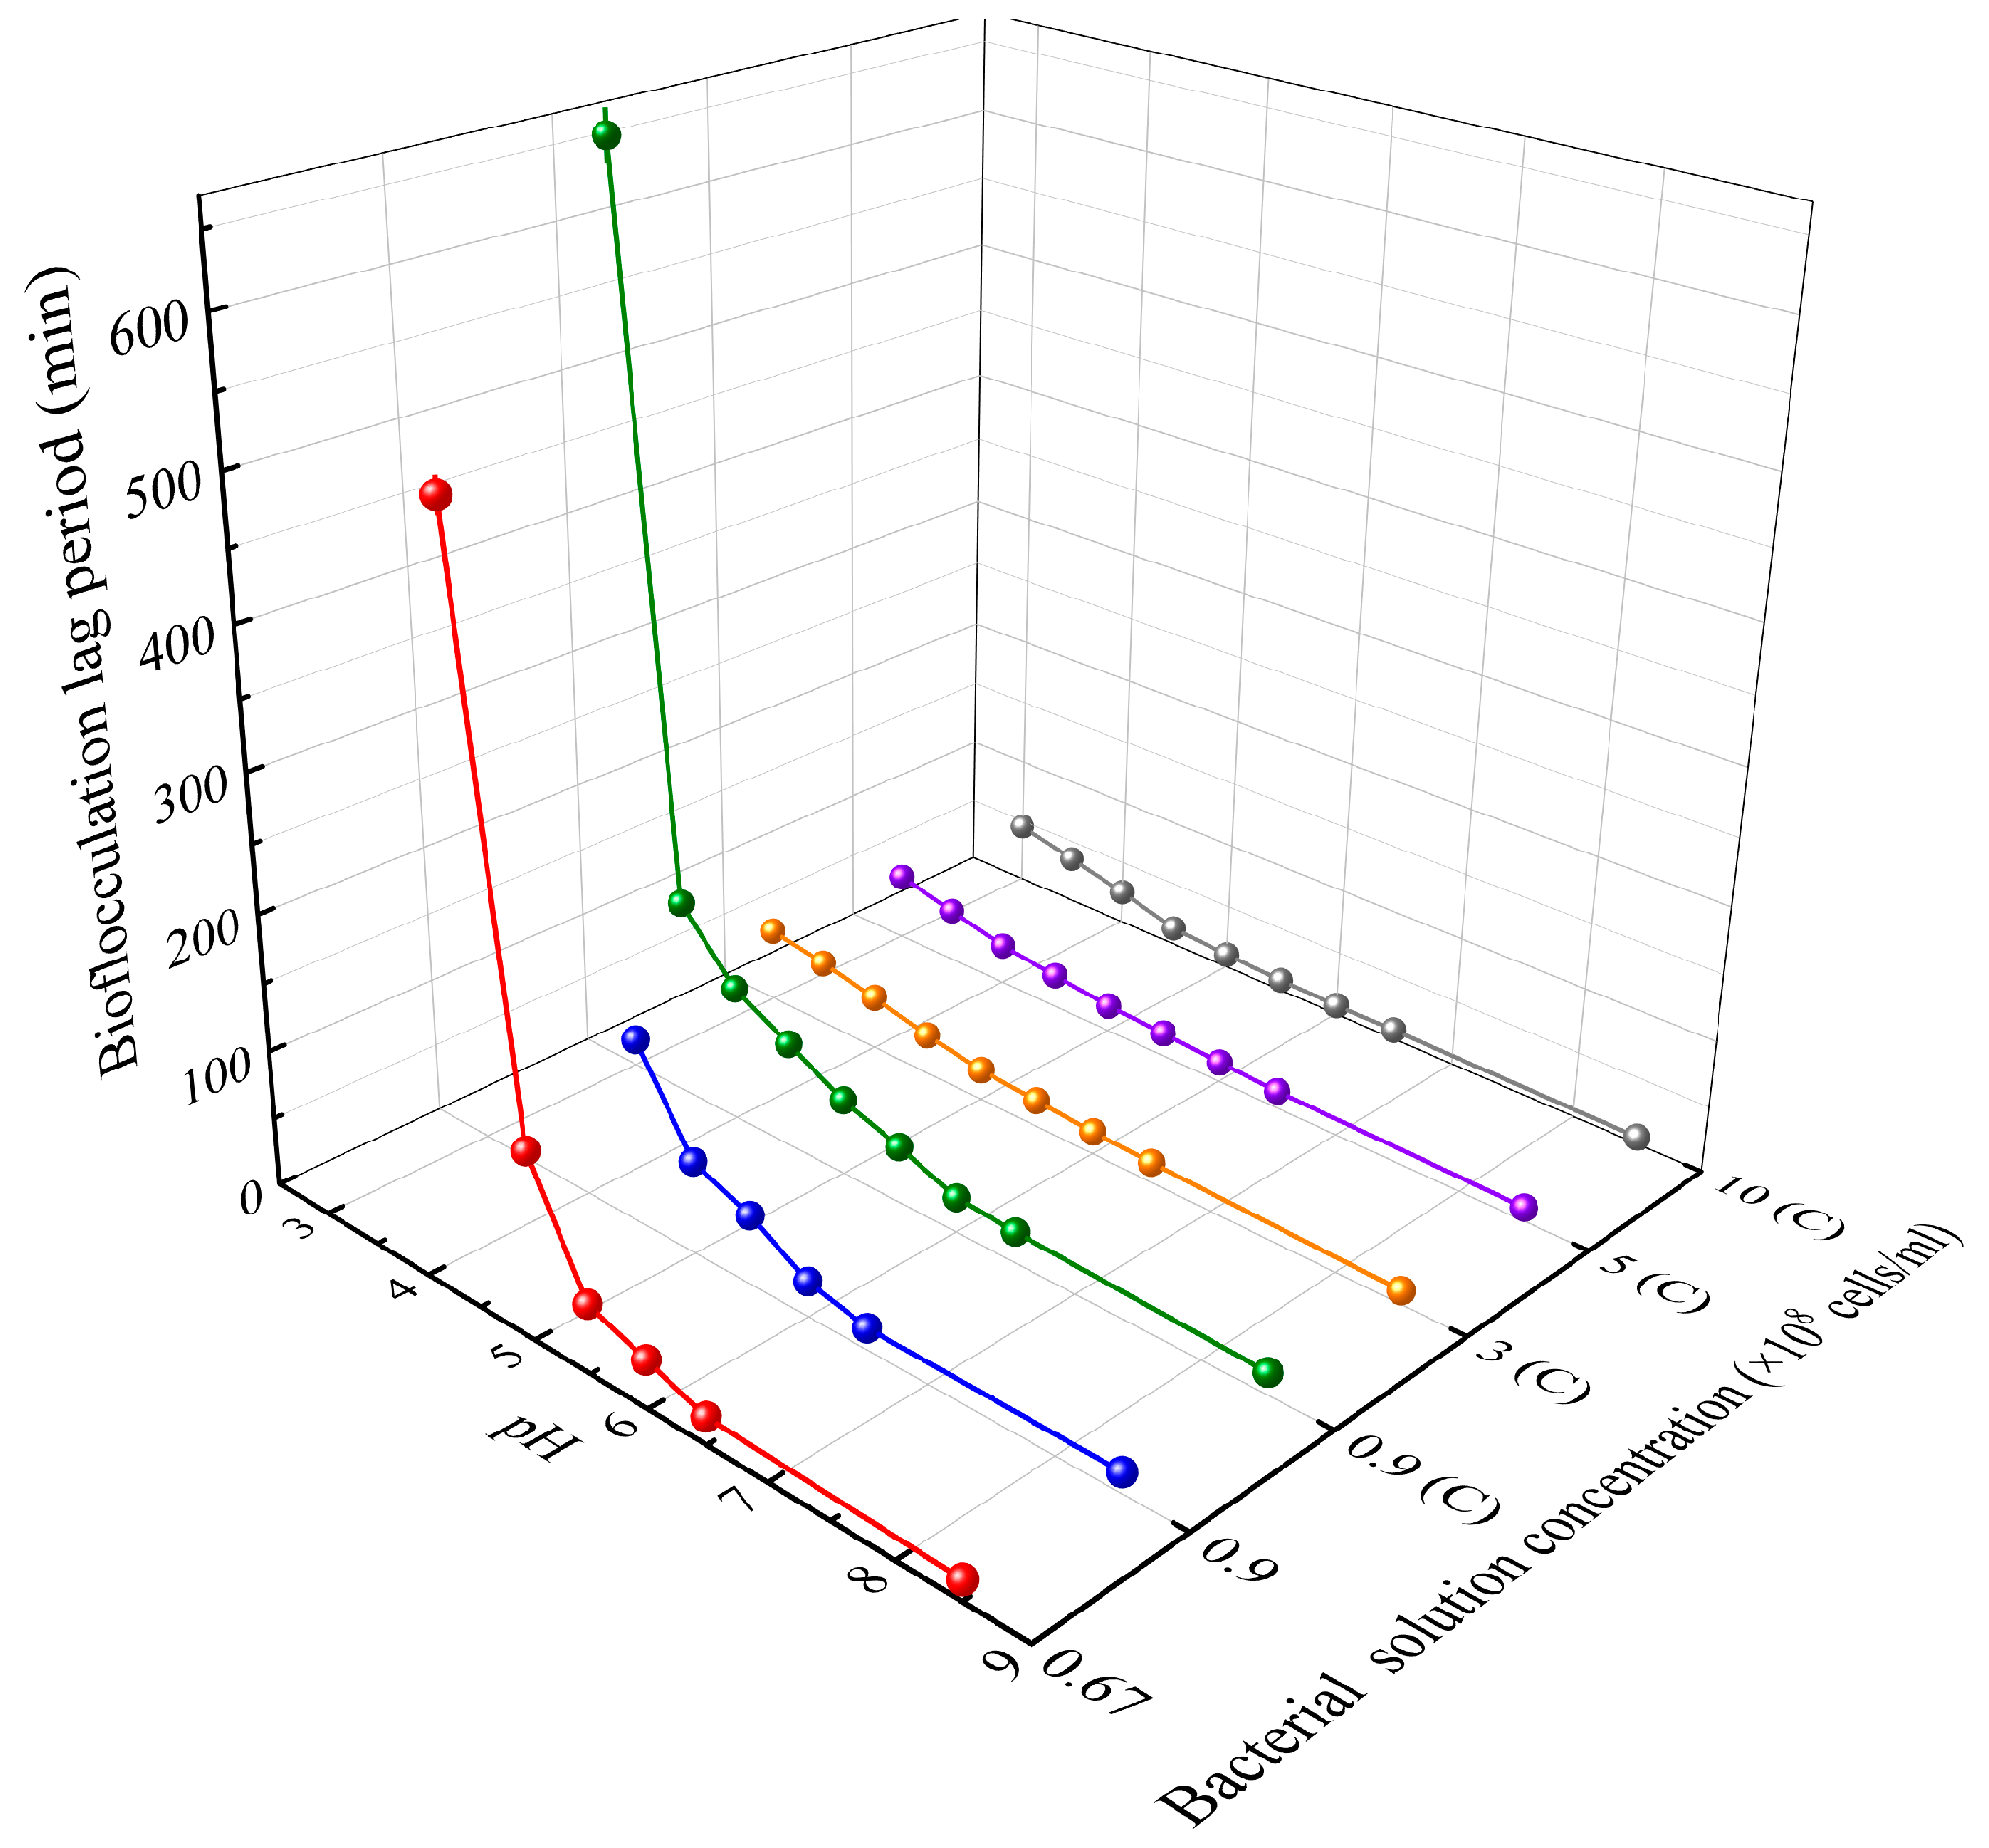
2.3.1. Determination of the Optimal Theoretical pH Values
2.3.2. Permeability Test
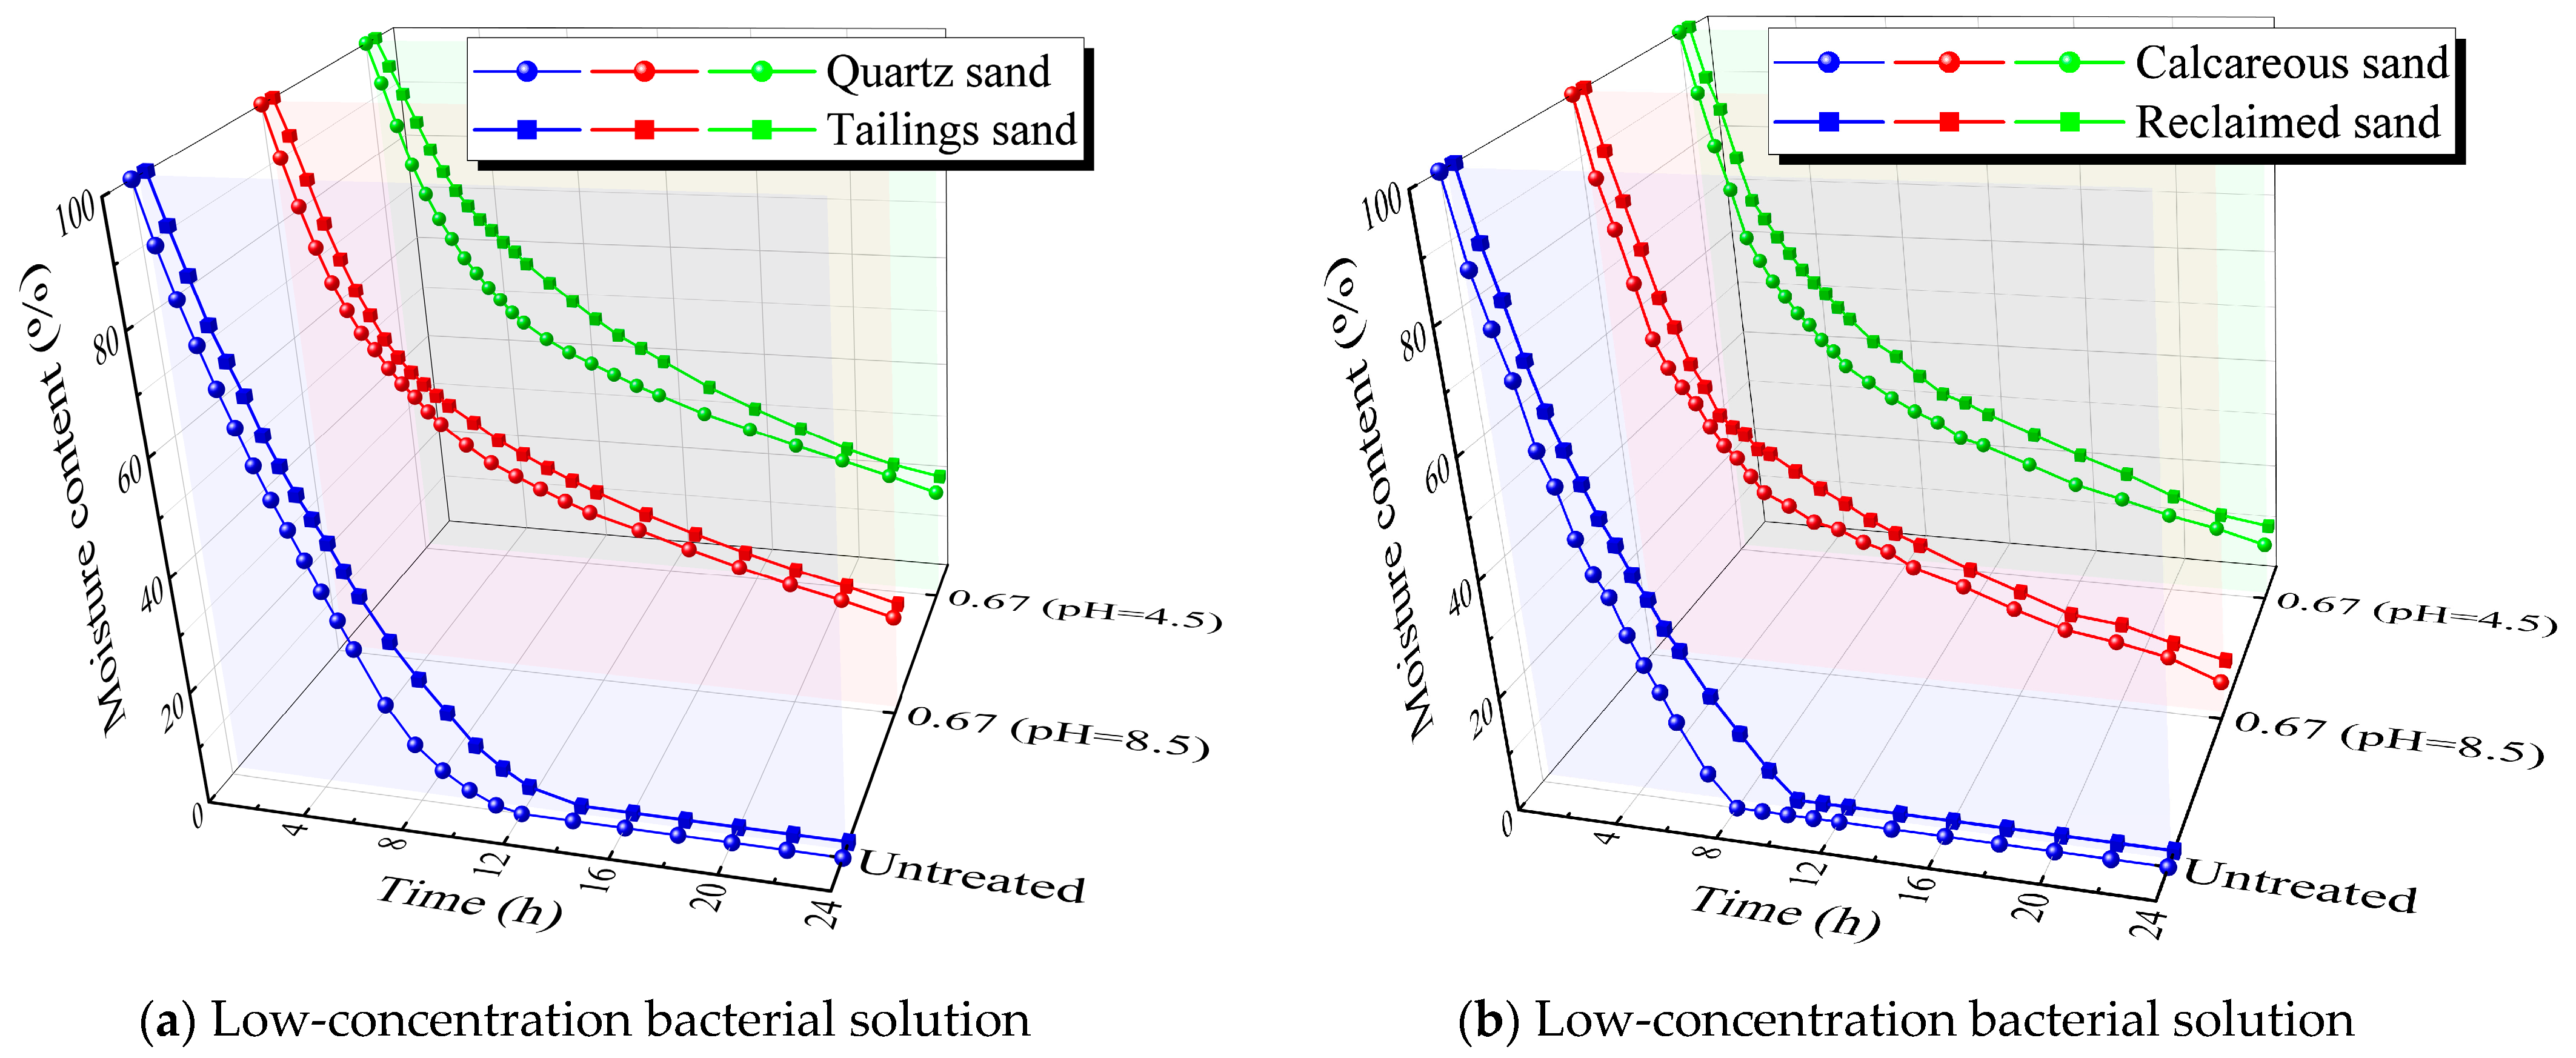
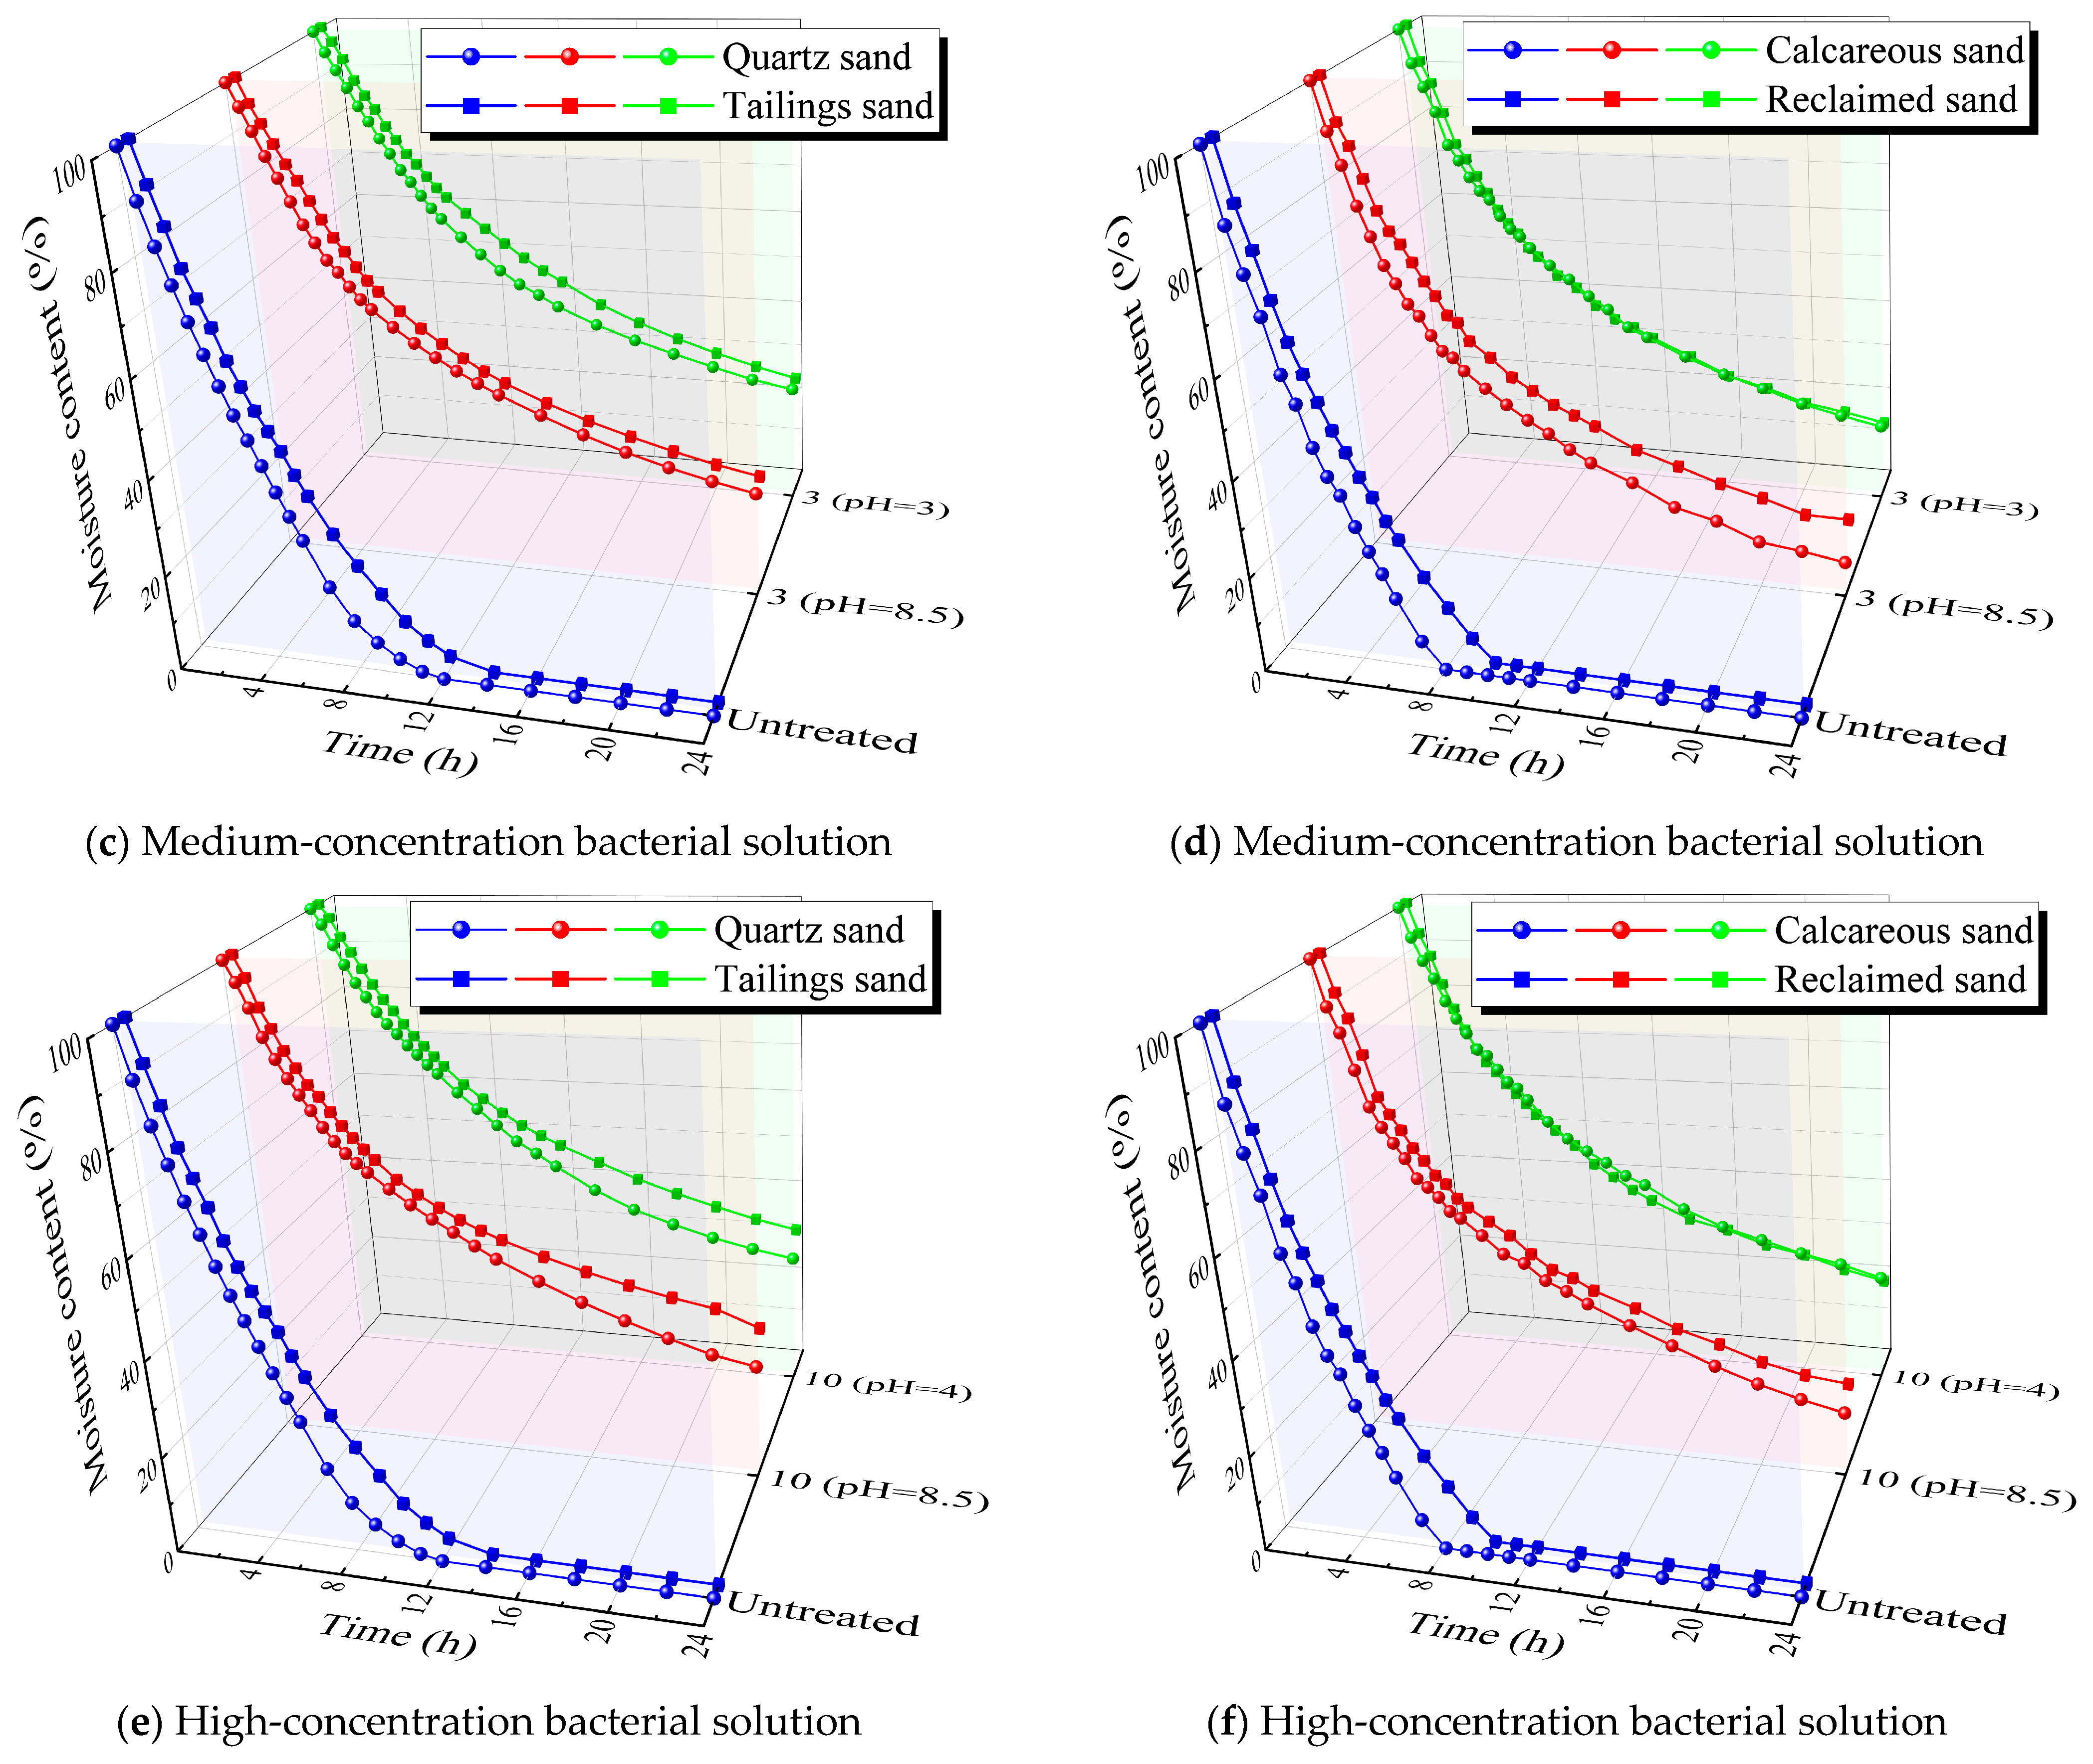
2.3.3. Moisture Retention Test
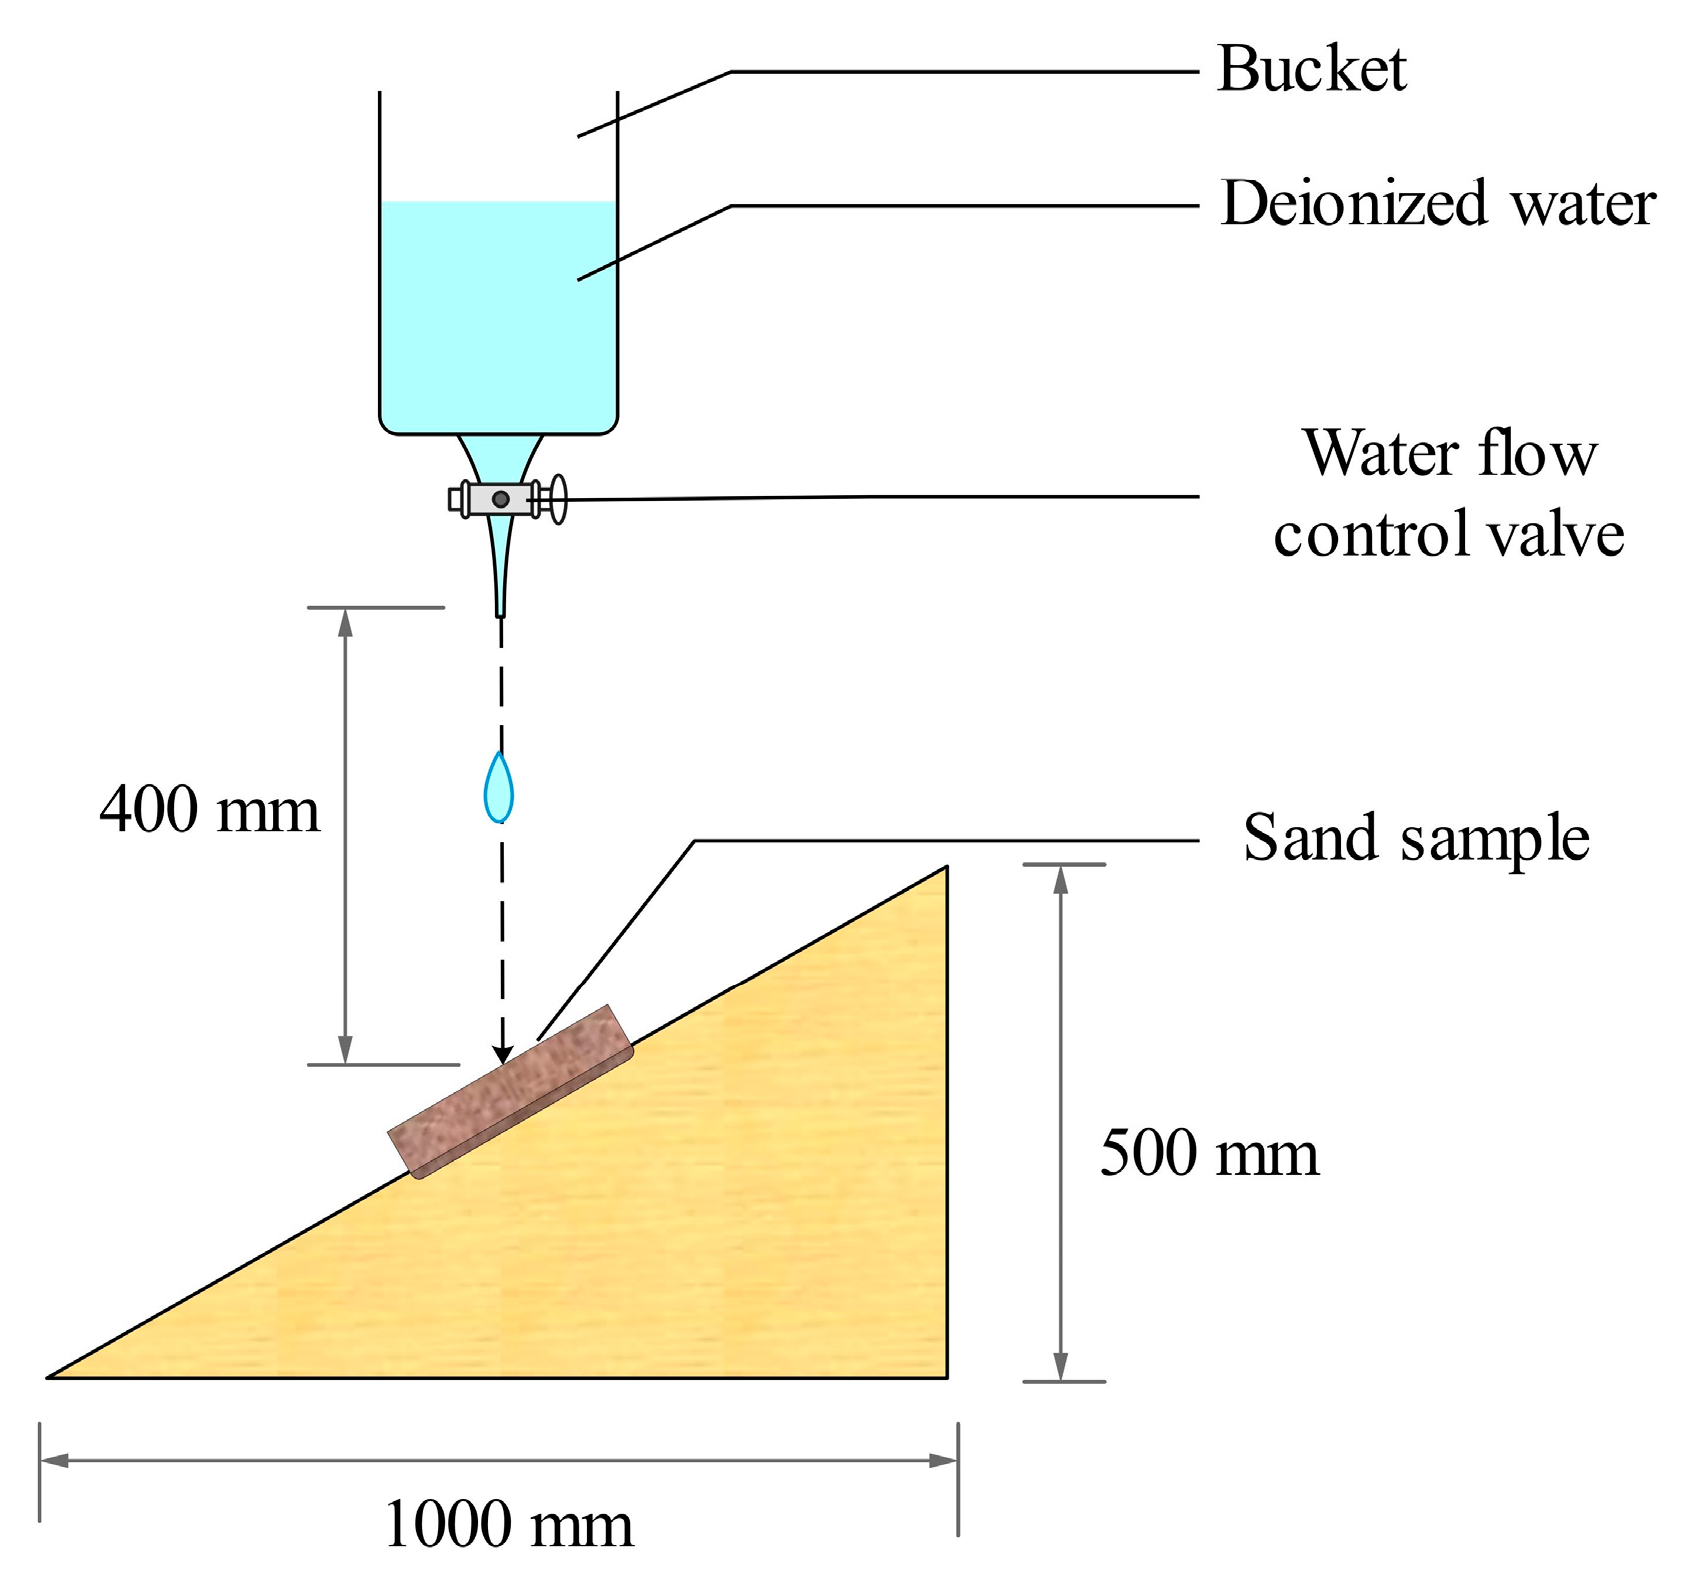
2.3.4. Raindrop Erosion Test
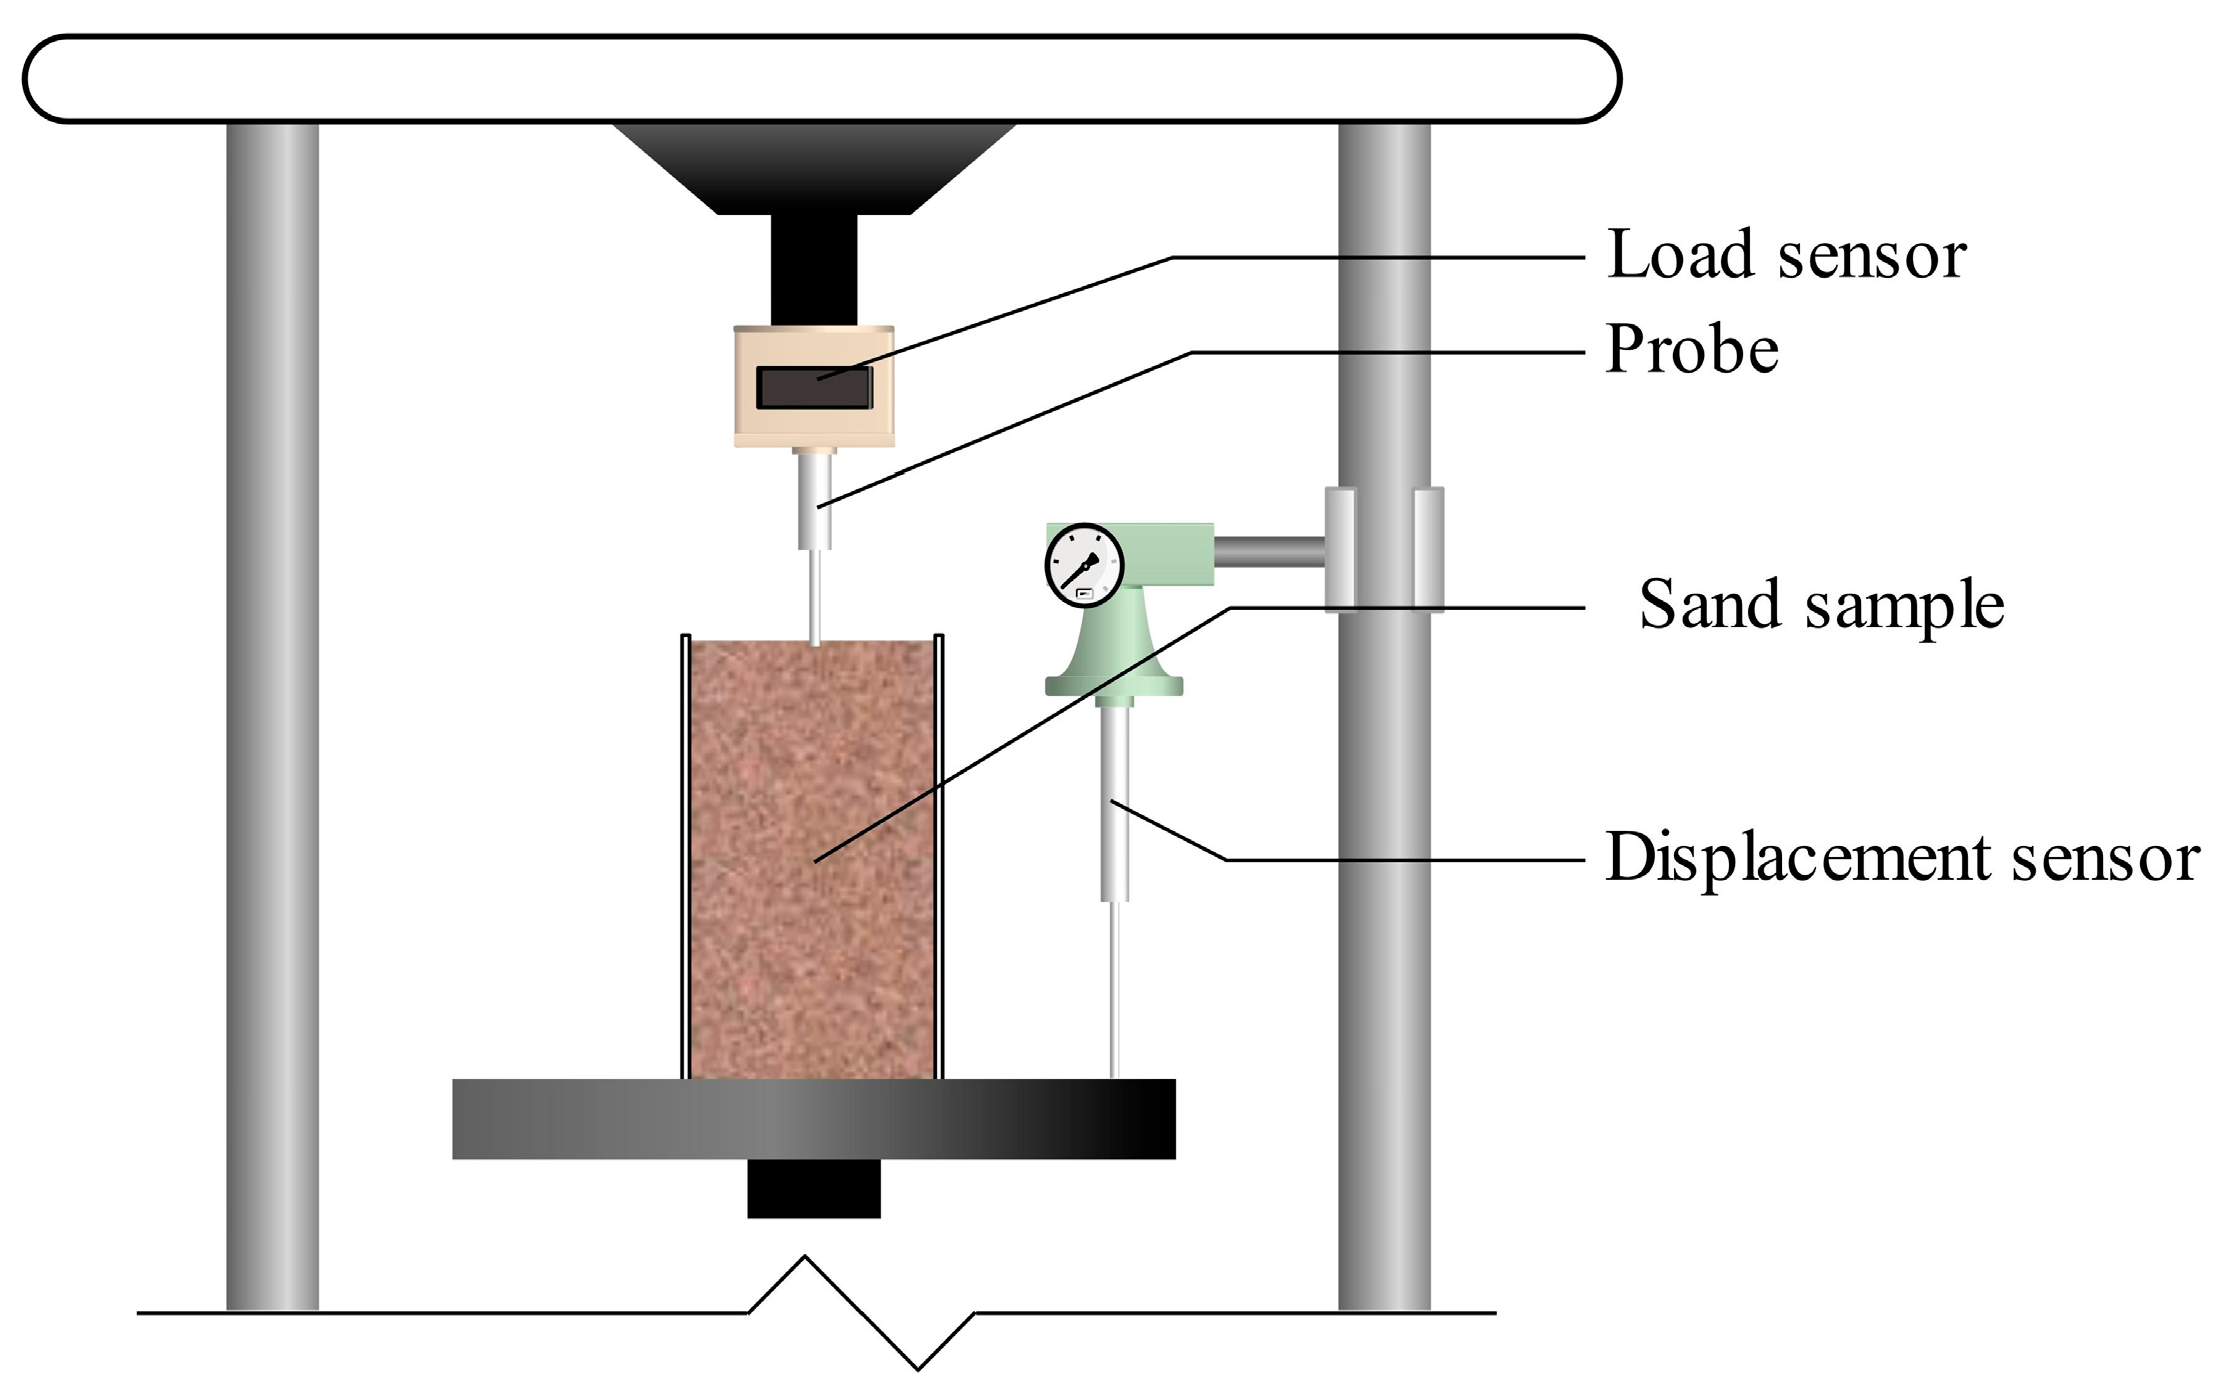
2.3.5. Penetration Resistance Test
2.3.6. Wind Erosion Test
3. Results
3.1. Determination of the Optimal Theoretical pH Values
3.2. Permeability Test
3.3. Moisture Retention Test
3.4. Raindrop Erosion Test
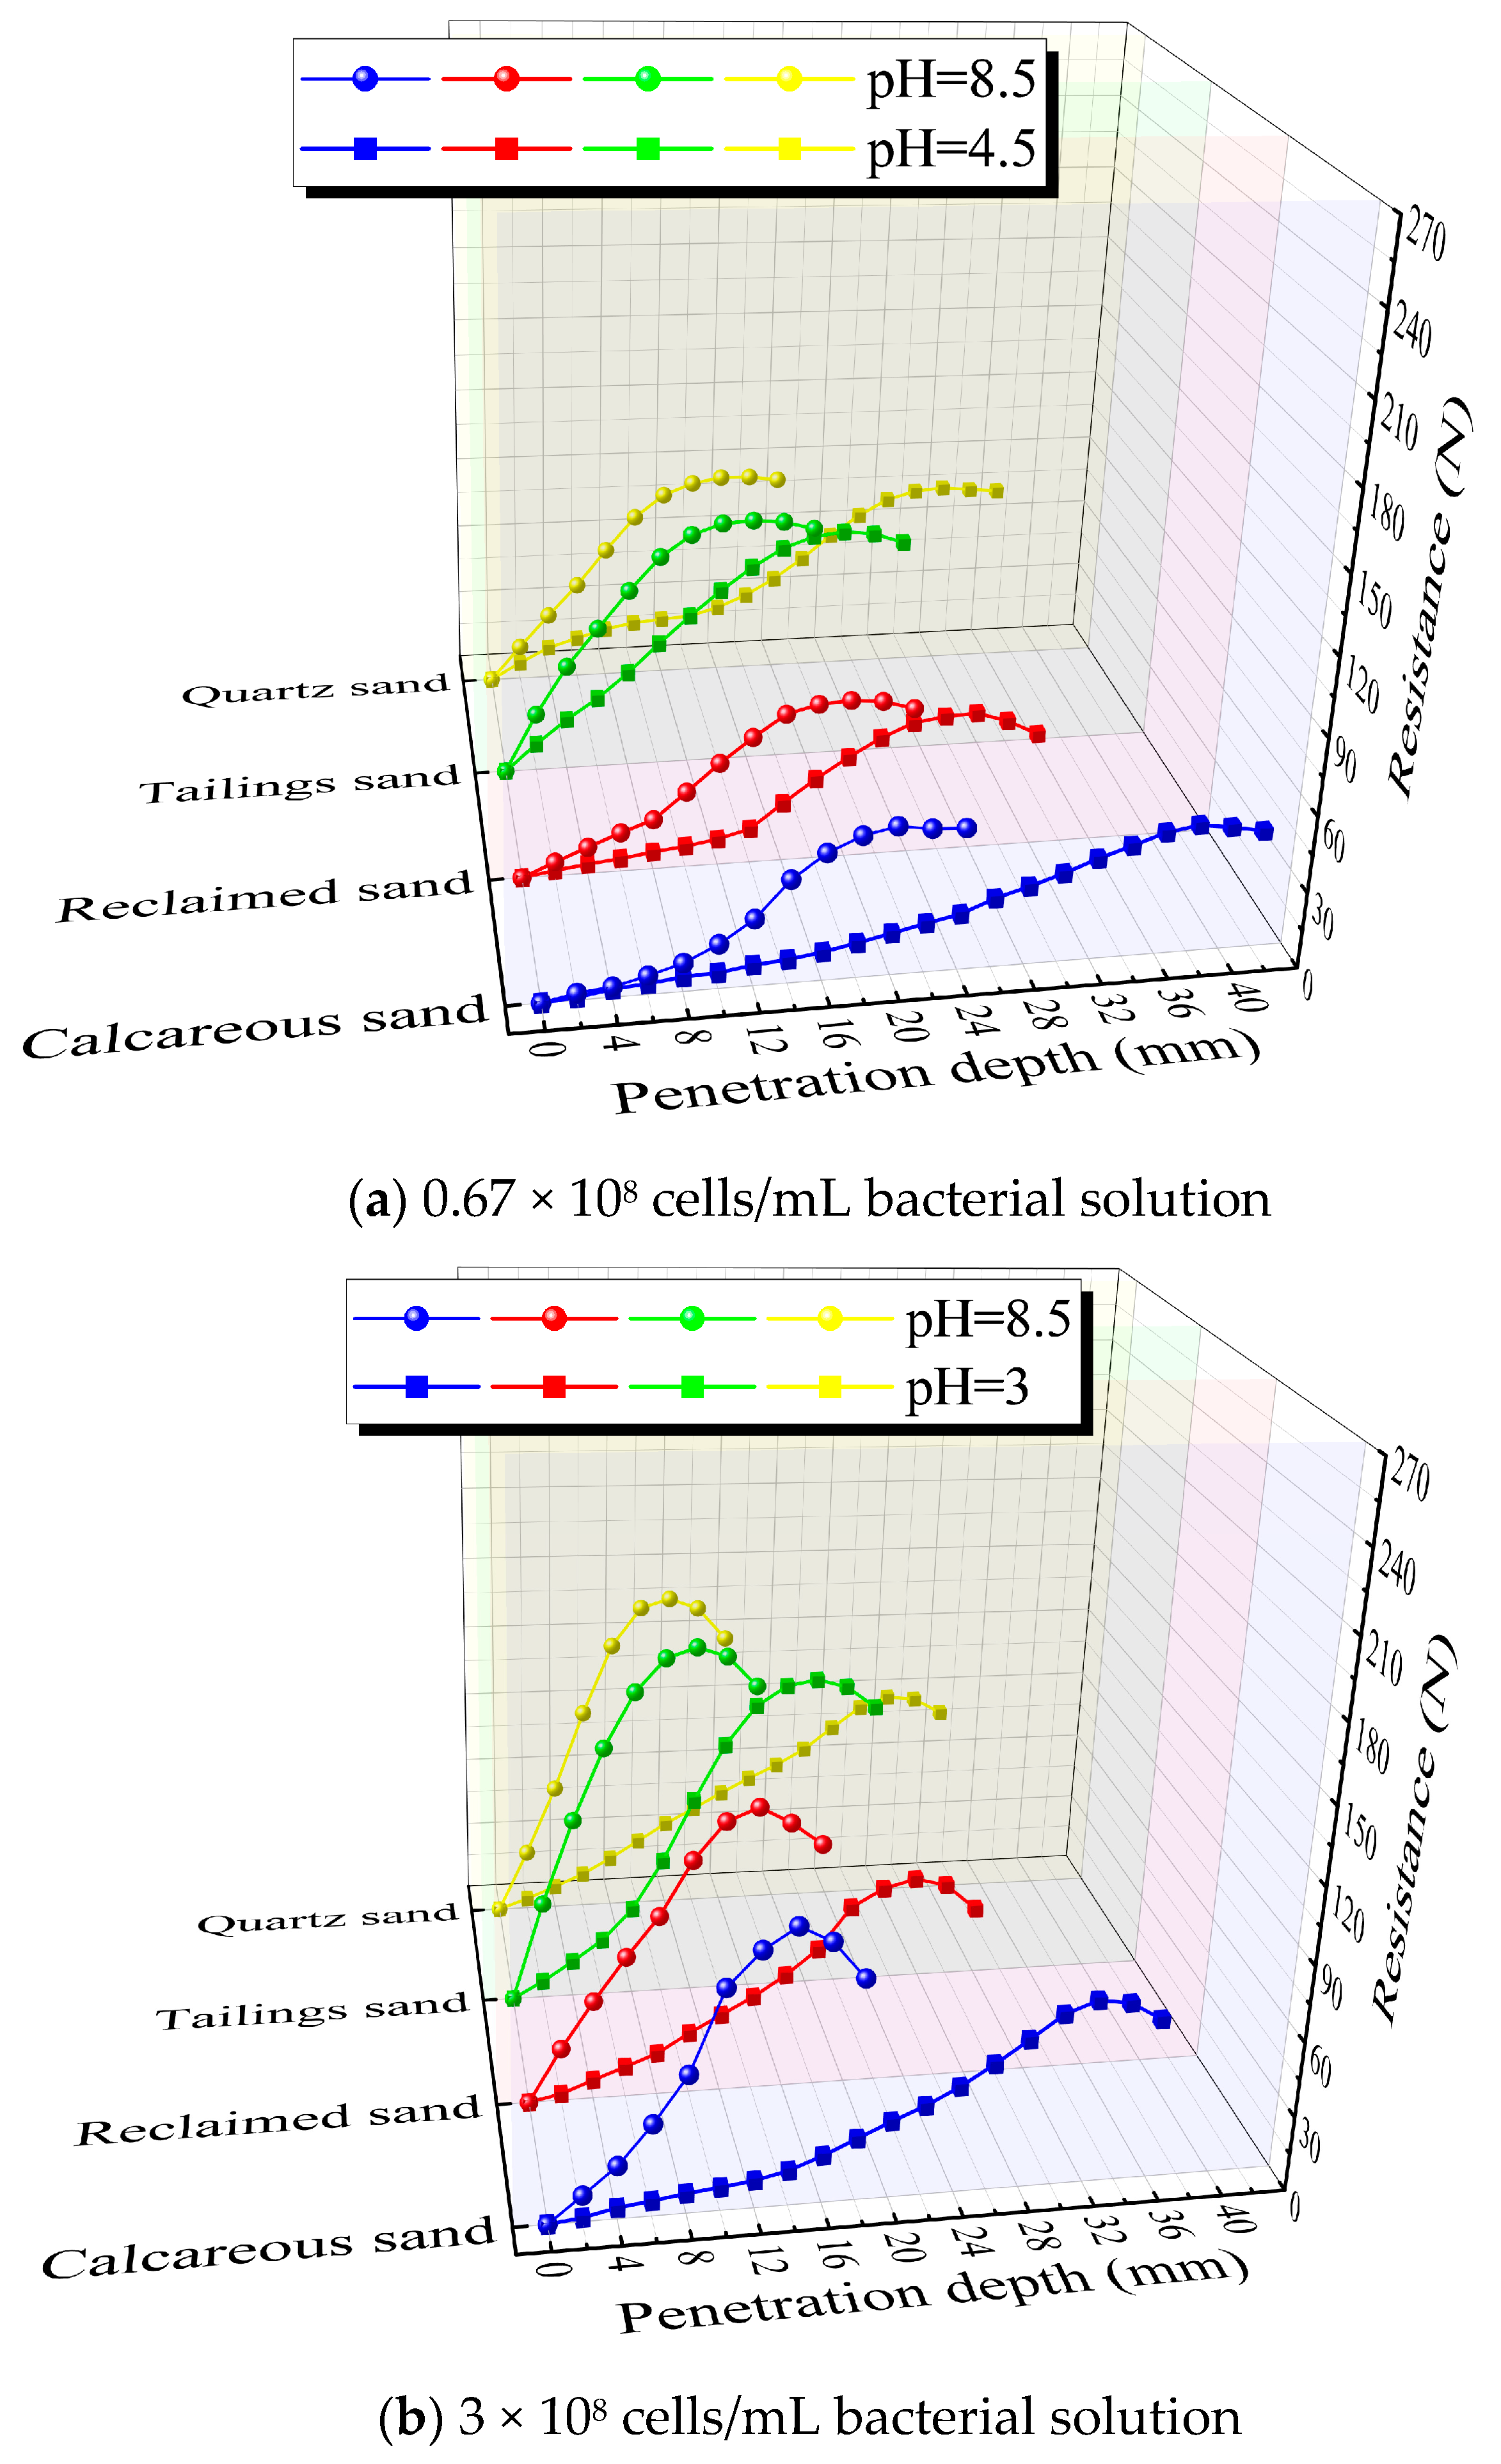
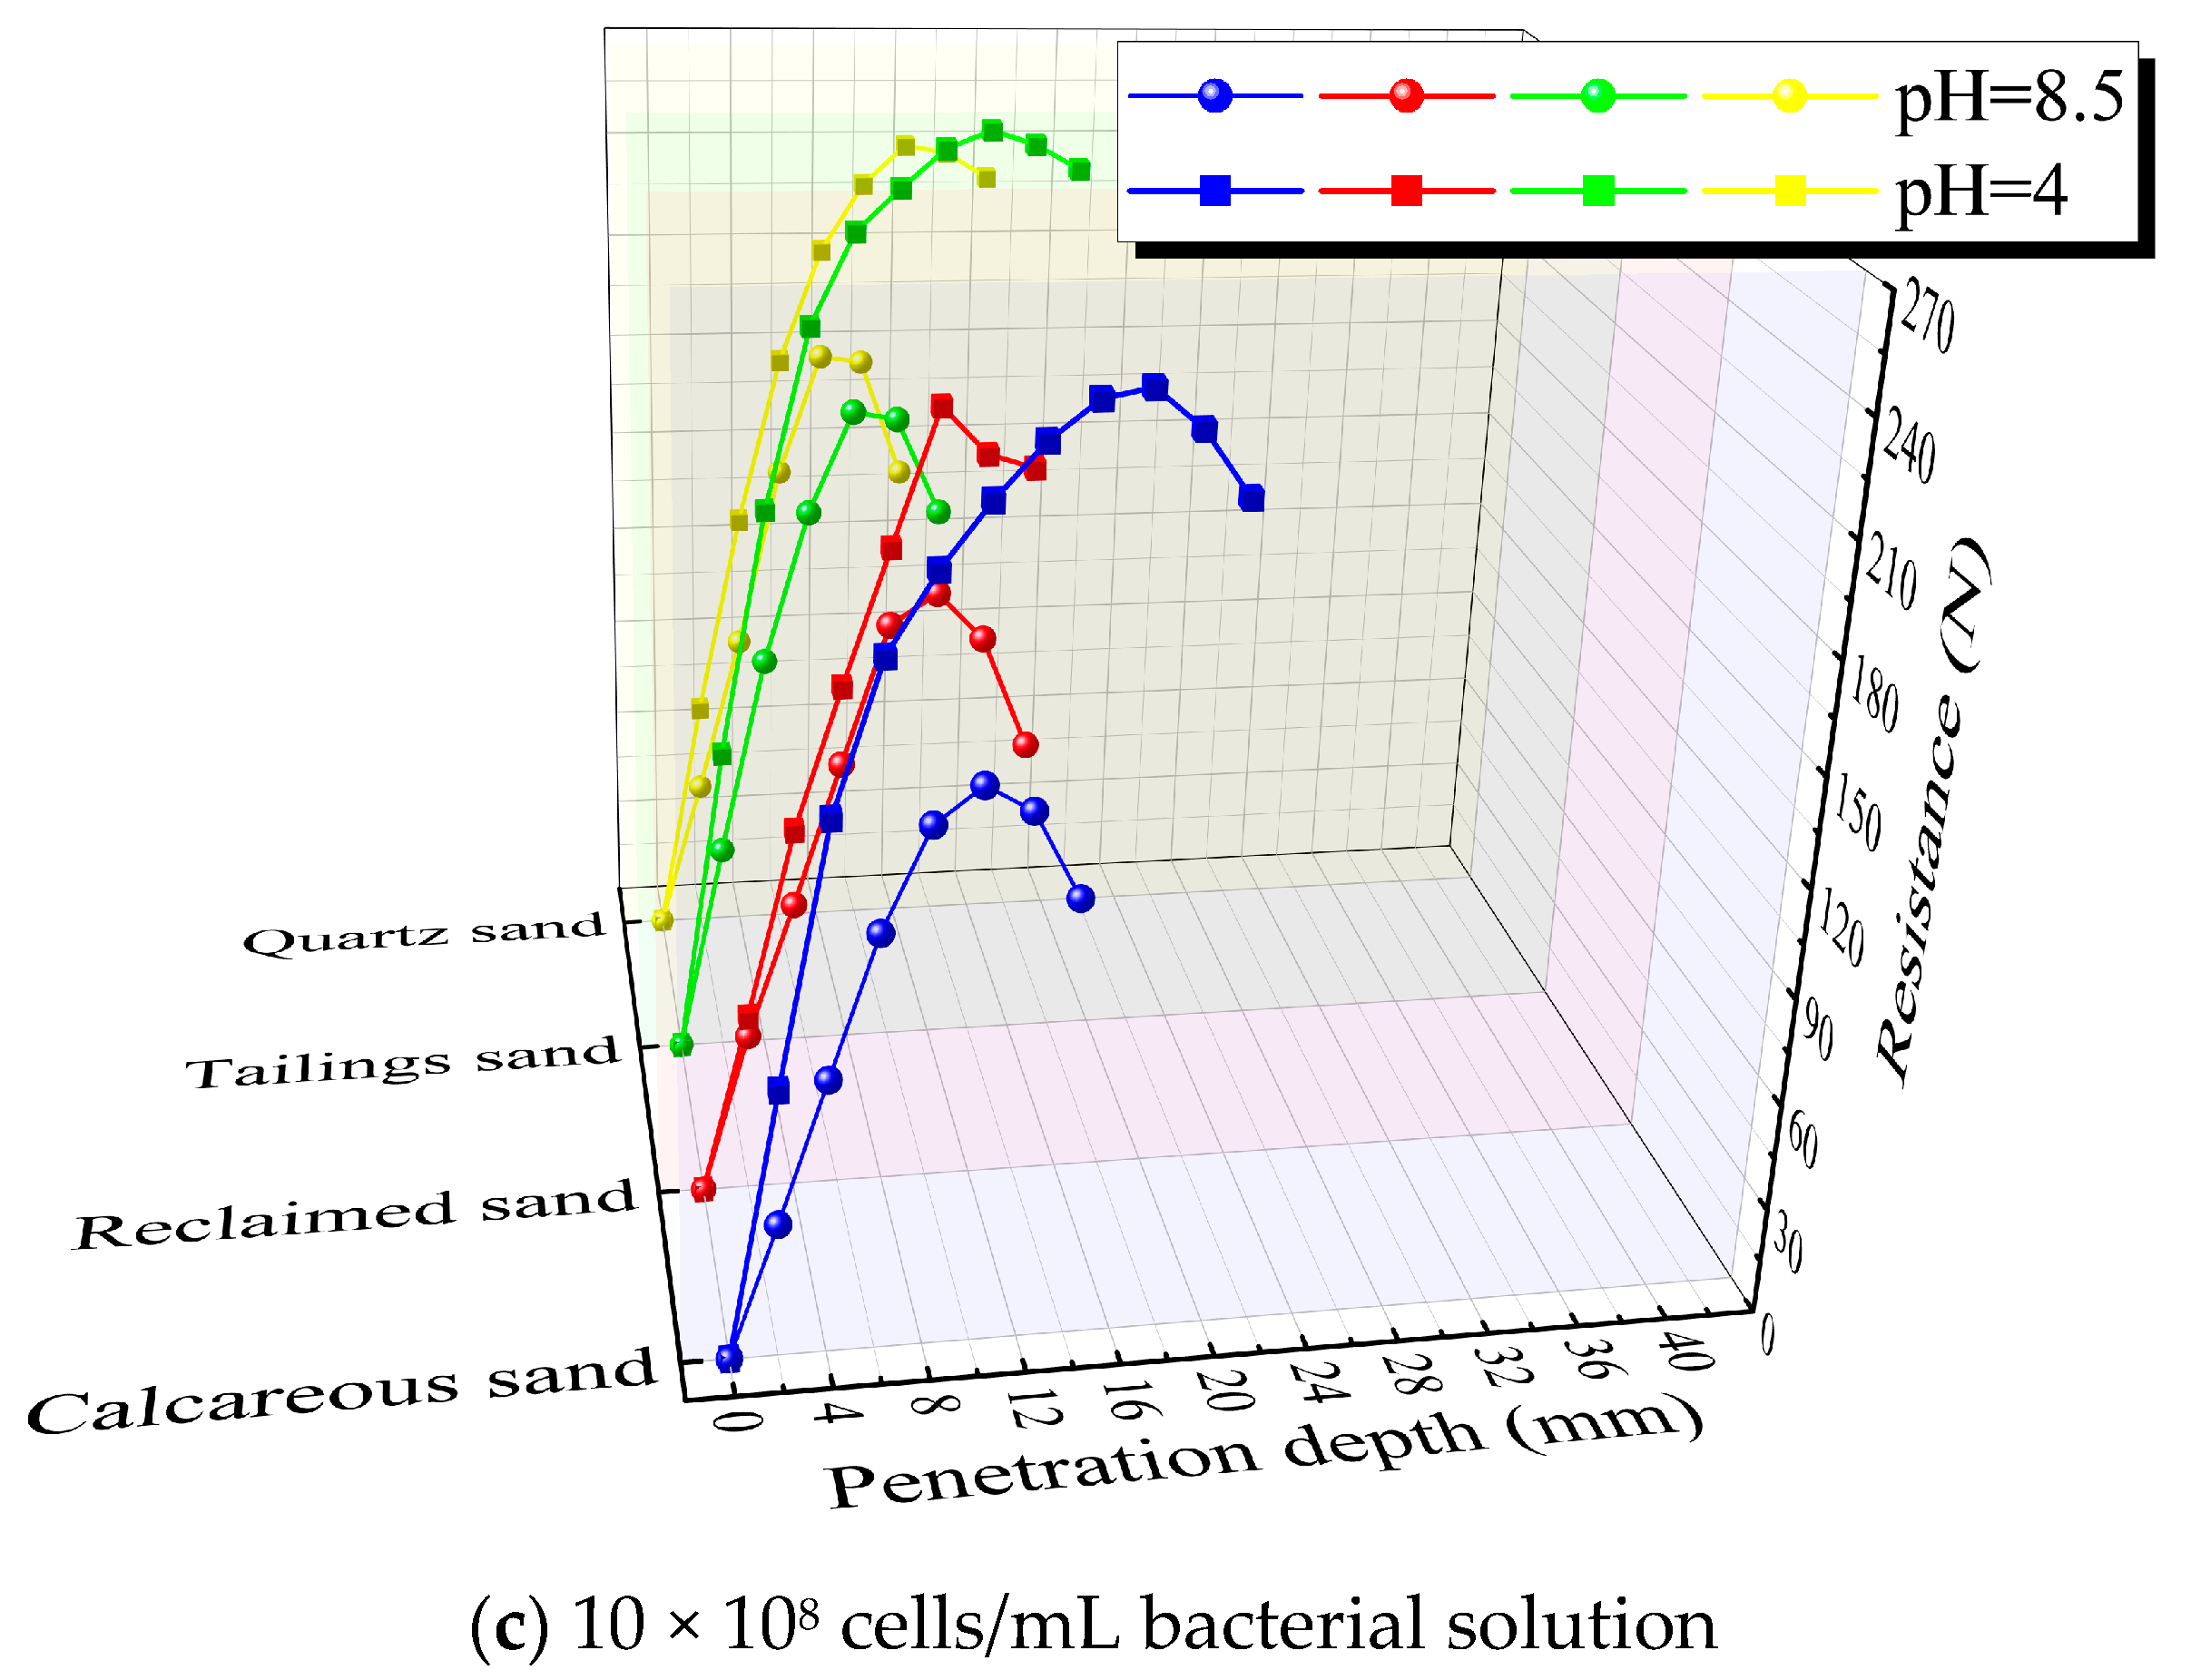
3.5. Penetration Resistance Test
3.6. Wind Erosion Resistance Test
4. Discussion
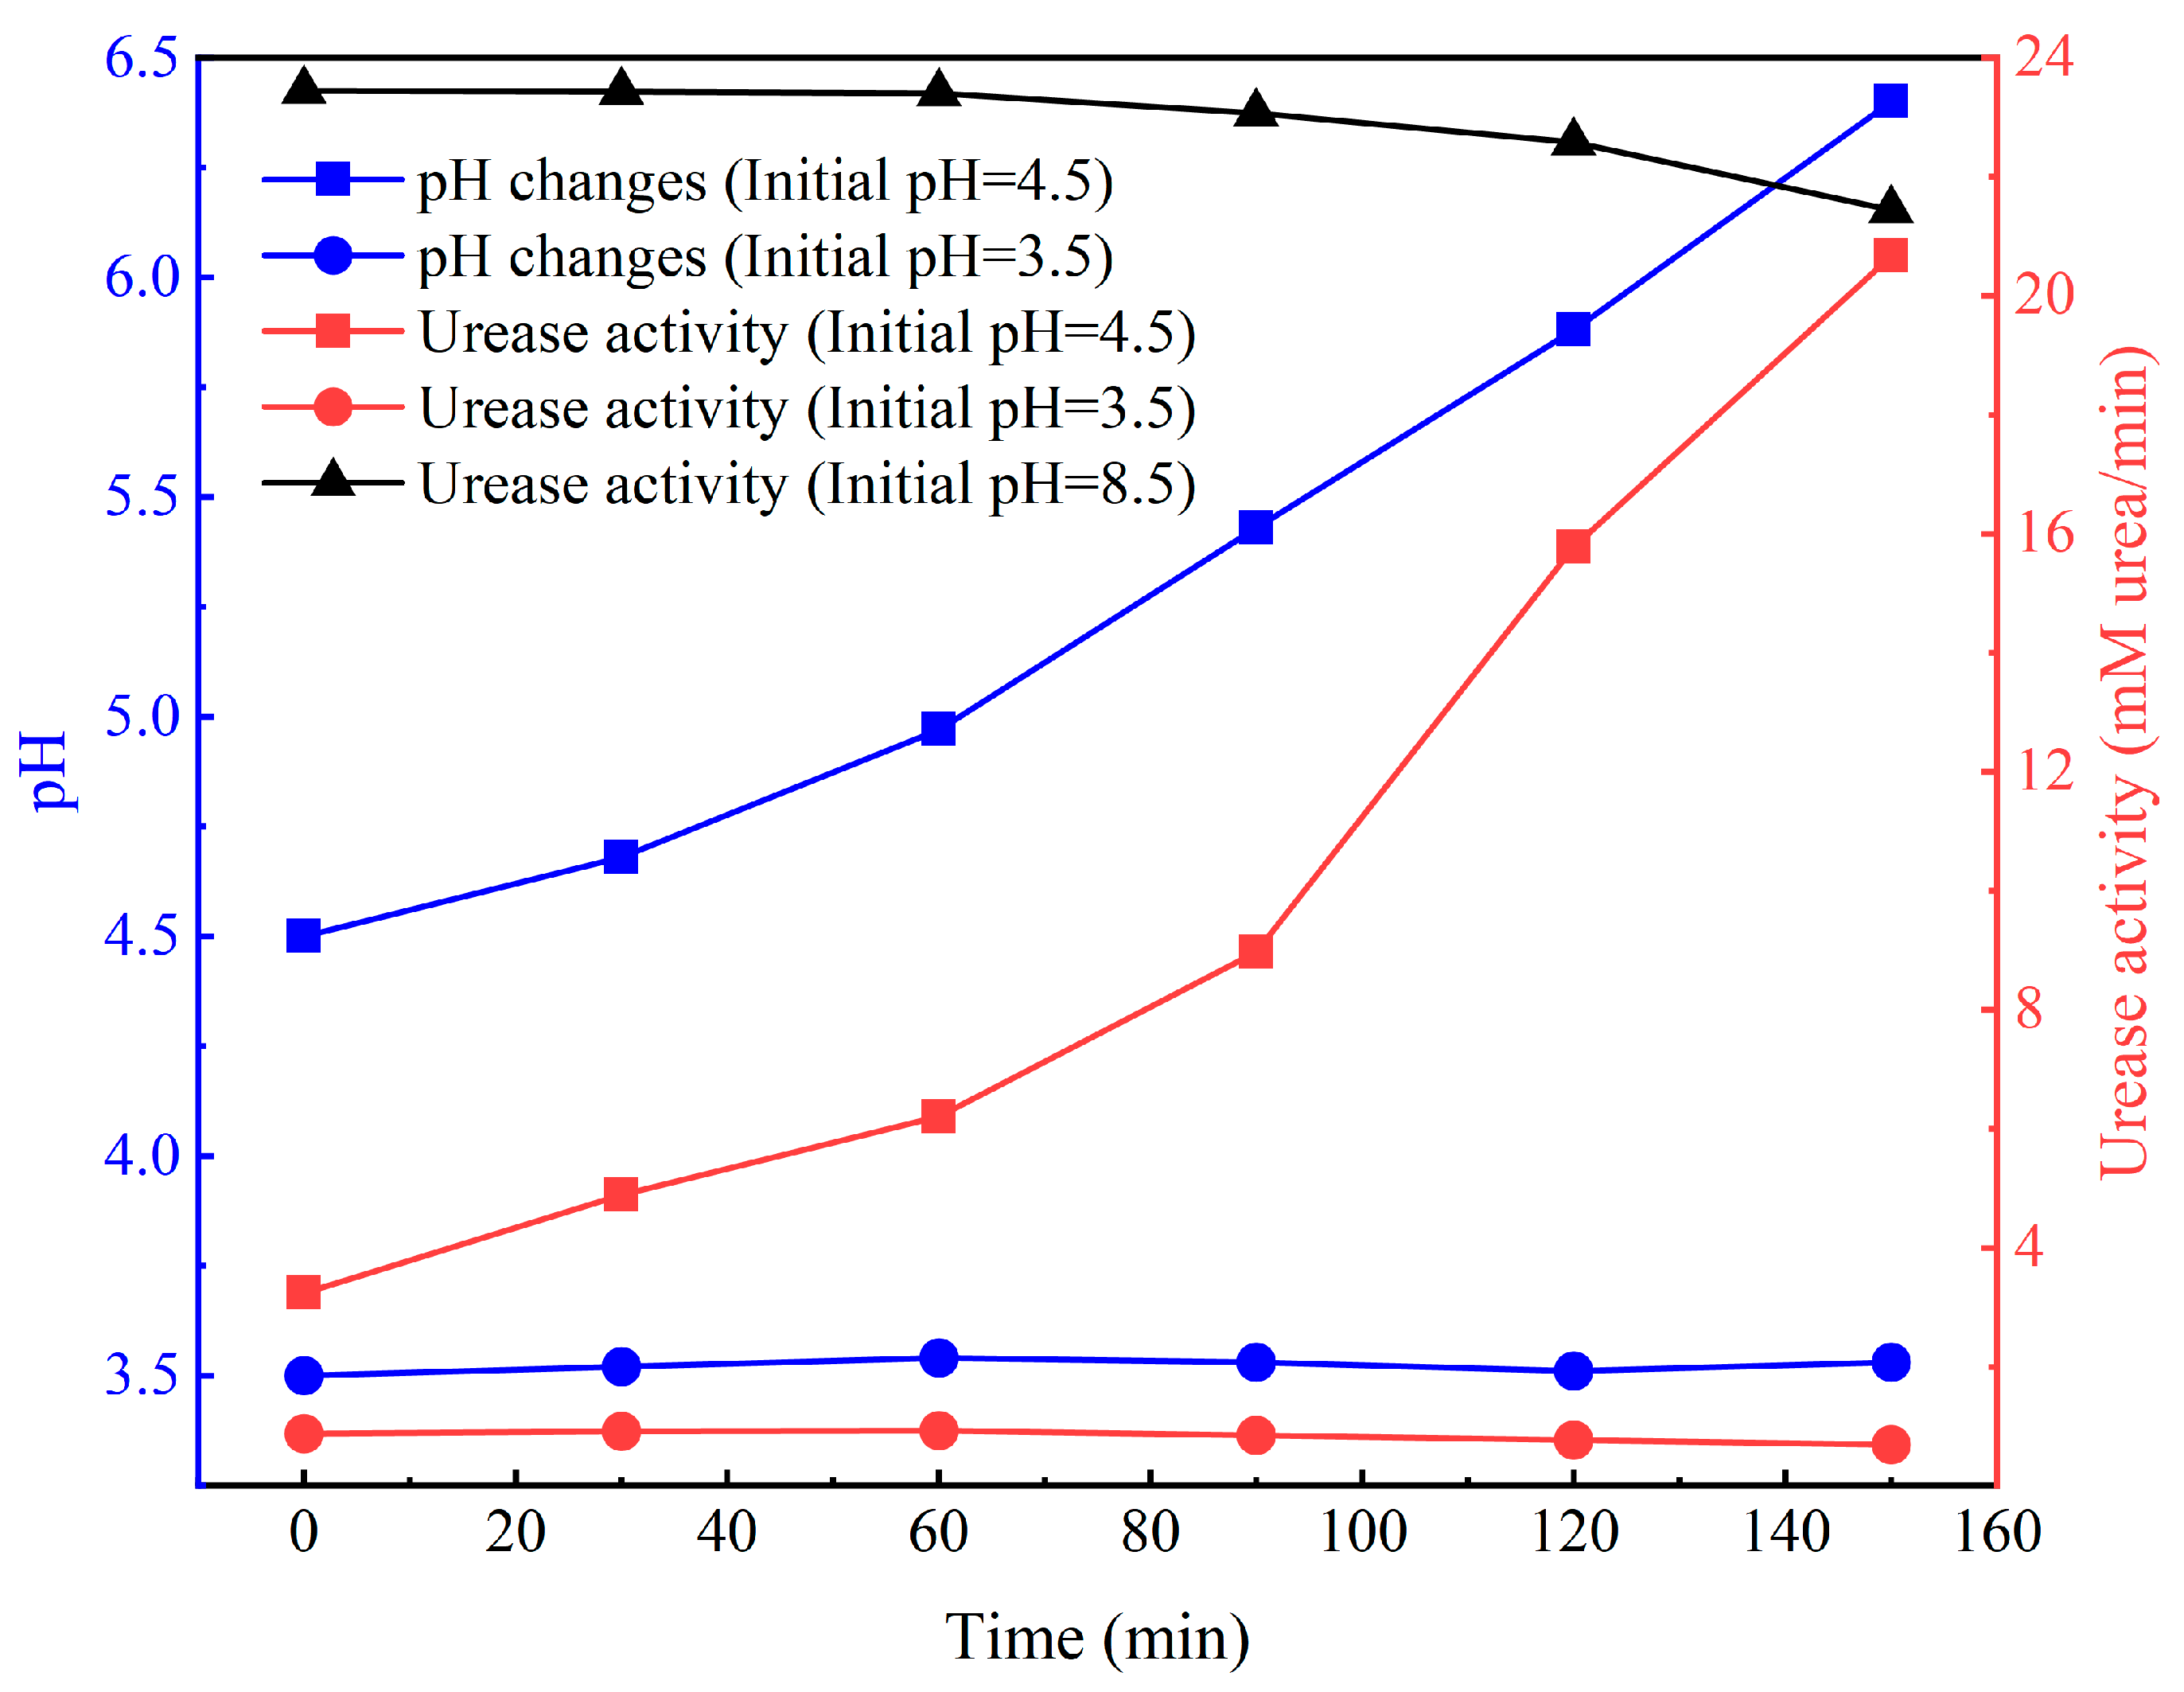
4.1. Impact of Low pH on Urease Activity
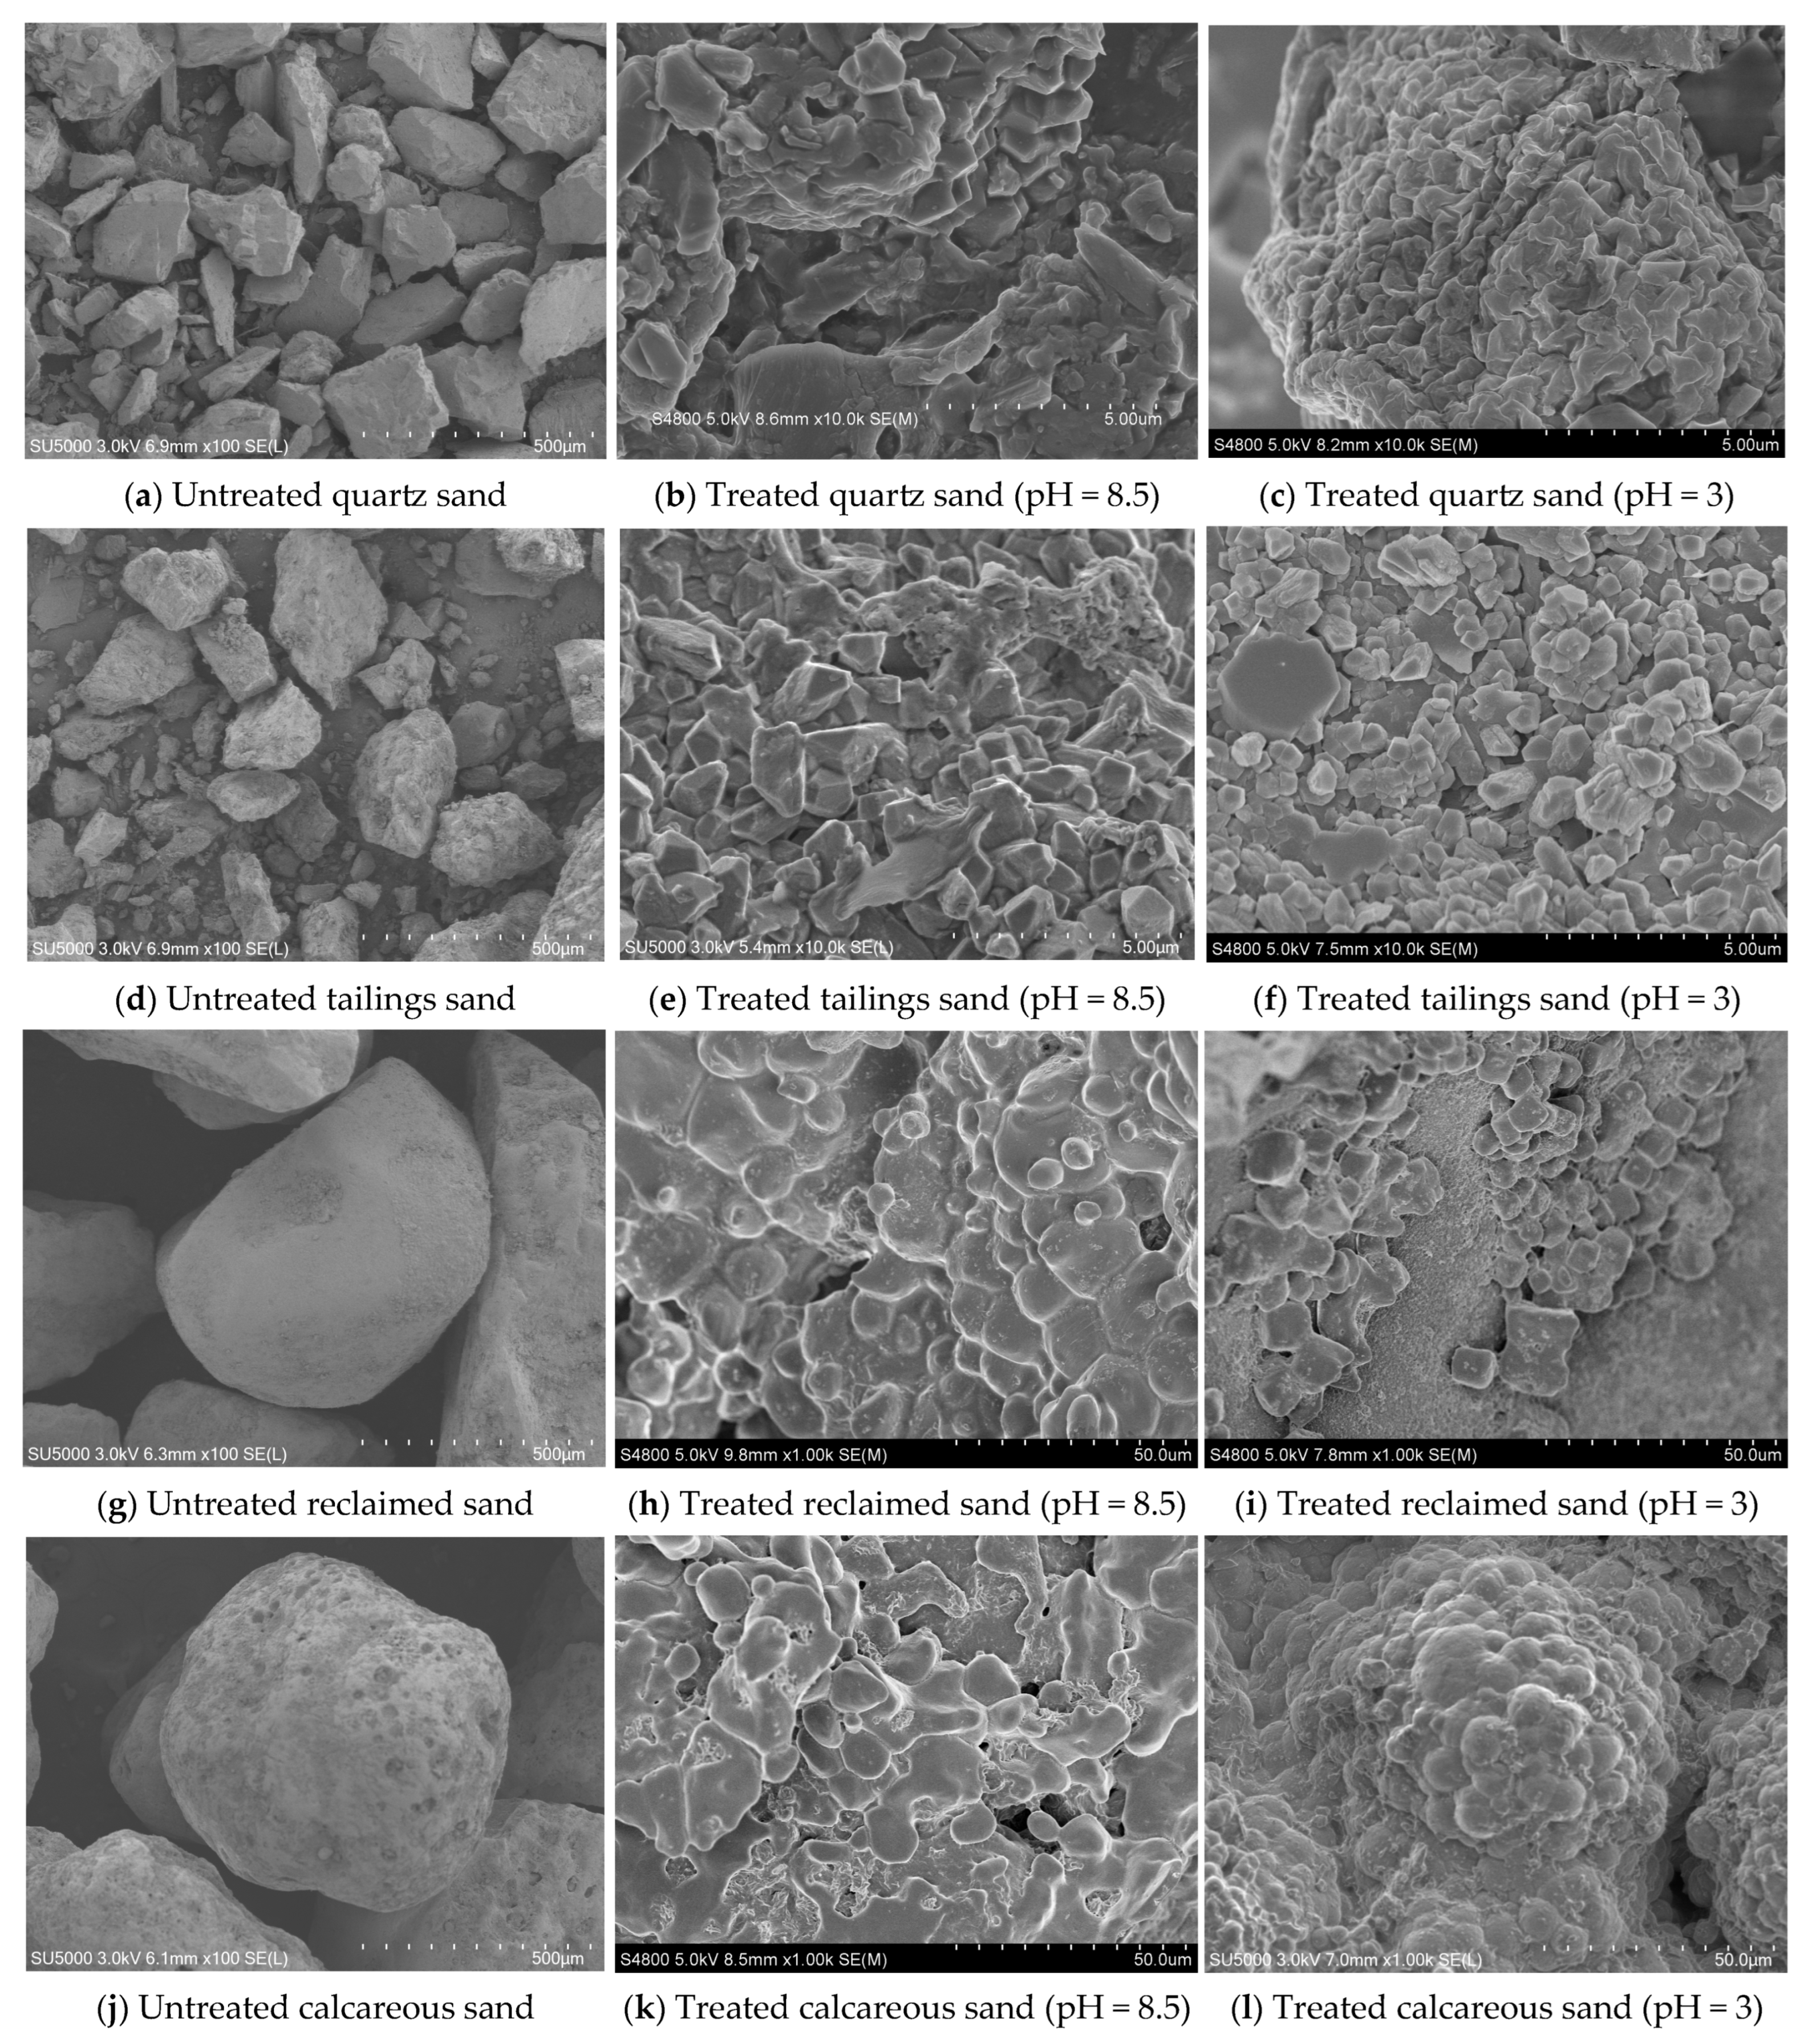
4.2. Microscopic Analysis of Different Sands Treated with Low-pH MICP
5. Conclusions
Author Contributions
Funding
Institutional Review Board Statement
Informed Consent Statement
Data Availability Statement
Conflicts of Interest
References
- Chang, I.; Im, J.; Cho, G.C. Introduction of microbial biopolymers in soil treatment for future environmentally-friendly and sustainable geotechnical engineering. Sustainability 2016, 8, 251. [Google Scholar] [CrossRef]
- Cabalar, A.F.; Karabash, Z.; Erkmen, O. Stiffness of a biocemented sand at small strains. Eur. J. Environ. Civ. Eng. 2018, 22, 1238–1256. [Google Scholar] [CrossRef]
- Van Paassen, L.A.; Ghose, R.; Van der Linden, T.J.; Van der Star, W.R.; van Loosdrecht, M.C. Quantifying biomediated ground improvement by ureolysis: Large-scale biogrout experiment. J. Geotech. Geoenviron. Eng. 2010, 136, 1721–1728. [Google Scholar] [CrossRef]
- Zomorodian, S.M.; Ghaffari, H.; O’Kelly, B.C. Stabilisation of crustal sand layer using biocementation technique for wind erosion control. Aeolian Res. 2019, 40, 34–41. [Google Scholar] [CrossRef]
- Liu, S.; Yu, J.; Peng, X.; Cai, Y.; Tu, B. Preliminary study on repairing tabia cracks by using microbially induced carbonate precipitation. Constr. Build. Mater. 2020, 248, 118611. [Google Scholar] [CrossRef]
- Qabany, A.A.; Soga, K. Effect of chemical treatment used in MICP on engineering properties of cemented soils. Géotechnique 2013, 6, 331–339. [Google Scholar] [CrossRef]
- Benini, S.; Rypniewski, W.R.; Wilson, K.S.; Miletti, S.; Ciurli, S.; Mangani, S. A new proposal for urease mechanism based on the crystal structures of the native and inhibited enzyme from Bacillus pasteurii: Why urea hydrolysis costs two nickels. Structure 1999, 7, 205–216. [Google Scholar] [CrossRef] [PubMed]
- Mobley, H.L.T.; Hausinger, R.P. Microbial ureases: Significance, regulation and molecular characterisation. Microbiol. Rev. 1989, 53, 85–108. [Google Scholar] [CrossRef]
- Stumm, W.; Morgan, J.J. Aquatic Chemistry, 2nd ed.; Wiley: New York, NY, USA, 1981. [Google Scholar]
- Stocks-Fischer, S.; Galinat, J.K.; Bang, S.S. Microbiological precipitation of calcium carbonate. Soil Biol. Biochem. 1999, 31, 1563–1571. [Google Scholar] [CrossRef]
- Whiffin, V.S.; Van Paassen, L.A.; Harkes, M.P. Microbial carbonate precipitation as a soil improvement technique. Geomicrobiol. J. 2007, 24, 417–423. [Google Scholar] [CrossRef]
- Cheng, L.; Cord-Ruwisch, R. In situ soil cementation with ureolytic bacteria by surface percolation. Ecol. Eng. 2012, 42, 64–72. [Google Scholar] [CrossRef]
- Shahrokhi-Shahraki, R.; Zomorodian, S.M.; Niazi, A.; O’Kelly, B.C. Improving sand with microbial-induced carbonate precipitation. Proc. Inst. Civ. Eng. Ground Improv. 2014, 168, 217–230. [Google Scholar] [CrossRef]
- Harkes, M.P.; Van Paassen, L.A.; Booster, J.L.; Whiffin, V.S.; van Loosdrecht, M.C. Fixation and distribution of bacterial activity in sand to induce carbonate precipitation for ground reinforcement. Ecol. Eng. 2010, 36, 112–117. [Google Scholar] [CrossRef]
- Cheng, L.; Shahin, M.A.; Chu, J. Soil bio-cementation using a new one-phase low-pH injection method. Acta Geotech. 2019, 14, 615–626. [Google Scholar] [CrossRef]
- Zhang, J.; Li, J.; Xiao, P.; Liu, H.; Wu, H. Comparative study on MICP-treatment schemes for sands. J. Civ. Environ. Eng. 2023. [Google Scholar]
- Yang, Y.; Chu, J.; Liu, H.; Cheng, L. Improvement of uniformity of biocemented sand column using CH3COOH-buffered one-phase-low-pH injection method. Acta Geotech. 2023, 18, 413–428. [Google Scholar] [CrossRef]
- Ahmad, J.; Khan, M.A.; Ahmad, S. State of the art on factors affecting the performance of MICP treated fine aggregates. Mater. Today Proc. 2023. [Google Scholar] [CrossRef]
- Prajapati, N.K.; Agnihotri, A.K.; Basak, N. Microbial induced calcite precipitation (MICP) a sustainable technique for stabilization of soil: A review. Mater. Today Proc. 2023. [Google Scholar] [CrossRef]
- Xu, P.; Wen, Z.; Yang, S.; Liu, Z.; Leng, M.; Peng, J. Experimental Investigation in MICP Solidified Sands of Different Particle Sizes. Geol. J. China Univ. 2021, 27, 738. [Google Scholar]
- Zhang, G.; Tong, H.; Peng, Q.; Yuan, J. The Effect of Magnesium on the Experiment of Microbial Reinforcement of Sand. Sci. Technol. Eng. 2020, 20, 10659–10664. [Google Scholar]
- Xiong, Y.; Demg, H.; Li, J.; Cheng, L.; Zhu, W. Experimental study of MICP-treated sand enhanced by pozzolan. Rock Soil Mech. 2022, 43, 3403–3425. [Google Scholar]
- Cabalar, A.F.; Demir, S. Fall-cone testing of different size/shape sands treated with a biopolymer. Geomech. Eng. 2020, 22, 441. [Google Scholar]
- Wang, Y.; Li, C.; Ge, X.; Gao, L. Experimental study on improvement of weathered Pisha sandstone soil in Inner Mongolia section of the Yellow River Basin based on microbially induced carbonate precipitation technology. Rock Soil Mech. 2022, 43, 708–718. [Google Scholar]
- Xiao, Y.; Deng, H.; Li, J.; Cheng, L.; Zhu, W. Study on domestication of Sporosarcina pasteurii and cementation effect of calcareous sand in seawater environment. Rock Soil Mech. 2022, 43, 395–404. [Google Scholar]
- Zhang, Q.; Ye, W.; Liu, Z.; Wang, Q.; Chen, Y. Advances in soil cementation by biologically induced calcium carbonate precipitation. Rock Soil Mech. 2022, 43, 345–357. [Google Scholar]
- GB/T 50123-2019; Standard for Geotechnical Testing Method. National Standard of the People’s Republic of China: China, 2019.
- Ramachandran, S.K.; Ramakrishnan, V.; Bang, S.S. Remediation of concrete using microorganisms. Mater. J. 2001, 98, 3–9. [Google Scholar]
- Choi, S.G.; Park, S.S.; Wu, S.; Chu, J. Methods for Calcium Carbonate Content Measurement of Biocemented Soils. J. Mater. Civ. Eng. 2017, 29, 06017015. [Google Scholar] [CrossRef]
- New Zealand-Only Sub-Committee. NZS 4298 Materials and Workmanship for Earth Buildings; New Zealand-Only Sub-Committee: Wellington, New Zealand, 1998. [Google Scholar]
- Rice, M.A.; Willetts, B.B.; Mcewan, I.K. Wind erosion of Crusted Soil Sediments. Earth Surf. Process. Landf. 1996, 21, 279–293. [Google Scholar] [CrossRef]
- Hattori, T. Microbial Life in the Soil: An Introduction; Dekker: New York, NY, USA, 1973. [Google Scholar]
- Madigan, M.T.; Martinko, J.M.; Parker, J. Brock Biology of Microorganisms, 10th ed.; Prentice Hall; Pearson Education: Upper Saddle River, NJ, USA, 2002. [Google Scholar]
- Tan, H. Microbiology, 1st ed.; Higher Education Press: Beijing, China, 1988. [Google Scholar]
- Zhuge, J.; Li, H. Microbiology, 2nd ed.; Science Press: Beijing, China, 2004. [Google Scholar]
- Whiffin, V.S. Microbial Calcium Carbonate Precipitation for the Production of Biocement; Murdoch University: Perth, Australia, 2004. [Google Scholar]
- Gandhi, K.S.; Kumar, R.; Ramkrishna, D. Some Basic Aspects of Reaction Engineering of Precipitation Processes. Ind. Eng. Chem. Res. 1995, 34, 3223–3230. [Google Scholar] [CrossRef]


| Category | Tailings Sand | Reclaimed Sand | Calcareous Sand | Quartz Sand |
|---|---|---|---|---|
| Type | fine sand | coarse sand | coarse sand | fine sand |
| pH | 9.5 | 9.8 | 7.8 | 7.2 |
| Main components | SiO2, CaO | SiO2 | SiO2, CaO | SiO2 |
| ρdmin (g/cm3) | 1.8283 | 1.3289 | 1.3360 | 1.3378 |
| ρdmax (g/cm3) | 2.3746 | 1.6387 | 1.6713 | 1.9405 |
Disclaimer/Publisher’s Note: The statements, opinions and data contained in all publications are solely those of the individual author(s) and contributor(s) and not of MDPI and/or the editor(s). MDPI and/or the editor(s) disclaim responsibility for any injury to people or property resulting from any ideas, methods, instructions or products referred to in the content. |
© 2023 by the authors. Licensee MDPI, Basel, Switzerland. This article is an open access article distributed under the terms and conditions of the Creative Commons Attribution (CC BY) license (https://creativecommons.org/licenses/by/4.0/).
Share and Cite
Lai, Y.; Liu, S.; Cai, Y.; Yu, J. Reinforcement of Different Sands by Low-pH Bio-Mineralization. Materials 2023, 16, 6211. https://doi.org/10.3390/ma16186211
Lai Y, Liu S, Cai Y, Yu J. Reinforcement of Different Sands by Low-pH Bio-Mineralization. Materials. 2023; 16(18):6211. https://doi.org/10.3390/ma16186211
Chicago/Turabian StyleLai, Yongming, Shiyu Liu, Yanyan Cai, and Jin Yu. 2023. "Reinforcement of Different Sands by Low-pH Bio-Mineralization" Materials 16, no. 18: 6211. https://doi.org/10.3390/ma16186211
APA StyleLai, Y., Liu, S., Cai, Y., & Yu, J. (2023). Reinforcement of Different Sands by Low-pH Bio-Mineralization. Materials, 16(18), 6211. https://doi.org/10.3390/ma16186211