
Rice Husk Cellulose-Based Adsorbent to Extract Rare Metals: Preparing and Properties
 ,
,
Abstract
:1. Introduction
2. Materials and Methods
2.1. Cellulose Preparation Process
- By the action of a 1.5% NaOH solution in three stages according to Beckman’s method [53]. At the first stage, rice husk was treated with a 1.5% sodium hydroxide solution for 48 h at room temperature with a solid-to-liquid (S:L) ratio of 1:20. Then the solution was poured off, and the solid residue was filled with a new portion of the alkaline solution at the indicated solid-to-liquid ratio and refluxed for 6 h. After separation of the liquid, the solid residue was again filled with fresh NaOH solution (S:L ratio of 1:10) and heated to a temperature of 130 °C, at which it was kept for 1 h. Then the obtained residue was washed with hot distilled water to neutralize the reaction of the wash water and filtered on a Burchner funnel. The residue was dried at 105 °C.
- By the action of the Kürschner and Hoffer reagent [51], consisting of 1 volume of concentrated nitric acid and 4 volumes of ethyl alcohol. One gram of rice husk was treated for 1 h with 25 cm3 of Kürschner and Hoffer reagent by refluxing in a water bath. Such treatment was repeated 4 times, after which the residue was filtered on a glass filter and washed with a fresh portion of Kürschner and Hoffer reagent and hot distilled water to neutralize the reaction of the wash water. The residue was dried at 105 °C.
2.2. Cellulose-Based Sorbent Preparation
2.3. Cellulose and Cellulose-Based Materials Characterization
2.4. Re (VII) Sorption Experiments
3. Results
3.1. Delignification of Rice Husk
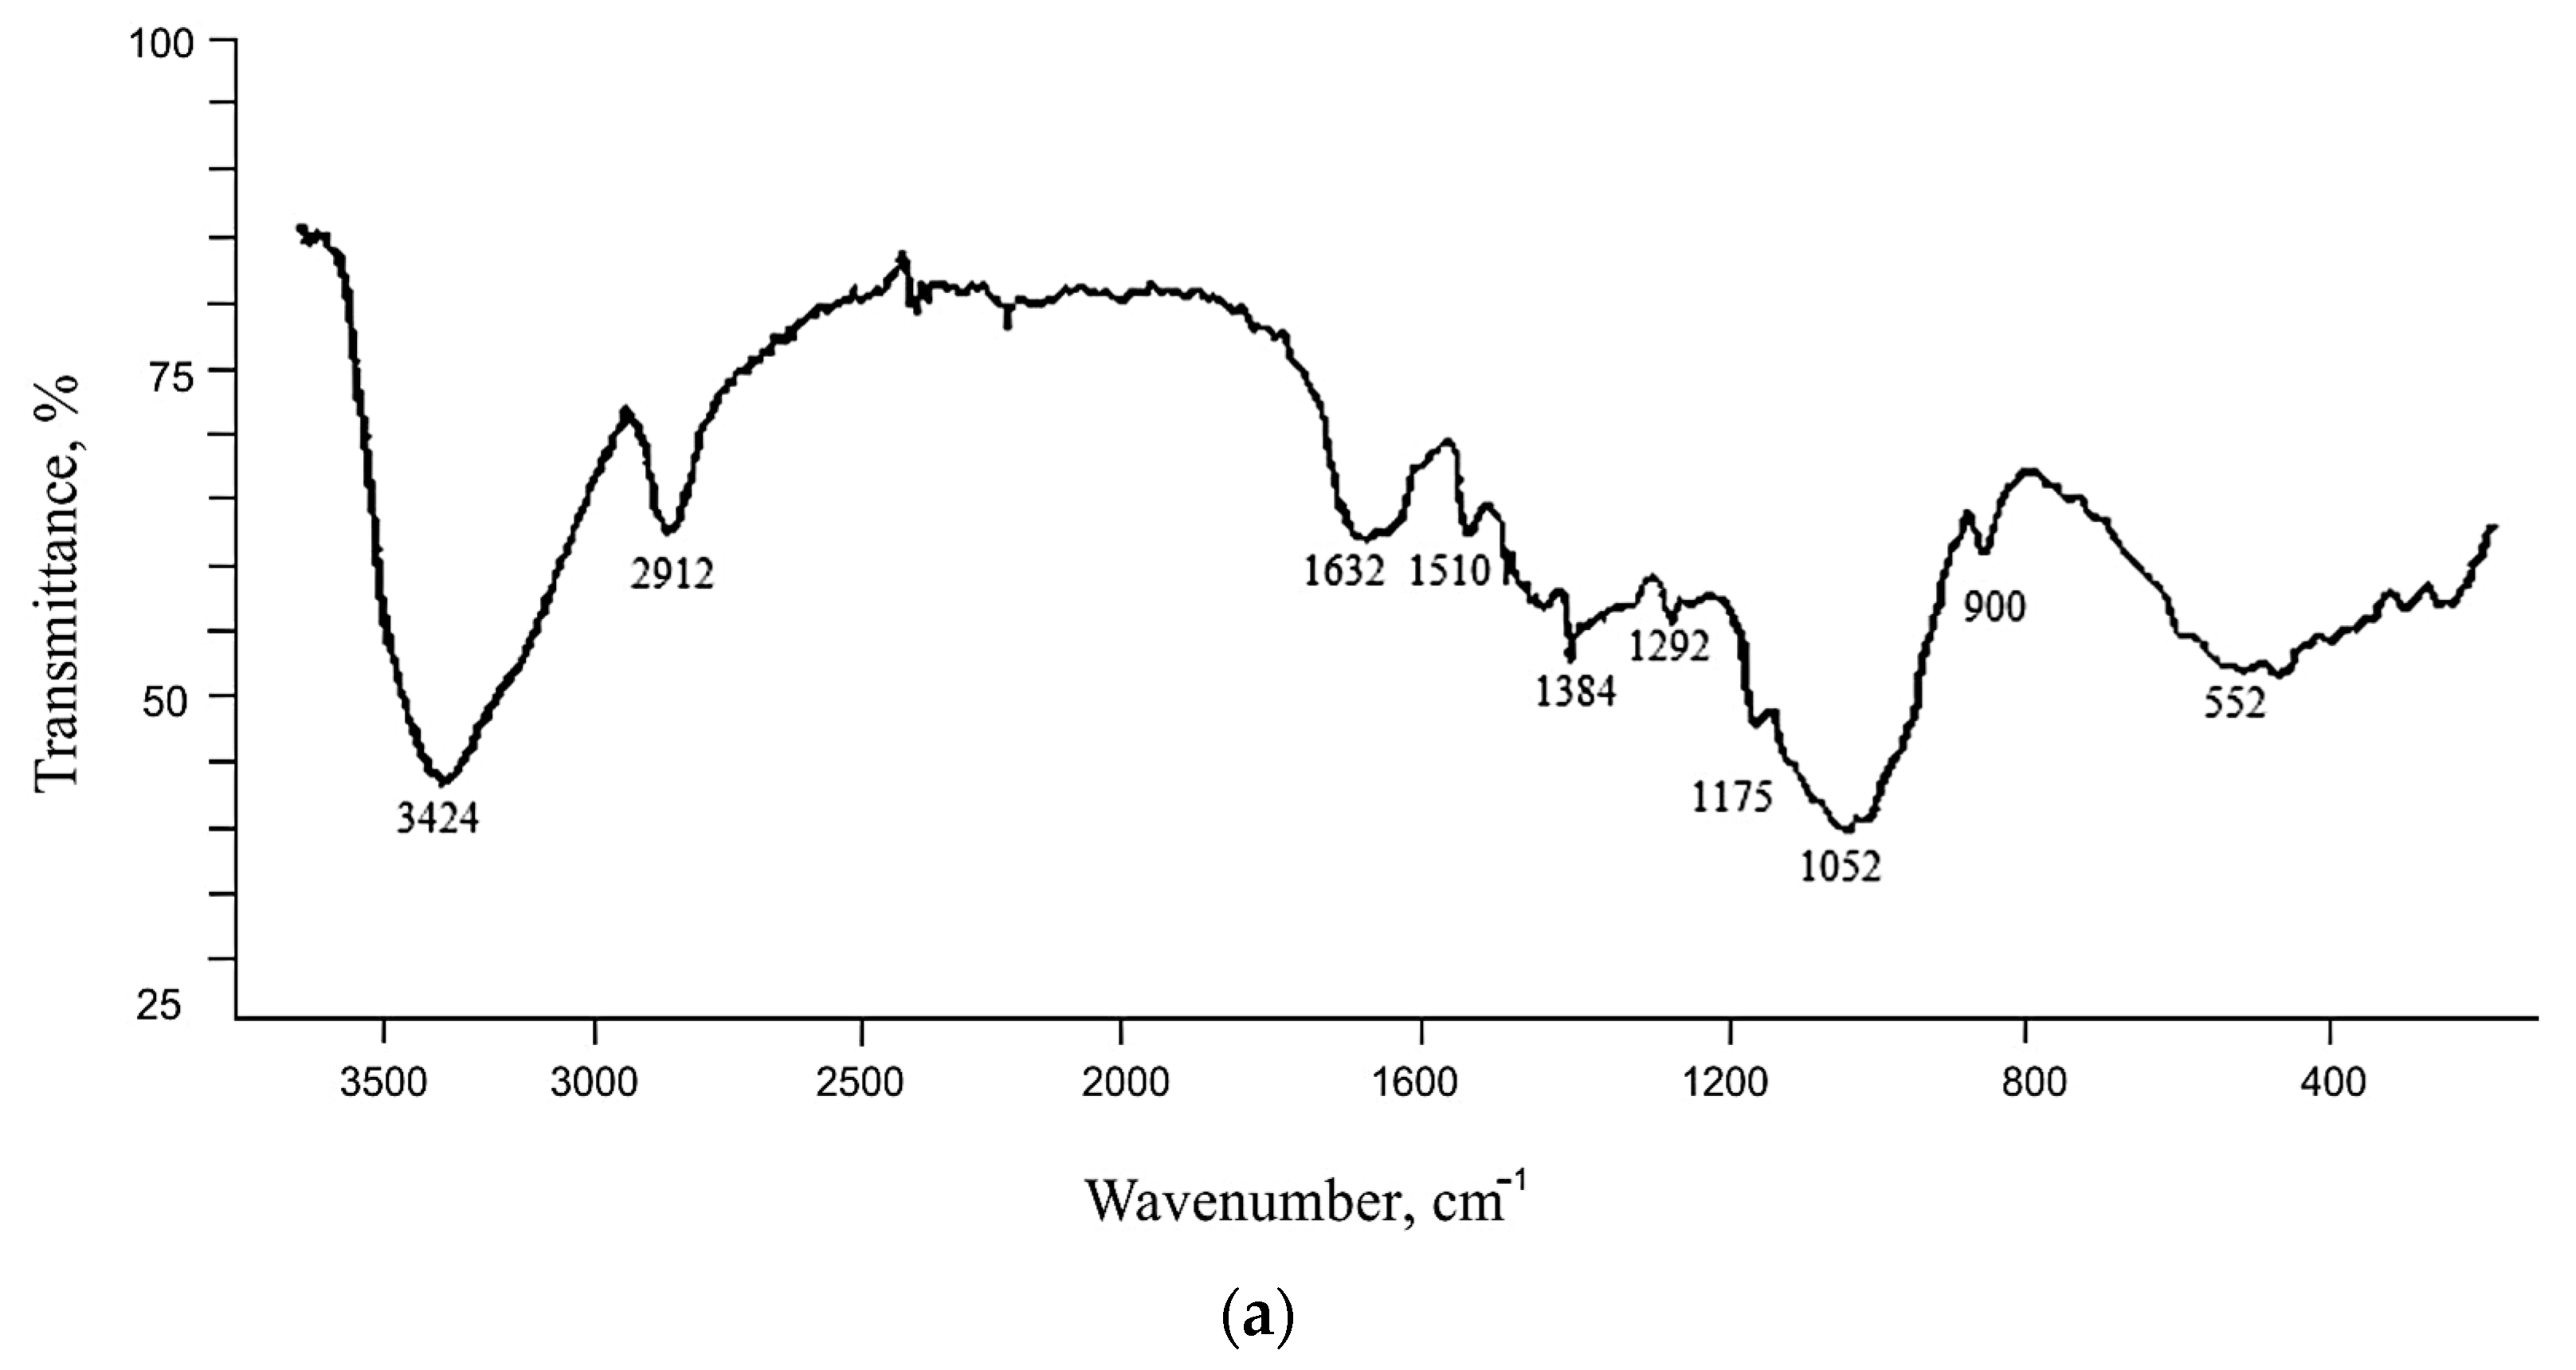
3.2. Study of Rice Husk Cellulose by Infrared Spectroscopy
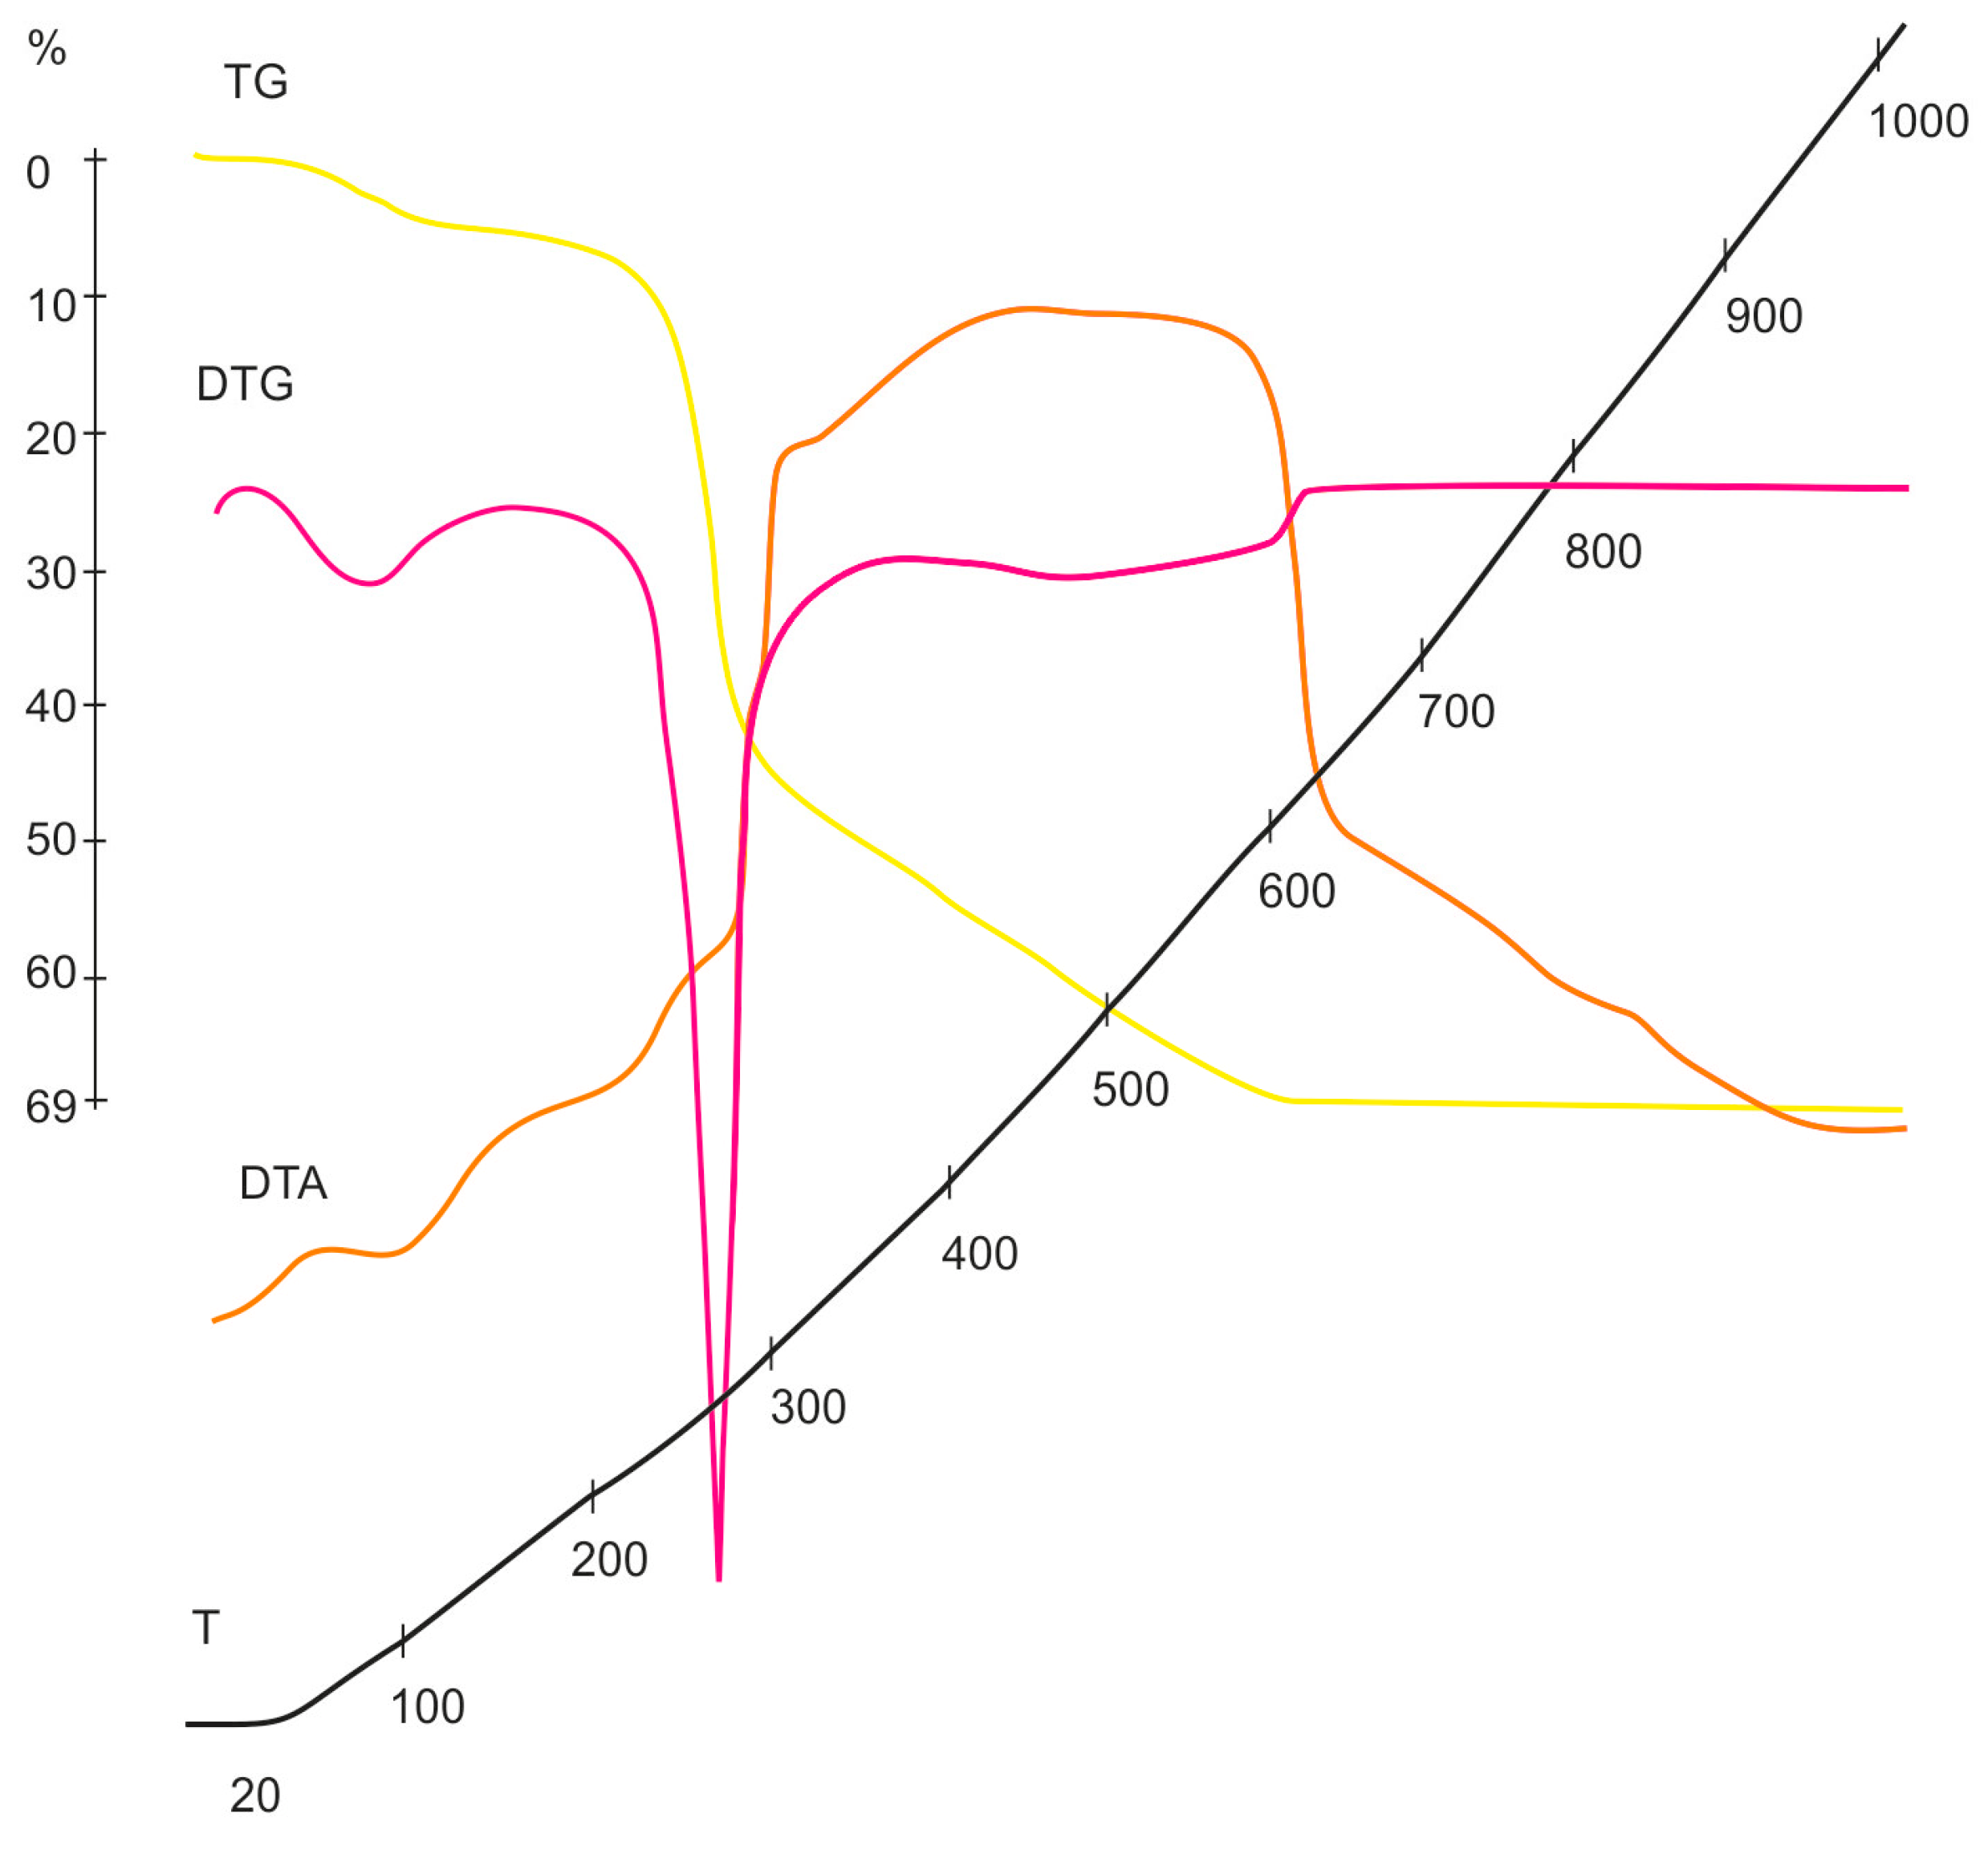
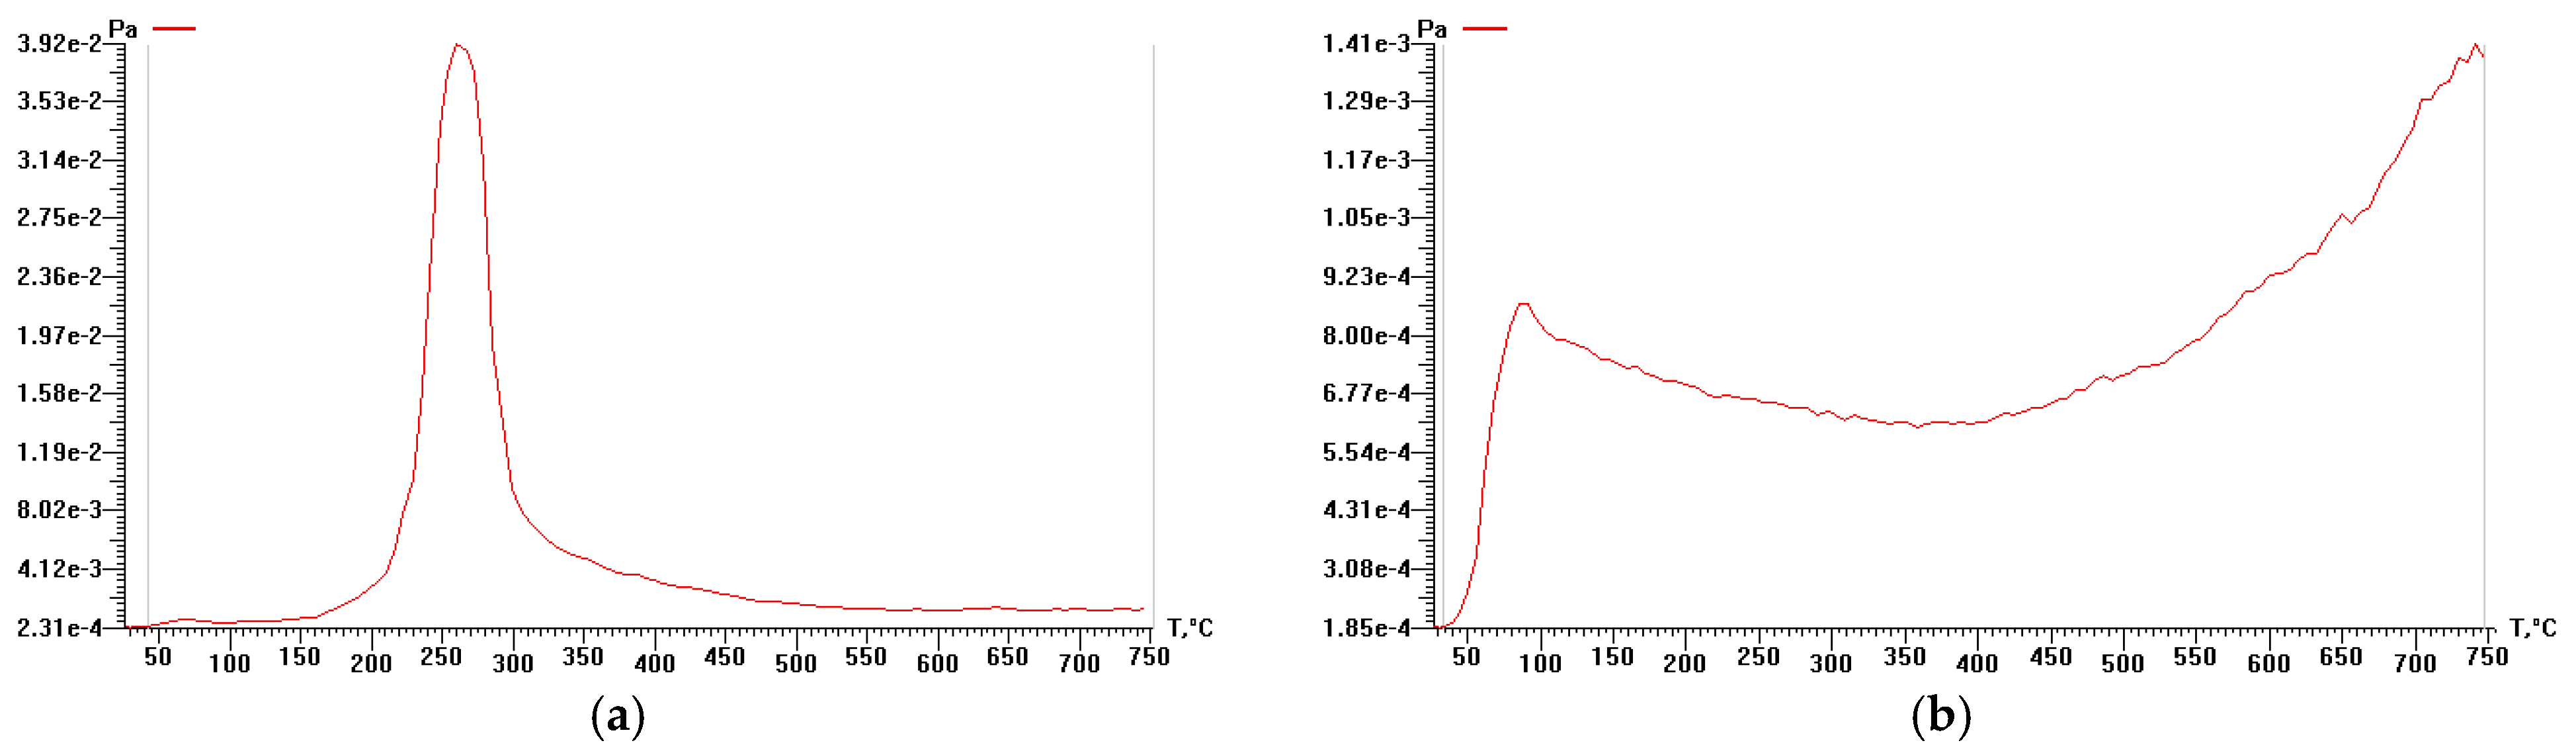
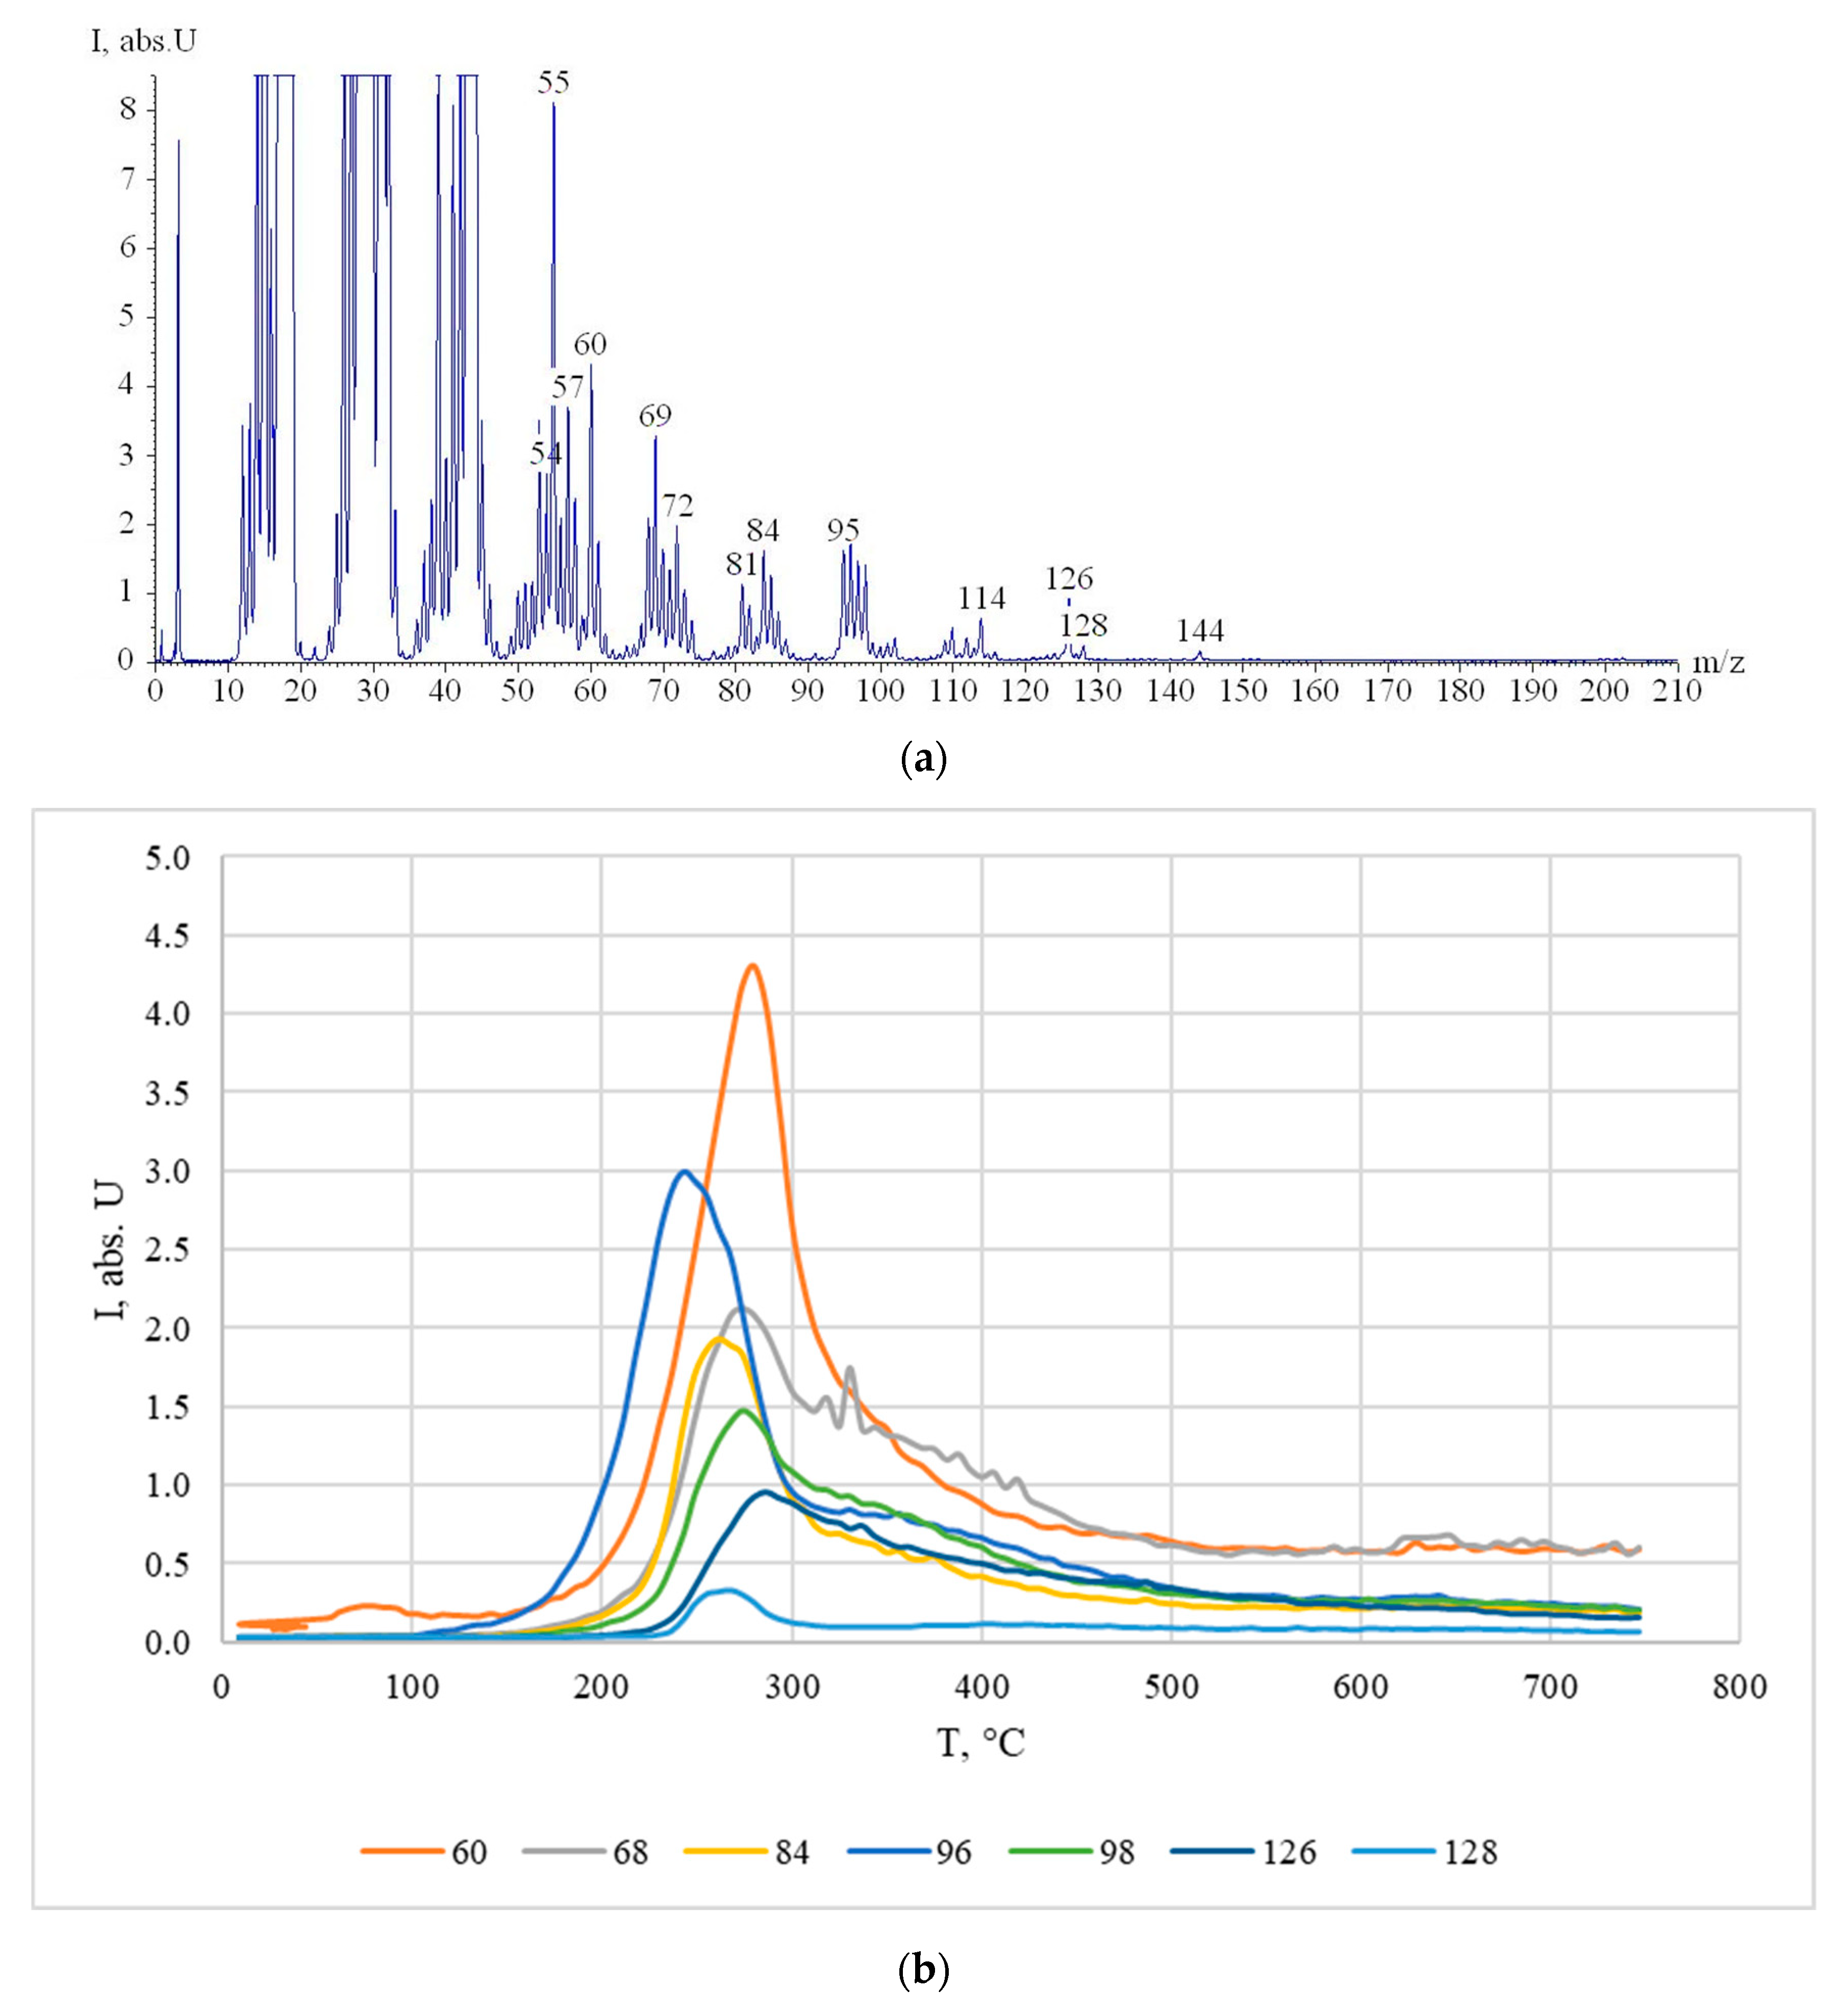
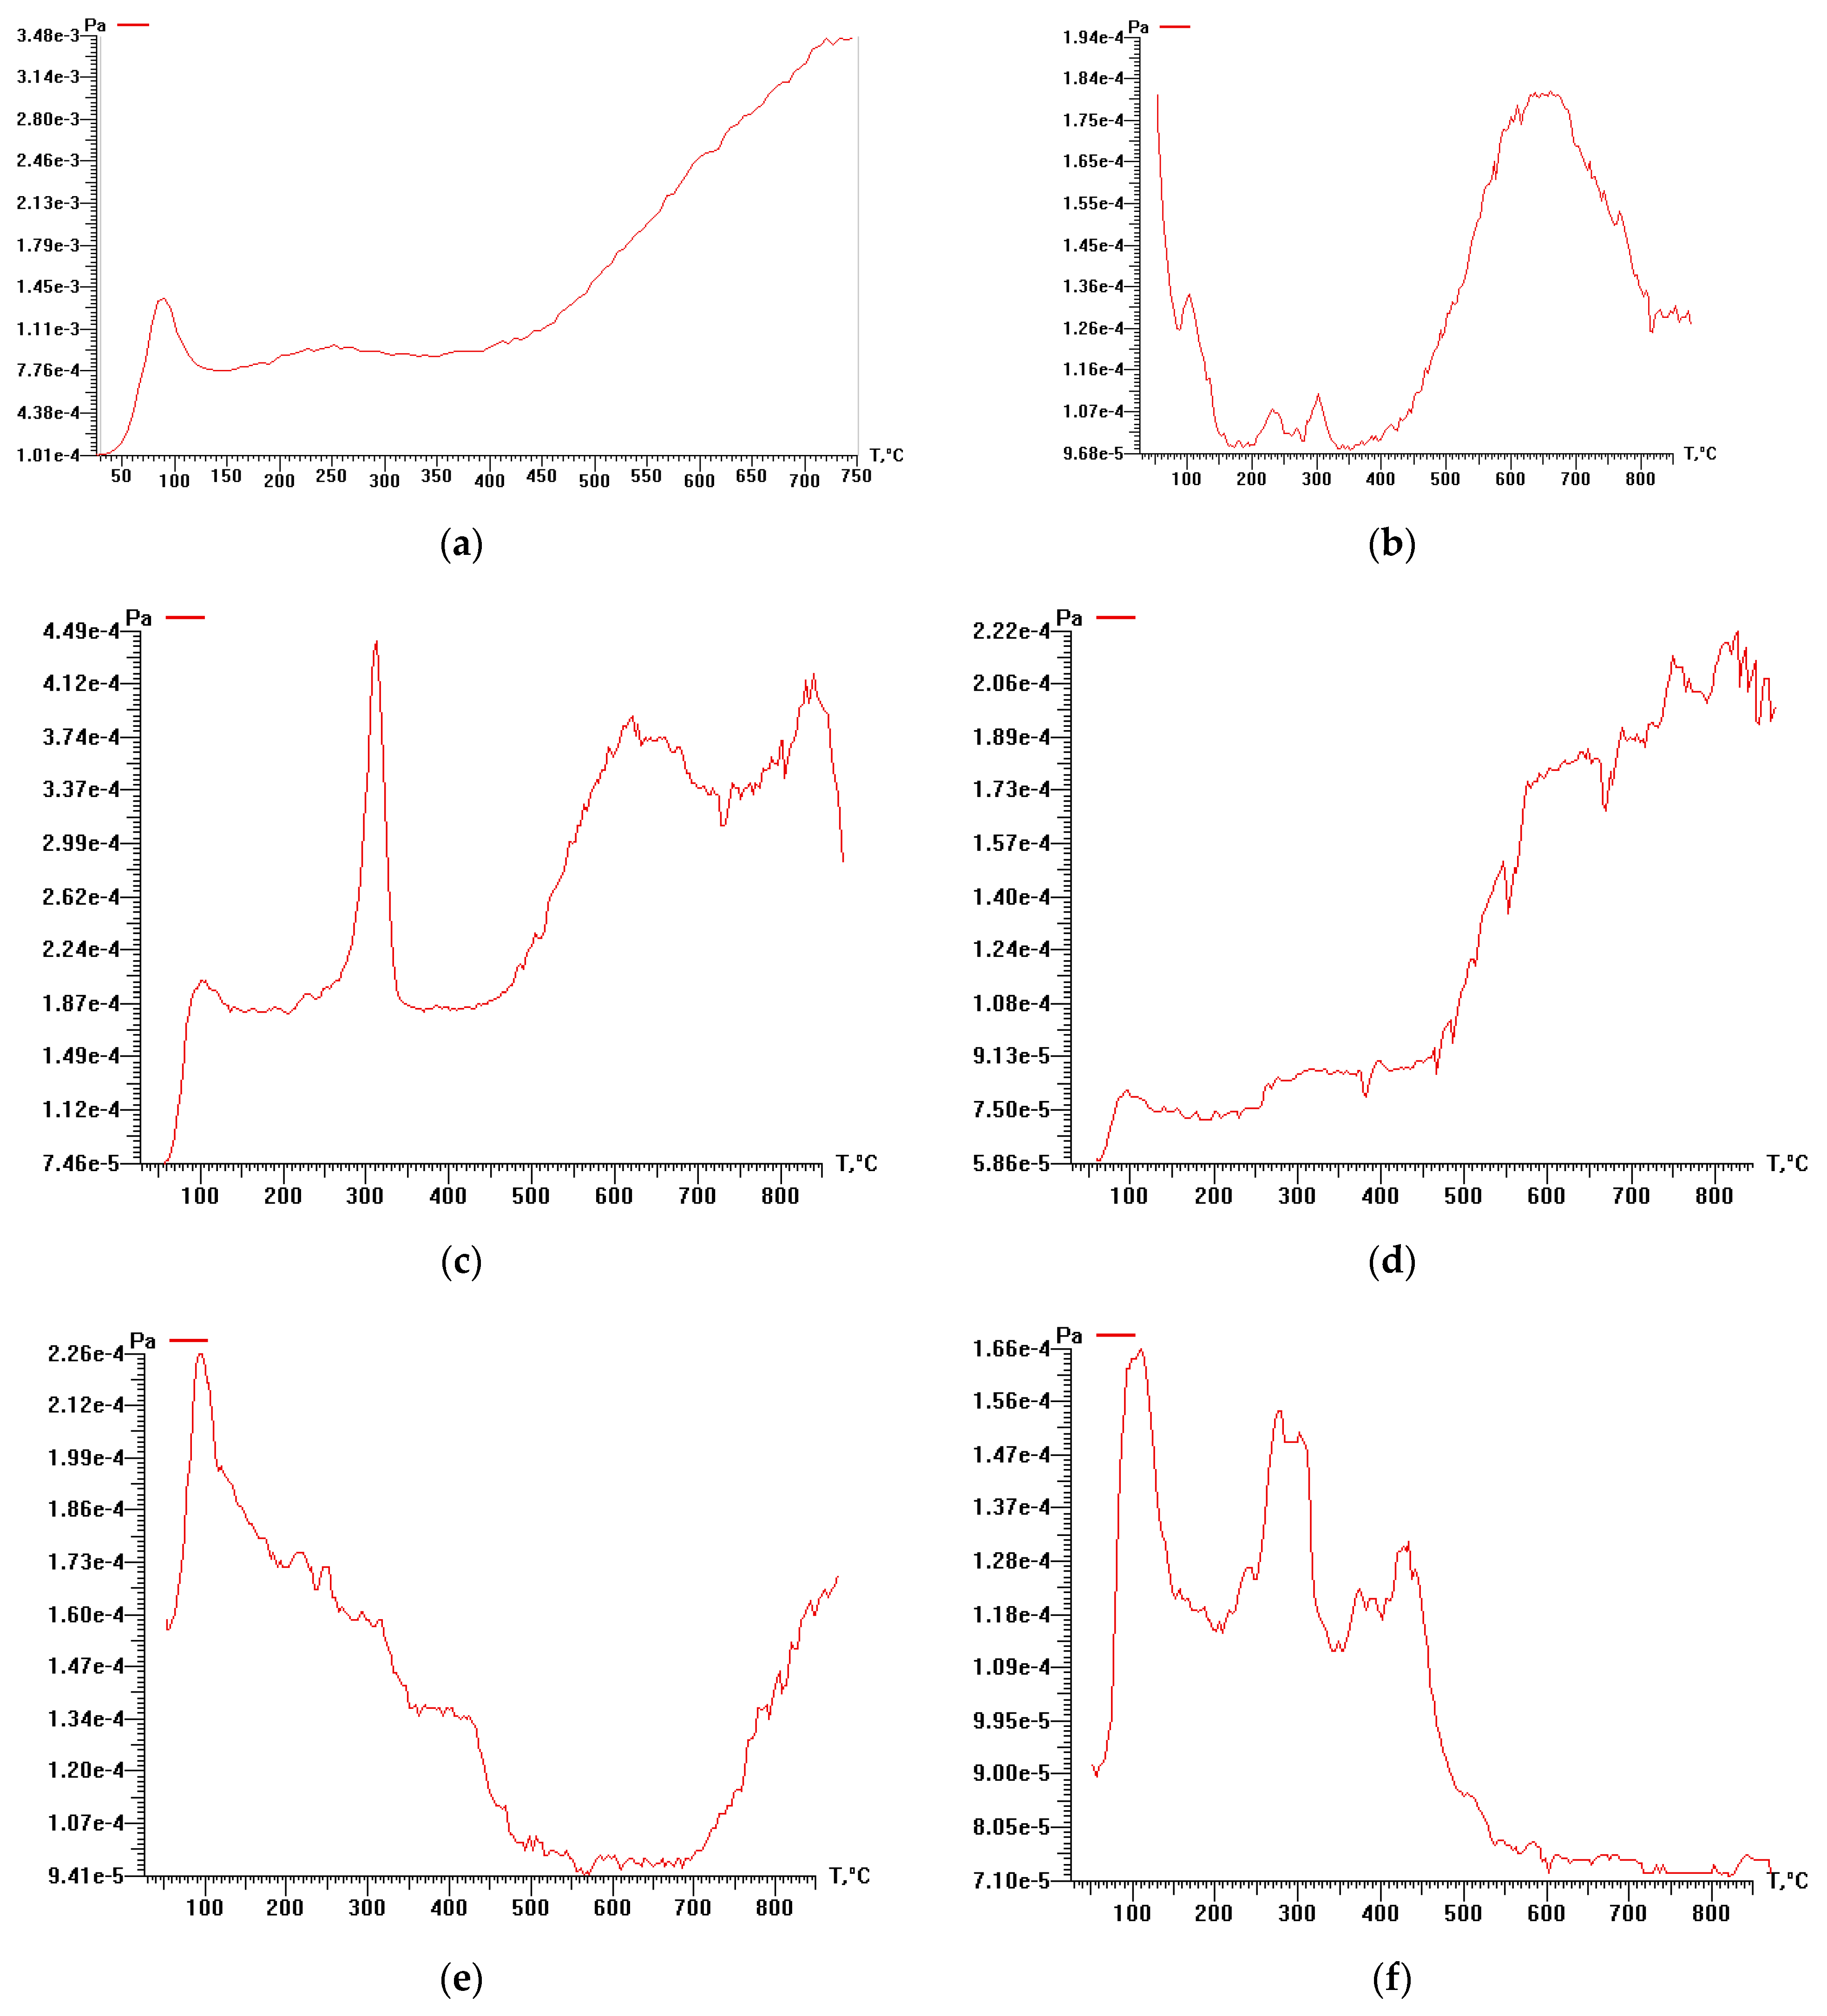
3.3. Study of Cellulose Thermal Degradation in the Process of Carbonization
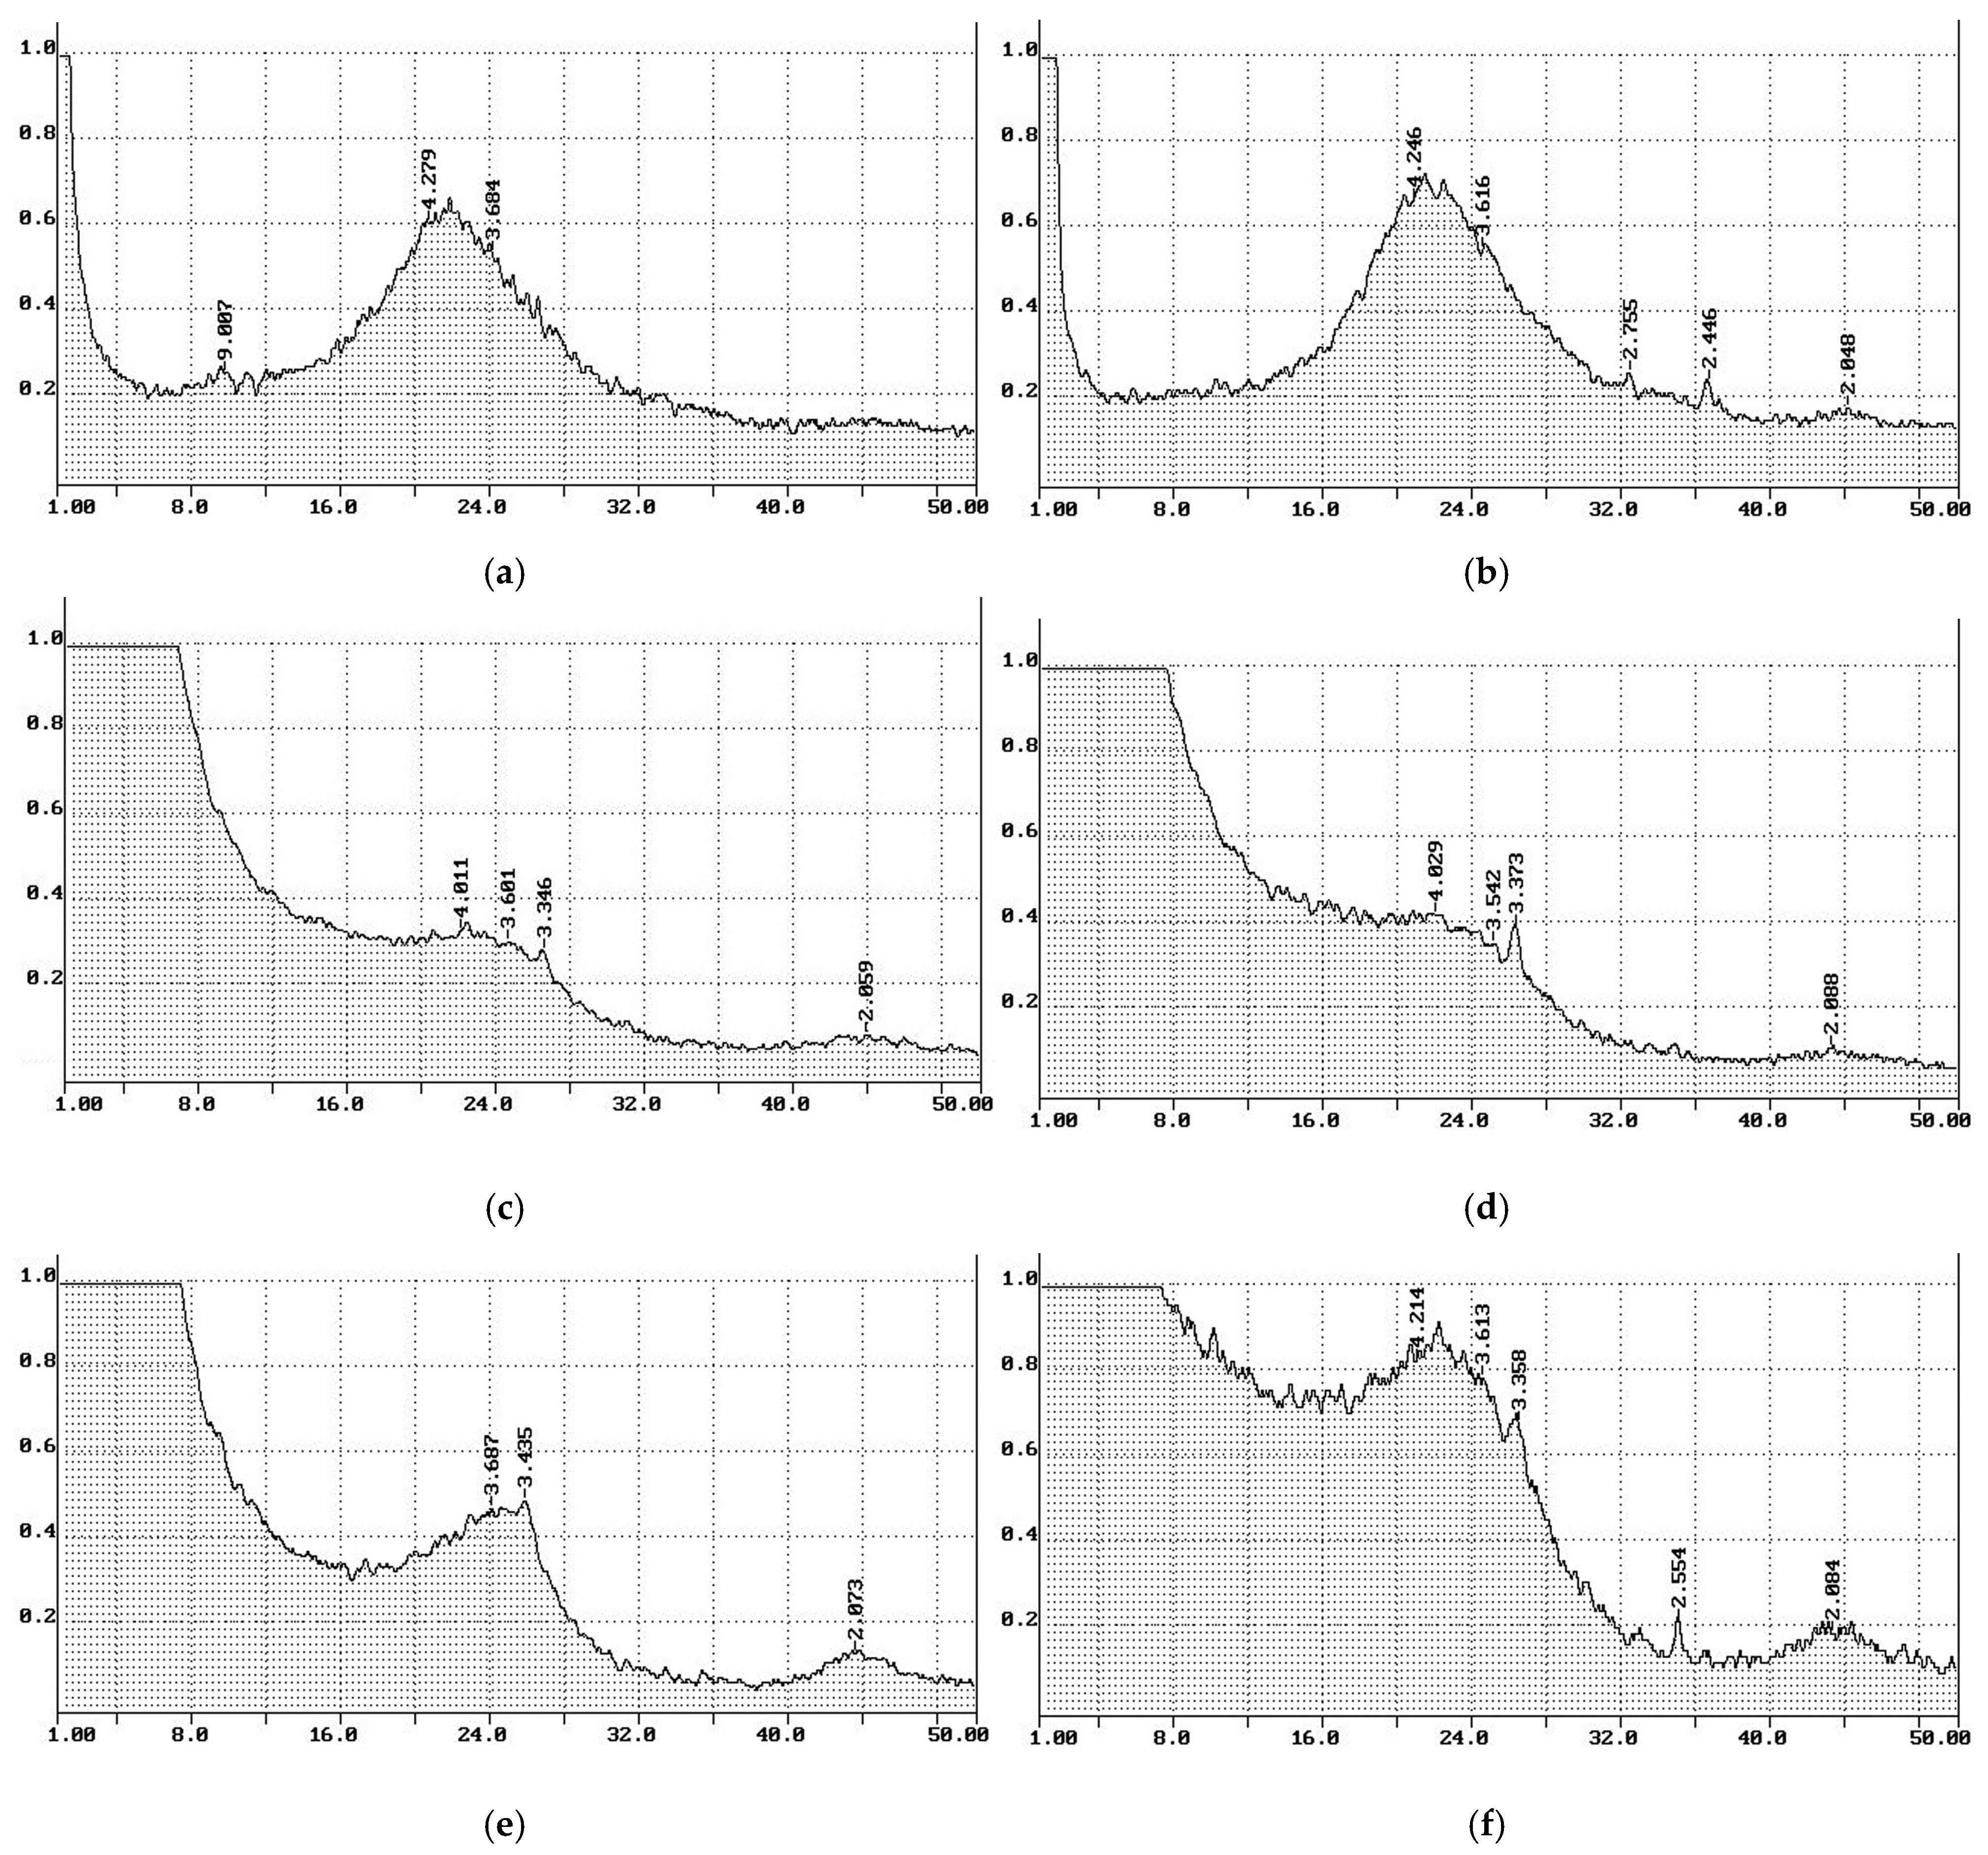
3.4. X-ray Phase Composition of Cellulose and Cellulose-Based Materials
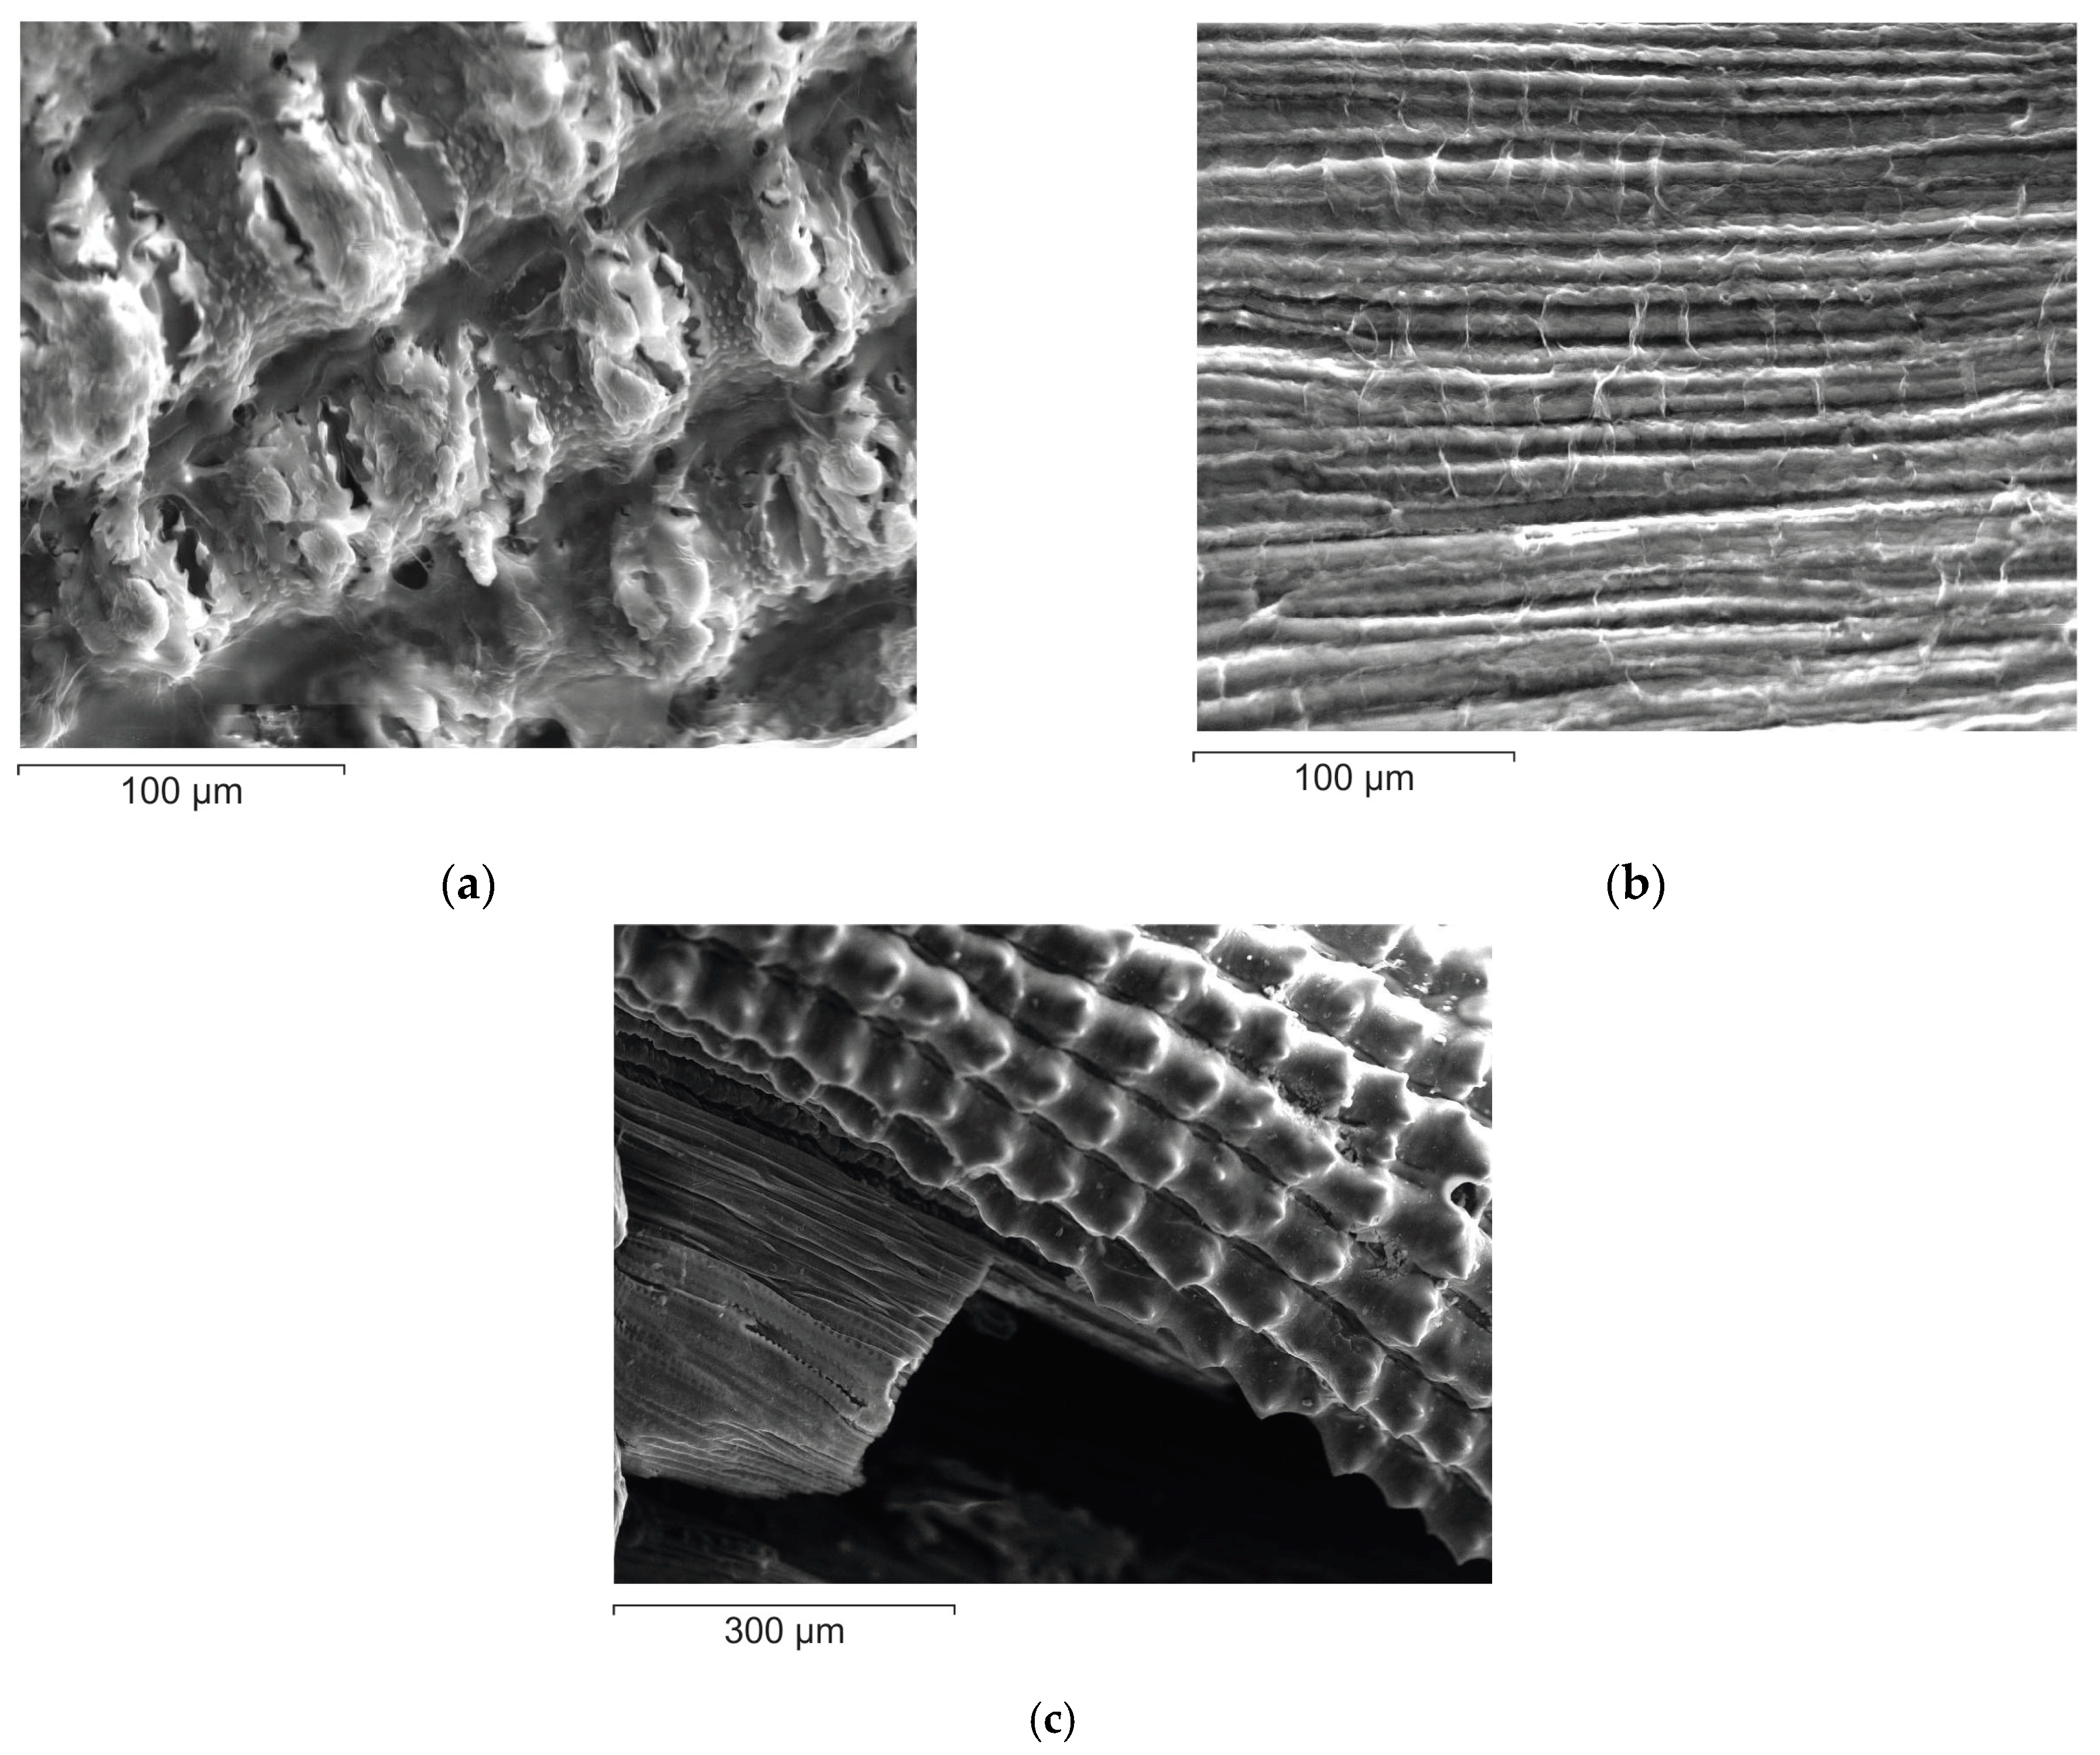
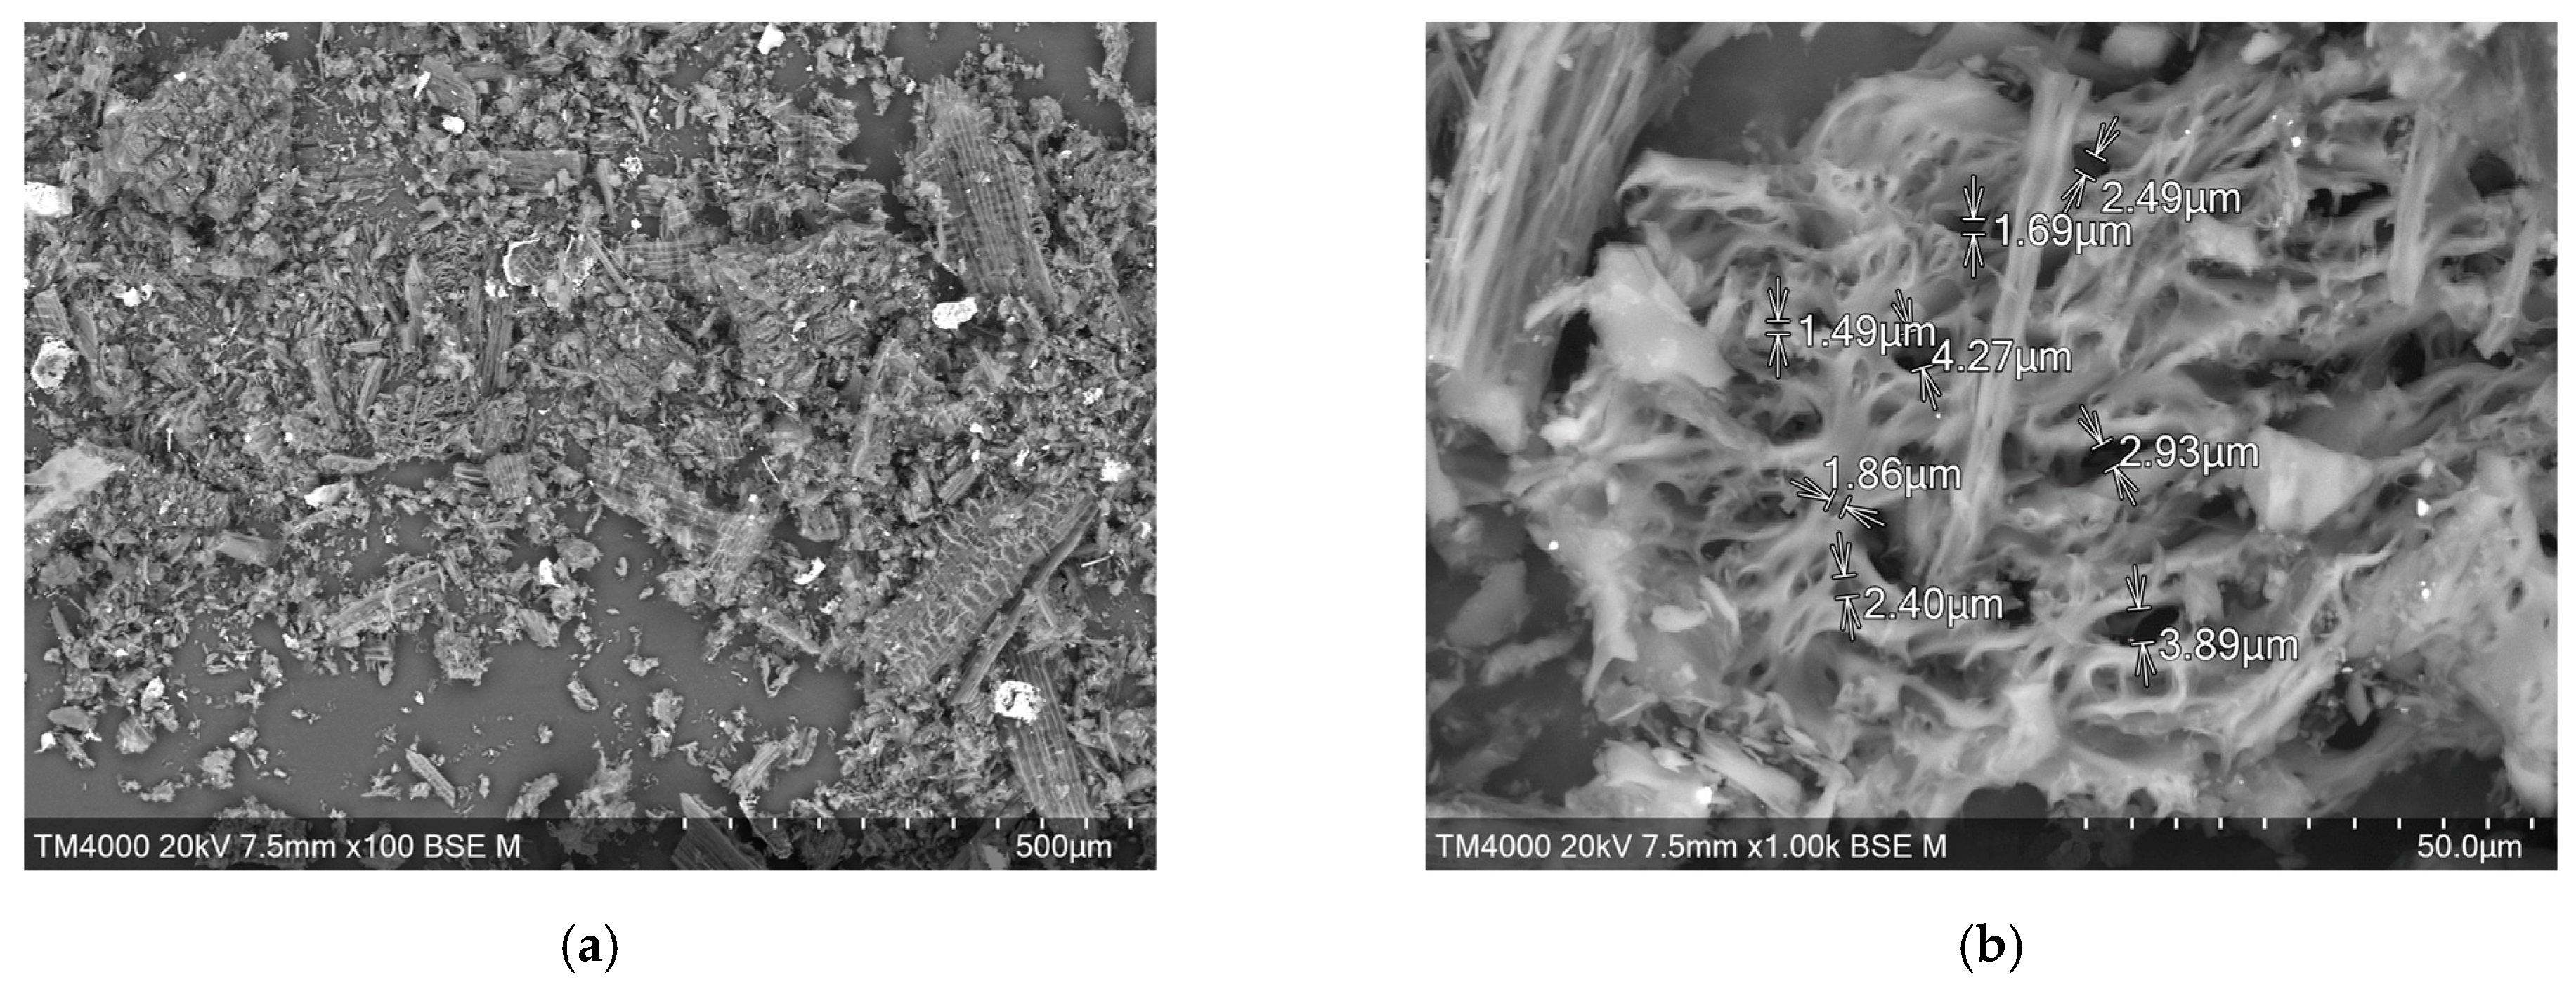
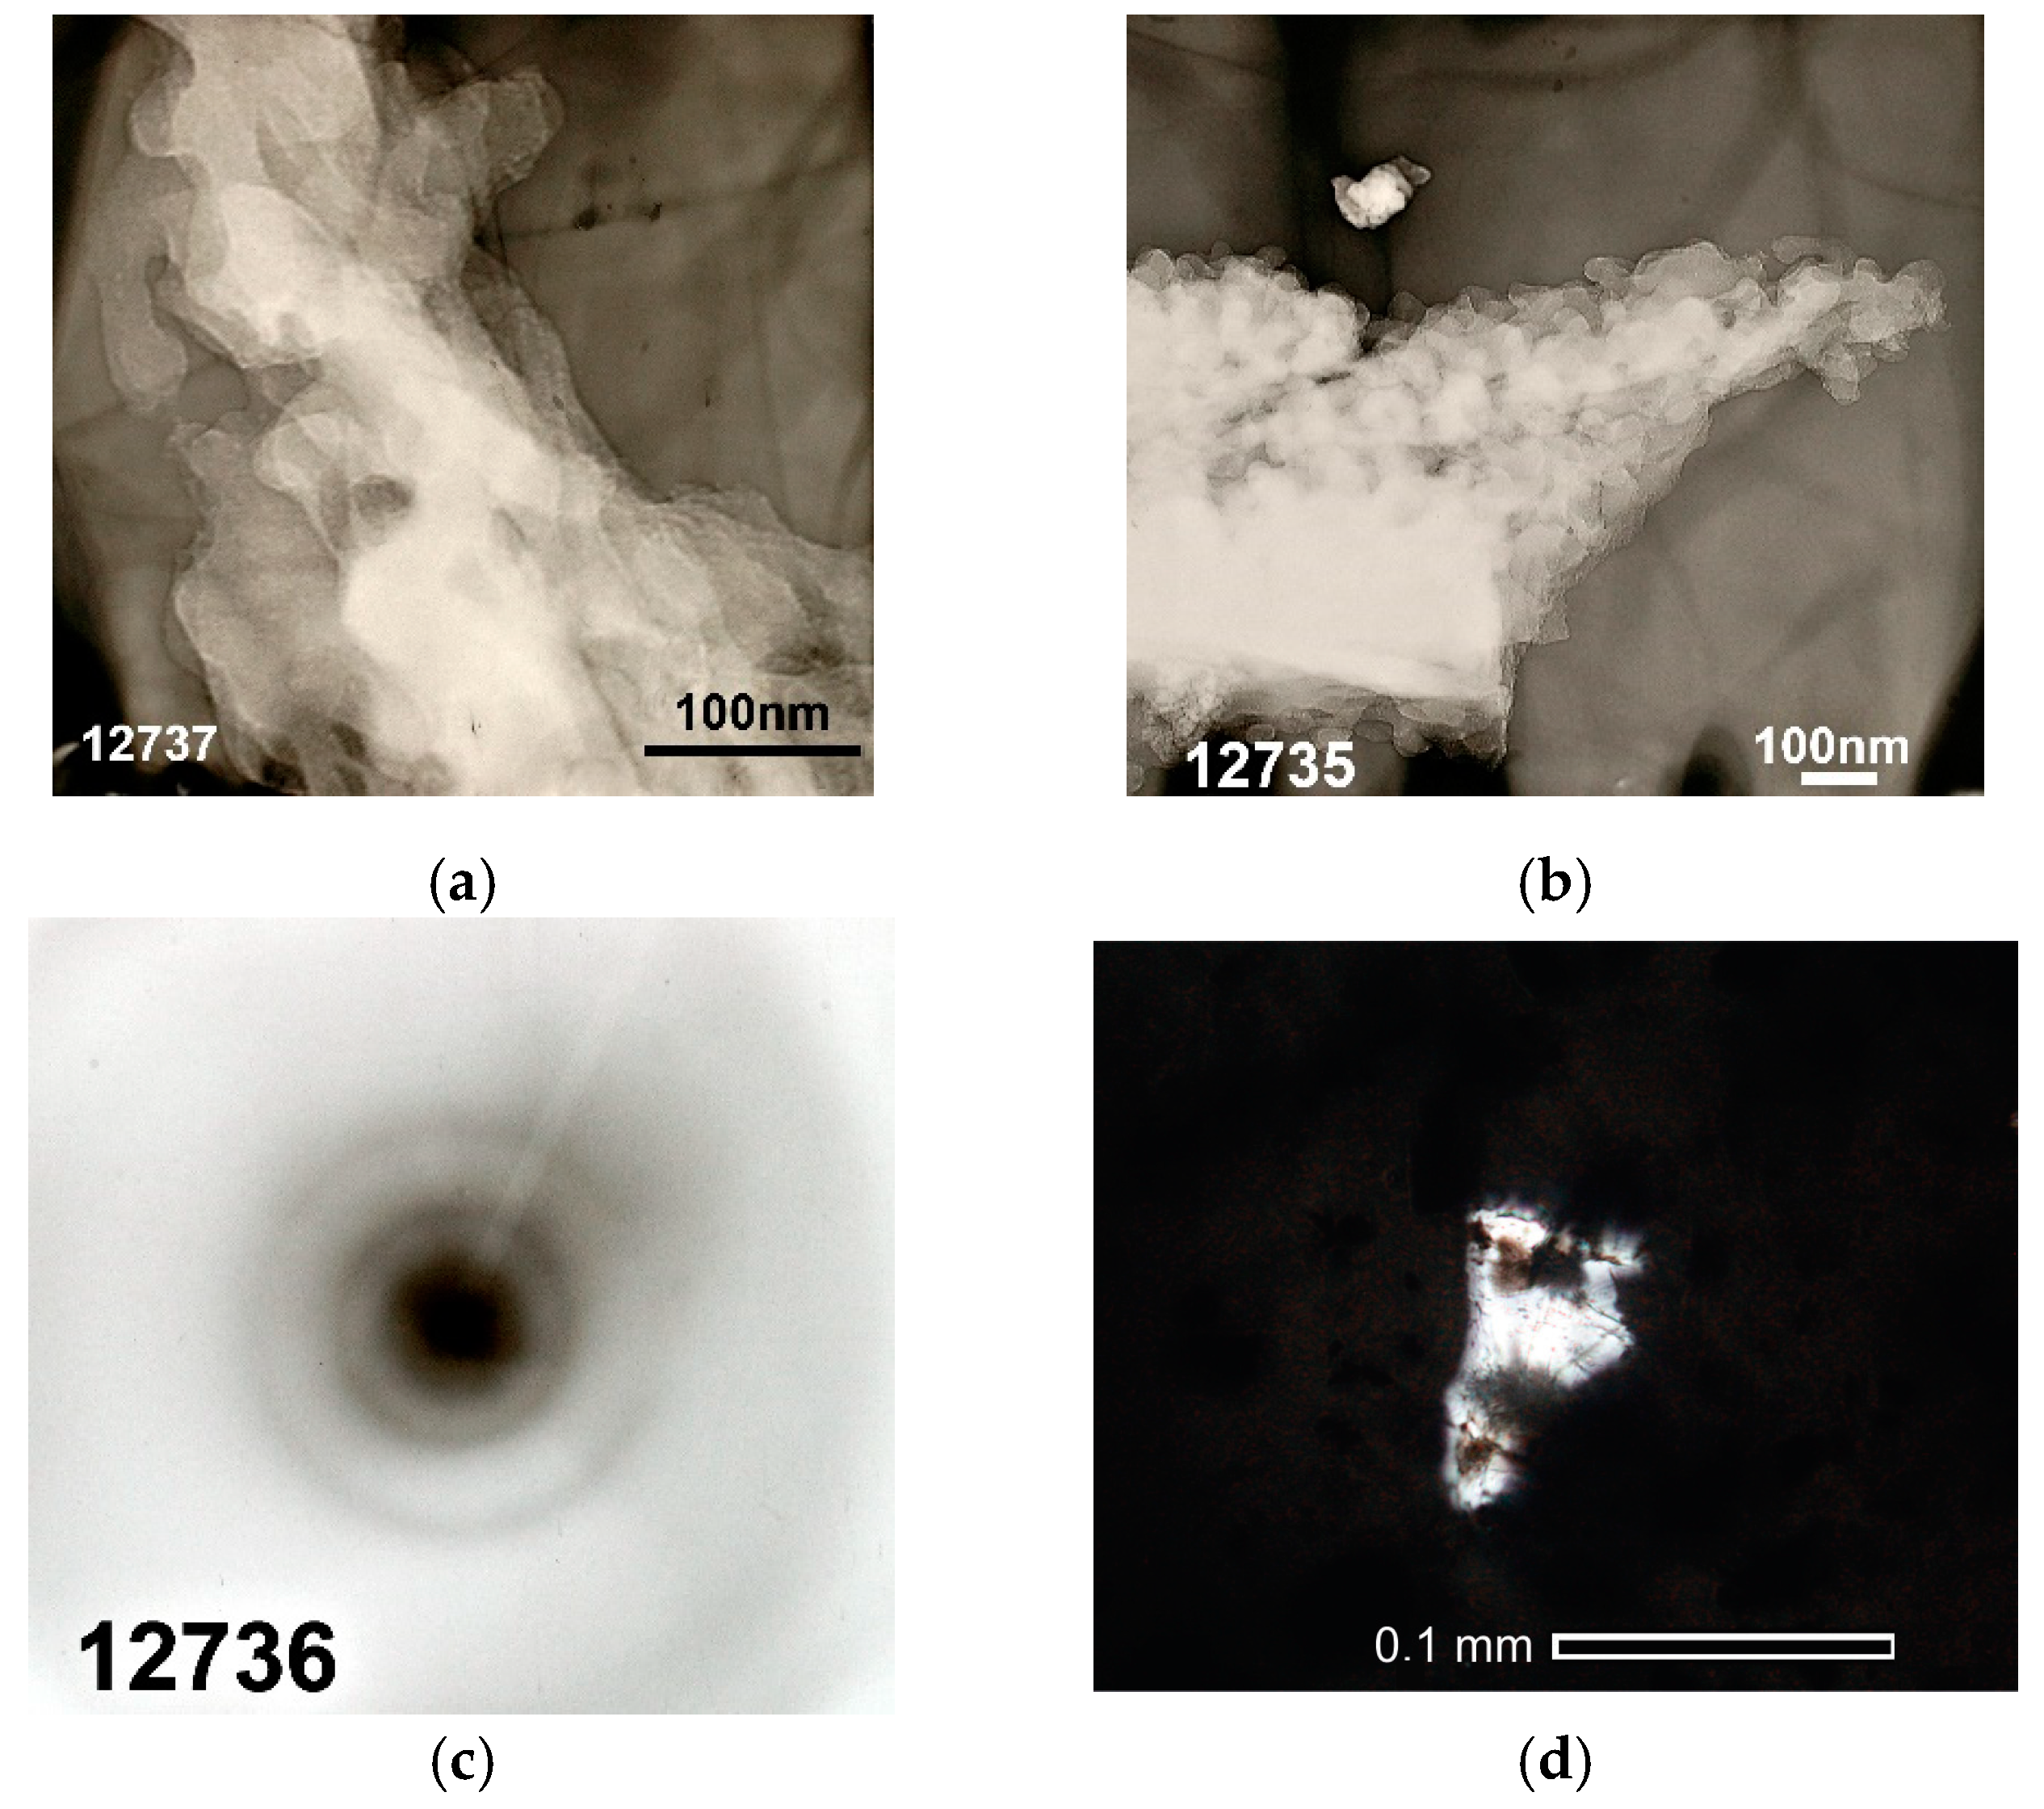
3.5. Structure and Morphology of Cellulose-Based Materials Particles
3.6. Textural Characteristics of Cellulose-Based Materials
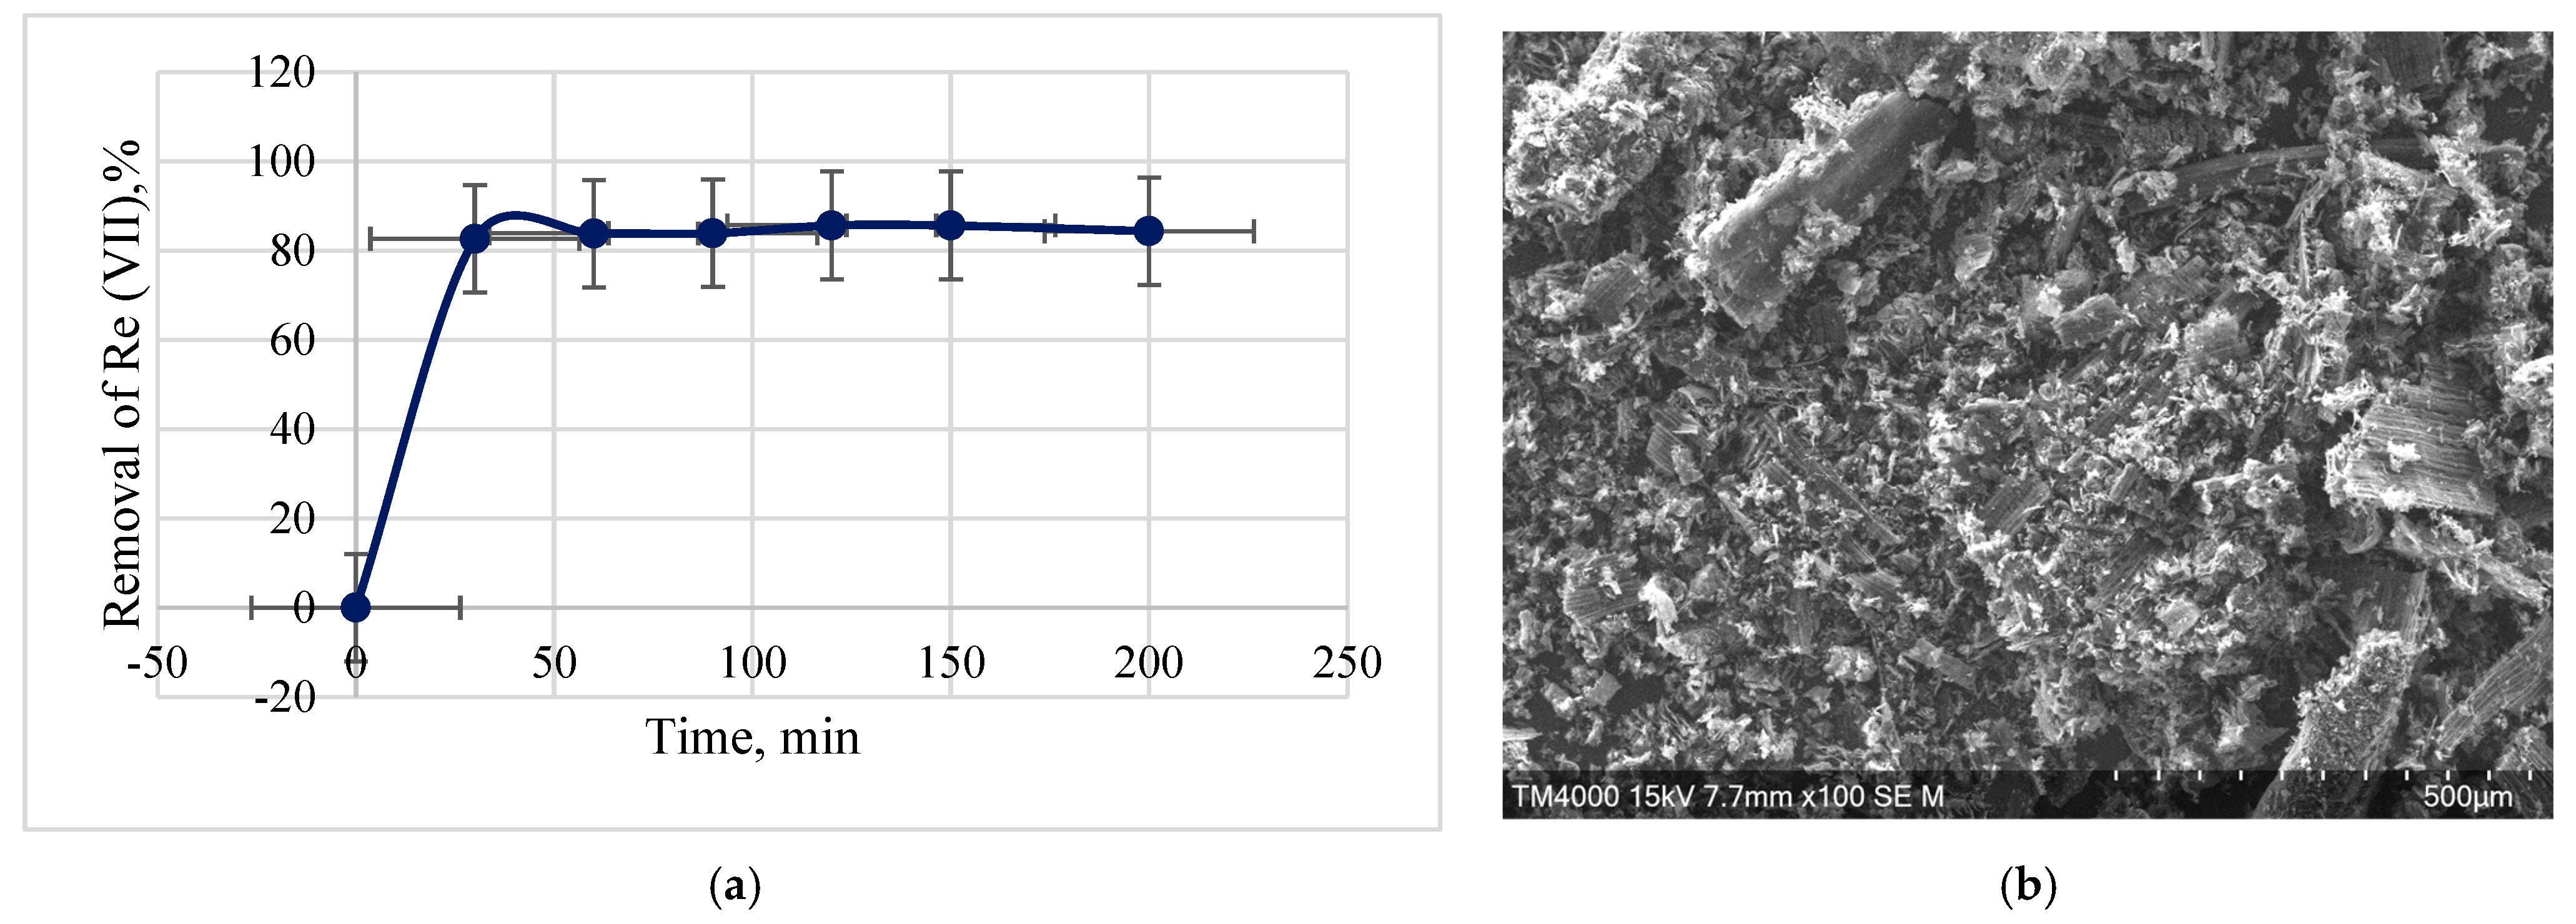
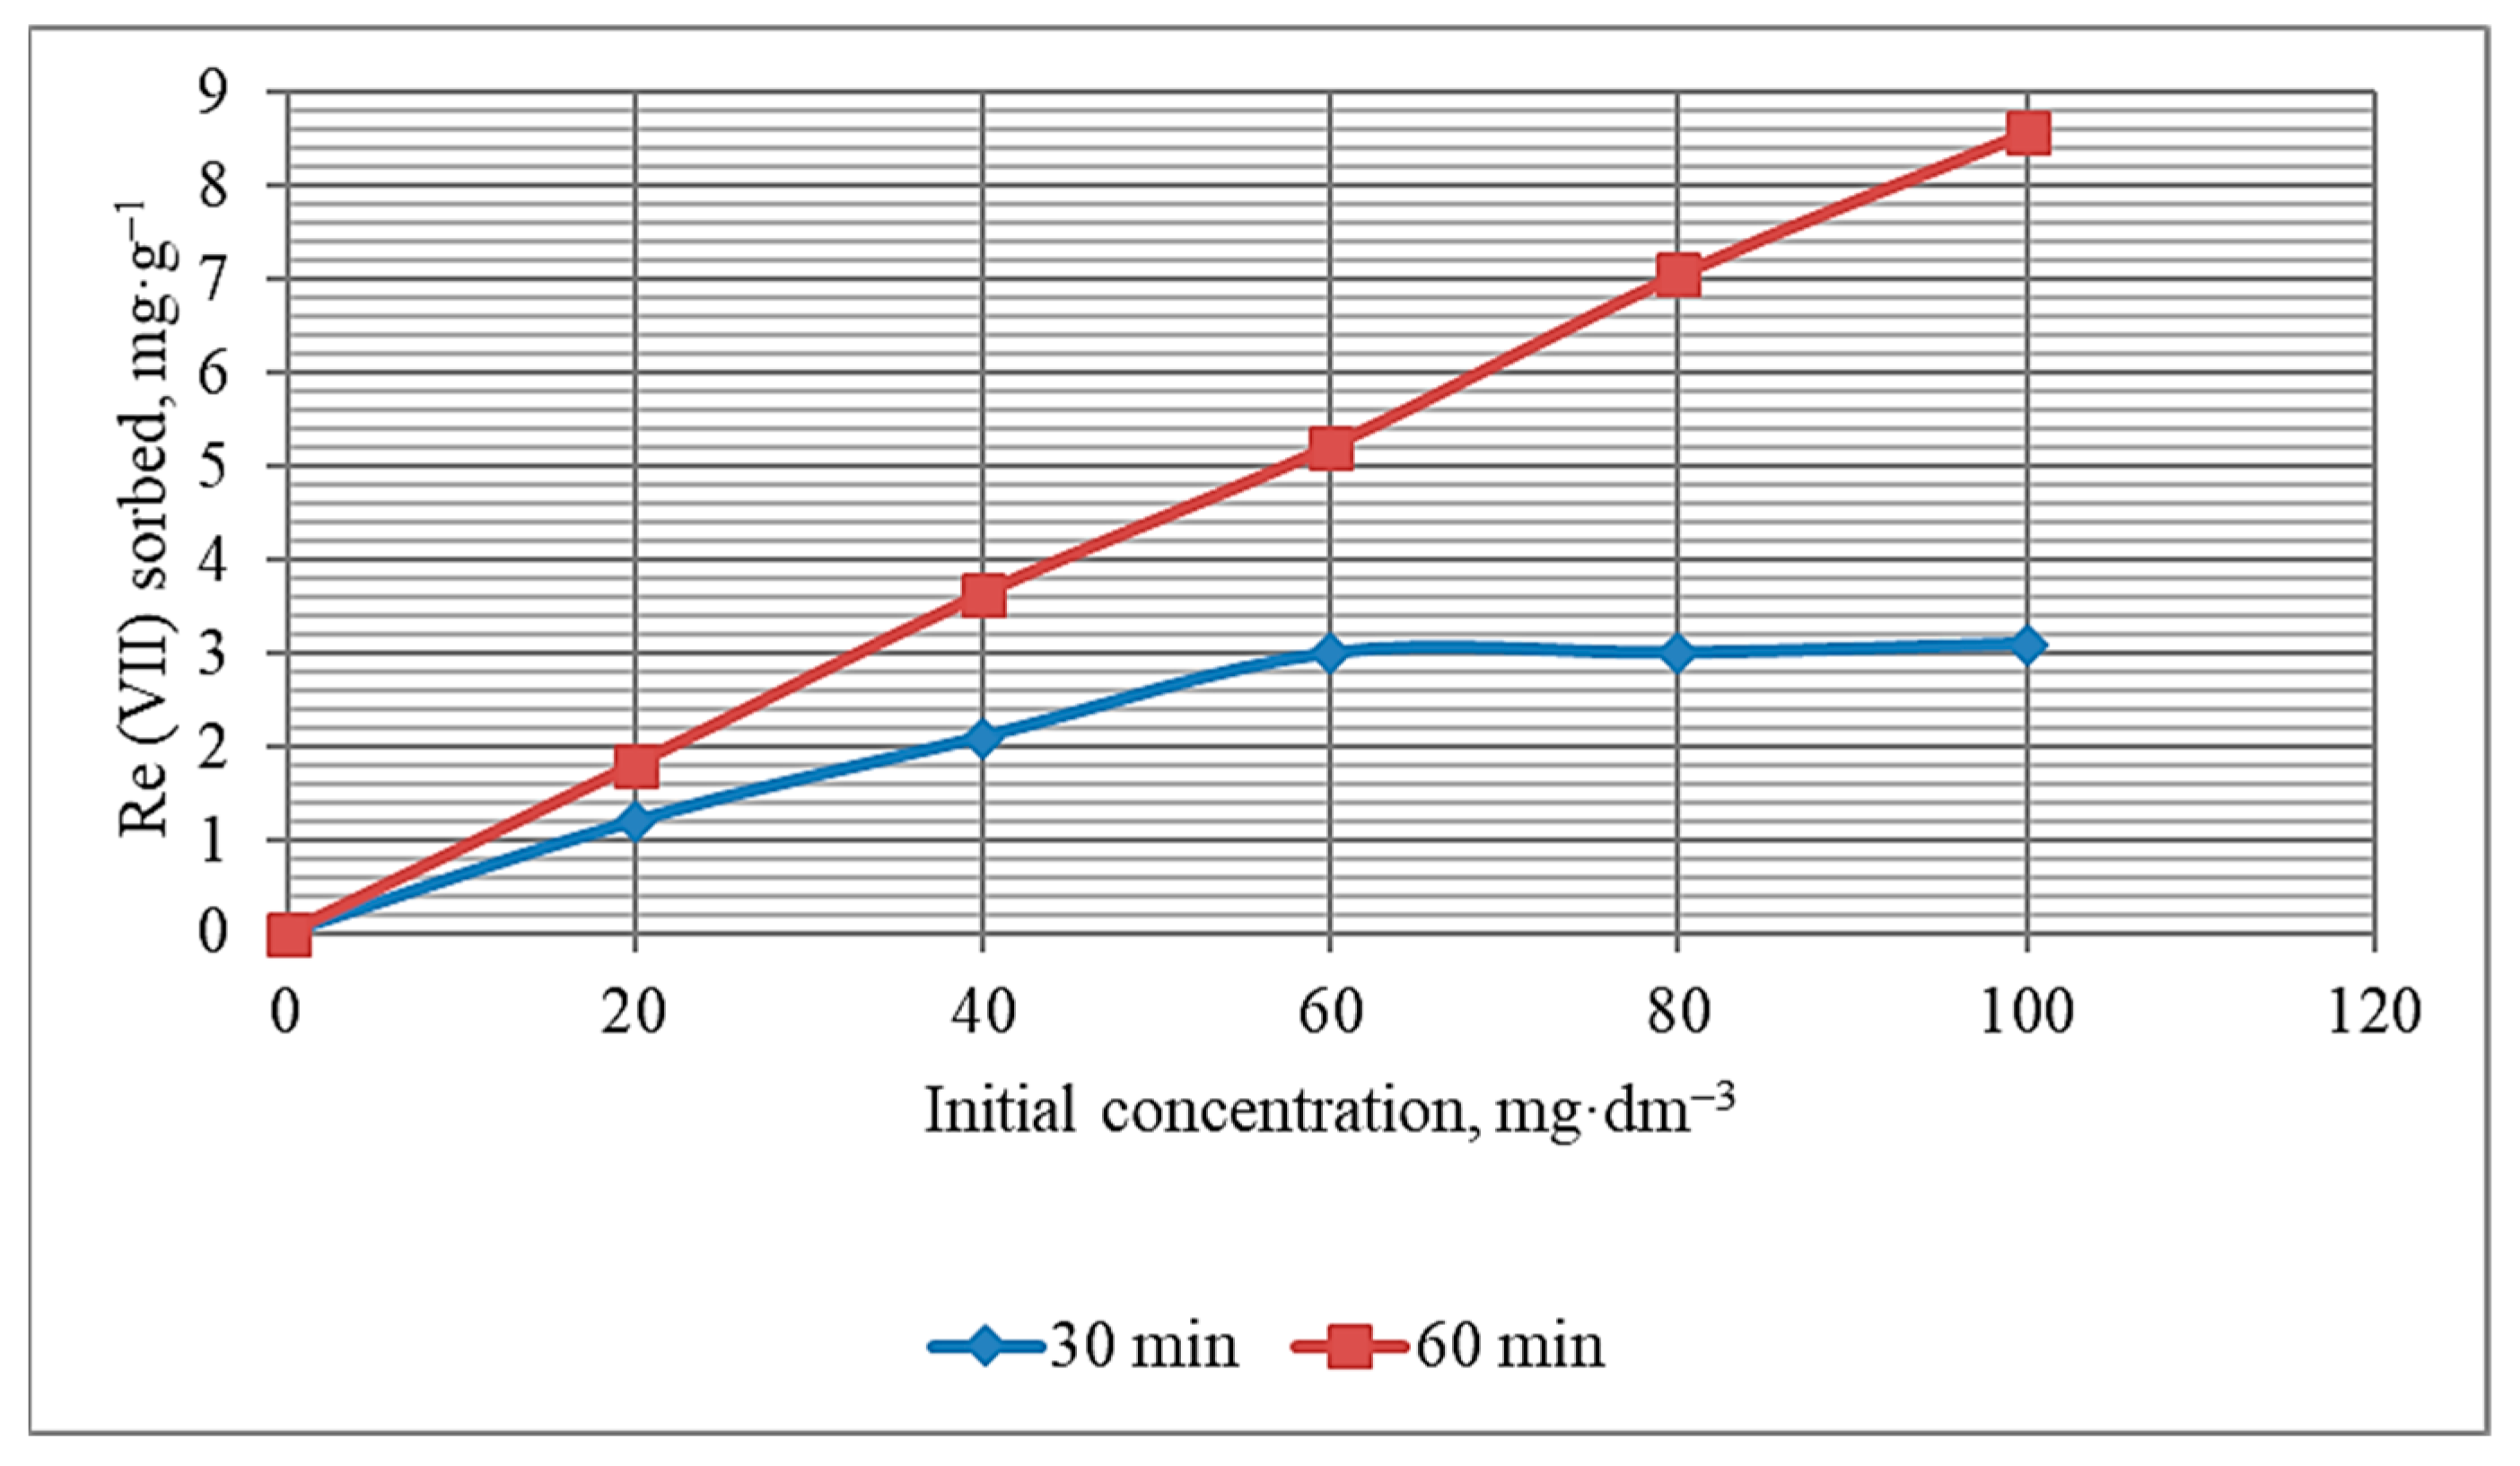
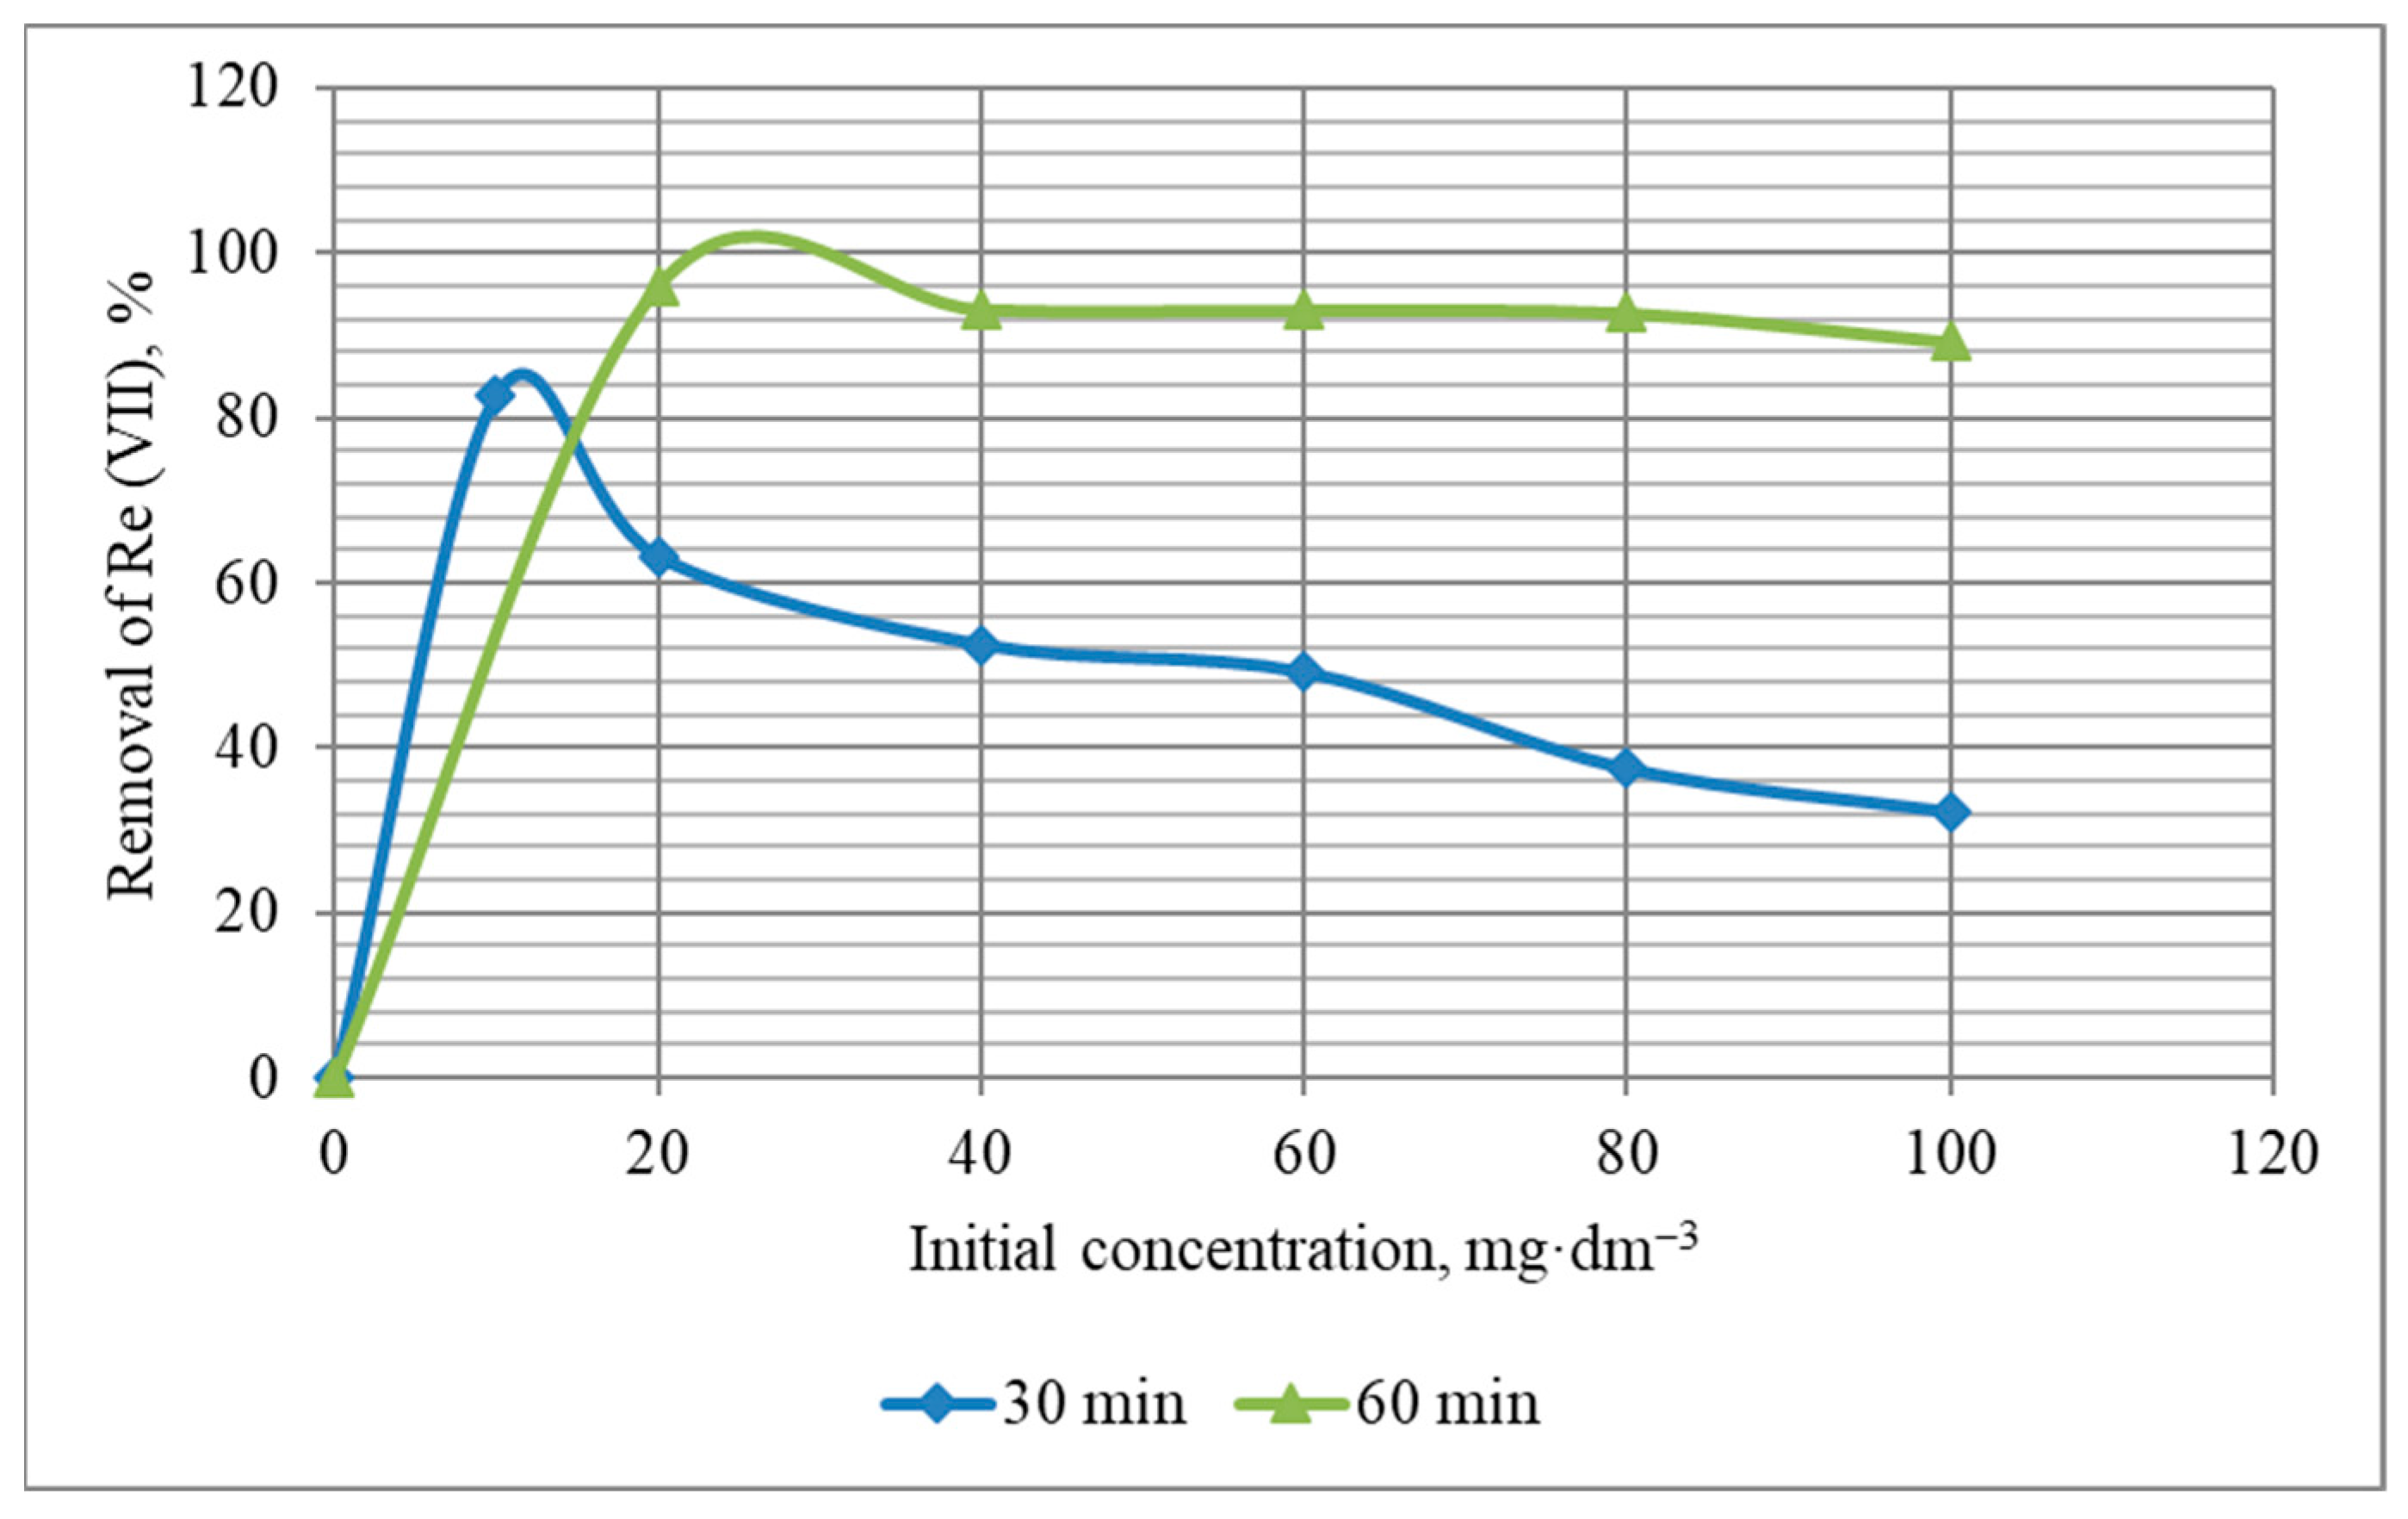
3.7. Rhenium Adsorption Process
4. Discussion
5. Conclusions
Supplementary Materials
Author Contributions
Funding
Institutional Review Board Statement
Informed Consent Statement
Data Availability Statement
Acknowledgments
Conflicts of Interest
References
- Baitov, K. Effective Use of the RM and REM Deposits Will Increase the Inflow of Capital into the Country. Gorn.-Metall. Promyshlennost 2019, 7, 12–17. [Google Scholar]
- Demchenko, M. To Be Rich Tomorrow. Available online: https://kazpravda.kz/n/chtob-byt-bogatymi-zavtra/ (accessed on 21 August 2022).
- Anderson, C.D.; Taylor, P.R.; Anderson, C.G. Extractive Metallurgy of Rhenium: A Review. Miner. Metall. Process. 2013, 30, 59–73. [Google Scholar] [CrossRef]
- Feruza, B.; Abdurassul, Z.; Alma, T.; Alimgazy, S.; Akmaral, S. Extraction of Rhenium and Osmium from Lead Technogenic Raw Materials of Copper Production. Materials 2022, 15, 4071. [Google Scholar] [CrossRef]
- Zhumakynbai, N.; Shaimerden, Z.B.; Berdikulova, F.A.; Ondiris, B.G.; Khamidulla, A.G.; Seidakhmetova, N.M. Extraction of Rhenium from Lead Sludge of Copper Production. J. Eng. 2023, 2023, 8029697. [Google Scholar] [CrossRef]
- Shaimerden, Z.B.; Zhumakynbai, N.; Berdikulova, F.A.; Ondiris, B.G.; Khamidulla, A.G. Review of Methods for Obtaining Rhenium from Man-Made Waste and Secondary Raw Materials. Metallurgist 2022, 66, 1006–1014. [Google Scholar] [CrossRef]
- Berdikulova, F.; Zharmenov, A.; Terlikbayeva, A.; Sydykov, A.; Mazulevskiy, Y. Reduction Smelting of Antimony Concentrate Obtained in the Course of Lead Production. J. Chem. Technol. Metall. 2018, 53, 1001–1008. [Google Scholar] [CrossRef]
- Elutin, V.; Istrashkina, M.V.; Perederreeva, Z.A. Rhenium Recovery from Secondary Raw Materials of Various Types in Rhenium and Rhenium Alloys. JOM 1997, 1, 135–139. [Google Scholar]
- Palant, O.M.; Levchuk, V.A.; Bryukvin, A.M.; Levin, A.M.; Paretskii, V.M. Complex Electrochemical Processing of the Metallic Wastes from a Rhenium-Containing Nickel Superalloy in Sulfuric Acid Electrolytes. Russ. Metall. 2011, 6, 589–593. [Google Scholar] [CrossRef]
- Shen, L.; Tesfaye, F.; Li, X.; Lindberg, D.; Taskinen, P. Review of Rhenium Extraction and Recycling Technologies from Primary and Secondary Resources. Miner. Eng. 2021, 161, 106719. [Google Scholar] [CrossRef]
- Kim, H.S.; Park, J.S.; Seo, S.Y.; Tran, T.; Kim, M.J. Recovery of Rhenium from a Molybdenite Roaster Fume as High Purity Ammonium Perrhenate. Hydrometallurgy 2015, 156, 158–164. [Google Scholar] [CrossRef]
- Drobot, N.F.; Kupriyanova, T.A.; Krenev, V.A.; Filippov, M.N. Rhenium and Platinum Recovery from Platinum and Rhenium Catalysts Used. Theor. Found. Chem. Eng. 2009, 43, 539–543. [Google Scholar] [CrossRef]
- Rabinovich, M.; Fedoryak, O.; Dobele, G.; Andersone, A.; Gawdzik, B.; Lindstrom, M.; Sevastyanova, O. Carbon Adsorbents from Industrial Hydrolysis Lignin: The USSR/Eastern European Experience and its Importance for Modern Biorefineries. Renew. Sustain. Energy Rev. 2016, 57, 1008–1024. [Google Scholar] [CrossRef]
- Ahmaruzzaman, M. Industrial Wastes as Low-Cost Potential Adsorbents for the Treatment of Wastewater Laden With Heavy Metals. Adv. Colloid Interface Sci. 2011, 166, 36–59. [Google Scholar] [CrossRef]
- Mondal, M.K.; Garg, R. A Comprehensive Review on Removal of Arsenic Using Activated Carbon Prepared from Easily Available Waste Materials. Environ. Sci. Pollut. Res. 2017, 24, 13295–13306. [Google Scholar] [CrossRef]
- Braghiroli, F.L.; Bouafif, H.; Neculita, C.M.; Koubaa, A. Activated Biochar as an Effective Sorbent for Organic and Inorganic Contaminants in Water. Water Air Soil Pollut. 2018, 229, 230. [Google Scholar] [CrossRef]
- Al-Rashdi, B.; Somerfield, C.; Hilal, N. Heavy Metals Removal Using Adsorption and Nanofiltration Techniques. Sep. Purif. Rev. 2011, 40, 209–259. [Google Scholar] [CrossRef]
- Seilkhanova, A.; Rakhym, A.; Csavdar, A. Preliminary Assessment of Modified Kazakh Natural Zeolites as Possible Sorbents for MnO4− Removal from Aqueous Solutions. Stud. Univ. Babes-Bolyai Chem. 2018, 4, 181–192. [Google Scholar] [CrossRef]
- Panova, Y.; Aubakirov, Y.; Arbag, H. Selection of Sorption Materials for the Extraction of Nickel and Cobalt from the Ore of the Gornostaevskoye Deposit. Chem. Bull. Kaz. Nat. Univ. 2021, 102, 5–12. [Google Scholar] [CrossRef]
- Panova, Y.N.; Abzhan, Y.O.; Zhussupova, A.K. The Effect of Anionic Impurities on the Sorption Extraction of Molybdenum from Leaching Solutions. Vestn. KazNU. Chem. Ser. 2020, 2, 4–9. [Google Scholar] [CrossRef]
- Pipiska, M.; Zarodnanska, S.; Hornik, M.; Duriska, L.; Holub, M.; Safarik, I. Magnetically Functionalized Moss Biomass as Biosorbent for Efficient Co2+ Ions and Thioflavin T Removal. Materials 2020, 13, 3619. [Google Scholar] [CrossRef]
- Wang, Q.; Jiang, F.; Ouyang, X.-K.; Yang, L.Y.; Wang, Y. Adsorption of Pb(II) from Aqueous Solution by Mussel Shell-Based Adsorbent: Preparation, Characterization, and Adsorption Performance. Materials 2021, 14, 741. [Google Scholar] [CrossRef]
- Suranek, M.; Melichova, Z.; Kurekova, V.; Kljajević, L.; Nenadović, S. Removal of Nickel from Aqueous Solutions by Natural Bentonites from Slovakia. Materials 2021, 14, 282. [Google Scholar] [CrossRef]
- Zinicovscaia, I.; Yushin, N.; Grozdov, D.; Vergel, K.; Popova, N.; Artemiev, G.; Safonov, A. Metal Removal from Nickel-Containing Effluents Using Mineral–Organic Hybrid Adsorbent. Materials 2020, 13, 4462. [Google Scholar] [CrossRef]
- Zinicovscaia, I.; Yushin, N.; Abdusamadzoda, D.; Grozdov, D.; Shvetsova, M. Efficient Removal of Metals from Synthetic and Real Galvanic Zinc–Containing Effluents by Brewer’s Yeast Saccharomyces cerevisiae. Materials 2020, 13, 3624. [Google Scholar] [CrossRef]
- Kolodynska, D.; Fila, D.; Hubiki, Z. Evaluation of Possible Use of the Macroporous Ion Exchanger in the Adsorption Process of Rare Earth Elements and Heavy Metal Ions from Spent Batteries Solutions. Chem. Eng. Process. Process Intensif. 2020, 147, 107767. [Google Scholar] [CrossRef]
- Anastopoulos, I.; Bhatnagar, A.; Lima, E.C. Adsorption of Rare Earth Metals: A Review of Recent Literature. J. Mol. Liq. 2016, 221, 954–962. [Google Scholar] [CrossRef]
- Khabiyev, A.; Baigenzhenov, O.; Korganbayeva, Z.; Toishybek, A.; Chepushtanova, T.; Orynbayev, B. Niobium(V) Recovery from Leaching Solution of Titanium Wastes: Kinetic Studies. Metalurgija 2022, 61, 793–796. [Google Scholar]
- Tamer, H.A.; Salwa, A.; Taghreed, B. Nano-chamomile Waste as a Low-cost Biosorbent for Rapid Removal of Heavy Metal Ions from Natural Water Samples. Egypt. J. Chem. 2023, 62, 1337–1353. [Google Scholar] [CrossRef]
- Sostaric, T.D.; Petrovic, M.S.; Pastor, F.T.; Loncarevic, D.R.; Petrovic, J.T.; Milojkovic, J.V.; Stojanovic, M.D. Study of Heavy Metals Biosorption on Native and Alkali-Treated Apricot Shells and Its Application in Wastewater Treatment. J. Mol. Liq. 2018, 259, 340–349. [Google Scholar] [CrossRef]
- Salishcheva, O.V.; Tarasova, Y.V.; Lashitskiy, S.S.; Moldagulova, N.E. Analysis of Kinetic and Equilibrium Adsorption of Heavy Metals by Natural Materials. IOP Conf. Ser. Earth Environ. Sci. 2021, 640, 062007. [Google Scholar] [CrossRef]
- Toniazzo, L.; Fierro, V.; Braghiroli, F.; Amaral, G.; Celzard, A. Biosorption of Model Pollutants in Liquid Phase on Raw and Modified Rice Husks. J. Phys. Conf. Ser. 2013, 416, 012026. [Google Scholar] [CrossRef]
- Yakovlev, V.A.; Yeletsky, P.M.; Lebedev, M.Y.; Ermakov, D.Y.; Parmon, V.N. Preparation and Investigation of Nanostructured Carbonaceous Composites from the High-Ash Biomass. Chem. Eng. J. 2007, 134, 246–255. [Google Scholar] [CrossRef]
- Crombie, K.; Masek, O.; Sohi, S.P.; Brownsort, P.; Cross, A. The Effect of Pyrolysis Conditions on Biochar Stability as Determined by Three Methods. GCB Bioenergy 2012, 5, 122–131. [Google Scholar] [CrossRef]
- Shaheen, S.M.; Antoniadis, V.; Shahid, M.; Yang, Y.; Abdelrahman, H.; Zhang, T.; Hassan, N.E.E.; Bibi, I.; Niazi, N.K.; Younis, S.A.; et al. Sustainable Applications of Rice Feedstock in Agro-Environmental and Construction Sectors: A Global Perspective. Renew. Sustain. Energy Rev. 2022, 153, 111791. [Google Scholar] [CrossRef]
- Hashmi, Z.; Jatoy, A.; Nadeem, S.; Anjum, A.; Imam, M.; Jangda, H. Comparative Analysis of Conventional to Biomass-Derived Adsorbent for Wastewater Treatment: A Review. Biomass Convers. Biorefinery 2022, 12, 1–32. [Google Scholar] [CrossRef]
- Majumdar, S.; Mandal, P.K.; Das, S.K.; Majumdar, R. Metal Impregnated Silica-Carbon Materials from Rice Husk: A Versatile Sorbent for Toxic Organics and Inorganics in Water and Air. CLEAN Soil Air Water 2012, 41, 291–297. [Google Scholar] [CrossRef]
- Lv, J.L.; Zhai, S.R.; Wang, Z.Z.; Lei, Z.M.; An, Q.D. Carbon–Silica Composite Bio-Sorbents with a High Density of Oxygen-Containing Sites for Efficient Methylene Blue Adsorption. Res. Chem. Intermed. 2015, 42, 839–854. [Google Scholar] [CrossRef]
- Scapin, E.; Maciel, G.P.; Polidoro, A.D.; Lazzari, E.; Benvenutti, E.V.; Falcade, T.; Jacques, R. Activated Carbon from Rice Husk Biochar with High Surface Area. Activated Carbon from Rice Husk Biochar with High Surface Area. Biointerface Res. Appl. Chem. 2021, 11, 10265–10277. [Google Scholar] [CrossRef]
- Nowrouzi, M.; Behin, J.; Younesi, H.; Bahramifar, N.; Charpentier, P.A.; Rohani, S. An Enhanced Counter-Current Approach Towards Activated Carbon from Waste Tissue with Zero Liquid Discharge. Chem. Eng. J. 2017, 326, 934–944. [Google Scholar] [CrossRef]
- Kovacova, Z.; Demcak, S.; Balintova, M.; Pla, C.; Zinicovscaia, I. Influence of Wooden Sawdust Treatments on Cu(II) and Zn(II) Removal from Water. Materials 2020, 13, 3575. [Google Scholar] [CrossRef]
- Fristák, V.; Bošanská, D.; Pipiska, M.; Duriska, L.; Bell, S.M.; Soja, G. Physicochemical Characterization of Cherry Pits-Derived Biochar. Materials 2022, 15, 408. [Google Scholar] [CrossRef] [PubMed]
- Mandal, S.; Marpu, S.B.; Omary, M.A.; Dinulescu, C.C.; Prybutok, V.; Shi, S.Q. Lignocellulosic-Based Activated Carbon-Loaded Silver Nanoparticles and Chitosan for Efficient Removal of Cadmium and Optimization Using Response Surface Methodology. Materials 2022, 15, 8901. [Google Scholar] [CrossRef]
- Awwad, N.S.; Gad, H.H.; Ahmad, M.I.; Aly, H.F. Sorption of Lanthanum and Erbium from Aqueous Solution by Activated Carbon Prepared from Rice Husk. Colloids Surf. B: Biointerfaces 2010, 81, 593–599. [Google Scholar] [CrossRef]
- Zafar, S.; Khan, M.I.; Khraisheh, M.; Shahida, S.; Javed, T.; Mirza, M.L.; Khalid, N. Use of Rice Husk as an Effective Sorbent for the Removal of Cerium Ions from Aqueous Solution: Kinetic, Equilibrium and Thermodynamic Studies. Desalination Water Treat. 2019, 150, 124–135. [Google Scholar] [CrossRef]
- Zhu, Y.; Zheng, Y.; Wang, A. A Simple Approach to Fabricate Granular Adsorbent for Adsorption of Rare Elements. Int. J. Biol. Macromol. 2015, 72, 410–420. [Google Scholar] [CrossRef]
- Zharmenov, A.; Yefremova, S.; Sukharnikov, Y.; Bunchuk, L.; Kablanbekov, A.; Anarbekov, K.; Murtazayeva, D.; Yessengarayev, Y. Carbonaceous Materials from Rice Husk: Production and Application in Industry and Agriculture. Inz. Miner. J. Pol. Miner. Eng. Soc. 2018, 1, 263–274. [Google Scholar] [CrossRef]
- On Approval of the Concept of Industrial and Innovative Development of the Republic of Kazakhstan for 2021–2025. Decree of the Government of the Republic of Kazakhstan. Available online: https://adilet.zan.kz/rus/docs/P1800000846 (accessed on 21 August 2023).
- Rhenium. The Global Market. 2016. Available online: https://nedradv.ru/nedradv/ru/msr?obj=d63bd630c3a0d64877dd8a1ea4bbc9c3 (accessed on 21 August 2023).
- Yefremova, S.; Zharmenov, A.; Sukharnikov, Y.; Bunchuk, L.; Kablanbekov, A.; Anarbekov, K.; Kulik, T.; Nikolaichuk, A.; Palianytsia, B. Rice Husk Hydrolytic Lignin Transformation in Carbonization Process. Molecules 2019, 24, 3075. [Google Scholar] [CrossRef]
- Obolenskaya, A.V.; Shegolev, V.P.; Akim, G.L. Practical Work in the Chemistry of Wood and Pulp; Lesnaya Promyshlennost: Moscow, Russia, 1965; p. 412. ISBN 978-5-91646-298-2. [Google Scholar]
- Satbaev, B.; Yefremova, S.; Zharmenov, A.; Kablanbekov, A.; Yermishin, S.; Shalabaev, N.; Satbaev, A.; Khen, V. Rice Husk Research: From Environmental Pollutant to a Promising Source of Organo-Mineral Raw Materials. Materials 2021, 14, 4119. [Google Scholar] [CrossRef]
- Nikitin, V.M. Lignin; Goslesbumizdat: Leningrad, Russia, 1961; pp. 1–316. [Google Scholar]
- Yefremova, S.V.; Korolev, Y.M.; Sukharnikov, Y.I.; Kablanbekov, A.A.; Anarbekov, K.K. Structural Transformations of Carbon Materials in the Processes of Preparation from Plant Raw Materials. Solid Fuel Chem. 2016, 50, 152–157. [Google Scholar] [CrossRef]
- Kulik, T.V. Use of TPD-MS and Linear Free Energy Relationships for Assessing the Reactivity of Aliphatic Carboxylic Acids on a Silica Surface. J. Phys. Chem. 2012, 116, 570–580. [Google Scholar] [CrossRef]
- Efremova, S.V.; Korolev, Y.M.; Sukharnikov, Y.I. X-Ray Diffraction Characterization of Silicon-Carbon Nanocomposites Produced from Rice Husk and its Derivatives. Dokl. Chem. 2008, 419, 78–81. [Google Scholar] [CrossRef]
- Trejmanis, F.P.; Karklin, V.B.; Gromov, V.S. Infrared Spectra of Cotton Cellulose with Sorbed Xylene. Wood Chem. 1972, 11, 25–29. [Google Scholar]
- Rogovin, Z.A. Cellulose Chemistry; Khimiia: Moscow, Russia, 1972; pp. 1–519. [Google Scholar]
- Kronberg, V.Z.; Sharapova, T.E.; Domburg, G.E. Possibilities of IR Spectroscopy of MNPVO in the Study of Lignin Carbonatio. Wood Chem. 1987, 3, 59–67. [Google Scholar]
- Pilipchuk, I.S.; Pen, R.Z.; Finkelshtein, A.V. Infrared Spectroscopy of Lignin. Wood Chem. 1968, 1, 45–49. [Google Scholar]
- Pokrovskaia, E.N.; Sidorov, V.I.; Melnikova, I.N. Hydrophobization of Wood with Phosphorus and Organosilicon Compounds. Wood Chem. 1990, 1, 90–96. [Google Scholar]
- Kaputskii, F.N. On the Interaction of Cellulose with Dietary Hydroxypropylamine. Izv. AN SSSR. Ser. Khim. Nauk. 1975, 9, 2041–2045. [Google Scholar]
- Kocheva, L.S. Structural Changes of Cellulose Materials Under the Influence of Gamma Irradiation. Probl. Khimii Drev. Lesokhimii 1997, 156, 86–89. [Google Scholar]
- Nakamoto, K. IR and RAMAN Spectra of Inorganic and Coordination Compounds; Mir, The USSR: Moscow, Russia, 1991; pp. 1–536. ISBN 5-03-001749-6. [Google Scholar]
- Yefremova, S.; Sukharnikov, Y.; Terlikbayeva, A.; Zharmenov, A.; Bunchuk, L.; Anarbekov, K.; Shabanova, T. Influence of Vegetable Polymers Nature on Carbon Materials Structure Formation. In Mine Planning and Equipment Selection, Proceedings of the 22nd MPES Conference, Dresden, Germany, 14–19 October 2013; Drebenstedt, C., Singhal, R., Eds.; Springer: Cham, Switzerland, 2014; Volume 2, pp. 1107–1115. [Google Scholar] [CrossRef]
- Greg, S.; Sing, K. Adsorption, Specific Surface Area, Porosity; Mir, The USSR: Moscow, Russia, 1984; pp. 1–306. ISBN 0-12-300956-1. [Google Scholar]
- Fu, P.; Hu, S.; Xiang, J.; Yi, W.; Bai, X.; Sun, L.; Su, S. Evolution of Char Structure During Steam Gasifi Cation of the Chars Produced from Rapid Pyrolysis of Rice Husk. Bioresour. Technol. 2010, 102, 691–697. [Google Scholar]
- Chen, Y.; Zhu, Y.; Wang, Z.; Li, Y.; Wang, L.; Gao, X.; Ma, Y.; Guo, Y. Application Studies of Activated Carbon Derived from Rice Husks Produced by Chemical-Thermal Process. Adv. Colloid Interface Sci. 2011, 163, 39–52. [Google Scholar] [CrossRef] [PubMed]
- Rocha, L.S.; Lopes, C.B.; Borges, J.A.; Duarte, A.C.; Pereira, E. Valuation of Unmodified Rice Husk Waste as an Eco-Friendly Sorbent to Remove Mercury: A Study Using Environmental Realistic Concentrations. Water Air Soil Pollut. 2013, 224, 1599. [Google Scholar] [CrossRef]
- Borbat, V.F. Hydrometallurgy, 2nd ed.; Metallurgiia, The USSR: Mocsow, Russia, 1986; Volume 263, p. 5. [Google Scholar]
- Giles, C.H.; MacEwan, T.H.; Nakhwa, S.N.; Smith, D. Studies in Adsorption: Part XI. A System of Classification of Solution Adsorption Isotherms and Its Use in Diagnosis of Adsorption Mechanisms and in Measurement of Specific Surface Area Solids. J. Chem. Soc. 1960, 14, 3973–3993. [Google Scholar] [CrossRef]
- Hadi, P.; Xu, M.; Ning, C.; Sze Ki Lin, C.; McKay, G. A Critical Review on Preparation, Characterization and Utilization of Sludge-Derived Activated Carbons for Wastewater Treatment. Environ. Chem. Eng. 2014, 260, 895–906. [Google Scholar] [CrossRef]
- Olalekan, A.P.; Dada, A.O.; Okewale, A.O. Comparative Adsorption Isotherm Study of Removal of Pb2+ and Zn2+ onto Agricultural Waste. Res. J. Chem. Environ. Sci. 2013, 1, 22–27. [Google Scholar]
- El-Shafey, E.I. Removal of Zn(II) and Hg(II) from Aqueous Solution on a Carbonaceous Sorbent Chemically Prepared from Rice Husk. J. Hazard. Mater. 2010, 175, 319–327. [Google Scholar] [CrossRef]
- Ioelovich, M.I.; Tupureine, A.D. Study of the Interaction of Cellulose in the Cell Walls of Wood with Sodium Hydroxide Solutions. Wood Chem. 1989, 4, 14–21. [Google Scholar]
- Tretinnikov, O.N.; Zhbankov, R.G. The Structure of the Surface Layers of Cellulose Films Obtained from Non-Aqueous Solutions, According to IR Spectroscopy of Repeatedly Disturbed Total Internal Reflection. Wood Chem. 1990, 5, 3–7. [Google Scholar]
- Belhachemi, M.; Jeguirim, M.; Limousy, L.; Addoun, F. Comparison of NO2 Removal Using Date Pits Activated Carbon and Modified Commercialized Activated Carbon Via Different Preparation Methods: Effect of Porosity and Surface Chemistry. Chem. Eng. J. 2014, 253, 121–129. [Google Scholar] [CrossRef]
- Kolesnikov, A.S. Thermodynamic Simulation of Silicon and Iron Reduction and Zinc and Lead Distillation in Zincoligonite Ore-Carbon Systems. Russ. J. Non-Ferr. Met. 2014, 55, 513–518. [Google Scholar] [CrossRef]


| Sample | Delignification Conditions | Yield, % wt. | Content, % wt. | |||
|---|---|---|---|---|---|---|
| Cellulose | Hemicellulose | Lignin | SiO2 | |||
| AC | According to Beckman’s method | 43.4 | 62.0 | 22.4 | 15.5 | 0.1 |
| KHC2 | 2-fold treatment with Kürschner and Hoffer reagent | 53.1 | not determined | not determined | ~1.0 | 26.4 |
| KHC3 | 3-fold treatment with Kürschner and Hoffer reagent | 50.0 | not determined | not determined | N/A | 27.4 |
| KHC4 | 4-fold treatment with Kürschner and Hoffer reagent | 49.6 | not determined | not determined | N/A | 25.2 |
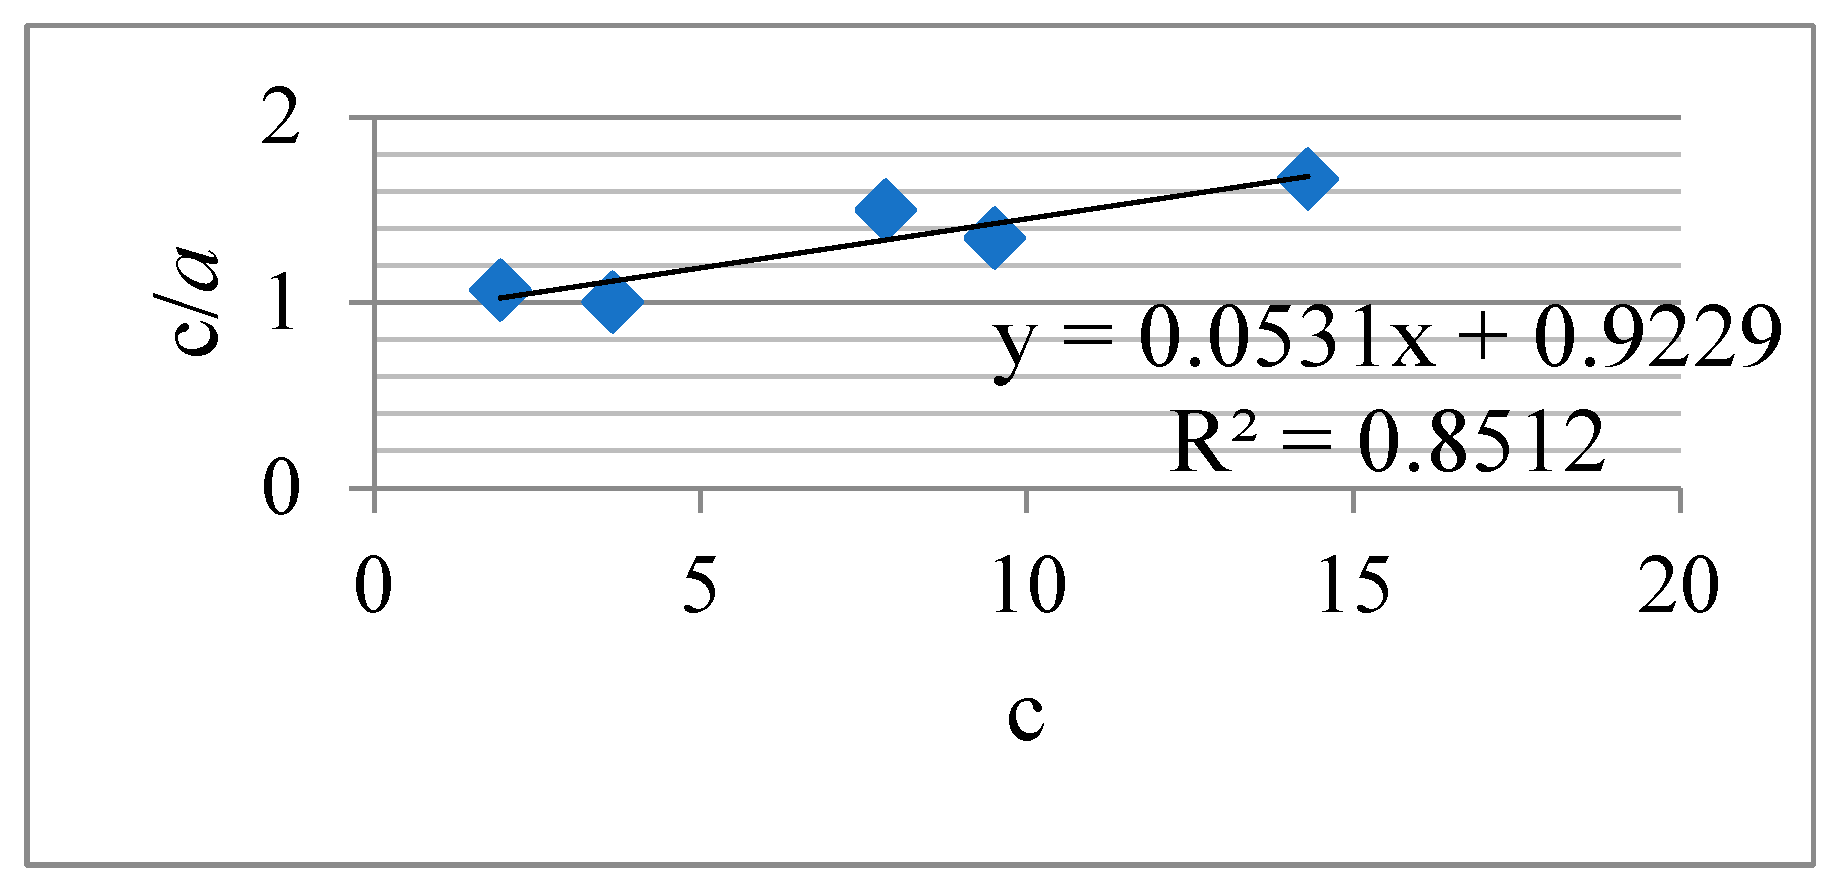
| Langmuir constants | R2 | am, mg·g−1 | KL, dm3·mg−1 |
| 0.8512 | 4.01 | 0.290 | |
| Freundlich constants | R2 | KF, (mg·g−1)·(dm3·mg−1)1/n | 1/n |
| 0.9745 | 1.221 | 0.510 |
Disclaimer/Publisher’s Note: The statements, opinions and data contained in all publications are solely those of the individual author(s) and contributor(s) and not of MDPI and/or the editor(s). MDPI and/or the editor(s) disclaim responsibility for any injury to people or property resulting from any ideas, methods, instructions or products referred to in the content. |
© 2023 by the authors. Licensee MDPI, Basel, Switzerland. This article is an open access article distributed under the terms and conditions of the Creative Commons Attribution (CC BY) license (https://creativecommons.org/licenses/by/4.0/).
Share and Cite
Kablanbekov, A.; Yefremova, S.; Berdikulova, F.; Satbaev, S.; Yermishin, S.; Shalabaev, N.; Satbaev, B.; Terlikbayeva, A.; Zharmenov, A. Rice Husk Cellulose-Based Adsorbent to Extract Rare Metals: Preparing and Properties. Materials 2023, 16, 6277. https://doi.org/10.3390/ma16186277
Kablanbekov A, Yefremova S, Berdikulova F, Satbaev S, Yermishin S, Shalabaev N, Satbaev B, Terlikbayeva A, Zharmenov A. Rice Husk Cellulose-Based Adsorbent to Extract Rare Metals: Preparing and Properties. Materials. 2023; 16(18):6277. https://doi.org/10.3390/ma16186277
Chicago/Turabian StyleKablanbekov, Askhat, Svetlana Yefremova, Feruza Berdikulova, Serik Satbaev, Sergey Yermishin, Nurgali Shalabaev, Baimakhan Satbaev, Alma Terlikbayeva, and Abdurassul Zharmenov. 2023. "Rice Husk Cellulose-Based Adsorbent to Extract Rare Metals: Preparing and Properties" Materials 16, no. 18: 6277. https://doi.org/10.3390/ma16186277