
Influence of Design Parameters on Mechanical Behavior of Multi-Bolt, Countersunk C/SiC Composite Joint Structure
 ,
,
Abstract
:1. Introduction
2. Models
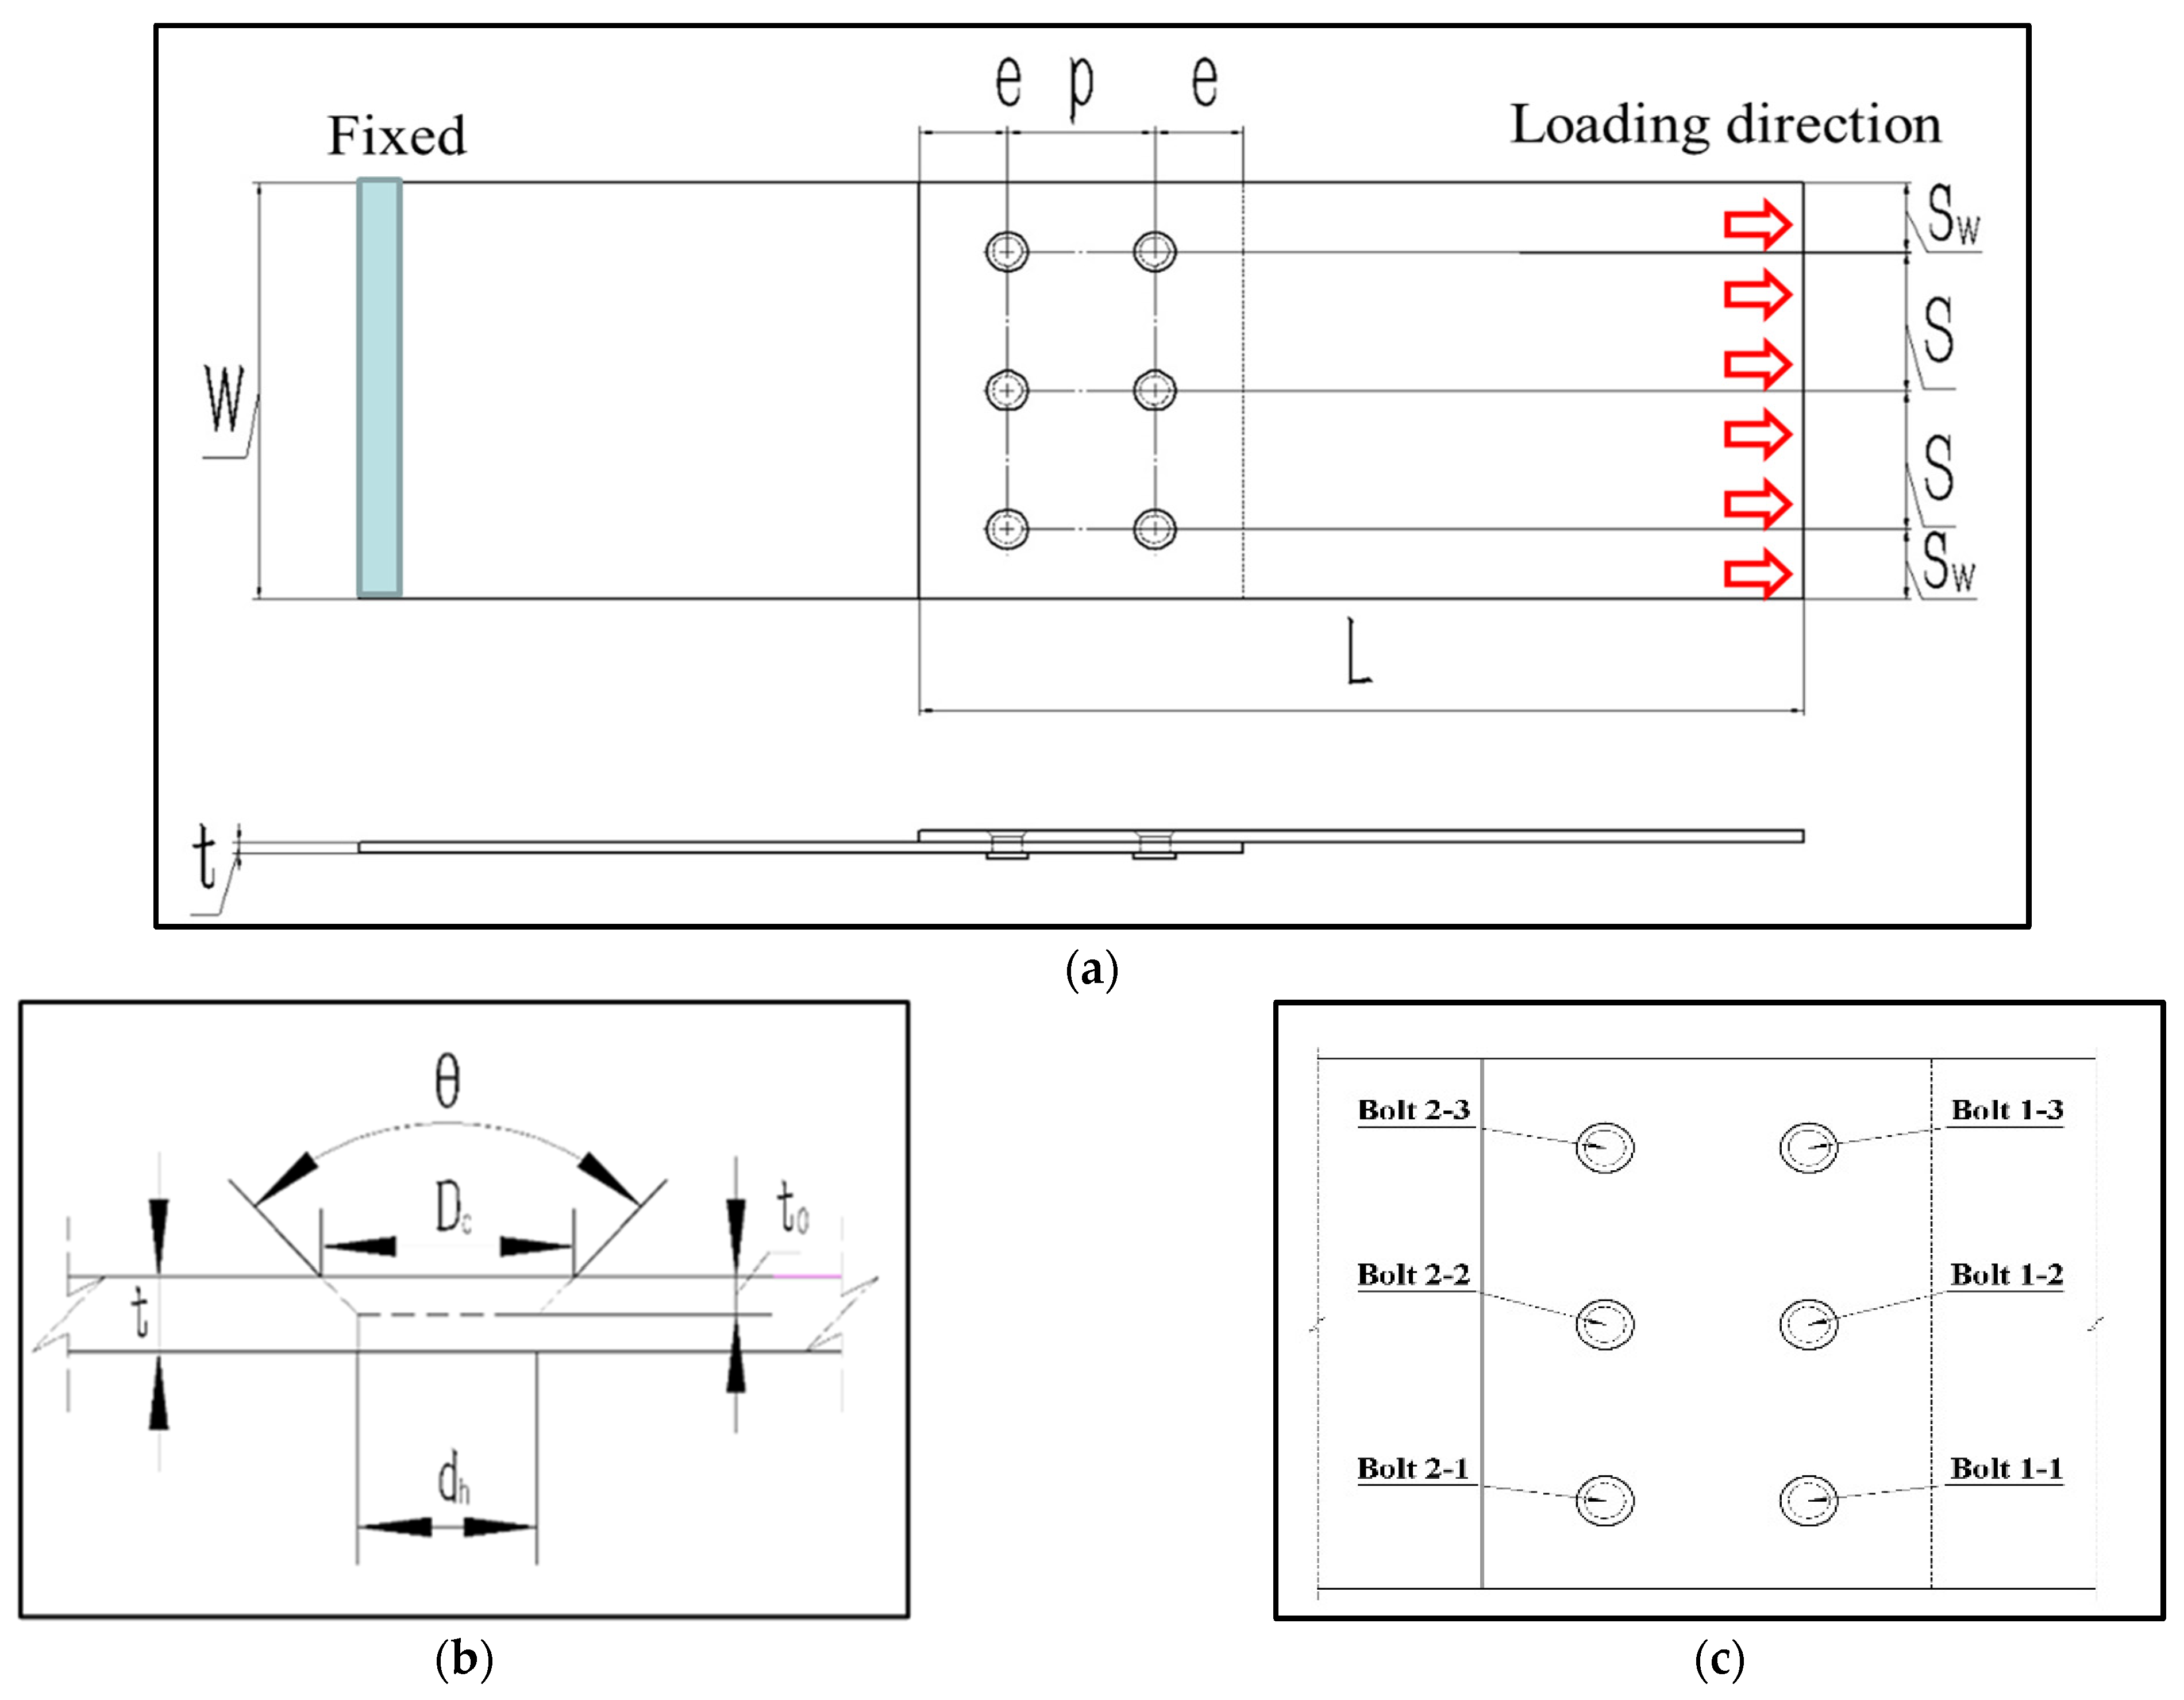
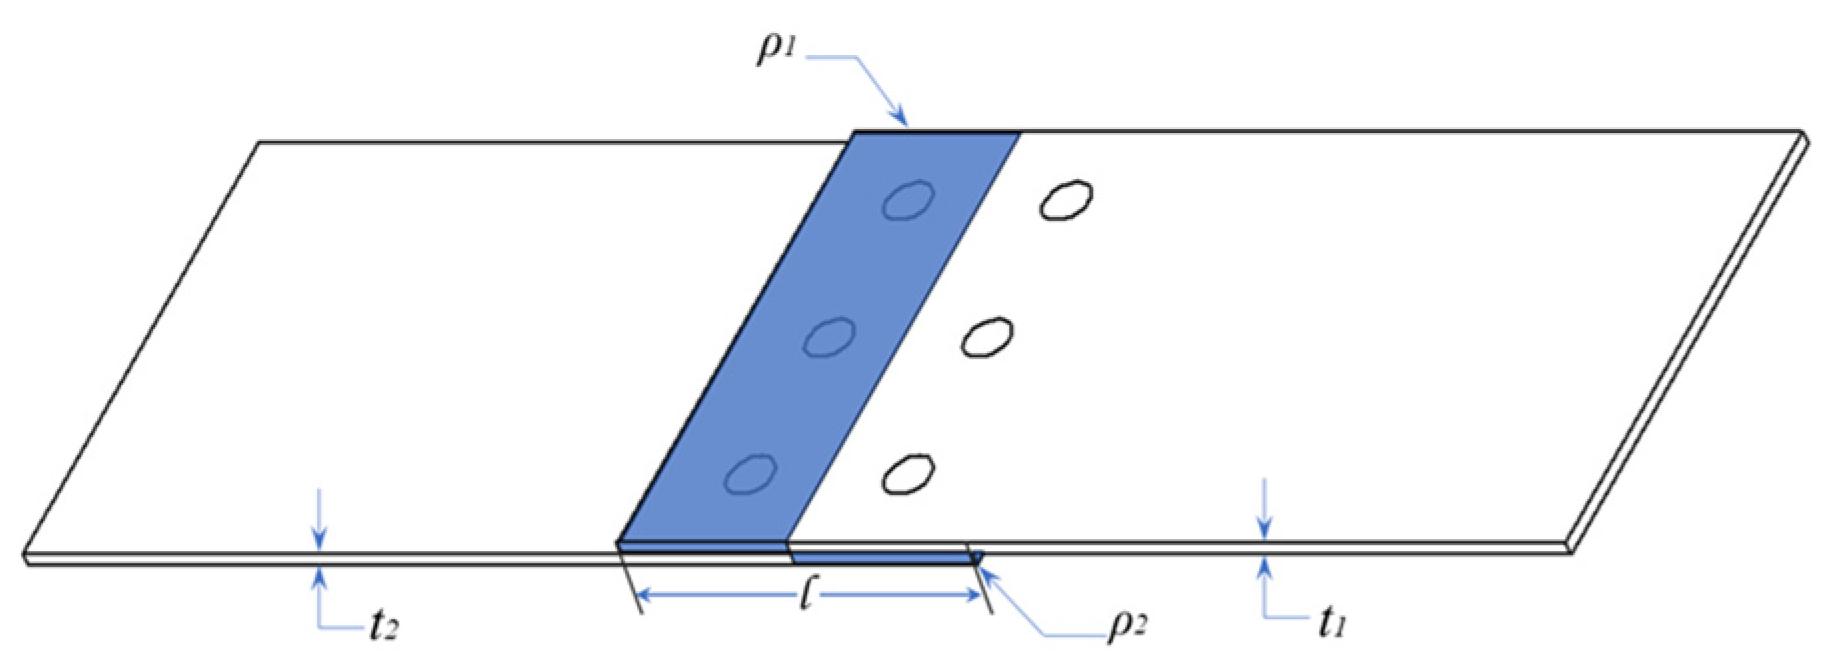
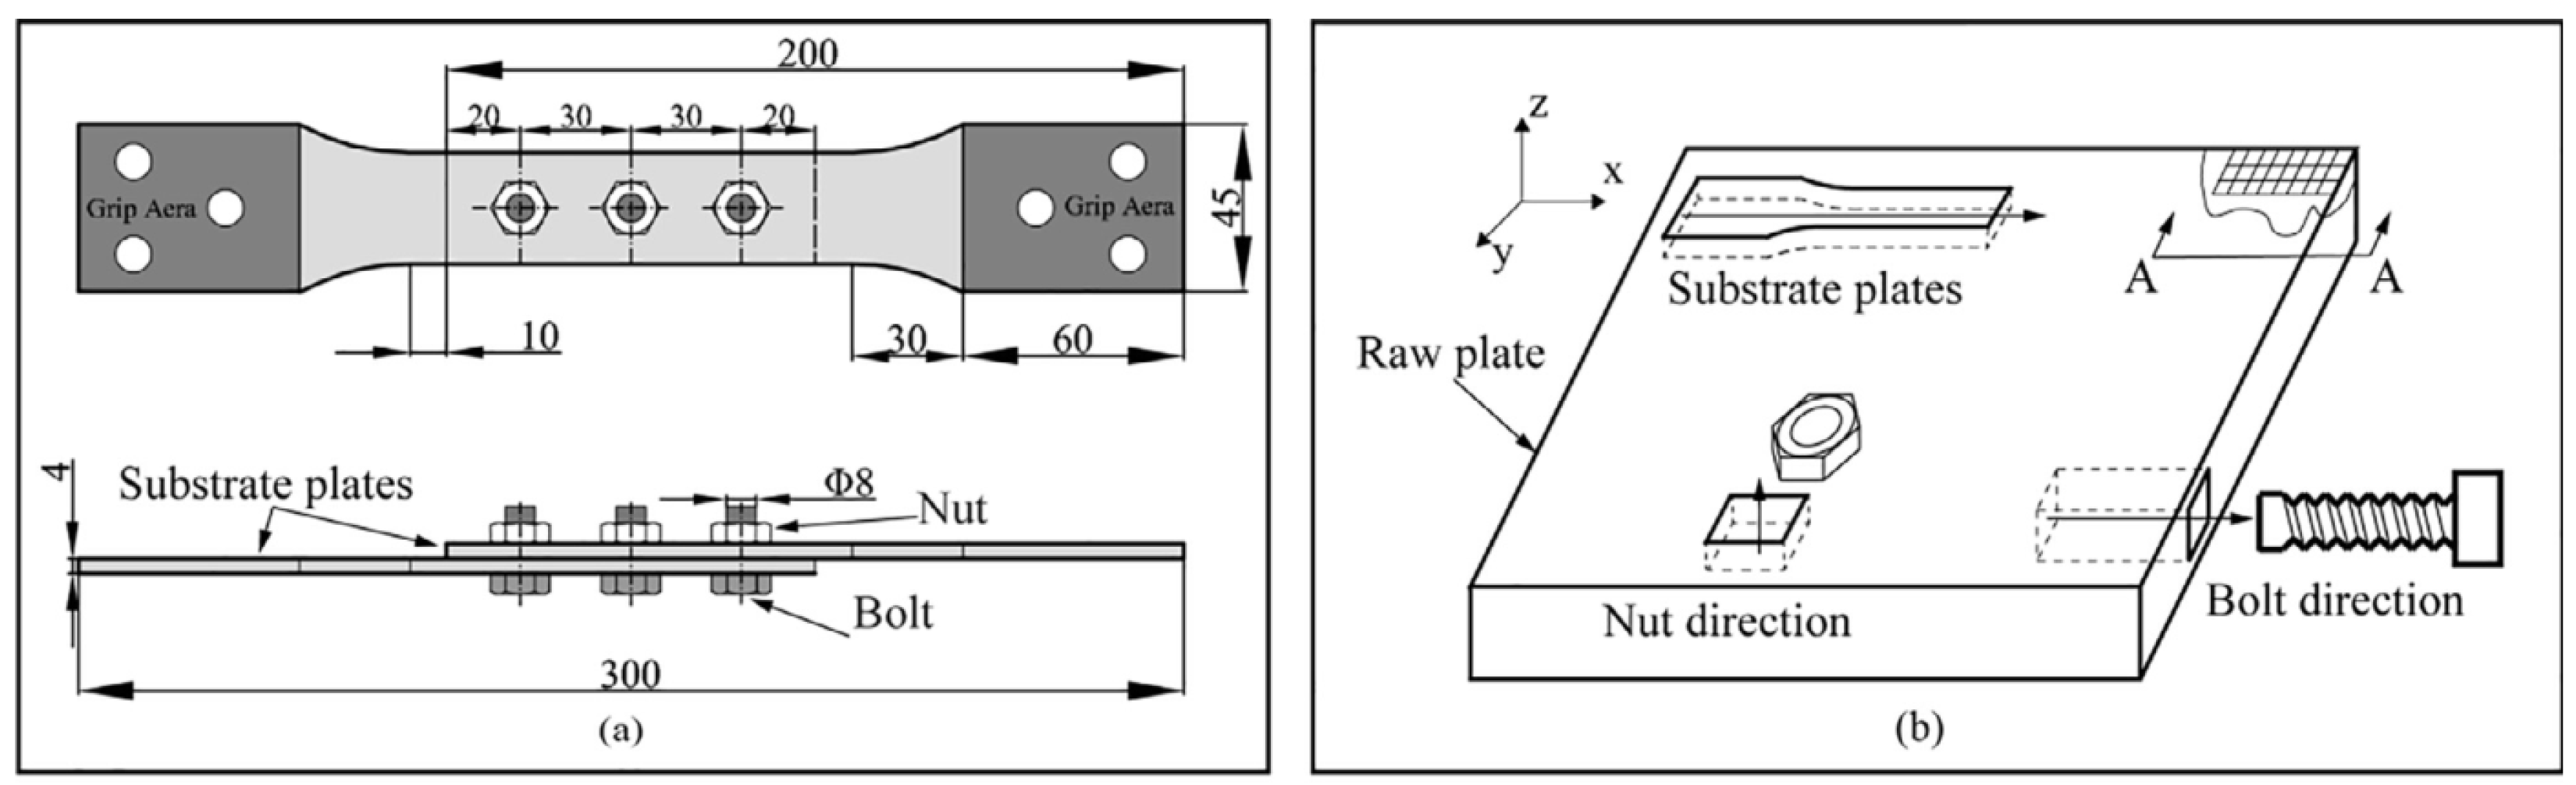
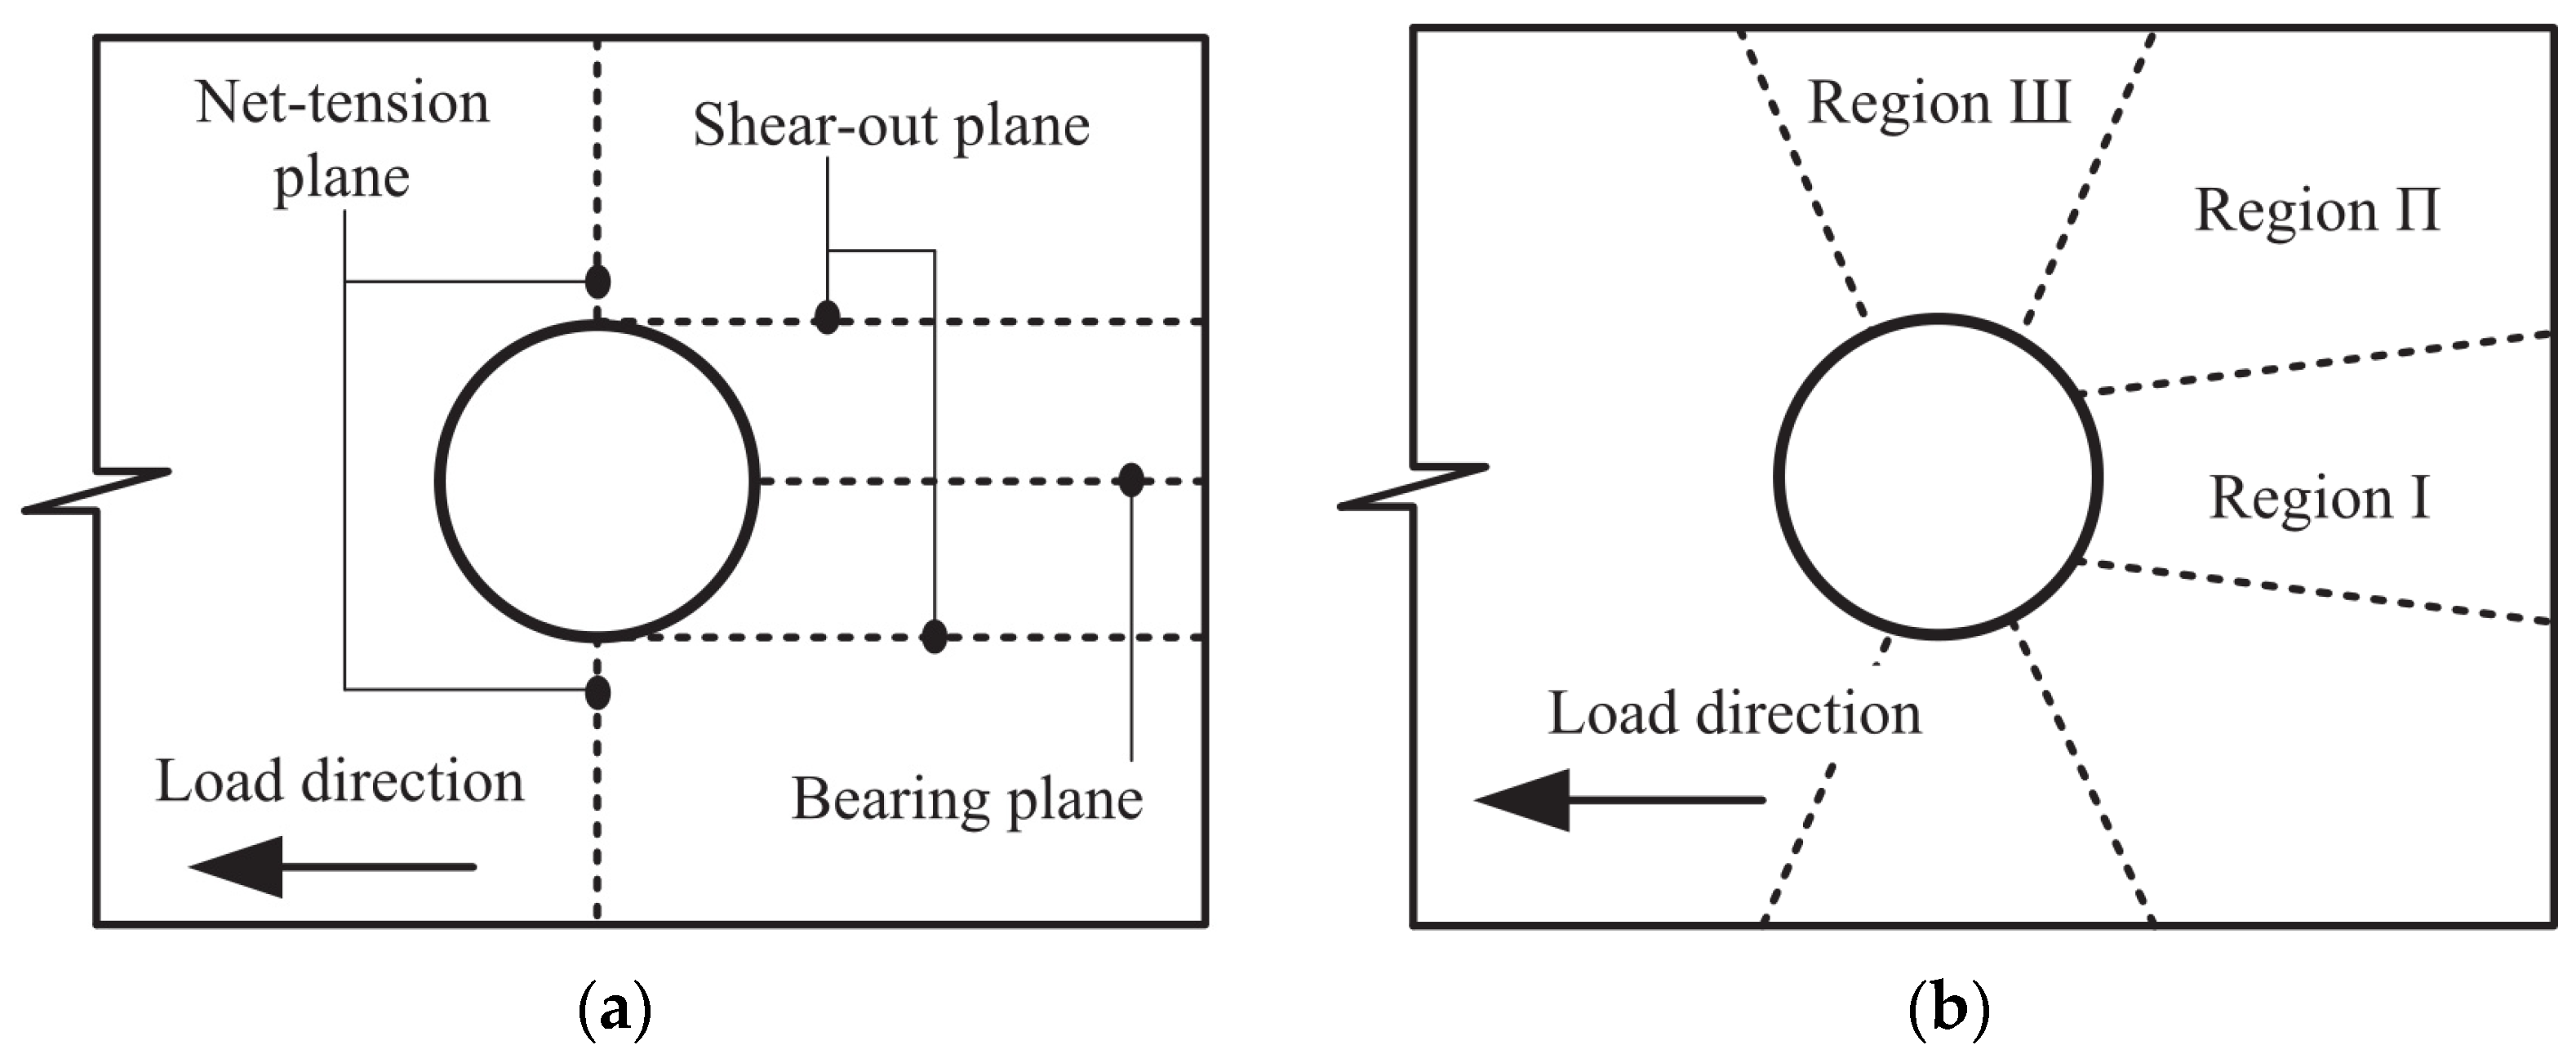
2.1. Geometric Model
2.2. Mathematical Model
3. Validation
3.1. Material Parameters
3.2. Simulation and Experimental Results
4. Results and Discussion
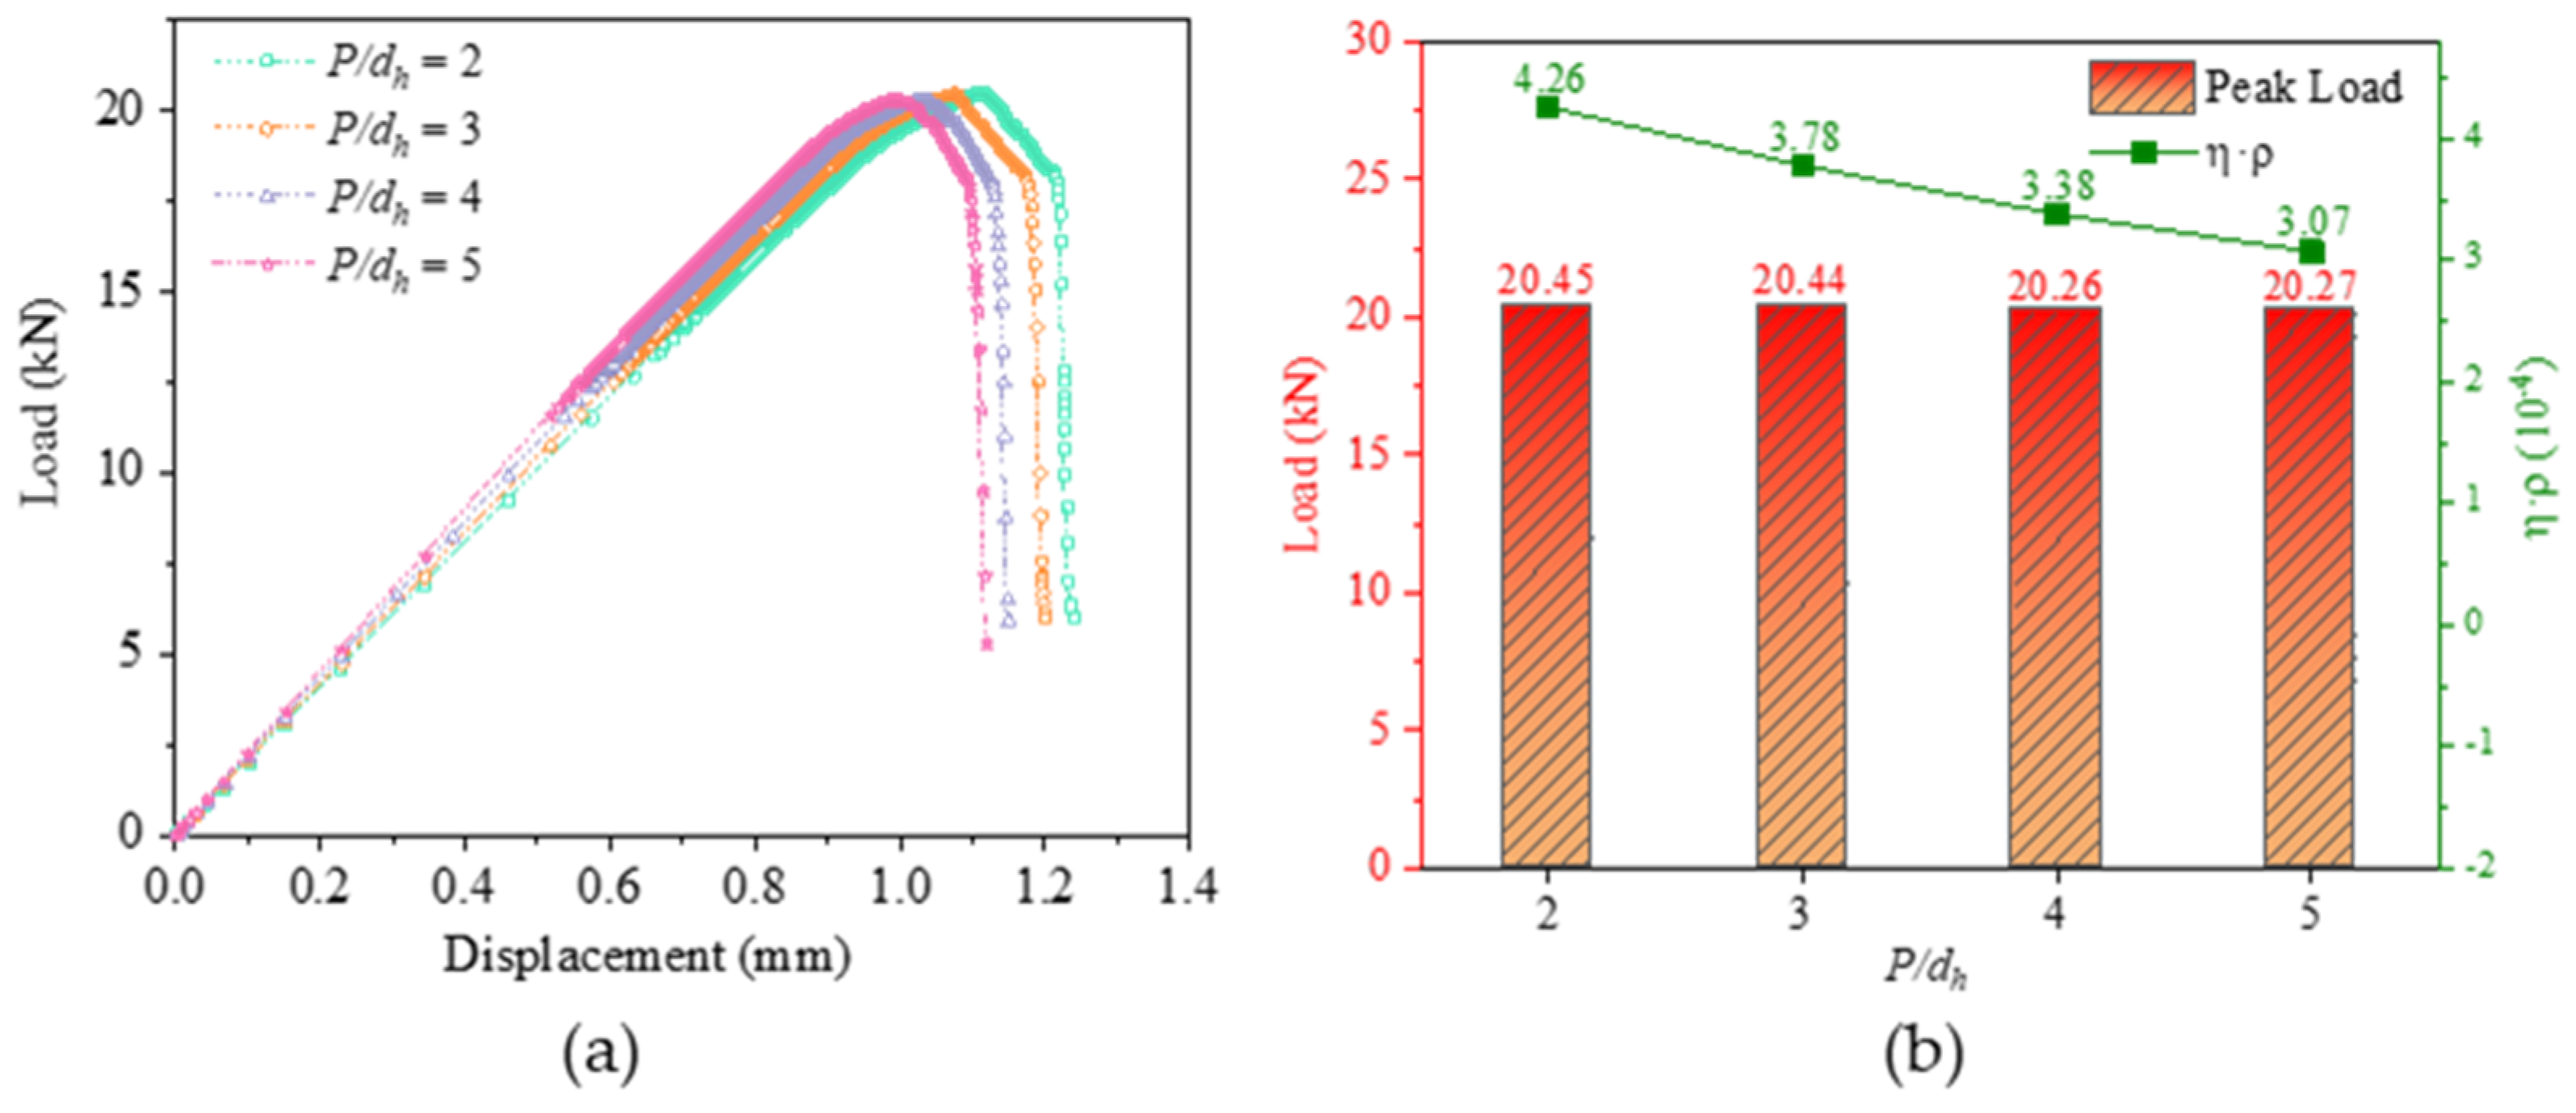
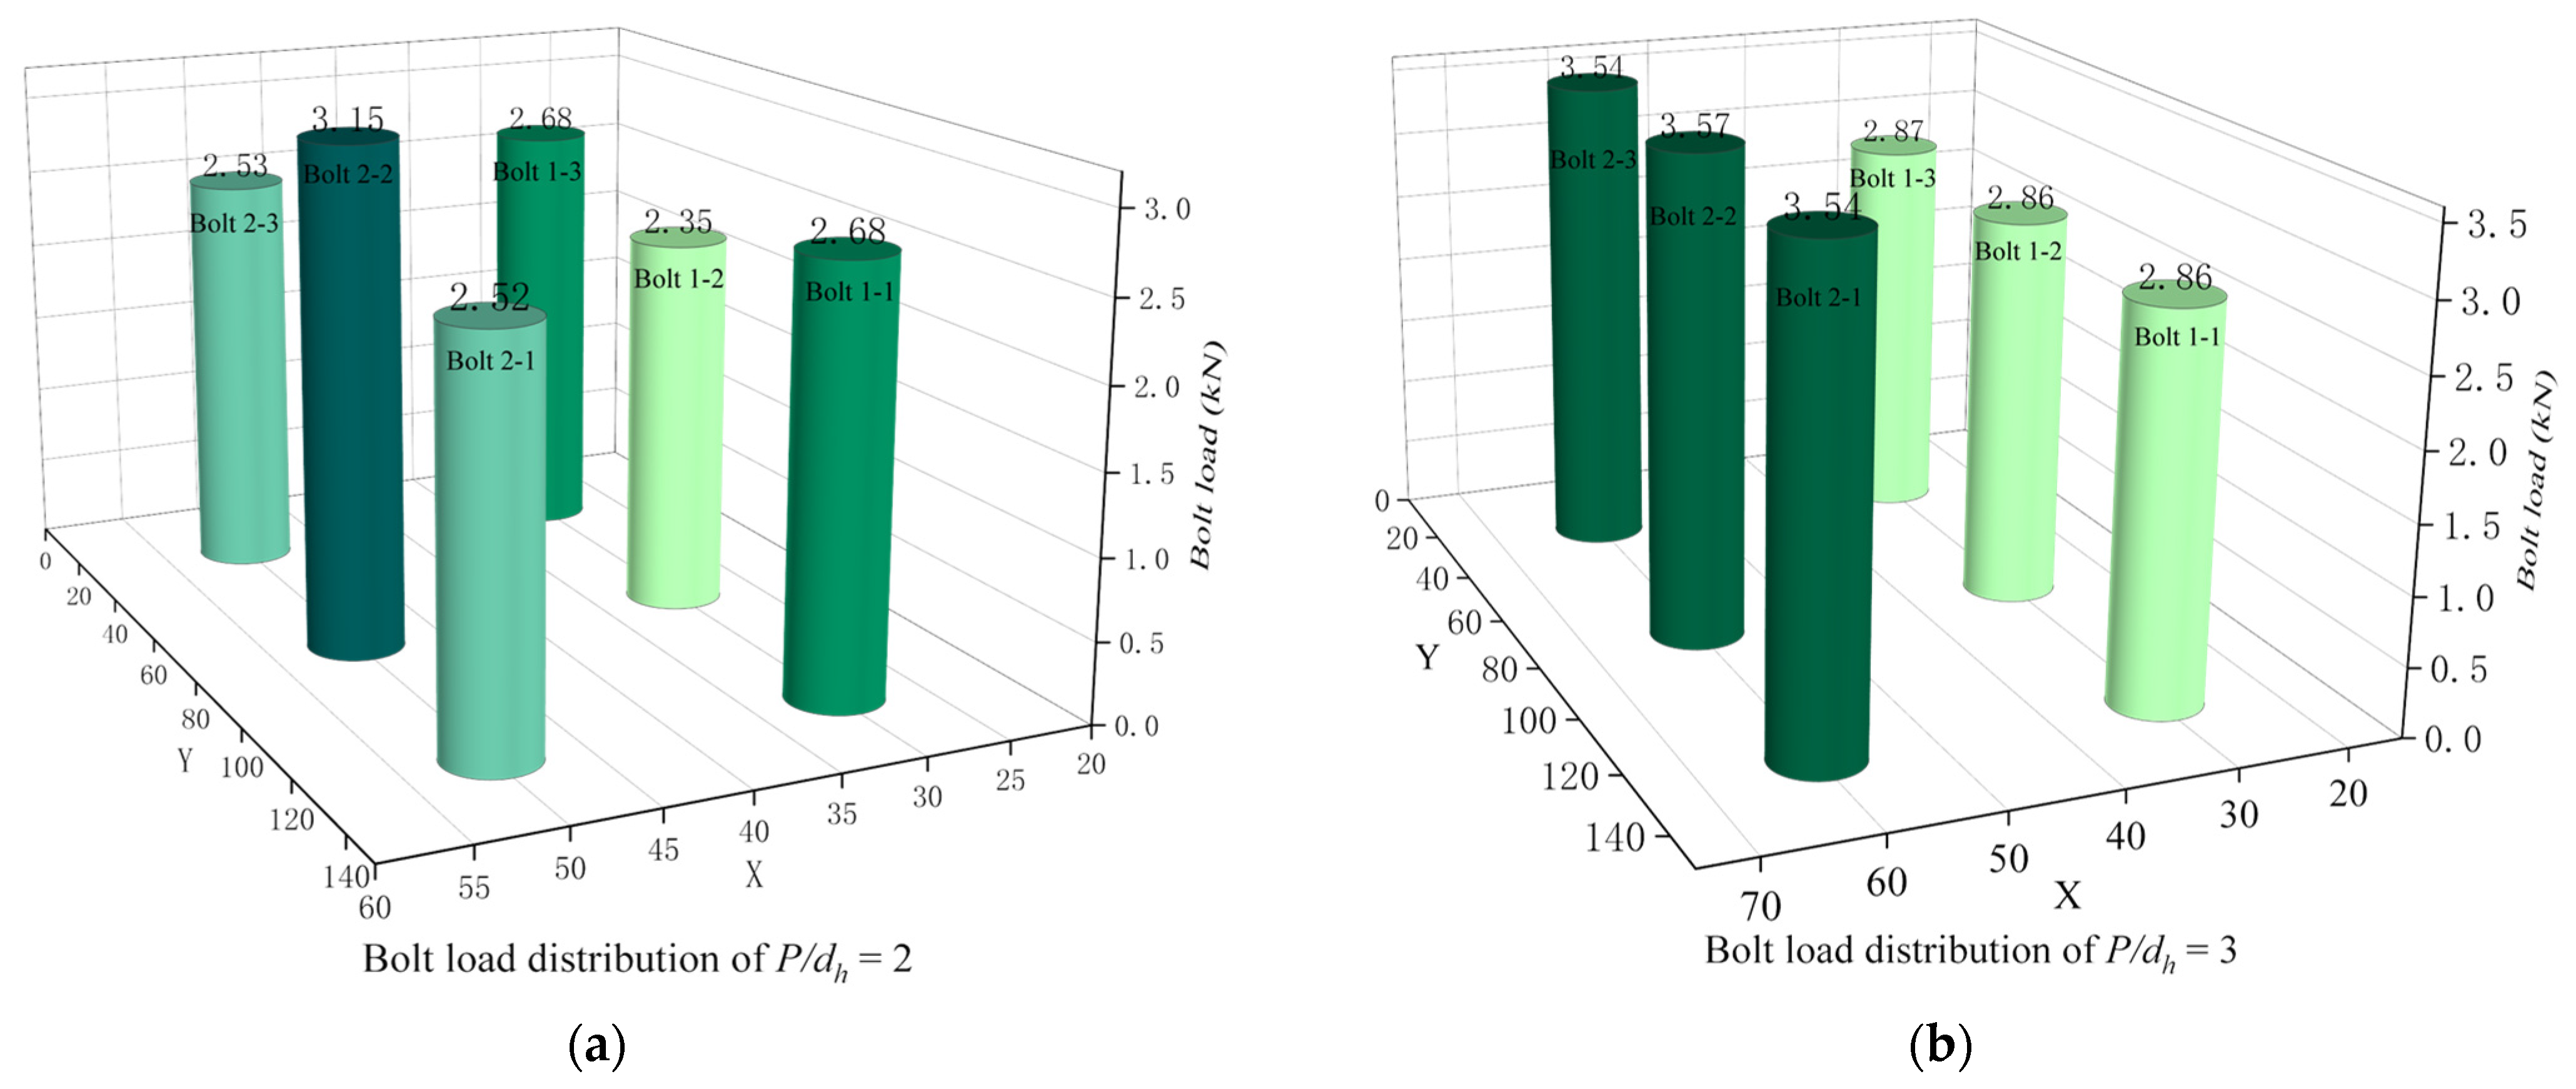
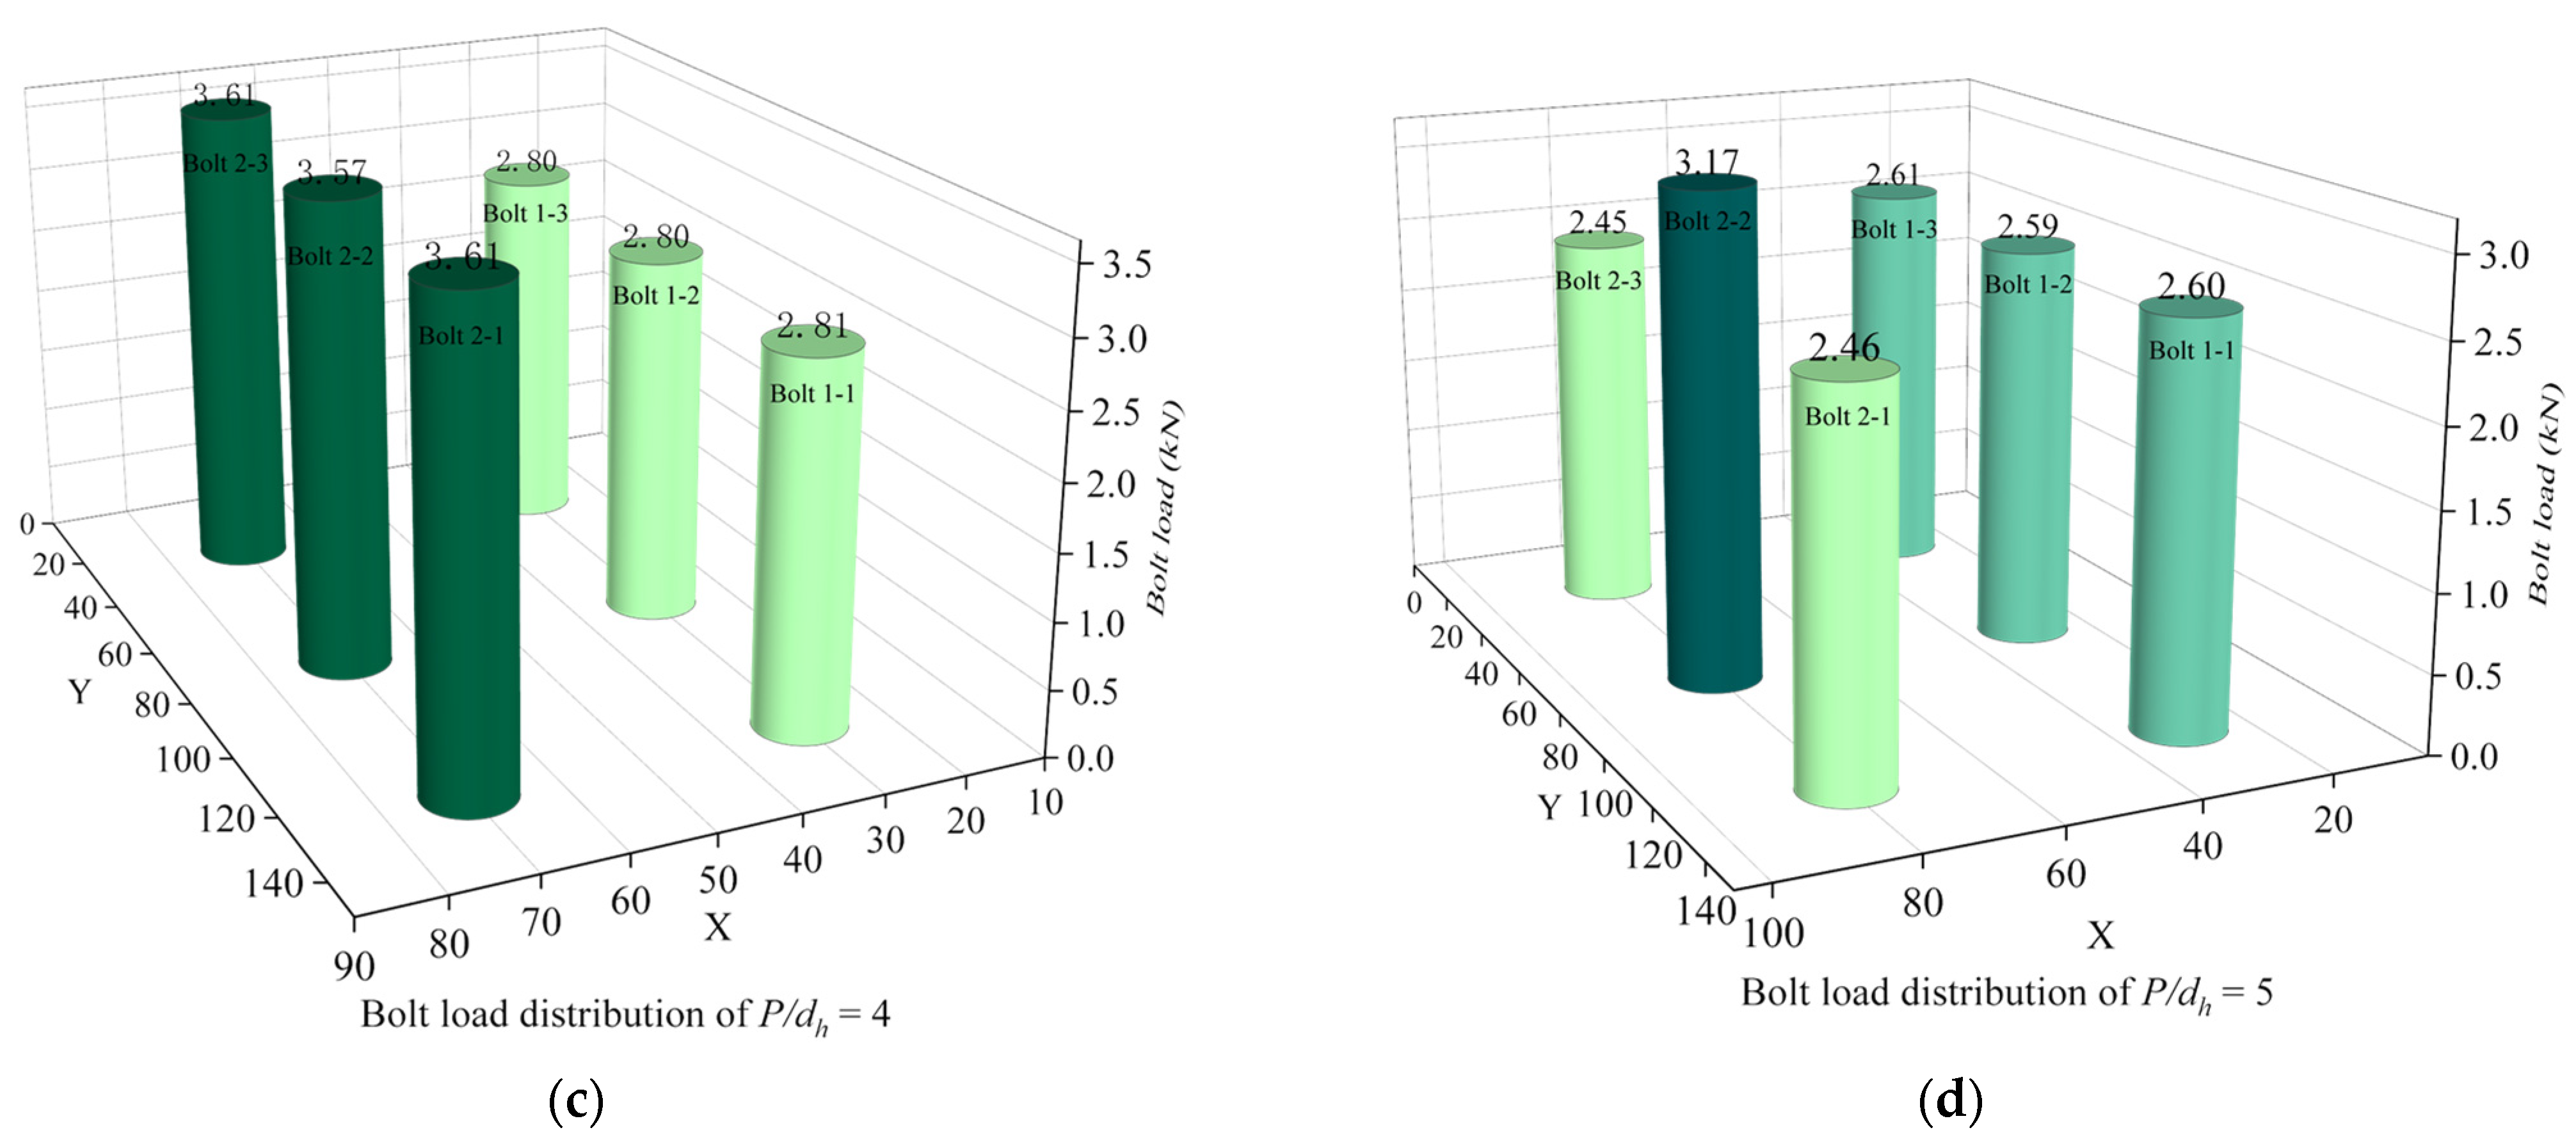
4.1. Effect of P/dh on Mechanical Behavior of Joint Structure
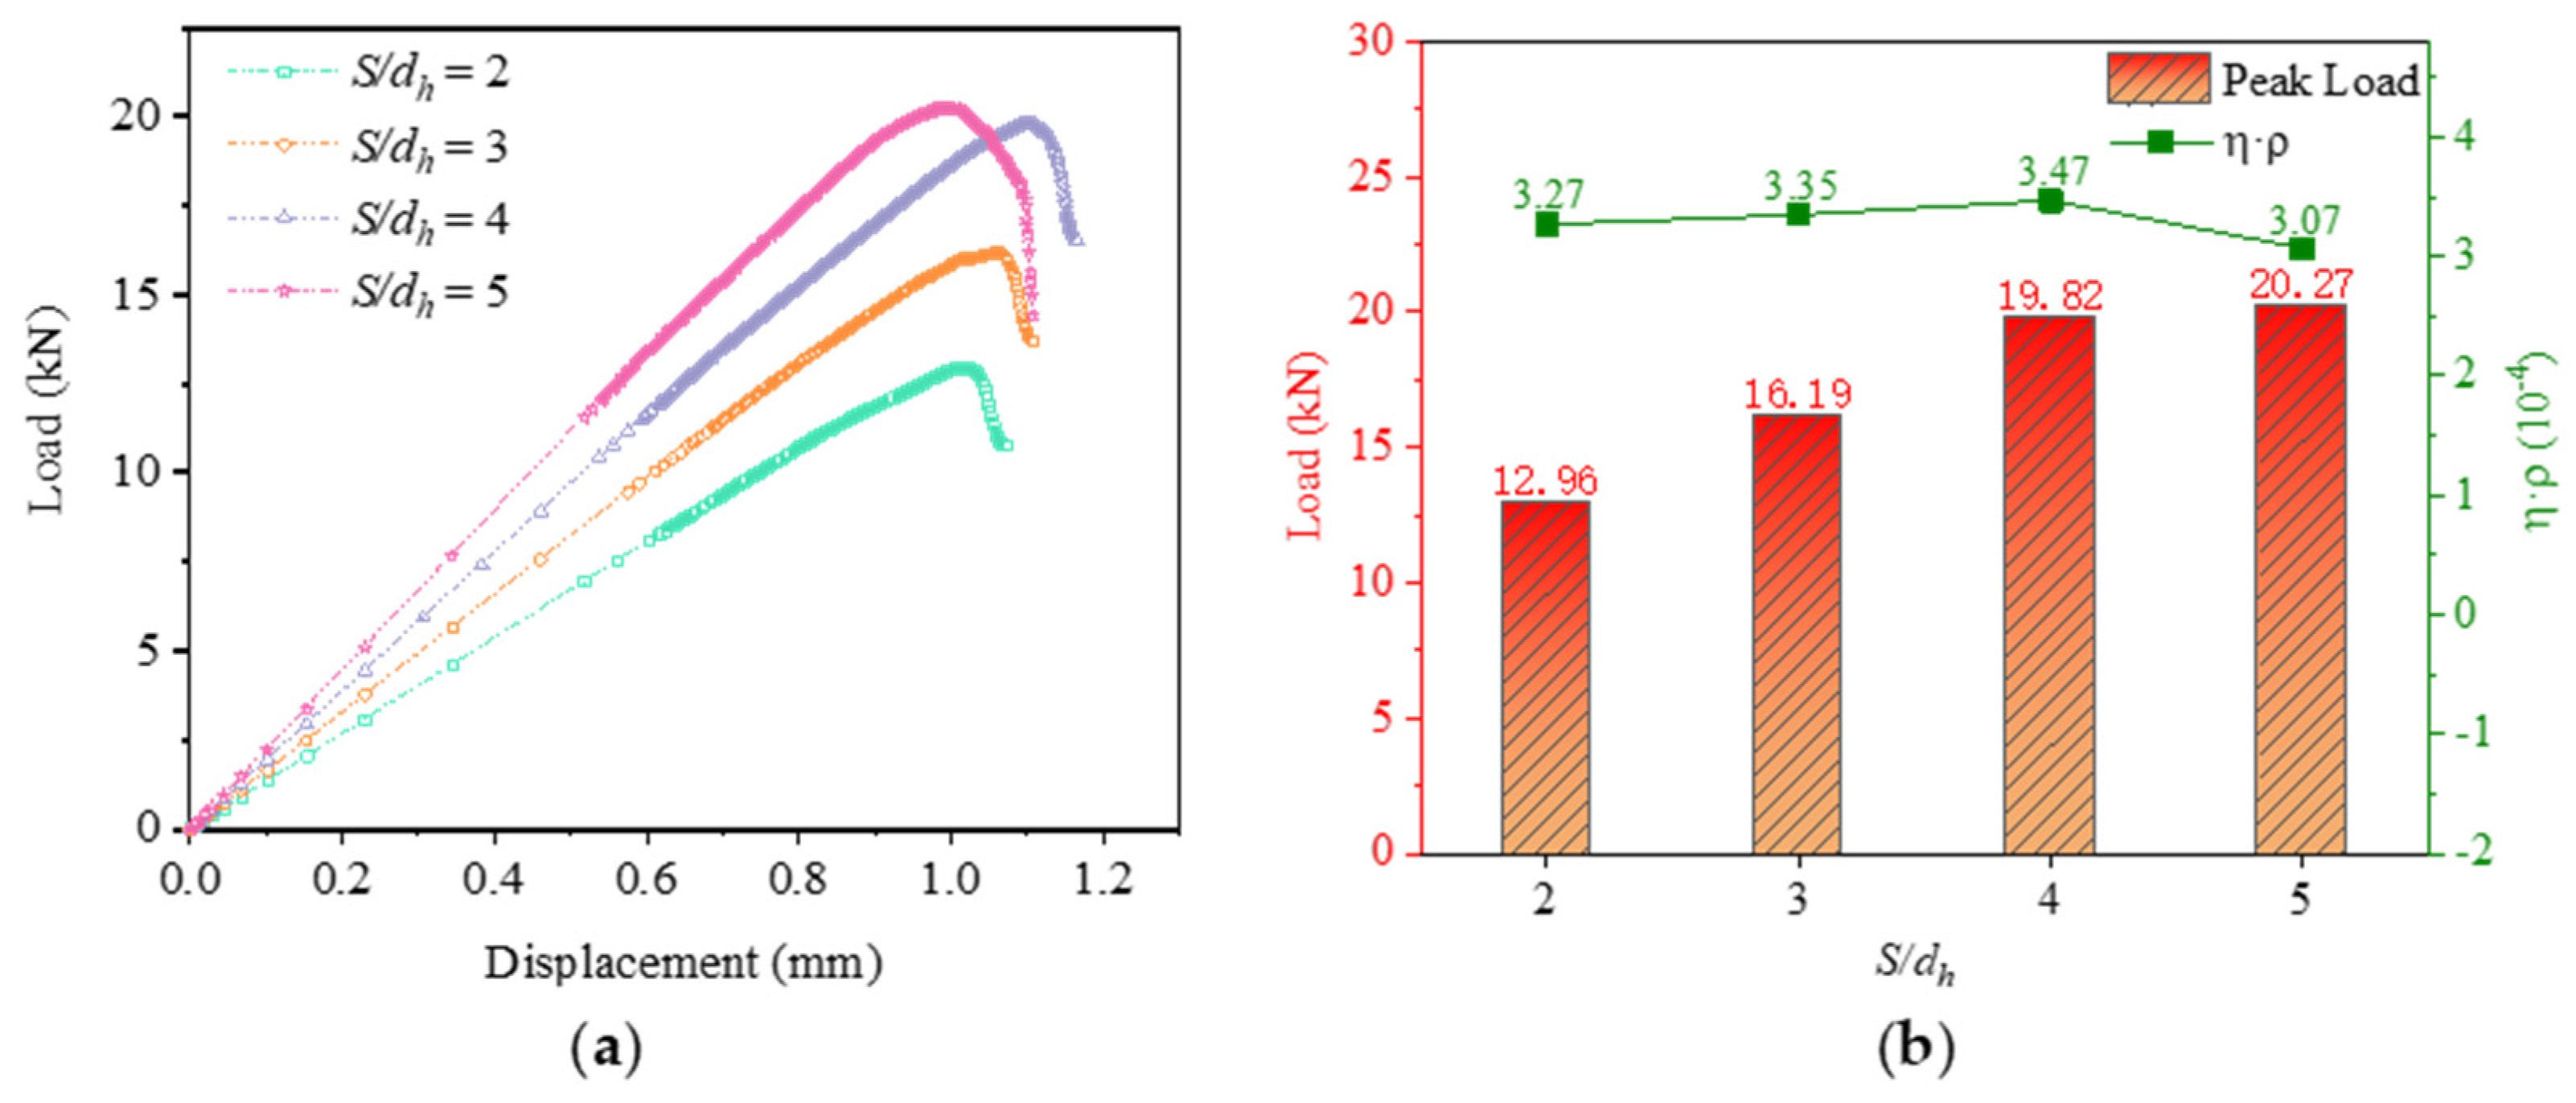
4.2. Effect of S/dh on Mechanical Behavior of Joint Structure
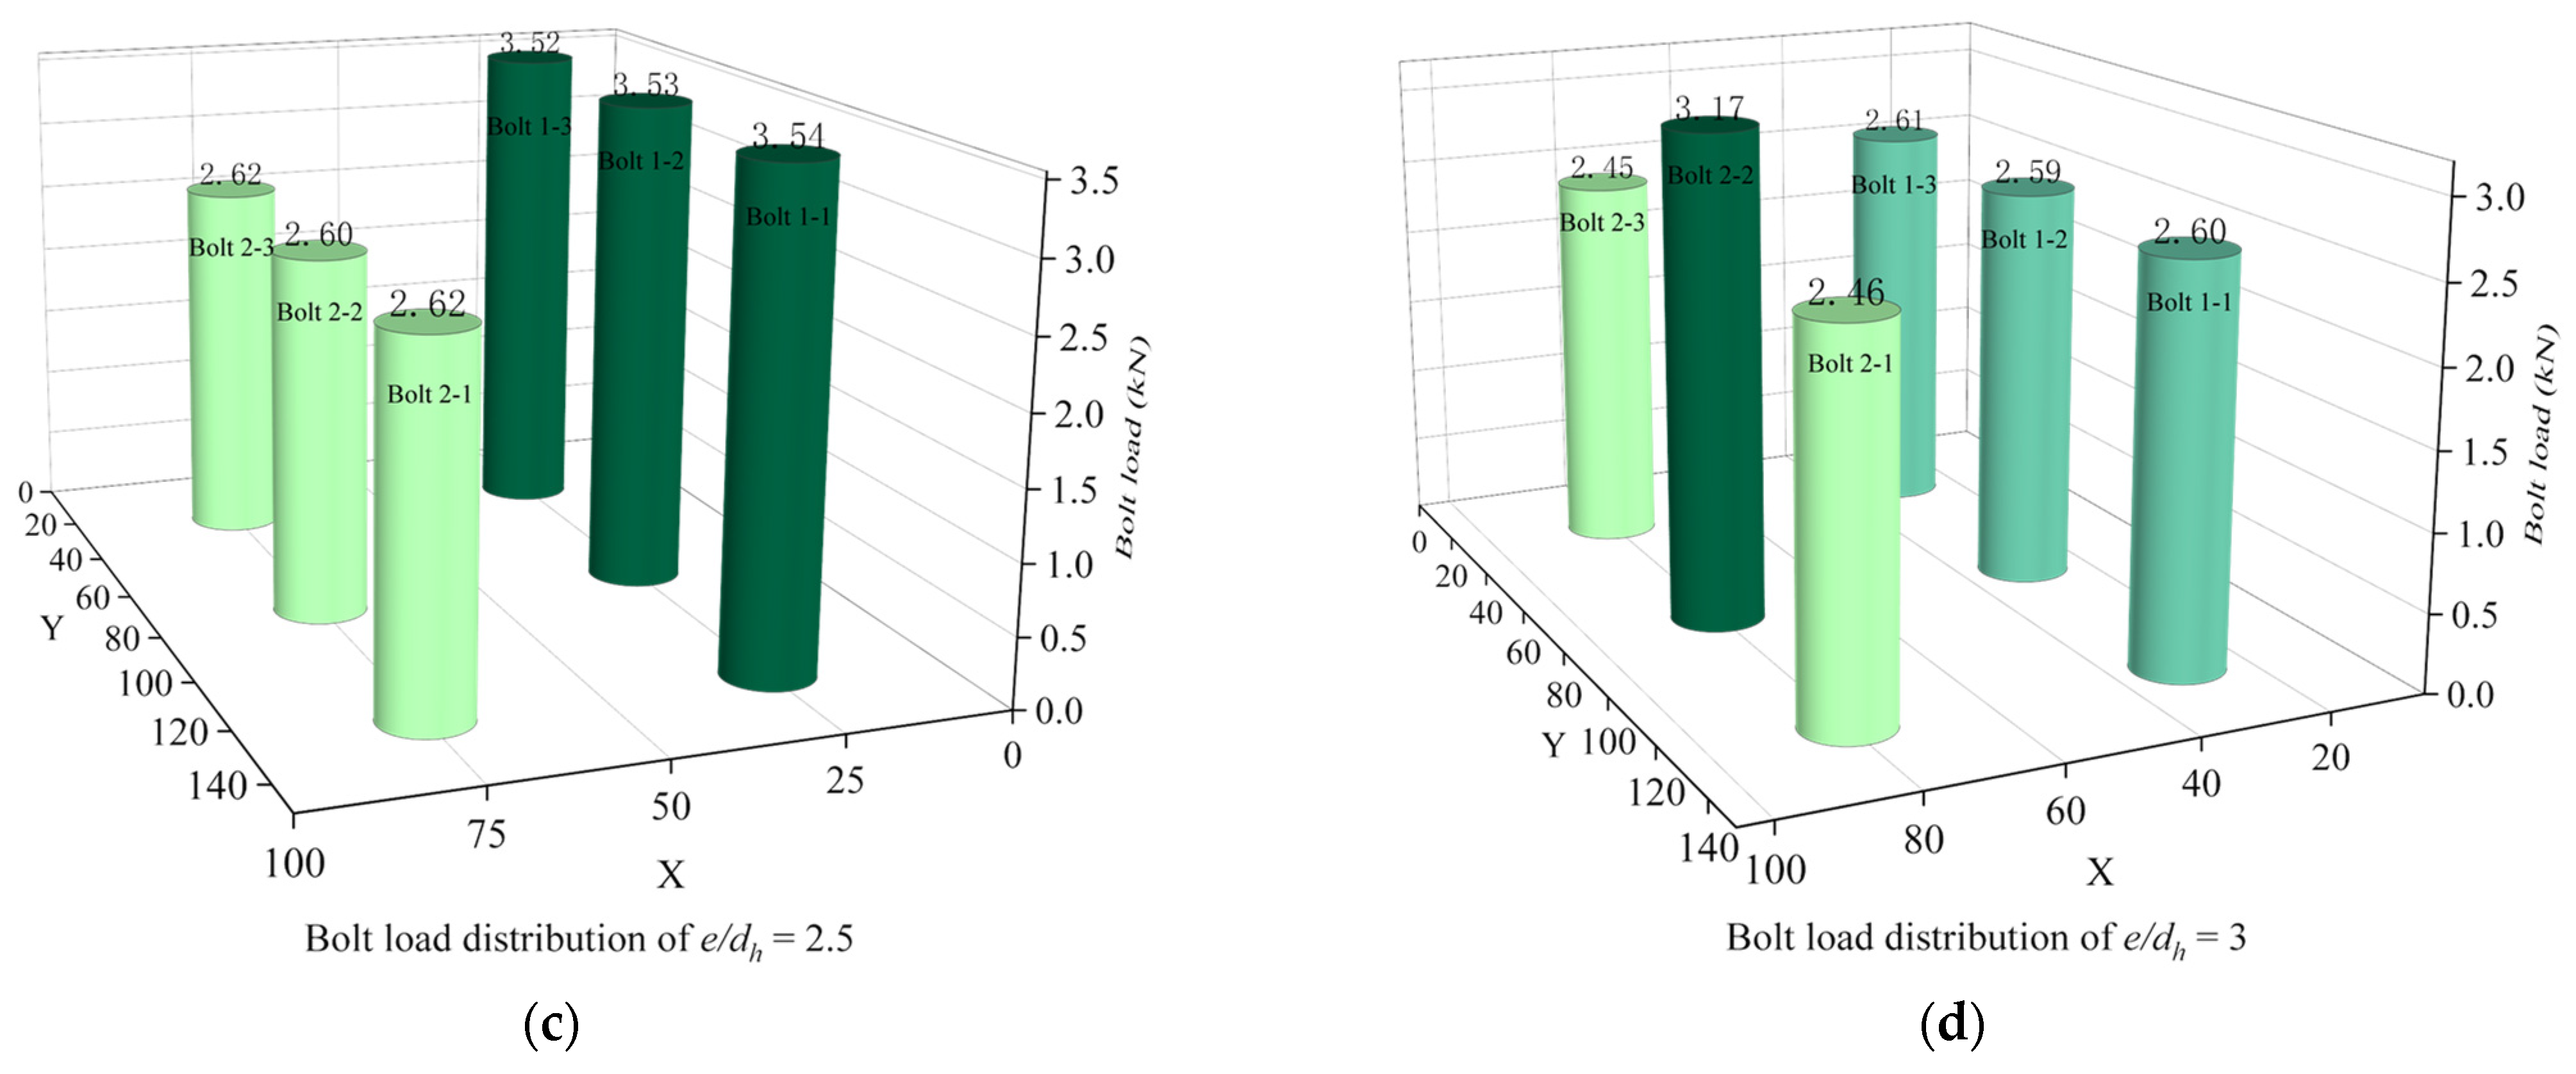
4.3. Effect of e/dh on Mechanical Behavior of Joint Structure
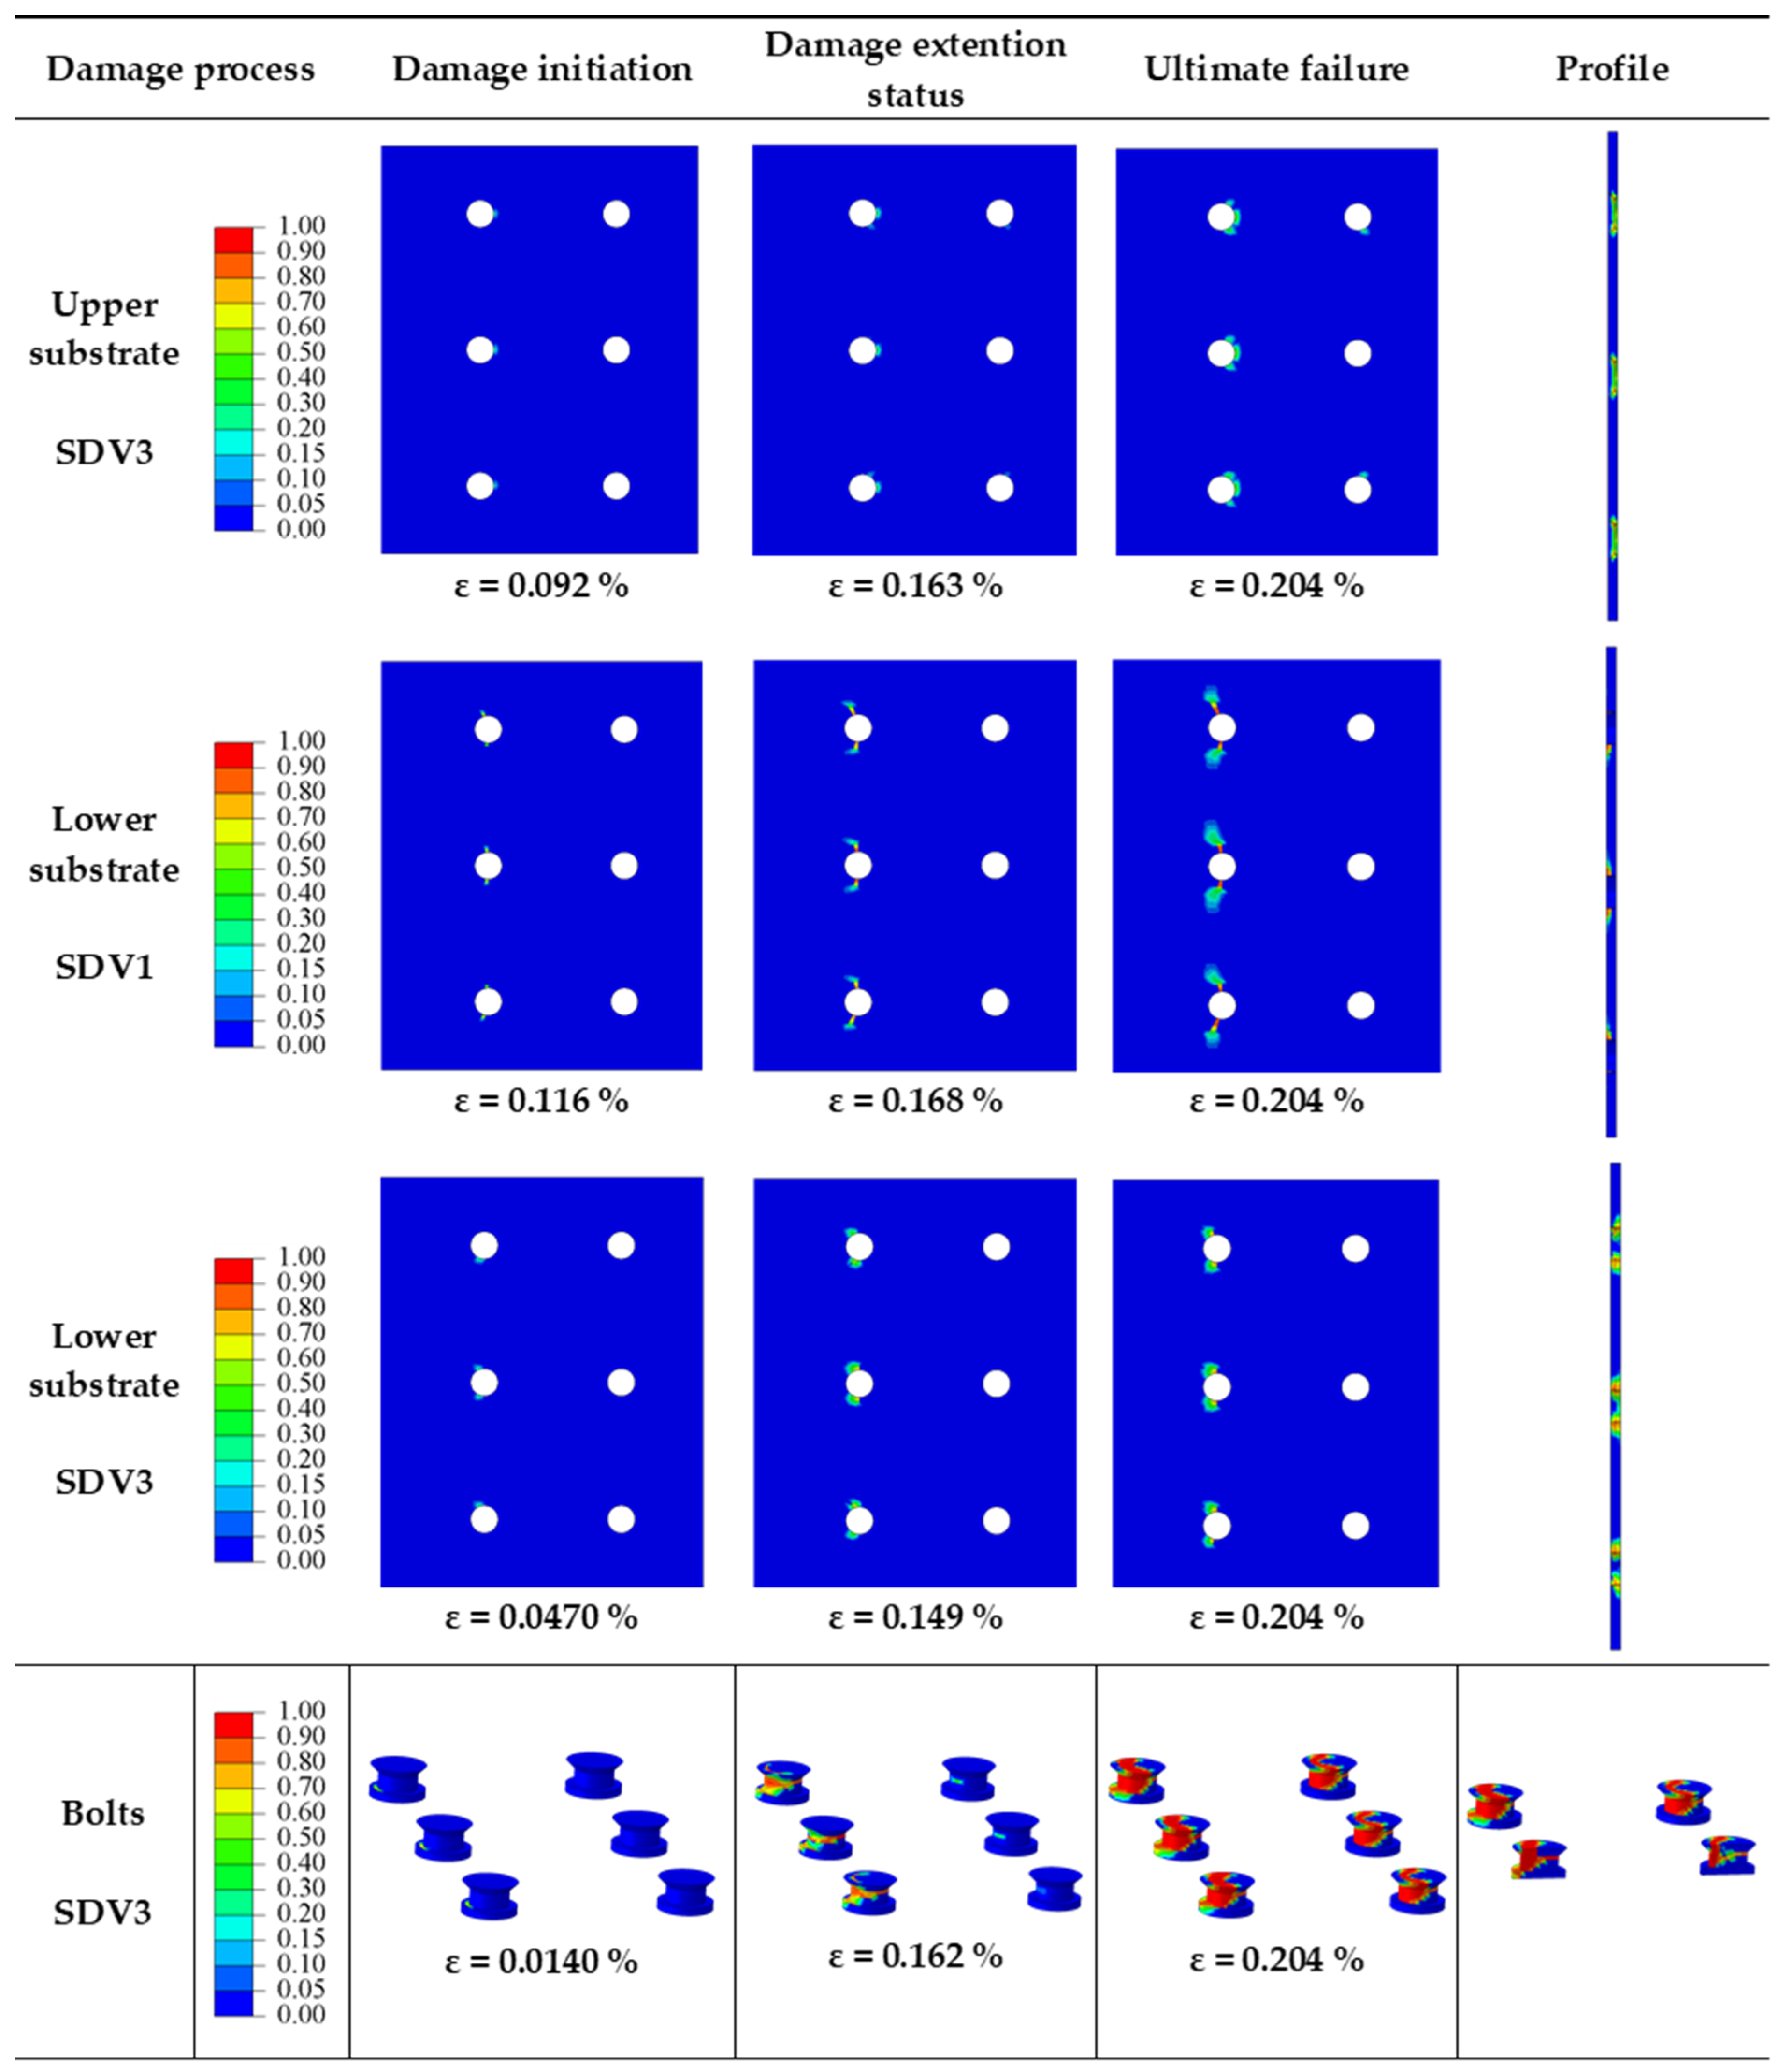
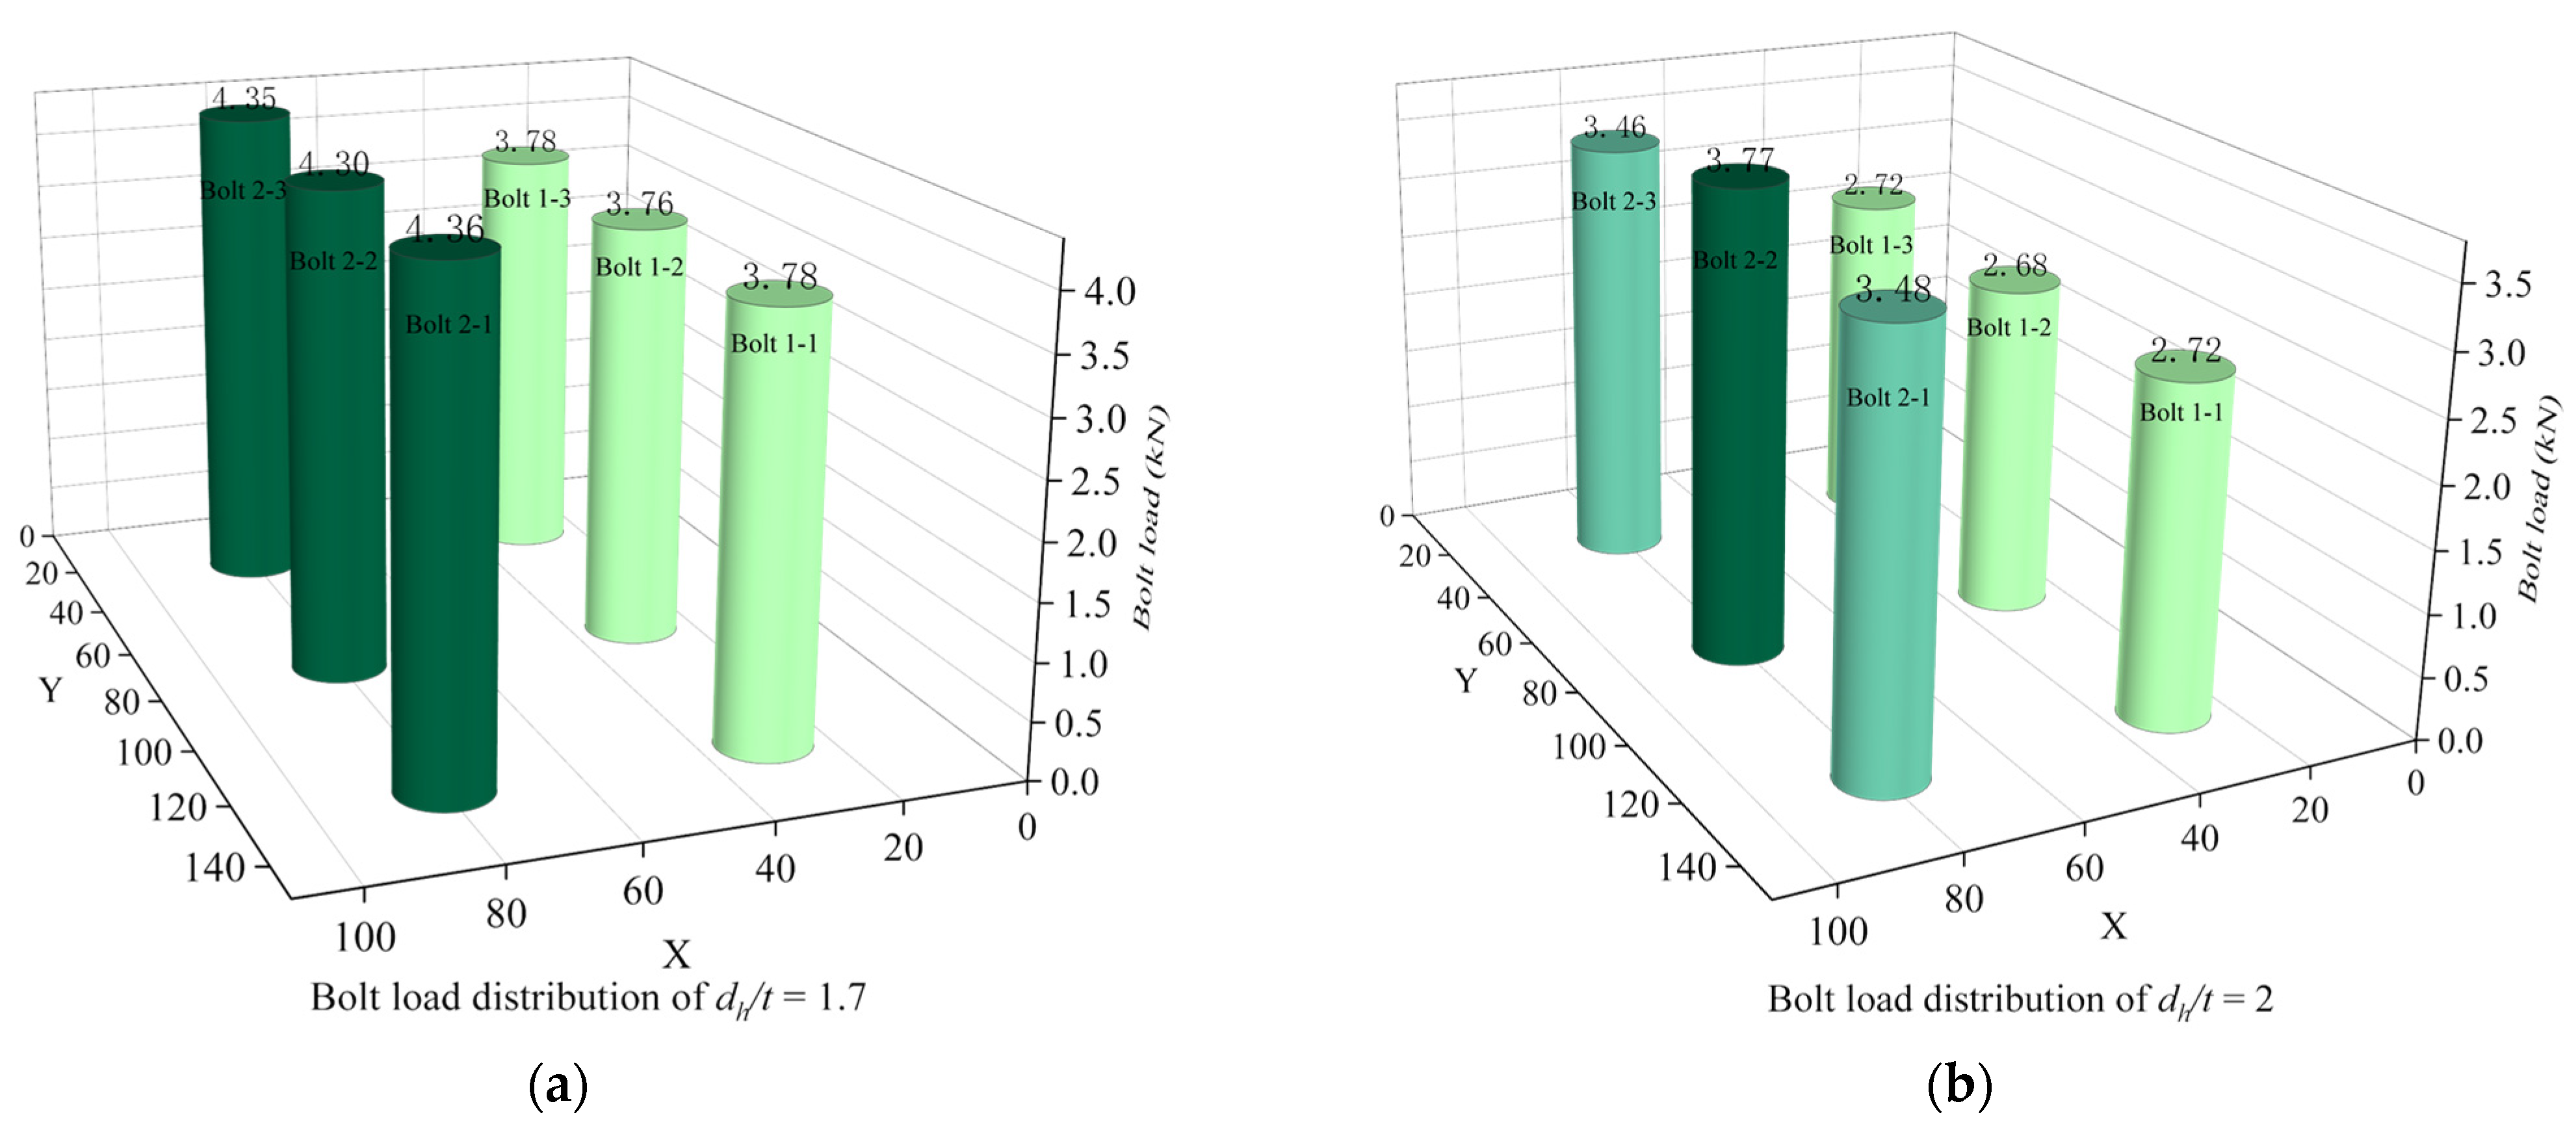
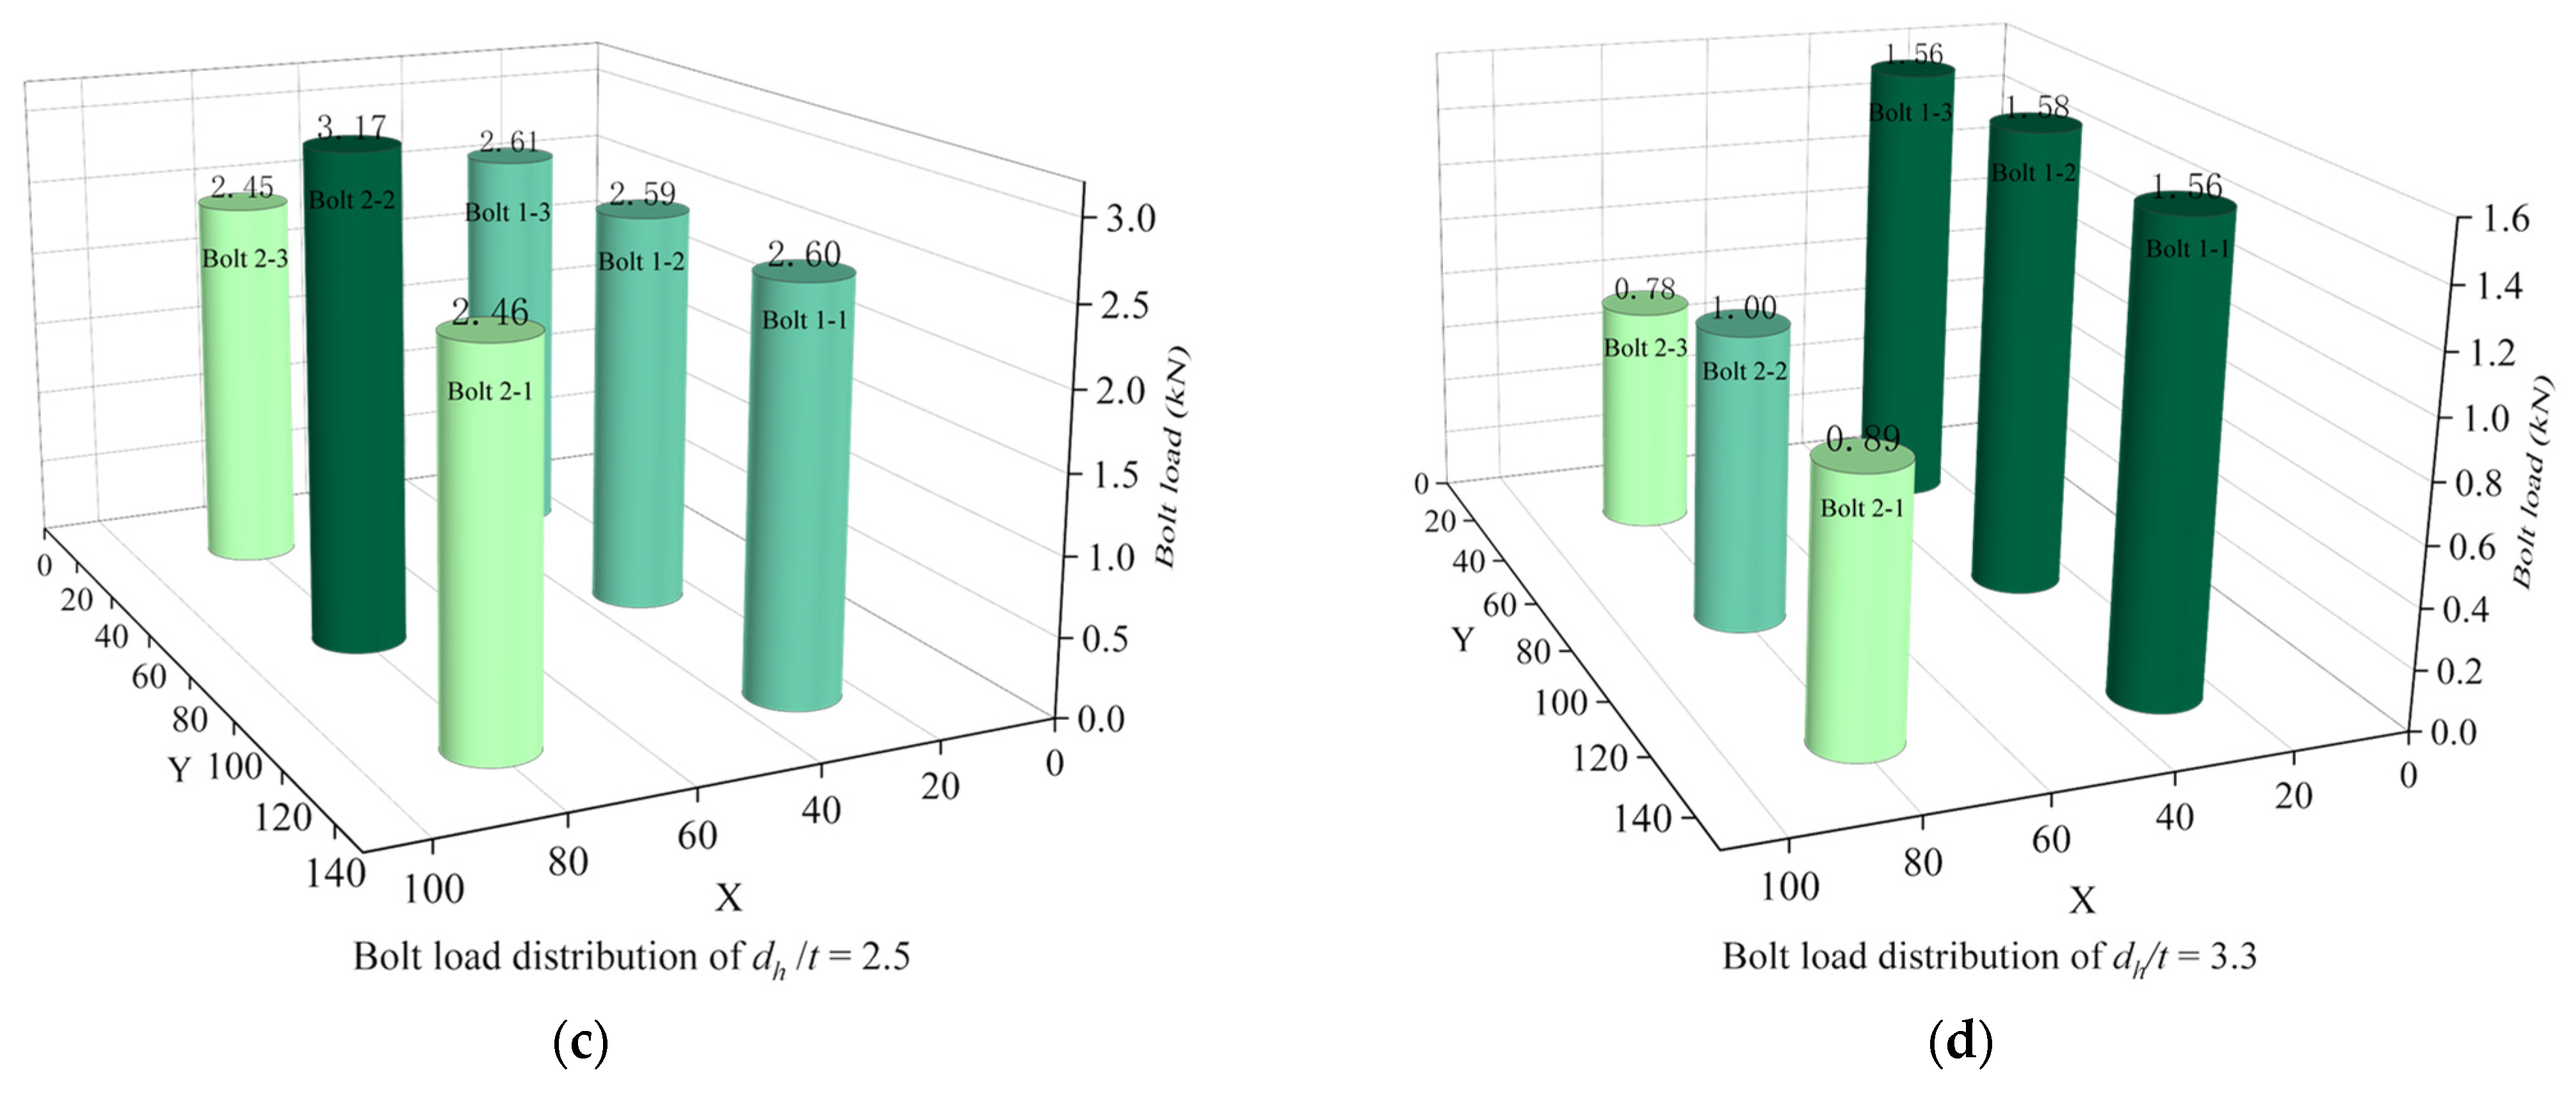
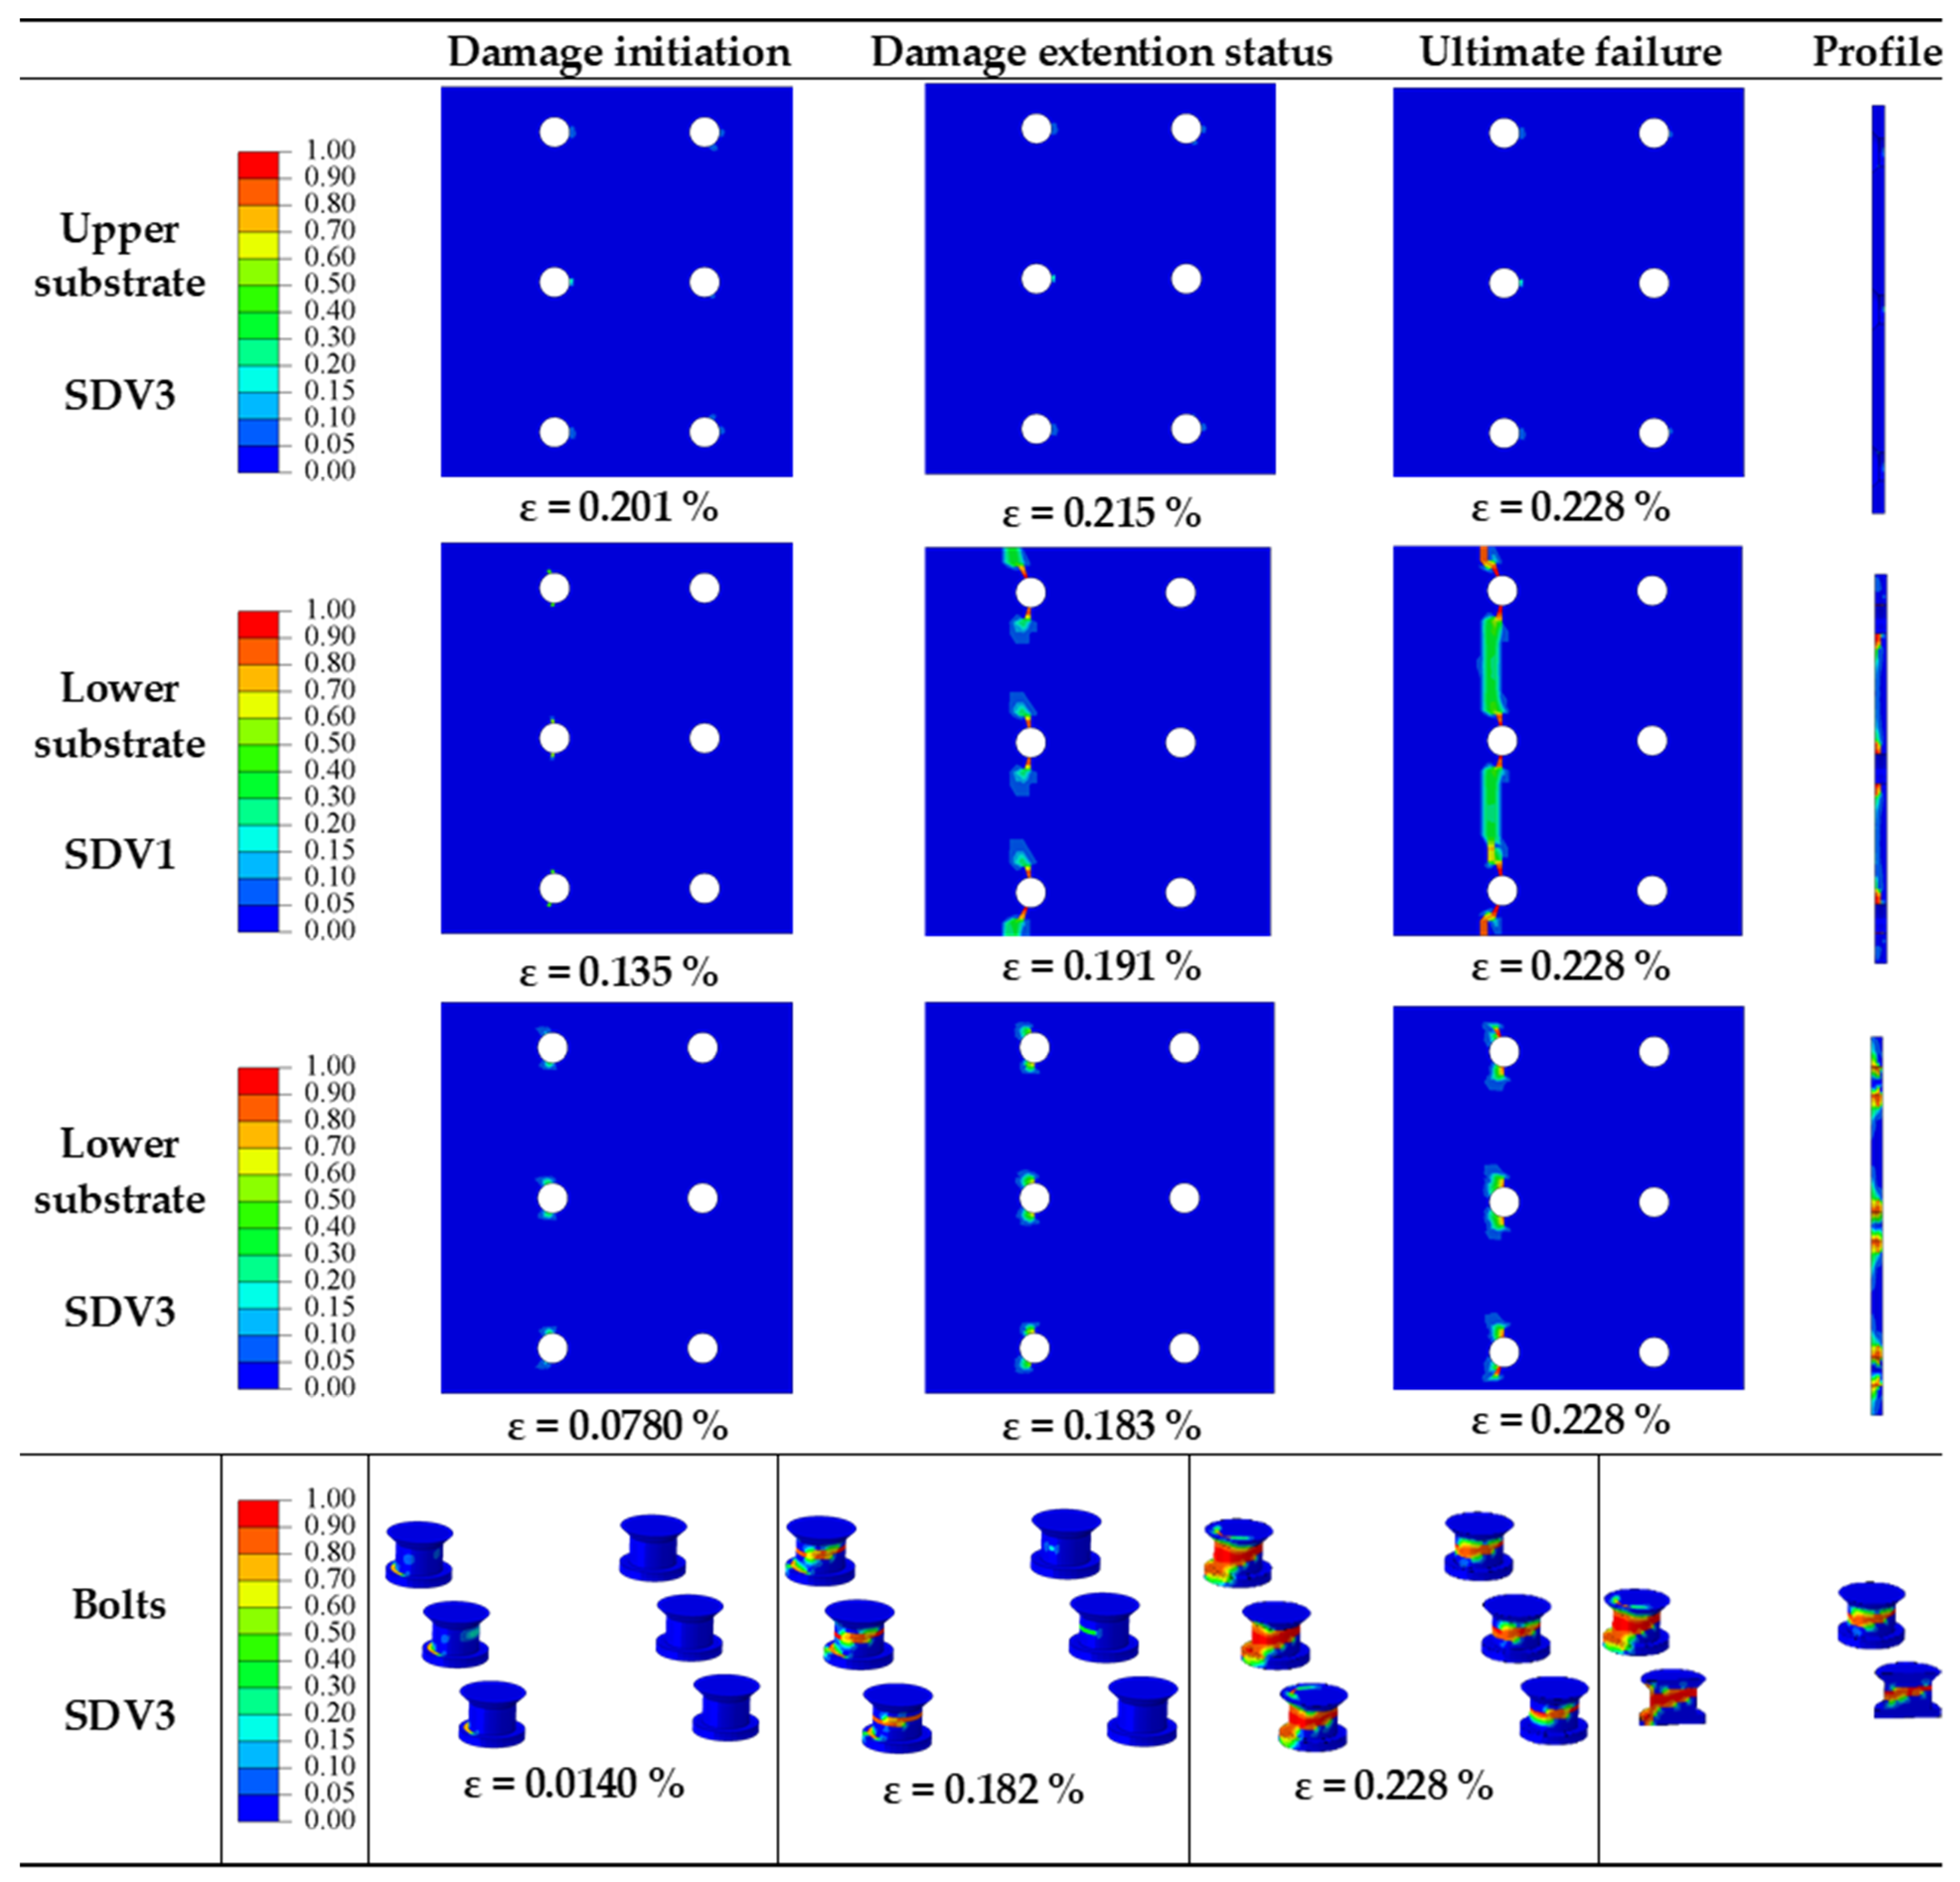
4.4. Effect of dh/t on Mechanical Behavior of Joint Structure
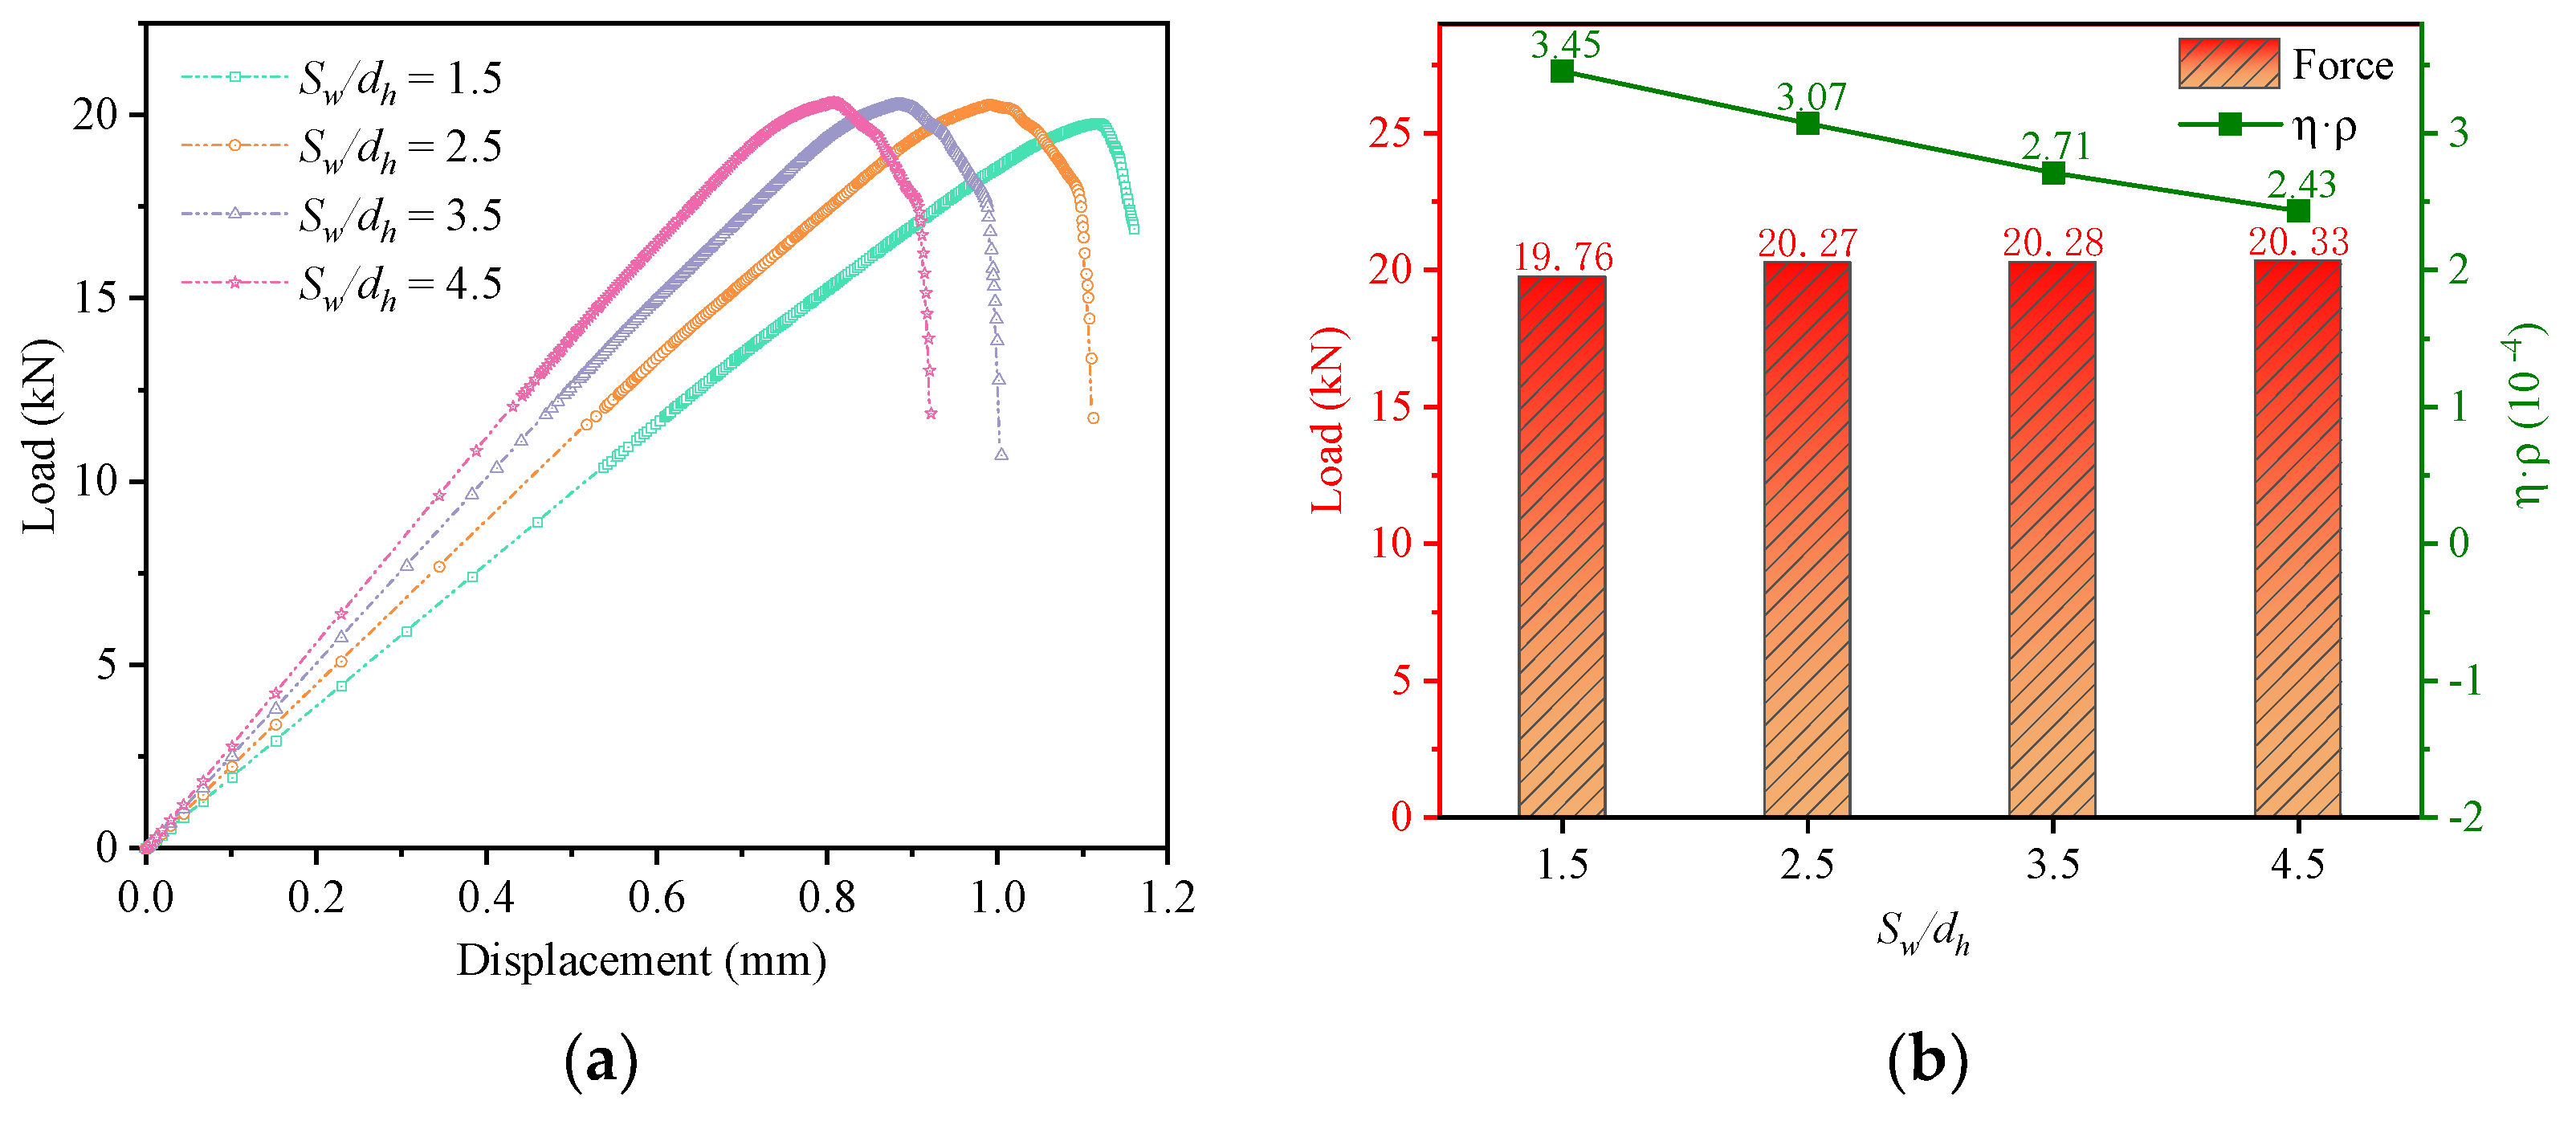
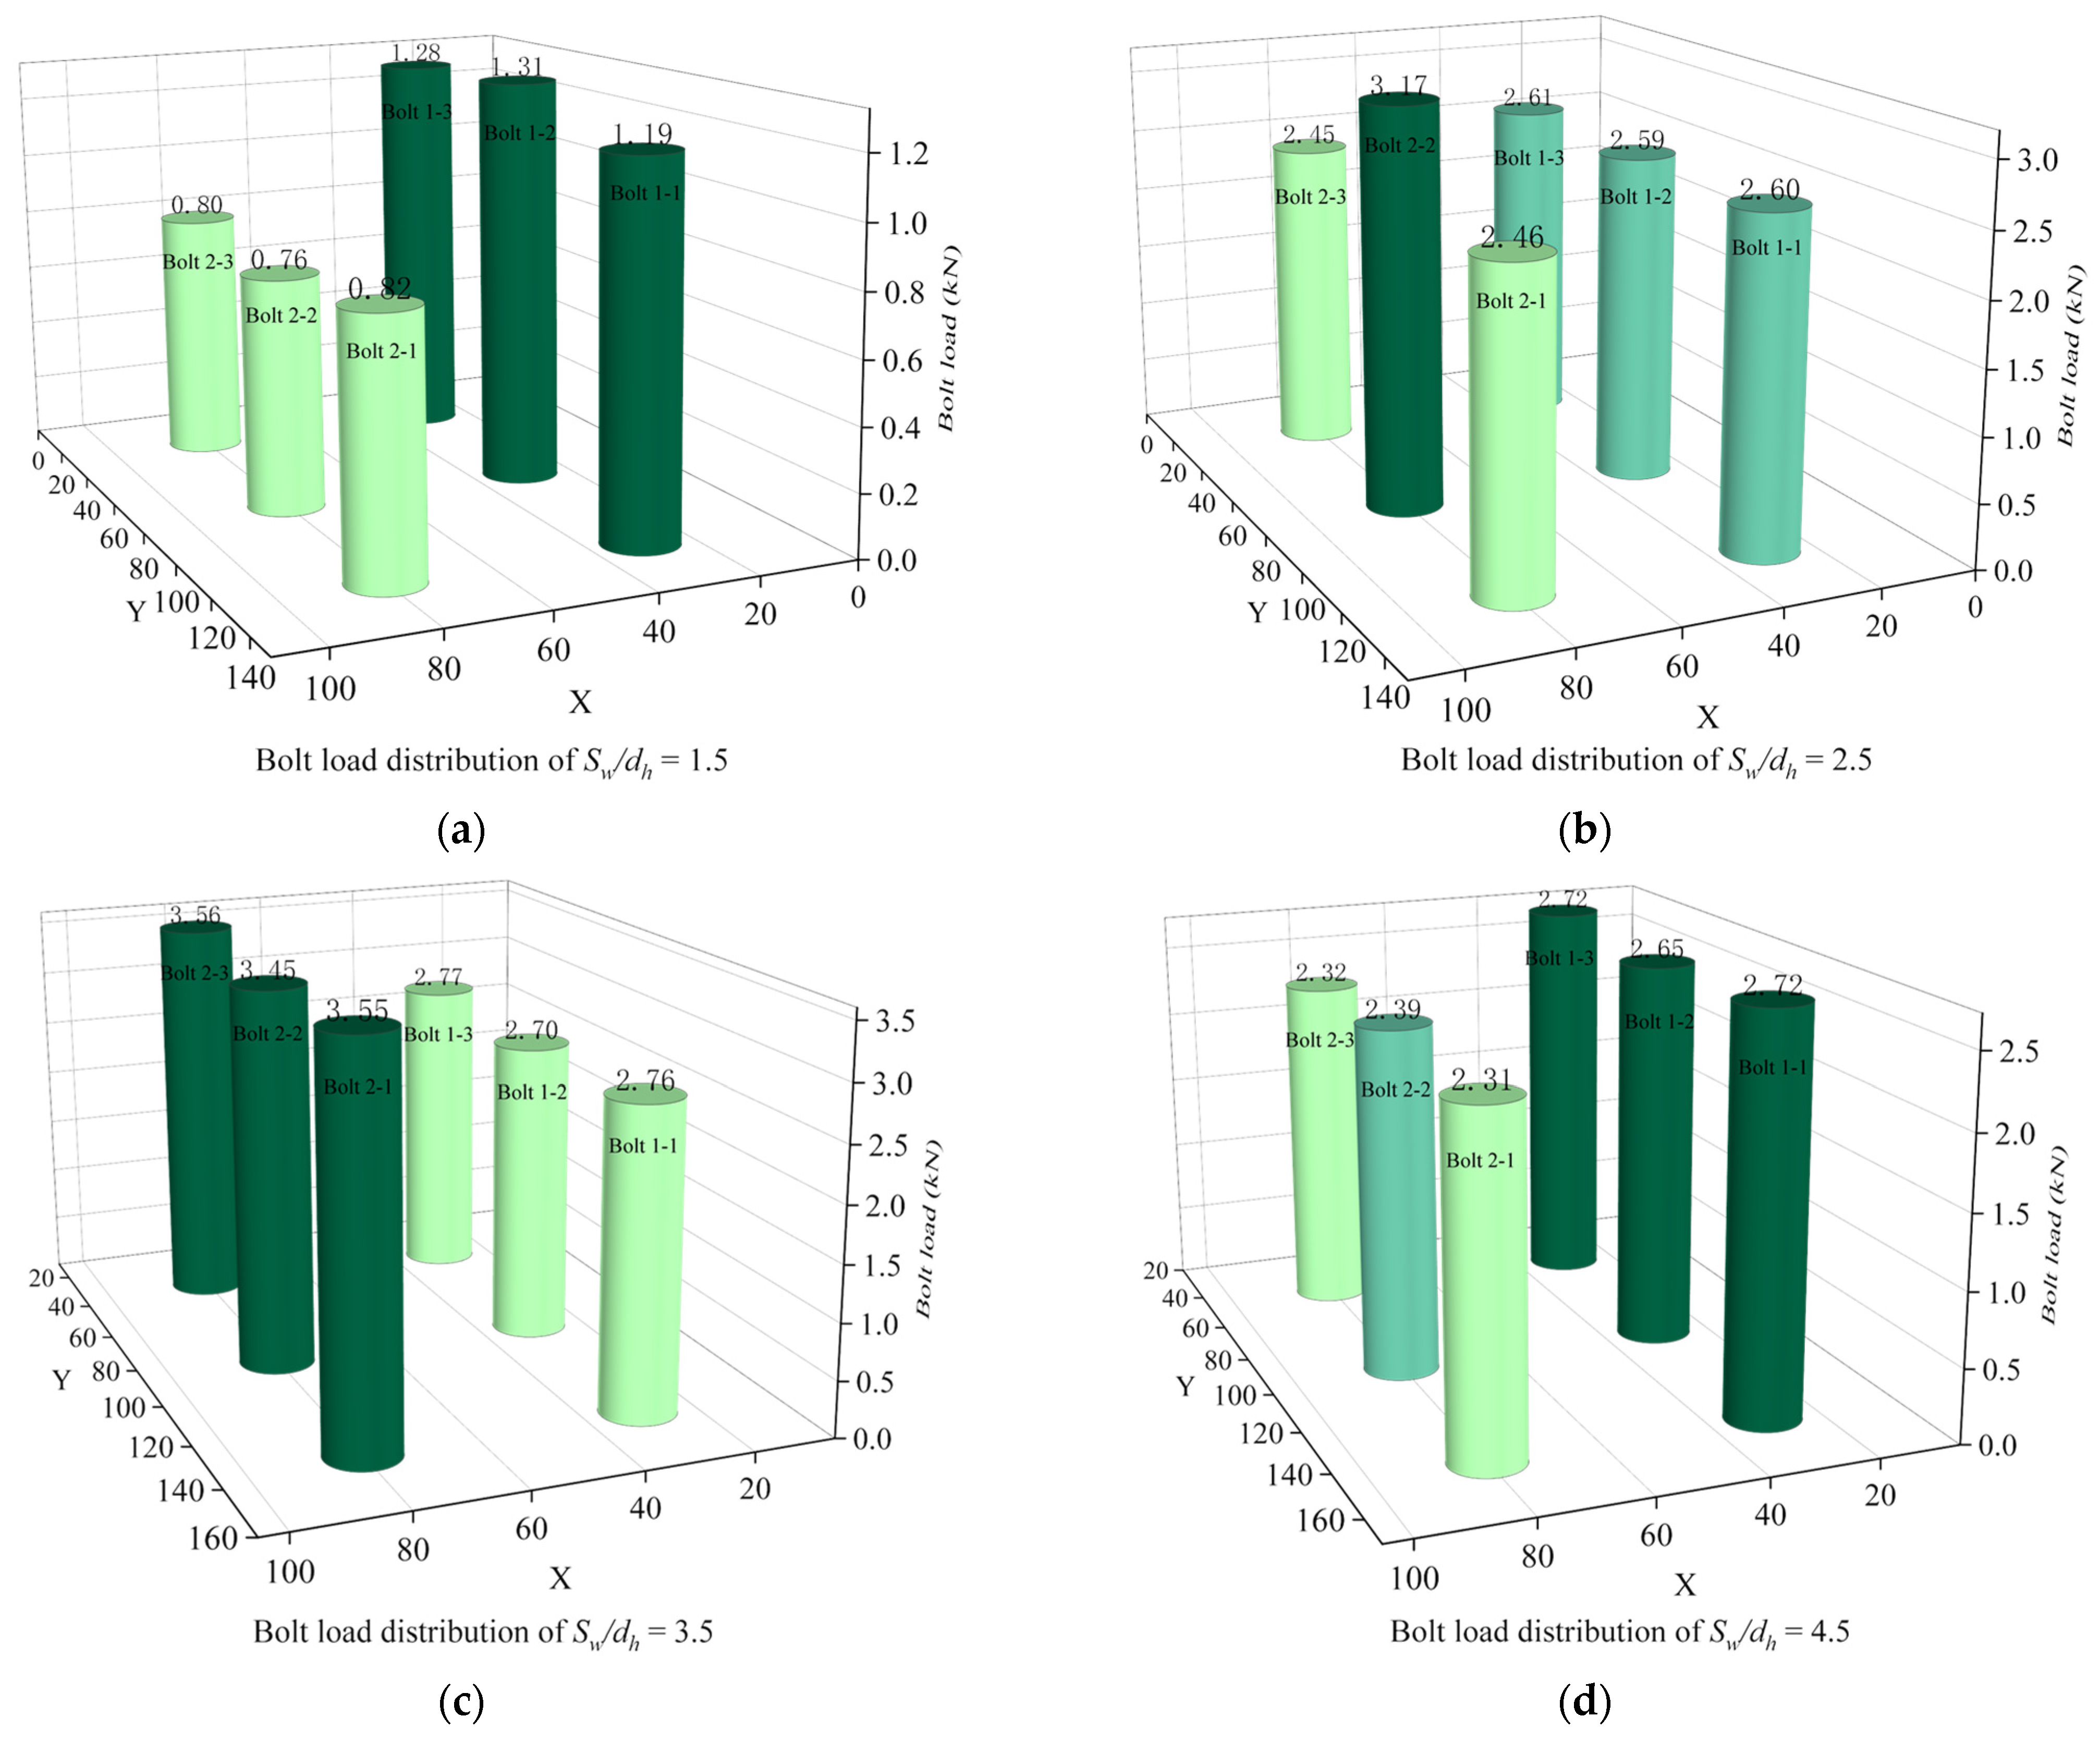
4.5. Effect of Sw/dh on Mechanical Behavior of Joint Structure
- (1)
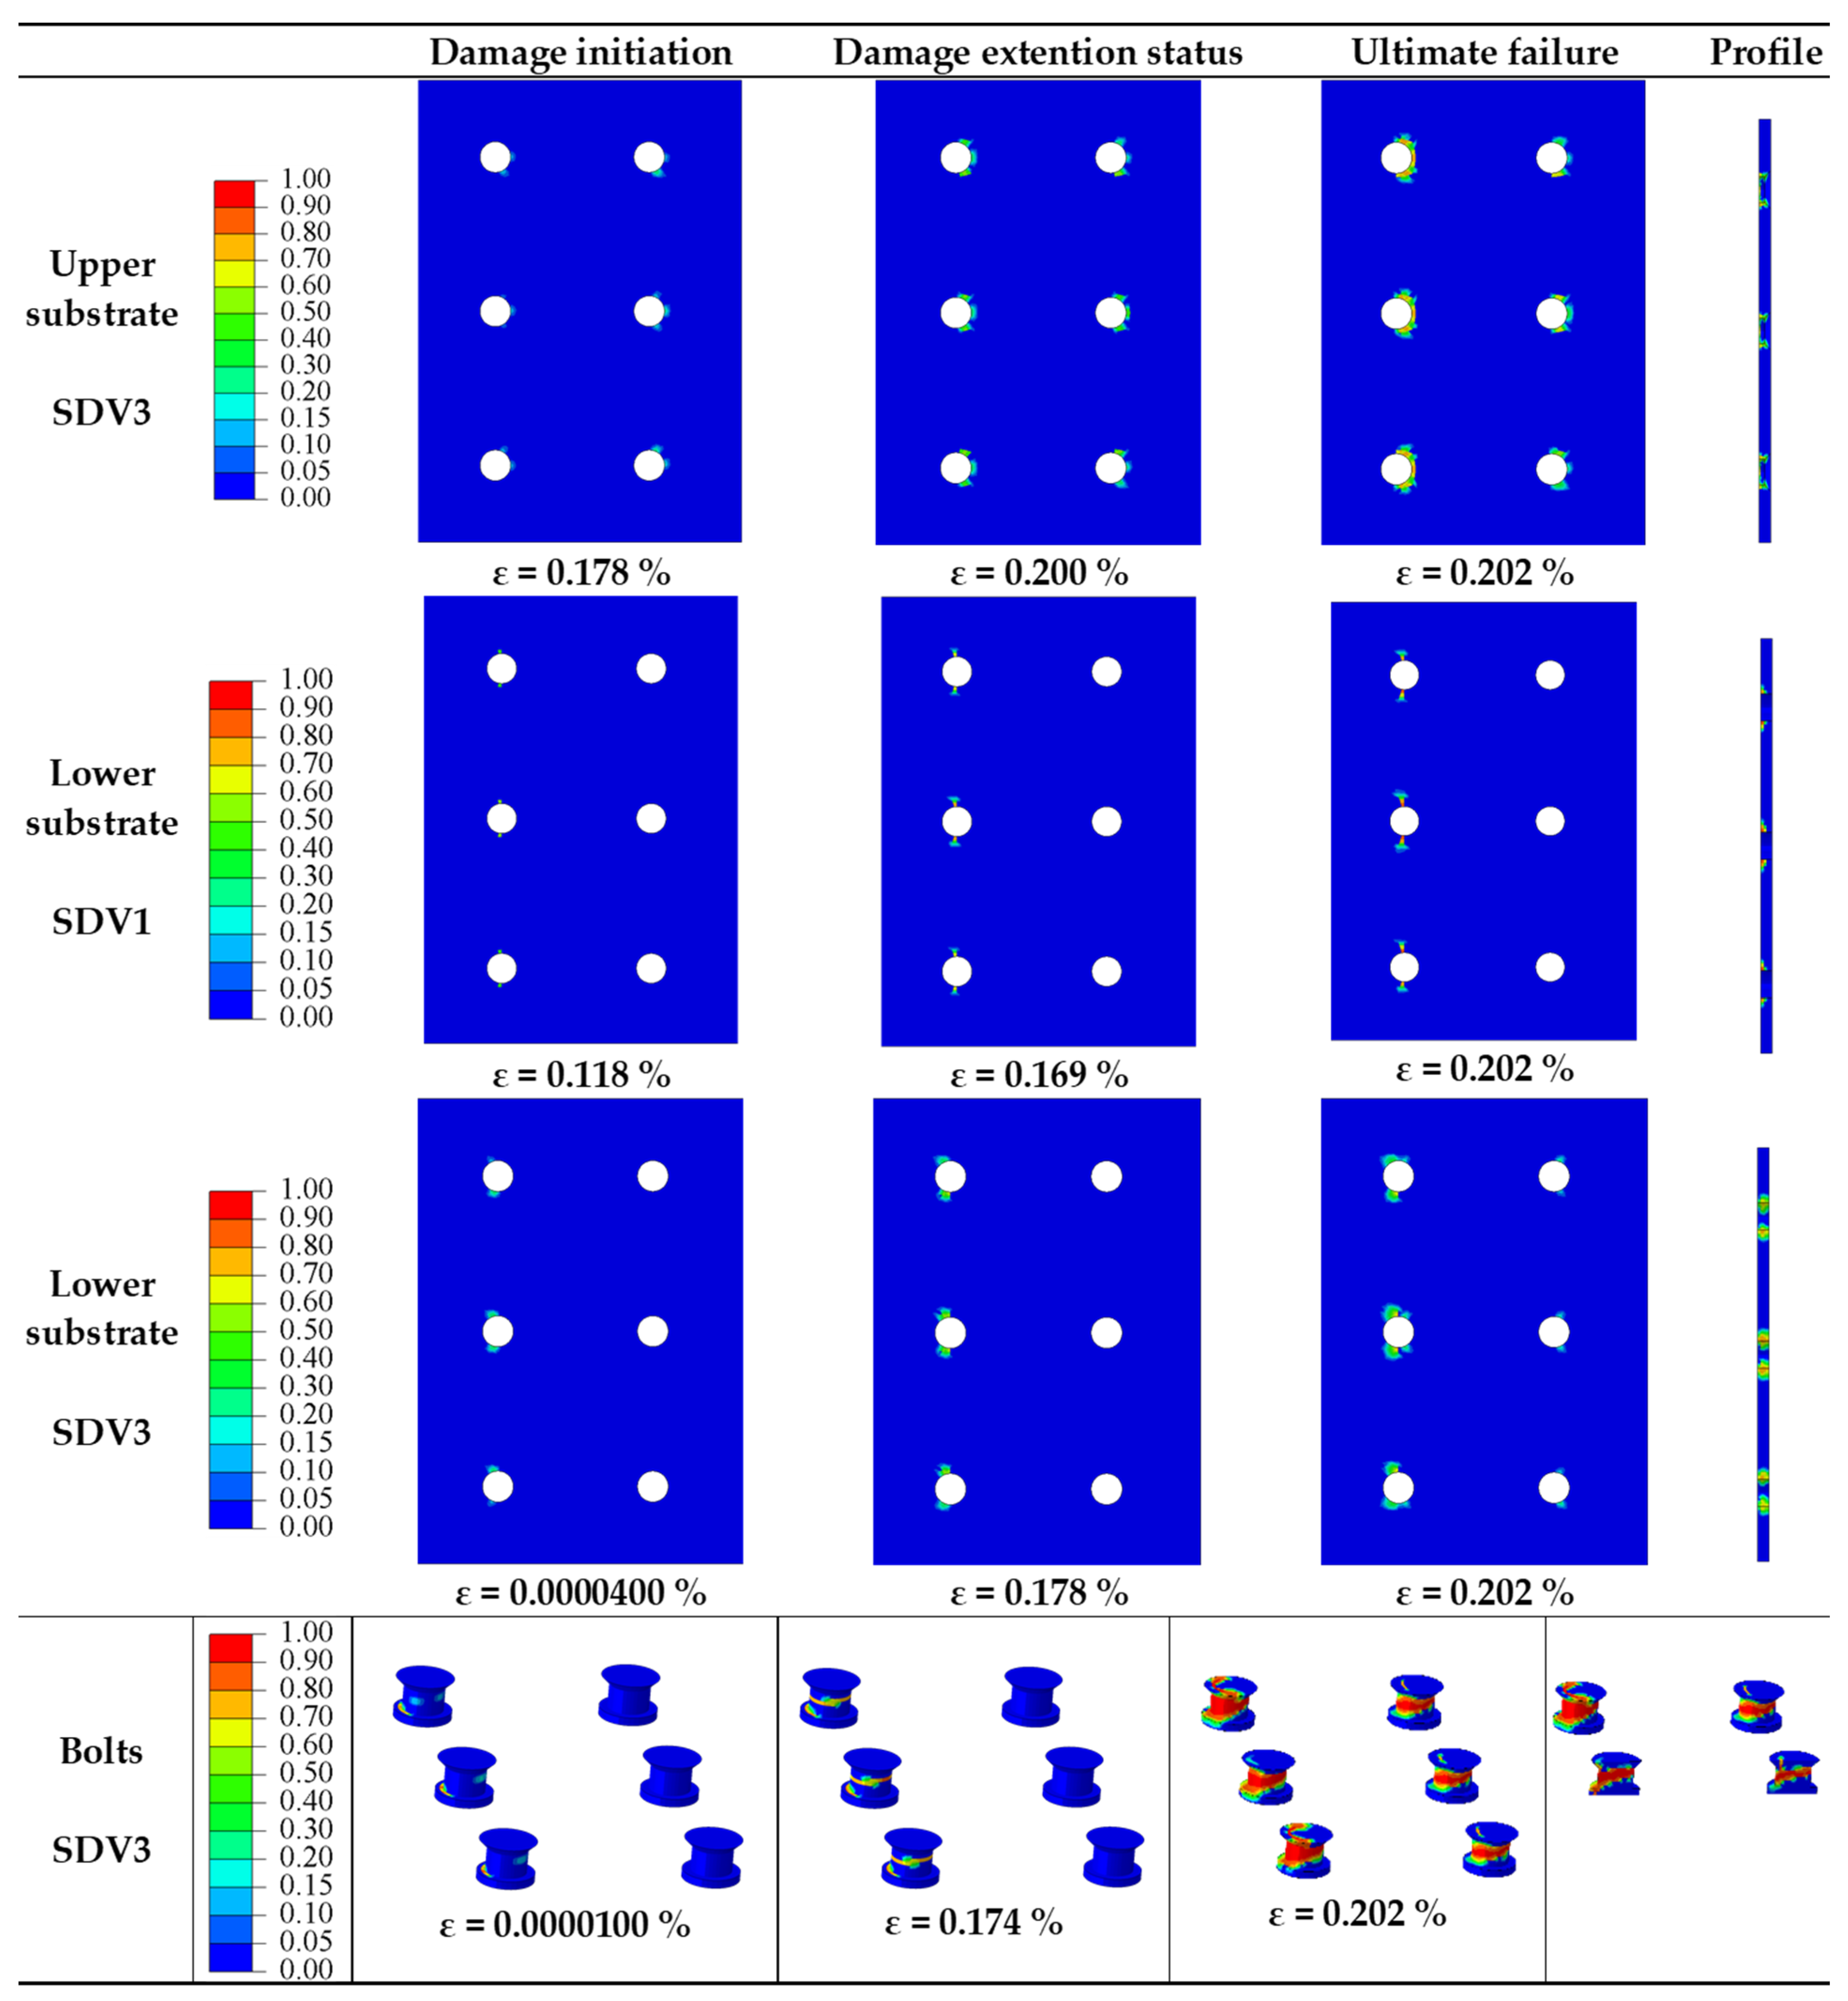
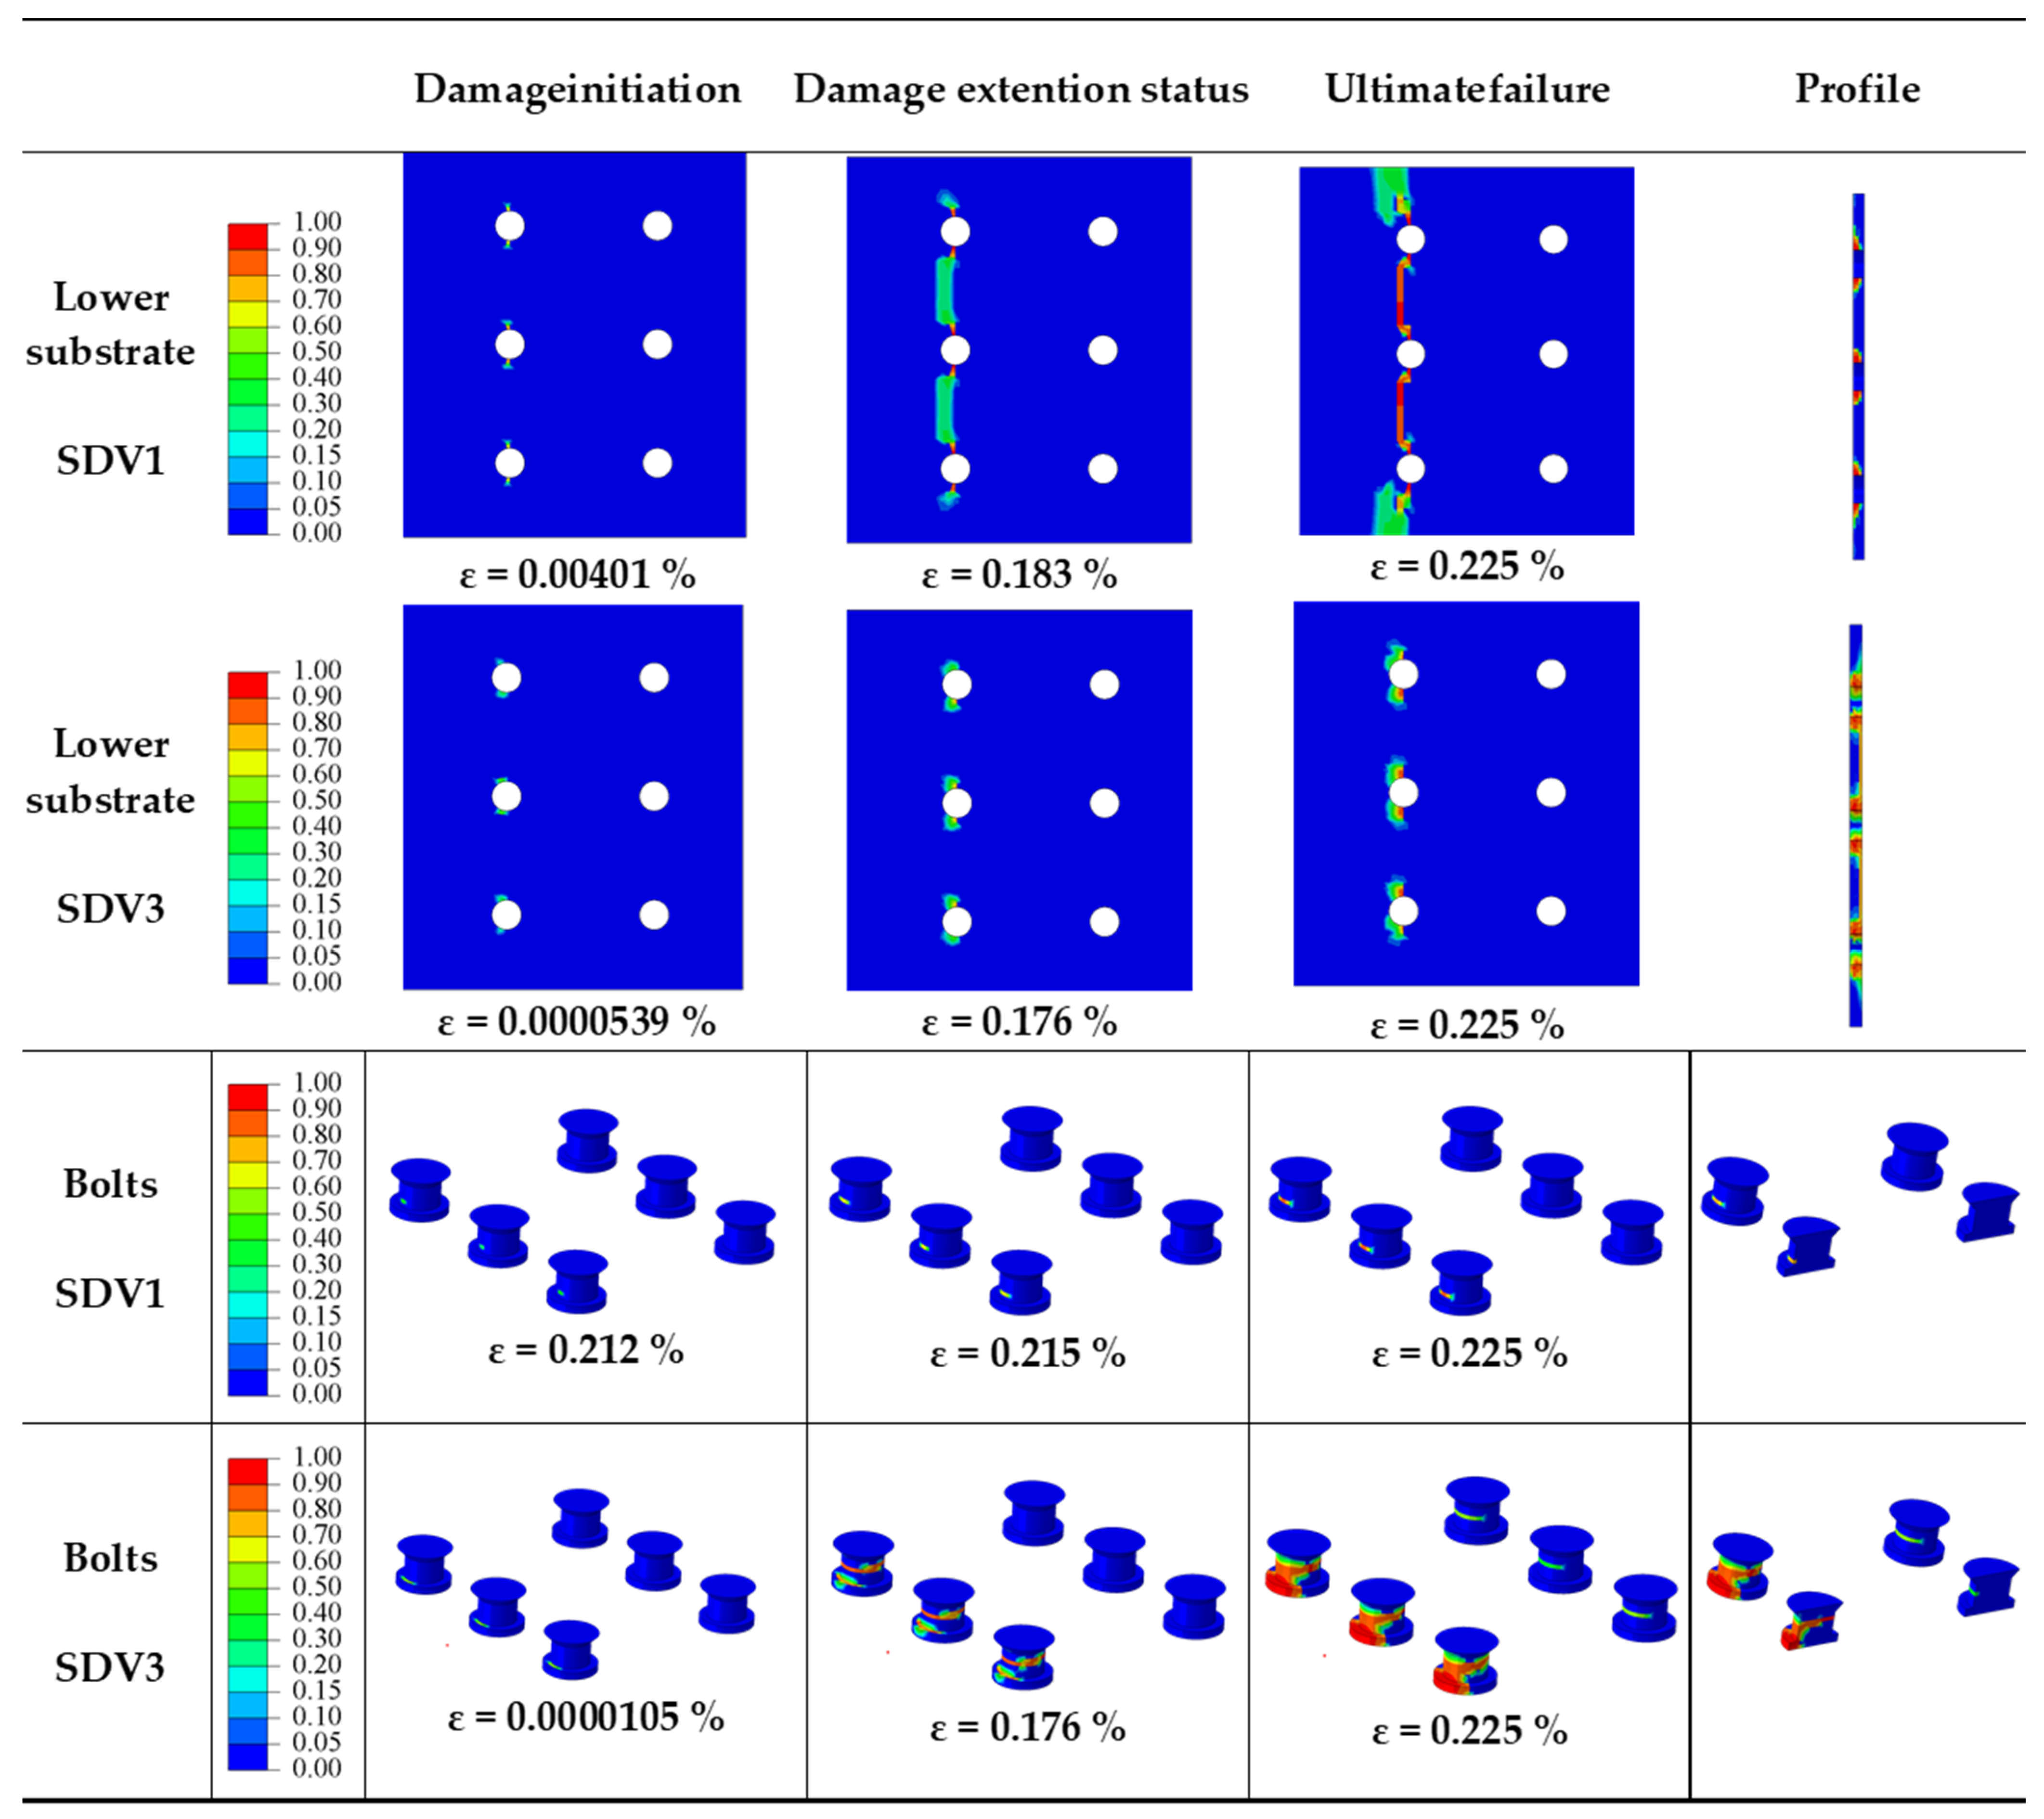
- The load capacity of the multi-bolt, countersunk C/SiC composite joint structure remains consistent as the ratio of bolt pitch to through hole diameter increases. The optimal ratio for this joint structure is 3 due to balanced bolt load distribution and efficient weight increment, while the damage pattern is primarily bolt matrix damage for ratios between 2 and 5.
- (2)
- The load capacity of the multi-bolt, countersunk C/SiC composite joint structure increases with the ratio of bolt spacing to through hole diameter. The optimal ratio for this joint structure is 4, resulting in uniform bolt load distribution and efficient weight increment. The damage pattern shifts from warp tensile damage to lower substrate for ratios between 2 and 4 and to bolt matrix damage when the ratio reaches 5.
- (3)
- The load capacity of the multi-bolt, countersunk C/SiC composite joint structure remains constant as the ratio of the distance between the free edge of the substrate to through hole diameter increases. The optimal ratio for this joint structure is 1.5, resulting in uniform bolt load distribution and maximum weight increment efficiency. The damage pattern is primarily bolt matrix damage for ratios between 1.5 and 3.
- (4)
- Increasing the ratio of through hole diameter to specimen thickness decreases the load-carrying capacity of the multi-bolt, countersunk C/SiC composite joint structure. However, it increases the weight increment efficiency. The most uniform bolt load distribution is observed at a ratio of 1.7. The optimal performance of the joint structure is achieved at a ratio of 1.7, with a change in the damage pattern occurring at a ratio of 2. The predominant damage pattern is bolt matrix damage for ratios between 1.7 and 2, while warp damage to the lower substrate becomes dominant for ratios between 2.5 and 3.3.
- (5)
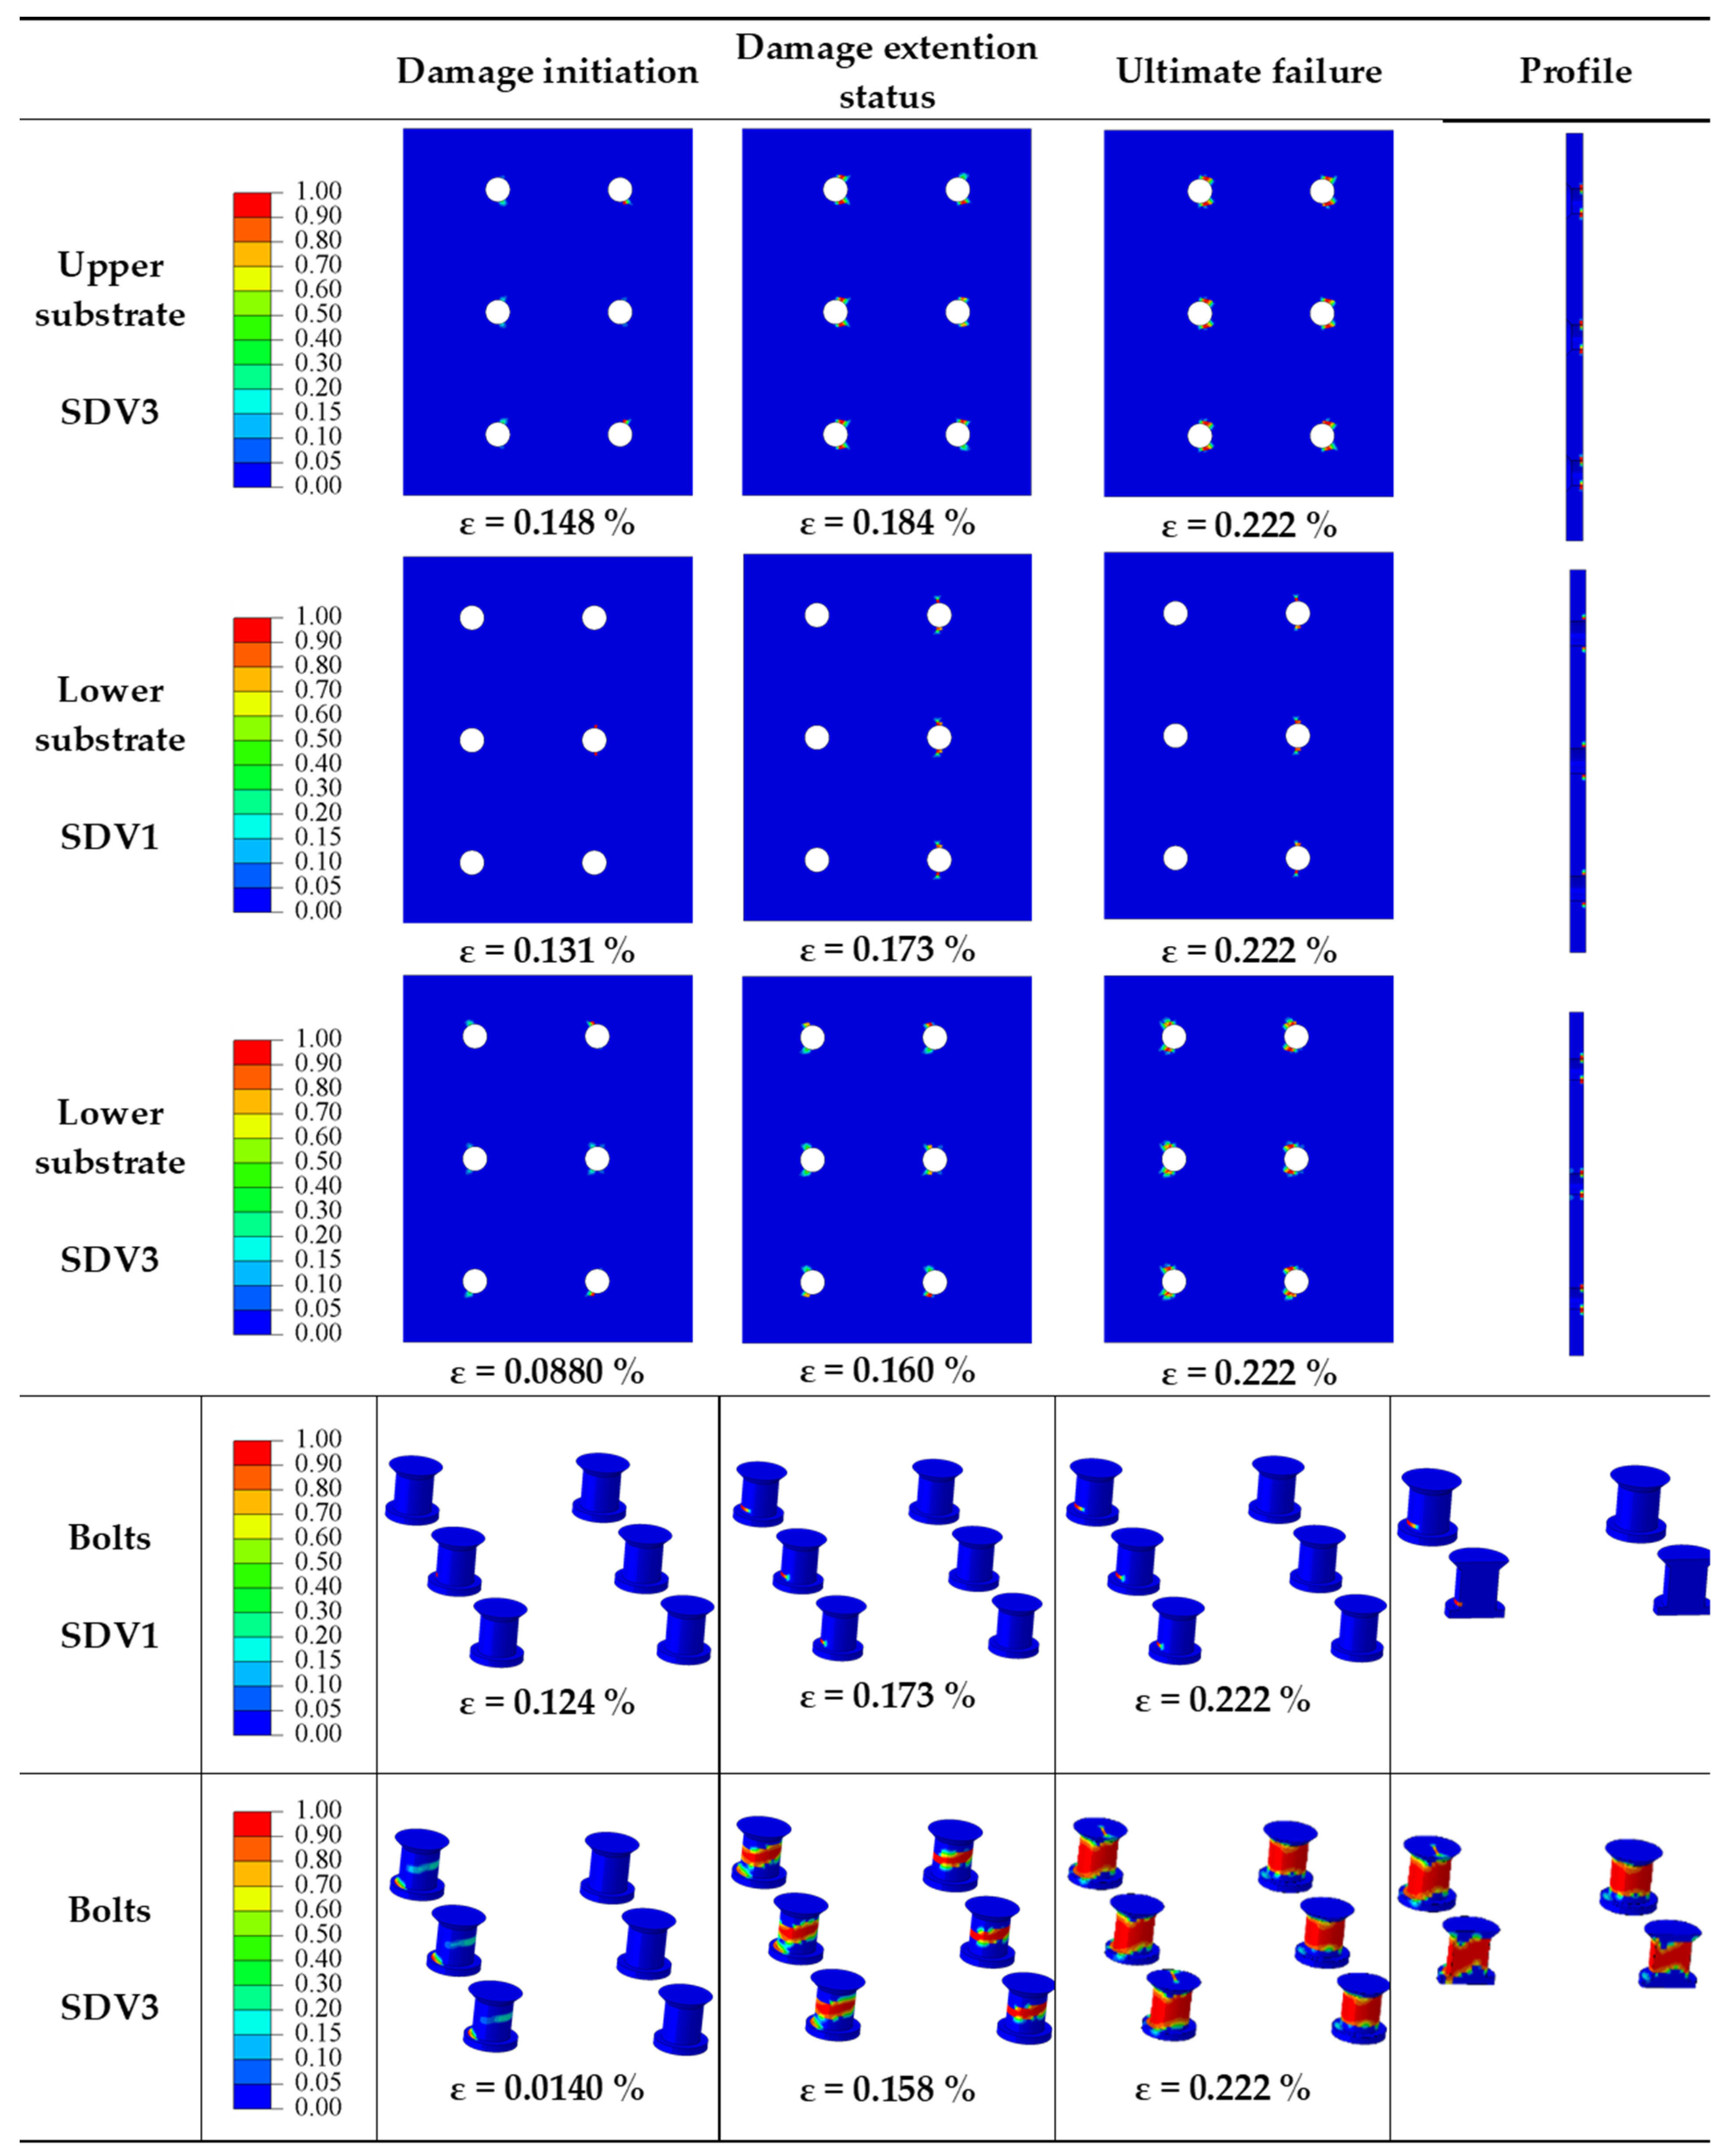
- The load capacity of the multi-bolt, countersunk C/SiC composite joint structure remains constant as the ratio of the distance between the edge of the substrate to through hole diameter increases. The optimal ratio for this joint structure is 1.5, resulting in uniform bolt load distribution and reduced weight increment efficiency. The damage pattern shifts from warp damage to the lower substrate at a ratio of 1.5 to bolt substrate damage for ratios between 2.5 and 4.5.
5. Conclusions
- (1)
- The optimal schemes derived from the three metrics of peak load, pin load distribution, and weight increment efficiency are a ratio of bolt pitch to through hole diameter of 3, a ratio of bolt spacing between columns to through hole diameter of 4, a ratio of distance between the free edge of the substrate to through hole diameter of 1.5, a ratio of through hole diameter to specimen thickness of 1.7, and a ratio of distance between the edge of the substrate to through hole diameter of 1.5, respectively.
- (2)
- Peak load increases with increasing ratio of bolt spacing between columns to through hole diameter and the ratio of through hole diameter to specimen thickness. Changes in the ratio of bolt pitch to through hole diameter, the ratio of the distance between the free edge of the substrate to through hole diameter, and the ratio of the distance between the edge of the substrate to through hole diameter would not affect the peak load.
- (3)
- In multi-bolt joint structures with different design parameters, matrix damage (SDV3) occurs in the bolts. Warp damage (SDV1) occurs in the net-tension damage region of the lower substrate when the ratio of bolt spacing to through hole diameter is not greater than 4 or when the ratio of distance between the edge of the substrate to through hole diameter is not greater than 1.5.
Author Contributions
Funding
Informed Consent Statement
Data Availability Statement
Conflicts of Interest
References
- Babu, K.N.; Naresh, H.; Srinivasa Gupta, G. Design And Analysis of Bolted Joint For Rocket Motor Casing. Mater. Today Proc. 2018, 5, 5165–5174. [Google Scholar] [CrossRef]
- Pichon, G.; Daidié, A.; Paroissien, E.; Benaben, A. Quasi-static strength and fatigue life of aerospace hole-to-hole bolted joints. Eng. Fail. Anal. 2023, 143, 106860. [Google Scholar] [CrossRef]
- Sonar, T.; Balasubramanian, V.; Malarvizhi, S.; Venkateswaran, T.; Sivakumar, D. Maximizing strength and corrosion resistance of InterPulsed TIG welded Superalloy 718 joints by RSM for aerospace applications. CIRP J. Manuf. Sci. Technol. 2021, 35, 474–493. [Google Scholar] [CrossRef]
- Shan, M.; Zhang, R.; Liu, F.; Zhao, L. A characteristic curve including hygrothermal effects for predicting the failure of composite multi-bolt joints. Compos. Commun. 2022, 36, 101384. [Google Scholar] [CrossRef]
- Zhang, Y.; Zhou, Z.; Pan, S.; Tan, Z. Comparison on failure behavior of three-dimensional woven carbon/carbon composites joints subjected to out-of-plane loading at room and high temperature. Compos. Commun. 2021, 23, 100567. [Google Scholar] [CrossRef]
- You, Y.; Liu, M.; Liu, Y.; Wang, P.; Zhou, S.; Chen, J. Experimental studies on thread-fixed one-side bolted T-stubs in tension at elevated temperatures. J. Constr. Steel Res. 2020, 171, 106139. [Google Scholar] [CrossRef]
- Zhao, Y.; Chen, Y.; He, C.; Ai, S.; Fang, D. A damage-induced short-circuit diffusion model applied to the oxidation calculation of ceramic matrix composites (CMCs). Compos. Part A Appl. Sci. Manuf. 2019, 127, 105621. [Google Scholar] [CrossRef]
- Zhang, Y.; Zhang, L.; Yin, X.; Zhang, J.; He, Z.; Ye, F. Oxidation behaviors and shear properties of z-pinned joint made of two-dimensional carbon fiber reinforced silicon carbide composite. Ceram. Int. 2016, 42, 11974–11981. [Google Scholar] [CrossRef]
- Liu, L.; Chen, H.; Sun, L.; Jin, X.; Li, S.; Wang, P.; Chen, C. Behavior of thread-fixed one-side bolts bolted T-stubs with arc-shaped flange to steel tube under tension. Eng. Struct. 2023, 279, 115647. [Google Scholar] [CrossRef]
- Wang, P.; You, Y.; Xu, Q.; Wang, Q.; Liu, F. Shear Behavior of Lapped Connections Bolted by thread-fixed one-side bolts at elevated temperatures. Fire Saf. J. 2021, 125, 103415. [Google Scholar] [CrossRef]
- Casalegno, V.; Smeacetto, F.; Salvo, M.; Sangermano, M.; Baino, F.; Noé, C.; Orlandi, M.; Piavani, R.; Bonfanti, R.; Ferraris, M. Study on the joining of ceramic matrix composites to an Al alloy for advanced brake systems. Ceram. Int. 2021, 47, 23463–23473. [Google Scholar] [CrossRef]
- Tang, Y.; Zhou, Z.; Pan, S.; Xiong, J.; Guo, Y. Mechanical property and failure mechanism of 3D Carbon–Carbon braided composites bolted joints under unidirectional tensile loading. Mater. Des. 2015, 65, 243–253. [Google Scholar] [CrossRef]
- Zhou, Y.; Fei, Q.; Tao, J. Profile design of loaded pins in composite single lap joints: From circular to non-circular. Results Phys. 2016, 6, 471–480. [Google Scholar] [CrossRef]
- Rouhi, M.S.; Ramantani, D.; Tay, T.E. 3D explicit simulation of bearing failure in metal–composite bolted joints. Compos. Struct. 2022, 284, 115108. [Google Scholar] [CrossRef]
- Zhou, Y.; Xiao, Y.; He, Y.; Zhang, Z. A detailed finite element analysis of composite bolted joint dynamics with multiscale modeling of contacts between rough surfaces. Compos. Struct. 2020, 236, 111874. [Google Scholar] [CrossRef]
- Shamaei-Kashani, A.R.; Shokrieh, M.M. An analytical approach to predict the mechanical behavior of single-lap single-bolt composite joints reinforced with carbon nanofibers. Compos. Struct. 2019, 215, 116–126. [Google Scholar] [CrossRef]
- Fu, M.; Fang, G.; Liu, S.; Wang, B.; Zhou, Z.; Liang, J. Failure analysis of 2D C/SiC composite z-pinned/bonded hybrid single-lap joints. Ceram. Int. 2020, 46, 21216–21224. [Google Scholar] [CrossRef]
- Mandal, B.; Chakraborty, S.; Chakrabarti, A. A hybrid approach for global sensitivity analysis of FRP composite multi-bolt joints. Compos. Struct. 2019, 208, 189–199. [Google Scholar] [CrossRef]
- Qiu, C.; Han, Y.; Shanmugam, L.; Jiang, F.; Guan, Z.; Du, S.; Yang, J. An even-load-distribution design for composite bolted joints using a novel circuit model and neural network. Compos. Struct. 2022, 279, 114709. [Google Scholar] [CrossRef]
- Zhao, L.; Yang, W.; Cao, T.; Li, H.; Liu, B.; Zhang, C.; Zhang, J. A progressive failure analysis of all-C/SiC composite multi-bolt joints. Compos. Struct. 2018, 202, 1059–1068. [Google Scholar] [CrossRef]
- Taheri-Behrooz, F.; Shamaei Kashani, A.R.; Hefzabad, R.N. Effects of material nonlinearity on load distribution in multi-bolt composite joints. Compos. Struct. 2015, 125, 195–201. [Google Scholar] [CrossRef]
- Hashin, Z. Failure Criteria for Unidirectional Fiber Composites. J. Appl. Mech.-Trans. ASME 1980, 47, 329–334. [Google Scholar] [CrossRef]
- Qu, H.; Li, D.; Li, R.; Ge, E.; Zhai, Y. Effect of forced assembly on bearing performance of single-lap, countersunk composite bolted joints—Part II: Numerical investigation. Compos. Struct. 2023, 319, 117169. [Google Scholar] [CrossRef]
- Cheng, X.; Wang, S.; Zhang, J.; Huang, W.; Cheng, Y.; Zhang, J. Effect of damage on failure mode of multi-bolt composite joints using failure envelope method. Compos. Struct. 2017, 160, 8–15. [Google Scholar] [CrossRef]
- Cao, Y.; Zuo, D.; Zhao, Y.; Cao, Z.; Zhi, J.; Zheng, G.; Tay, T.E. Experimental investigation on bearing behavior and failure mechanism of double-lap thin-ply composite bolted joints. Compos. Struct. 2021, 261, 113565. [Google Scholar] [CrossRef]
- Lopez-Cruz, P.; Laliberté, J.; Lessard, L. Investigation of bolted/bonded composite joint behaviour using design of experiments. Compos. Struct. 2017, 170, 192–201. [Google Scholar] [CrossRef]
- Ding, G.; Feng, P.; Wang, Y.; Ai, P. Novel pre-clamp lap joint for CFRP plates: Design and experimental study. Compos. Struct. 2022, 302, 116240. [Google Scholar] [CrossRef]
- Zhou, W.; Zhang, R.; Fang, D. Design and analysis of the porous ZrO2/(ZrO2 + Ni) ceramic joint with load bearing–heat insulation integration. Ceram. Int. 2016, 42, 1416–1424. [Google Scholar] [CrossRef]
- ASTM D5961; Standard Test Method for Bearing Response of Polymer Matrix Composite Laminates. American Society for Testing and Materials: West Conshohocken, PA, USA, 2017.
- GB/T 5279-1985; Countersunk Head Screws. Head Configuration and Gauging. Standardization Institute of the Ministry of Machinery Industry: Beijing, China, 1985.
- Huang, C.-H.; Lee, Y.-J. Experiments and simulation of the static contact crush of composite laminated plates. Compos. Struct. 2003, 61, 265–270. [Google Scholar] [CrossRef]
- Qing, H.; Mishnaevsky, L. 3D constitutive model of anisotropic damage for unidirectional ply based on physical failure mechanisms. Comput. Mater. Sci. 2010, 50, 479–486. [Google Scholar] [CrossRef]
- Yang, Y.; Liu, X.; Wang, Y.-Q.; Gao, H.; Li, R.; Bao, Y. A progressive damage model for predicting damage evolution of laminated composites subjected to three-point bending. Compos. Sci. Technol. 2017, 151, 85–93. [Google Scholar] [CrossRef]
- Cushman, J.B.; Mccleskey, S.F.; Ward, S.H. Test and Analysis of Celion 3000/PMR-15, Graphite/Polyimide Bonded Composite Joints: Summary; NASA: Washington, DC, USA, 1983. [Google Scholar]
- McCarthy, C.T.; McCarthy, M.A.; Lawlor, V.P. Progressive damage analysis of multi-bolt composite joints with variable bolt–hole clearances. Compos. Part B Eng. 2005, 36, 290–305. [Google Scholar] [CrossRef]


| Modulus (Gpa) | E1 = E2 | E3 | G12 | G13 = G23 | Poisson Ratio | ν12 | ν13 = ν23 |
|---|---|---|---|---|---|---|---|
| 120 | 60 | 44.4 | 24 | 0.25 | 0.35 | ||
| Strength (Mpa) | XT = YT | XC = YC | ZT | ZC | S12 | S13 = S23 | |
| 238.91 | 409.40 | 60.31 | 120.19 | 114.53 | 34.68 |
| No. | P/dh | S/dh | e/dh | dh/t | Sw/dh | P (mm) | S (mm) | e (mm) | Sw (mm) | W × t × L (mm3) |
|---|---|---|---|---|---|---|---|---|---|---|
| 1 | 2 | 5 | 3 | 2.5 | 2.5 | 20 | 50 | 30 | 25 | 150 × 4 × 300 |
| 2 | 3 | 5 | 3 | 2.5 | 2.5 | 30 | 50 | 30 | 25 | 150 × 4 × 300 |
| 3 | 4 | 5 | 3 | 2.5 | 2.5 | 40 | 50 | 30 | 25 | 150 × 4 × 300 |
| 4 | 5 | 5 | 3 | 2.5 | 2.5 | 50 | 50 | 30 | 25 | 150 × 4 × 300 |
| 5 | 5 | 2 | 3 | 2.5 | 2.5 | 50 | 20 | 30 | 25 | 90 × 4 × 300 |
| 6 | 5 | 3 | 3 | 2.5 | 2.5 | 50 | 30 | 30 | 25 | 110 × 4 × 300 |
| 7 | 5 | 4 | 3 | 2.5 | 2.5 | 50 | 40 | 30 | 25 | 130 × 4 × 300 |
| 8 | 5 | 5 | 1.5 | 2.5 | 2.5 | 50 | 50 | 15 | 25 | 150 × 4 × 300 |
| 9 | 5 | 5 | 2 | 2.5 | 2.5 | 50 | 50 | 20 | 25 | 150 × 4 × 300 |
| 10 | 5 | 5 | 2.5 | 2.5 | 2.5 | 50 | 50 | 25 | 25 | 150 × 4 × 300 |
| 11 | 5 | 5 | 3 | 1.7 | 2.5 | 50 | 50 | 30 | 25 | 150 × 6 × 300 |
| 12 | 5 | 5 | 3 | 2 | 2.5 | 50 | 50 | 30 | 25 | 150 × 5 × 300 |
| 13 | 5 | 5 | 3 | 3.3 | 2.5 | 50 | 50 | 30 | 25 | 150 × 3 × 300 |
| 14 | 5 | 5 | 3 | 2.5 | 1.5 | 50 | 50 | 30 | 15 | 130 × 4 × 300 |
| 15 | 5 | 5 | 3 | 2.5 | 3.5 | 50 | 50 | 30 | 35 | 170 × 4 × 300 |
| 16 | 5 | 5 | 3 | 2.5 | 4.5 | 50 | 50 | 30 | 45 | 190 × 4 × 300 |
Disclaimer/Publisher’s Note: The statements, opinions and data contained in all publications are solely those of the individual author(s) and contributor(s) and not of MDPI and/or the editor(s). MDPI and/or the editor(s) disclaim responsibility for any injury to people or property resulting from any ideas, methods, instructions or products referred to in the content. |
© 2023 by the authors. Licensee MDPI, Basel, Switzerland. This article is an open access article distributed under the terms and conditions of the Creative Commons Attribution (CC BY) license (https://creativecommons.org/licenses/by/4.0/).
Share and Cite
Wang, H.; Guo, L.; Li, W.; Zhang, M.; Hong, Y.; Yang, W.; Zhang, Z. Influence of Design Parameters on Mechanical Behavior of Multi-Bolt, Countersunk C/SiC Composite Joint Structure. Materials 2023, 16, 6352. https://doi.org/10.3390/ma16196352
Wang H, Guo L, Li W, Zhang M, Hong Y, Yang W, Zhang Z. Influence of Design Parameters on Mechanical Behavior of Multi-Bolt, Countersunk C/SiC Composite Joint Structure. Materials. 2023; 16(19):6352. https://doi.org/10.3390/ma16196352
Chicago/Turabian StyleWang, Hongcui, Lijia Guo, Weijie Li, Mengshan Zhang, Yiqiang Hong, Wei Yang, and Zhongwei Zhang. 2023. "Influence of Design Parameters on Mechanical Behavior of Multi-Bolt, Countersunk C/SiC Composite Joint Structure" Materials 16, no. 19: 6352. https://doi.org/10.3390/ma16196352