
Analysis of Crack Propagation Behaviors in RPV Dissimilar Metal Welded Joints Affected by Residual Stress

Abstract
:1. Introduction
2. Damage Model in XFEM
3. Finite Element Model of Cracks in DMW Joints
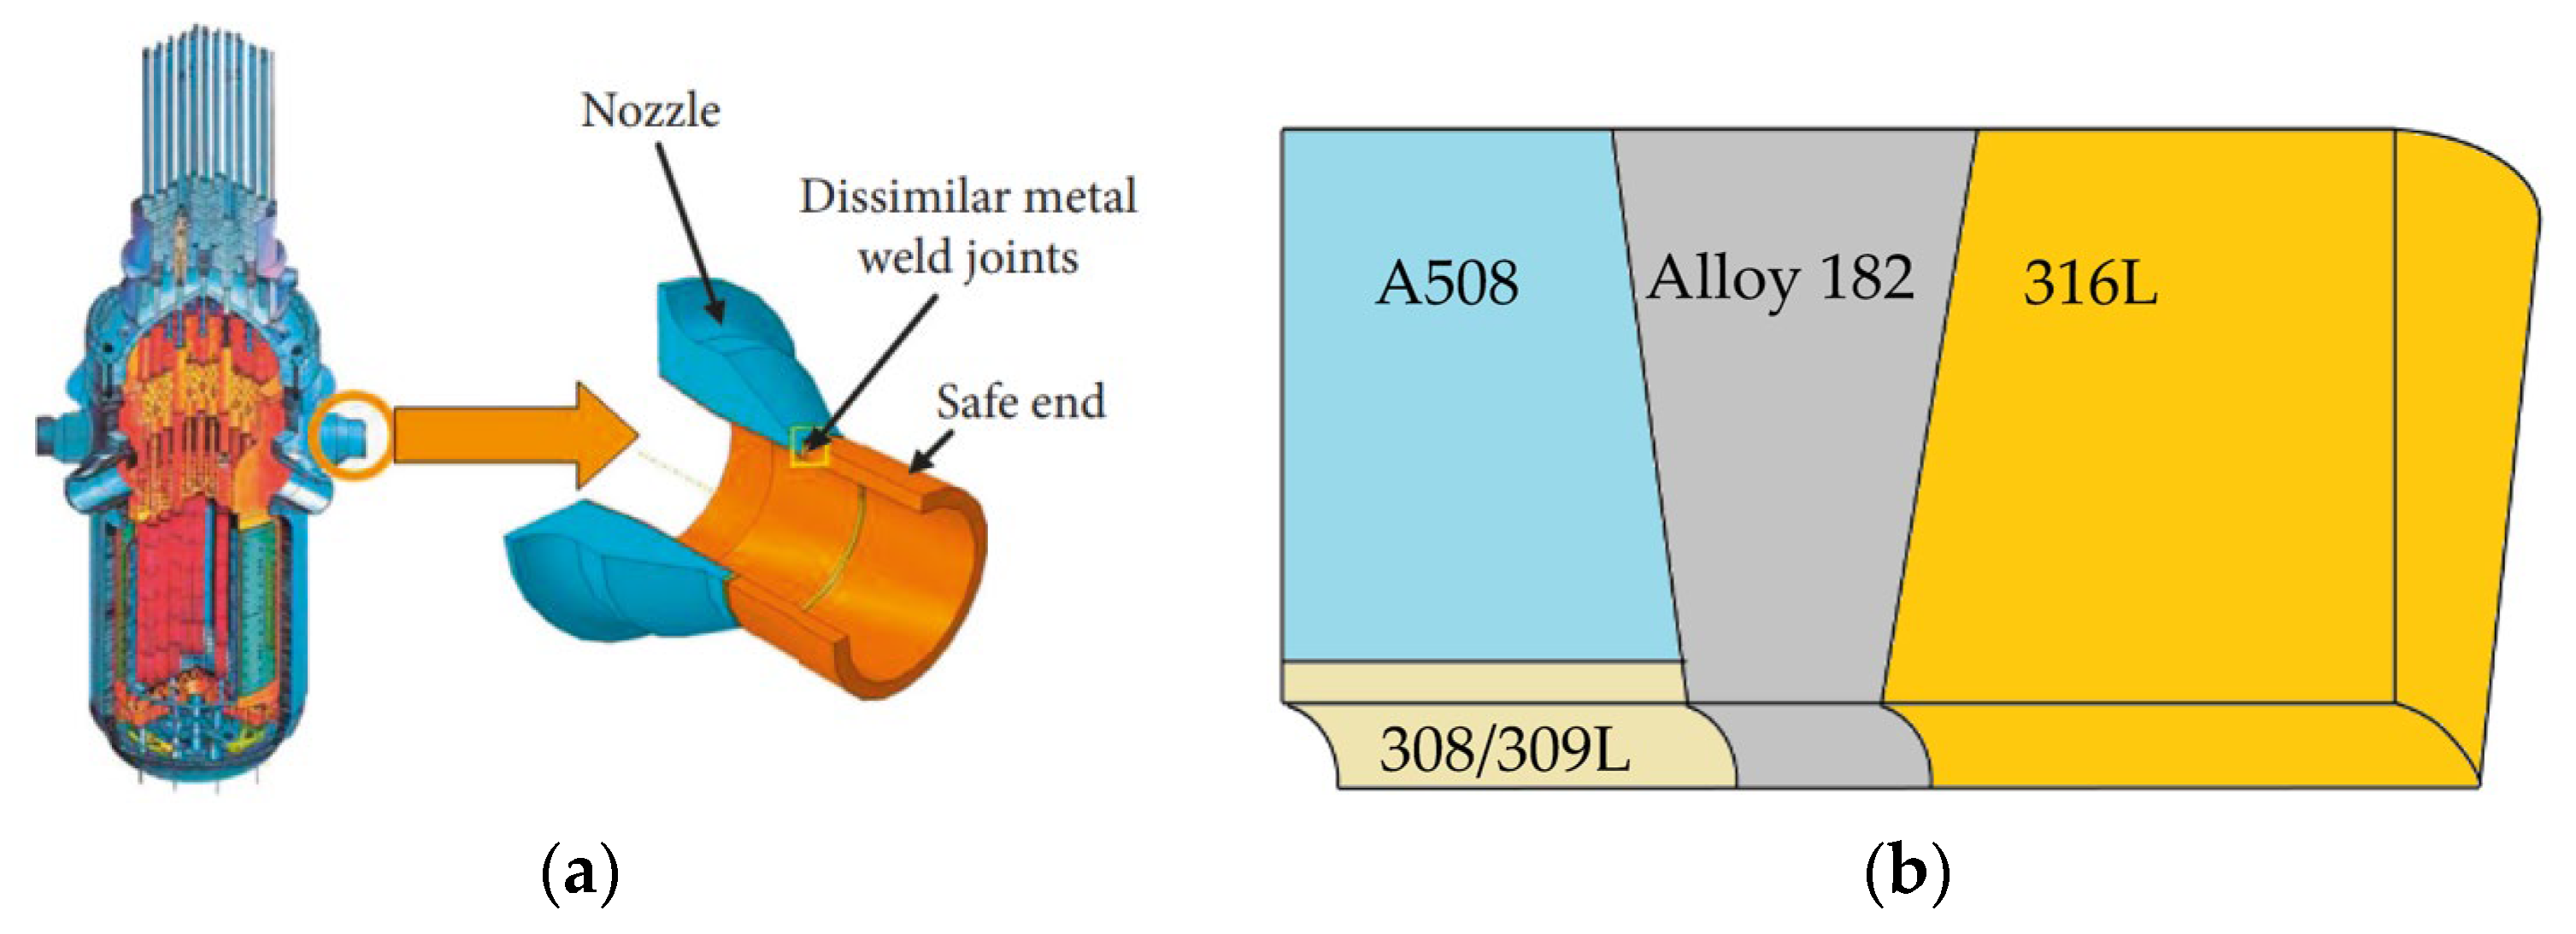
3.1. Geometric Model
3.2. Material Model
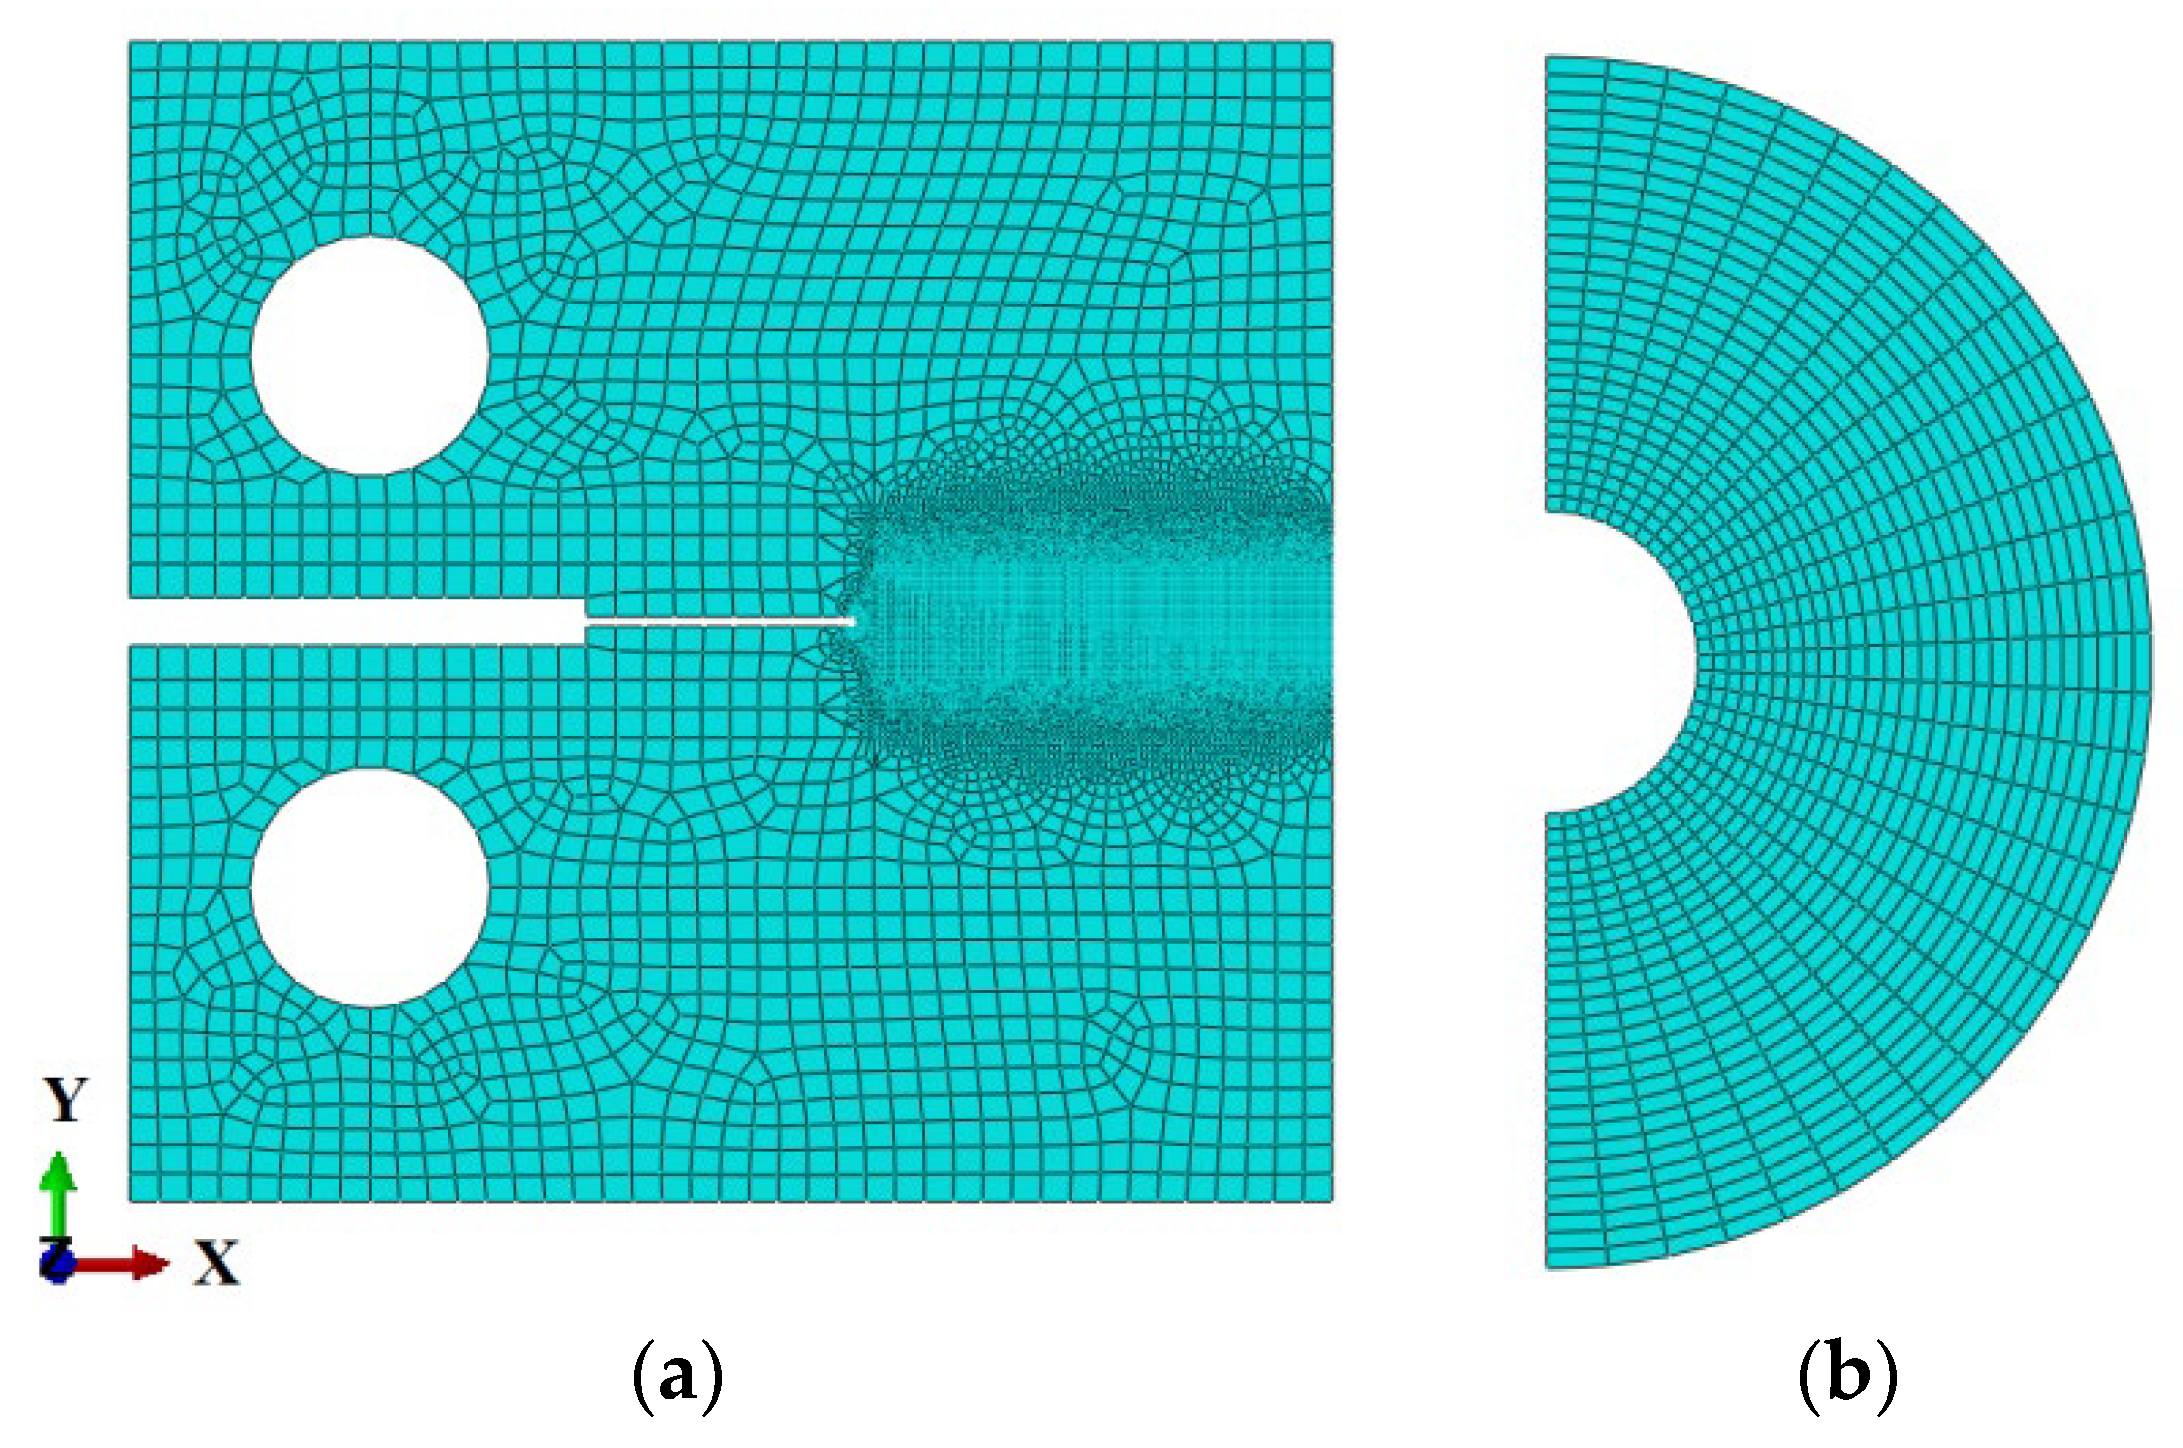
3.3. Mesh Model
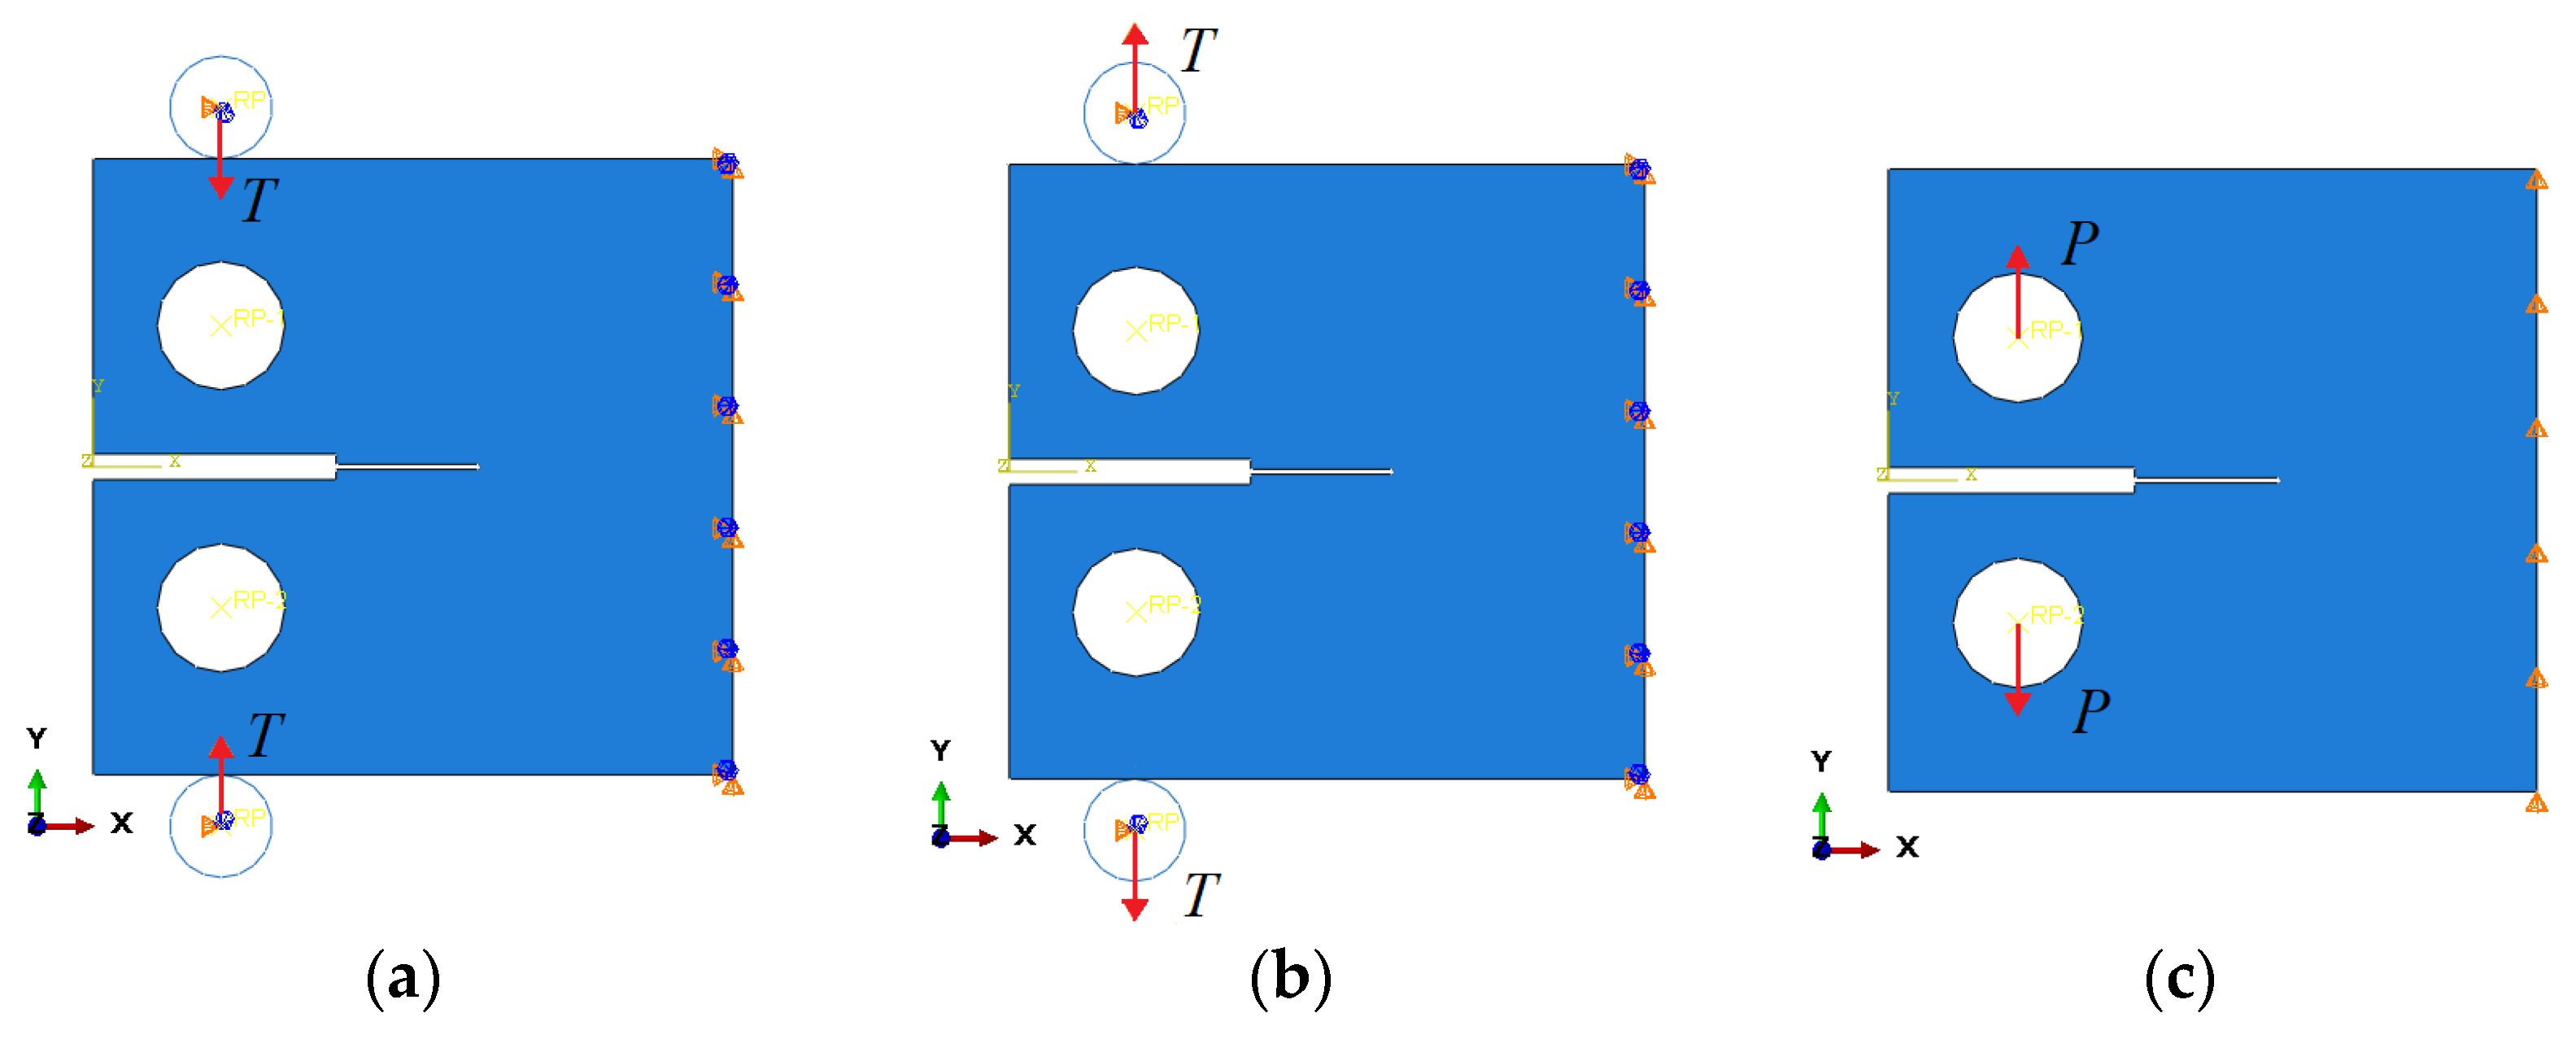
3.4. Boundary Conditions and Loads
4. Crack Propagation in the Residual Stress Field
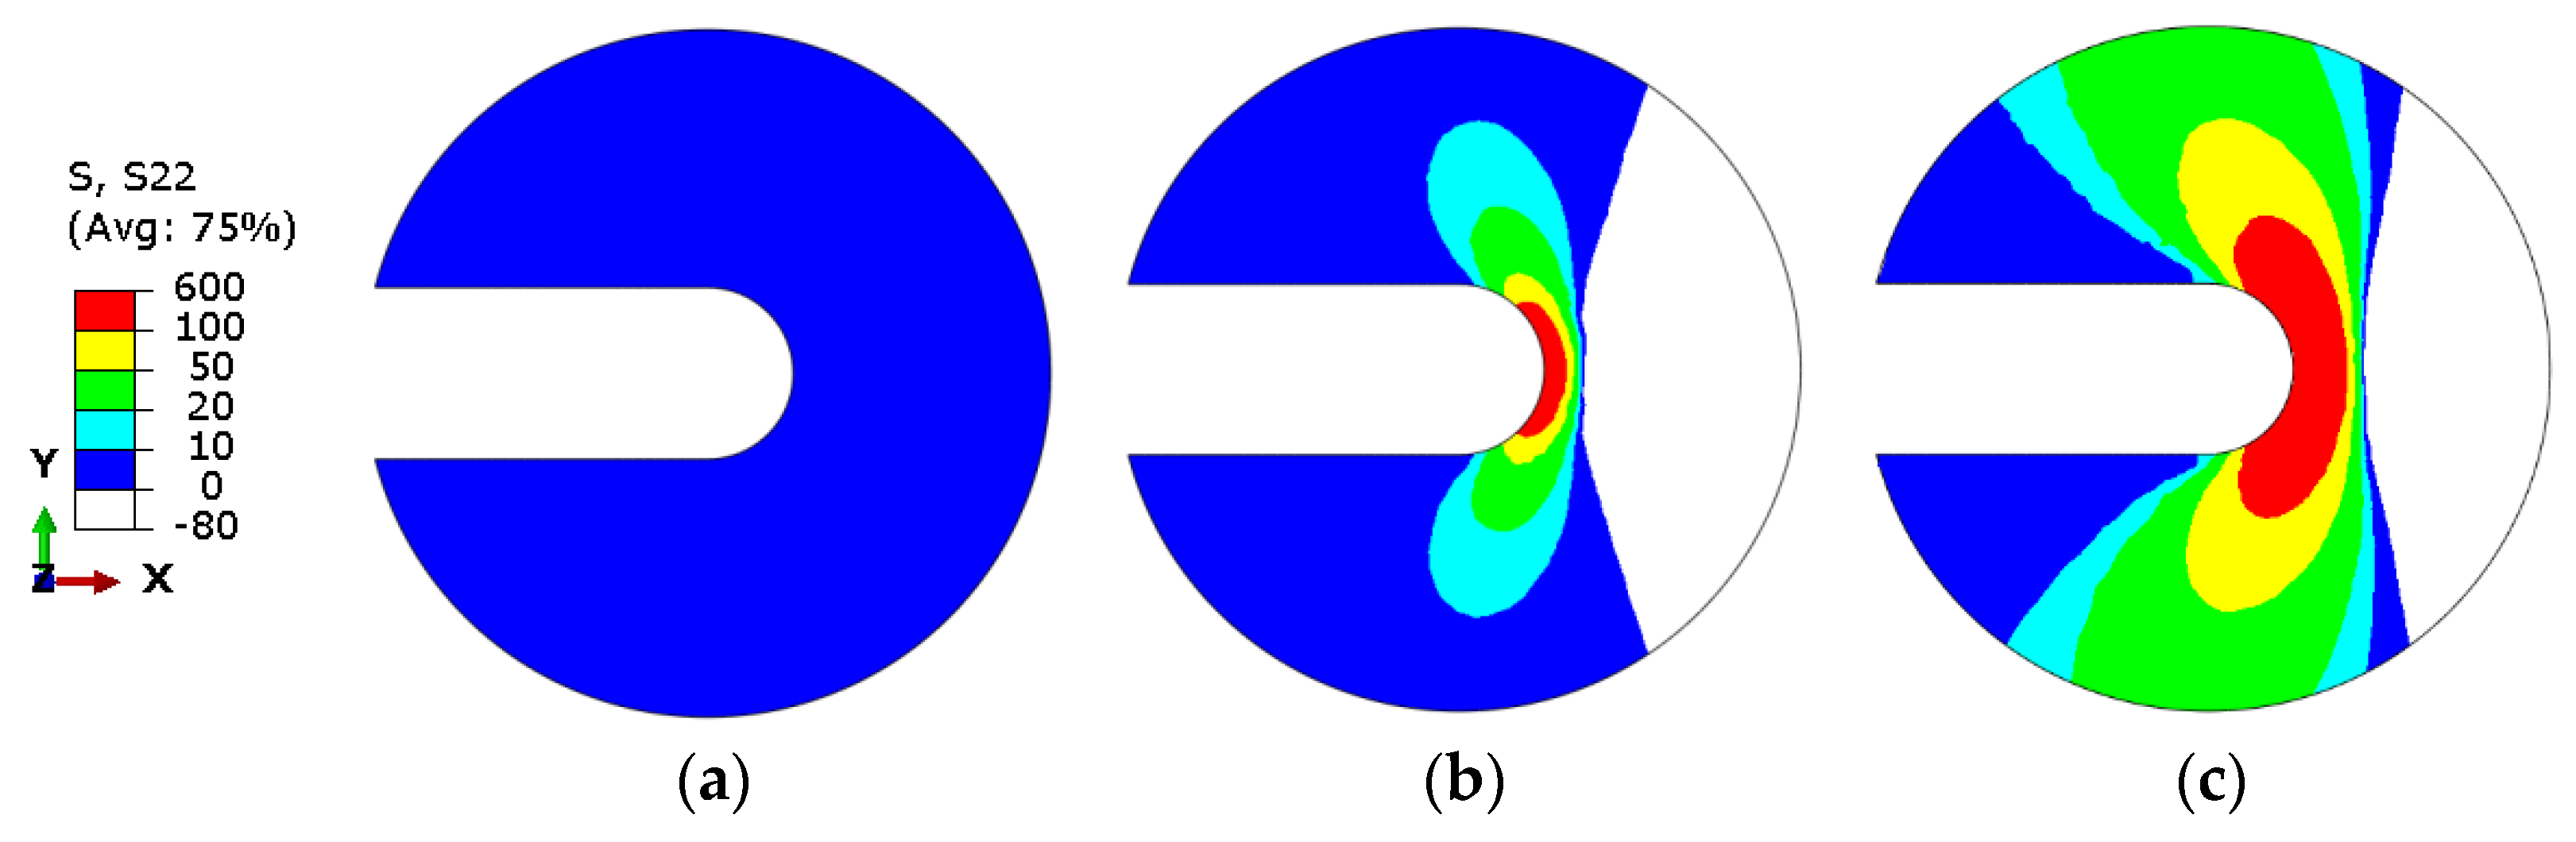
4.1. Variation of the Residual Stress around the Cack Front
4.2. Effect of Residual Stress on Crack Propagation
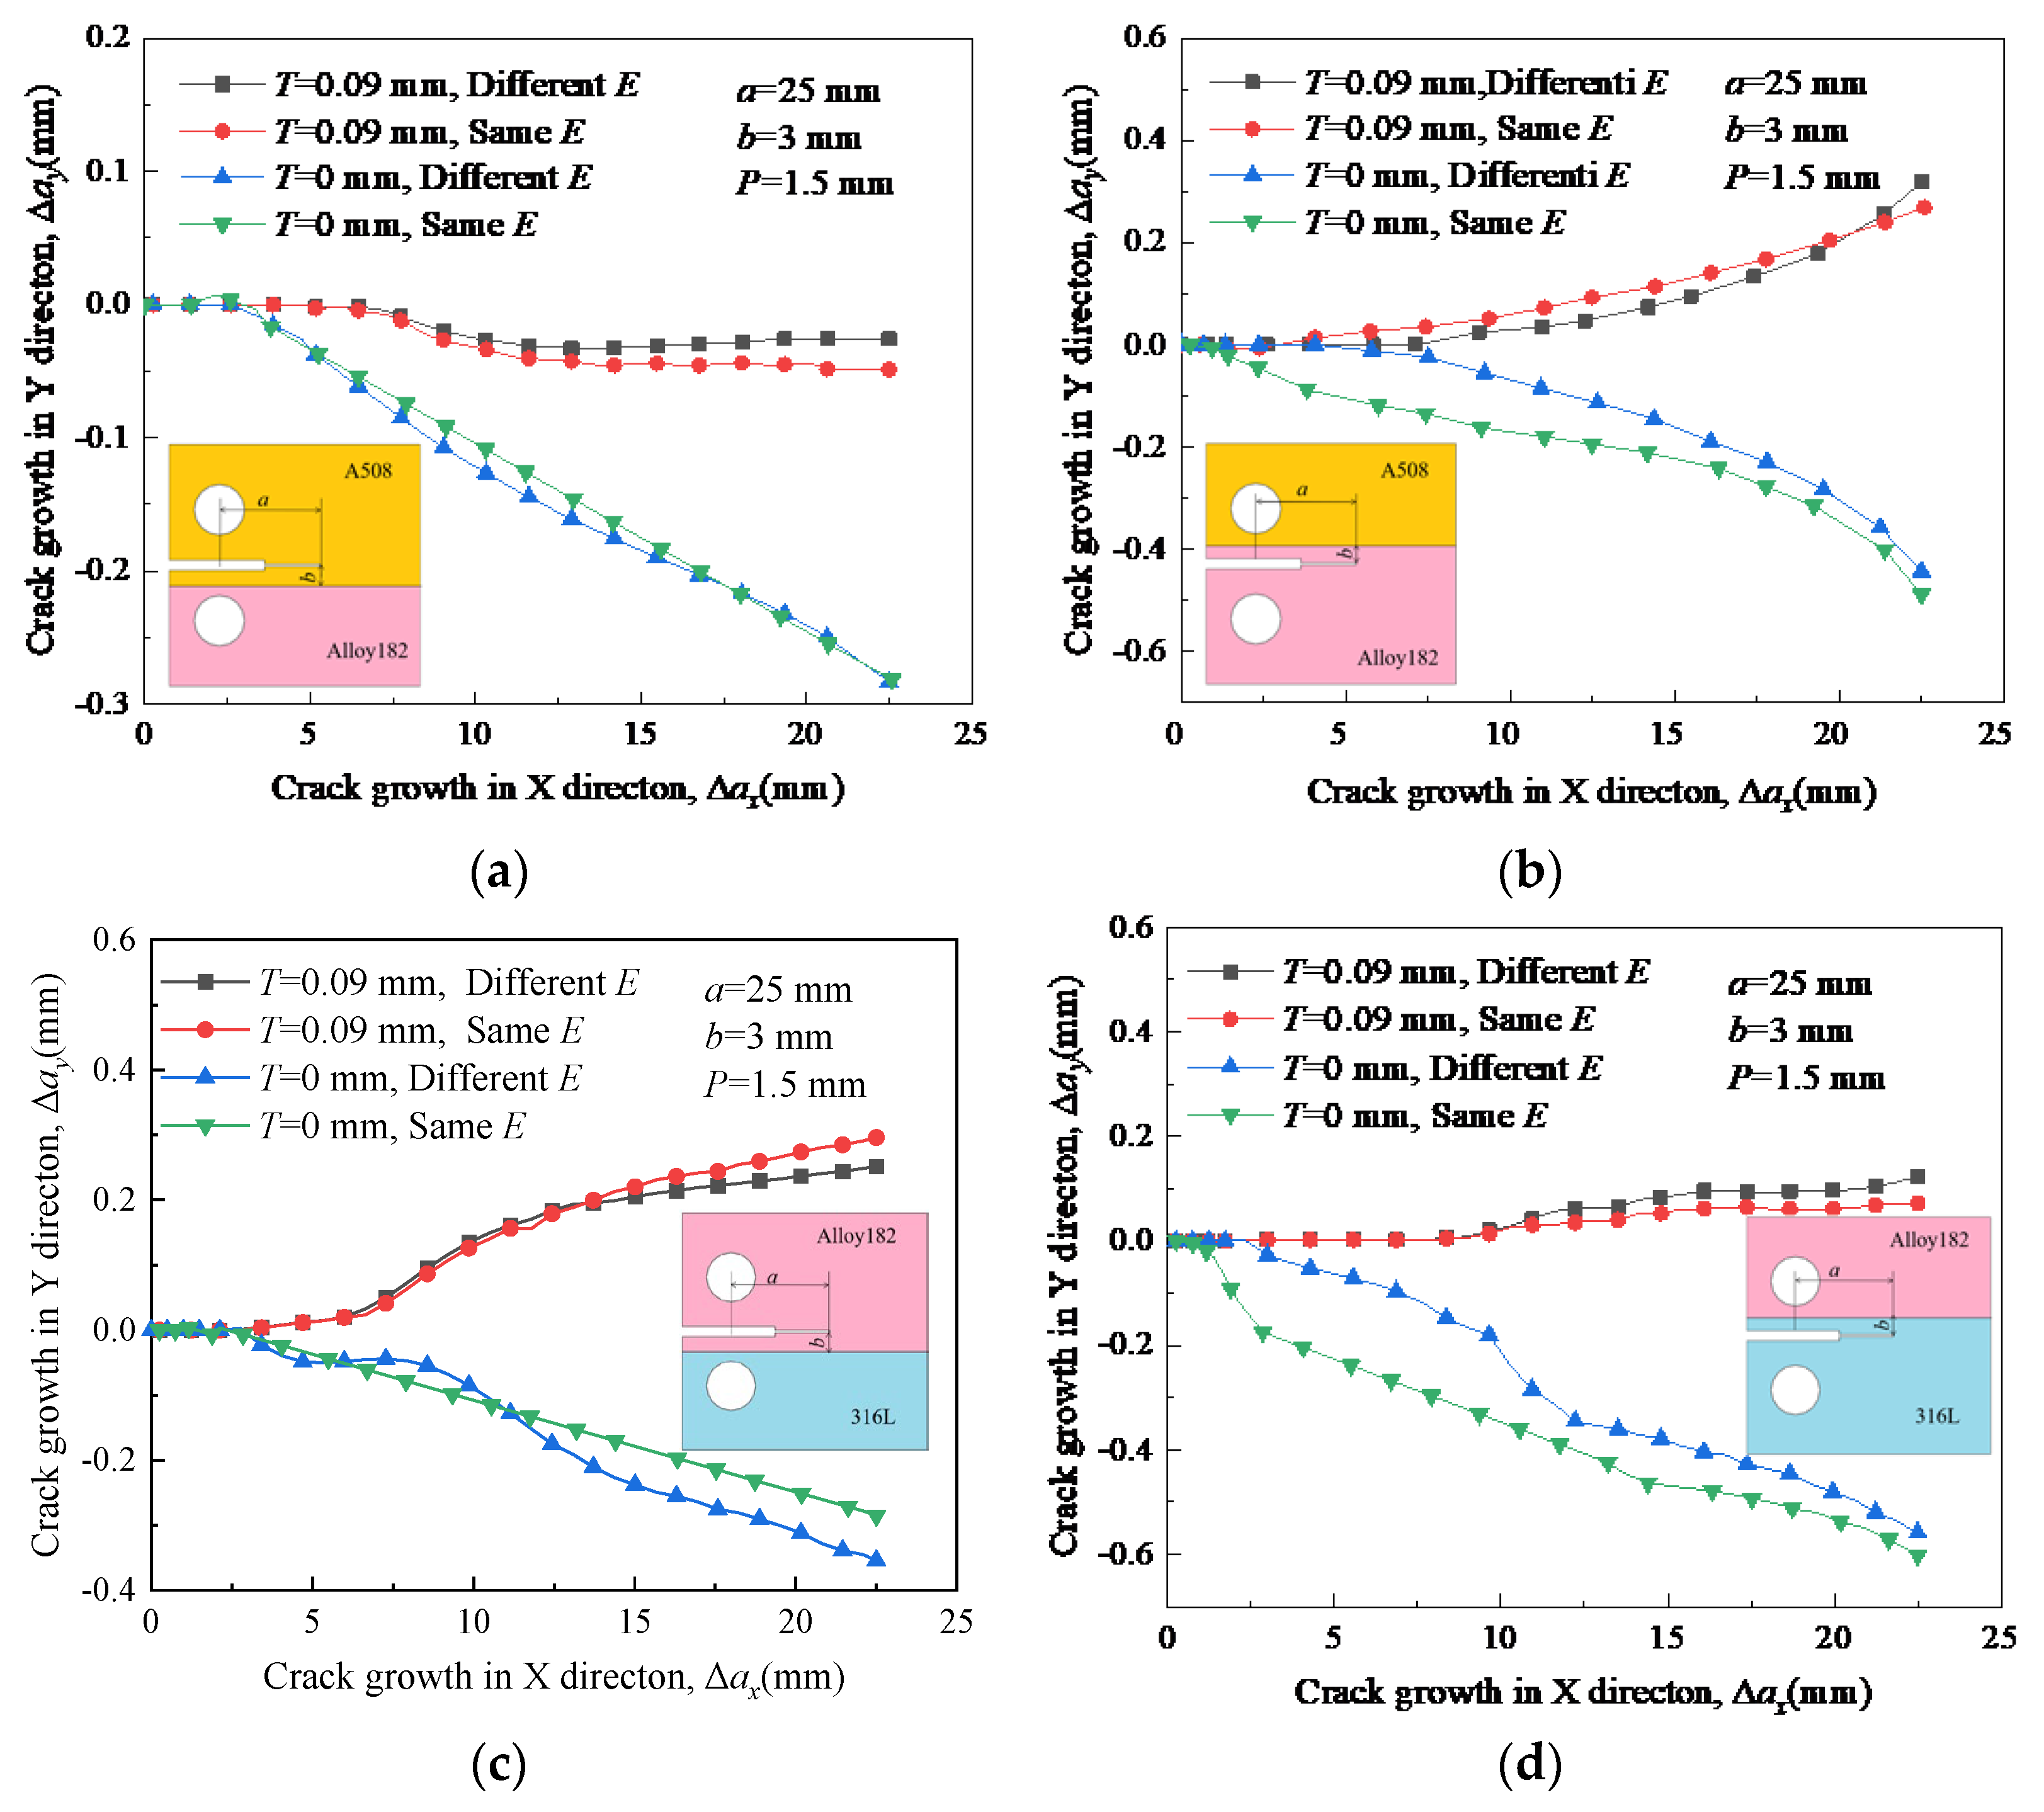
4.3. Effect of Young’s Modulus on Crack Propagation
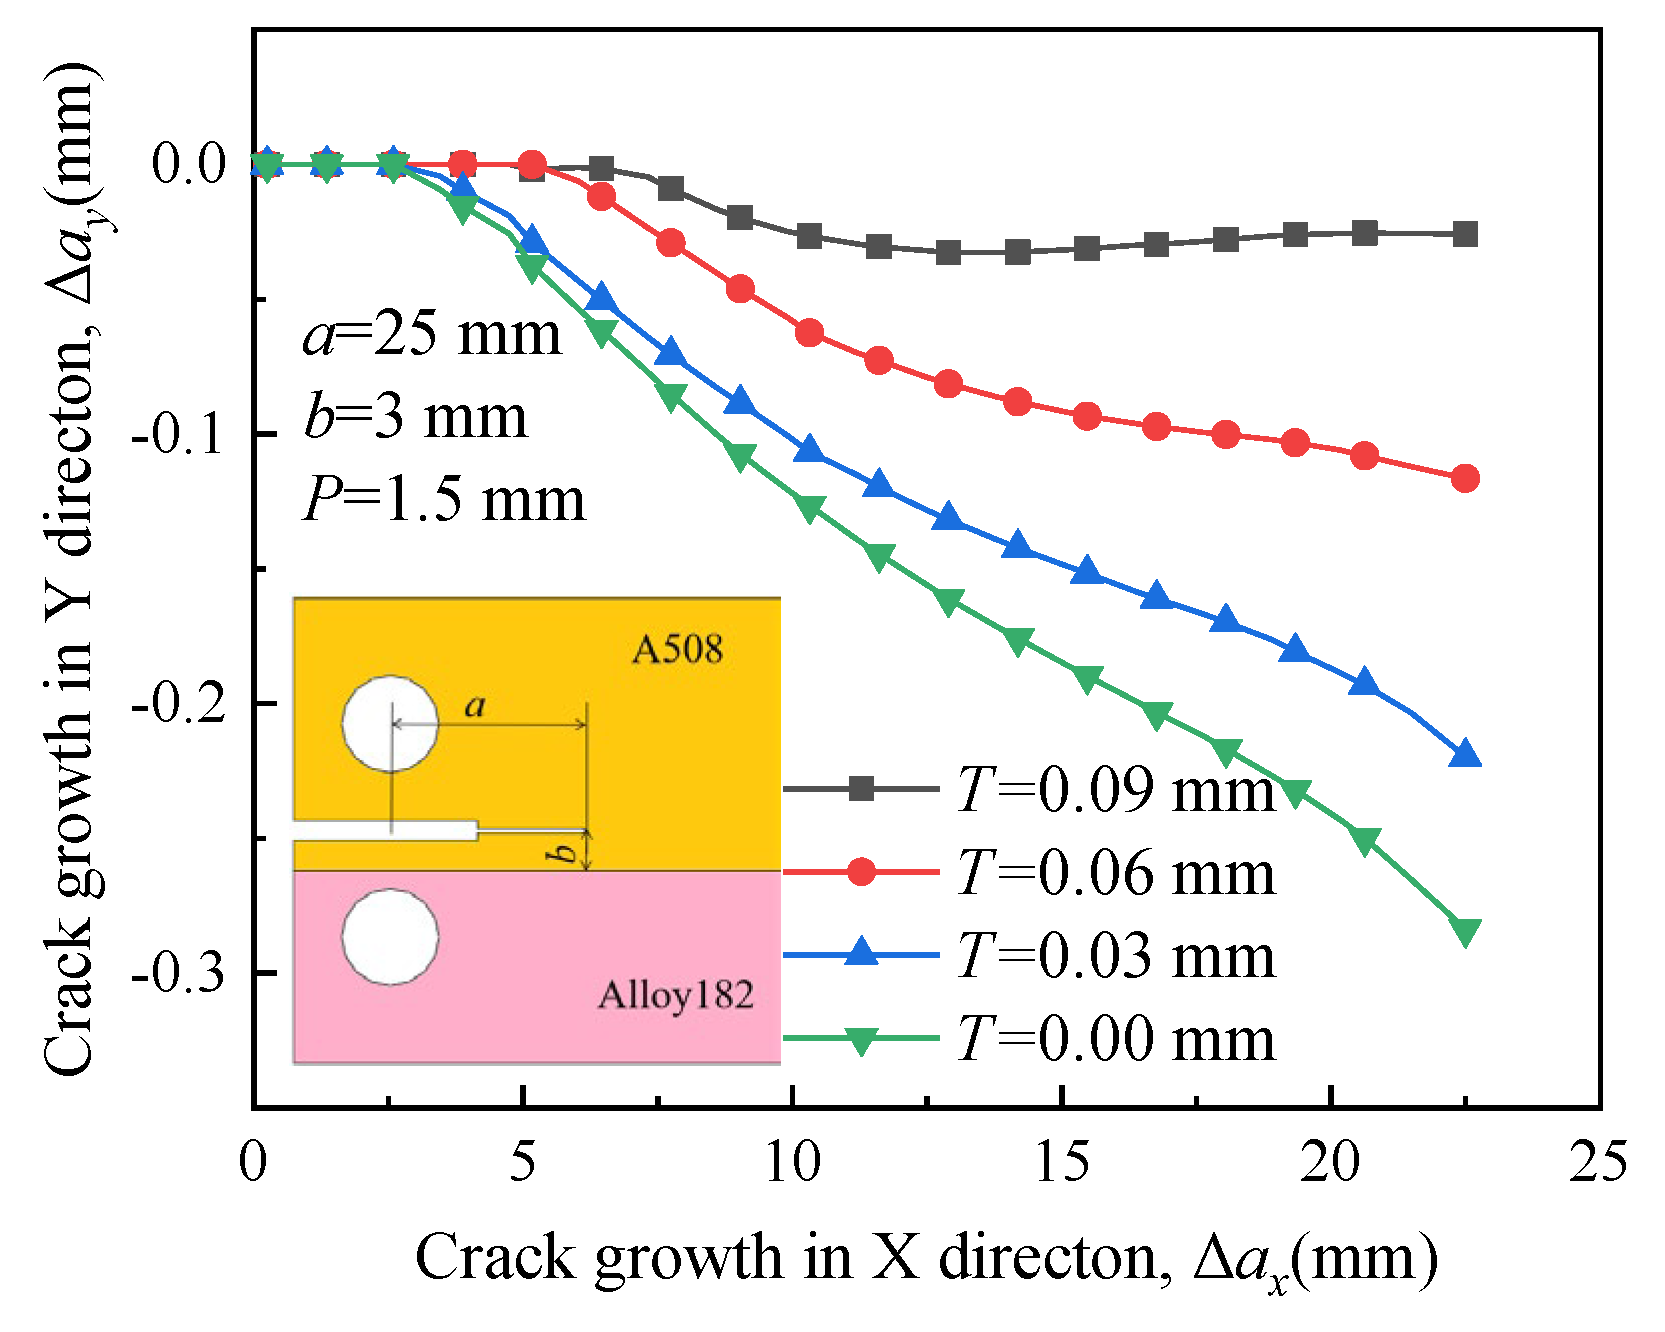
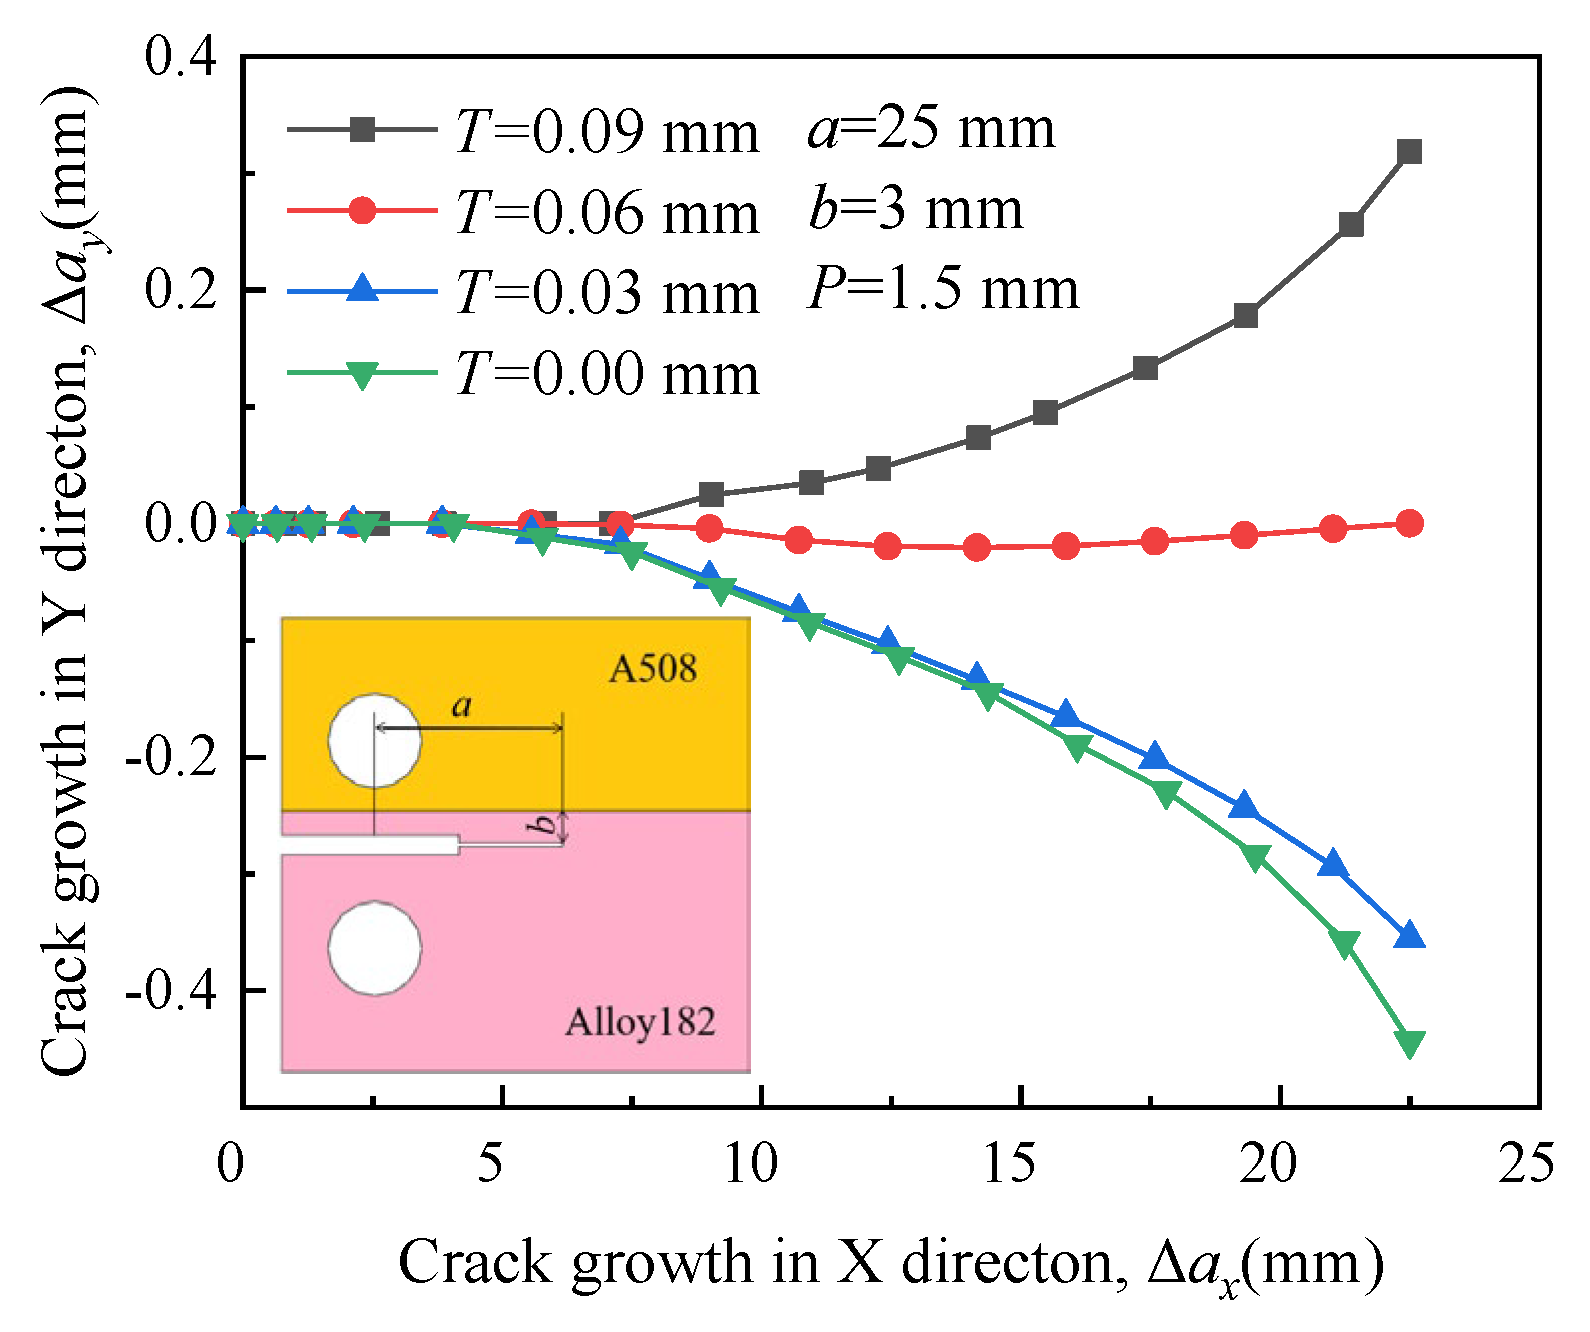
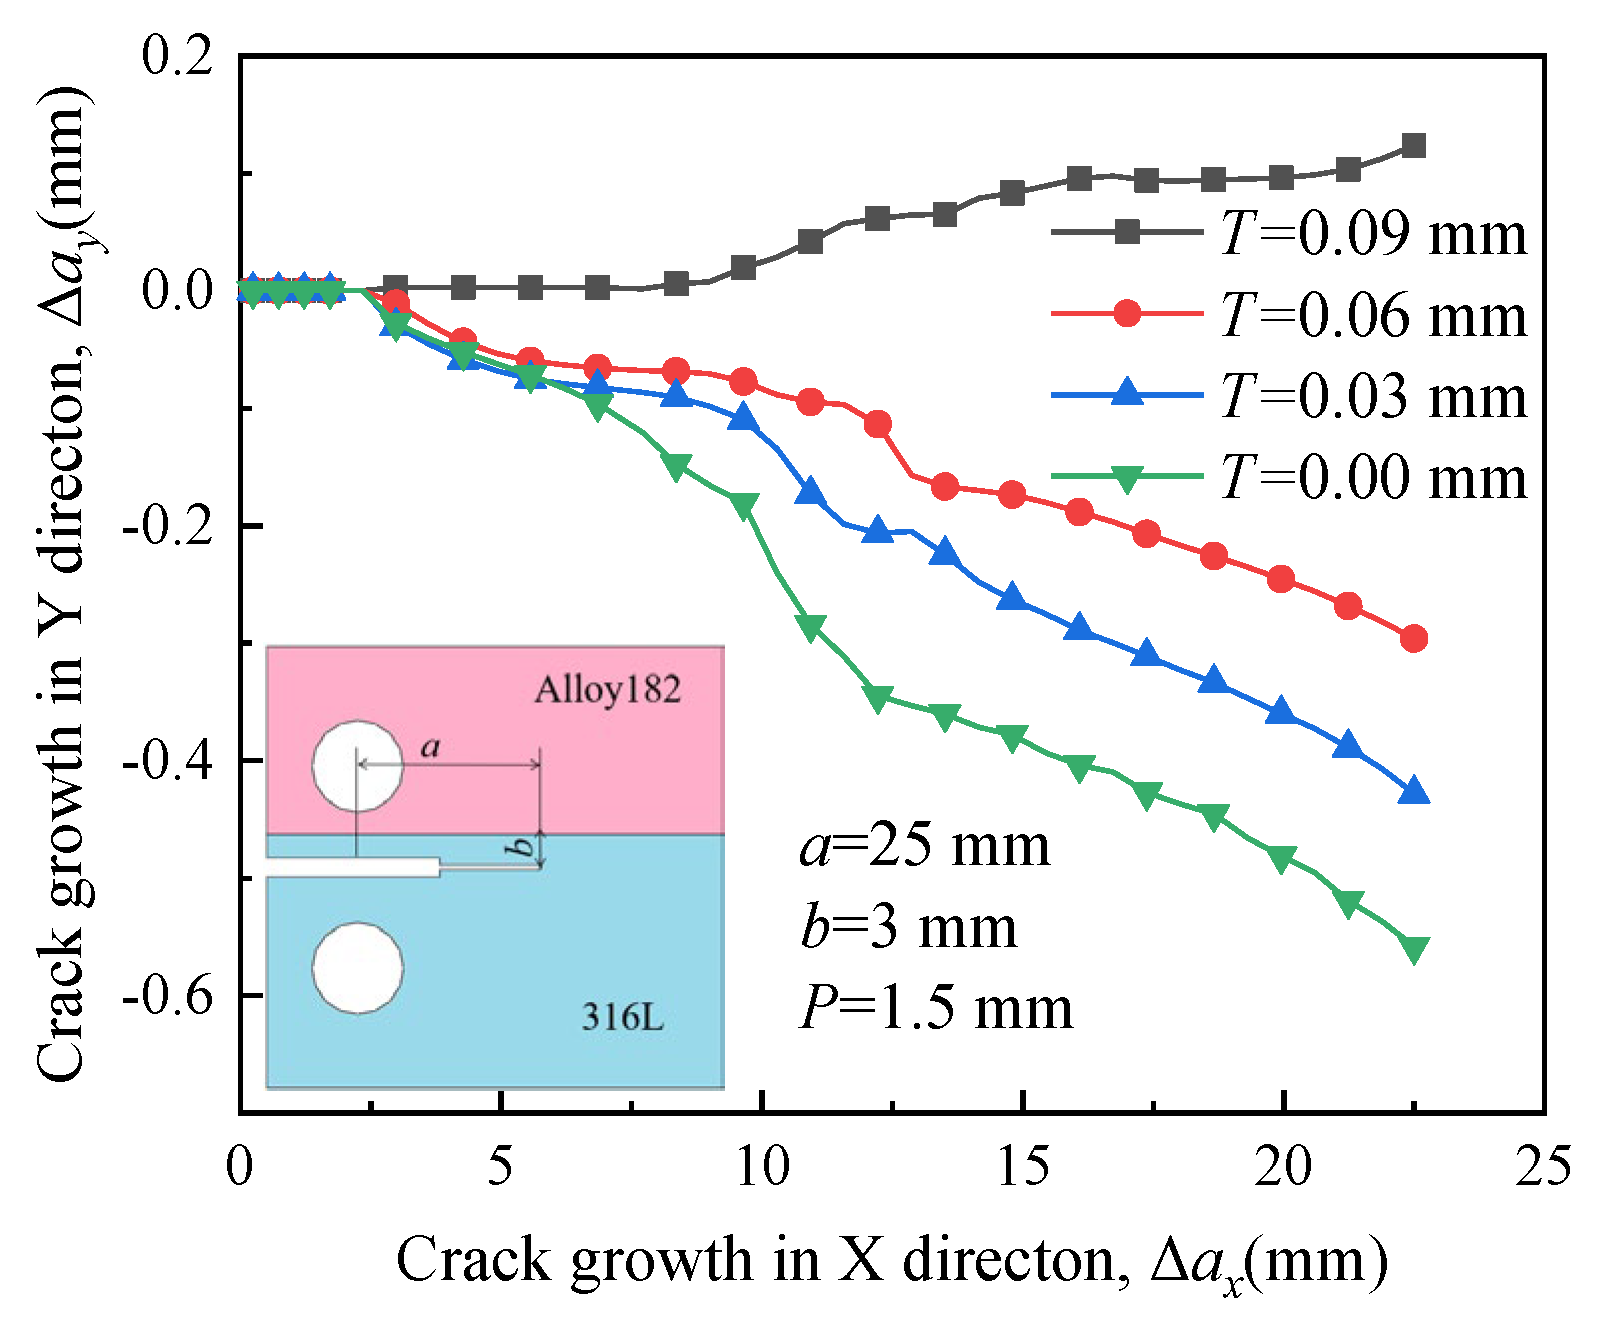
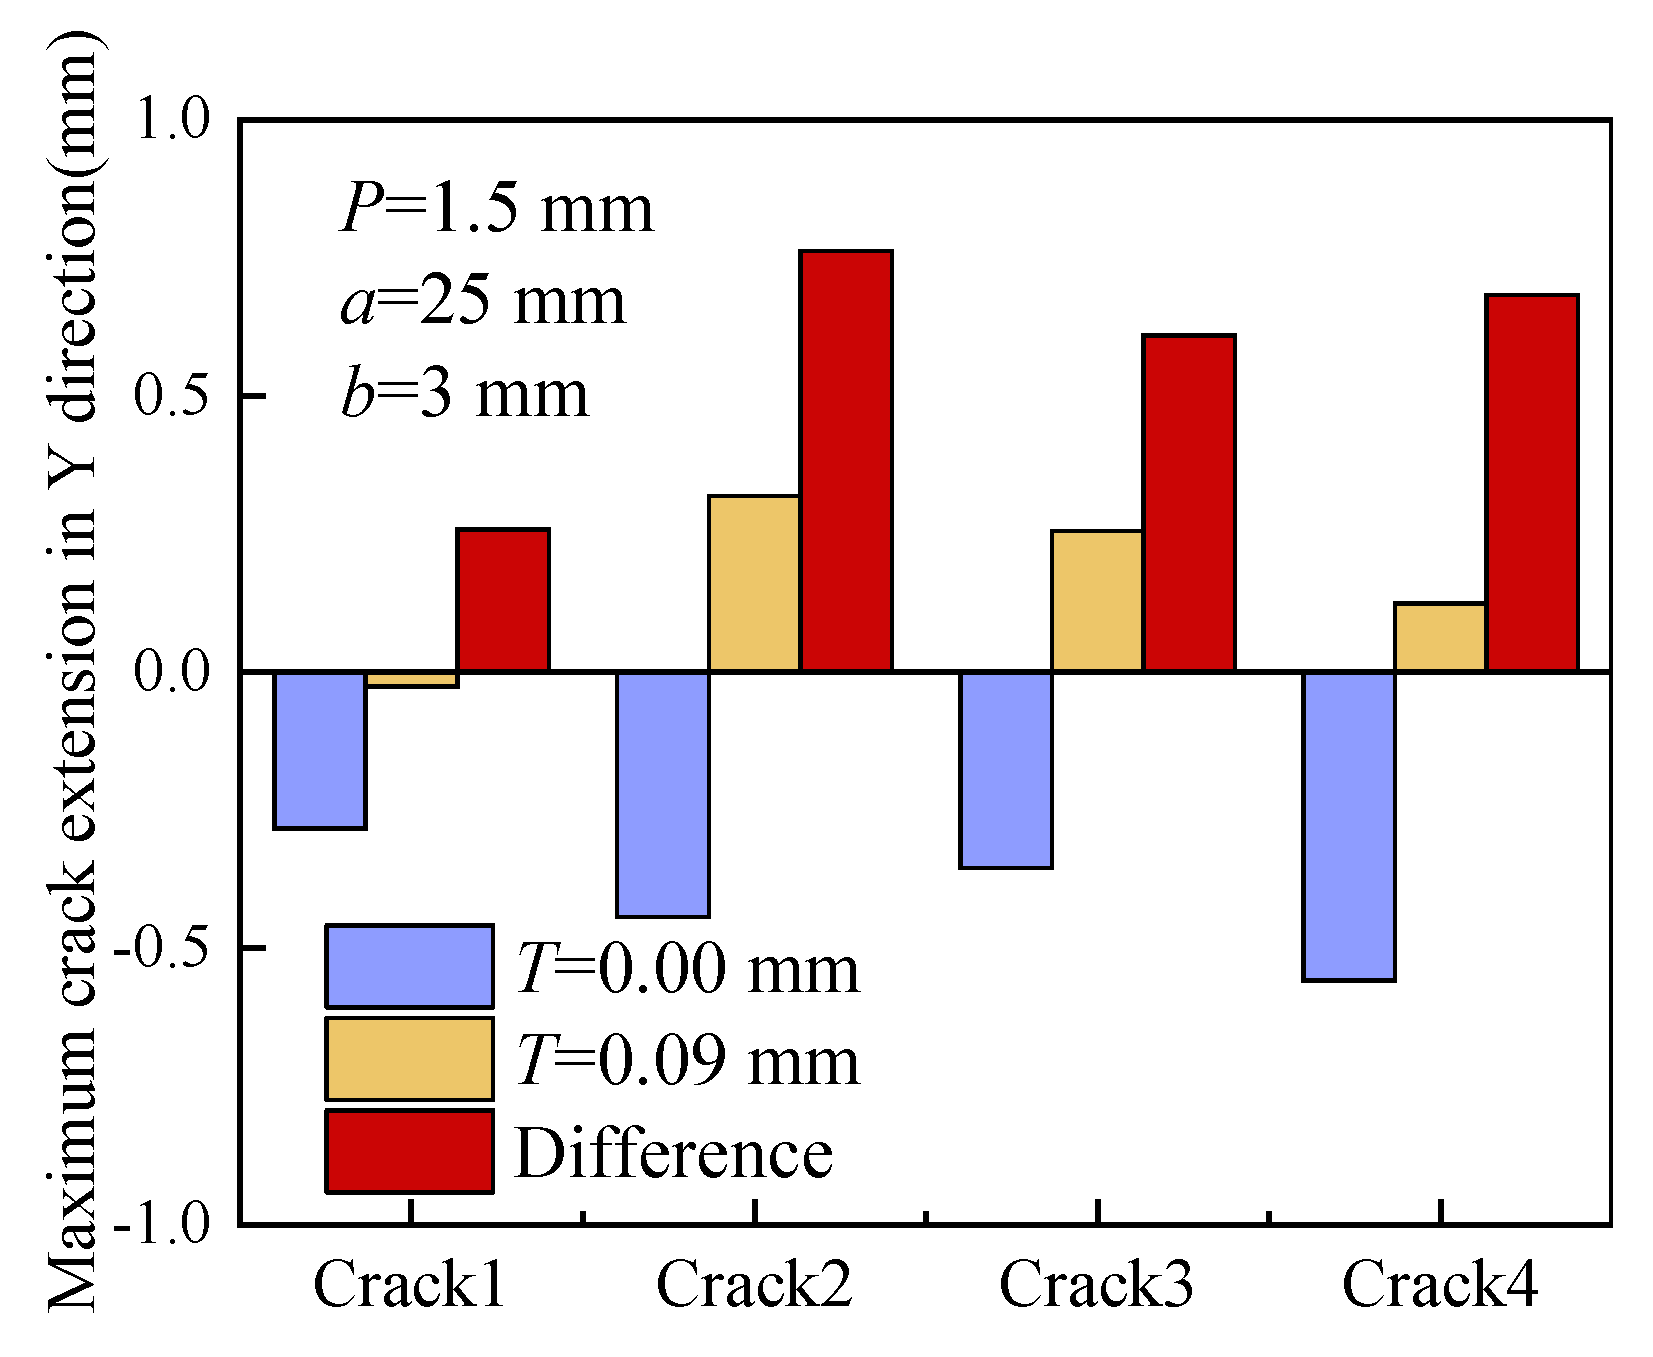
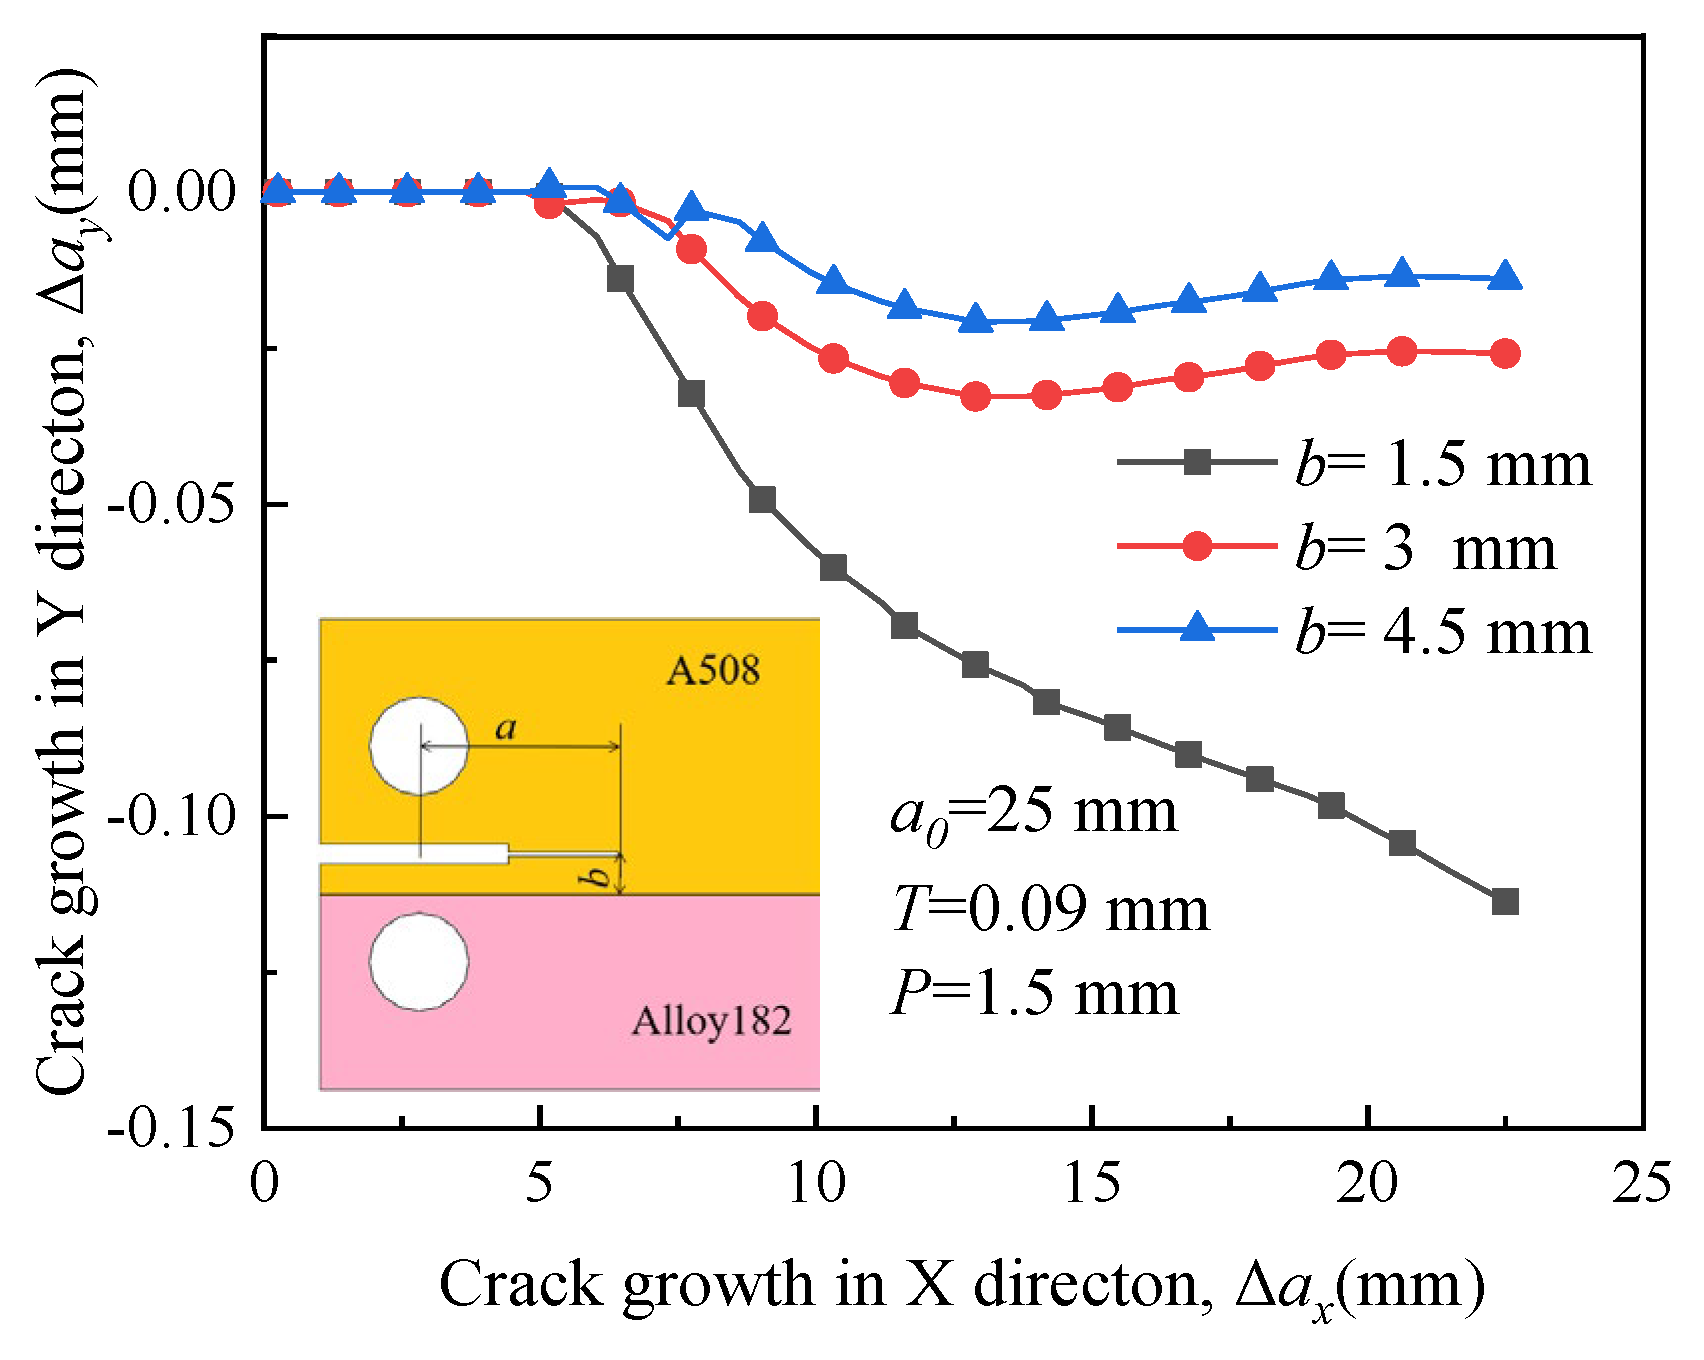
4.4. Effect of Crack Location on Crack Propagation
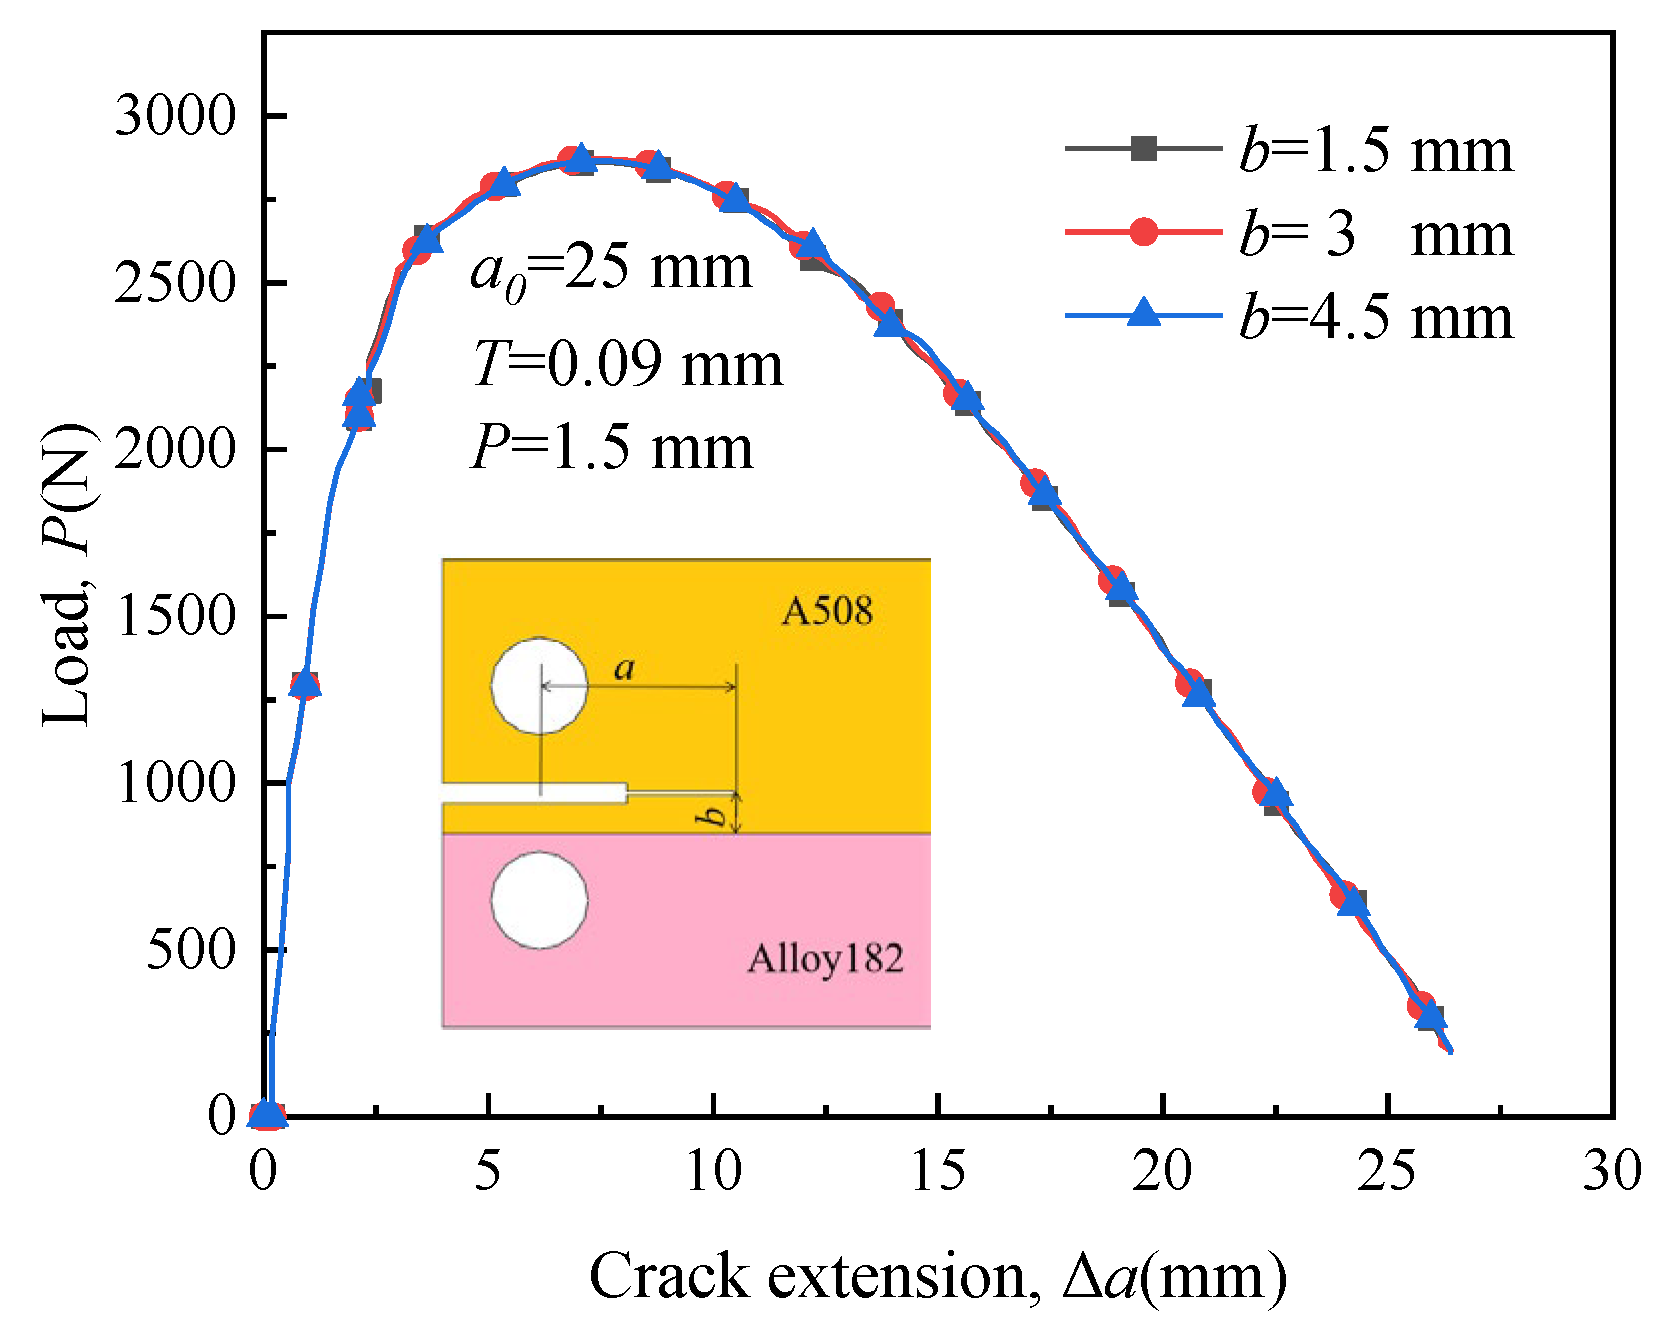
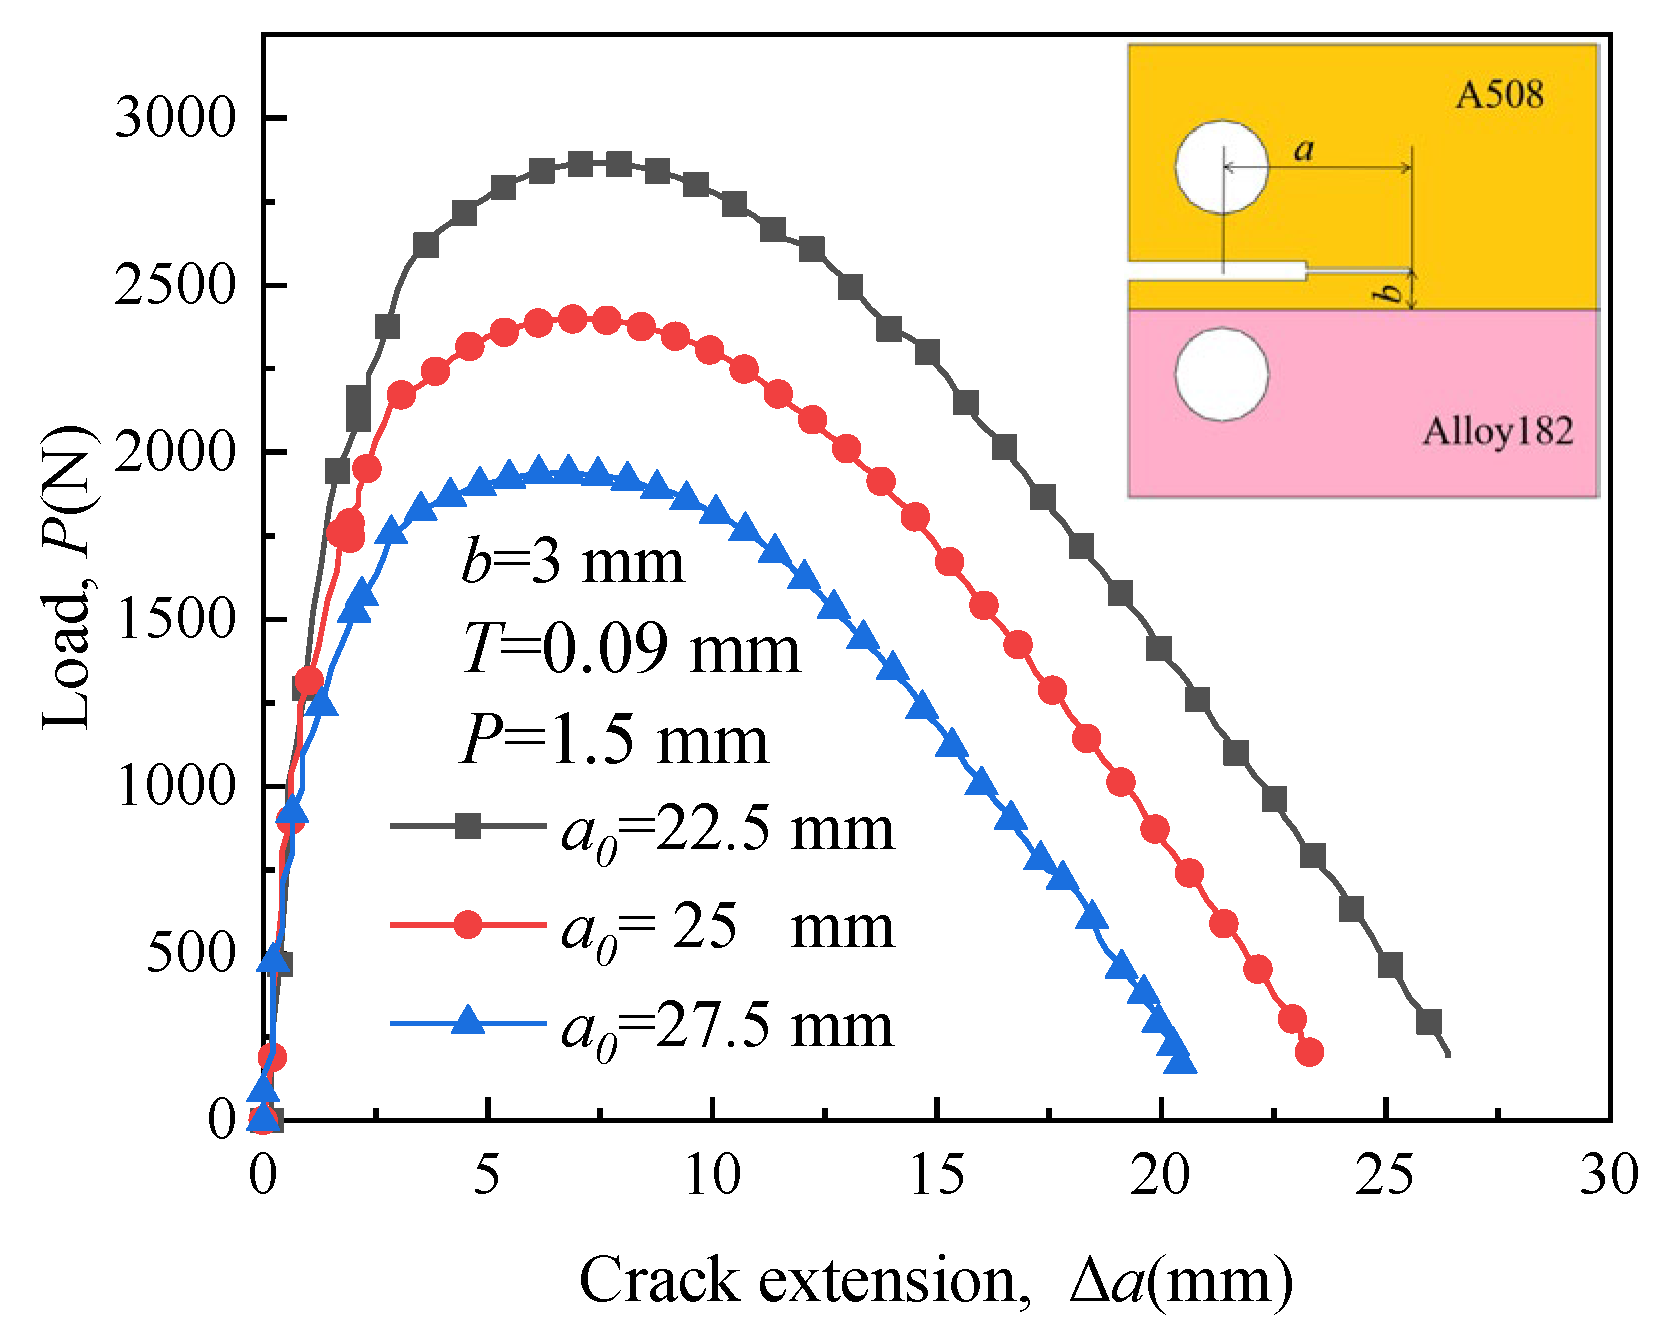
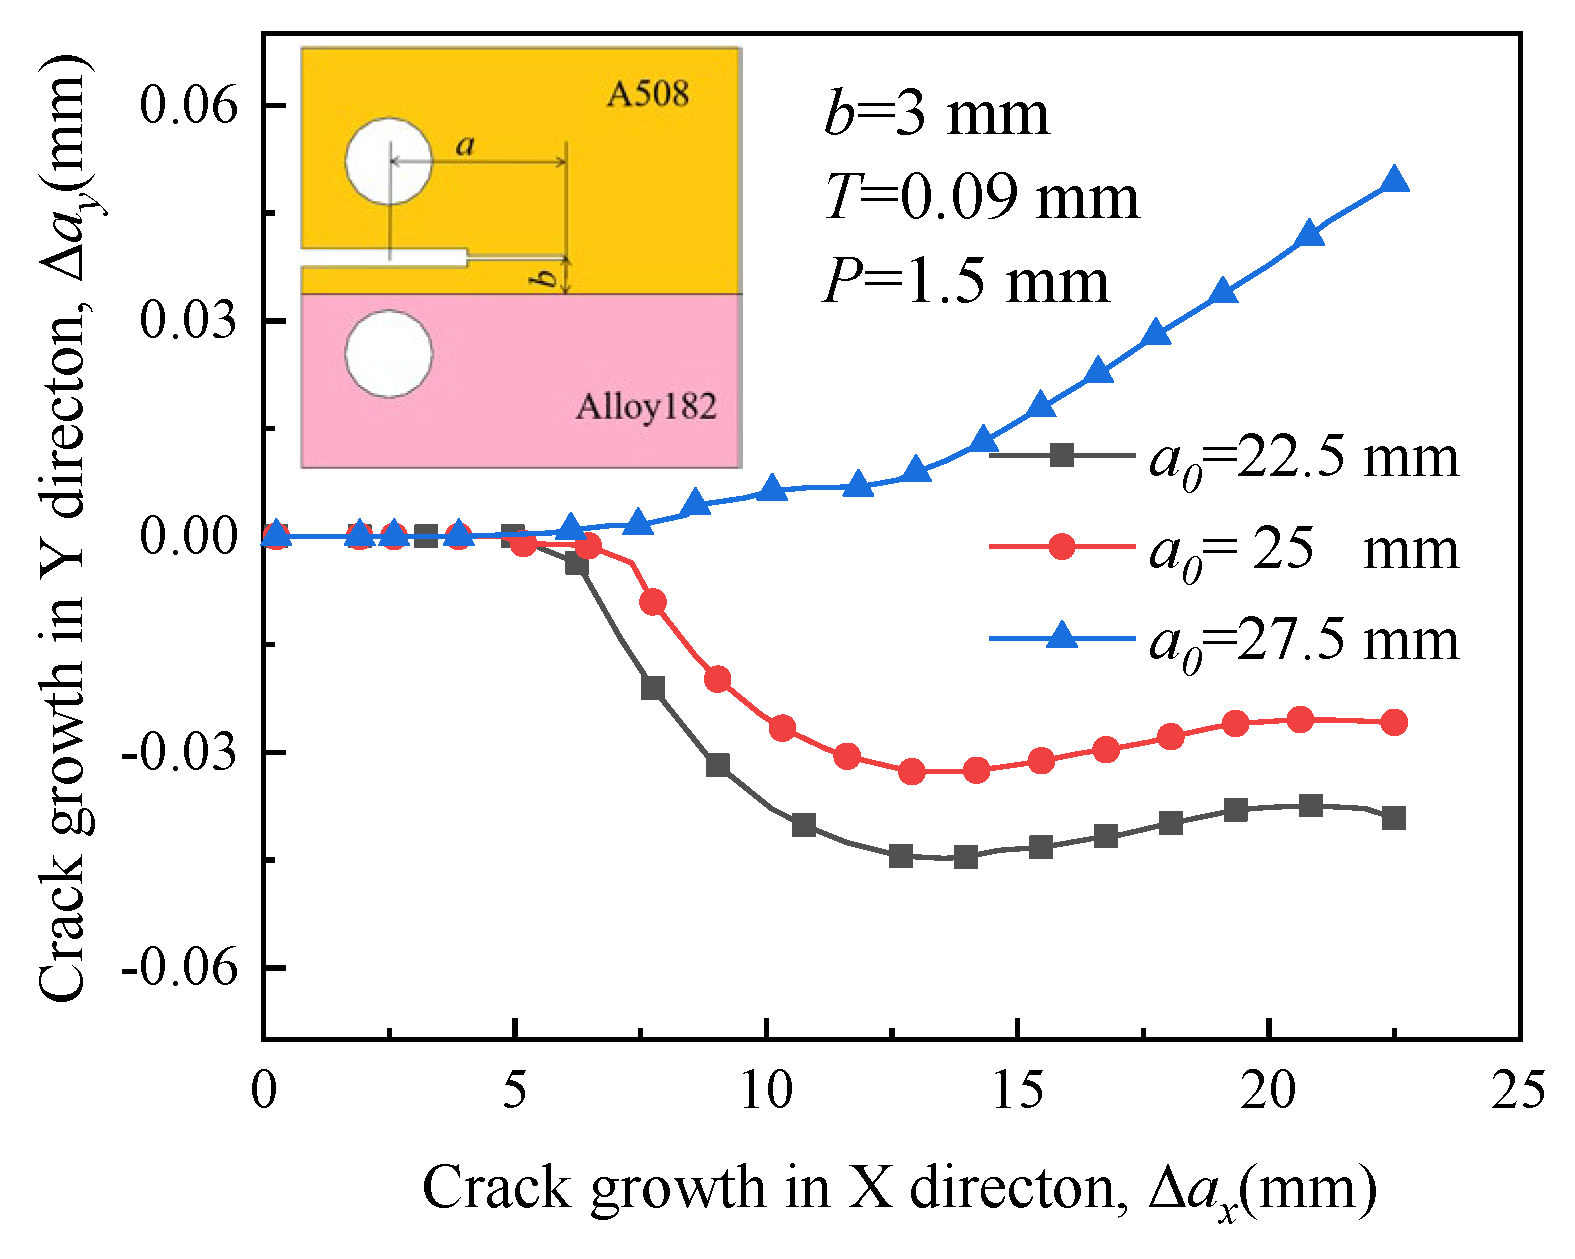
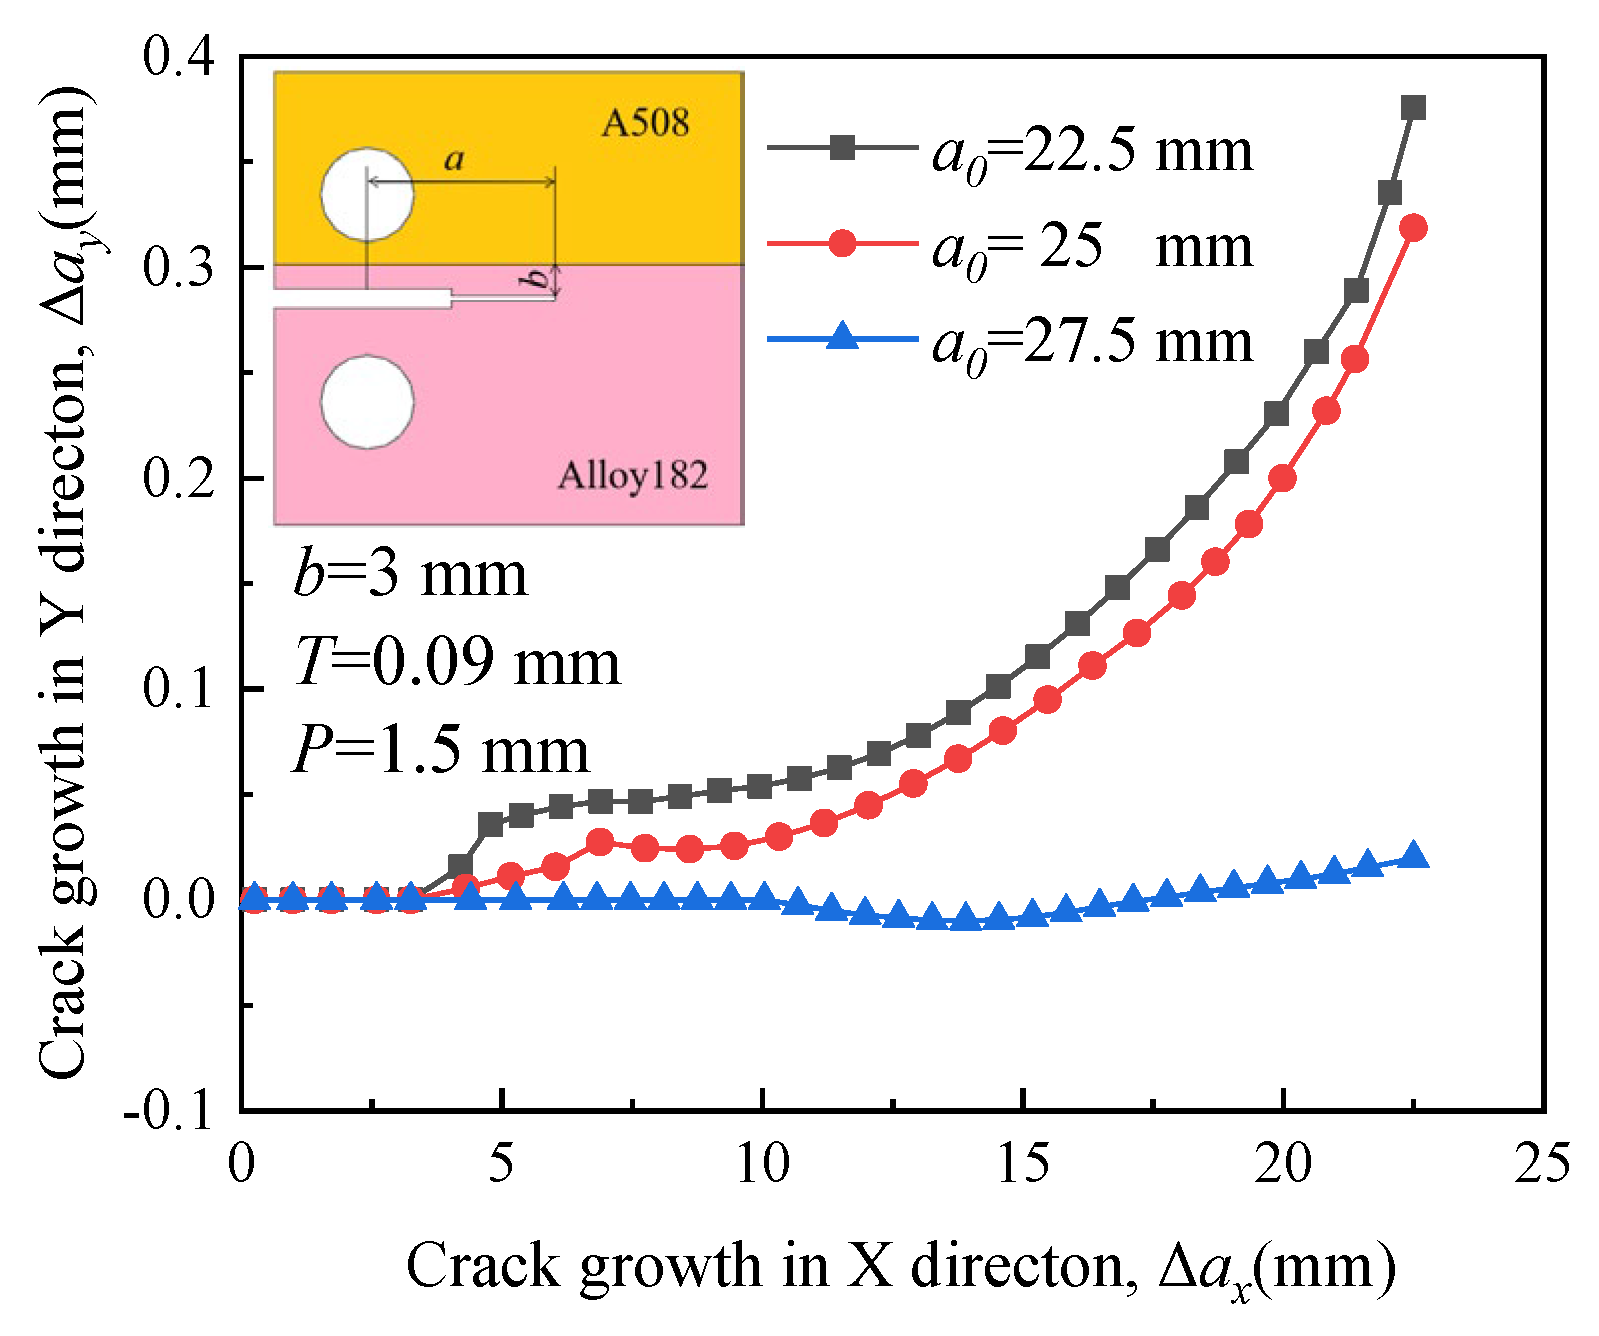
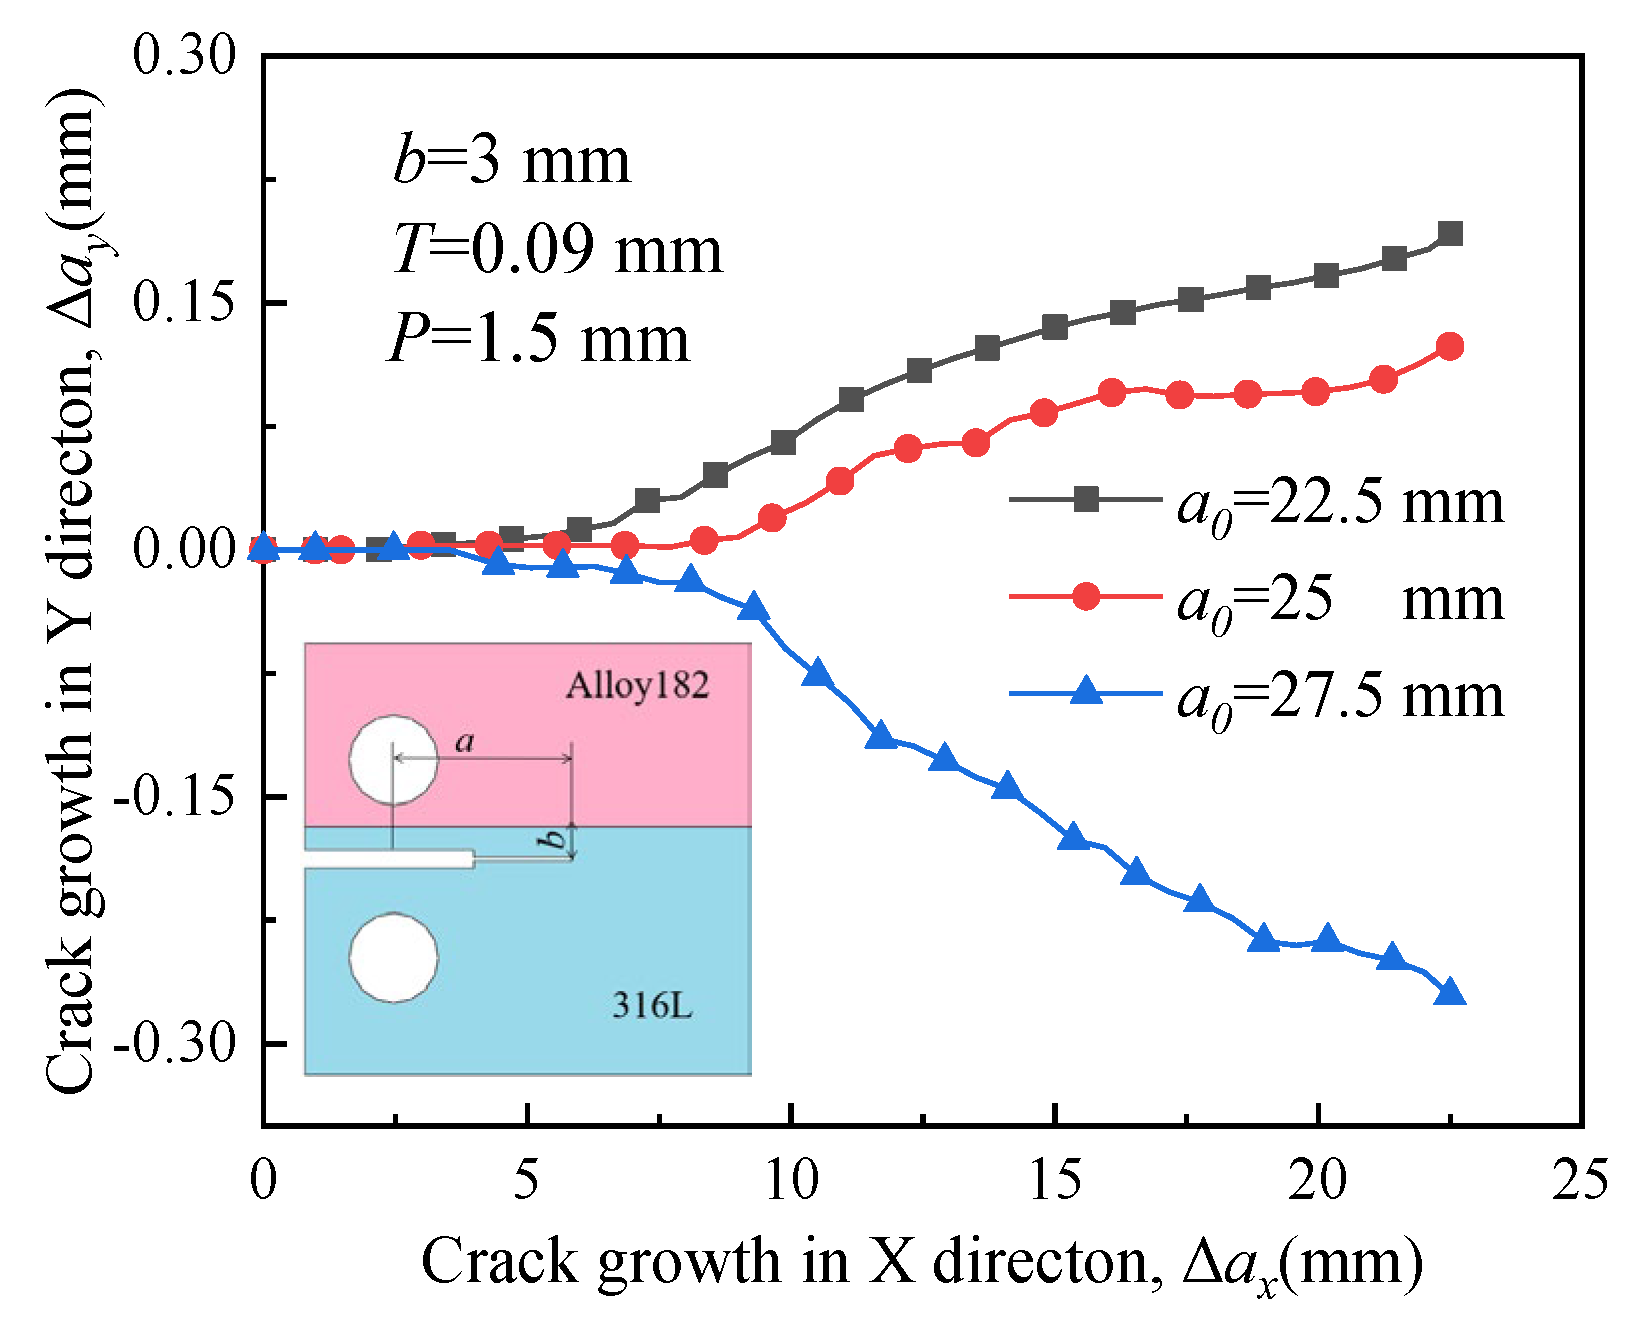
4.5. Effect of Initial Crack Length on Crack Propagation
5. Conclusions
Author Contributions
Funding
Institutional Review Board Statement
Informed Consent Statement
Data Availability Statement
Conflicts of Interest
References
- Zhao, L.; Wang, J.; Su, H.; Du, D.; Zhang, L.; Tu, S. Stress corrosion cracking of the fusion boundary for 304l/82 dissimilar metal weld joint in simulated primary water. Corrosion 2020, 76, 176–187. [Google Scholar] [CrossRef] [PubMed]
- Xue, H.; Wang, Z.; Wang, S.; He, J.X.; Yang, H.L. Characterization of mechanical heterogeneity in dissimilar metal welded joints. Materials 2021, 14, 4145. [Google Scholar] [CrossRef] [PubMed]
- Serindag, H.T.; Çam, G. Characterizations of microstructure and properties of dissimilar AISI 316L/9Ni low alloy cryogenic steel joints fabricated by GTAW. J. Mater. Eng. Perform. 2023, 32, 7039–7049. [Google Scholar] [CrossRef]
- Senol, M.; Cam, G. Investigation into microstructures and properties of AISI 430 ferritic steel butt joints fabricated by GMAW. Int. J. Pres. Ves. Pip. 2023, 202, 104926. [Google Scholar] [CrossRef]
- Serindag, H.T.; Cam, G. Multi-pass butt welding of thick AISI 316L plates by gas tungsten arc welding: Microstructural and mechanical characterization. Int. J. Pres. Ves. Pip. 2022, 200, 104842. [Google Scholar] [CrossRef]
- Deng, D.; Ogawa, K.; Kiyoshima, S.; Yanagida, N.; Saito, K. Prediction of residual stresses in a dissimilar metal welded pipe with considering cladding, buttering and post weld heat treatment. Comp. Mater. Sci. 2009, 47, 398–408. [Google Scholar] [CrossRef]
- Ye, Y.; Cai, J.; Jiang, X.; Dai, D.; Deng, D. Influence of groove type on welding-induced residual stress, deformation and width of sensitization region in a SUS304 steel butt welded joint. Adv. Eng. Softw. 2015, 86, 39–48. [Google Scholar] [CrossRef]
- Wang, Z.; Xue, H.; Wang, S.; Zhang, Y.B. A multi-method coupled approach to simulate crack growth path and stress-strain field at the tip of the growing crack in the dissimilar metal welded joint. Int. J. Pres. Ves. Pip. 2023, 206, 105046. [Google Scholar] [CrossRef]
- Wang, H.T.; Wang, G.Z.; Xuan, F.Z.; Tu, S.T. Numerical investigation of ductile crack growth behavior in a dissimilar metal welded joint. Nucl. Eng. Des. 2011, 241, 3234–3243. [Google Scholar] [CrossRef]
- Muransky, O.; Smith, M.C.; Bendeich, P.J.; Edwards, L. Validated numerical analysis of residual stresses in Safety Relief Valve (SRV) nozzle mock-ups. Comp. Mater. Sci. 2011, 50, 2203–2215. [Google Scholar] [CrossRef]
- Hou, J.; Peng, Q.J.; Shoji, T.; Wang, J.Q.; Han, E.H.; Ke, W. Effects of cold working path on strain concentration, grain boundary microstructure and stress corrosion cracking in Alloy 600. Corros. Sci. 2011, 53, 2956–2962. [Google Scholar] [CrossRef]
- Li, H.F.; Li, G.J.; Fang, K.W.; Peng, J.; Yang, W.; Zhang, M.L.; Sun, Z.Y. Stress corrosion cracking behavior of dissimilar metal weld A508/52M/316L in high temperature water environment. Acta. Metall. Sin. 2011, 47, 797–803. [Google Scholar]
- Hou, J.; Peng, Q.; Shoji, T.; Wang, J.; Ke, W.; Han, E. Study of microstructure and stress corrosion cracking behavior in welding transition zone of Ni-based alloys. Acta Metall. Sin. 2010, 46, 1258–1266. [Google Scholar] [CrossRef]
- Jang, C.; Lee, J.; Kim, J.S.; Jin, T.E. Mechanical property variation within Inconel 82/182 dissimilar metal weld between low alloy steel and 316 stainless steel. Int. J. Pres. Ves. Pip. 2008, 85, 635–646. [Google Scholar] [CrossRef]
- Peng, Q.; Xue, H.; Hou, J.; Sakaguchi, K.; Takeda, Y.; Kuniya, J.; Shoji, T. Role of water chemistry and microstructure in stress corrosion cracking in the fusion boundary region of an Alloy 182-A533B low alloy steel dissimilar weld joint in high temperature water. Corros. Sci. 2011, 53, 4309–4317. [Google Scholar] [CrossRef]
- Huang, J.Y.; Liu, R.F.; Chiang, M.F.; Jeng, S.L.; Huang, J.S.; Kuo, R.C.; Wang, J.C. Corrosion fatigue behavior of dissimilar metal weldments under nominal constant ΔK loading mode in a simulated BWR coolant environment. Corros. Sci. 2011, 53, 2289–2298. [Google Scholar] [CrossRef]
- Huang, J.Y.; Chiang, M.F.; Jeng, S.L.; Huang, J.S.; Kuo, R.C. Environmentally assisted cracking behavior of dissimilar metal weldments in simulated BWR coolant environments. J. Nucl. Mater. 2013, 432, 189–197. [Google Scholar] [CrossRef]
- Turski, M.; Bouchard, P.J.; Steuwer, A.; Withers, P.J. Residual stress driven creep cracking in AISI Type 316 stainless steel. Acta Mater. 2008, 56, 3598–3612. [Google Scholar] [CrossRef]
- Chen, L.Y.; Wang, G.Z.; Tan, J.P.; Xuan, F.Z.; Tu, S.T. Effects of residual stress on creep damage and crack initiation in notched CT specimens of a Cr-Mo-V steel. Eng. Fract. Mech. 2013, 97, 80–91. [Google Scholar] [CrossRef]
- Zhao, L.; Jing, H.; Xu, L.; Han, Y.; Xiu, J. Effect of Tesidual stress on creep crack growth behavior in ASME P92steel. Eng. Fract. Mech. 2013, 110, 233–248. [Google Scholar] [CrossRef]
- Song, X.M.; Wang, G.Z.; Xuan, F.Z.; Tu, S.T. Investigation of residual stress effects on creep crack initiation and growth using local out-of-plane compression. Eng. Fract. Mech. 2015, 149, 45–57. [Google Scholar] [CrossRef]
- Song, X.M.; Wang, G.Z.; Tu, S.T.; Xuan, F.Z. Effects of residual stress on creep crack initiation and growth of Cr-Mo-V steel in cracked C(T) specimen. Procedia Eng. 2015, 130, 1770–1778. [Google Scholar] [CrossRef]
- Qiang, B.; Li, Y.; Yao, C.; Wang, X. Through-thickness welding residual stress and its effect on stress intensity factors for semi-elliptical surface cracks in a butt-welded steel plate. Eng. Fract. Mech. 2018, 193, 17–31. [Google Scholar] [CrossRef]
- Alves, D.N.; Almeida, J.G.; Rodrigues, M.C. Experimental and numerical investigation of crack growth behavior in a dissimilar welded joint. Theor. Appl. Fract. Mech. 2020, 109, 102697. [Google Scholar] [CrossRef]
- Alkateb, M.; Tadić, S.; Ivanović, I.; Marković, S. Crack growth rate analysis of stress corrosion cracking. Teh. Vjesn. 2021, 28, 240–247. [Google Scholar] [CrossRef]
- Moharrami, R.; Sanayei, M. Developing a method in measuring residual stress on steel alloys by instrumented indentation technique. Measurement 2020, 158, 107718. [Google Scholar] [CrossRef]
- Uyulgan, B.; Cetinel, H.; Aksoy, T. Effect of constraint on fracture behavior of welded 17mn4 and aisi304 steels. J. Mech. Sci. Technol. 2011, 25, 2171–2177. [Google Scholar] [CrossRef]
- Itatani, M.; Saito, T.; Hayashi, T.; Narazaki, C.; Ogawa, K.; Kikuchi, M. Evaluation of fracture characteristics of Ni-base weld metal for BWR components. ASME Press. Vessel. Pip. Conf. 2009, 43642, 419–427. [Google Scholar] [CrossRef]
- Bi, Y.; Yuan, X.; Lv, J.; Bashir, R.; Wang, S.; Xue, H. Effect of yield strength distribution welded joint on crack propagation path and crack mechanical tip field. Materials 2021, 14, 4947. [Google Scholar] [CrossRef]
- Sun, Y.; Xue, H.; Yang, F.; Wang, S.; Zhang, S.; He, J.; Bashir, R. Mechanical properties evaluation and crack propagation behavior in dissimilar metal welded joints of 304 L austenitic stainless steel and SA508 low-alloy steel. Sci. Technol. Nucl. Install. 2022, 2022, 3038397. [Google Scholar] [CrossRef]
- Lin, H.B.; Li, Q.; Liu, D.K. Study on the effect of residual compressive stress on crack propagation based on XFEM. Chem. Eng. J. 2016, 51, 85–90. [Google Scholar] [CrossRef]
- Dassault Systemes Simulia Corp. Abaqus Analysis User’s Manual 6.12; Simulia: Johnston, RI, USA, 2012. [Google Scholar]
- ASTM Standard E399-90; Standard Test Method for Plane Strain Fracture Toughness of Metallic Materials. ASTM Standards American Society for Testing Materials: West Conshohocken, PA, USA, 2002.
- Xue, H.; Ogawa, K.; Shoji, T. Effect of welded mechanical heterogeneity on local stress and strain ahead of stationary and growing crack tips. Nucl. Eng. Des. 2009, 239, 628–640. [Google Scholar] [CrossRef]
- Chopra, O.K.; Gruber, E.E.; Shack, W.J. Fracture toughness and crack growth rates of irradiated austenitic stainless steels (No. ANL-03/22); Technical Report; Argonne National Lab.: Lemont, IL, USA, 2003. [Google Scholar] [CrossRef]
- Liu, J.H.; Wang, L.; Liu, Y.; Song, X.; Luo, J.; Yuan, D. Fracture toughness and fracture behavior of SA508-III steel at different temperatures. Int. J. Miner. Metall. Mater. 2014, 21, 1187–1195. [Google Scholar] [CrossRef]
- Moës, N.; Belytschko, T. Extended finite element method for cohesive crack growth. Eng. Fract. Mech. 2002, 69, 813–833. [Google Scholar] [CrossRef]
- Cam, G.; Erim, S.; Yeni, C.; Kocak, M. Determination of mechanical and fracture properties of laser beam welded steel joints. Weld. J. 1999, 78, 193s–201s. [Google Scholar]


| Materials | Young’s Modulus E (GPa) | Poison’s Ratio v | Yield Stress σ0 (MPa) | Hardening Exponent n | Ultimate Tensile Strength σu (MPa) | Fracture Toughness JIC (kJ/m2) |
|---|---|---|---|---|---|---|
| A508 | 183 | 0.3 | 385 | 4.779 | 560 | 224.2 |
| Alloy 182 | 203 | 0.3 | 342 | 4.375 | 576 | 166.6 |
| 316L | 176 | 0.3 | 309 | 4.080 | 485 | 170.0 |
| Crack Location | Different Young’s Modulus E (GPa) | Same Young’s Modulus E (GPa) |
|---|---|---|
| crack 1 | EA508 = 183, EAlloy 182 = 203 | EAlloy 182 = 203 |
| crack 2 | ||
| crack 3 | EAlloy 182 = 203, E316L = 176 | |
| crack 4 |
Disclaimer/Publisher’s Note: The statements, opinions and data contained in all publications are solely those of the individual author(s) and contributor(s) and not of MDPI and/or the editor(s). MDPI and/or the editor(s) disclaim responsibility for any injury to people or property resulting from any ideas, methods, instructions or products referred to in the content. |
© 2023 by the authors. Licensee MDPI, Basel, Switzerland. This article is an open access article distributed under the terms and conditions of the Creative Commons Attribution (CC BY) license (https://creativecommons.org/licenses/by/4.0/).
Share and Cite
Zhao, L.; Sun, Y.; Shi, Z.; Yang, B. Analysis of Crack Propagation Behaviors in RPV Dissimilar Metal Welded Joints Affected by Residual Stress. Materials 2023, 16, 6578. https://doi.org/10.3390/ma16196578
Zhao L, Sun Y, Shi Z, Yang B. Analysis of Crack Propagation Behaviors in RPV Dissimilar Metal Welded Joints Affected by Residual Stress. Materials. 2023; 16(19):6578. https://doi.org/10.3390/ma16196578
Chicago/Turabian StyleZhao, Lingyan, Yuchun Sun, Zheren Shi, and Bin Yang. 2023. "Analysis of Crack Propagation Behaviors in RPV Dissimilar Metal Welded Joints Affected by Residual Stress" Materials 16, no. 19: 6578. https://doi.org/10.3390/ma16196578