
Residual Compressive Strength Prediction Model for Concrete Subject to High Temperatures Using Ultrasonic Pulse Velocity


Abstract
:1. Introduction
2. Materials and Methods
2.1. Materials
2.2. Experimental Program and Concrete Mix Proportion
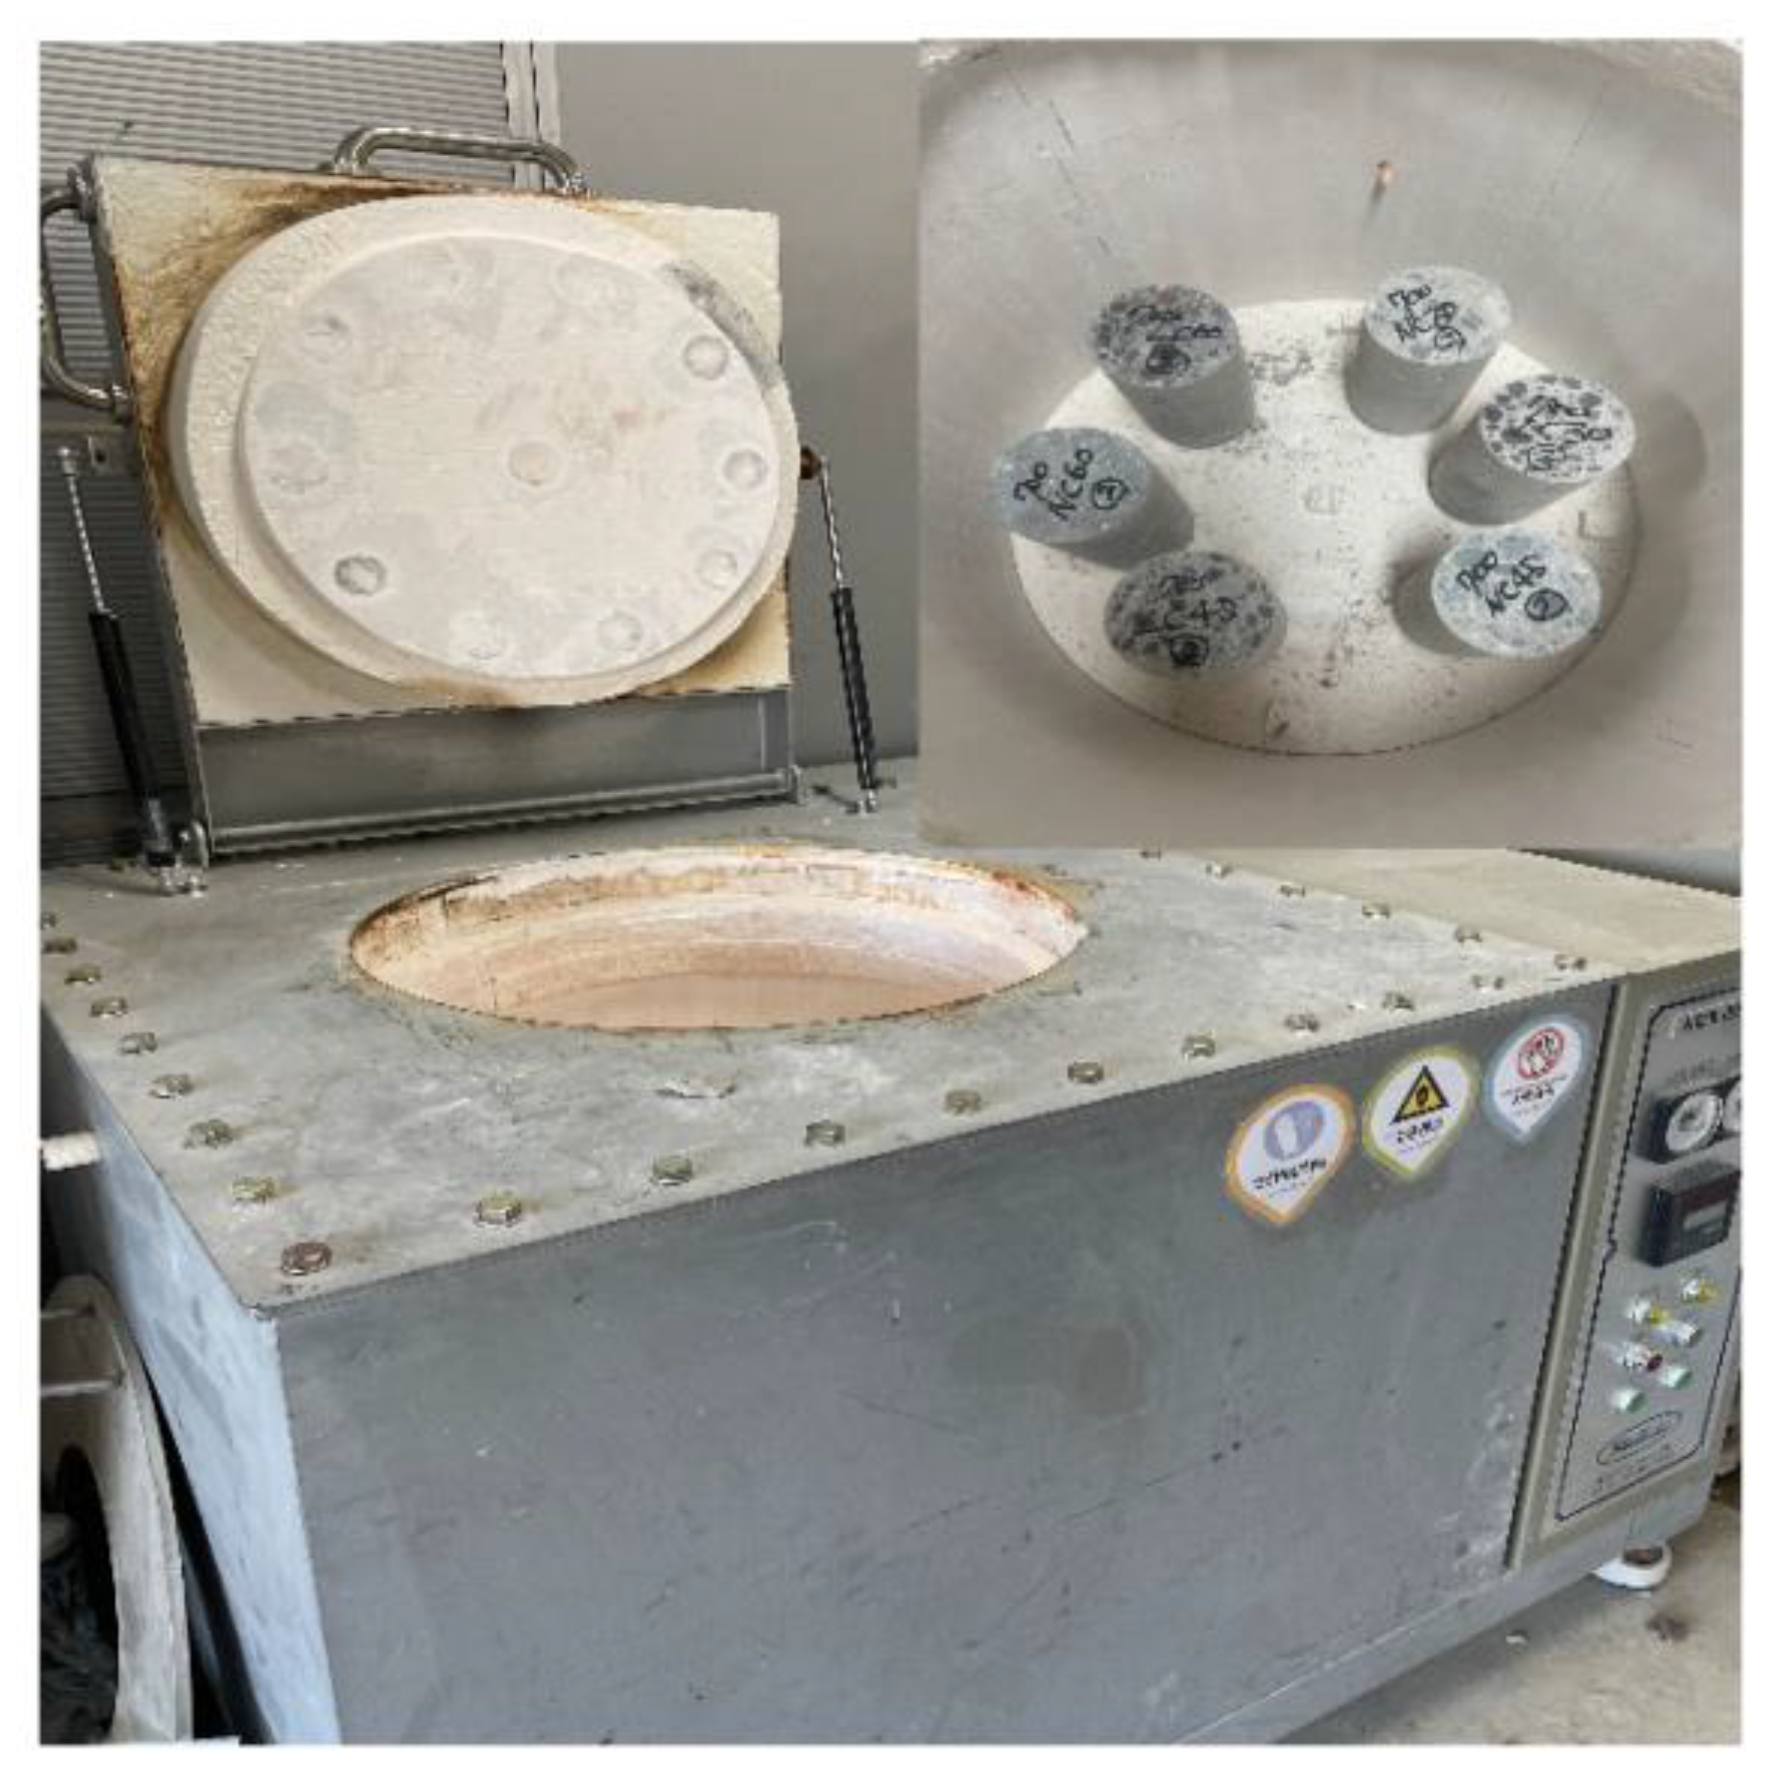
2.3. Test Methods
3. Results and Discussion
3.1. Mechanical Properties of NC and LC after High Temperature
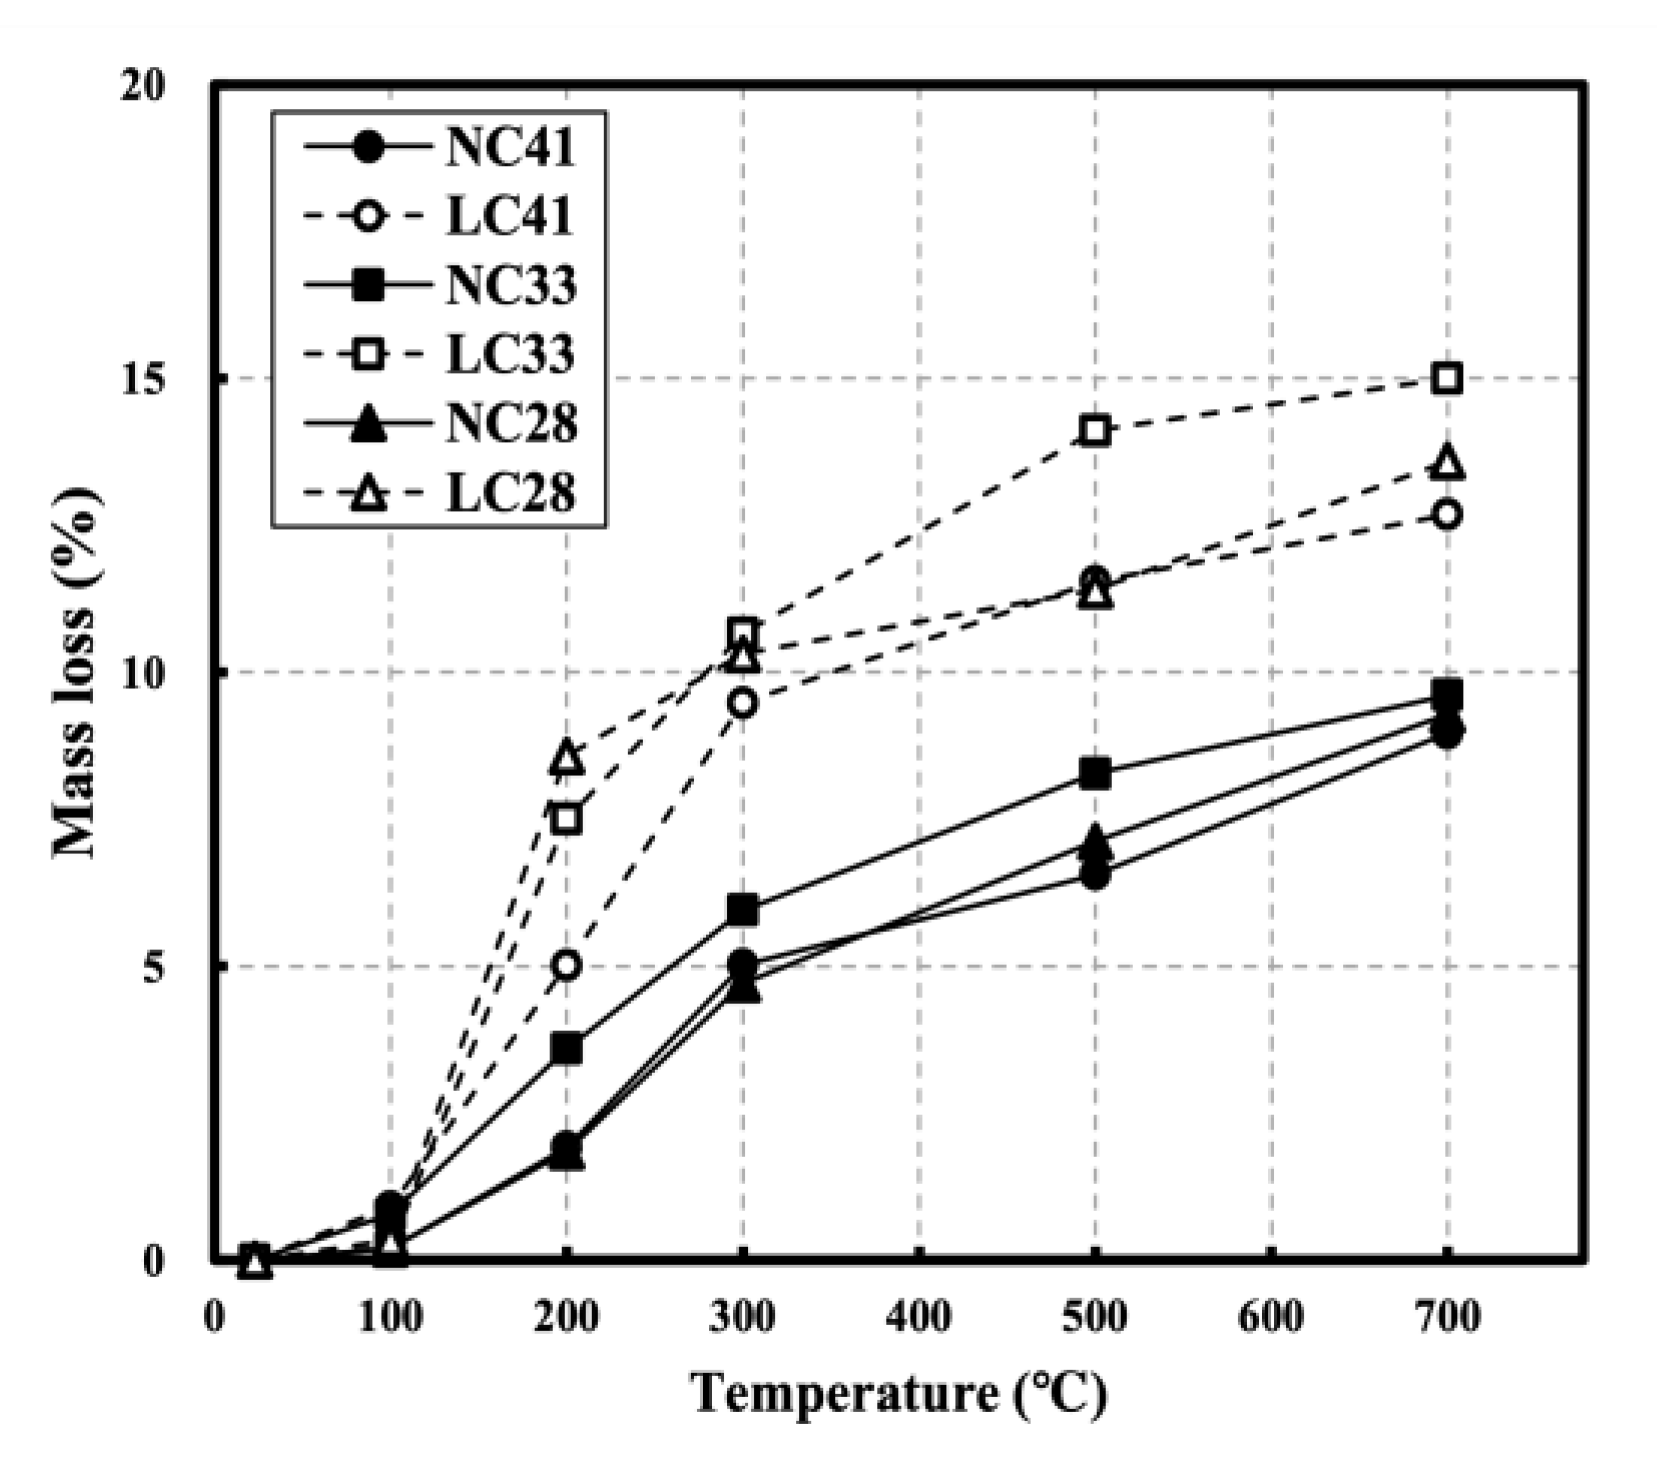
3.1.1. Mass Loss on NC and LC after High Temperature
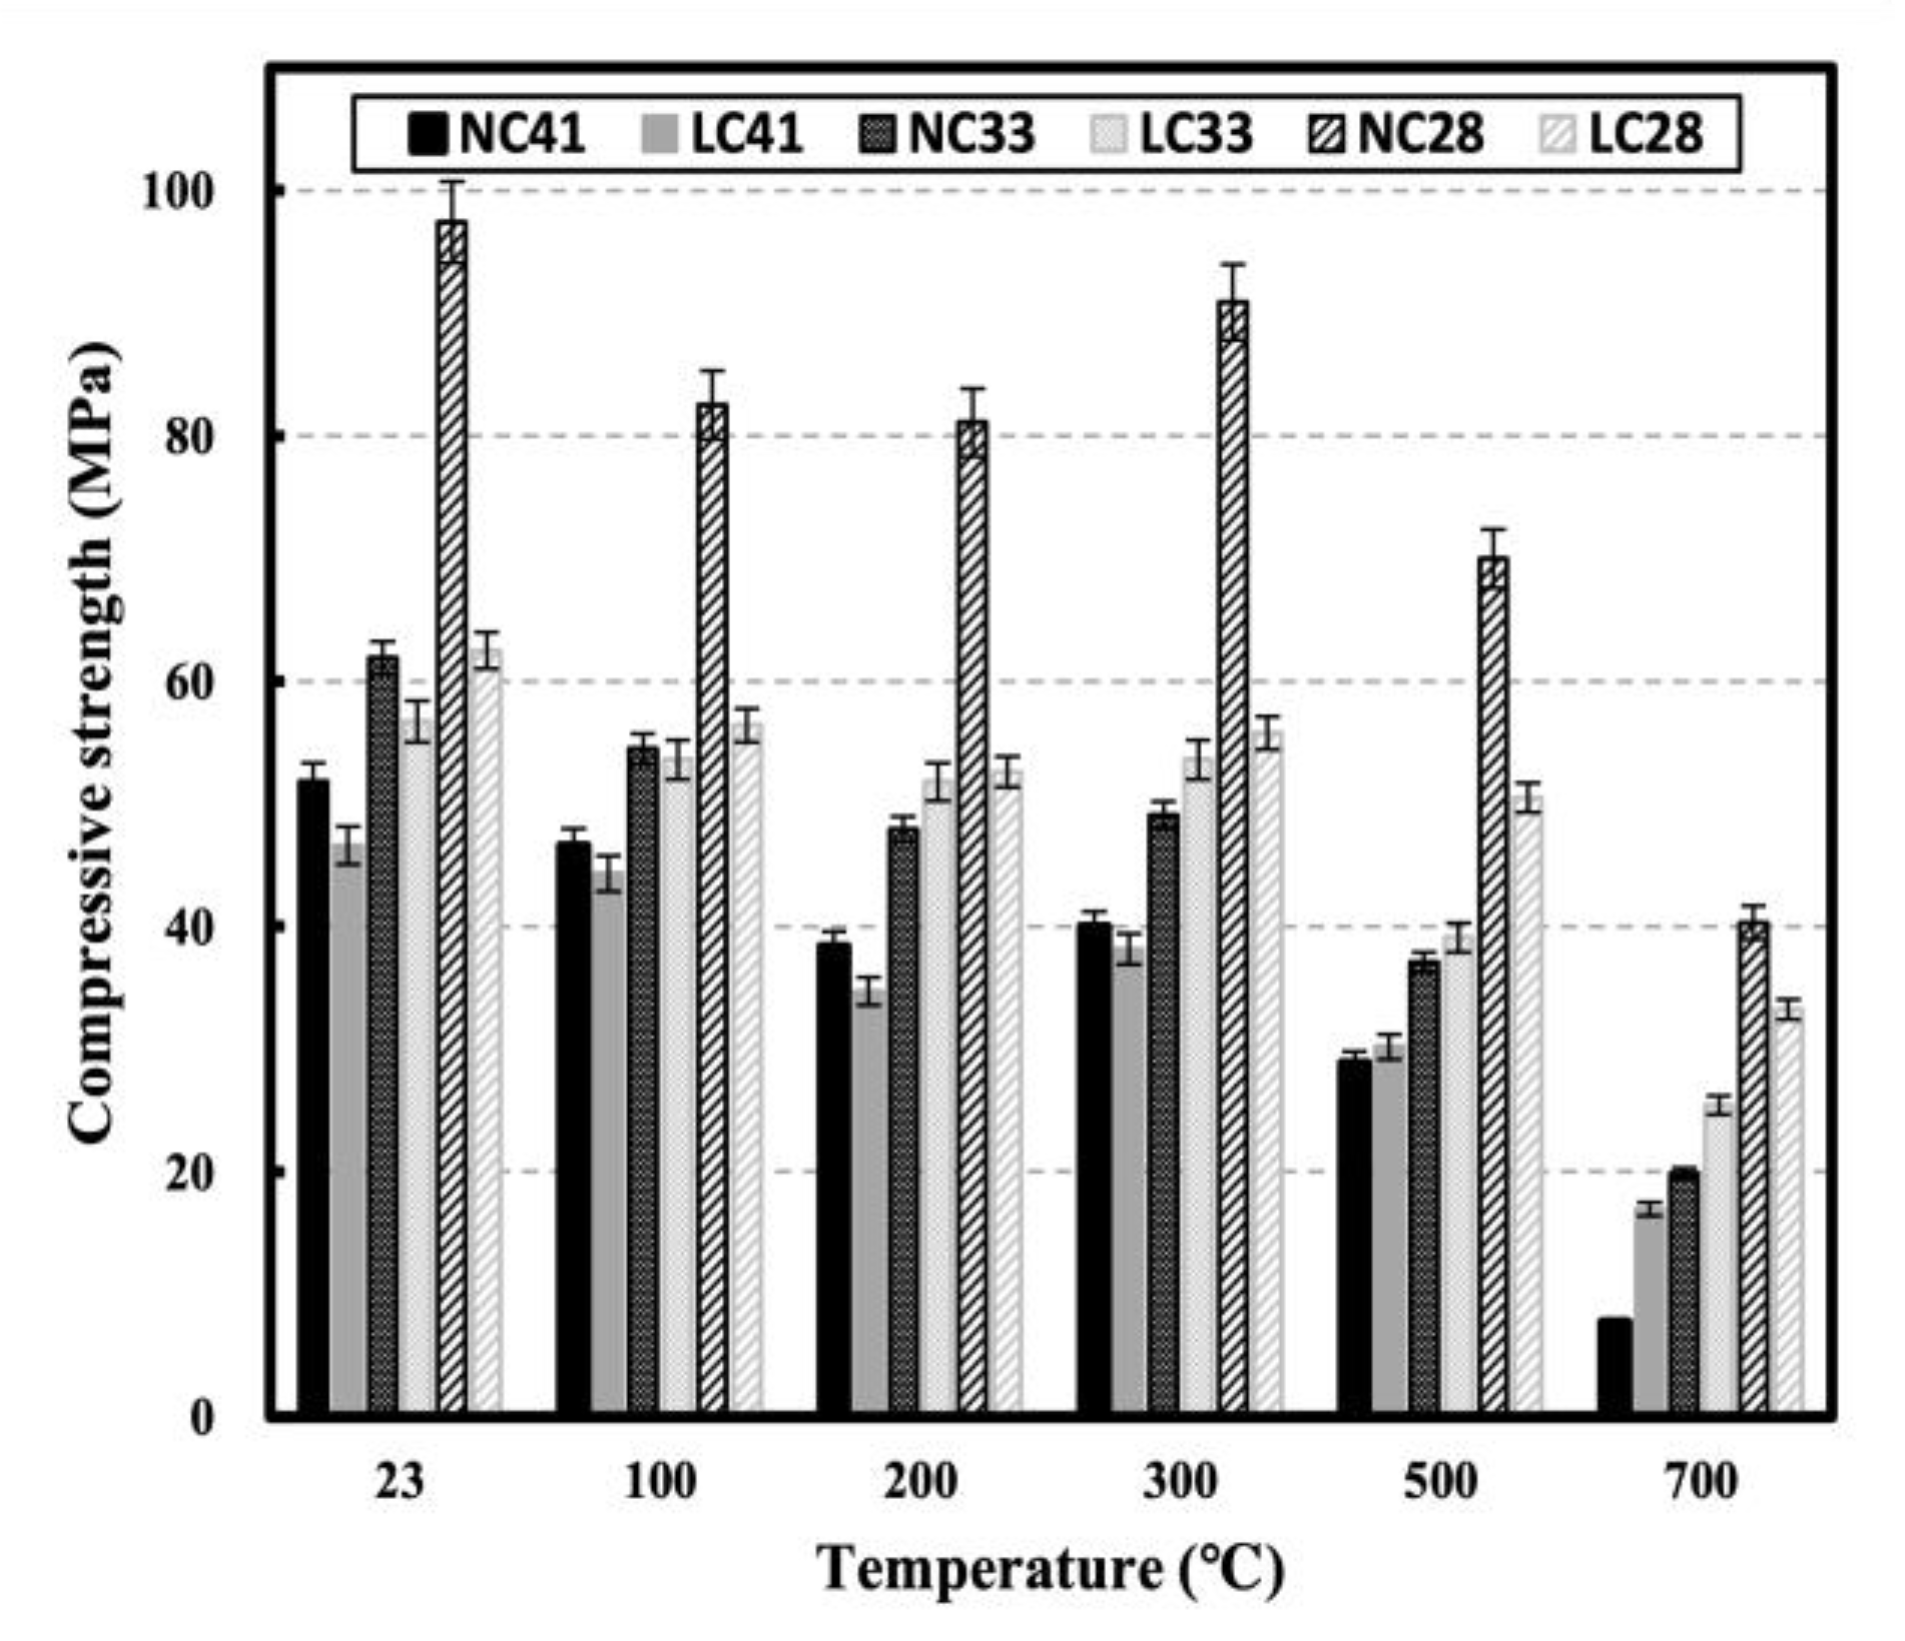
3.1.2. Compressive Strength on NC and LC after High Temperature
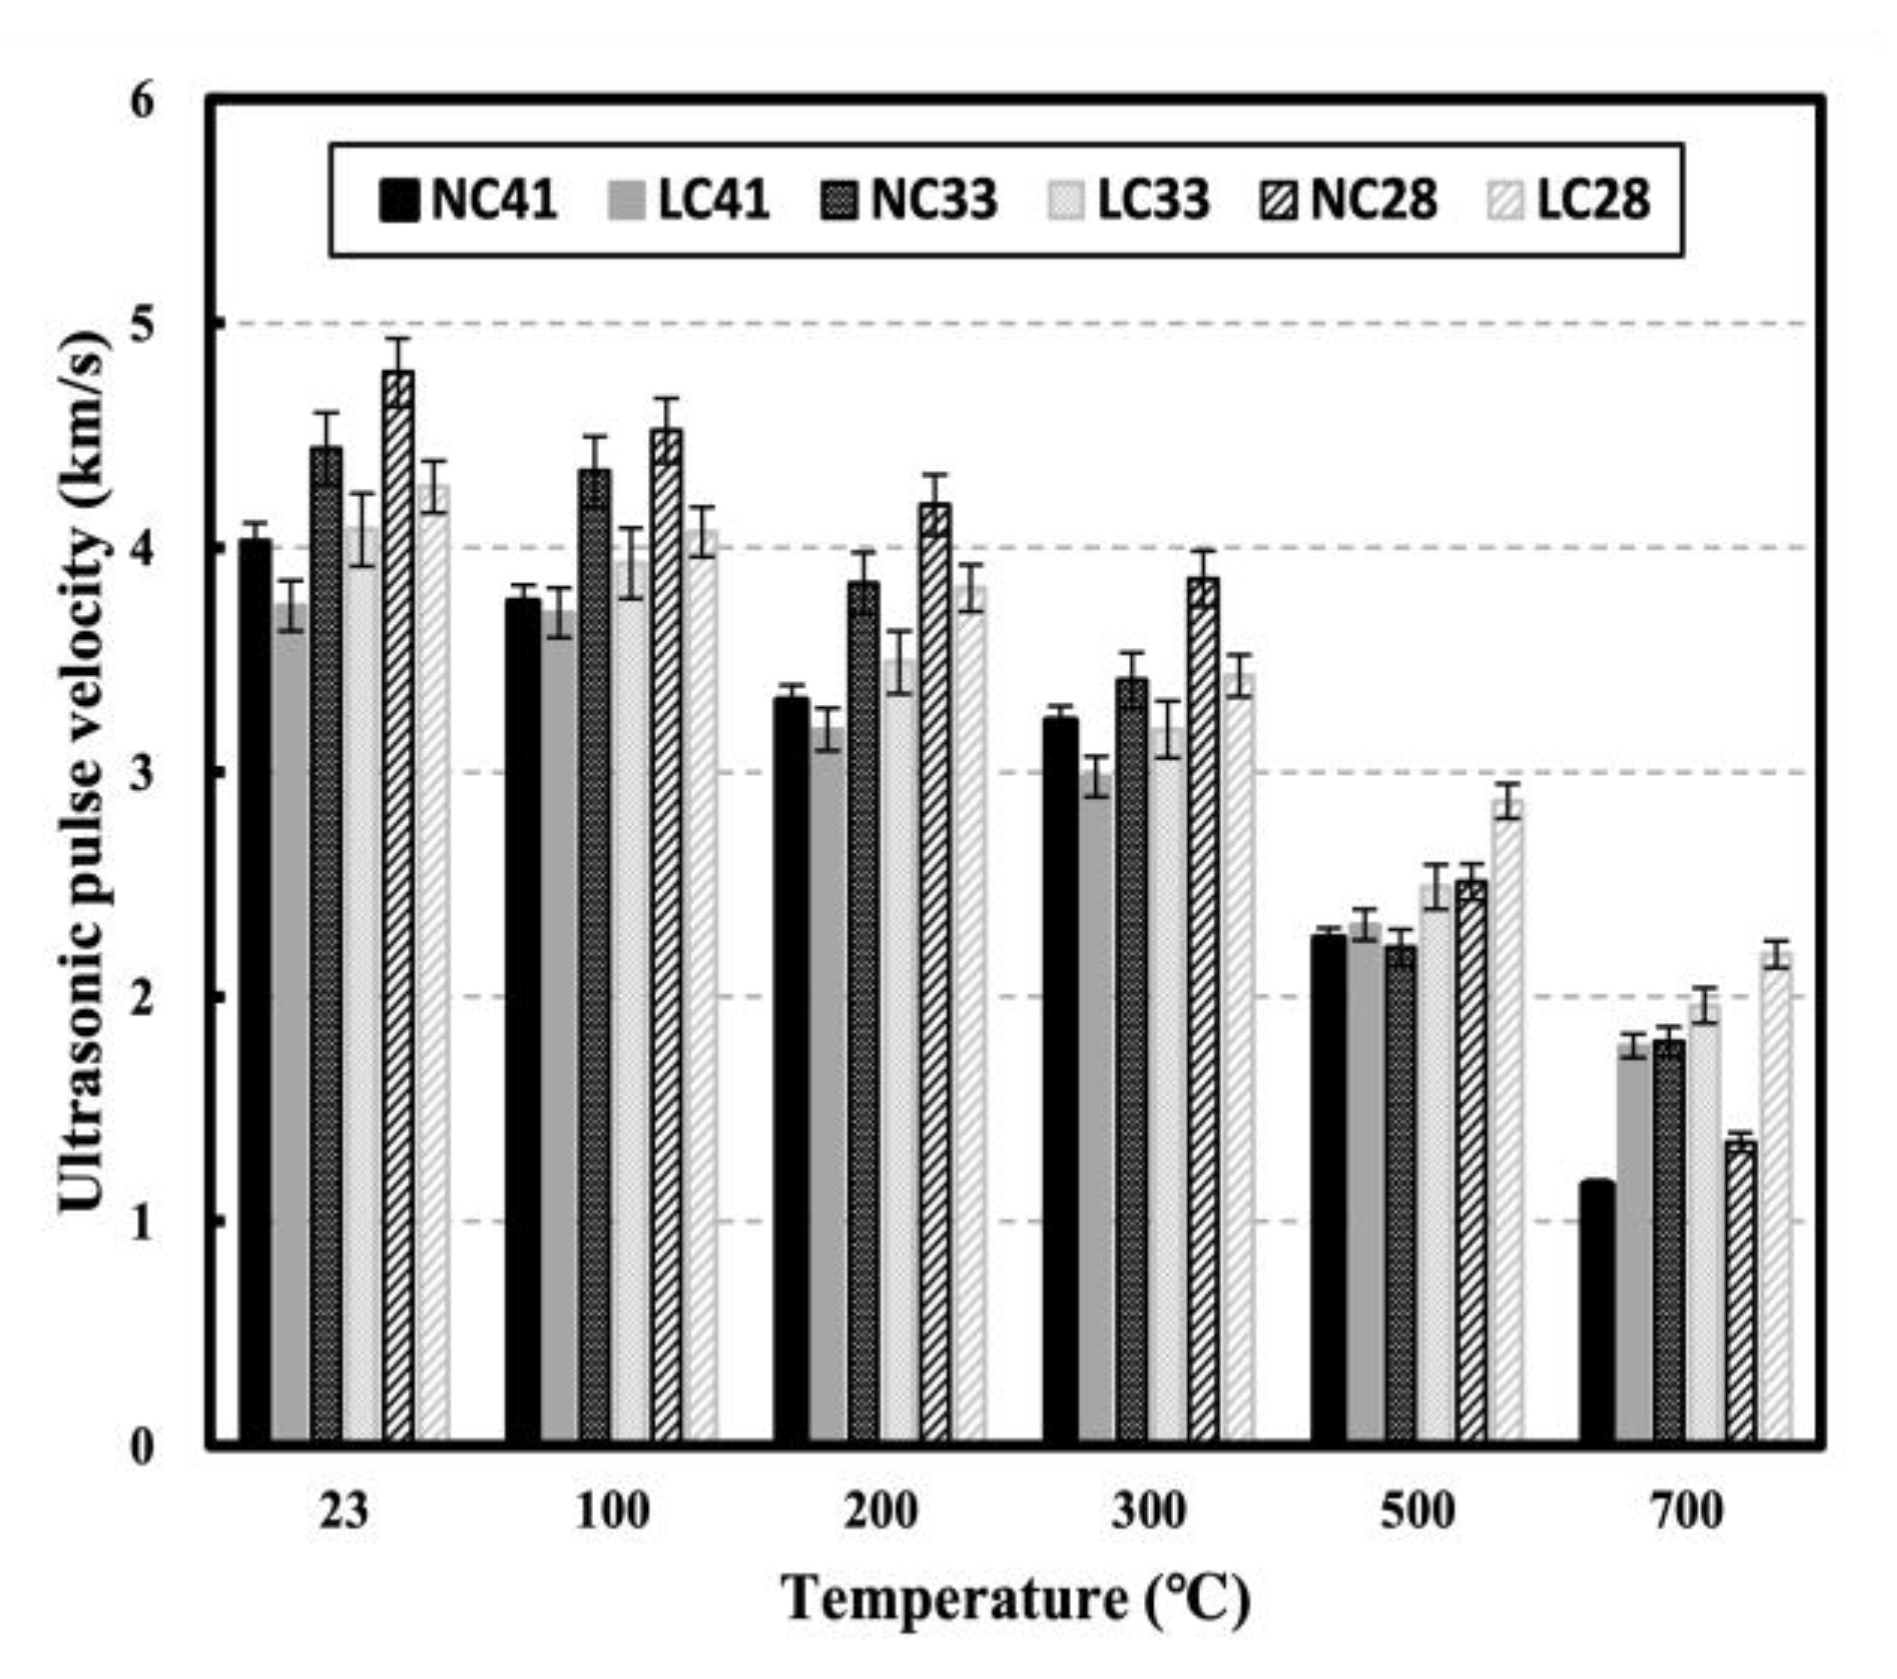
3.1.3. Ultrasonic Pulse Velocity on NC and LC after High Temperature
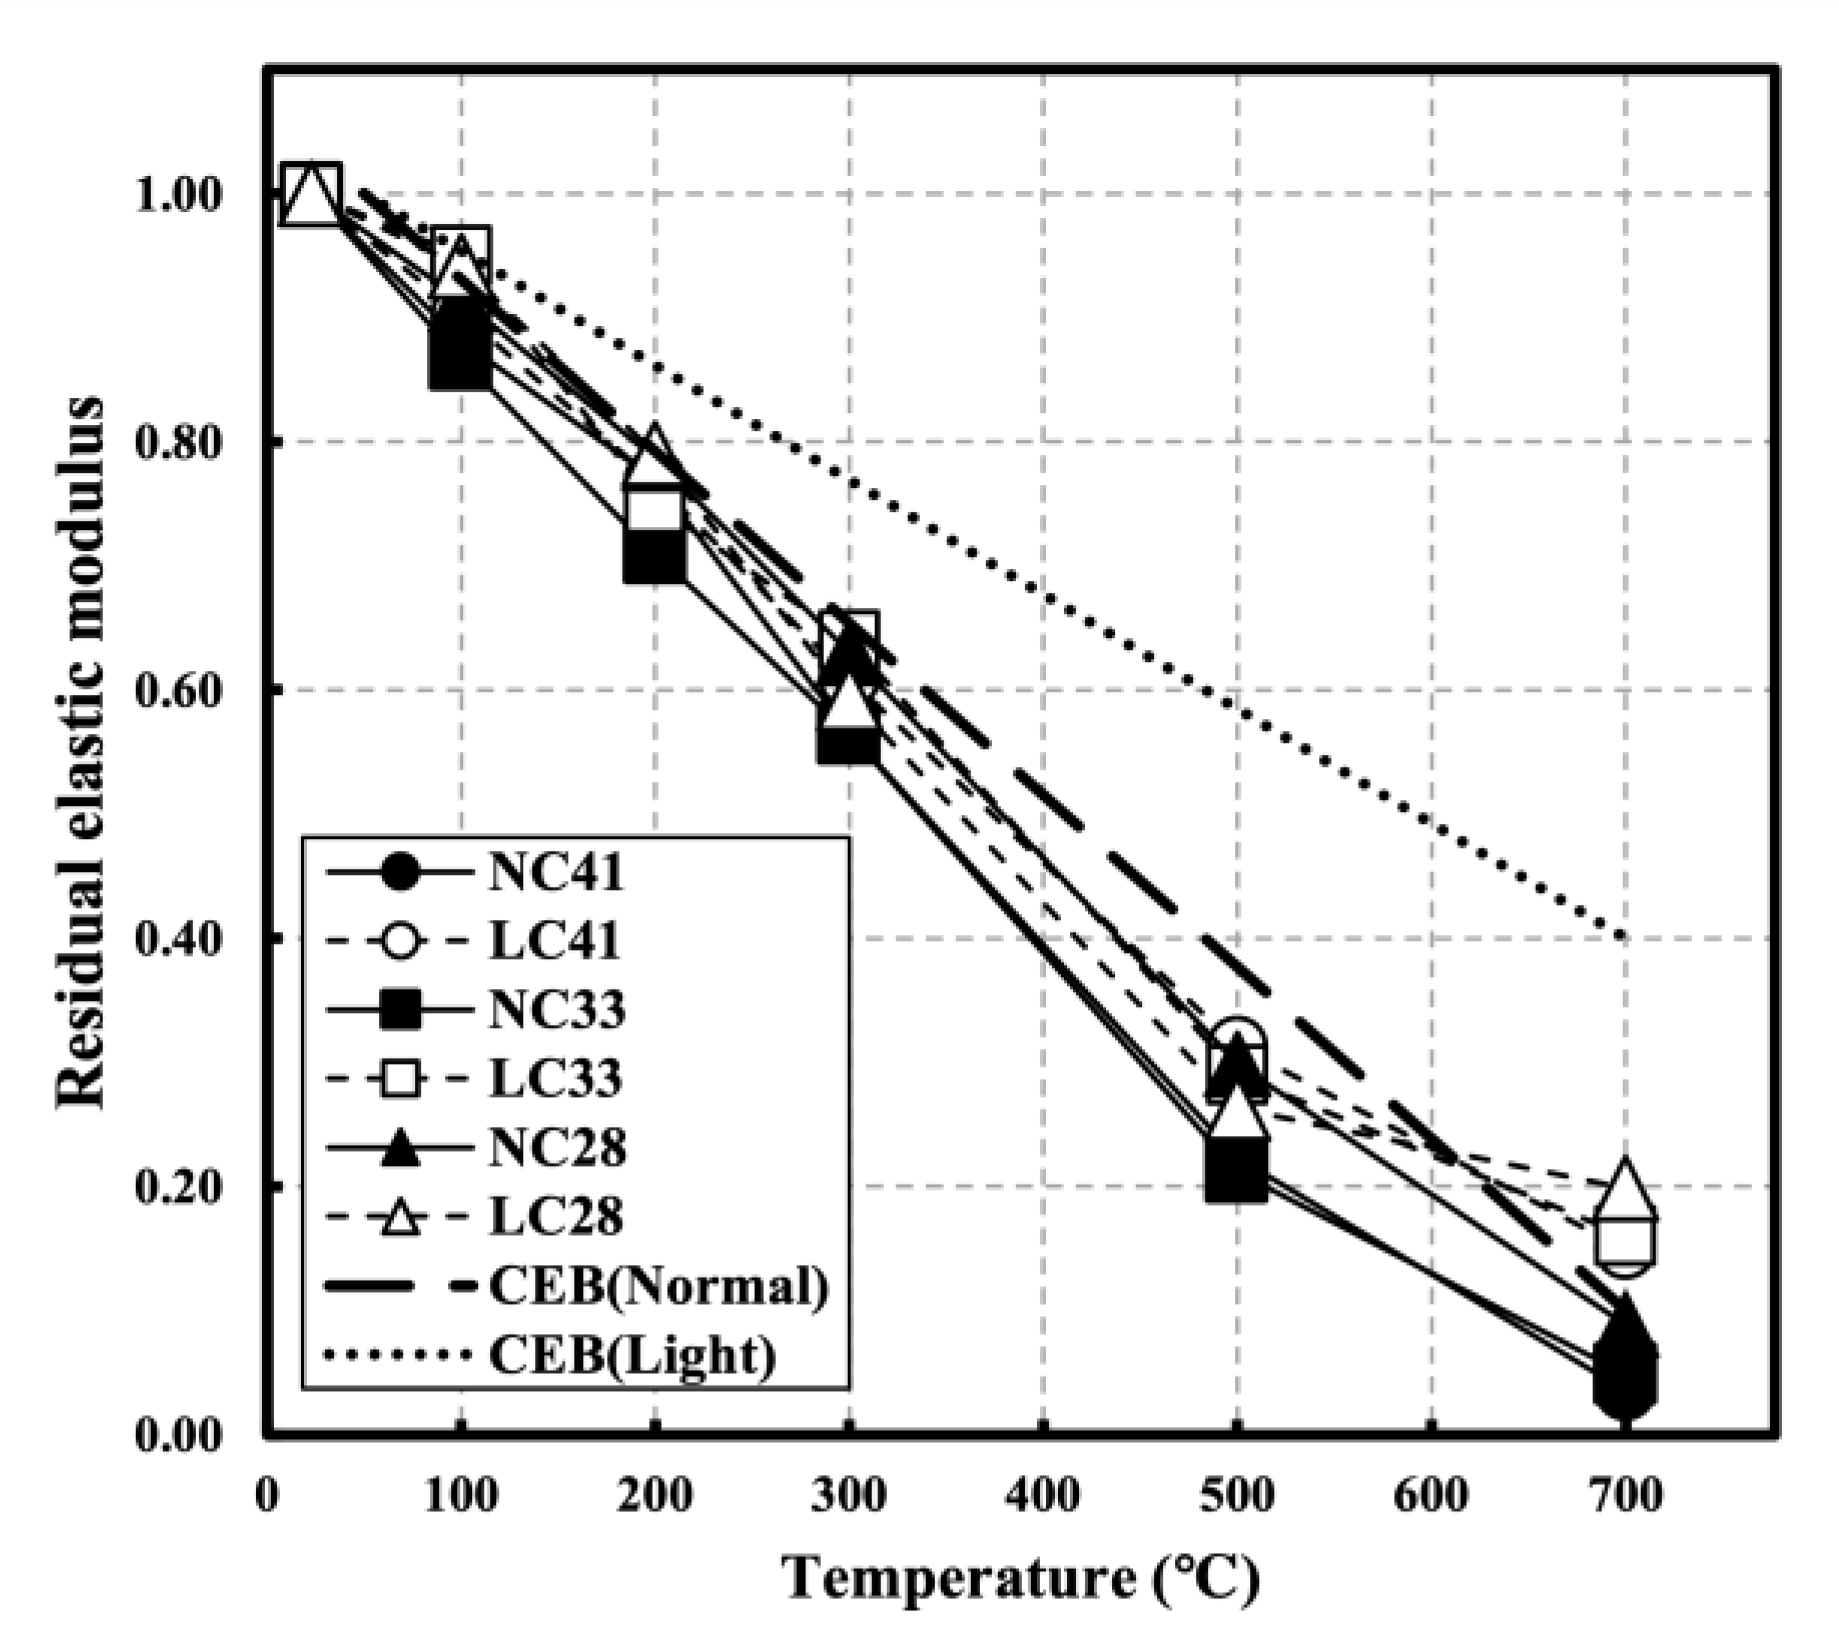
3.1.4. Elastic Modulus on NC and LC after High Temperature
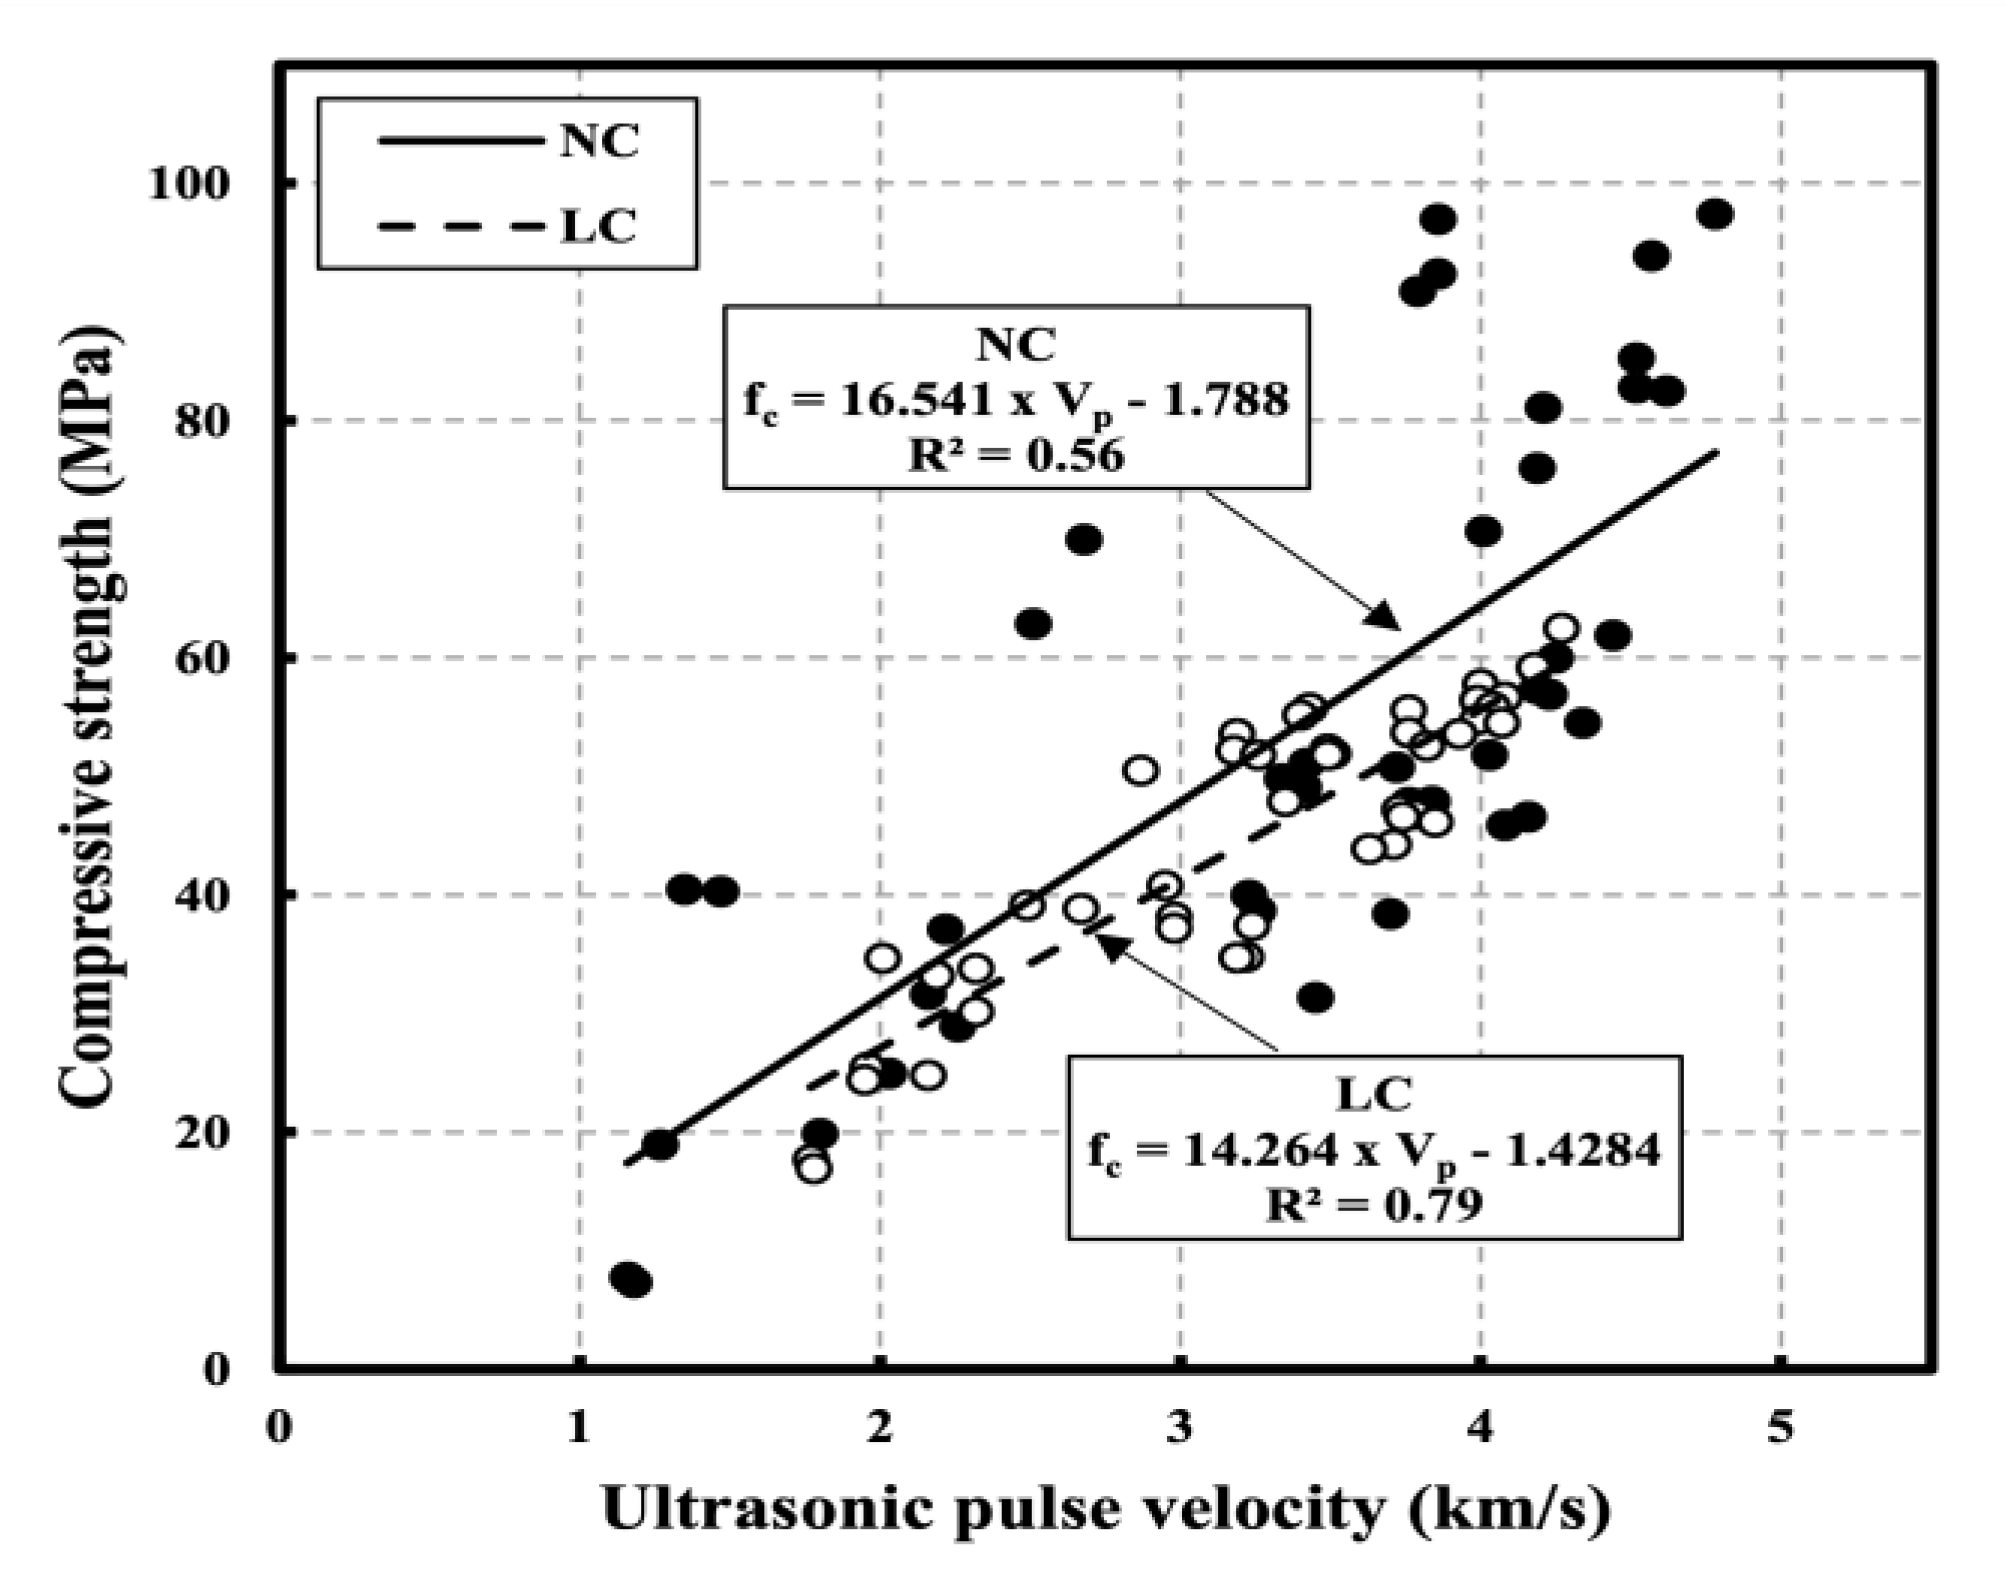
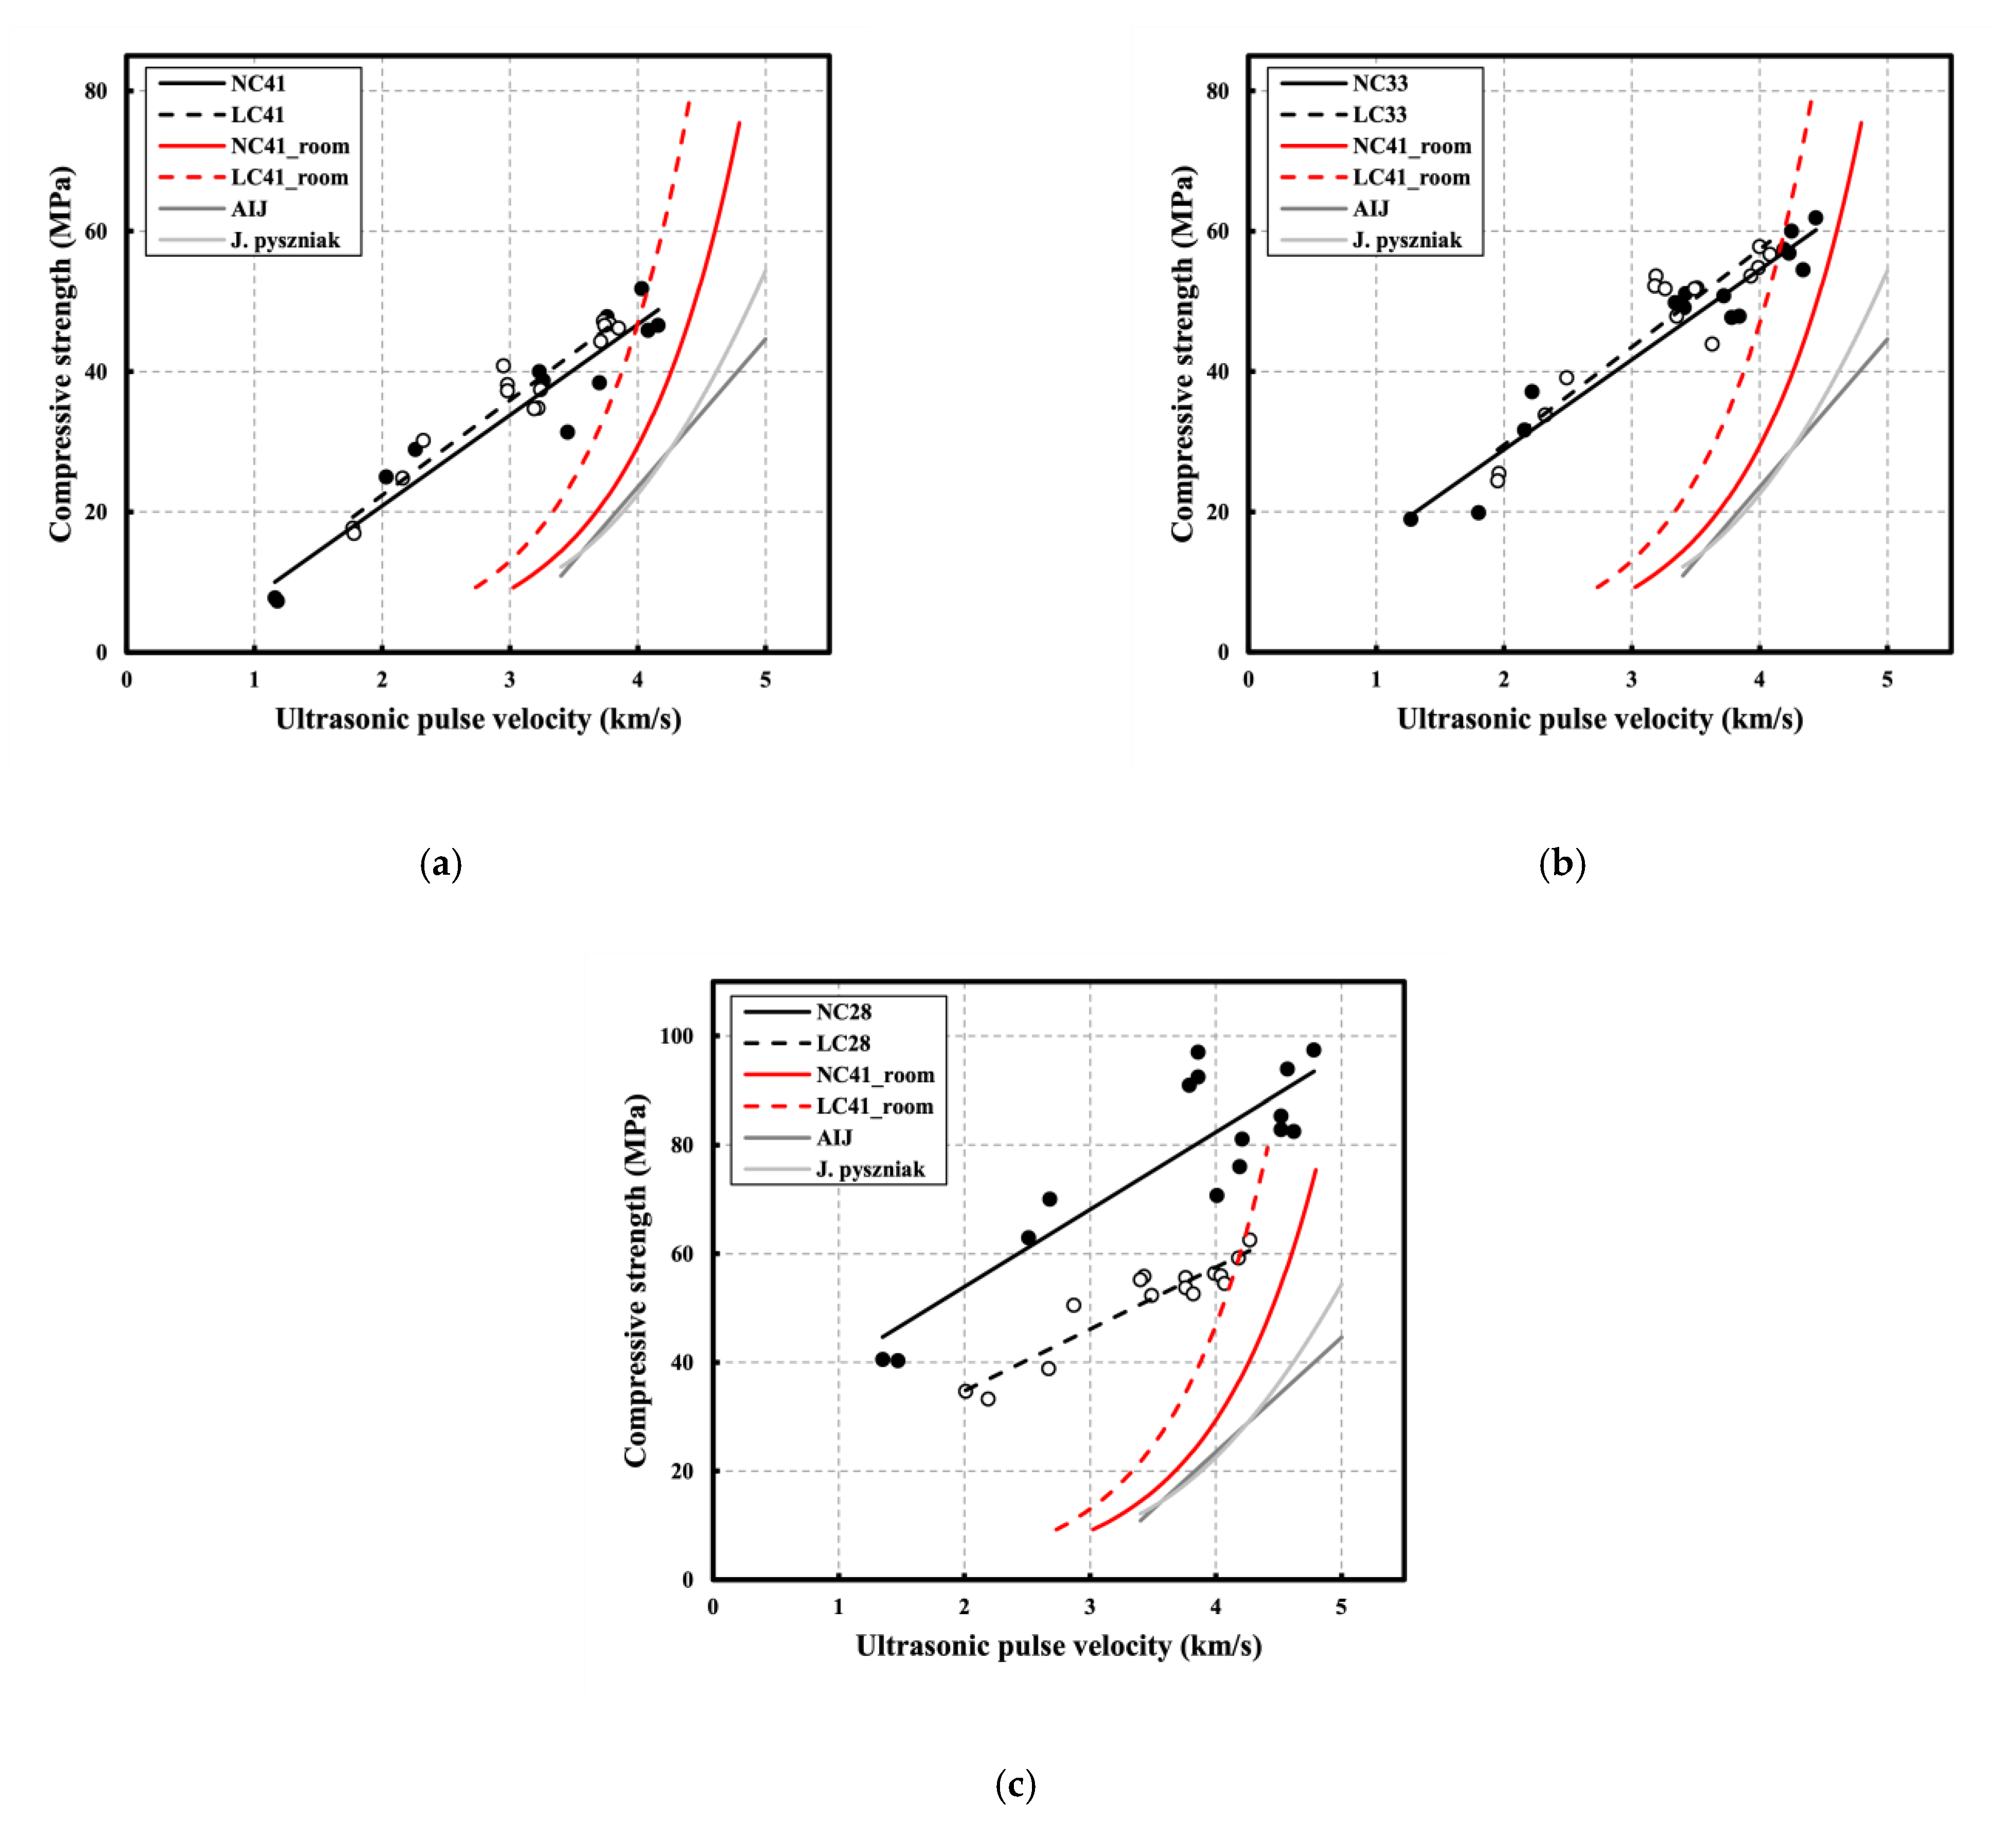
3.2. Correlation between Compressive Strength and Ultrasonic Pulse Velocity on NC and LC after High Temperature
4. Conclusions
- After exposure to high temperatures, the highest mass loss increase rate was observed in the 100–300 °C temperature range. At 300 °C, the mass loss was approximately 5% for NC and 10% for LC. At 700 °C, the mass loss was approximately 9.29% for NC and 13.76% for LC, possibly caused by the influence of the water content inside the aggregate.
- All specimens showed slight strength recovery after strength degradation in the temperature range below 300 °C and showed consistent strength degradation above 300 °C. At 700 °C, the residual compressive strengths of NC41, NC33, and NC28 were 0.15, 0.32, and 0.45, respectively, while those of LC41, LC33, and LC28 were 0.36, 0.45, and 0.53, respectively, possibly caused by the difference in the thermal expansion between the coarse aggregates.
- All specimens showed continuous ultrasonic pulse velocity (UPV) as the temperature increased. At 700 °C, the residual UPVs of NC41, NC33, and NC28 were 0.29, 0.41, and 0.32, respectively, while those of LC41, LC33, and LC28 were 0.62, 0.61, and 0.67, respectively.
- As the temperature increased, the elastic modulus continuously decreased at all levels and demonstrated a low residual rate compared with other mechanical properties. At 500 °C, the residual elastic modulus averaged 0.27 for all levels. At 700 °C, the average residual elastic moduli were approximately 0.06 for NC and 0.17 for LC.
- When the correlation between the compressive strength of concrete and UPV following exposure to high temperatures was analyzed, the prediction equations that consider the water-binder (W/C) ratio had high R2; however, relatively low R2 was observed at a W/C ratio of 0.28. Additionally, the existing prediction equations at room temperature (20 °C) and the prediction equations using UPV analysis showed significant differences. Therefore, prediction equations that reflect high-temperature characteristics must be used for accurately predicting of the strength of concrete through UPV following exposure to high temperatures. Furthermore, it is necessary to consider the aggregate and W/C ratio of concrete.
Author Contributions
Funding
Institutional Review Board Statement
Informed Consent Statement
Data Availability Statement
Conflicts of Interest
References
- Jung, S.P.; Lee, H.Y.; Song, J.Y.; Kim, J.W. A convergence study on establishment of fire-based objects for developing BIM libraries of tall buildings. Korea Sci. Art Forum 2018, 36, 351–365. [Google Scholar] [CrossRef]
- Ko, S.C.; Yi, W.H. A Study on Guidelines of Evacuation Planning for High-rise Buildings Through Simulation and Survey Analysis. J. Korean Soc. Hazard Mitig. 2018, 18, 35–46. [Google Scholar] [CrossRef]
- Dolinar, D.; Trtnik, G.; Turk, G.; Hozjan, T. The feasibility of estimation of mechanical properties of limestone concrete after fire using nondestructive methods. Constr. Build. Mater. 2019, 228, 1167. [Google Scholar] [CrossRef]
- Arslan, M.H.; Erdogan, O.; Koken, A.; Erkan, I.H.; Dogan, G. Evaluation of fire performance of prefabricated concrete buildings in Turkey. Mag. Concr. Res. 2017, 69, 389–401. [Google Scholar] [CrossRef]
- Alcaíno, P.; Santa-María, H.; Magna-Verdugo, C.; López, L. Experimental fast-assessment of post-fire residual strength of reinforced concrete frame buildings based on non-destructive tests. Constr. Build. Mater. 2020, 234, 117371. [Google Scholar] [CrossRef]
- Choi, S.J.; Kim, D.B.; Lee, K.S.; Kim, Y.U. The Study on the physical and strength properties of Lightweight aggregate concrete by replacement ratio of artificial Lightweight aggregate. J. Korea Inst. Build. Constr. 2019, 19, 313–322. [Google Scholar]
- Huda, M.Z.; Jumaat, M.Z.; Islam, A.S.; Al-Kutti, W.A. Performance of high strength lightweight concrete using palm wastes. IIUM Eng. J. 2018, 19, 30–42. [Google Scholar] [CrossRef]
- Sim, J.I.; Yang, K.H. Influence of specimen geometries on the compressive strength of Lightweight aggregate concrete. J. Korea Concr. Inst. 2012, 24, 333–340. [Google Scholar] [CrossRef] [Green Version]
- Kim, Y.J.; Choi, Y.W. The quality properties of self consolidating concrete using Lightweight aggregate. J. Civ. Environ. Eng. 2010, 30, 573–580. [Google Scholar]
- Shafigh, P.; Nomeli, M.A.; Alengaram, U.J.; Mahmud, H.B.; Jamaat, M.Z. Engineering properties of lightweight aggregate concrete containing limestone powder and high volume fly ash. J. Clean. Prod. 2016, 135, 148–157. [Google Scholar] [CrossRef]
- Chandra, S.; Berntsson, L. Lightweight Aggregate Concrete: Science, Technology and Applications; Noyes Publications: Norwich, NY, USA, 2002. [Google Scholar]
- De Domenico, D.; Messina, D.; Recupero, A. Quality control and safety assessment of prestressed concrete bridge decks through combined field tests and numerical simulation. Structures 2022, 39, 1135–1157. [Google Scholar] [CrossRef]
- Cristofaro, M.T.; Viti, S.; Tanganelli, M. New predictive models to evaluate concrete compressive strength using the SonReb method. J. Build. Eng. 2020, 27, 100962. [Google Scholar] [CrossRef]
- Roufael, G.; Beaucour, A.L.; Eslami, J.; Hoxha, D.; Noumowe, A. Influence of lightweight aggregates on the physical and mechanical residual properties of concrete subjected to high temperatures. Constr. Build. Mater. 2021, 268, 121221. [Google Scholar] [CrossRef]
- Yao, W.; Pang, J.; Liu, Y. Performance degradation and microscopic analysis of lightweight aggregate concrete after exposure to high temperature. Materials 2020, 13, 1566. [Google Scholar] [CrossRef] [PubMed] [Green Version]
- Kim, W.; Jeong, K.; Choi, H.; Lee, T. Correlation analysis of ultrasonic pulse velocity and mechanical properties of normal aggregate and lightweight aggregate concretes in 30–60 MPa Range. Materials 2022, 15, 2952. [Google Scholar] [CrossRef]
- Lee, T.; Lee, J.; Choi, H. Assessment of Strength Development at Hardened Stage on High-Strength Concrete Using NDT. Appl. Sci. 2020, 10, 6261. [Google Scholar] [CrossRef]
- ASTM C1231/C1231-15; Standard Practice for Use of Unbonded Caps in Determination of Compressive Strength of Hardened Cylindrical Concrete Specimens. American Society of Testing and Materials: West Conshohocken, PA, USA, 2016; pp. 1–5.
- ASTM C39/C39M; Standard Test Method for Compressive Strength of Cylindrical Concrete Specimens. American Society of Testing and Materials: West Conshohocken, PA, USA, 2018; pp. 1–8.
- ASTM C469; Standard Test Method for Static Modulus of Elasticity and Poisson’s Ratio of Concrete in Compression. Annual Book of ASTM Standards: Philadelphia, PA, USA, 2011.
- ASTM C597-16; Standard Test Method for Pulse Velocity Through Concrete. American Society of Testing and Materials: West Conshohocken, PA, USA, 2016; pp. 1–4.
- Kim, W.; Jeong, K.; Lee, T.; Park, S. A Study on Correlation between Ultrasonic Pulse Velocity Method and Coarse Aggregate for Estimating Residual Modulus of Elasticity of Concrete Exposed to High Temperatures. Appl. Sci. 2022, 12, 6644. [Google Scholar] [CrossRef]
- Hwang, E.; Kim, G.; Choe, G.; Yoon, M.; Gucunski, M.N.; Nam, J. Evaluation of concrete degradation depending on heating conditions by ultrasonic pulse velocity. Constr. Build. Mater. 2018, 171, 511–520. [Google Scholar] [CrossRef]
- Cheon, Y.J.; Shin, Y.S.; Kim, H.S. Safety evaluation techniques for fire-damaged buildings. J. Korea Struct. Eng. Assoc. 2022, 29, 6–9. [Google Scholar]
- Saridemir, M.; Celikten, S. Investigation of fire and chemical effects on the properties of alkali-activated lightweight concretes produced with basaltic pumice aggregate. Constr. Build. Mater. 2020, 260, 119969. [Google Scholar] [CrossRef]
- Bui, N.K.; Satomi, T.; Takahashi, H. Effect of mineral admixtures on properties of recycled aggregate concrete at high temperature. Constr. Build. Mater. 2018, 184, 361–373. [Google Scholar] [CrossRef]
- Bolborea, B.; Baera, C.; Dan, S.; Gruin, A.; Burduhos-Nergis, D.D.; Vasile, V. Concrete compressive strength by means of ultrasonic pulse velocity and moduli of elasticity. Materials 2021, 14, 7018. [Google Scholar] [CrossRef] [PubMed]
- Lee, T.; Jeong, K.; Choi, H. Effect of thermal properties of aggregates on the mechanical properties of high strength concrete under loading and high temperature conditions. Materials 2021, 14, 6093. [Google Scholar] [CrossRef] [PubMed]
- Hammer, K.D. Concrete strength for fire safety design. Mag. Concr. Res. 2005, 57, 445–453. [Google Scholar]
- Abed, M.; Brito, J. Evaluation of high-performance self-compacting concrete using alternative materials and exposed to elevated temperatures by non-destructive testing. J. Build. Eng. 2020, 32, 101720. [Google Scholar] [CrossRef]
- Saha, A.K.; Sarker, P.K.; Majhi, S. Effect of elevated temperatures on concrete incorporating ferronickel slag as fine aggregate. Fire Mater. 2019, 43, 8–21. [Google Scholar] [CrossRef] [Green Version]
- Bilal, H.; Yaqub, M.; Rehman, S.K.U.; Abid, M.; Alyousef, R.; Alabduljabbar, H.; Aslam, F. Performance of foundry sand concrete under ambient and elevated temperatures. Materials 2019, 12, 2645. [Google Scholar] [CrossRef] [Green Version]
- Noumowe, A.N. Temperature distribution and mechanical properties of high-strength silica fume concrete at temperatures up to 200 °C. ACI Mater. J. 2003, 100, 326–330. [Google Scholar]
- EN 12390-6; Testing Hardened Concrete—Part 6: Tensile Splitting Strength of Test Specimens. CEN: Brussels, Belgium, 2009.
- ASTM C642-13; Standard Test Method for Density, Absorption, and Voids in Hardened Concrete. ASTM International: West Conshohocken, PA, USA, 2013.
- Dinakar, P.; Babu, K.G.; Santhanam, M. Durability properties of high volume fly ash self compacting concretes. Cem. Concr. Compos. 2008, 30, 880–886. [Google Scholar] [CrossRef]
- Yoon, M.H.; Choe, G.C.; Lee, T.G.; Kim, G.Y. Evaluation on strain properties of 60 MPa class high strength concrete according to the coarse aggregate type and elevated temperature condition. J. Korea Concr. Inst. 2014, 26, 247–254. [Google Scholar] [CrossRef] [Green Version]
- Andiç-Çakır, Ö.; Hizal, S. Influence of elevated temperatures on the mechanical properties and microstructure of self consolidating lightweight aggregate concrete. J. Constr. Build. Mater. 2012, 34, 575–583. [Google Scholar] [CrossRef]
- Lim, J.H. The Experimental Study of High-Strength Lightweight Concrete for the Enhancement of Its Compressive Strength. Master’s Thesis, Kyonggi University, Suwon-si, Republic of Korea, 2010; pp. 4–13. [Google Scholar]
- Akçaözoğlu, K.; Akçaözoğlu, S. The effect of elevated temperature on the lightweight concrete produced by expanded clay aggregate and calcium aluminate cement. Bilge Int. J. Sci. Technol. Res. 2017, 1, 59–70. [Google Scholar]
- Ke, Y.; Ortola, S.; Beaucour, A.L.; Dumontet, H. Identification of microstructural characteristics in lightweight aggregate concretes by micromechanical modelling including the interfacial transition zone (ITZ). Cem. Concr. Res. 2010, 40, 1590–1600. [Google Scholar] [CrossRef]
- Xue, C.; Yu, M.; Xu, H.; Xu, L.; Saafi, M.; Ye, J. Experimental study on thermal performance of ultra-high performance concrete with coarse aggregates at high temperature. Constr. Build. Mater. 2022, 314, 125585. [Google Scholar] [CrossRef]
- Kim, J.; Hong, J.; Kim, R.; Woo, U.; Choi, H. Development and application of loT-based contactless ultrasonic system. JKSMI 2020, 24, 70–79. [Google Scholar]
- Yang, H.; Lin, Y.; Hsiao, C.; Liu, J.Y. Evaluating residual compressive strength of concrete at elevated temperatures using ultrasonic pulse velocity. Fire Saf. J. 2009, 44, 121–130. [Google Scholar] [CrossRef]
- Toric, N.; Boko, I.; Juradin, S.; Baloevic, G. Mechanical properties of lightweight concrete after fire exposure. Struc. Concr. 2016, 17, 1071–1081. [Google Scholar] [CrossRef]
- Kumar, N.V.S.; Ram, K.S.S. Performance of concrete at elevated temperatures made with crushed rock dust as filler material. Mater. Today Proc. 2019, 18, 2270–2278. [Google Scholar] [CrossRef]
- Sadrmomtazi, A.; Gashti, S.H.; Tahmouresi, B. Residual strength and microstructure of fiber reinforced self-compacting concrete exposed to high temperatures. Constr. Build. Mater. 2020, 230, 116969. [Google Scholar] [CrossRef]
- Islam, M.Z.; Sohel, K.M.A.; Al-Jabri, K.; Harthy, A.A. Properties of concrete with ferrochrome slag as a fine aggregate at elevated temperatures. Case Stud. Constr. Mater. 2021, 15, e00599. [Google Scholar] [CrossRef]


| Materials | Properties |
|---|---|
| Cement | Type|ordinary Portland cement Density: 3150 kg/m3, Fineness: 320 m2/kg |
| Coarse aggregate | Crushed granite aggregate Density: 2680 kg/m3, Fineness modulus: 7.03 Absorption: 0.68%, Maximum size: 20 mm |
| Coal ash aggregate Density: 1470 kg/m3, Fineness modulus: 6.39 Absorption: 8.68%, Maximum size: 20 mm | |
| Fine aggregate | River sand Density: 2540 kg/m3, Fineness modulus: 2.54 Absorption: 1.6% |
| Admixture | Polycarboxylic-based acid |
| Materials | Chemical Composition (%) | L.O.I 2 | |||||||
|---|---|---|---|---|---|---|---|---|---|
| CaO | SiO2 | Al2O3 | Fe2O3 | MgO | SO3 | K2O | Others | ||
| OPC 1 | 60.34 | 19.82 | 4.85 | 3.30 | 3.83 | 2.88 | 1.08 | 0.86 | 3.02 |
| Classification | Estimation Equation |
|---|---|
| Specimen dimension | Φ100 × 200 mm |
| Type of coarse aggregate | Crushed granite aggregate, Coal ash aggregate |
| Design compressive strength | 30, 45, 60 MPa |
| Curing conditions | Water, Room temperature: 20 ± 2 °C, Humidity: 60 ± 5% |
| Temperature | 23, 100, 200, 300, 500, 700 °C |
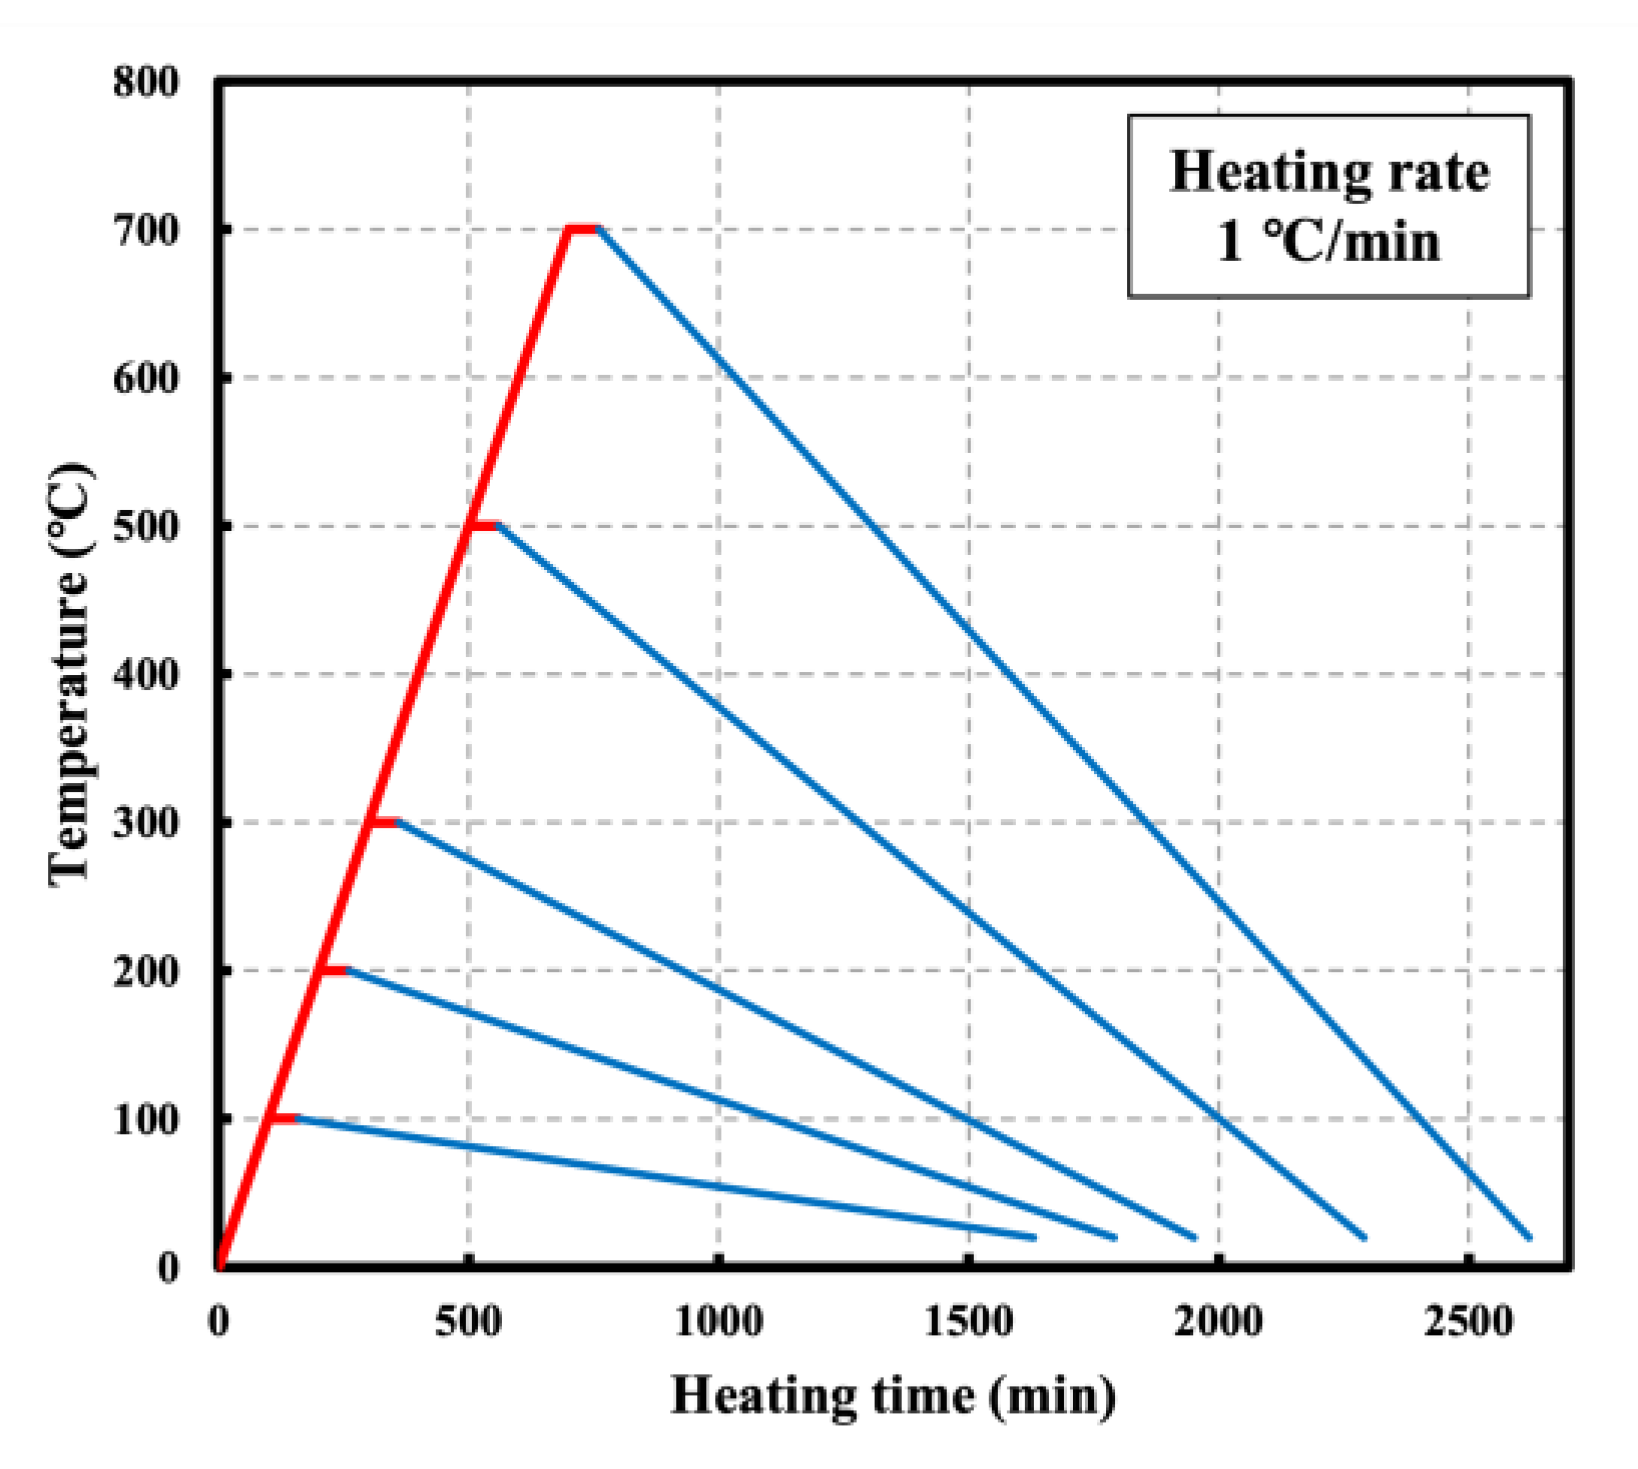
| Heating rate | 1 °C/min |
| Temperature | 60 min |
| Test items | Mass loss (%), Compressive strength (MPa), Ultrasonic pulse velocity (km/s), Elastic modulus (GPa) |
| MIX ID | fck (MPa) | W/C 1 | S/a 2 (%) | Unit Weight (kg/m3) | |||
|---|---|---|---|---|---|---|---|
| W 3 | C 4 | S 5 | G 6 | ||||
| LC41 | 30 | 0.41 | 46.0 | 165 | 400 | 799 | 758 |
| NC41 | 799 | 956 | |||||
| LC33 | 45 | 0.33 | 43.0 | 500 | 711 | 762 | |
| NC33 | 711 | 961 | |||||
| LC28 | 60 | 0.28 | 43.0 | 600 | 676 | 724 | |
| NC28 | 676 | 913 | |||||
| Test Items | Test Method | |
|---|---|---|
| Compressive strength (MPa) | ASTM C39/C39M | : distance(m) : time(s) |
| Elastic modulus (GPa) | ASTM C469 | |
| Ultrasonic Pulse Velocity (km/s) | ASTM C597 |
| ID | Equation | Correlation Coefficient (R2) |
|---|---|---|
| NC41 | Vp − 5.0134 | R2 = 0.92 |
| LC41 | Vp − 4.6244 | R2 = 0.93 |
| NC33 | Vp + 3.1922 | R2 = 0.93 |
| LC33 | Vp + 1.6587 | R2 = 0.85 |
| NC28 | Vp + 25.482 | R2 = 0.77 |
| LC28 | Vp + 11.986 | R2 = 0.87 |
Disclaimer/Publisher’s Note: The statements, opinions and data contained in all publications are solely those of the individual author(s) and contributor(s) and not of MDPI and/or the editor(s). MDPI and/or the editor(s) disclaim responsibility for any injury to people or property resulting from any ideas, methods, instructions or products referred to in the content. |
© 2023 by the authors. Licensee MDPI, Basel, Switzerland. This article is an open access article distributed under the terms and conditions of the Creative Commons Attribution (CC BY) license (https://creativecommons.org/licenses/by/4.0/).
Share and Cite
Kim, W.; Choi, H.; Lee, T. Residual Compressive Strength Prediction Model for Concrete Subject to High Temperatures Using Ultrasonic Pulse Velocity. Materials 2023, 16, 515. https://doi.org/10.3390/ma16020515
Kim W, Choi H, Lee T. Residual Compressive Strength Prediction Model for Concrete Subject to High Temperatures Using Ultrasonic Pulse Velocity. Materials. 2023; 16(2):515. https://doi.org/10.3390/ma16020515
Chicago/Turabian StyleKim, Wonchang, Hyeonggil Choi, and Taegyu Lee. 2023. "Residual Compressive Strength Prediction Model for Concrete Subject to High Temperatures Using Ultrasonic Pulse Velocity" Materials 16, no. 2: 515. https://doi.org/10.3390/ma16020515
APA StyleKim, W., Choi, H., & Lee, T. (2023). Residual Compressive Strength Prediction Model for Concrete Subject to High Temperatures Using Ultrasonic Pulse Velocity. Materials, 16(2), 515. https://doi.org/10.3390/ma16020515